karthikeyan. m register no: 108001108017 in partial ... · pdf fileregister no: 108001108017...
TRANSCRIPT

AN ORGANISATIONAL STUDY ON TAMILNADU
NEWSPRINT AND PAPERS LIMITED - KARUR
PROJECT REPORT
Submitted by
KARTHIKEYAN. M
Register No: 108001108017
In partial fulfillment for the award of the degree
of
MASTER OF BUSINESS ADMINISTRATION
IN
DEPARTMENT OF MANAGEMENT STUDIES
HINDUSTHAN INSTITUTE OF TECHNOLOGY
(Affiliated to Anna University of Technology, Coimbatore)
COIMBATORE – 641 032
AUGUST 2011

HINDUSTHAN INSTITUTE OF TECHNOLOGY(Affiliated to Anna University of Technology, Coimbatore)
DEPARTMENT OF MANAGEMENT STUDIES
This is to certify that the internship training report entitled
AN ORGANISATIONAL STUDY ON TAMILNADU
NEWSPRINT AND PAPERS LIMITED - KARUR
Is the bonafide record of training work done by
KARTHIKEYAN. M
Register No: 108001108017
of
MASTER OF BUSINESS ADMINISTRATION
2010-2012
----------------------- -------------------------------Project Guide Head of the Department
Submitted for the Internship Training Viva-Voce Examination held on -----------
------------------------- ----------------------------Internal Examiner External Examiner
DECLARATION
I affirm that the project work titled AN ORGANISATIONAL STUDY ON
TAMILNADU NEWS PRINT AND PAPERS LIMITED - KARUR being
submitted in partial fulfillment or the award of MASTER OF BUSINESS
ADMINISTRATION is the original work carried out by me. It has not formed the part of any
other project work submitted for award of any degree or diploma, either in this or any other
University.
KARTHIKEYAN. M
108001108017
I certify that the declaration made above by the candidate is true
Ms. R. SHOBANA
Assistant Professor

ACKNOWLEDGEMENT
First and foremost I wish to thank God, the almighty for enabling the successful
completion of the internship training.
I express my profound gratitude and sincere thanks to
Dr. T.RAVICHANDRAN, BE, ME, PhD, Principal of Hindusthan Institute of Technology.
I express my heartfelt thanks to Dr.K.SAMUVEL, PGDIB, M.Com, MBA, MPhil,
PhD, Head of the Department of Management Studies, Hindusthan Institute of Technology, and
Coimbatore for inspiration and valuable suggestions for carrying out this endeavor.
It is my first and foremost duty to express my deep and sincere thanks to Ms.R.
SHOBANA MBA Assistant Professor of MBA department, Hindusthan Institute of Technology,
Coimbatore, who supervised this Internship Training. I sincerely thank her for the inspiring
guidance, generous help and support.
I would like to express my sincere thanks to all the staff members and all other
individuals who helped me in completing this Internship Training.
M. KARTHIKEYAN
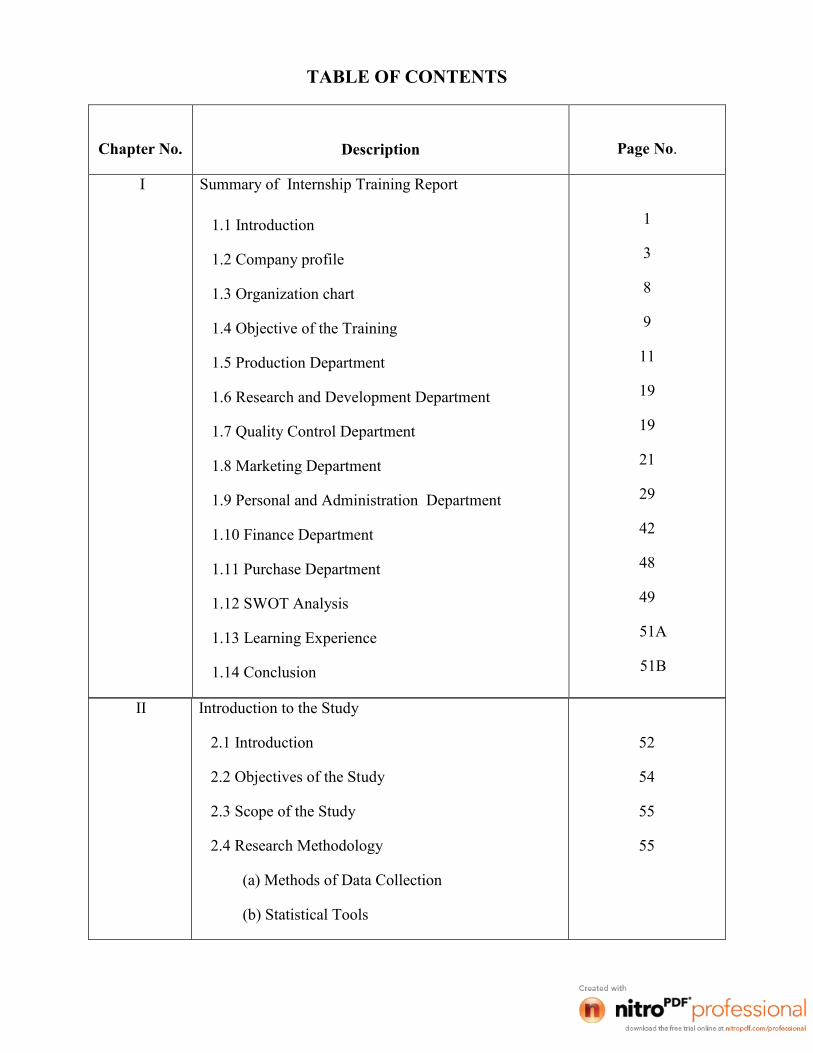
TABLE OF CONTENTS
II Introduction to the Study
2.1 Introduction
2.2 Objectives of the Study
2.3 Scope of the Study
2.4 Research Methodology
(a) Methods of Data Collection
(b) Statistical Tools
52
54
55
55
Chapter No. Description Page No.
I Summary of Internship Training Report
1.1 Introduction
1.2 Company profile
1.3 Organization chart
1.4 Objective of the Training
1.5 Production Department
1.6 Research and Development Department
1.7 Quality Control Department
1.8 Marketing Department
1.9 Personal and Administration Department
1.10 Finance Department
1.11 Purchase Department
1.12 SWOT Analysis
1.13 Learning Experience
1.14 Conclusion
1
3
8
9
11
19
19
21
29
42
48
49
51A
51B
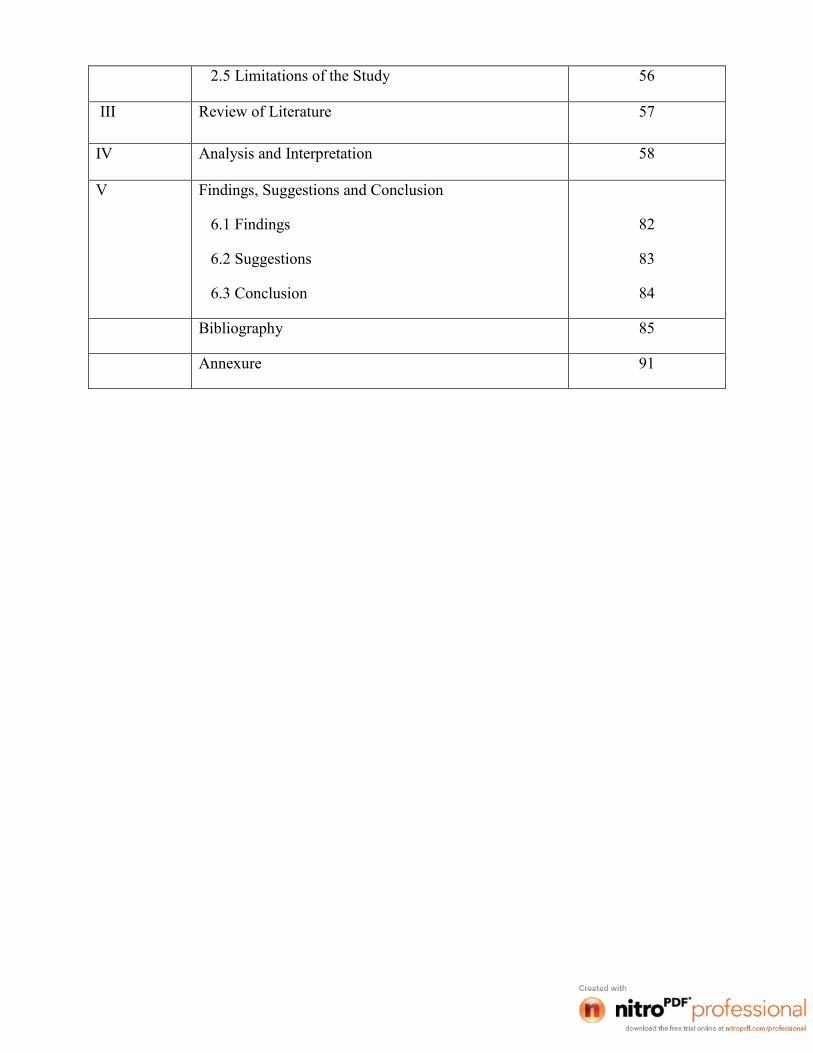
2.5 Limitations of the Study 56
III Review of Literature 57
IV Analysis and Interpretation 58
V Findings, Suggestions and Conclusion
6.1 Findings
6.2 Suggestions
6.3 Conclusion
82
83
84
Bibliography 85
Annexure 91
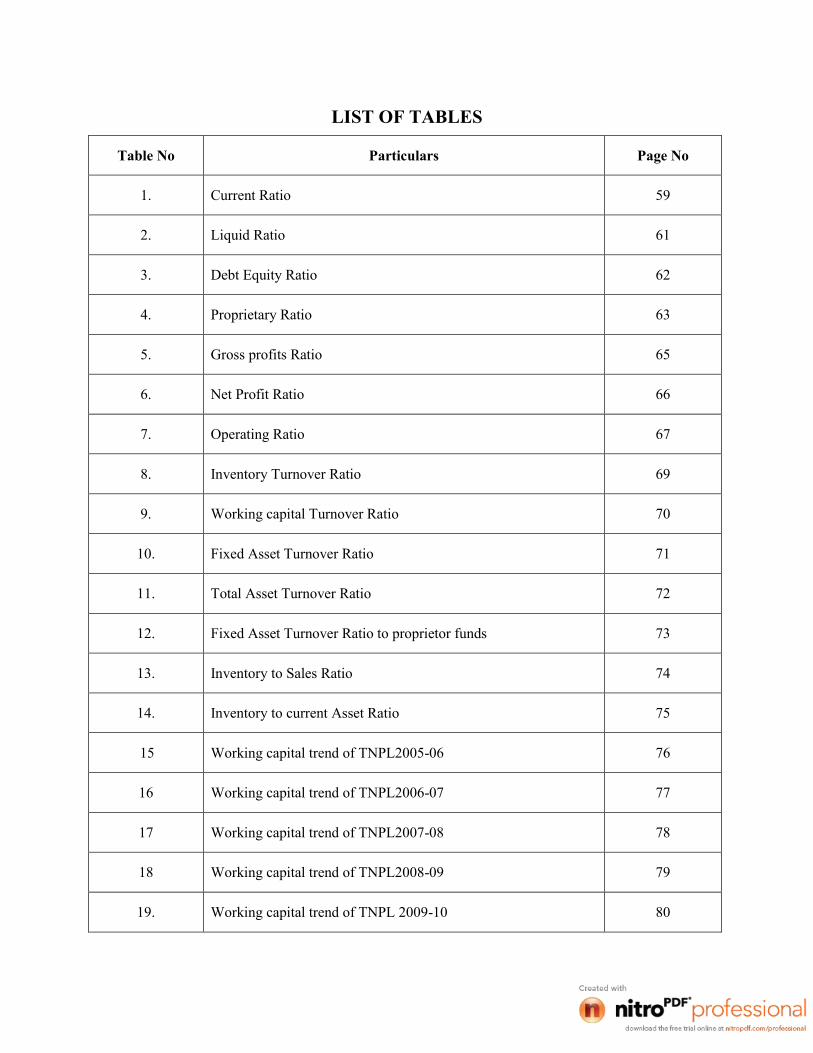
LIST OF TABLES
Table No Particulars Page No
1. Current Ratio 59
2. Liquid Ratio 61
3. Debt Equity Ratio 62
4. Proprietary Ratio 63
5. Gross profits Ratio 65
6. Net Profit Ratio 66
7. Operating Ratio 67
8. Inventory Turnover Ratio 69
9. Working capital Turnover Ratio 70
10. Fixed Asset Turnover Ratio 71
11. Total Asset Turnover Ratio 72
12. Fixed Asset Turnover Ratio to proprietor funds 73
13. Inventory to Sales Ratio 74
14. Inventory to current Asset Ratio 75
15 Working capital trend of TNPL2005-06 76
16 Working capital trend of TNPL2006-07 77
17 Working capital trend of TNPL2007-08 78
18 Working capital trend of TNPL2008-09 79
19. Working capital trend of TNPL 2009-10 80

Table No Particulars Page No
20 Balance Sheet of TNPL 2005-06 86
21 Balance Sheet of TNPL 2006-07 87
22 Balance Sheet of TNPL 2007-08 88
23 Balance Sheet of TNPL 2008-09 89
24 Balance Sheet of TNPL 2009-10 90
ABSTRACT
For a MBA student, a learning combination of theory and practice is an invaluable asset,
as it helps in understanding the core principles of business by way of first hand experiences.
This in-plant training is a stepping stone which will groom for the future in the corporate
world.
Following are the objectives of In - plant training:
To get an Industrial exposure.
To be aware of the happening in a particular industry.
To achieve knowledge about different sectors in market for making choice as to
which go for.
To learn functioning and operations of different departments in an organization.
To get knowledge about the working culture of the organization.
To have knowledge about the huge management practices and get the practical
knowledge of what we have studied.
To know the industries expectations toward the management students.

1.1 THE INTRODUCTION ABOUT INDUSTRY
Paper industry plays an important role in the industries development in India. Paper
industry occupies a large percentage in India market. It provides wide employment opportunities.
Paper industry not only plays vital role in India economy but also enhances our product values in
world market.
From the time, human life stared in this world, people realized the need for
communication and they wanted to record certain thing for future generation. Initially rocks and
trees were used to carve the message. After that palm leave were used for communication
process. Then mental sheet with sharp tools for writing were used. In olden days the kings used
silicon cloth to write important documents.
Origin of paper
The origin of Paper is Papyrus, which grows in abundance in delta of Egypt. After
processing, the leaves were used for writing. Ancient Egyptians this method.
The art of paper making
The art of paper making was first discovered in china its origin was kept as secret by the
Chinese for a long time. Then the art of paper making slowly travelled westward and reached
Samarkand in west Asian. Then the used and manufactures of paper gradually along southern
shores of Mediterranean. After that though Spain it reached morocco and then spread widely all
over the world.
First paper mill in the world
The first paper mill was stared in china and then Baghdad. After 40 year a paper mill was
started at Hainault in France. Then the art of paper making entered into England, Switzerland
and Netherlands. In 1800 a book was published describing the method of manufacturing paper
from wood pulp and vegetable pulp.
A perspective of paper industry in India
The earliest efforts in mechanizing the paper industry in India could be traced to the
beginning of 19th century when the Baptist missionary. William Carey stared a paper path of
government. Meantime in 1895, the Indian paper making association was established and it
rendered a proud service to paper industry.
The growth and development of the organized paper industry in India can be broadly
divided into three phases: 1870 to World War II, 1936 to around 1950 and 1951 to present day.
Present trend
Paper Industry in India has a long history with the first being commenced in 1832
thought the paper industry in India is more than a century old; it grew at a very slow pace till
1950. The industry has only 17 mills till 1950 and 1.6 lakhs tone of paper; presently the industry
is crowded with nearly 400 companies.
India’s per capital consumption of paper is around 3kg to 3.5kgas against the 27% in
Singapore 14kg in Singapore china, 11kg in Indonesia and 40kg at Asian pacific region. India’s
consumption is far less than average per capital consumption of the world, which is 45.6kg. The
industry production in the current is around 2.8 million tones.
Not long ago in 1995-96 the industry was unbeat mood. Following the presentation of the
dream budget in March 97 it was looking forward to a healthy growth and strong bottom lines.
However there was declaration in the economy with global demand of paper (GDP) growth
falling to 5% an export growth taking a nosedive to 2.645. The performance of the entire
manufacturing sector was below the par. But in contrast to 1998-99. Indian paper industry
gradually moved to its owned place. However during 2005-2006 the trend paper market has been
towards better position.

1.2 PROFILE
1.2.1 INDUSTRY PROFILE
Paper is a material made in thin sheet as an aqueous deposit from linen rags, wood pulp
or other form of cellulose which is used for writing, printing and wrapping etc..,
Paper plays a vital role in communication purpose. Paper was invented by TSAI-LUN in
LEI-YANG province of china. The first paper machine was invented by a French man,
NICOLOUS-LOUIS ROBERT in 1799. In India the first paper machine was set up at Scrampore
in West Bengal.
Ts'ai Lun seems to have made his paper by mixing finely chopped mulberry bark and
hemp rags with water, mashing it flat, and then pressing out the water and letting it dry in the
sun. He may have based his idea on bark cloth, which was very common in China and also made
from mulberry bark. Ts'ai Lun's paper was a big success, and began to be used all over China. By
the 400's AD, people in India were also making paper. People all over the Islamic world soon
began using paper, from India to Spain. By 1250 AD, the Italians had learned to make good
paper and sold it all over Europe. In 1338, French monks began to make their own paper. Once
they had learned to make paper, they became more interested in also learning about Chinese
printing, and a man called Gutenberg produced the first printed Bible in 1453. By this time,
people in the country of the Aztecs (modern Mexico) had also, independently, invented paper.
Their paper was made out of agarve plant fibers, and people used it to make books.
Meanwhile, in China people were using paper in more and more different ways. They
were using it for kites, and even for toilet paper!
Pulp and Paper manufacturing industry is one of the largest among the top ten in the
world. Today the world paper production has crossed 300 millions per annum.

1.2.2 COMPANY PROFILE
To be the market leader in the manufacture of world class eco-friendly papers by
adopting innovative technologies for sustainable development.
TNPL was formed by the Government of Tamil Nadu in April 1979. The primary
objective of the company is to produce Newsprint, Printing and Writing paper using bagasse a
sugarcane residue as the primary raw material. The registered office of the company is situated at
Gundy, Chennai.
The products are being marketed throughout the country and also being exported to 20
countries around the world. The factory is situated at kagithapuram in Karur district of
Tamilnadu. The initial capacity of the plant was 90,000 TPA of Newsprint, Printing and writing
paper, which commenced production in the year 1984. The capacity was doubled to 1, 80,000
TPA in January 1996 after implementation of the first project. Recently the capacity has been
further enhanced to 2, 30,000 TPA in April 2003 through up gradation of both the paper
machines.
The largest production capacity in India at a single location and paper machines with
built in flexibility for manufacturing Newsprint, Printing and writing papers in the same
machine.
TNPL has the unique arrangement with the sugar mills for sourcing the raw material in
the form of exchange of steam/fuel for baggasse. TNPL is committed to manufacture and supply
eco-friendly papers to customer’s satisfaction with the emphasis on continual improvements in
its quality management systems. Meeting customers requirement with eco-friendly raw materials

(viz.., Baggasse) for paper making through continuous process improvements is TNPL’s Quality
policy, Quality standardization without compromise on environment is being accomplished with
online quality control at various stages of production. Despite opening up of Indian markets for
imports, TNPL has been consistently recording increasing in year by year, which demonstrates
the company’s commitment to Quality. Direct interaction with customers through customer
service cell has helped the company in meeting the Customer Satisfaction Index (CSI) ranging
from 7.01 to 7.50. Customized products are also being manufactured by TNPL to meet the
customer delight.
The Online Integrated Information system (OIIS) a mini ERP package developed by
CMC ltd.., for TNPL integrates the flow of information from all the section of the company
covering Production, Materials, finance and Marketing etc.., Thus OIIS has greatly improved
information for faster and timely decision making for assured product quality. The automated
process control facilities ensure complaint free products at various stages upto the final packing
and dispatch.
By using bagasse as the primary raw material instead of wood. TNPL is saving deforestation of
about 30,000 acres of forestland every year. Due to the usage of bagasse the chemical

consumption in the pulp bleaching process is lower. TNPL’s effluents completely comply with
the norms set by Tamil Nadu Pollution Control Board. TNPL is adopting activated sludge
treatment system. Further the treated effluent water is being used to irrigate 1500 acres of land
around the factory. The farmers are cultivating cash crops such as sugarcane, groundnut etc..,
and using TNPL effluent water. TNPL has obtained the prestigious ISO 14001 certificates from
RWTUV, Germany for successfully establishing and applying environmental management
system for development manufacture and supply of paper.
TNPL has installed a bio methanation plant to generate methane gas from the effluent
water and use it as a field as substitute for furnace oil in the lime kilin saving 10 KL of furnace
oil everyday.
THE VISION:
To be the market leader in the manufacture of eco-friendly world class papers adopting
innovative technologies.
THE MISSION:
1. Attain leadership in paper industry.
2. Promote the usage of Baggasse in the manufacturer of Newsprint and Printing and
Writing paper.
3. Minimize environmental impact and become an environment friendly
organization.
BOARD OF DIRECTORS
Rajeev Ranjan, I.A.S. (Chairman)
T.K. Ramachandran, I.A.S.(Managing Director )
Thiru. R .R . Bhandari (director)
Thiru. N. Kumaravelu (director)
TNPL COMMITMENTS ON QUALITY
Company committed to satisfy customers for the product, TNPL develop, manufacture
and supply with emphasis on.
Customer requirements at competitive prices.
Use of Eco-Friendly raw materials.
Improve the quality of the paper to that of International standards.
Become globally competitive in terms of cost, pricing and quality.
Continuous process improvements. Involvements of all employees. Suppliers and dealers.
TNPL EXPORT NETWORK
Australia, Egypt, Greece, Indonesia, Jordan, Kenya, Malaysia, Myanmar, Nepal,
Nigeria, Philippines, Singapore, Sri Lanka, South- Africa, Taiwan, Turkey, U.A.E.., U.K.
Yemen.

1.3 ORGANIZATION CHART
ORGANIZATION CHART
MANAGING DIRECTOR
DEPUTY MANAGING DIRECTOR
CHIEF GENERAL MANAGER
GENERAL MANAGER
CHIEF GENERALMANAGER(Operation)
DIRECTOR
(Finance)
9(SDhd
DEPUTY GENEALMANAGER(Technical)
GENERAL MANAGER(Marketing)
CHIEF GENERALMANAGER (Finance &Admin)
CHIEF GENERAL MANAGER(Marketing)
GENERALMANAGER
(HR)
GENERAL MANAGER
(m&l)
GENERALMANAGER
(Paper)
DEPUTYGENERALMANAGER
(Paper)
DEPUTYGENERALMANAGER
(Production)

1.4 OBJECTIVES OF THE TRAINING
The main objective of this training is to equip us with practical knowledge of our
study, by studying the existing system of the organizational structure and to understand the
aspects of the various activities of the organization.
To have thorough practical knowledge of the workers of the firm.
To study the functions of various departments in the organization.
To understand the organization structure of firm.
To understand the process of the organization.
AWARDS AND ACCOLADES
In pursuit of excellence, TNPL has won many accolades. This is in recognition of its
continuous innovation and constant improvement in all spheres of its activity.
Best paper Mill 2007-08
Environment Protection – 2002
Export Award – 2006-07
Excellence in Cost Management – 2008
Credit Rating by ICRA Ltd
Safety Award – 2002
Energy Award – 2001
Best Corporate Citizen
Innovative Project
Green Rating
Excellence in Corporate Governance – 2004
The Energy and Resources Institute (TERI) Corporate Award – 2008

ACHIEVEMENTS OF TNPL
The centre for science & economics, New Delhi has awarded TNPL “3 leaf green rating”
awarded in appreciation for its environmental management system.
Confederation of Indian industry has recognized the bio-machination project
implementation by TNPL as an “innovative project”
Achieved highest production and sales 230079 MT of paper. Production was higher by
33838 MT over previous year.
Copier paper production highest at 37645 MT registered a growth of 34%
Exported 38645 MT wood free uncoated papers.
Received the special export award from CAPEXIL in recognition of outstanding export
performance, for the seventh consecutive time.
Achieved “zero-stock” of finished goods at the end of financial year for the sixteenth
time.
1.5 PRODUCTION DEPARTMENT
Production is a sequence of technical processes requiring either directly or indirectly the
mental and physical skill of craftsmen and consists of changing the type, shape, size, and
properties of materials and ultimately converting them into more useful article. Production
means creation of utilities which factors include the activities or procurement and utilization of
production viz., manpower, material, machinery’s and buildings.
Production Department in TNPL headed by the General Manager and has the following
two major areas.
Paper Machine
Pulp Mill
The main task of this development is to achieve the target production with good quality
of Newsprint and Writing paper. Chief Managers, Deputy Managers, Engineers and operators
assist him.
PAPER MACHINE
The paper machine area has two machines namely PM#1, and PM#2. The machine 1 was
supplied by Beloit Walmsely, UK. It is twin wire former having a deckle width of 6.8m, which
produces newsprint of 49 GSM paper. The machine is also capable of producing printing and
writing papers between the weight ranges of 40-80 GSMs. The paper machine 2 is designed to
achieve high quality paper. This machine has an on line process basis to weigh moisture and ash.
Converting, finishing and packing lines have been provided for production of finished paper in
reels or sheets of required dimensions. Facilities automatic reel handling and reel wrapping
systems. The sheeting system consists of 3 cutting machines salvage sheeter and micro processor
based 2 guillotine machines with an aggregate capacity of 180 tpd.

PAPER MACHINE DETAILS
Paper m/c- 1 Paper M/C- 2
Beloit Wamseley J M Voith
Speed 700 mpm 700 mpm
Production 1, 05, 000 tpa 1, 25, 000 tpa
PULP MILL
The Company produces the following varieties of pulp to manufacture Newsprint,
printing and writing papers.

1.5.1 PULP MAKING PROCESS
PULPING is a process of separation of fibrous-mass from the raw materials. There are three
types,
MECHANICAL PULPING
CHEMICAL PULPING
SEMI CHEMICAL PULPING
For all these process wood is mainly used as raw material. In this process the undesirable
components like sand, stone etc., can be removed.
A) MECHANICAL PULPING
It is a process in which wood pulp is ground well and mixed with steam. The
presence of heat softens the lignin and grinding process pulls the fibre out. This process is
not often used because the paper obtain from this are less strong. They are mainly used
for printing papers such as Newsprints, Telephone Directories.
B) CHEMICAL PULPING
The chemical pulping includes Soda pulping, Sulphate pulping and Sulfite
pulping. The important one among these is kraft pulping.
Soda pulping process is carried out by treating the wood and chips with caustic
soda solution to fibre by cooking them in pressurized vessels. In Sulphate pulping the
wood chips is cooked with Sulfurous acid and salt of this acid. Sulphate pulp is used I the
manufacture of bond writing high grade book and other fine papers.
C) SEMI CHEMICAL PULPING
It is a process involving an essential chemical treatment followed by a treatment in
advanced mechanical fibering equipments. In this pulping process the wood is treated
with mild chemical to soften lignin to loosen the fibers.
It is also known as Sulphate process. It was invented by a French Chemist named
F.Dhal in Germany in 1884. In this process wood chips and cooking liquor is heated.
Digesters for about 90 minutes at 701-173c. The cooking liquor is aqueous solution
NaoH, Na2s. The other cooking liquor is Na2Co3, Na2So4. Thiosulphate and
Polysulphide which are present with them in a little amount.

1.5.2 COOKING PROCESS
The Cooking process contains two types.
Batch Process
The chips are cooked in an individual digester with loading.
Cooking and Dumping done in sequence.
CONTINUOUS PROCESS
The chips and cooking liquor are fed at a constant rate into the top of the digester and
the chips moves downwards in a continuous manner for discharge from bottom.
In both the process the cooked chips are discharged from digester under pressure. The
pulp coming out of the digester is very dark in color and could brow stock. It is thin washed and
further sent to bleaching process. In this industry they follow continuous process.
1.5.3 BLEACHING PROCESS
Bleaching is a process to remove the unwanted particles and to increase the pulp
properties. Chemical pulp bleaching is based on removal on elimination of colored groups.
The bleaching process usually consists of Chlorination treatment followed by an
alkaline extraction after which further bleaching treatments are applied. The Chlorination stage
may be made with chlorine or with a hypochlorite mixture or CIO2. Further the reagents used in
bleaching process and H2o2, CIO2, hypochlorite. So incase of high yield pulp Zn or Na
hydrosulphite can be used. After bleaching the pulp were drawn at different proportions. The
obtained pulp is used for making paper through paper machine.
1.5.4 STOCK PREPARATION PROCESS
Most of the pulp cannot be used for paper making as it comes directly from the pulp mill.
The obtained final desired qualities, pulp having different characteristics are blended with dyes
and special additives. These operations referred to as stock blending to impart mechanical
strength to the final sheet. The pulp is refined in a variety of machines typical of which the
refined jorden are and beaters. Basically, this operation consists of passing the pulp repeatedly
between sharping moving bars that cut and abrade the fibers. This improves fibers- the fiber
bonding, uniformity, more dense, less porous depending on the king of paper to be made.
1.5.5 VARIOUS STAGES OF STOCK PREPARATION PROCESS:
The various stages of stock preparation process are,
STAGE OF REFINING
STAGE OF BLENDING
STAGE OF ROSIN
STAKE OF ALUM
STAGE OF MINERAL FILLER OR LOADING
STAGE OF DILLUTION
STAGE OF CLEANING
STAGE OF SCREENING
A) REFINING PROCESS
Refining refer to the action carried out in a continuous conical or disc type refiners
where the fiber flow parallel to the bar crossing. It is develop or modify the pulp fibers in a
optical manner. It increases the surface area of the fiber. It is a process of water absorption
content is more. It is a stage of hydrophobic into hydrophilic.
B) BLENDING PROCESS
Blending is a process of addition of Alum, Rosin and fillers at different concentration.
C) ROSIN PROCESS
Rosin is an ambr coloured natural resin detained from sorthern pine. It provide good
sizing. In practice, the rosin is added to the stock s the solution or emulsion and is predicted into
the fibers by the action of alum.
D) ALUM PROCESS
Alum is the process of hydrated of salt of Aluminium sulphate. It is used as a fining agent.
Both Rosin and alum comine to form Aluminium and rosinate.

E) MINERAL FILLER OR LOADING PROCESS
The mineral filler are added to paper making furnishes to improve the optical and the
physical properties of the sheet. The particles serve to fill in the spaces and crevices between the
fibers thus producing a denser, softer, brighter, smoother and more opaque sheet.
The most common paper making fillers are clay, CaCo3, talc and Tio2. Clay is the
most important popular filler because it is cheap, plentiful and stable and provides good
performance. Talk provides the soft silky feel to the paper product.
F) DILUTION PROCESS
The blending process is followed by dilution process. Since the product obtained has
more consistency for about 3-5% it must be diluted to decrease the concentration.
G) CLEANING PROCESS
The dilution is followed by cleaning process. It is done to increase the brightness of
the paper.
H) SCREENING PROCESS
The cleaning is followed by screening process. The pulp which is cleaned enters the
chamber. The pulp of required size enters the chamber for paper making process.
The pulp obtained is converted to 1% consistency. This process can be shown in a
simple of flow chart as below.

HARDWOOD PULP
BAGASSE PULP REFINES (3-5%) MIXING
IMPORTED PULP
BLENDING
DILUTION
CLEANING
SCREENING (1%)
TO PAPER MACHINE
1.5.6 PAPER MAKING PROCESS
The following are the main parts of paper machine and its functions.
THE STOCK INLET
THE HEAD BOX
THE FOUR DRAINER LINES
THE PRESS SELECTION
THE DRYER SECTION
THE CALENDER SECTION
WINDING
ROLL FINISHING

1. STOCK INLET
The objective of the inlet into piping is to distribute the paper making fibers
uniformly across the machine from back to front.
2. HEAD BOX
The pressurized flow box distributes the pulp the moving forming wire.
3. FOUR DRINER LINES
The endless moving wire forms the fibers into a sheet enables a furnish to drain
by gravity and dewater by suction.
4. PRESS SECTION
The sheet is conveyed through a series of presses where additional water is
removed and the wet is consolidated.
5. DRYER SECTION
Most of the running water is evaporated and the fiber bonding develops as the
paper contacts a series of steam-heat cylinders.
6. CALENDER SECTION
The sheet is pressed between multi rolls to reduce thickness and smooth the
surface.
REEL
The dried calendar paper is wound into reel.
7. WINDING SECTION
The function of the winder is to be to cut and wind the full width, large diameter
paper reel into suitable size rolls. It is then wrapped and sent to the customers directly.
8. ROLL FINISHING
The steps in roll finishing are weighing, wrapping, crimping, heading and
labeling.
1.6 RESEARCH AND DEVELOPMENT DEPARTMENT
The company adopted and developed the innovation technology of manufacturing
newsprint using mechanical bagasse pulp and its endower is to perfect and hardness the bagasse
pulping technology. The in-house research laboratory facility of the company is recognised by
the department of scientific and Industrial research New Delhi. The Company has a full pledged
quality control assurance department which ensures highest quality standards of the products.
Specific study of R&D includes
Environmental bleaching technology
Pulping studies for improving pulp yield
Bio technology studies
Improvement of mechanical bagasse pulp quality
Printing studies
The R&D department has sophisticated state of the art instruments.
1.7 QUALITY CONTROL DEPARTMENT
The quality control function in many paper mills is now undergoing with some
changes. The old approach to quality consisted of setting up of a quality control department,
making spot checks on incoming material, alone end of the plant performing some in process
tests and finally conducting evaluation of the finished product. Some statistical analysis was
included if such specialized talent was available. The competitive market of the future will
demand much more.
In progressive mill the classical quality control function just described is beginning to be
replaced by the concept of total quality management. This involves the orderly co-ordination of
all functions that relate to product quality even to seemingly unrelated areas such as purchasing,
engineering and accounting shipping and warehousing. If starts with a management commitment
to a total quality effort that impacts every phase of the company.
The function of the quality control department is to measure quality keep the score and
measure the performance. The responsibility for quality lies with everyone in the production
system.
FUNCTIONS OF QUALITY CONTROL DEPARTMENT
Testing the ongoing product for defects/deviation and informing production
department for taking corrective steps.
Certification of output and maintaining parent roll history for future analysis of
products, companies etc.
Inspection of joints and conducting “Operator- Wise Reel Joint Performance
Tests”.
Inspection of finisher’s performance & reporting.
PROCESS CONTROL COMPUTER REPORTING SYSTEM:
A computer scan of ongoing product i.e. paper is continuously taken in the paper machine
cross direction and automatically recorded for the following reports.
1) Parents roll quality report highlighting GSM moisture and caliper.
2) Grade Report
3) Profile Report
4) Production, Run Time and Loss Report
5) Day Report
ROLL OF QUALITY CONTROL DEPARTMENT IN COMPLAINTS AND PRODUCT
DEVELOPMENT:
1) Visiting the customer for complaints investigation.
2) Analyzing the complaints and advising the production department for quality
improvement.
3) Attending to product trails at frequent intervals, arranged by the marketing department to
get first-hand knowledge about their product and its performance of competitor-product.
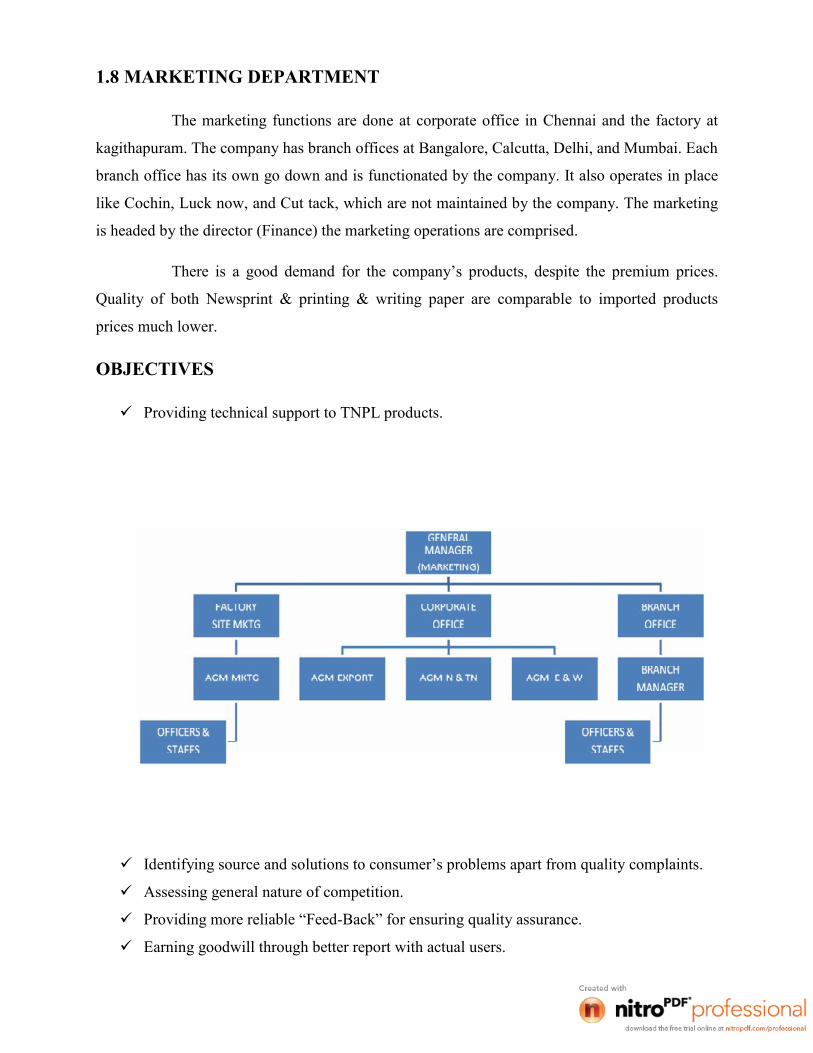
1.8 MARKETING DEPARTMENT
The marketing functions are done at corporate office in Chennai and the factory at
kagithapuram. The company has branch offices at Bangalore, Calcutta, Delhi, and Mumbai. Each
branch office has its own go down and is functionated by the company. It also operates in place
like Cochin, Luck now, and Cut tack, which are not maintained by the company. The marketing
is headed by the director (Finance) the marketing operations are comprised.
There is a good demand for the company’s products, despite the premium prices.
Quality of both Newsprint & printing & writing paper are comparable to imported products
prices much lower.
OBJECTIVES
Providing technical support to TNPL products.
Identifying source and solutions to consumer’s problems apart from quality complaints.
Assessing general nature of competition.
Providing more reliable “Feed-Back” for ensuring quality assurance.
Earning goodwill through better report with actual users.

This has assured that TNPL not only meets requirements of the customer but ensures their
satisfaction also. Online quality control has been the hallmark of TNPL.
TNPL sells its entire production printing & writing paper is being sold through a network
of dealers and distributors speed across the country. The following are the distribution network
for TNPL products.
COMPETITORS FOR TNPL
JK
ITC Bhatrachalam
SPB
Bathravathy Paper Mills
Ballarpur Industries
SPB Ltd.
Sirpur Papers
FUNCTIONS OF MARKETING DEPARTMENT IN TNPL
The marketing functions start from Madras Corporate office and the factory and
pugalur. The company has branch office at Calcutta, Delhi, Bombay, Cuttak, pune, Bangalore,
Cochin, Chandigargh, Visagapatnam, Jaipur. Each branch office has the godown and is
functioned by the company. The marketing department is headed by the Director finance. He
assists the day-to-day affairs at the corporate office by the manager marketing, who in terms
assisted by senior sales officers and sales assistants. The site office is assisted by the chief
manager marketing.
MARKETING PRODUCTS OF TNPL
OUR PRODUCTS
TNPL offers high-quality surface sized and non-surface sized paper to suit the needs
of modern high speed printing machines. TNPL's cutting edge technology backed by experienced
professionals ensures quality products to customers. TNPL’s manufacturing processes are
equipped with state-of-the-art control systems to maintain critical quality parameters on line. The
paper produced by TNPL is eco- friendly as the pulp is manufactured out of renewable raw
material and is subjected to Elemental Chlorine Free (ECF) bleaching. As the paper is acid free,
it has a longer colour stability and enhanced permanency in terms of strength characteristics.
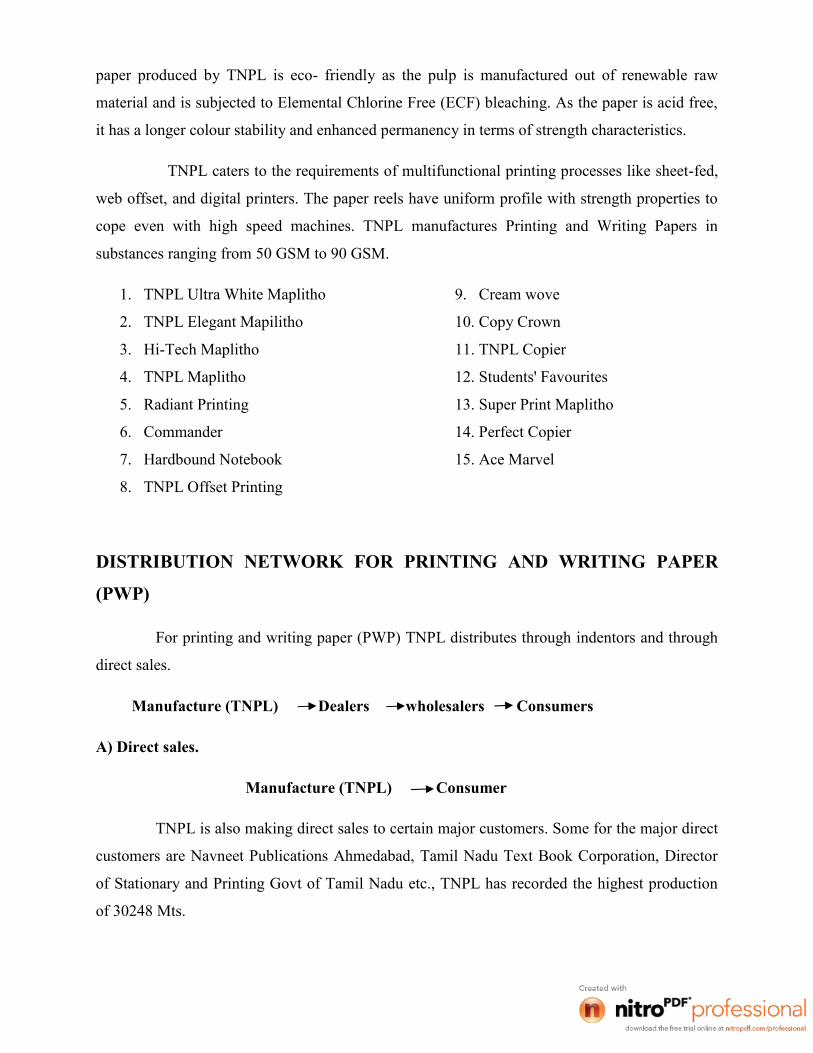
TNPL caters to the requirements of multifunctional printing processes like sheet-fed,
web offset, and digital printers. The paper reels have uniform profile with strength properties to
cope even with high speed machines. TNPL manufactures Printing and Writing Papers in
substances ranging from 50 GSM to 90 GSM.
1. TNPL Ultra White Maplitho
2. TNPL Elegant Mapilitho
3. Hi-Tech Maplitho
4. TNPL Maplitho
5. Radiant Printing
6. Commander
7. Hardbound Notebook
8. TNPL Offset Printing
9. Cream wove
10. Copy Crown
11. TNPL Copier
12. Students' Favourites
13. Super Print Maplitho
14. Perfect Copier
15. Ace Marvel
DISTRIBUTION NETWORK FOR PRINTING AND WRITING PAPER
(PWP)
For printing and writing paper (PWP) TNPL distributes through indentors and through
direct sales.
Manufacture (TNPL) Dealers wholesalers Consumers
A) Direct sales.
Manufacture (TNPL) Consumer
TNPL is also making direct sales to certain major customers. Some for the major direct
customers are Navneet Publications Ahmedabad, Tamil Nadu Text Book Corporation, Director
of Stationary and Printing Govt of Tamil Nadu etc., TNPL has recorded the highest production
of 30248 Mts.
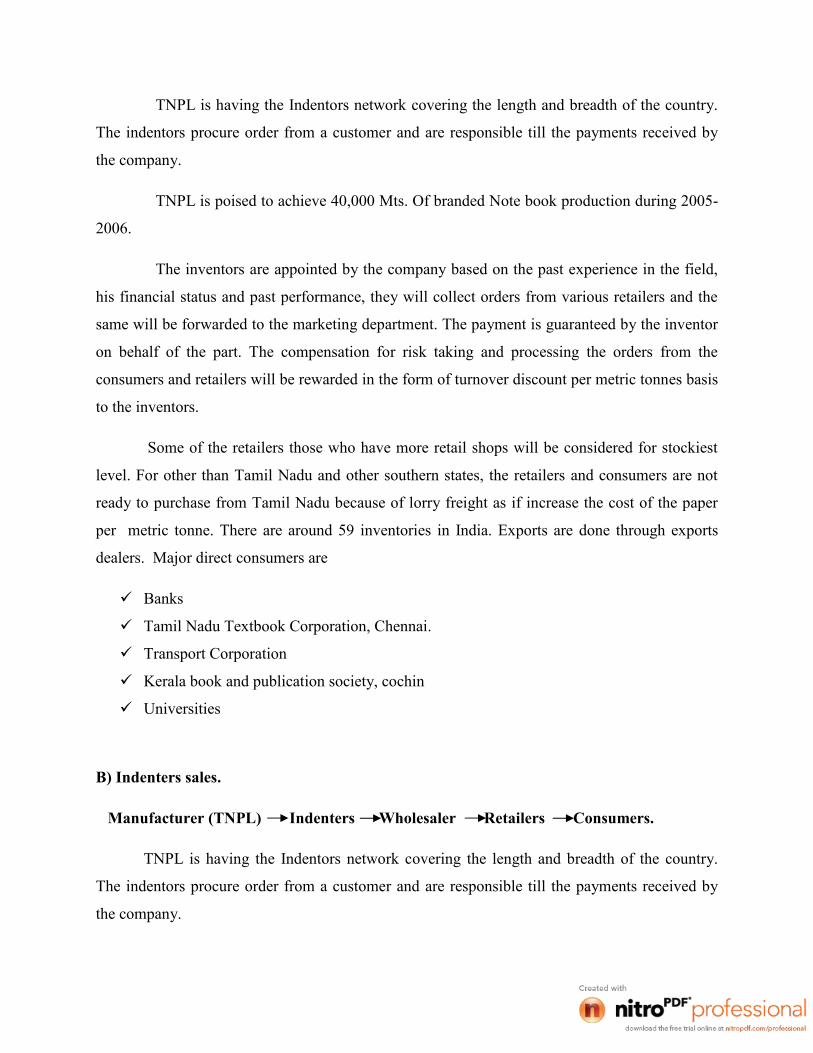
TNPL is having the Indentors network covering the length and breadth of the country.
The indentors procure order from a customer and are responsible till the payments received by
the company.
TNPL is poised to achieve 40,000 Mts. Of branded Note book production during 2005-
2006.
The inventors are appointed by the company based on the past experience in the field,
his financial status and past performance, they will collect orders from various retailers and the
same will be forwarded to the marketing department. The payment is guaranteed by the inventor
on behalf of the part. The compensation for risk taking and processing the orders from the
consumers and retailers will be rewarded in the form of turnover discount per metric tonnes basis
to the inventors.
Some of the retailers those who have more retail shops will be considered for stockiest
level. For other than Tamil Nadu and other southern states, the retailers and consumers are not
ready to purchase from Tamil Nadu because of lorry freight as if increase the cost of the paper
per metric tonne. There are around 59 inventories in India. Exports are done through exports
dealers. Major direct consumers are
Banks
Tamil Nadu Textbook Corporation, Chennai.
Transport Corporation
Kerala book and publication society, cochin
Universities
B) Indenters sales.
Manufacturer (TNPL) Indenters Wholesaler Retailers Consumers.
TNPL is having the Indentors network covering the length and breadth of the country.
The indentors procure order from a customer and are responsible till the payments received by
the company.
ORDER PROCESSING
Mostly the indenters are appointed by the company based on the past experience in the
field, this financial status and past performance. The Indents should be sent in the prescribed
format and should be complying with all respects like codes of materials, indenter, and consignee
are must. Received indents will be processed at Chennai and sent to the site office every month
of production, production plan for the next month. Indents of those parties who names are the
outstanding list will not be processed. Two copies of processed indents one for the consignee and
another for the indenter with order acceptance number will be sent to the indenter.
The orders are collected from the various retailers and the same will be forwarded by the
indentors to marketing department TNPL. The marketing department consolidates the orders and
gives information to production department for manufacture of required paper with the date of
paper dispatch. The production department produces the particular variety of paper and delivers
it to the marketing godown. Then the marketing department will inform to the customer and the
head office marketing department. Then the finished product will b arranged for transportation.
PAYMENTS
The general terms of payments are by way of Demand Draft. However they accept local
cheques in the following collection centers.
Bangalore, Calcutta, Chennai, Delhi, Hyderabad, Luck now, Mumbai, Patna
For the payments, the company gives various commission and discounts to the Indenter (or)
Customers are as follows.
A) Cash Discounts
Cash discounts will be allowed, as per the term announced by TNPL from time to time
cash discounts for advance payment will be deducted and shown in the invoice itself. For other
than advance payment, parties may deduct the cash discount as specified in the invoice while
making payment. For advance payment, DD should be sent for the exact value of the materials
less the applicable discount.

B) Trade Discount
Trade discount is given through invoice to customers. The statement is passed by monthly
basis.
C) Star Discount
Star discount is given to particular customer only. If any customer purchases 16 MTS per
month he gets star discounts.
D) Regional Discount
Regional discount is based on the delivery place of the goods. This discount differs from
one area to another area.
E) Off take Incentive
Off take incentive is allowed to indenters for taking materials. Security deposit will be
collected as per policy of TNPL based on the quota allowed. At present the deposit payable Rs.
10000 per tonne. Interest at 12% per annum on the security deposit will be paid way of credit
note in year.
Annual Incentive
Discount is issued to indenter all the end of every financial year. Eligibility to get annual
incentive the following two conditions.
Invoice outstanding not more than 90 days of the customers.
Throughout the year the customer should have achieved the minimum quota.
Dispatch of materials
For the dispatch of materials TNPL to use the 2 ways of transportation modes.
Road Transportation
Rail Transportation
Insurance
Transit insurance can be arranged at the request of the Indenter/Customer, the amount will
be charged in the invoice. The present premium is payable at 0.17% of invoice value. Insurance
claims should be filed by the customers with insurance and followed by them for settlement.
However TNPL will render assistance on this matter.
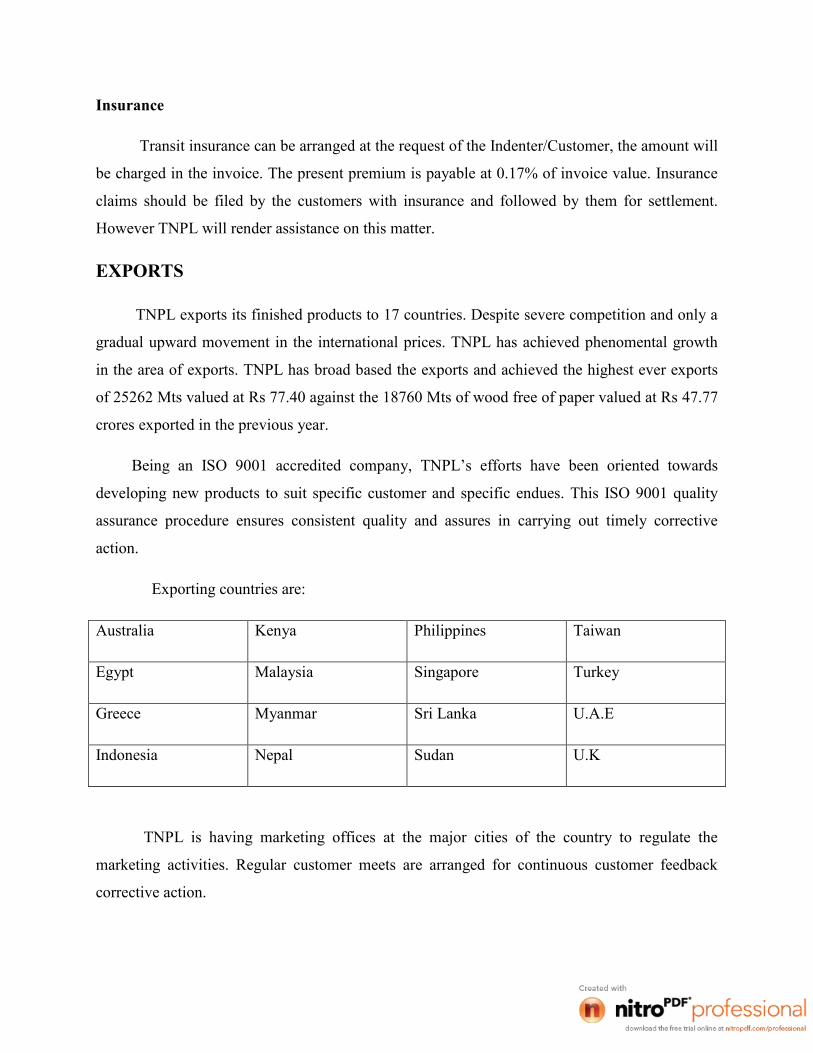
EXPORTS
TNPL exports its finished products to 17 countries. Despite severe competition and only a
gradual upward movement in the international prices. TNPL has achieved phenomental growth
in the area of exports. TNPL has broad based the exports and achieved the highest ever exports
of 25262 Mts valued at Rs 77.40 against the 18760 Mts of wood free of paper valued at Rs 47.77
crores exported in the previous year.
Being an ISO 9001 accredited company, TNPL’s efforts have been oriented towards
developing new products to suit specific customer and specific endues. This ISO 9001 quality
assurance procedure ensures consistent quality and assures in carrying out timely corrective
action.
Exporting countries are:
Australia Kenya Philippines Taiwan
Egypt Malaysia Singapore Turkey
Greece Myanmar Sri Lanka U.A.E
Indonesia Nepal Sudan U.K
TNPL is having marketing offices at the major cities of the country to regulate the
marketing activities. Regular customer meets are arranged for continuous customer feedback
corrective action.

During 2004- 2005 the company has sold 7708 tonnes of Newsprint and 1, 93,532 tonnes
of printing & writing papers. Of this, 41264 tonnes of printing & writing papers exported valuing
Rs. 127.68 cores. The exports recorded a growth of 37% in quantitative terms and 47% in value
terms during the year 2004-2005 compared the previous year. Thus TNPL recorded now peak in
Exports during 2004-2005.
The company has achieved all time highest production of 1, 96.240 MT and all times
highest sales of 2, 01,279 MT during the year 2004-2005.
Symbolic of TNPL commitment to the environment, the World Wide Fund for nature
(WWF) has entered into a pact with TNPL to use the ‘panda’ logo in TNPL branded products.
EXCISE DUTY
It is a kind of tax collected by central Government on the production. Applicable Excise duty
is 16% for printing & writing paper. Newsprint is exempted from excise duty. There is no excise
duty for export sales and sock branch sales.
1.9 PERSONNEL AND ADMINISTRATION DEPARTMENT
In TNPL they are having the good human resource department and this departmentcontrolling the entire workforce of the employees. So we are going to see the major activities ofthis department.
The work of a personnel department deals with procuring, hiring, training, placement,
utilizing and maintaining an effective work force that will help in the accomplishment of the
firms’ goals. The responsibility of good personnel administration rests on every supervisor and
manager in the organization.
PERSONNEL ADMINISTRATION
Personnel Administration is a method of developing the capabilities of the employees in
the factory so that they get maximum satisfaction out of their work and give their best efforts to
the organization so the organization also gets the benefits indirectly.
PERSONNEL AND ADMINISTRATION IN TNPL
Functions:
1. HR department main function of all the organization is recruitment of employees, staffs,workers, etc.,
2. After the recruitment the company has to provide the training to the selected candidates andproviding the good working environment to them.
3. To maintaining the records and files of each staff and workers and follow up in mattersconcerned with pay increase, promotional activities etc.,
4. To maintain proper base on with the accounts department regarding payment of salary, wages
etc., by giving proper information.
5. By keeping the proper records about the employees it will provide the information’s regarding
employees it is used to solve if any legal problems.
6. To enrich the employees co-ordination among the employees.

HUMAN RESOURCE DEPARTMENT STRUCTURE
GENERAL MANAGER
DEPUTY GENERAL MANAGER
MANAGER
DEPUTY MANAGER
SENIOR MANAGER
OFFICER
ASSISTANT OFFICER
STAFF
WORK MENSENIOR ASSISTANT
ASSISTANT GRADE 1
ASSISTANT GRADE 2
JUNIOR ASSISTANT
FOREMEN
ASSISTANT
CHARGE MAN
HIGHLYSKILLED
SKILLED
SEMI SKILLED
UNSKILLED
The Personnel Department in TNPL is mainly consists of following:
Establishment
Industrial relations
Human Resources and Development
1. Establishment
Establishment is that part of personnel and administration management process which is
primarily concerned with the human constituents of an organization. The following functions are
comes under the establishment.
Recruitment
Selection
Induction
Training
Promotion
Increment
Bonus
Employment
a. Recruitment
Employee’s recruitment is the very important process in the organization. So every
organization has to recruit and retire the employees. Before recruitment, the department has to
make detailed study and determine the activities of the department. If there is any vacancy, the
company has to give the advertisement or the company can inform the employment exchange.
b. Selection
Selection of the employees made through oral or written test it depends upon job
requirements and skills necessary for the company. After the satisfaction of the HR department
the candidate can get the appointment.
c. Induction
It is conduct after the candidate selected in the interview or after getting the appointment
order. Before joining into the job all candidates have to attend the medical examination. After
some certificate verification formalities are the over, the HR trainer will provide the details about
the organization and nature of the job which he is going engage, and introducing their
department heads.

d. Training
Training is the important aspect in all kinds of jobs. After the appointment of the candidates
they have to get the training regarding their respective department works it will take normally
two years, during this training period the candidates can get stipend.
e. Promotion
Promotion is one of the welfare activities of the HR department. Without having any
promotion the employee cannot get the job satisfaction, the promotional activities will enhance
the output of the company. It will provide the unions and management under the industrial
dispute Act, with regard to officers, promotion will be done as per the policy of the management.
f. Increment
All the company’s regular employees are having the eligible to get the yearly increments. The
increment will vary depends upon the posting.
g. Bonus
Every year bonus will be paid to the employees of the festival of Diwali and Pongal. For
executives and workman they will get 20% as bonus and 35 days wages as a bonus are paid
subject to ceiling of maximum of Rs. 10,000.
h. Employment
During the course of the training there are 1820 plus employees are on permanent basis are on
roll, of which 1000 are workmen. In addition to this, contract labours around 1600 are also
there. In total around 3420 employees are working.
2. Industrial Relation
The word ‘industrial relation’ denotes the good relationship between management, employees
and Government in any industry. In TNPL they are maintaining the cordial relationship with
their employees. The directors of the company placing the valuable contribution made by the
employees of the company to the performance and growth of the factory.

3. Human Resource Development
HRD must concentrate on the development of the overall organization. It has to improve the
organization diagnostic and problem solving capabilities and make the organization more
effective one. HRD in TNPL mainly focus on Health, Safety and Welfare measures.
a. Health
TNPL provides the health care to its employees and their family members. They are having
various schemes for their employees which is they needed.
TNPL has various medical assistance schemes of its employees and dependants. In addition
they are providing the First Aid is also maintained in the factory. TNPL bearing 50% medical
expenses for the employees if they admitted 24 hours in the hospital.
b. Safety
Safety is the foremost one in the factory without safety the employee may get fear to work,
but in TNPL is not like that. The factory is providing the clearly defined safety policy. The
safety policy specifies in detail the responsibility for implementation of safety measures,
prevention of personal injury, accident reporting system.
All safety reporting systems, testing procedures, inspection procedures are brought under ISO
9001-1994 documentation.
c. Welfare Measures
TNPL Welfare Measures are divided into two types:
1. Statutory Welfare Measures
Canteen facility:
In TNPL they are having good industrial canteen as per the requirement and the needs of the
workmen and officers. In addition they are maintaining two types of canteen.
Employees canteen
Workmen canteen

Gratuity:
Gratuity is paid for staffs and workmen as per the Gratuity Payment Act. For officers gratuity
is paid as the service rules of the company.
Leave:
In TNPL all the permanent employees are getting three different types of leaves. They are
explained in the following table.
Casual leave
Sick leave
Privilege leaves
Apart from these above leaves, the company is providing 9 days as national and
festival holidays.
Leave Schedule:
S.No. Types of Leave Officers Staffs Workmen
1. Casual Leave 10 days 12 days 12 days
2. Sick Leave 10 days 8 days 8 days
3. Privilege Leave 30 days 30 days 1 day for every
20 days worked
4. National festival 9 days per year 9 days per year 9 days per year
TNPL providing some other facilities to their employees such as:
Lunch rooms
Rest rooms
Provident fund
Toilets
Shelters
First Aid Applications
Safety facilities for storing and drying
cloths
Sitting facility
Purified water facility.

2. Non-Statutory welfare measures
Uniforms:
In TNPL the permanent employees are only wearing the blue color uniform. Two pairs of
Terri cotton uniform are being issued to all the permanent employees. It is used to identify the
employees from the contract labours.
Shoes:
In TNPL employees are getting industrial type of Bata Safety shoes is being issued to all
employees including contract labours with three pairs of Nylon socks. It will protect the feet of
the employees.
Identity Badge
Identity badge has been issued to all employees.
Medical Assistance
TNPL is providing leave with wages for a period of six months, pay for hospitalization
charges for employees, who suffer from certain specific chronic illness.
First- Aid Medical centre
TNPL has a good first aid medical with one male medical officer, one female medical officer,
one nurse and two dressers. The first aid medical centre is rendering the medical assistance to
the colony residents besides rendering assistance to the accident cases to the employees.
TNPL School
TNPL is providing the matriculation school where about more than 1700 children are studying.
In this school all employees can join their children and also the outsider can join in this school.
TNPL Housing Colony
The factory maintains a well laid housing with around 702 houses where essential employees
are given accommodation on nominal basis. The employees those who are coming more than 30
km from the factory those employees can get quarter’s facilities. TNPL Colony has 24 hours
power supply.
Recreational Facilities
The following clubs are functioning in the TNPL housing colony, which arranges for regular
cultural programmes.
TNPL study centre
TNPL recreation club for workman
TNPL ladies club for officer’s wives.
TNPL ladies recreation club for
employees wives for workmen and
staff.
Personal Accident Policy
Group Insurance Scheme.
Bachelor’s Hostel.
Staff mess.
Housing Loan.
Labour Welfare Centre.
Shift Timings
A- Shift from 6.00 AM to 2.00 PM
B- Shift from 2.00 PM to 10.00 PM
C- Shift from 8.00 PM to 4.00 AM
G- Shift from 8.30 AM to 5.30 PM
1.9.1 CORPORATE SOCIAL RESPONSIBILITY (CSR)
TNPL, as a responsible corporate citizen, has ingrained the philosophy of Corporate Social
Responsibility deeply into its value system. The company is consistently taking up various
community welfare initiatives for the benefit of the people living in neighboring villages. During
the year 2009-10, the company has spent an amount of about Rs.2.63 Cr. for various CSR
activities. For the year 2010-2011 an amount of Rs.3 Cr. has been allotted for various CSR
activities.
1. Education
A modern school, accredited with Five Star Status by Bharathidasan University, Trichy,
providing educational facilities upto 12th Standard, is functioning in the township catering to the
educational needs of the children of employees and the children from the neighbourhood. The
school has the distinction of turning out toppers at District level year on year. In 2008-09, one of
the students has secured 3rd place in National Ball Badminton Championship. The school
provides opportunities to children to excel in studies and extra curricular activities. Every year,
the company spends about Rs.1 Cr. in providing education to nearly 2,200 students.
TNPL provides free Scholarship to children belonging to the economically weaker section to
pursue their education in TNPL school. TNPL also supports augmentation of educational
facilities in various Government schools in neighboring villages, through supply of note books
and giving financial assistance to meritorious children, building additional class rooms,
providing furniture etc. The company has also provided computers to number of schools.
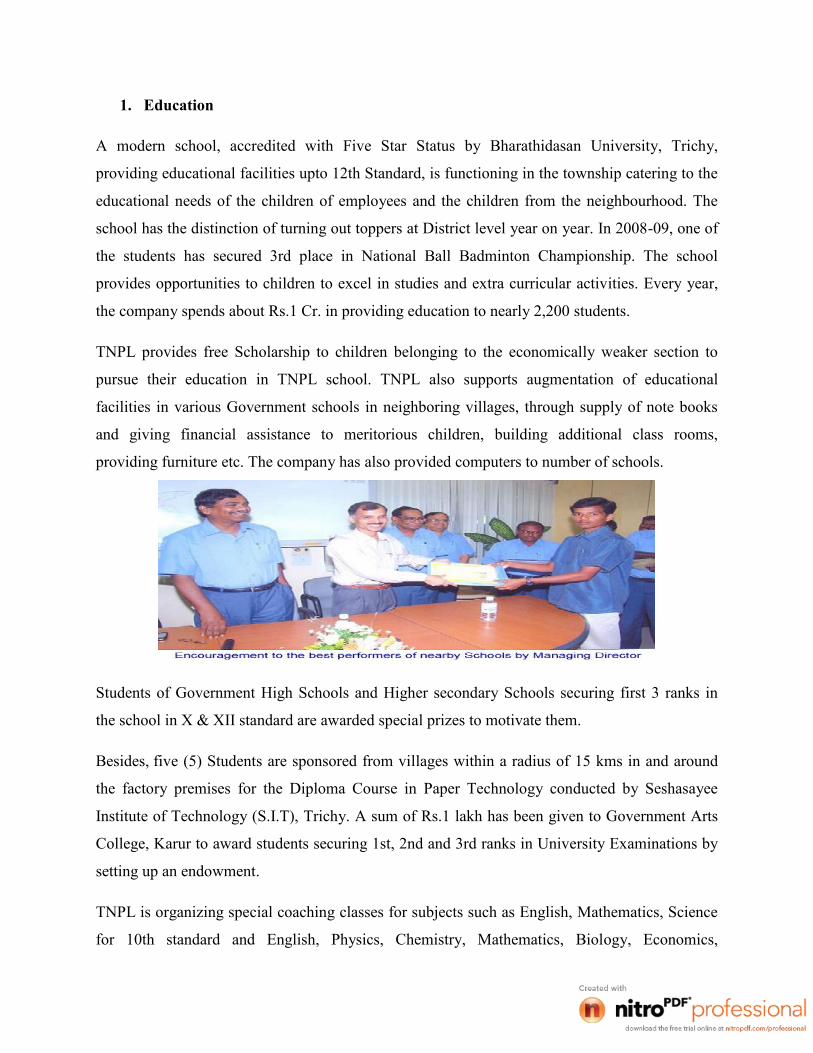
Students of Government High Schools and Higher secondary Schools securing first 3 ranks in
the school in X & XII standard are awarded special prizes to motivate them.
Besides, five (5) Students are sponsored from villages within a radius of 15 kms in and around
the factory premises for the Diploma Course in Paper Technology conducted by Seshasayee
Institute of Technology (S.I.T), Trichy. A sum of Rs.1 lakh has been given to Government Arts
College, Karur to award students securing 1st, 2nd and 3rd ranks in University Examinations by
setting up an endowment.
TNPL is organizing special coaching classes for subjects such as English, Mathematics, Science
for 10th standard and English, Physics, Chemistry, Mathematics, Biology, Economics,
Commerce and Accountancy for 12th standard students with a view to encourage slow learning
students in Government Schools who are appearing for 10th and 12th standard public
examination in 2009-2010.
2. Career and Knowledge Development
It has been TNPL’s endeavor to provide various kinds of vocational training to the rural youth of
the area. Accordingly, a Computer Training Centre has been set up to provide computer literacy
to unemployed youth from the neighbouring villages. Based on aptitude, Advanced Training in
computers is imparted to make the youth employable.
A Soft Skill Development Center has been set up which conducts Typewriting classes both in
English and Tamil for unemployed youth from the villages. On completion of Training, the
trainees appear at the public examination conducted by the State Government for different levels
of proficiency in Typewriting.
Training in sewing, apparel making and bee keeping is imparted to women from neighbouring
villages to improve their employability and their economic status.
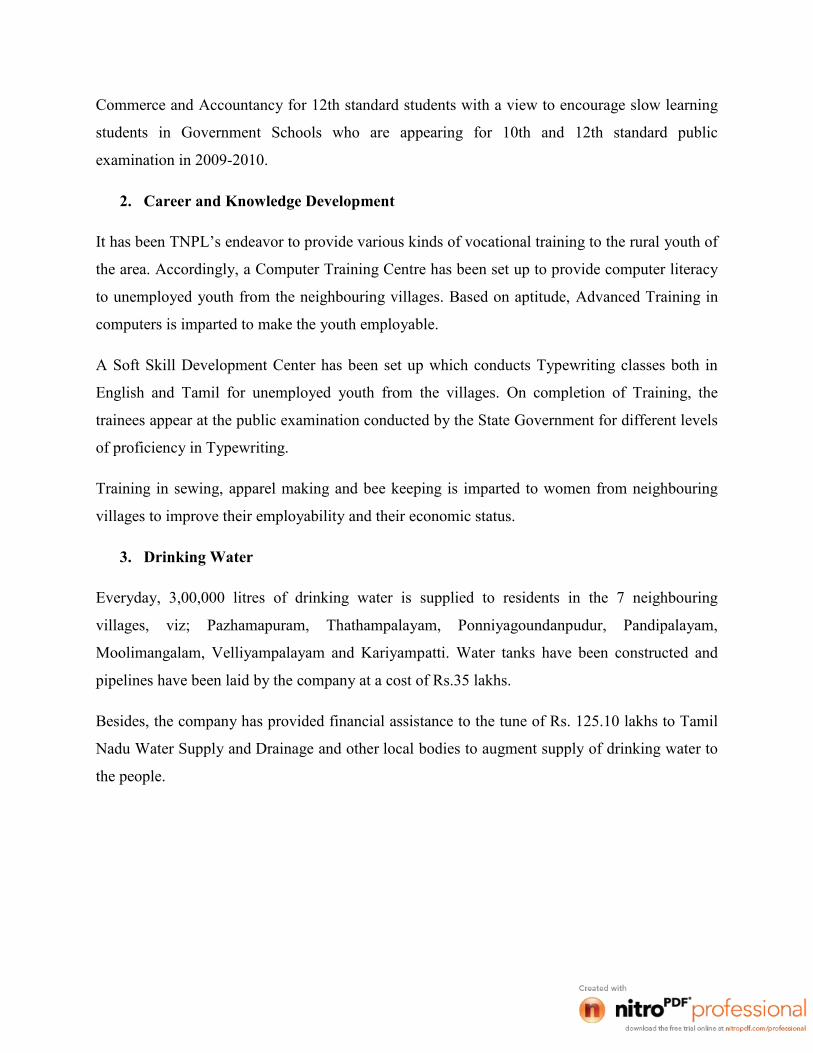
3. Drinking Water
Everyday, 3,00,000 litres of drinking water is supplied to residents in the 7 neighbouring
villages, viz; Pazhamapuram, Thathampalayam, Ponniyagoundanpudur, Pandipalayam,
Moolimangalam, Velliyampalayam and Kariyampatti. Water tanks have been constructed and
pipelines have been laid by the company at a cost of Rs.35 lakhs.
Besides, the company has provided financial assistance to the tune of Rs. 125.10 lakhs to Tamil
Nadu Water Supply and Drainage and other local bodies to augment supply of drinking water to
the people.
4. Medical and Public Health
TNPL regularly organizes Medical Camps in the neighbouring villages, through its Medical
Officers and Para-Medical Staff. Medical personnel of the Government Primary Health Centre
also join the team. Patients are screened for ailments and medicine is distributed free of cost for
minor ailments. For major illness, financial assistance is given to the individuals.
Pamphlets on general health and hygiene are circulated amongst employees and the
neighborhood population.
Blood donation camp is jointly organized by TNPL and the Blood Bank of the District Govt.
Hospital, Karur on a regular basis. Eye camp for students studying in the neighbouring Govt.
Schools was organized in February, 2009. In the first phase, Teachers were given training by
Doctors from Aravind Eye Hospital, Madurai. The training enabled the teachers to identify
school children requiring treatment. Based on the screening, 275 students were examined by eye
specialists from Aravind Eye Hospital, and spectacles were given to 83 students free of cost.
During February 2010, Special Eye Screening Camp was organized for the residents of
neighborhood villagers in co-ordination with Aravind Eye Hospital, Madurai.
5. Infrastructure and Road Improvements
TNPL has been contributing its resources liberally towards the improvement of infrastructure in
the neighbouring areas. The company has constructed drains and retaining walls in the TNPL
Effluent Water Lift Irrigation Society (TEWLIS) ayacut area by spending Rs.86 lakhs. Besides,
several road improvement works have been done and public toilets constructed.
6. Promotion of Sports and Recreation
TNPL has taken several steps to promote sports amongst the youngsters of the area. District and
State level athletic championships are hosted by the company. Youngsters from neighbouring
villages are trained in various athletics disciplines under the supervision of coaches. Many of
these athletes have won medals at the State level.
Besides, in 2007-08, an amount of Rs.10 lakhs was given to the District Administration, Karur
for construction of Sports Complex in Karur.
7. Live Stock and Cattle Care
Livestock and Cattle Care Camps are held in neighbouring villages once in 2 months. Medical
and Para-medical staff from Department of Animal Husbandry and Veterinary Services, Tamil
Nadu Govt. provide the specialist support. TNPL sponsors the event by meeting all the
expenditure incurred for the camp. Medicines for cattle are provided and the camps have
received tremendous response and support. So far, 9 camps were conducted benefiting thousands
of cattle. Mobile cattle vaccination camps are held in co-ordination with Department of Animal
Husbandry and Veterinary Training and Research Institute, Karur to cover villages falling in
surrounding areas of TNPL.
8. Development of Tamil Language and Culture
By way of promoting Rural Art and Culture, cultural programmes by traditional folklore artistes
are held. Needy artistes are given financial assistance. Debates and symposium in Tamil are
held regularly. Local artistes are provided assistance to promote Rural Art and Culture. ‘Thai’
Pongal and Tamil New Year day was celebrated with enthusiasm and gaiety at TNPL Stadium
with a view to promote the Art and Culture of the region. TNPL joined 8 panchayats
viz.Kagithapuram, Punnam, Nanjai Pugalur, Punjai Pugalur, Vettamangalam, Thirukkaduthurai,
Kombupalayam, and Punjai Thottakuruchi in celebrating pongal as ‘Samuthaya Pongal’ in a
grand manner.
9. Greening the Environment
By way of increasing the area under green cover, 50,000 saplings of Neem, Vagai, Rain tree,
Bamboo etc., were planted in the following Panchayat / Villages: Vettamangalam, Kuppam,
Pavithram, Punjai Thottakurichi, Punjai Pugalur, Thirukkaduthurai, Nanjai Pugalur and
Manmangalam on a single day ie: October 31, 2008. An amount of Rs. 20 lakhs had been spent
for this purpose.
10. Other Community Welfare Act
Farmers’ meet is being conducted regularly to train the farmers in scientific methods of
cultivation and recent trends in farming. The company, through a tie-up with Tamil Nadu
Agricultural University, Coimbatore (TNAU), carries out periodic study of the soil conditions
and trains the farmers to get better yield. The farmers are also taken on tour to other states /
towns to acquire first-hand knowledge of the improved farming techniques adopted in these
places.
During monsoon, the company chips in its contribution by cleaning weeds, debris, etc., and
provide appropriate relief measures. As a welfare measure, gypsum is given to the farmers to
improve the soil quality of their land.
11."Talent-Expo"
Recognizing the fact that today’s youth are the future of India, TNPL conducts “TALENT-
EXPO” a platform to the students from rural and semi urban areas to exhibit their multifarious
talents. In ‘TALENT EXPO 2008-09’, over 1200 students from 55 schools participated in 23
competitions. In ‘TALENT-EXPO 2009-2010’ over 1200 students from 49 Schools participated
in 21 competitions.
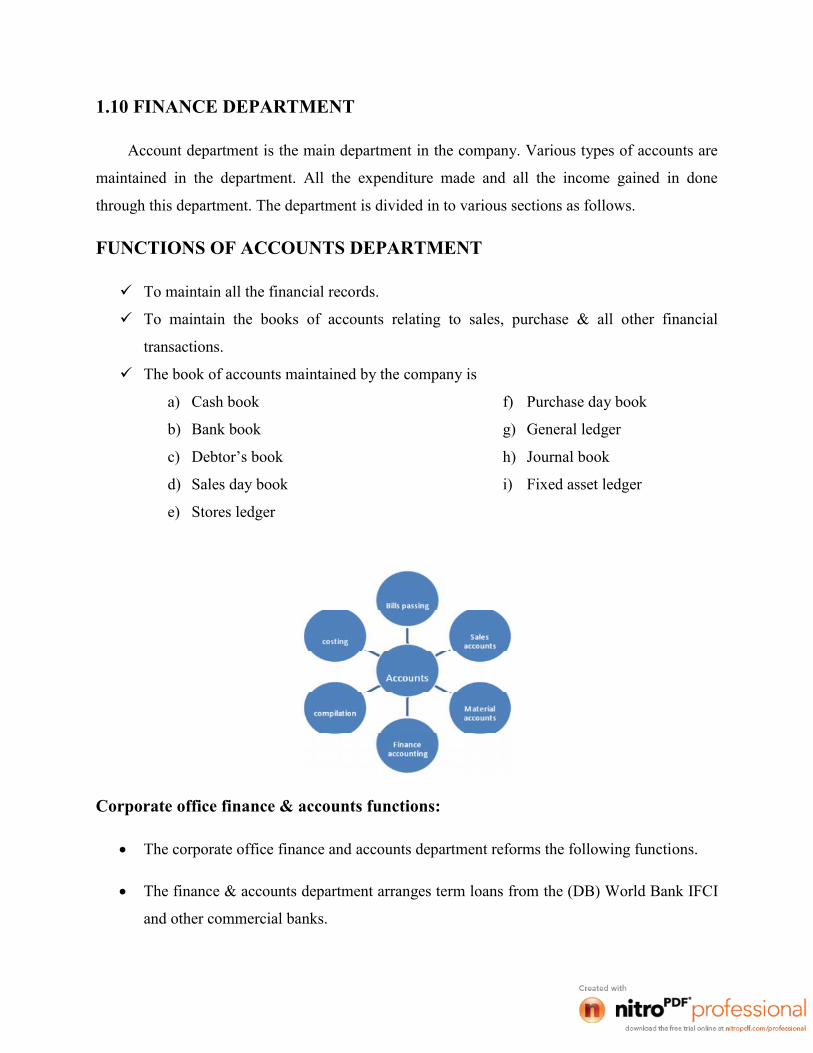
1.10 FINANCE DEPARTMENT
Account department is the main department in the company. Various types of accounts are
maintained in the department. All the expenditure made and all the income gained in done
through this department. The department is divided in to various sections as follows.
FUNCTIONS OF ACCOUNTS DEPARTMENT
To maintain all the financial records.
To maintain the books of accounts relating to sales, purchase & all other financial
transactions.
The book of accounts maintained by the company is
a) Cash book
b) Bank book
c) Debtor’s book
d) Sales day book
e) Stores ledger
f) Purchase day book
g) General ledger
h) Journal book
i) Fixed asset ledger
Corporate office finance & accounts functions:
The corporate office finance and accounts department reforms the following functions.
The finance & accounts department arranges term loans from the (DB) World Bank IFCI
and other commercial banks.
Arranges for working capital loan (cash credit)
The company working capital limit is 70 Crores from contortion banks consisting of
Andhra Bank, Canara Bank, Indian Bank & Indian Overseas Bank, K.V.Bank, Syndicate
Bank of Patiala, State Bank of India.
BILL PASSING OR ESTABLISHMENT
The finance departments of corporate office prepare pay roll and disburse the salary and
other allowances to employees at corporate and all branches office.
The accounts department’s another function is to compile all accounting entry prepare
trial balance, profit and loss account and balance sheet site office accounts will be merged with
corporate office final accounts once entry quarter and at the year end to publish the results in the
newspaper as per SEBI’S guideline.
Besides, the corporate account department is working the opening of letter of credit (LC)
for major imports like coal, pluged.
BILL PASSING SECTION
Accounts Department receives the bills of invoice from supplies vendors through
materials of user department. The following types of bills are received at accounts department.
Civil, repairs & maintenance bills.
Chemicals & packing materials.
General stores, spares.
Labour bills.
Transport raw materials & finished goods.
In TNPL while processing bills for payment, bills section takes various control measures in
order to make correct payment to the parties.
General stores, Chemicals & Packing materials for making payments to vendor the following
documents are verified.
Bills or invoice received from vendor

Materials receiving report (MRR) received from stores department for ensuring the
materials are received at TNPL.
Purchase order for terms of payment value to materials, quality, validity to the order etc.,
If the purchase order terms matches with the bill, MRR, Bills section prepare bank vouches
while processing the above if any to the terms in the purchase order differs the bill section. Will
send inter office Memorandum to make amendments to materials department. After getting the
amendments only the bill is processed for payments.
VARIOUS TYPES OF BILLS
A) Civil Repairs & Maintenance Bills
The company is engaging civil contractor construction of building, repairs &
maintenance works. For the above works the company is issuing work order to the civil
contractor.
B) Labour Bills
The company is engaging labour for various works through contractors. For labour
supply contract the company is issuing work order with terms and conditions, which is based on
rate contract basis. The labour contractors are submitting their bills once in 15 days, to the
executive department. The executing department will be certifying that the work has been
completed and payment can be made after due verification at account department. After receipt
of duty certified bill, the bills passing section will process the bills for payment with reference to
work order.
C) Transport Bills
The company is engaging vehicles to transport fuel of raw materials from offsides and
finished goods to the customers. The transport contract is awarded to the transport, contract for
one year on rate contract basis. The transport contractor submits the bills along with the goods
carry copy to the transport department. The transport deportment after the verification certifies
the bill for payment and subject to accounts department verification. After of bill at bills section
process, the bills for payment with reference to work order issued to the transport contractors.

D) Miscellaneous Bills
The miscellaneous works bills duly certified by the respective user department and are
received by work order the same process for payment.
MATERIALS ACCOUNTING SECTION
The material accounting section is maintaining the stock ledger with records and bills of raw
materials, chemicals and coal. The receipt and issue of materials is accounted by the section. The
material accounting section is to be prepared stocks on monthly basis and it occurs with financial
records.
FINANCE SECTION
Finance section arranges the funds from corporate office: cash is paid only to employees for
travel advance. For all other payments, the company is issuing cheque only finance section
receives the bank payments vouchers from various sections in account department. Based on due
date of bills, every day finance section will prepare funds requirements and get the required
funds from corporate office. After receipt of funds, finance section will prepare the cheque and
sent foe dispatch to the parties.
COMPILICATION SECTION
Complication section receives the journal vouchers from various sections in the accounts
department. After ensuring that all vouchers are received and updates in the system. Compilation
section processes the above vouchers in the system. After processing it takes Trial Balance Profit
& Loss Account, general ledger & party ledgers.
COSTING SECTION:
Cost accounting section is preparing the cost statement from the following.
VARIABLE COST
Process costing system is applied. The two major process involved are
Pulp making Paper making
The service function inter-alia include the following
Water Steam Generation Power Generation
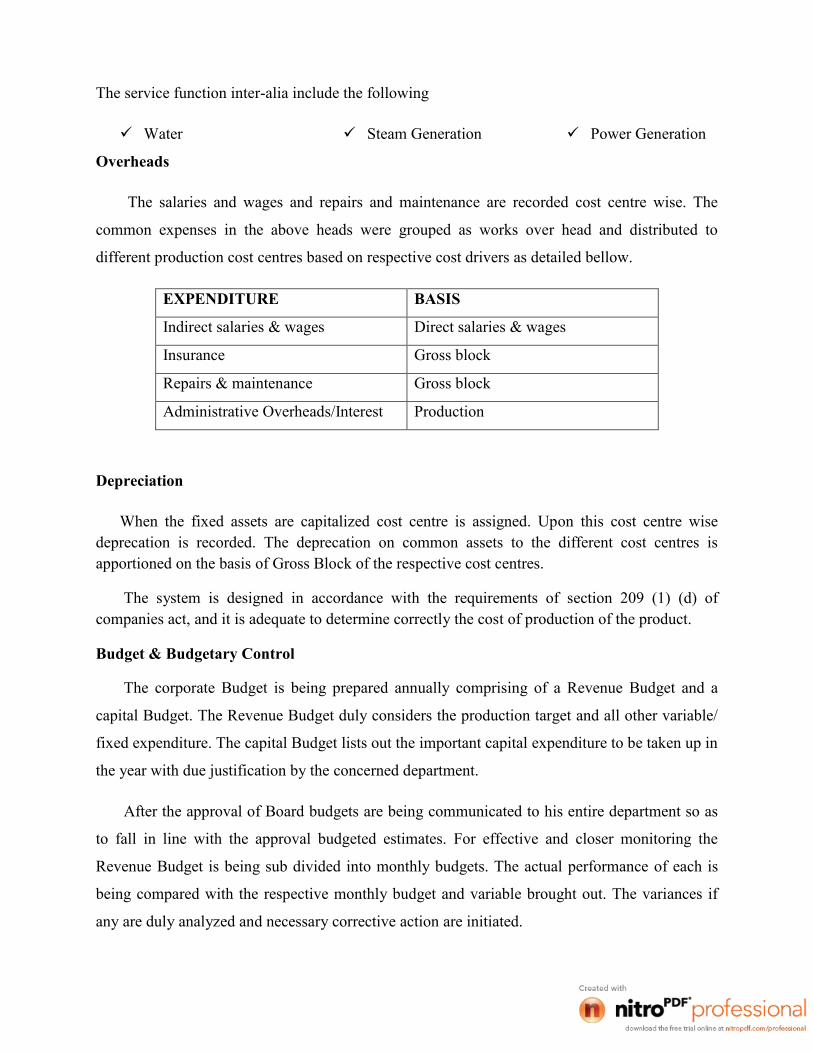
Overheads
The salaries and wages and repairs and maintenance are recorded cost centre wise. The
common expenses in the above heads were grouped as works over head and distributed to
different production cost centres based on respective cost drivers as detailed bellow.
EXPENDITURE BASIS
Indirect salaries & wages Direct salaries & wages
Insurance Gross block
Repairs & maintenance Gross block
Administrative Overheads/Interest Production
Depreciation
When the fixed assets are capitalized cost centre is assigned. Upon this cost centre wisedeprecation is recorded. The deprecation on common assets to the different cost centres isapportioned on the basis of Gross Block of the respective cost centres.
The system is designed in accordance with the requirements of section 209 (1) (d) ofcompanies act, and it is adequate to determine correctly the cost of production of the product.
Budget & Budgetary Control
The corporate Budget is being prepared annually comprising of a Revenue Budget and a
capital Budget. The Revenue Budget duly considers the production target and all other variable/
fixed expenditure. The capital Budget lists out the important capital expenditure to be taken up in
the year with due justification by the concerned department.
After the approval of Board budgets are being communicated to his entire department so as
to fall in line with the approval budgeted estimates. For effective and closer monitoring the
Revenue Budget is being sub divided into monthly budgets. The actual performance of each is
being compared with the respective monthly budget and variable brought out. The variances if
any are duly analyzed and necessary corrective action are initiated.

1.11 PURCHASE DEPARTMENT
The purchase department is the mediator between the user and the vendor. Purchase is through
tenders which are of two types:
1. Closing
2. E-Procurement
Closing tender:
The material should be obtained by the ISO certification then only it will be taken. It should be n
own product. Lab should certified selecting vendor.
Qualification for suppliers
L1-250 L2-300 L3-350
TNPL ask the L2 supplier to match the L1 price if L2 did not match than TNPL ask L3 to
match if L3 did not match than the quality will be less and the period will also be less for the
person. Again TNPL will go for retender after 2 or 3 months.
E-Procurement:
Vendor will be quoted only in interest. Each supplier has to as per the norms of TNPL‘s lab
evaluation. Vendor will allow participated while making tender through their “password”.
TNPL fixes the rate in the E-Procurement. Finally L1 will be selected than L2 also match with
L1 price.
Order quality will be distributed in the 60:40 ratios that are L1 got 60% of quantity of
requirement to 40% of L2 because TNPL wants two suppliers in the each every material.
Payment:
In the earlier period 90% of payment will be paid to the suppliers whenever material reached at
the site balance 10% payment will be paid depending upon the user certification.
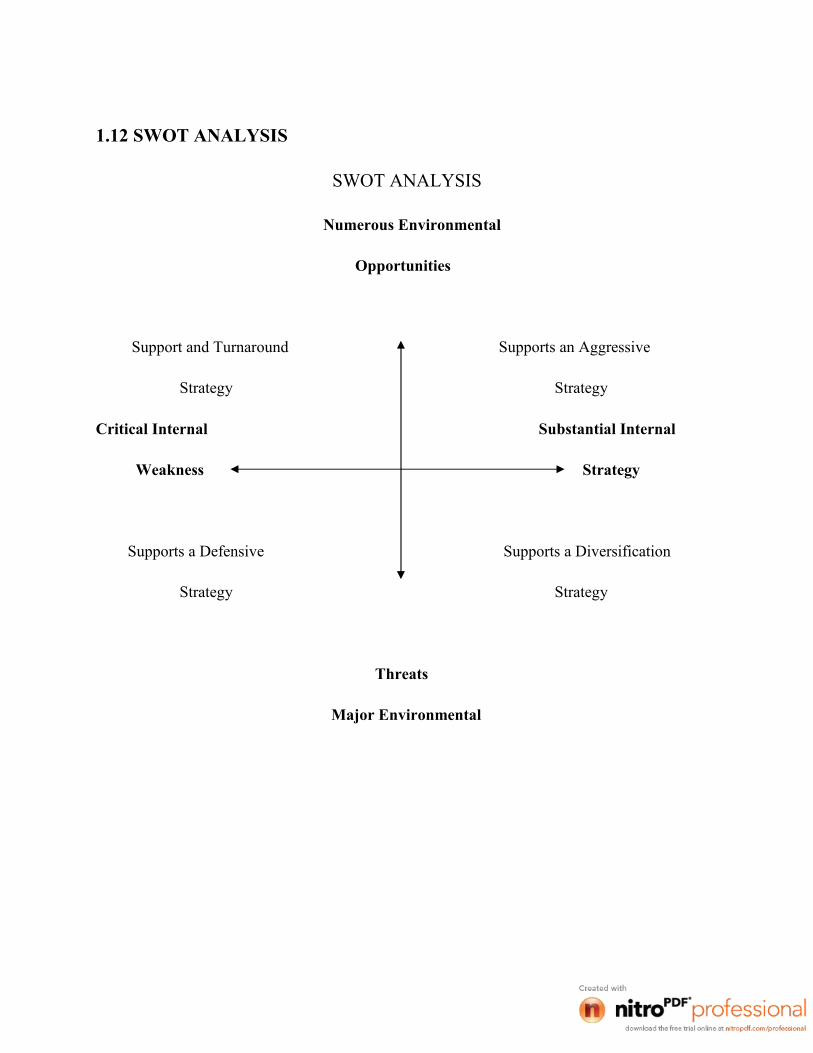
1.12 SWOT ANALYSIS
SWOT ANALYSIS
Numerous Environmental
Opportunities
Support and Turnaround Supports an Aggressive
Strategy Strategy
Critical Internal Substantial Internal
Weakness Strategy
Supports a Defensive Supports a Diversification
Strategy Strategy
Threats
Major Environmental

Strength:
World Bank Assistance.
Capacity doubled within s decade.
Largest Bagasse based plant.
Latest Technology Implemented.
Working Continuously on Cost reduction.
Zero Stock of finished goods for the 16th Continuous Year.
New Studies for alternative renewable Raw Materials.
Product Line Extension.
Excellent Customer Service.
Strong R & D force.
Innovations in Waste Management and Reusability.
Well Established Network.
Rising Demand-Supply Gap.
Quick Decision through OIIS.
Weakness:
Depend Sugar Mill for Bagasse.
Depend on TAFCRN for Pulpwood.
Depend on River Cauvery for water.
Production Break-off due to water Shortage.
Environmental Impact.
Selective Distribution Channel.
No Promotional Campaign.

Opportunities:
Raising demand for Paper in Future.
A Produce Cement using mill waste.
Expand Power Generation.
Expand the Clonal Plantation Scheme.
Expand the Methane Gas Production.
Gain a Large Share in Existing Market.
Study on Commercial Suitability of wild Sugarcane.
Improve Environment Performance.
Alkaline Sizing of Baggasse Based Papers.
Threats:
Scarcity of Raw Materials.
Deforestation.
Failure of Monsoon.
Increasing Competition.
Major prolonged economic depression.
Reduce demand due to Paper les office.
Changes in Excise Duty Affect the Price of Paper.
Availability of Low cost Paper in Foreign Market.
1.13 CONCLUSION
From this report, we able to know about each and every functions of the department of
this organization, it is obvious that it has more efficiency and also able to survive in this field.
The company is now planning to improve its efficiency by having fully fledged equipment and
modern technology to enrich their overall functions. This organization may use computer which
is one of the most wonderful invention of the centenary will also help this organization to have
link with its development in feature.
As for as paper industries are concerned, this industry occupies a major part among the
industries of our economy. This industry alone provides more employment Opportunities then
any other industry. So, government will take all necessary steps to improve this industry. So that
it will be assured that the economy of our country could be developed.

INTRODUCTION TO THE STUDY
2.1 INTRODUCTION
Finance is the main centre of economic activity. It plays an important role for the survival
and growth of a business. Capital has to be utilized effectively to increase the rate of
developments and to raise the efficiency of unit. The capital formation includes both fixed and
working capital. Capital can be raised by the issues of shares, debentures and borrowings.
Finance invested in purchase of fixed assets and installations of machines are considered as fixed
capital. The finance used for the purpose of meeting day to day operations of the business is
considered as working capital.
Every business needs funds for the purpose of its establishment and to carry out this day
to day operation. Long term funds are required to create production facilities through the
purchase of fixed assets. Funds are also needed for short term purposes.
Capital
Capital means total funds required for the enterprise. Capital plays an important role in
any business; it may be classified into two main categories.
Fixed capital
Working capital
Fixed capital
Capital required for purchasing the fixed land and building, plant and machinery, office
equipments and furniture etc; is called fixed capital. These assets are purchased for constant use
in production. They are not intended for resale.
These fixed assets are used on a permanent basis for producing goods and services.
Hence fixed capital requirements are financed by means of share capital, and long term
borrowings. The amount of fixed capital requirement will depend upon the size of the
organization and the nature of business.
Operating Cycle of the Working Capital
Modern business enterprises produce goods in anticipation of demand. Goods produced
are not sold immediately. Cash for sales is also is nit realized immediately. From the time of
purchase of raw materials, to the time of realization of cash an operating cycle is involved.
The following stages are usually found in the operation cycle of a manufacturing firm.
Conversion of cash into raw materials.
Conversion of raw materials in to work in progress
Conversion of work in progress in to finished goods.
Conversion of finished goods into debtors through sale
Conversion of debtors in to cash.
Working Capital Cycle
The period of time which elapses between the point at which cash begins to be expended
on the production and the collection of cash from a customer is called working capital cycle. The
below portion of the diagram shows in a simplified form the chain of events in a manufacturing
firm. Each of the boxes in the upper part of the diagram can be seen as a think through which
funds flow. These tanks, which are concerned with day-to-day activities, have funds constantly
flowing into and out of them. The chain starts with the firm buying raw materials on credit.
In due course this stock will be used in production, work will be carried out on the
stock, and it will become part of the firm’s work in progress (WIP)
Work will continue on the WIP until it eventually emerges as the finished product.
As production progresses, labour costs and overheads will need to be met.
Of course at some stage trade creditors will need to be paid
When the finished goods are sold on credit, debtors are increased.

STATEMENT OF THE PROBLEM
Ready money is Alaudin’s lamp adequate working capital is essential for continued
business operation. Irrespective of the size of business firm need working capital. Like fixed
capital, working capitals also determine the profitability of a business. In this context inherently,
Saturn research question arise like
1) How to find out this adequacy of working capital of a business? –say with reference
to the study organization, namely, TNPL.
2) What supplementary tools may be used to check the soundness of current ratio of the
business? Which is used to find out adequacy (or) strength of working capital of the
business? The present study titled. Working capital management in TNPL attempts
to find answers to the above questions.
2.2 OBJECTIVES OF THE STUDY
PRIMARY OBJECTIVES:
To study the existing system of working capital management of Tamilnadu News Print
and Papers Ltd.
To analyze and compare the changes in working capital
To analyze and compare the balance sheet
To analyze various ratios
Current ratio
Liquid ratio
inventory turnover ratio
working capital TURNOVER
ratio
Debt equity ratio
Proprietary ratio
Gross profit ratio
Operating ratio
`
SECONDARY OBJECTIVES:
To suggest measure to maintain adequate working capital
To calculate inventory to sales and inventory to current assets, fixed and total
asset turnover ratio
2.3 SCOPE OF THE STUDY
The present study is the case study of the TNPL. This has been undertaken in
order to highlight the liquidity and profitability of the company. The financial performance of
the company has been analyzed with the help of secondary data collected from the annual
reports, for a period of five years from 2005-2010.
2.4 RESEARCH METHODOLOGY
2.4.1 GEOGRAPHICAL AREA COVERED
This was conducted in the TAMILNADU NEWS PRINT AND PAPER LTD
Kagithapuram. Around 10 Kms. Distance is available to reach Karur to Kagithapuram by road.
2.4.2 PERIOD OF STUDY
The working capital management of TNPL covers a period of five years from 2005-06 to
2009-10.
2.4.3 RESEARCH DESIGN
Research design acts as the blueprint for the research by using this framework
the researcher moves step by step in to the research process. It constitutes the basic forms for
the collection, measurement and analysis of data. Research design stands from the advanced
planning of the methods to be adopted for collection of relevant data. Moreover it explains
about the techniques to be used in the analysis, keeping in view the objective of the research and
availability of staff, time and money. This research design was selected based on the objective
on the study and keeping in mind the time and availability of recourses for the research.
`2.4.4 METHODS OF DATA COLLECTION
The evaluation of the study is based on the secondary data collected from the
annual reports, journals and magazines. The analyses and recommendations made are based on the facts,
graphs, diagrams, which are given to represent statistical data for the study.
2.5 LIMITATIONS OF THE STUDY
The study coves only ltd aspects
The official were reluctant to give complete data as it involves some secrecy
The findings and results are formed only from the past five year’s data.
`REVIEW OF LITERATURE
Research design acts as the blueprint for the research by using this framework the
researcher moves step by step in to the research process. It constitutes the basic forms for the
collection, measurement and analysis of data. Research design stands from the advanced
planning of the methods to be adopted for collection of relevant data. Moreover it explains
about the techniques to be used in the analysis, keeping in view the objective of the research and
availability of staff, time and money. This research design was selected based on the objective
on the study and keeping in mind the time and availability of recourses for the research.
Different authors have studied working capital management in different ways and tools.
The following studies indicate how financial executives and academicians approached working
capital management. The American principles board of certified public accountants, USA
defines as working capital sometimes called as net working capital is represented by the excess
of current liabilities and identifies the relatively liquid of total enterprise capital with a margin
of buffer for maturing obligations within the ordinary operating cycle of business.
1. Dr.Radhe.S.Pradhan (2001) made a study of management of working
capital.The sample units are from public enterprises of Nepal. He has included in the study
structure and utilization of working capital and also estimated the demand function of working
capital. His study throws light upon the risk return trade off in working capital management of
sample units.
2. Sir.S.C.Bardic (2003) in his article of working capital management an
overview exposed the importance of working capital management as an index of corporate
performance.
3. A.Vijayakumar, A.Venkatachalam (1999) made a case study on
responsiveness of working capital management. This study generally indicates a moderate trend
in financial position and the utilization of working capital. Variations in working capital are
should be avoided. Attempts should also be made to use funds more effectively, by keeping an
optimum level of working capital. Because, keeping more assets causes a reduction in
profitability. Hence, efforts should be made to ensure a positive trend in the estimation and
maintenance of working capital.
`ANALYSIS & INTERPRETATION
ANALYSIS:
Working capital management is important for the success of the company.
Efficient management of working capital is one of the basic functions of finance manager.
Working capital management makes an efficient use of funds to attain profit by minimizing the
risk. It means managing the current assets and current liabilities efficiently. So it becomes a
challenging and a dynamic job.
In our country, working capital management has a greater significance in view of
the several constraints. Question of cash management arises for a company which are insisting
cash sales. The company has to buy and shore the essential raw material as and when they are
available, for the uninterrupted production. In the management of receivables even an
established as to extent liberal credit to its customers.
The working capital meets the short term financial requirements of a business
enterprise. The size of the working capital is measured in relation to the fixed capital. If the
working capital is high, fixed capital is low and vice versa. A proper balance has been
maintained between two. In the initial period business require working capital, but later on as
the production starts, the working capital requirements diminishes.
RATIO ANALYSIS
The most important tool used for analyzing capital is Ratio analysis. The
mathematical expression of the relationship between the two figures is called ratio. It helps to
evaluate the financial condition and performance of the firm. Some important ratios are applied
as a measure of working ratios have been calculated with the help of annual published financial
statements of the sample unit. The calculated ratios have been compared with previous periods
and norms, deviations from the norms are analyzed.
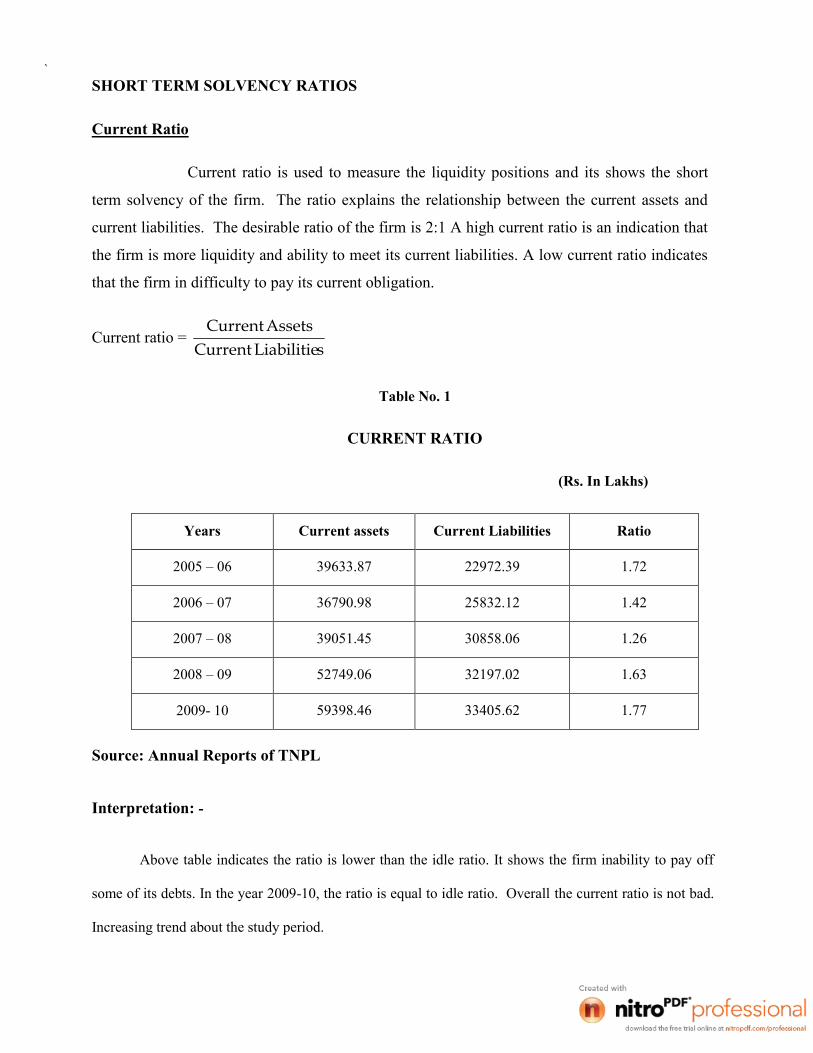
`SHORT TERM SOLVENCY RATIOS
Current Ratio
Current ratio is used to measure the liquidity positions and its shows the short
term solvency of the firm. The ratio explains the relationship between the current assets and
current liabilities. The desirable ratio of the firm is 2:1 A high current ratio is an indication that
the firm is more liquidity and ability to meet its current liabilities. A low current ratio indicates
that the firm in difficulty to pay its current obligation.
Current ratio =sLiabilitieCurrent
AssetsCurrent
Table No. 1
CURRENT RATIO
(Rs. In Lakhs)
Years Current assets Current Liabilities Ratio
2005 – 06 39633.87 22972.39 1.72
2006 – 07 36790.98 25832.12 1.42
2007 – 08 39051.45 30858.06 1.26
2008 – 09 52749.06 32197.02 1.63
2009- 10 59398.46 33405.62 1.77
Source: Annual Reports of TNPL
Interpretation: -
Above table indicates the ratio is lower than the idle ratio. It shows the firm inability to pay off
some of its debts. In the year 2009-10, the ratio is equal to idle ratio. Overall the current ratio is not bad.
Increasing trend about the study period.
`LIQUID RATIO
Liquidity ratios measures the firm’s ability to meet its current obligation i.e. ability to pay
its obligations as and when become due. They show whether the firm can pay its short term
obligation out of short term resources or not. A liquidity ratio establishes a relationship between
cash and other current assets to current obligations.
Liquid ratio is more important than current ratio because it eliminates stock and prepaid
expenses. Standard norm of liquid ratio is 1:1
Liquid ratio =
sLiabilitieCurrentensesexpepaidPrStockAssetsCurrent

`Table No. 2
LIQUID RATIO
(Rs. In Lakhs)
Years CA – (Inventories +prepaid expenses Current Liabilities Ratio
2005 - 06 27318.84 22972.39 1.18
2006 - 07 20930.75 25832.12 0.81
2007 - 08 24063.21 30858.06 0.77
2008 – 09 32900.87 32197.02 1.02
2009-10 12433.27 25832.12 0.48
Source: Annual Reports of TNPL
Interpretation
The ideal liquid ratio is 1:1 above table indicates the that from the year 2006, 2007, 2009 liquid
ratio is higher and its shows that the company is sound enough is meeting out its obligation. The next two
years also the ratio is more or less equal to ideal ratio. So the company liquidity position is good in all the
years.

`
Table No. 3
EQUITY RATIO
(Rs. In Lakhs)
Years Long term debt Shareholders fund Ratio
2005 – 06 18192.00 52251.81 0.34
2006 – 07 14885.00 57650.05 0.26
2007 – 08 21788.00 64000.98 0.34
2008 – 09 - 66431.53 0
2009-10 136290.66 80450.21 1.69
Source: Annual Reports of TNPL
Interpretation
The ideal debt equity ratio is 2:1 while go through the debt equity ratio of TNPL the ratio is not
satisfactory. In all the types, debt equity ratio was below the standard of 2:1 so the financial manager
should take action to maintain the standard ratio of 2:1
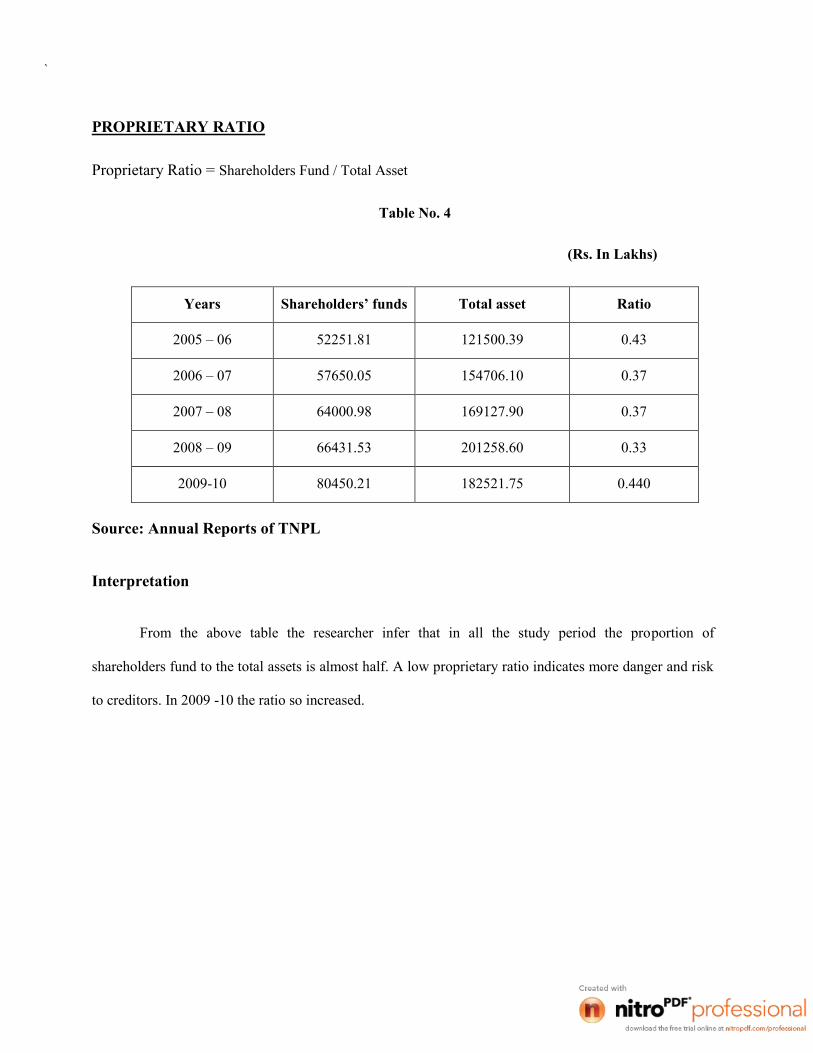
`
PROPRIETARY RATIO
Proprietary Ratio = Shareholders Fund / Total Asset
Table No. 4
(Rs. In Lakhs)
Years Shareholders’ funds Total asset Ratio
2005 – 06 52251.81 121500.39 0.43
2006 – 07 57650.05 154706.10 0.37
2007 – 08 64000.98 169127.90 0.37
2008 – 09 66431.53 201258.60 0.33
2009-10 80450.21 182521.75 0.440
Source: Annual Reports of TNPL
Interpretation
From the above table the researcher infer that in all the study period the proportion of
shareholders fund to the total assets is almost half. A low proprietary ratio indicates more danger and risk
to creditors. In 2009 -10 the ratio so increased.
`PROFITABILITY RATIO
Profitability reflects the final result of business operations. Poor operational performance
may indicate poor sales and hence poor profits. Owners are interested to know the profitability,
as it indicates the return, which they can get on investment. These ratios are calculated on sales
and we based on the promise that the firm should earn a sufficient profit on its sales otherwise it
may feel difficulty in meeting the operating expenses and shareholders will get to return.
GROSS PROFIT RATIO
The ratio shows the amount of gross profit made out of the total net sales. It shows the
margin left after meeting manufacturing costs. It measures the efficiency of production as well
as pricing.
The gross profit defined in the trading business as the difference between the creditors to
the trading account minus the debits to the trading account is known as “Gross trading profit”.
“Net Sales” is defined as sales minus sales return minus sales discount.
Gross Profit ratio = 100xSalesNetprofitGross
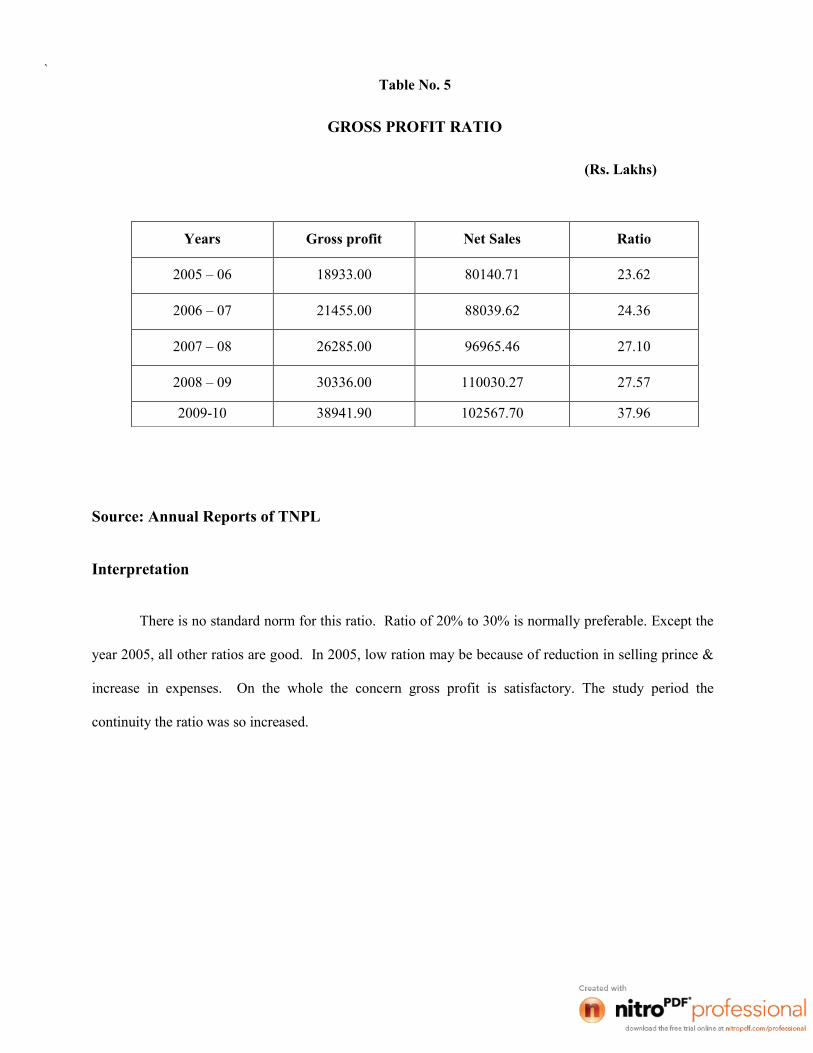
`Table No. 5
GROSS PROFIT RATIO
(Rs. Lakhs)
Source: Annual Reports of TNPL
Interpretation
There is no standard norm for this ratio. Ratio of 20% to 30% is normally preferable. Except the
year 2005, all other ratios are good. In 2005, low ration may be because of reduction in selling prince &
increase in expenses. On the whole the concern gross profit is satisfactory. The study period the
continuity the ratio was so increased.
Years Gross profit Net Sales Ratio
2005 – 06 18933.00 80140.71 23.62
2006 – 07 21455.00 88039.62 24.36
2007 – 08 26285.00 96965.46 27.10
2008 – 09 30336.00 110030.27 27.57
2009-10 38941.90 102567.70 37.96

`NET PROFIT RATIO
This ratio shows the earning left for shareholders as a percentage of net sales. This ratio
helps in determining the efficiency with which the affairs at the business are being managed.
This ratio measures the relationship between net profit and sales of the firm. It indicates the
management activity to earn sufficient profit on sales not only to cover all operating expenses of
the business but also for shareholders.
Net profit ratio = 100xSalesNetofitPrNet
Table No. 6
NET PROFIT RATIO
(Rs. In Lakhs)
Years Net Profit Net Sales Ratio
2005 – 06 8054.57 80122.54 10.05
2006 – 07 8606.38 88039.62 9.77
2007 – 08 11283.00 96965.46 11.63
2008 – 09 10738.68 110030.27 9.75
2009-10 12606.40 102567.70 12.29
Source: Annual Reports of TNPL
Interpretation
The above table shows that the net profit ratio was maximum during the year 2007 – 08 and
minimum during the year 2008 – 09. In all the other years the net profit shows the fluctuating trend.

`OPERATING RATIO
The ratio shows the percentage of sales absorbed by the cost of sales and operating
expenses. A low ratio is more factorable as would leave a margin for operating profit. Operating
expenses includes selling and administrative expenses.
Operating ratio = 100xsalesNet
expresesOperatingsoldgoodsofCost
Cost of goods sold = Total Sales – Gross profit
Table No. 7
OPERATING RATIO
(Rs. In Lakhs)
Years CGS + OperatingCost Net Sales Ratio
2005 – 06 67730.98 80140.71 84.51
2006 – 07 73121.55 88039.62 83.05
2007 – 08 77170.48 96965.46 79.58
2008 – 09 86280.87 110030.27 78.41
2009 -10 92051.12 102567.70 89.34
Source: Annual Reports of TNPL
Interpretation
Generally lower the ratio is preferable because it leaves more margins. In the above table shows
that the company is continuously improve his operating ratio from the year 2005 to 2009.
`ACTIVITY RATIO OR TURN OVER RATIO
Activity ratio measures the efficiency of asset management. The efficiency is uses of
assets would be reflected by the speed with which they are converted in to sales. Activity ratio
indicates the relationship between sales and various assets of the firm.
Inventory turnover ratio
Working capital turnover ratio
Inventory Turnover Ratio
Inventory turnover ratio measures the velocity of conversion of stock into sales. It or it
may be defined as the cost of goods sold divided by average stock.
The purpose is to see whether the minimum funds have been locked up in inventory. It
indicates the number of times the stock has been turned over during the period and evaluates the
efficiency with which a firm is able to manage into inventory.
Inventory Turnover Ratio =InventoryAverage
SoldGoodsofCost
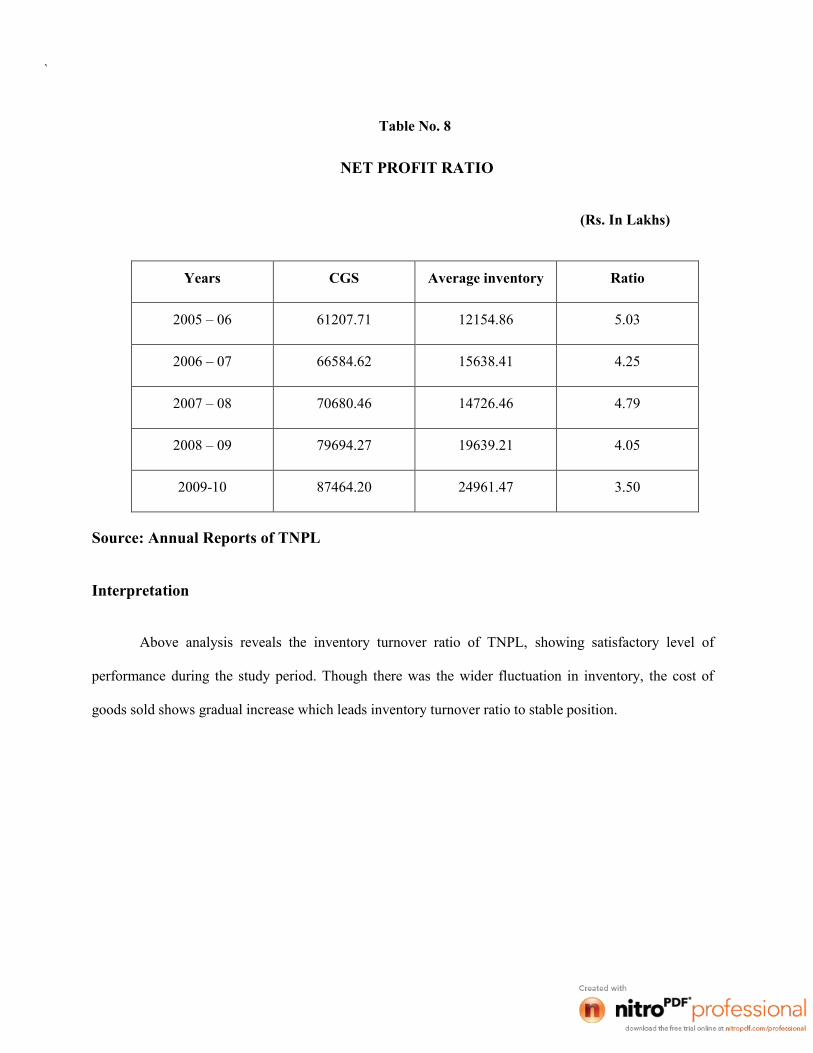
`
Table No. 8
NET PROFIT RATIO
(Rs. In Lakhs)
Years CGS Average inventory Ratio
2005 – 06 61207.71 12154.86 5.03
2006 – 07 66584.62 15638.41 4.25
2007 – 08 70680.46 14726.46 4.79
2008 – 09 79694.27 19639.21 4.05
2009-10 87464.20 24961.47 3.50
Source: Annual Reports of TNPL
Interpretation
Above analysis reveals the inventory turnover ratio of TNPL, showing satisfactory level of
performance during the study period. Though there was the wider fluctuation in inventory, the cost of
goods sold shows gradual increase which leads inventory turnover ratio to stable position.
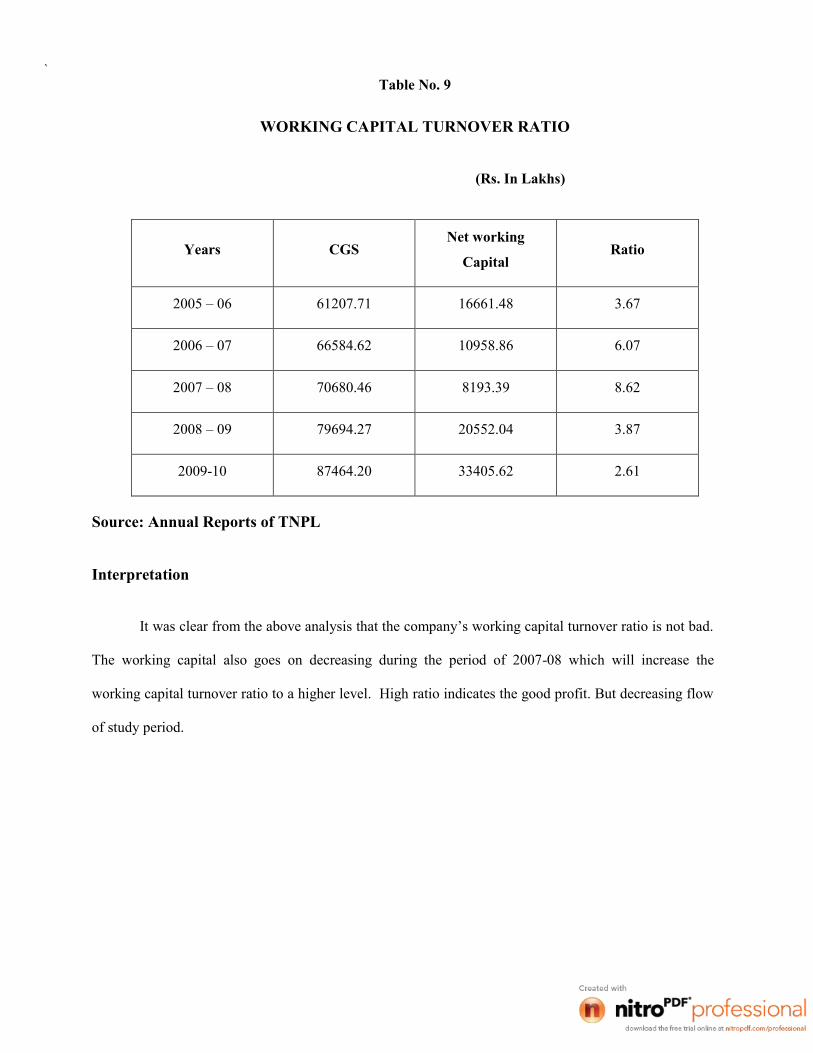
`Table No. 9
WORKING CAPITAL TURNOVER RATIO
(Rs. In Lakhs)
Years CGSNet working
CapitalRatio
2005 – 06 61207.71 16661.48 3.67
2006 – 07 66584.62 10958.86 6.07
2007 – 08 70680.46 8193.39 8.62
2008 – 09 79694.27 20552.04 3.87
2009-10 87464.20 33405.62 2.61
Source: Annual Reports of TNPL
Interpretation
It was clear from the above analysis that the company’s working capital turnover ratio is not bad.
The working capital also goes on decreasing during the period of 2007-08 which will increase the
working capital turnover ratio to a higher level. High ratio indicates the good profit. But decreasing flow
of study period.

`
FIXED ASSETS TURNOVER RATIO
Fixed Assets Turnover Ratio =AssetfixedNet
SalesNet
Table No. 10
Fixed Assets Turnover Ratio
(Rs. In Lakhs)
Years Net sales Fixed assets Ratio
2005 – 06 80140.71 81752.47 0.98
2006 – 07 88039.62 117794.48 0.74
2007 – 08 98985.46 128360.99 0.75
2008 – 09 110030.27 148395.53 0.74
2009 -10 102567.70 124408.62 0.82
Source: Annual Reports of TNPL
Interpretation
From the year 2005-09 the level of fixed assets turnover ratio was not stable. In the year 2007-09
the solvency ratio is low compared to others. Higher ratio indicates more profit. So the study period the
ration fully satisfactory.
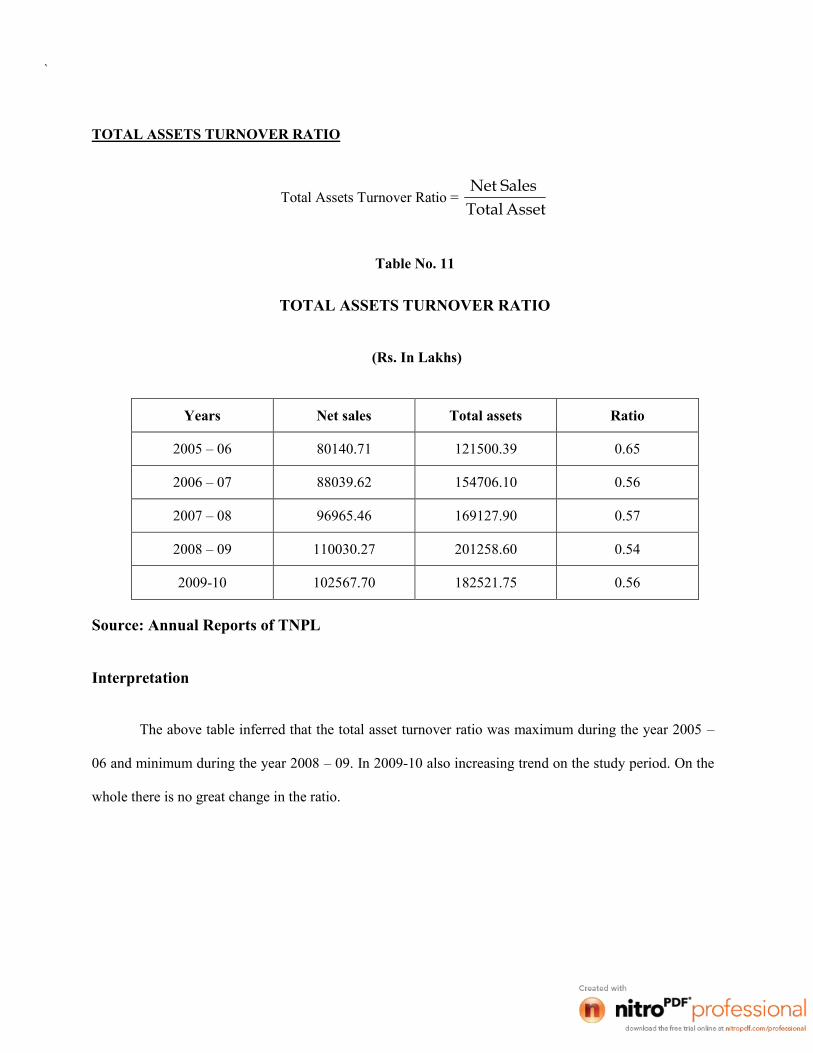
`
TOTAL ASSETS TURNOVER RATIO
Total Assets Turnover Ratio =AssetTotalSalesNet
Table No. 11
TOTAL ASSETS TURNOVER RATIO
(Rs. In Lakhs)
Years Net sales Total assets Ratio
2005 – 06 80140.71 121500.39 0.65
2006 – 07 88039.62 154706.10 0.56
2007 – 08 96965.46 169127.90 0.57
2008 – 09 110030.27 201258.60 0.54
2009-10 102567.70 182521.75 0.56
Source: Annual Reports of TNPL
Interpretation
The above table inferred that the total asset turnover ratio was maximum during the year 2005 –
06 and minimum during the year 2008 – 09. In 2009-10 also increasing trend on the study period. On the
whole there is no great change in the ratio.
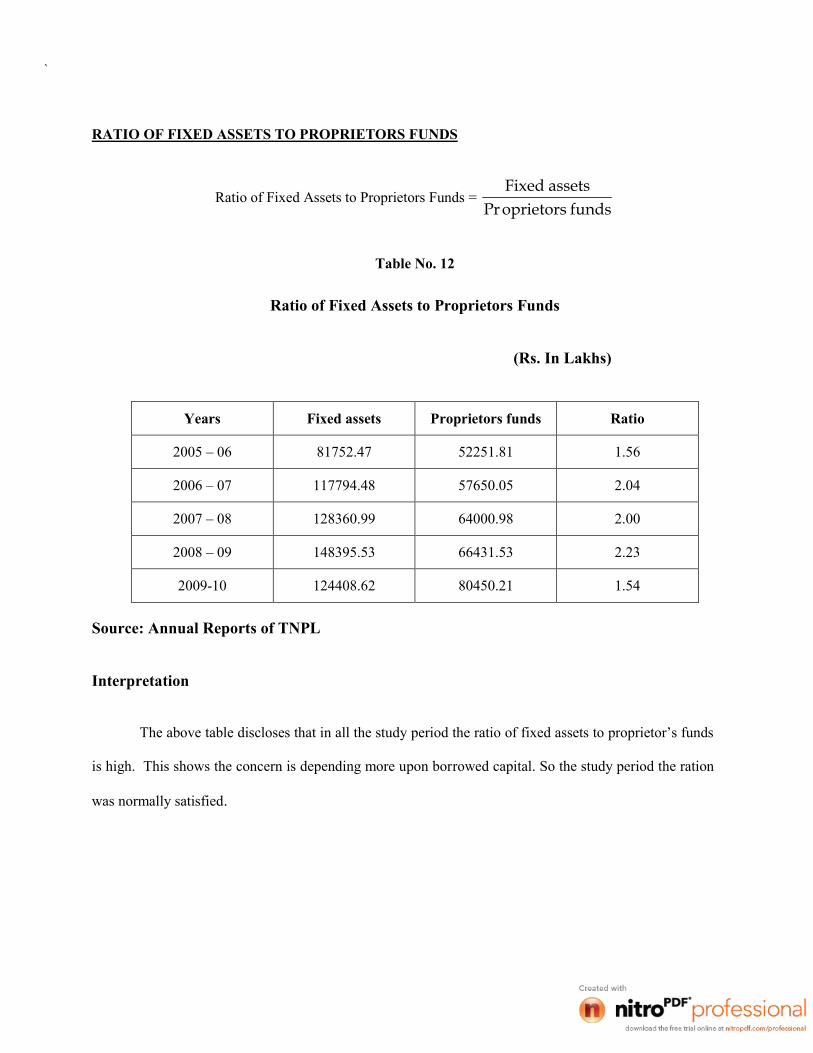
`
RATIO OF FIXED ASSETS TO PROPRIETORS FUNDS
Ratio of Fixed Assets to Proprietors Funds =fundsoprietorsPr
assetsFixed
Table No. 12
Ratio of Fixed Assets to Proprietors Funds
(Rs. In Lakhs)
Years Fixed assets Proprietors funds Ratio
2005 – 06 81752.47 52251.81 1.56
2006 – 07 117794.48 57650.05 2.04
2007 – 08 128360.99 64000.98 2.00
2008 – 09 148395.53 66431.53 2.23
2009-10 124408.62 80450.21 1.54
Source: Annual Reports of TNPL
Interpretation
The above table discloses that in all the study period the ratio of fixed assets to proprietor’s funds
is high. This shows the concern is depending more upon borrowed capital. So the study period the ration
was normally satisfied.
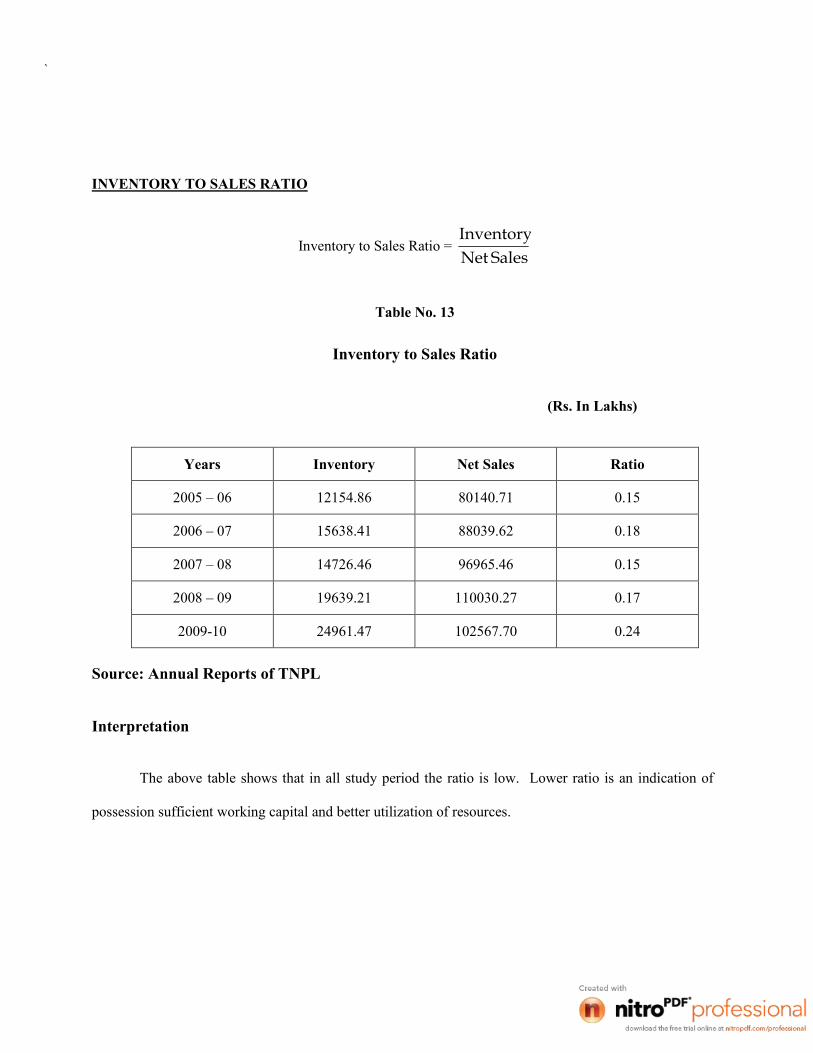
`
INVENTORY TO SALES RATIO
Inventory to Sales Ratio =SalesNet
Inventory
Table No. 13
Inventory to Sales Ratio
(Rs. In Lakhs)
Years Inventory Net Sales Ratio
2005 – 06 12154.86 80140.71 0.15
2006 – 07 15638.41 88039.62 0.18
2007 – 08 14726.46 96965.46 0.15
2008 – 09 19639.21 110030.27 0.17
2009-10 24961.47 102567.70 0.24
Source: Annual Reports of TNPL
Interpretation
The above table shows that in all study period the ratio is low. Lower ratio is an indication of
possession sufficient working capital and better utilization of resources.
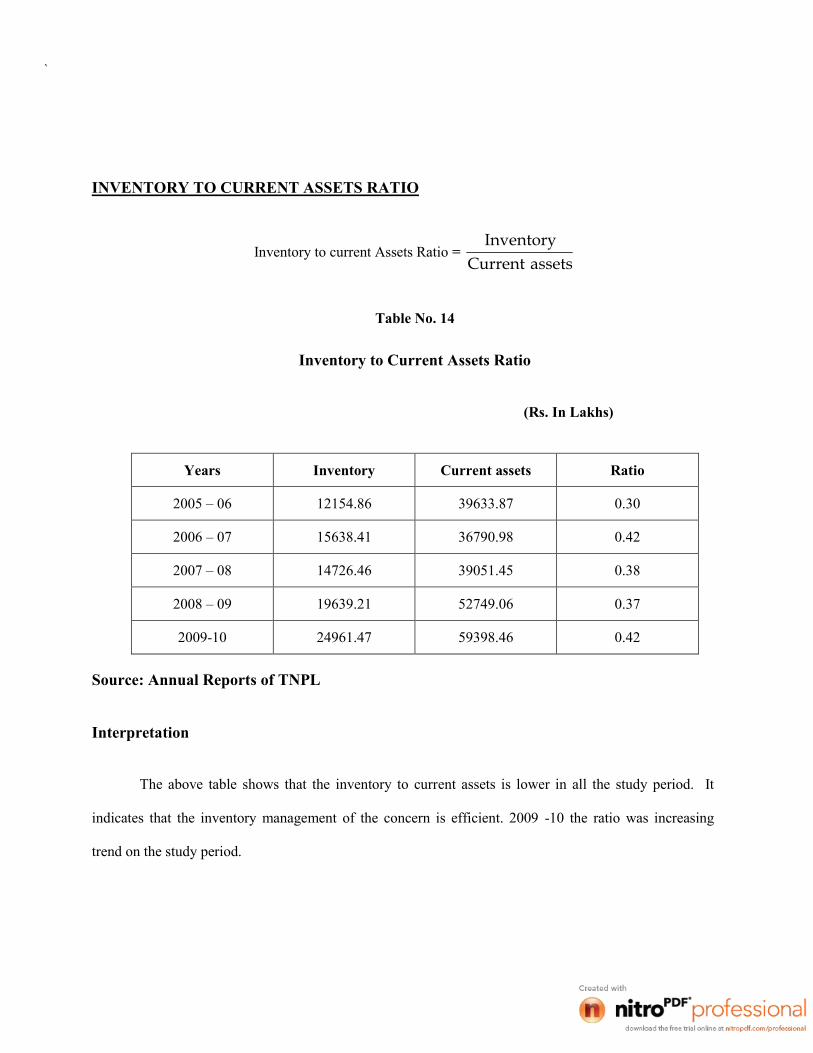
`
INVENTORY TO CURRENT ASSETS RATIO
Inventory to current Assets Ratio =assetsCurrent
Inventory
Table No. 14
Inventory to Current Assets Ratio
(Rs. In Lakhs)
Years Inventory Current assets Ratio
2005 – 06 12154.86 39633.87 0.30
2006 – 07 15638.41 36790.98 0.42
2007 – 08 14726.46 39051.45 0.38
2008 – 09 19639.21 52749.06 0.37
2009-10 24961.47 59398.46 0.42
Source: Annual Reports of TNPL
Interpretation
The above table shows that the inventory to current assets is lower in all the study period. It
indicates that the inventory management of the concern is efficient. 2009 -10 the ratio was increasing
trend on the study period.

`Table No: 15
Statement Showing Changes in Working Capital of TNPL
For the year ending 31st March 2006
Rs. In Lakhs
Source: 2005-2010 Annual Report of TNPL
Interpretation
In the year 2005-2006 the working capital has been increased up to 1283.97 (in Lakhs) due to theincrease in the current assets such as inventories, debtors, cash and bank balance, loan and advances. Thecurrent liabilities are decreased. In this firm had enough money to meet its current liabilities.
Particular 2005 2006 Increase Decrease
Current Assets
Inventories
Sundry Debtors
Cash and bank balance
Loan and Advance
12299.50
11814.20
1360.38
13066.88
12154.86
12776.68
2021.49
12680.84
-
962.48
661.11
-
144.64
-
-
368.04
Total Current Assets 38540.96 39633.87
Current Liabilities
Current Liabilities
Provisions
18812.37
4351.08
16513.62
6458.77
2298.77
-
-
2107.69
Total CurrentLiabilities
23163.45 22972.39
Net Working Capital
(CA-CL)
15377.51
1283.97
16661.48 3922.34 2620.37
1301.97
Increase in WorkingCapital
16661.48 16661.48 3922.34 3922.34
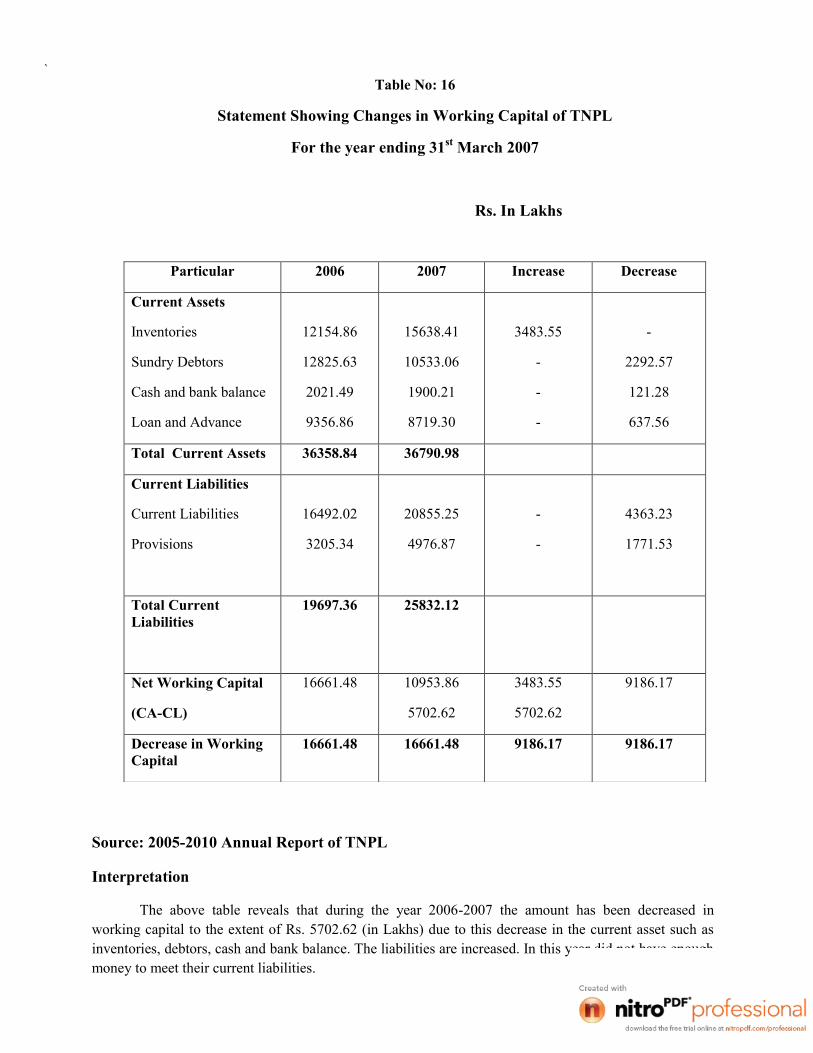
`Table No: 16
Statement Showing Changes in Working Capital of TNPL
For the year ending 31st March 2007
Rs. In Lakhs
Source: 2005-2010 Annual Report of TNPL
Interpretation
The above table reveals that during the year 2006-2007 the amount has been decreased inworking capital to the extent of Rs. 5702.62 (in Lakhs) due to this decrease in the current asset such asinventories, debtors, cash and bank balance. The liabilities are increased. In this year did not have enoughmoney to meet their current liabilities.
Particular 2006 2007 Increase Decrease
Current Assets
Inventories
Sundry Debtors
Cash and bank balance
Loan and Advance
12154.86
12825.63
2021.49
9356.86
15638.41
10533.06
1900.21
8719.30
3483.55
-
-
-
-
2292.57
121.28
637.56
Total Current Assets 36358.84 36790.98
Current Liabilities
Current Liabilities
Provisions
16492.02
3205.34
20855.25
4976.87
-
-
4363.23
1771.53
Total CurrentLiabilities
19697.36 25832.12
Net Working Capital
(CA-CL)
16661.48 10953.86
5702.62
3483.55
5702.62
9186.17
Decrease in WorkingCapital
16661.48 16661.48 9186.17 9186.17
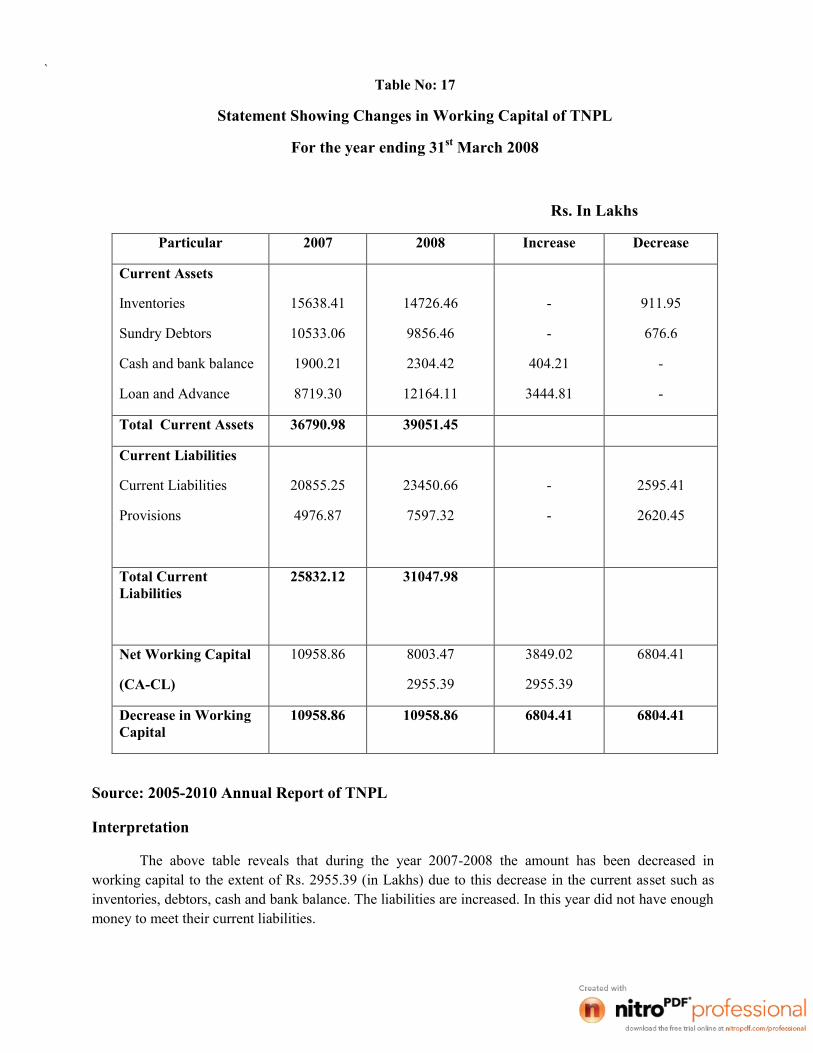
`Table No: 17
Statement Showing Changes in Working Capital of TNPL
For the year ending 31st March 2008
Rs. In Lakhs
Source: 2005-2010 Annual Report of TNPL
Interpretation
The above table reveals that during the year 2007-2008 the amount has been decreased inworking capital to the extent of Rs. 2955.39 (in Lakhs) due to this decrease in the current asset such asinventories, debtors, cash and bank balance. The liabilities are increased. In this year did not have enoughmoney to meet their current liabilities.
Particular 2007 2008 Increase Decrease
Current Assets
Inventories
Sundry Debtors
Cash and bank balance
Loan and Advance
15638.41
10533.06
1900.21
8719.30
14726.46
9856.46
2304.42
12164.11
-
-
404.21
3444.81
911.95
676.6
-
-
Total Current Assets 36790.98 39051.45
Current Liabilities
Current Liabilities
Provisions
20855.25
4976.87
23450.66
7597.32
-
-
2595.41
2620.45
Total CurrentLiabilities
25832.12 31047.98
Net Working Capital
(CA-CL)
10958.86 8003.47
2955.39
3849.02
2955.39
6804.41
Decrease in WorkingCapital
10958.86 10958.86 6804.41 6804.41

`
Table No: 18
Statement Showing Changes in Working Capital of TNPL
For the year ending 31st March 2009
Rs. In Lakhs
Source: 2005-2010 Annual Report of TNPL
Interpretation
In the year 2008-2009 the working capital has been increased up to 12358.65 (in Lakhs) due tothe increase in the current assets such as inventories, debtors, cash and bank balance, loan and advances.The current liabilities are increased. So in this firm had enough money to meet its current liabilities.
Particular 2008 2009 Increase Decrease
Current Assets
Inventories
Sundry Debtors
Cash and bank balance
Loan and Advance
14726.46
9856.46
2304.42
12164.11
19639.21
16973.83
1767.15
14368.87
4912.75
7117.37
-
2204.76
-
-
537.27
-
Total Current Assets 39051.45 52749.06
Current Liabilities
Current Liabilities
Provisions
23260.74
7597.32
22105.65
10091.37
1155.09
-
-
2494.05
Total CurrentLiabilities
30858.06 32197.02
Net Working Capital
(CA-CL)
8193.39
12358.65
20552.04 15389.97 3031.32
12358.65
Increase in WorkingCapital
20552.04 20552.04 15389.97 15389.97

`Table No: 19
Statement Showing Changes in Working Capital of TNPL
For the year ending 31st March 2010
Rs. In Lakhs
Source: 2005-2010 Annual Report of TNPL
Interpretation
In the year 2009-2010 the working capital has been increased up to 5944.42 (in Lakhs) due to theincrease in the current assets such as inventories, debtors, cash and bank balance, loan and advances. Thecurrent liabilities are increased. So in this firm had enough money to meet its current liabilities.
Particular 2009 2010 Increase Decrease
Current Assets
Inventories
Sundry Debtors
Cash and bank balance
Loan and Advance
19135.59
16973.83
1767.15
12588.43
16911.30
19956.91
1936.31
20593.94
-
2983.08
169.16
8005.51
2224.29
-
-
-
Total Current Assets 50465.00 59398.46
Current Liabilities
Current Liabilities
Provisions
20325.21
10091.37
22496.73
10908.89
-
-
2171.52
817.52
Total CurrentLiabilities
30416.58 33405.62
Net Working Capital
(CA-CL)
20048.42
5944.42
25992.84 11157.75 5213.33
5944.42
Increase in WorkingCapital
25992.84 25992.84 11157.75 11157.75
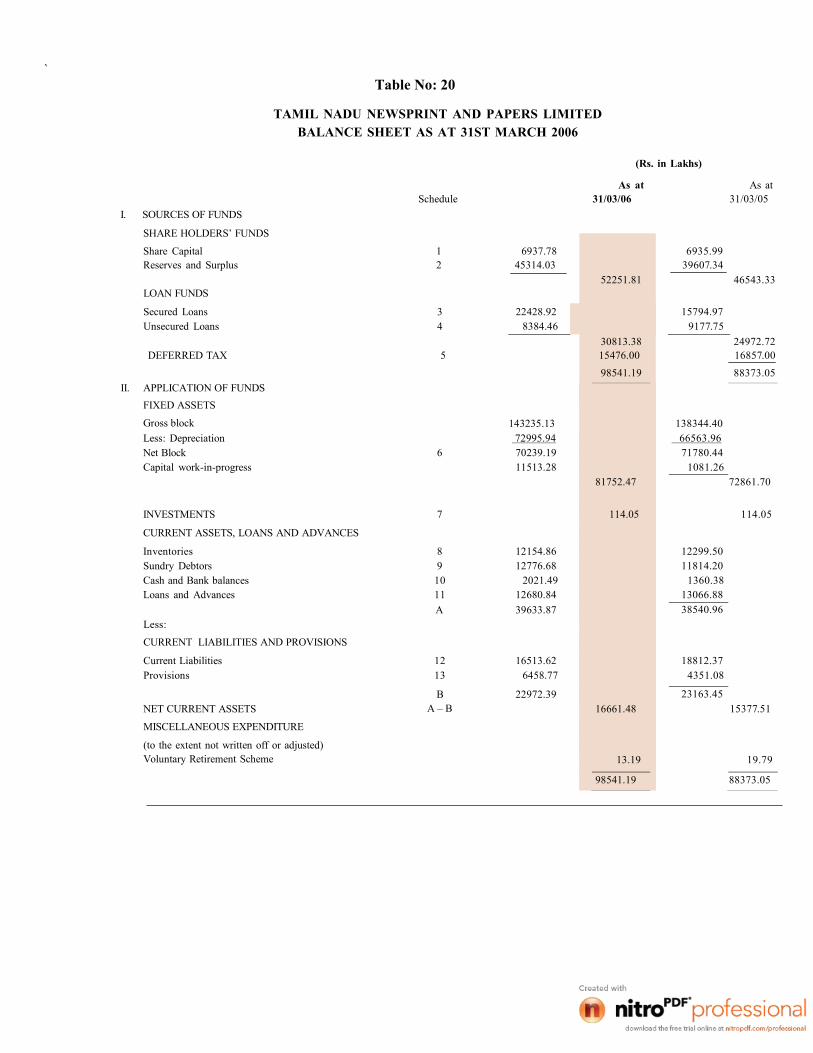
`Table No: 20
TAMIL NADU NEWSPRINT AND PAPERS LIMITEDBALANCE SHEET AS AT 31ST MARCH 2006
(Rs. in Lakhs)
I. SOURCES OF FUNDS
SHARE HOLDERS’ FUNDS
As at As atSchedule 31/03/06 31/03/05
Share Capital 1 6937.78 6935.99Reserves and Surplus 2 45314.03 39607.34
52251.81 46543.33LOAN FUNDS
Secured Loans 3 22428.92 15794.97Unsecured Loans 4 8384.46 9177.75
30813.38 24972.72DEFERRED TAX 5 15476.00 16857.00
98541.19 88373.05II. APPLICATION OF FUNDS
FIXED ASSETS
Gross block 143235.13 138344.40Less: Depreciation 72995.94 66563.96Net Block 6 70239.19 71780.44Capital work-in-progress 11513.28 1081.26
81752.47 72861.70
INVESTMENTS 7 114.05 114.05
CURRENT ASSETS, LOANS AND ADVANCES
Inventories 8 12154.86 12299.50Sundry Debtors 9 12776.68 11814.20Cash and Bank balances 10 2021.49 1360.38Loans and Advances 11 12680.84 13066.88
Less:A 39633.87 38540.96
CURRENT LIABILITIES AND PROVISIONS
Current Liabilities 12 16513.62 18812.37Provisions 13 6458.77 4351.08
NET CURRENT ASSETSB
A – B22972.39
16661.4823163.45
15377.51
MISCELLANEOUS EXPENDITURE
(to the extent not written off or adjusted)Voluntary Retirement Scheme 13.19 19.79
98541.19 88373.05

`
ScheduleI. SOURCESOFFUNDS SHARE
HOLDERS’ FUNDS
Share Capital 1Reserves and Surplus 2
LOANFUNDSSecured Loans 3Unsecured Loans 4
DEFERRED TAX 5
II. APPLICATIONOFFUNDSFIXED ASSETSGross blockLess: DepreciationNet Block 6Capital work- in- progress
INVESTMENTS 7
CURRENTASSETS, LOANSAND ADVANCESInventories 8Sundry Debtors 9Cash and Bank balances 10Loans and Advances 11
ALess:CURRENT LIABILITIESANDPROVISIONS
Current Liabilities 12Provisions 13
BNET CURRENTASSETS A-BMISCELLANEOUSEXPENDITURE(to the extent not written off or adjusted)Voluntary Retirement Scheme
6937.7850712.27
As at31/03/07
57650.05
55939.94
15284.00
49586.466353.48
151436.4079593.70
128873.99
117794.48114.05
10958.86
6.60
71842.7045951.78
15638.4110533.06
1900.218719.30
36790.98
20855.254976.87
25832.12
128873.99
Table No: 21
TAMIL NADU NEWSPRINT AND PAPERS LIMITEDBALANCE SHEET AS AT 31ST MARCH 2007
(Rs.in Lakh)As at
31/03/06
6937.7845314.03
52251.81
22428.928384.46
30813.38
15476.00
98541.19
143235.1372995.9470239.1911513.28
81752.47114.05
12154.8612825.632021.499356.86
36358.84
16492.023205.34
19697.36
16661.48
13.1998541.19

`
Table No: 22
TAMIL NADU NEWSPRINT AND PAPERS LIMITEDBALANCE SHEET AS AT 31ST MARCH 2008
I. SOURCES OF FUNDSSHARE HOLDERS’ FUNDS
(Rs. in Lakh)As at As at
Schedule 31/03/08 31/03/ 07
Share Capital 1 6937.78 6937.78Reserves and Surplus 2 57063.20 50712.27
64000.98 57650.05LOAN FUNDSSecured Loans 3 48805.95 49586.46Unsecured Loans 4 6437.95 6353.48
55243.90 55939.94DEFERRED TAX 18835.00 15284.00
138079.88 128873.99II. APPLICATION OF FUNDS
FIXED ASSETSGross block 186091.03 151436.40Less: Depreciation 86800.34 79593.70Net Block 5 99290.69 71842.70Capital work- in- progress 29070.30 45951.78
128360.99 117794.48INVESTMENTS 6 1715.42 114.05CURRENT ASSETS, LOANS AND ADVANCESInventories 7 14726.46 15638.41Sundry Debtors 8 9856.46 10533.06Cash and Bank balances 9 2304.42 1900.21Loans and Advances 10 12164.11 8719.30
A 39051.45 36790.98Less:CURRENT LIABILITIES AND PROVISIONSCurrent Liabilities 11 23450.66 20855.25Provisions 12 7597.32 4976.87
B 31047.98 25832.12NET CURRENT ASSETS A-B 8003.47 10958.86MISCELLANEOUS EXPENDITURE(to the extent not written off or adjusted)Voluntary Retirement Scheme 0.00 6.60
138079.88 128873.99
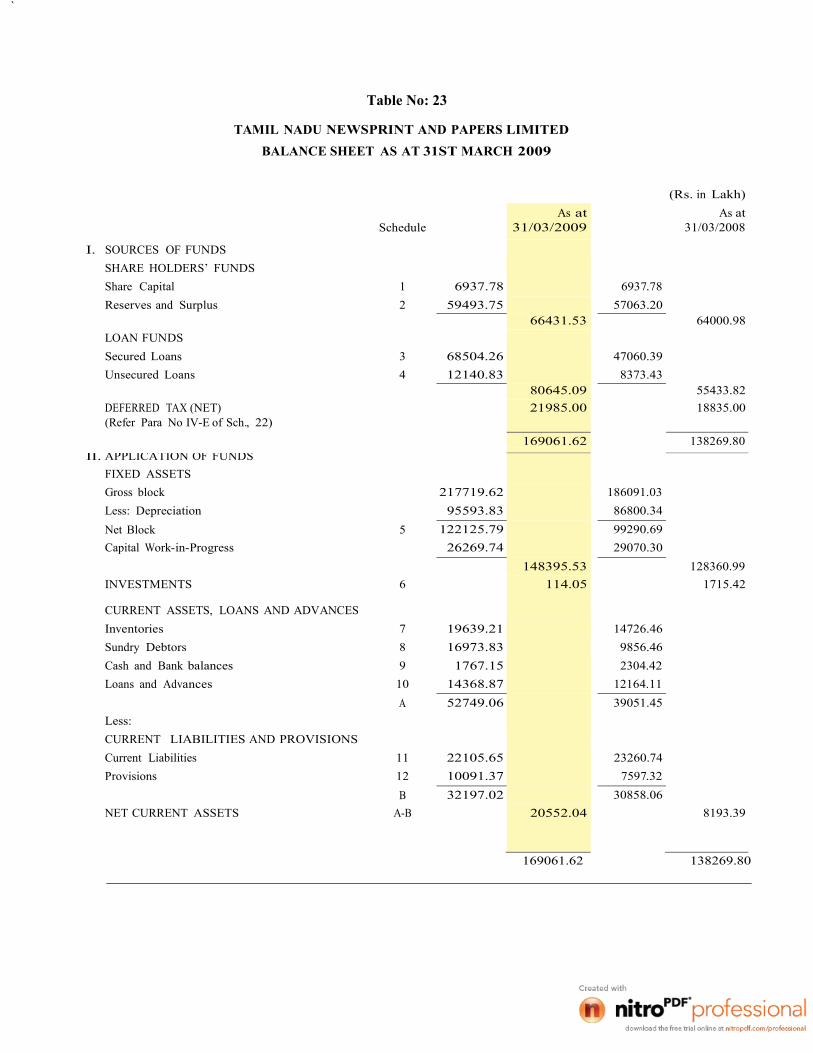
`
Table No: 23
TAMIL NADU NEWSPRINT AND PAPERS LIMITEDBALANCE SHEET AS AT 31ST MARCH 2009
(Rs. in Lakh)
ScheduleAs at
31/03/2009As at
31/03/2008
I. SOURCES OF FUNDSSHARE HOLDERS’ FUNDSShare Capital 1 6937.78 6937.78Reserves and Surplus 2 59493.75 57063.20
66431.53 64000.98LOAN FUNDSSecured Loans 3 68504.26 47060.39Unsecured Loans 4 12140.83 8373.43
80645.09 55433.82DEFERRED TAX (NET)(Refer Para No IV-E of Sch., 22)
21985.00 18835.00
169061.62 138269.80II. APPLICATION OF FUNDS
FIXED ASSETSGross block 217719.62 186091.03Less: Depreciation 95593.83 86800.34Net Block 5 122125.79 99290.69Capital Work-in-Progress 26269.74 29070.30
148395.53 128360.99INVESTMENTS 6 114.05 1715.42
CURRENT ASSETS, LOANS AND ADVANCESInventories 7 19639.21 14726.46Sundry Debtors 8 16973.83 9856.46Cash and Bank balances 9 1767.15 2304.42Loans and Advances 10 14368.87 12164.11
A 52749.06 39051.45Less:CURRENT LIABILITIES AND PROVISIONSCurrent Liabilities 11 22105.65 23260.74Provisions 12 10091.37 7597.32
B 32197.02 30858.06NET CURRENT ASSETS A-B 20552.04 8193.39
169061.62 138269.80

`
Table No: 24
TAMIL NADU NEWSPRINT AND PAPERS LIMITEDBALANCE SHEET AS AT 31ST MARCH 2010
I. SOURCES OF FUNDSSHARE HOLDERS’ FUNDS
(Rs. in Lakh)As at As at
Schedule 31/03/2010 31/03/2009
Share Capital 1 6937.78 6937.78Reserves and Surplus 2 73512.43 59493.75
80450.21 66431.53LOAN FUNDSSecured Loans 3 105489.81 68504.26Unsecured Loans 4 30800.85 12140.83
136290.66 80645.09DEFERRED TAX (NET) 21013.00 21985.00(Refer Para No IV-E of Sch., 23)
II. APPLICATION OF FUNDSFIXED ASSETS
237753.87 169061.62
Gross block 229877.63 217719.62Less: Depreciation 105469.01 95593.83Net Block 5 124408.62 122125.79Capital Work-in-Progress 85250.01 26269.74
209658.63 148395.53INVESTMENTS 6 1139.99 114.05
CAPTIVE PLANTATION 7 962.41 503.62
CURRENT ASSETS, LOANS AND ADVANCESInventories 8 16911.30 19135.59Sundry Debtors 9 19956.91 16973.83Cash and Bank balances 10 1936.31 1767.15Loans and Advances 11 20593.94 12588.43
A 59398.46 50465.00Less:CURRENT LIABILITIES AND PROVISIONSCurrent Liabilities 12 22496.73 20325.21Provisions 13 10908.89 10091.37
B 33405.62 30416.58NET CURRENT ASSETS A-B 25992.84 20048.42
237753.87 169061.62

`
COMPARATIVE STUDY
Comparative study is an investigation of how the practical concepts are applying in the
company.
TNPL is a state government company engaging the business of paper production. One of
the main thing that I found in the company is they are using democratic leadership style. The
management does not give rights to all the employees in the company for participate in the
decision making process. The company’ HR policies are well and quite acceptable to all the
employees. They are providing PF, incentives, bonus, pension scheme, medical allowances and
better work environment to the employees.
Management of business is a complicated one. The success of a business is depends on
how they are coordinating the business operation. TNPL is having a well established top level
management and they are coordinating the basic management functions such as.
Planning
Organizing
Directing
Controlling
For reducing the efforts of the business and increasing the efficiency the company is practicingthe following concepts.
Total Quality Management
Quality circle
On the job training procedure
Performance appraisal
All the departments are working in a well successful manner because of the activities of the top
level management.

`
FINDINGS
The net working capital position of the TamilNadu News Print paper ltd shows and
effective utilization of working capital.
Current ratio during the year 2005-06 to 2009-10 is satisfactory but during the study
period the ratio is lower than the normal ratio. (2:1)
Liquidity ratio during the study period is satisfactory because it is higher than the normal
ratio this shows the financial of the TNPL.
During the study period fixed assets turnover is sound and good.
Debt equity shareholders fund in the total assets is almost half, this indicate more danger
and risk to creditors.
Fixed assets profit ratio of TNPL is satisfactory during the study period.
The gross profit ratio of TNPL is satisfactory. They have adequate gross profit during the
study period.
The inventories turnover ratio in the year 2006-07 was high. The high ratio is the
indication of quick turn over of stock.
The working capital turnover ratio is also satisfactory. High ratio is an indicator of good
project.
The company is maintaining up to date records. This helps the concern to predict the
future accurately.
`
6.2 RECOMMENDATIONS
1) The gross profit and net profit position are good in TNPL. So it can continue the same level.
2) The liquidity ratio is satisfactory in all the years. The researcher recommends that the company
can continue of powers liquid funds to meet its future requirement.
3) There is a balance between current assets and current liabilities. This can be continued for the
success.
4) The Current Ration is not satisfactory in some years. The researcher recommends that the
company should improve the current ration level is future courses.
`
6.3 CONCLUSION
This summer Internship Training, secured me a deep practical & theoretical knowledge
about the functions of various departments of TNPL. It was very useful to gain knowledge about
the various departments and its managerial functions. It gave me an opportunity to know how the
employees were trained and how they benefited through their HR policies.
The company procedures were well understood, relating to secretarial work, accounting
procedures, complete production process and use of marketing channels for distribution.
`
BIBLOGRAPHY:
Books
Agarwal N.K Management of working capital
Maheswari .S.N Management Accounting, Sultan chand and sons publishers 23, Dayagni New Delhi.
Pandi .IM Financial Management Vikas publishing house pvt ltd Seventh revised edition, 1995.
Pradeep kumar Elements of financial management.
Prasanna Chandra, Financial Management, Tata Mc graw –hill publishing company ltd. Fourth Edition,New Delhi.
Dr.Ramachandran .R Management Accounting, Sriram Publication, Trichy 1994.
Gupta, Shashi .K & Sharma, R.K .2003, Managemnt Accounting, Kalyani Publishers, Delhi.
Gupta Shash, K & Mehra, Arun.2004, Financial Analysis and reporting, Kalyani publishers, delhi.
Groppelli, Angelico A.; Ehsan Nikbakht, Finance, 4th ed.Barron’s Educational Series, Inc..pp.433. ISBN0764112759.
Williams, Jan R.: Susan.F.Haka, Mart.S.bettner, JosephV, Carcello(2008).Financial & ManagementAccounting. McGram –Hill Irwin pp266. ISBN 9780072996500.
Professor Cram, “Ratios of profitability: Profit Margin “College –Cram.Com. 14 May 2008<http:/www.college– ram.com/study/finance/ratios of profitability.profit –margiin>
Professor Cram, “Ratios of profitability: “Return on Assets” College -Cram.com.14 may 2008 <http:/www.college– ram.com/study/finance/ratios of profitability.return on assets/>.
`
ANNEXURE
2005-06 Annual Report
2006-07 Annual Report
2007-08 Annual Report
2008-09 Annual Report
2009-10 Annual Report

`