karen heslop thesis 2012.final - qut eprintseprints.qut.edu.au/59610/1/karen_heslop_thesis.pdfthe...
TRANSCRIPT

BINOCULAR RIVALRY AND VISUOSPATIAL ABILITY IN INDIVIDUALS WITH SCHIZOPHRENIA
Karen R. Heslop
Bachelor of Nursing
Graduate Diploma (Social Science – Counselling)
Master of Education (Adult and Workplace)
A Thesis submitted as fulfilment for Degree of Doctor of Philosophy
School of Psychology and Counselling
Institute of Health and Biomedical Innovation
Queensland University of Technology
2012


i
Keywords
A1 allele, backward masking, Benton’s Judgment of Line Orientation, binocular
rivalry, dopamine, schizophrenia, Taq1A
ii
Abstract
Visual abnormalities, both at the sensory input and the higher interpretive
levels, have been associated with many of the symptoms of schizophrenia.
Individuals with schizophrenia typically experience distortions of sensory perception,
resulting in perceptual hallucinations and delusions that are related to the observed
visual deficits. Disorganised speech, thinking and behaviour are commonly
experienced by sufferers of the disorder, and have also been attributed to perceptual
disturbances associated with anomalies in visual processing. Compounding these
issues are marked deficits in cognitive functioning that are observed in
approximately 80% of those with schizophrenia. Cognitive impairments associated
with schizophrenia include: difficulty with concentration and memory (i.e. working,
visual and verbal), an impaired ability to process complex information, response
inhibition and deficits in speed of processing, visual and verbal learning. Deficits in
sustained attention or vigilance, poor executive functioning such as poor reasoning,
problem solving, and social cognition, are all influenced by impaired visual
processing. These symptoms impact on the internal perceptual world of those with
schizophrenia, and hamper their ability to navigate their external environment.
Visual processing abnormalities in schizophrenia are likely to worsen personal,
social and occupational functioning.
Binocular rivalry provides a unique opportunity to investigate the processes
involved in visual awareness and visual perception. Binocular rivalry is the
alternation of perceptual images that occurs when conflicting visual stimuli are
presented to each eye in the same retinal location. The observer perceives the
opposing images in an alternating fashion, despite the sensory input to each eye
remaining constant. Binocular rivalry tasks have been developed to investigate
iii
specific parts of the visual system. The research presented in this Thesis provides an
explorative investigation into binocular rivalry in schizophrenia, using the method of
Pettigrew and Miller (1998) and comparing individuals with schizophrenia to healthy
controls. This method allows manipulations to the spatial and temporal frequency,
luminance contrast and chromaticity of the visual stimuli. Manipulations to the rival
stimuli affect the rate of binocular rivalry alternations and the time spent perceiving
each image (dominance duration). Binocular rivalry rate and dominance durations
provide useful measures to investigate aspects of visual neural processing that lead to
the perceptual disturbances and cognitive dysfunction attributed to schizophrenia.
However, despite this promise the binocular rivalry phenomenon has not been
extensively explored in schizophrenia to date.
Following a review of the literature, the research in this Thesis examined
individual variation in binocular rivalry. The initial study (Chapter 2) explored the
effect of systematically altering the properties of the stimuli (i.e. spatial and temporal
frequency, luminance contrast and chromaticity) on binocular rivalry rate and
dominance durations in healthy individuals (n=20). The findings showed that altering
the stimuli with respect to temporal frequency and luminance contrast significantly
affected rate. This is significant as processing of temporal frequency and luminance
contrast have consistently been demonstrated to be abnormal in schizophrenia.
The current research then explored binocular rivalry in schizophrenia. The
primary research question was, “Are binocular rivalry rates and dominance durations
recorded in participants with schizophrenia different to those of the controls?” In
this second study binocular rivalry data that were collected using low- and high-
strength binocular rivalry were compared to alternations recorded during a
monocular rivalry task, the Necker Cube task to replicate and advance the work of
iv
Miller et al., (2003). Participants with schizophrenia (n=20) recorded fewer
alternations (i.e. slower alternation rates) than control participants (n=20) on both
binocular rivalry tasks, however no difference was observed between the groups on
the Necker cube task.
Magnocellular and parvocellular visual pathways, thought to be abnormal in
schizophrenia, were also investigated in binocular rivalry. The binocular rivalry
stimuli used in this third study (Chapter 4) were altered to bias the task for one of
these two pathways. Participants with schizophrenia recorded slower binocular
rivalry rates than controls in both binocular rivalry tasks. Using a ‘within subject
design’, binocular rivalry data were compared to data collected from a backward-
masking task widely accepted to bias both these pathways. Based on these data, a
model of binocular rivalry, based on the magnocellular and parvocellular pathways
that contribute to the dorsal and ventral visual streams, was developed.
Binocular rivalry rates were compared with performance on the Benton’s
Judgment of Line Orientation task, in individuals with schizophrenia compared to
healthy controls (Chapter 5). The Benton’s Judgment of Line Orientation task is
widely accepted to be processed within the right cerebral hemisphere, making it an
appropriate task to investigate the role of the cerebral hemispheres in binocular
rivalry, and to investigate the inter-hemispheric switching hypothesis of binocular
rivalry proposed by Pettigrew and Miller (1998, 2003). The data were suggestive of
intra-hemispheric rather than an inter-hemispheric visual processing in binocular
rivalry.
Neurotransmitter involvement in binocular rivalry, backward masking and
Judgment of Line Orientation in schizophrenia were investigated using a genetic
indicator of dopamine receptor distribution and functioning; the presence of the Taq1
v
allele of the dopamine D2 receptor (DRD2) receptor gene. This final study (Chapter
6) explored whether the presence of the Taq1 allele of the DRD2 receptor gene, and
thus, by inference the distribution of dopamine receptors and dopamine function,
accounted for the large individual variation in binocular rivalry. The presence of the
Taq1 allele was associated with slower binocular rivalry rates or poorer performance
in the backward masking and Judgment of Line Orientation tasks seen in the group
with schizophrenia.
This Thesis has contributed to what is known about binocular rivalry in
schizophrenia. Consistently slower binocular rivalry rates were observed in
participants with schizophrenia, indicating abnormally-slow visual processing in this
group. These data support previous studies reporting visual processing abnormalities
in schizophrenia and suggest that a slow binocular rivalry rate is not a feature
specific to bipolar disorder, but may be a feature of disorders with psychotic features
generally.
The contributions of the magnocellular or dorsal pathways and parvocellular or
ventral pathways to binocular rivalry, and therefore to perceptual awareness, were
investigated. The data presented supported the view that the magnocellular system
initiates perceptual awareness of an image and the parvocellular system maintains the
perception of the image, making it available to higher level processing occurring
within the cortical hemispheres. Abnormal magnocellular and parvocellular
processing may both contribute to perceptual disturbances that ultimately contribute
to the cognitive dysfunction associated with schizophrenia. An alternative model of
binocular rivalry based on these observations was proposed.
vi
Table of Contents
Keywords ...................................................................................................................... i
Abstract ........................................................................................................................ ii
List of Figures ............................................................................................................ xii
List of Tables ............................................................................................................. xiv
List of Abbreviations ................................................................................................. xvi
Statement of Original Authorship ............................................................................. xix
Acknowledgments ...................................................................................................... xx
CHAPTER 1: Literature Review - Visual Processing In Schizophrenia and Binocular Rivalry ......................................................................................................... 1
1.1 Schizophrenia ...................................................................................................... 1
1.2 Perceptual Disturbances in Schizophrenia .......................................................... 3
1.3 Delusional Experiences ....................................................................................... 4 1.3.1 Disorganised thoughts and behaviour. ...................................................... 5
1.4 Cognitive Deficits in Schizophrenia ................................................................... 6 1.4.1 Visual-evoked potentials in schizophrenia. ............................................... 7 1.4.2 Functional magnetic resonance imaging Studies (fMRI) in
schizophrenia. .......................................................................................... 10 1.4.3 Magnocellular and parvocellular visual pathways in schizophrenia. ...... 12 1.4.4 The cerebral hemispheres and schizophrenia. ......................................... 14 1.4.5 Neurotransmitters in schizophrenia. ........................................................ 14 1.4.6 Dopamine genes in schizophrenia. .......................................................... 16 1.4.7 Perceptual rivalry in schizophrenia. ........................................................ 17 1.4.8 Binocular rivalry in schizophrenia. ......................................................... 19
1.5 Binocular Rivalry .............................................................................................. 22 1.5.1 Stimulus parameters moderate binocular rivalry ..................................... 24
1.5.1.1 Spatial frequency....................................................................... 25 1.5.1.2 Movement. ................................................................................ 26 1.5.1.3 Luminance. ................................................................................ 26 1.5.1.4 Colour. ...................................................................................... 27 1.5.1.5 Orientation. ............................................................................... 27 1.5.1.6 Size. ........................................................................................... 28 1.5.1.7 Context. ..................................................................................... 28
1.6 Theories of Binocular Rivalry .......................................................................... 28 1.6.1 Bottom-up theories of binocular rivalry. ................................................. 29 1.6.2 Visual-evoked potentials (VEPs) in binocular rivalry ............................ 31
1.7 Top- down Theories of Binocular Rivalry ........................................................ 32 1.7.1 Single-cell studies. ................................................................................... 33 1.7.2 Imaging studies. ....................................................................................... 33 1.7.3 Eye-swapping methodologies. ................................................................. 34 1.7.4 Neurotransmitter involvement in binocular rivalry. ................................ 35 1.7.5 Monocular rivalry compared to binocular rivalry. .................................. 36
vii
1.8 Multi-level or Hierarchical Theories ................................................................ 36 1.8.1 Visual pathway theories of binocular rivalry .......................................... 37
1.8.1.1 Monocular and binocular pathways. ......................................... 37 1.8.1.2 Magnocellular and parvocellular pathways. ............................. 38
1.8.2 Inter-hemispheric theory of binocular rivalry. ........................................ 39
1.9 Summary and introduction to Chapters ............................................................ 41
CHAPTER 2: Altering Binocular Rivalry Rate by Increasing Luminance Contrast and Temporal Frequency: Support for an Oscillation Model of Binocular Rivalry .. 49
2.1 Binocular rivalry ............................................................................................... 49 2.1.1 Binocular rivalry rate. ............................................................................. 49 2.1.2 Dominance durations. ............................................................................. 52
2.2 Study 1 .............................................................................................................. 53 2.2.1 Aims. ....................................................................................................... 53 2.2.2 Hypotheses. ............................................................................................. 53
2.3 Method .............................................................................................................. 54 2.3.1 Participants. ............................................................................................. 54 2.3.2 Apparatus. ............................................................................................... 55
2.3.2.1 Binocular rivalry stimuli. .......................................................... 55
2.4 Design ............................................................................................................... 58
2.5 Procedure .......................................................................................................... 59
2.6 Statistical Analyses ........................................................................................... 60 2.6.1 Two-sided Smirnov test to compare dominance duration
distributions. ............................................................................................ 60
2.7 Results .............................................................................................................. 61 2.7.1 Binocular rivalry rate. ............................................................................. 61 2.7.2 Fast versus slow alternators (binocular rivalry rate). .............................. 64 2.7.3 Binocular rivalry dominance durations in fast and slow alternators. ...... 68
2.8 Discussion ......................................................................................................... 72 2.8.1 Binocular rivalry rates. ............................................................................ 72 2.8.2 Dominance durations. ............................................................................. 76 2.8.3 Age. ......................................................................................................... 78
2.9 Conclusion ........................................................................................................ 78
CHAPTER 3: Slower Binocular Rivalry Rates in Individuals with Schizophrenia Compared to Healthy Controls .................................................................................. 81
3.1 Binocular Rivalry Rate in Major Psychiatric Illness ........................................ 81
3.2 Study 2 .............................................................................................................. 85 3.2.1 Aims. ....................................................................................................... 85 3.2.2 Hypotheses. ............................................................................................. 86
3.3 Method .............................................................................................................. 86 3.3.1 Participants. ............................................................................................. 86
3.3.1.1 Healthy participants. ................................................................. 87 3.3.1.2 Participants with schizophrenia. ............................................... 87 3.3.1.3 Procedure .................................................................................. 89
viii
3.3.1.3.1 BINOCULAR RIVALRY TESTING. .................................................................... 89
3.3.1.3.2 PERCEPTUAL RIVALRY TESTING; THE NECKER CUBE. ................................... 90
3.4 Statistical Analyses ........................................................................................... 91
3.5 Results ............................................................................................................... 93 3.5.1 Binocular rivalry rate. .............................................................................. 93 3.5.2 Necker Cube alternation rates. ................................................................ 94 3.5.3 Normalised mean dominance durations. ................................................. 96
3.6 Discussion ......................................................................................................... 97 3.6.1 Binocular rivalry rates in schizophrenia. ................................................. 99 3.6.2 Monocular rivalry rates in schizophrenia. ............................................. 100 3.6.3 Distributions, gamma plots. ................................................................... 101 3.6.4 Effect of stimulus strength. ................................................................... 102 3.6.5 Diagnostic value of binocular rivalry rate. ............................................ 103 3.6.6 Physiological mechanisms for the slowing of binocular rivalry rate. ... 104 3.6.7 Effect of schizophrenia medication dose. .............................................. 105
3.7 Conclusion ...................................................................................................... 106
CHAPTER 4: Binocular Rivalry and Backward-Masking Tasks Reveal Pathway-Specific Abnormalities in Schizophrenia ................................................................. 108
4.1 Magnocellular and Parvocellular Pathways in Schizophrenia ........................ 108 4.1.1 Physiological differences in the magnocellular and parvocellular
pathways. ............................................................................................... 110 4.1.2 Magnocellular and parvocellular pathways in binocular rivalry. .......... 112
4.2 Study 3, Experiment 1: Assessing Binocular Rivalry in Schizophrenia Using Stimuli that Bias the Magnocellular and Parvocellular Visual Pathways ................ 114
4.2.1 Method. .................................................................................................. 115 4.2.1.1 Participants with schizophrenia. ............................................. 115 4.2.1.2 Control participants. ................................................................ 115 4.2.1.3 Binocular rivalry stimuli to bias the magnocellular and parvocellular pathways. ...................................................................... 116 4.2.1.4 Recording binocular rivalry. ................................................... 117
4.2.2 Statistical analyses. ................................................................................ 117 4.2.3 Results. .................................................................................................. 118
4.2.3.1 Binocular rivalry rate. ............................................................. 118 4.2.3.2 Dominance intervals. .............................................................. 121
4.2.4 Discussion related to magnocellular and parvocellular tasks. ............... 122 4.2.4.1 Binocular rivalry rates. ............................................................ 122 4.2.4.2 Dominance duration intervals. ................................................ 123 4.2.4.3 Gender differences. ................................................................. 127
4.3 A Backward-Masking Task Utilising Stimuli that Bias the Magnocellular and Parvocellular Visual Pathways ................................................................................. 129
4.3.1 Introduction. .......................................................................................... 129 4.3.1.1 Comparing binocular rivalry with other neurophysical tasks. 129 4.3.1.2 Development of the visual backward masking task. ............... 131 4.3.1.3 The visual backward masking task procedure. ....................... 133 4.3.1.4 Results of preliminary testing. ................................................ 134
ix
4.4 Experiment 2: Comparing Visual Backward Masking and Binocular Rivalry Tasks to Investigate Magnocellular and Parvocellular Processes. ........................... 136
4.4.1 Methods. ................................................................................................ 136 4.4.1.1 Schizophrenia participants. ..................................................... 136 4.4.1.2 Healthy controls. ..................................................................... 137 4.4.2.2 Binocular rivalry and visual backward masking stimuli. ...... 137
4.4.2 Statistical analyses. ............................................................................... 138 4.4.3 Results. .................................................................................................. 138
4.4.3.1 Binocular rivalry rates. ........................................................... 138 4.4.3.2 Dominance intervals. .............................................................. 140 4.4.3.3 Visual backward masking (VBM). ......................................... 141 4.4.3.4 Comparing binocular rivalry and visual backward masking results. ................................................................................................. 145
4.4.4 Discussion relating to visual backward masking. ................................. 147
4.5 General Discussion ......................................................................................... 150 4.5.1 A model of binocular rivalry based on visual backward masking
theory. .................................................................................................... 154
4.6 Conclusion ...................................................................................................... 159
CHAPTER 5: Benton’s Judgment Of Line Orientation - An Indicator of Visuospatial Ability In Schizophrenia ..................................................................... 161
5.1 The Right Hemisphere and Visuospatial Dysfunction ................................... 161
5.2 The Benton’s Judgment of Line Orientation Task ......................................... 163 5.2.1 Scoring the Benton’s Judgment of Line Orientation task. .................... 164
5.2.1.1 Global score. .......................................................................... 164 5.2.1.2 Error type. .............................................................................. 166 5.2.1.3 Individual line errors.............................................................. 167 5.2.1.4 Hemi-space errors. ................................................................. 167
5.3 Pilot Testing the Computer Version of BJLO and Alternative Scoring Systems168 5.3.1 Method. ................................................................................................. 170
5.3.1.1 Participants. ............................................................................. 170 5.3.1.2 Procedure. ............................................................................... 170
5.3.2 Results of pilot test ................................................................................ 171
5.4 Study 4, Benton’s Judgment of Line Orientation in Participants with Schizophrenia ........................................................................................................... 172
5.4.1 Aims. ..................................................................................................... 172 5.4.2 Method. ................................................................................................. 173
5.4.2.1 Participants with schizophrenia. ............................................. 173 5.4.2.2 Healthy control participants. ................................................... 173 5.4.2.3 Procedures. .............................................................................. 173
5.4.3 Statistical analyses. ............................................................................... 174 5.4.4 Results. .................................................................................................. 175
5.4.5.1 Global score analysis. ............................................................. 175 5.4.5.2 Error type analysis. ................................................................. 176 5.5.5.3 Line error analysis. ................................................................. 176 5.5.5.4 Hemi-space analyses. .............................................................. 177
5.5 Association between Benton’s Judgment of Line Orientation and binocular rivalry ....................................................................................................................... 177
x
5.6. Global score ....................................................................................................... 178 5.7.1.1 Error type. ............................................................................... 182 5.7.1.2 Hemi-space.............................................................................. 183
5.7.2 Potential Impact of BJLO Performance ................................................. 184 5.7.2.1 Age and gender. ...................................................................... 184 5.7.2.2. Medication effects. ................................................................. 184 5.7.2.3 Schizophrenia sub-types and symptom ratings. ...................... 184 5.7.2.4 Cognitive ability. ..................................................................... 185
5.7.3 Comparing Benton’s Judgment of Line Orientation with Binocular Rivalry ................................................................................................... 185
5.7.4 Cortical Pathway and Hemispheric Models of Involvement ................. 186 5.7.4.1 Dorsal and Ventral Pathways .................................................. 186 5.7.4.2 The Cortical Hemispheres ....................................................... 187
5.6 Conclusion ...................................................................................................... 188
CHAPTER 6: Taq1 Allele of the DRD2 Dopamine Receptor Gene, Binocular Rivalry, Visual Backward Masking and Benton’s Judgment of Line Orientation ... 190
6.1 Dopamine in Vision ........................................................................................ 190 6.1.1 The A1 allele of the DRD2 receptor gene. ............................................ 191 6.1.2 The A1 allele of the DRD2 receptor in vision. ...................................... 194
6.2 Aims ................................................................................................................ 195
6.3 Method ............................................................................................................ 195 6.3.1 DNA collection and extraction. ............................................................. 195 6.3.2 Participants. ........................................................................................... 196
6.3.2.1 Control participants who participated in the binocular rivalry tasks in Study 1. .................................................................................. 197 6.3.2.2 Participants with schizophrenia and healthy controls who participated in binocular rivalry, Studies 2 and 3 and the Necker Cube task in Study 2 (Chapters 3 and 4). ..................................................... 197 6.3.2.3 Participants with schizophrenia and healthy controls who participated in visual backward masking tasks in Study 3 (Chapter 4).198 6.3.2.4 Participants with schizophrenia and healthy controls who participated in Benton’s Judgment of Line Orientation in Study 4 (Chapter 5). ......................................................................................... 198
6.4 Results ............................................................................................................. 199 6.4.1 Binocular rivalry results. ....................................................................... 199
6.4.1.1 Binocular rivalry in control participants in 16 stimulus Conditions from Study 1. .................................................................... 199 6.4.1.2 Binocular rivalry rates in low- and high-strength, magnocellular and parvocellular biased binocular rivalry tasks and the Necker cube.200
6.4.3 Benton’s Judgment of Line Orientation Task results. ........................... 200
6.5 Discussion ....................................................................................................... 204
CHAPTER 7: Overview, General Discussion and Conclusions ........................... 209
7.1 Overview and General Discussion .................................................................. 209 7.1.1 Exploring binocular rivalry rate. ........................................................... 209 7.1.2 Dominance durations. ............................................................................ 210
7.2 Neurotransmission and Binocular Rivalry: Does Dopamine Have a Role? ... 212
xi
7.3 Combining Theories to Produce a New Model of Binocular Rivalry ............ 213
7.4 Slower Binocular Rivalry and Visual Processing in Schizophrenia ............... 216
7.5 Limitations ...................................................................................................... 217
7.6 Implications for Future Research ................................................................... 223
7.7 Conclusion ...................................................................................................... 225
REFERENCES ......................................................................................................... 228 APPENDICES……………………………………………………………………..296 Appendix A: Backward Masking Task Instructions for Parvocellular VBM Task………………………………………………………………………………..296
Appendix B: Backward Masking Task Instructions for Magnocellular Visual Backward Masking (VBM) Task ............................................................................. 298
Appendix C: Effect of Schizophrenia Characteristics on Visual Backward Masking (VBM) Tasks ............................................................................................................ 300
Appendix D: Score Sheet - Benton’s Judgment of Line Orientation (BJLO) .......... 302
Appendix E. Benton Judgment of Line Orientation (BJLO) Performance Scores in Participants with Schizophrenia and Healthy Controls by A1 Allele of the DRD2 Receptor Gene. ......................................................................................................... 304
xii
List of Figures
Figure 2.1: Binocular rivalry rates by 20 participants across all stimulus conditions (n = 16). ...................................................................................... 62
Figure 2.2: Mean binocular rivalry rates (n = 20) across the 16 stimulus
conditions. .................................................................................................... 63
Figure 2.3: The effect of increasing stimulus strength on binocular rivalry rate
in ‘slow’ and ‘fast’ alternators: binocular rivalry rates recorded by 20 healthy volunteers grouped based on the participants mean binocular rivalry alternation rate, A. The effect of increasing stimulus strength by introducing movement to low and high luminance stimuli in fast (n=3) and slow (n=3) alternators. B. ............................................................ 67
Figure 2.4: The effect of stimulus strength on binocular rivalry rate: Binocular
rivalry rate increases as stimulus strength increases. ................................... 68
Figure 2.5:Cumulative frequency distributions of normalized dominance
durations recorded by fast alternators (n = 3) compared with slow alternators (n = 3) in 16 stimulus conditions. ............................................... 72
Figure 3.1: Mean alternation rates recorded in schizophrenia participants (n =
20, grey diamonds) compared healthy controls (n = 20, black squares) in two binocular rivalry tasks. ...................................................................... 95
Figure 3.2: Normalised mean dominance durations (the time intervals between
button pushes (in seconds)/mean) plotted as cumulative distributions. ....... 98
Figure 4.1:Binocular rivalry rates recorded in participants with schizophrenia
(black triangles) compared to healthy controls (black diamonds). ............ 120
Figure 4.2: Difference between the dominance durations of participants with
schizophrenia (black lines) and healthy control participants (grey lines) for (A) the magnocellular binocular rivalry (BR) task and (B) the parvocellular BR task. .......................................................................... 124
Figure 4.3: Binocular rivalry (BR) rates recorded in participants with schizophrenia (black triangles) compared to healthy controls (black diamonds). .................................................................................................. 140
Figure 4.4: The dominance durations between participants with schizophrenia
(black lines) compared to healthy participants (grey lines) for (A) magnocellular binocular rivalry (BR) task and (b) parvocellular BR task. ............................................................................................................ 143

xiii
Figure 4.5: Number of correct responses as a function of inter-stimulus interval in healthy controls and participants with schizophrenia for (A) magnocellular visual backward-masking(VBM) and (B) parvocellular VBM tasks. ................................................................................................ 144
Figure 4.6: The hypothesised time course of activation of transient and
sustained channels after a brief presentation of a stimulus. ....................... 151
Figure 4.7: The time course of the transient and sustained channels when the
target precedes the mask (backward masking). ......................................... 152
Figure 4.8: Transient (magnocellular) neurons inhibit sustained ones via
internuncial neurons at the lateral geniculate nucleus (LGN) and cortex. The impulse response by the internuncial neuron is initiatory at the postsynaptic potential and integrates with the sustained neuron at either the LGN or cortex. ........................................................................... 155
Figure 4.9: A revised model of binocular rivalry with rapid magnocellular
response followed by the parvocellular response to continuous stimuli (vertical and horizontal lines) in the right and left eyes respectively at corresponding retinotopic areas. ................................................................ 158
Figure 5.1: An item from the Benton’s Judgement of Line Orientation (BJLO)
task. ............................................................................................................ 165
Figure 6.1: Benton’s Judgement of Line Orientation (BJLO) line error scores
according to the presence of the A1 allele in subjects with (a) schizophrenia and (b) healthy controls. ..................................................... 206

xiv
List of Tables
Table 2.1: The Kolmogorov-Smirnov goodness of fit analysis statistics for the dominance duration distributions for fast and slow alternators over 16 stimulus conditions (n=20). .......................................................................... 70
Table 2.2: The two-sided Smirnov test statistic for fast and slow alternators (m
and n respectively) compared with the critical values determined by of T1 at the 0.95 quantile (w0.95 ≈1.36√ m+n/ mn) across the 16 test binocular rivalry stimuli conditions (n=20). ................................................ 71
Table 3.1: Age, gender, eye dominance and NART scores of controls and
participants with schizophrenia .................................................................... 88
Table 3.2: Smirnov test statistic for participants with schizophrenia (n=20) and
controls (n=20). ............................................................................................ 97
Table 4.1: Age, gender, eye dominance and NART score of participants with
schizophrenia and controls ......................................................................... 116
Table 4.2: Smirnov test results indicating differences in the distribution of
dominance durations between participants with schizophrenia (n=17) and controls (n=24) for both magnocellular and parvocellular binocular rivalry (BR) tasks. ...................................................................... 121
Table 4.3: Correct target letter identification by location and letter in a
preliminary test of the magnocellular and parvocellular visual backward masking (VBM) task (n = 5). .................................................... 135
Table 4.4: Age, gender, eye dominance and NART score of controls and
participants with schizophrenia. ................................................................. 137
Table 4.5: Differences in the distribution of dominance durations between
participants with schizophrenia and controls in magnocellular and parvocellular binocular rivalry (BR) tasks: Smirnov test outcomes of dominance duration distributions. .............................................................. 141
Table 4.6: Differences in correct identification of a target scores in
magnocellular and parvocellular visual backward- masking (VBM) tasks between participants with schizophrenia and healthy controls at four inter-stimulus intervals (ISI) .............................................................. 142
Table 4.7: Correlations between magnocellular and parvocellular binocular
rivalry (BR) rates (in Hz) with magnocellular and parvocellular visual backward masking (VBM) correct scores (Spearman’s correlation coefficient rho). .......................................................................................... 146

xv
Table 5.1: Method of analysing Benton’s Line of Judgement Orientation (BJLO) results as per (Ska ......................................................................... 169
Table 5.2: Age, gender, eye dominance and NART score of participants with
schizophrenia and Controls. ....................................................................... 174
Table 5.3: Benton’s Judgement of Line Orientation (BJLO) data for control
participants and participants with schizophrenia: mean global scores (out of 30 and 60), line error scores and hemi-space errors for the BJLO task. .................................................................................................. 179
Table 5.4: Benton’s Judgement of Line Orientation (BJLO) data for healthy
control participants and participants with schizophrenia: error type in the BJLO task ............................................................................................. 180
Table 5.5: Correlations between global Benton’s Judgement of Line
Orientation (BJLO) scores and binocular rivalry (BR) rates for stimuli that bias the BR task for either the magnocellular or parvocellular visual pathways (spearman rank order). .................................................... 181
Table 6.1: Demographic characteristics of participants genotyped for the
presence of the Taq1 A DRD2 alleles receptor for studies 2, 3 and 4. ...... 199
Table 6.2: Binocular rivalry rates recorded by A1+ healthy participants (n = 5)
compared A1- healthy participants (n = 11) over the 16 stimulus conditions. .................................................................................................. 201
Table 6.3: Binocular rivalry rates recorded by A1+ and A1- participants using
binocular rivalry tasks with high and low strength stimuli, magnocellular and parvocellular biased stimuli and the Necker Cube ...... 202
Table 6.4: Correct scores in backward masking tasks that bias magnocellular
and parvocellular visual pathways at 4 inter-stimulus intervals (ISI) recorded by A1+ and A1- participants with schizophrenia. ...................... 206
Table 6.5: Correct scores in backward masking tasks that bias magnocellular
and parvocellular visual pathways at 4 inter-stimulus intervals (ISI) recorded by A1+ and A1- control participants .......................................... 205
xvi
List of Abbreviations
A1+ Positive for the presence of the A1 allele of the DRD2 receptor gene
A1- Negative for the presence of the A1 allele of the DRD2 receptor gene
BJLO Benton’s Judgement of Line Orientation
BOLD Blood-oxygenation level dependent
bp Base pairs
BPD Bipolar Disorder
BPRS Brief Psychiatric Rating Scale
BR Binocular Rivalry
c/d Cycles per degree
COMT Catechol-O-methyl transferase
CNTRICS Cognitive Neuroscience Treatment Research to Improve Cognition in
Schizophrenia
cpd Cycles per degree of visual angle
c/s Cycles per second
CPZE Chlorpromazine equivalents
deg Degrees
dLGN Dorsal Lateral Geniculate Nucleus
DSM-IV Diagnostic and Statistical Manual of Mental Disorders – Edition 4
DRD2 Dopamine D2 receptor
DSA Dichoptic stimulus alternation
EEG Electroencephalography
ERP Event related potential
fMRI Functional Magnetic Resonance Imaging
GABA Gamma-Aminobutyric acid
xvii
H Horizontal
Hz Hertz
ISI Inter-stimulus interval
LGN Lateral Geniculate Nucleus
msec Milliseconds
MEG Magnetoencephalography
MRI Medical resonance imaging
MT Middle Temporal visual area (also referred to as V5)
N Negative
NART National Adult Reading Test
NMDA N-methyl-D-aspartic acid
PANSS Positive and Negative Schizophrenia Syndrome scale
P Positive
PET Positron emission tomography
PTSD Post-traumatic stress disorder
SCID Structured Clinical Interview for DSM-IV
Sec Seconds
t-VEP Transient visual-evoked potential
VBM Visual Backward Masking
VEP Visual Evoked Potential
V1 Visual area 1, the extra striate cortex (also known as the primary
visual pathway)
V2 Visual area 2, the pre-striate cortex
V3 Visual area 3
V4 Visual area 4
xviii
V5 Visual area 5 (also known as the middle temporal visual area)
5-HT Serotonin

xix
Statement of Original Authorship
The work contained in this Thesis has not been previously submitted to meet
requirements for an award at this or any other higher education institution. To the
best of my knowledge and belief, the Thesis contains no material previously
published or written by another person, except where due reference is made.
Name: Karen Ruth Heslop
Signature: …………………..
Dated: …………………..

xx
Acknowledgments
I would like to acknowledge the support, guidance, scholarly advice and
encouragement offered by Professor Ross Young and Associate Professor and
Katrina Schmid. I also wish to thank them both for providing practical support and
the many hours they spent reviewing my written work and providing constructive
feedback that helped with the direction of the project.
I would also like thank Dr Bruce Lawford for his infectious enthusiasm for
genetics, schizophrenia and research, and Dr Simon Burton for his clinical insights,
moral support and his assistance in developing many of the tasks.
Thank you also to the individuals who participated in this research as part of
the clinical group, and to my friends, colleagues and fellow students who acted as
controls and spent many hours in dimly-lit rooms, wearing strange goggles and
pushing buttons on a computer keyboard in response to some lines on a screen.
I wish to also thank Dr Steven Miller, Dr Guang Bin Lui and Professor Jack
Pettigrew whose work initially inspired me to investigate this fascinating
phenomenon, and for making the binocular rivalry task available to me. Thank you
also to Professor Stan Catts and Professor Laurie Geffen for their valued
contributions early in the project, and to Associate Professor Jason O’Connor and Dr
Cameron Hurst for their statistical advice.
Most of all I wish to thank Brett for his continued support and patience.
Literature Review - Visual Processing in Schizophrenia and Binocular Rivalry 1
1.1 Schizophrenia
Schizophrenia is a complex brain disorder characterised by cognitive
dysfunction that causes long-term disability, altered sensory perception,
dysregulation of emotion and disturbed behaviour (Brenner, Krishnan, Vohs, Ahn,
Hetrick & Morzorati, 2009). Despite many years of research into the disorder
spanning the disciplines of the physical, psychological and neurological sciences,
genetic and epidemiological research, there is no one theory that satisfactorily
explains the symptoms or pathophysiology of schizophrenia. While advances in the
field of neurosciences, and brain imaging have provided key insights into this
disorder many fundamental questions remain unanswered.
It is generally agreed that sufferers experience both subjective sensory
anomalies and objective deficits of sensory function (Brenner et al., 2009) that
contribute to many of the symptoms of schizophrenia. Symptoms of schizophrenia
include visual, auditory and olfactory hallucinations associated with distortions of
sensory perception (Andreasen, Arndt, Alliger, Miller & Flaum, 1995; Butler,
Silverstein & Dakin, 2008) and delusions or firmly-held false beliefs that result from
mis-interpretations of these perceptions and personal experiences (Frith, & Dolan,
1997). Sufferers may also experience disorganised speech, thinking and behaviour,
agitation, social dis-inhibition and bizarre behaviours (Andreasen et al., 1995).
Many individuals with schizophrenia experience a reduced intensity range of
emotional expression (affective flattening), poverty of speech (alogia), a reduction or
inability to initiate and maintain goal-directed behaviour (avolition) and a marked
decrease in reaction to the immediate surrounding environment (Cadenhead, Geyer,
Chapter 1: Literature Review - Visual Processing in Schizophrenia and Binocular
Rivalry

2 Literature Review - Visual Processing in Schizophrenia and Binocular Rivalry
Butler, Perry, Sprock & Braff, 1997; Uhlhaas, Phillips & Silverstein, 2005). The
symptoms of schizophrenia impact on the individuals’ internal world and hamper
their ability to navigate their external environments and impair their overall
functioning (Couture, Granholm & Fish, 2010). Therefore, individuals with
schizophrenia experience poorer social and occupational functioning compared to
their unaffected peers (Peuskens, Demily & Thibaut, 2005; Tan, 2009; Tsang, Leung,
Chung, Bell & Cheung, 2010).
Compounding these issues are marked deficits in cognitive functioning.
Cognitive impairment is considered a core feature of schizophrenia, with more than
80% of patients showing significant impairment (Bora, Yucel & Pantelis, 2010).
Cognitive deficits associated with schizophrenia include: difficulty with
concentration and memory (i.e. working, visual and verbal), the limited ability to
process complex information, response inhibition, and deficits in speed of
processing, visual and verbal learning. Those with schizophrenia also experience
difficulty with sustained attention or vigilance, and difficulties in executive function
such as reasoning, problem solving and social cognition (Bora, Yucel, & Pantelis,
2010; Green, 2006; Tomás, Fuentes, Roder & Ruiz, 2010).
Researchers investigating visual abnormalities in schizophrenia, that are known
to contribute to cognitive deficits and perceptual disturbance characteristic of the
disorder, generally subscribe to either “top-down” or “bottom-up” theories (see
Butler, Silverstein & Dakin, 2008; Javitt, 2009; Piskulic, Oliver, Norman & Maruff,
2007, for reviews). Traditionally, the perceptual visual disturbances in schizophrenia
have been viewed as being consequential to “top-down” processing (Frith & Dolan,
1997; Gilbert & Sigman 2007; Grossberg, 2000; Kveraga, Ghuman & Bar, 2007;
Laycock, Crewther & Crewther, 2007) where disturbances in localised cortical

Literature Review - Visual Processing in Schizophrenia and Binocular Rivalry 3
regions diminish cognitive processing, attention, memory and executive functioning
and ultimately affect social functioning and outcomes (Javitt, 2009). However, the
focus in schizophrenia research has shifted toward perceptual disturbances,
abnormalities early in the visual pathway, and their contributions to higher cognitive
deficits (Bulter et al., 2005; Butler, Martinex, Foxe, Kim, Zemon, Silipo, Mahoney,
Shpaner, Jalbrzikowski & Javitt, 2007; Javitt, 2009; Martinez, Hillyard, Dias, Hagler,
Butler, Guilfoyle, Jalbrzikowski, Silipo & Jarvitt, 2008).
1.2 Perceptual Disturbances in Schizophrenia
Individuals with schizophrenia have marked deficits in detecting low-contrast
visual stimuli (Keri, Antal, Szekeres, Benedek & Janka, 2000; Keri & Benedek,
2007), stimuli with low luminance and spatial frequencies, and stimuli presented at
varying temporal speeds (or pulsing stimuli) (Chen, Levy, Matthysse, Holzman &
Nakayama, 2000; Keri, Antal, Benedek & Janka, 2000; Keri, Antal, Szekeres,
Benedek & Janka, 2000; Schwarts, McGinn & Winstead, 1987; Schwartz, Mallot &
Winstead, 1988; Slaghuis, 1998; Slaghuis & Bishop, 2001; Slaghuis & Thompson,
2003; Slaghuis, 2004). Such deficits in perception reduce the individual’s ability to
identify salient visual information in day-to-day situations (Poirel, Brazo, Turbelin,
Lecardeur, Simon, Houde, Pineau & Dollfus, 2010). Damage to sensory processing
areas, that allow prior knowledge of a sensory input to be related to random
incoming sensory information (Frith & Dolan, 1997), may inhibit the correct
identification of visual stimuli, resulting in sensory hallucinations. These perceptual
disturbances involve aberrant cortical activations of networks at differing levels of
complexity in the brain (Jardri, Pouchet, Pins & Thomas, 2010). Dysfunction in the
posterior area of the brain that mediates visual perceptual processing (the primary
visual cortex) has been implicated in object and visual spatial perceptions that are
4 Literature Review - Visual Processing in Schizophrenia and Binocular Rivalry
frequently noted in schizophrenia (Tek, Gold, Blaxton, Wilk, McMahon &
Buchanan, 2002). Prefrontal areas that are involved in maintaining information
during short delay intervals between visual stimuli are also affected in schizophrenia
(Tek et al., 2002).
1.3 Delusional Experiences
Sensory gating abnormalities (i.e. the ability to ignore irrelevant information
while focusing on a salient features) that are related to perceptual and attentional
mechanisms, have been reported by individuals with schizophrenia (Hetrick,
Erickson & Smith, 2010). Poor sensory gating, together with a reduction in the
quality of sensory input, results in a heightened awareness of background stimuli and
poor selective attention. Therefore, individuals with schizophrenia often have
difficulty correctly identifying the source of a perceptual stimulus, filtering out
unimportant information and interpreting sensory perceptions to determine a context
for the incoming stimuli. The individual may thus misinterpret sensory information;
believing external forces are controlling their actions or thoughts, or thinking that
they can control events that are not under their control (Voss, Moore, Hauser,
Gallinat, Heinz & Haggard, 2010). Failure to correctly make this distinction may
account for the strong association between hallucinations and paranoid delusions in
schizophrenia; the person with schizophrenia not only hears voices or misinterprets
visual stimuli, but attributes (usually hostile) intentions to these voices and visual
experiences (Frith & Dolan, 1997). Prior knowledge, or memory of sensory input,
enables us to distinguish our own actions from those of independent agents in the
outside world. Many theorists posit that delusional disturbances are related to a mis-
match between predicted and actual sensory feedback that relies on an intact central
comparator mechanism (Voss et al., 2010).

Literature Review - Visual Processing in Schizophrenia and Binocular Rivalry 5
The visual environment consists of global features (for example, a forest) and
local features (for example a tree). Global visual information provides the context in
which local information is interpreted. For example, a tree in a forest appears to be
in context, while a tree in a kitchen of a house is considered out of context. It has
been suggested that individuals with schizophrenia have difficulty processing global
information and therefore context, and tend to focus more on local features (Poirel et
al., 2010) therefore resulting in a local bias. This local bias leads to an incorrect
interpretation of visual information.
1.3.1 Disorganised thoughts and behaviour.
Individuals with schizophrenia require greater delays between two temporally
presented images in order to detect the two discrete images. When images are
separated by only 90-150 millisecond (msec) intervals they tend to view temporally-
modulated images as continuous presentations (Schwartz, Evans, Pena & Winstead,
1994). Tasks that require observers to identify a blank image (an inter-stimulus
interval) between two sinusoidal gratings (Schwartz & Winstead, 1998; Schwartz, et
al., 1994) or between two flashed stimuli consistently separate those with
schizophrenia from healthy controls (Schwartz, Satter, O’Neill & Winstead, 1990;
Schwartz & Winstead, 1988; Schwartz, et al., 1994). These abnormally-long inter-
stimulus intervals have been correlated with disorganised thoughts and behaviours in
schizophrenia (Norton, Ongur, Stromeyer & Chen, 2008).
Furthermore, the visual motion pathway that includes a local and a global
processing stage, each of which has distinct neural substrates, is disrupted in
schizophrenia. In schizophrenia, global (but not local) processing stage of the visual
motion system is compromised. These motion-sensitive brain areas are abnormal in
schizophrenia. These areas possess large receptive fields for spatial and temporal

6 Literature Review - Visual Processing in Schizophrenia and Binocular Rivalry
integration, such as the middle temporal and medial superior temporal areas (Chen,
Nakayama, Levy, Matthysse & Holzman, 2003). These regions are integral for the
detection of motion and spatial orientation, the shifting of attention and orientating
oneself during self-movement (Duffy and Wurtz, 1997). Such abnormalities may
manifest in schizophrenia as disorganised or slowed thinking, difficulty with
understanding, expressing and integrating thoughts, feelings and behaviours. These
deficits are generally thought to be related to deficits in the neural pathways that
relate to the sequencing of information or timing of neural information flow
(Andreasen et al., 1995; Barrett, Mulholland, Cooper & Rushe, 2009; Couture,
Granholm & Fish, 2010).
1.4 Cognitive Deficits in Schizophrenia
Cognitive deficits are thought to be related to higher-order sensory deficits.
Current neurophysiological models suggest deficits in cognitive processing are due
to impairments in basic perceptual processes that localise to primary sensory brain
regions (Butler, Martinez, Foxe, Kim, Zemon, Silipo, Mahoney, Shpaner,
Jalbrzikowski & Javitt, 2007; Butler, Schechter, Zemon, Schwartz, Greenstein,
Gordon, Schroeder & Javitt, 2001; Javitt, 2009).
The ability to track visual information allows us to efficiently process and
interpret incoming visual information which is essential for effective interaction with
our external environment. In schizophrenia, abnormal eye tracking is hypothesised
to be a fundamental component of the perceptual disturbance and abnormal cognitive
processing associated with the disorder (Javitt, 2009). Eye tracking abnormalities
have been observed in working memory (Levin et al; 1988; Park & Holzman, 1993;
Sereno & Holzman, 1995). These abnormalities have also been evident in cognitive
processing tasks (Campanella & Guerit, 2009; Litman et al., 1991; Solomon,
Literature Review - Visual Processing in Schizophrenia and Binocular Rivalry 7
Holzman, Levin & Gale, 1997), contrast and velocity discrimination (Chen, Levy, et
al., 1999) and motion detection (Chen, Nakayama, Levy Matthysse & Holzman,
2003) in schizophrenia. Importantly, they are independent of medication effects
(Grawe & Levander, 1995; Holzman, O’Brian & Waternaux, 1991; Litman et al.,
1989; Litman, Hommer, Radant, Clem & Pickar, 1994) and severity of illness
(Bartifai, Levander, Nyback, Berggren & Schalling, 1995). These abnormalities may
reflect a failure of cortical and/or cerebellar function in areas coordinating saccadic
and pursuit eye movements during visual tracking (Avila, Weiler, Lahti, Tamminga
& Thaker, 2002; Hong et al., 2005; O’Driscoll et al., 1998) or magnocellular deficits
(Laycock, Crewther & Crewther, 2008; Schwartz, Maron, Evans & Winstead, 1996b)
Cognitive deficits associated with schizophrenia are also likely to be related
to abnormalities in the architecture or structure of the brain, or dysfunction in the
structures or mechanisms associated with information processing. These include the
neural pathways and neurotransmitters involved in visual processing. There have
been many advances in the scientific investigation into visual processing that have
provided new insights into schizophrenia. Investigations of brain function by
measuring visual-evoked potentials, using functional magnetic resonance imaging
(fMRI) to investigate visual pathways and the cortical hemispheres have made a
significant contribution over the recent decades. Investigations into the
neurotransmitters and the genetic determinants of neurotransmission have also
gathered momentum.
1.4.1 Visual-evoked potentials in schizophrenia.
A visual-evoked potential (VEP) is an electrical potential (forming either
positive [P] or negative [N] waves when detected by electroencephalography or
EEG), that is generated within the visual system following the presentation of a
8 Literature Review - Visual Processing in Schizophrenia and Binocular Rivalry
stimulus. Reduced amplitude in positive P100 waves (Doniger, Foxe, Murray,
Higgins & Javitt, 2002; Schechter et al., 2005; Thompson & Drasdo, 1992; Vohs et
al., 2008; Yeap et al, 2008), P300 and C100 waves, negative N100 amplitudes
(Doniger et al., 2002; Schechter et al., 2005; Vohs et al., 2008) and prolonged P300b
latency (Vohs, et al., 2008) have been observed in individuals with schizophrenia and
their siblings (Groom et al., 2008). Although a feature of schizophrenia, abnormal
P300 amplitudes are thought to be more characteristic of functional psychosis in
general, rather than being specific to schizophrenia (Bestelmeyer, Phillips, Crombie,
Benson & St Clair, 2009).
Visual-evoked potentials can also be measured in response to particular stimuli
to further investigate specific visual abnormalities. For example, altered VEP spatial
frequency functions have been observed in schizophrenia (Clementz, Wang & Keil,
2008; Celesia & Toleikis, 1991). Abnormal VEPs in tasks using stimuli that
preferentially stimulate magnocellular or parvocellular pathways have been observed
in schizophrenia (Butler et al., 2001; Butler et al., 2005; Butler et al., 2007; Kim,
Wylie, Pasternak, Butler & Javitt, 2006). These findings confirm the existence of
early-stage visual processing dysfunction in schizophrenia (Butler et al., 2005).
Abnormal steady-state VEPs (evoked potentials measured during continuous
stimulation) have been observed in schizophrenia during visual processing of
complex visual tasks. P300b amplitudes have been observed to be lower in the
parietal regions in identity and happiness tasks (in those with schizophrenia
compared to controls using an oddball paradigm to evaluate face identity recognition
and facial emotional recognition of happiness and fear) (Ramos-Loyo, Gonzalez-
Garrido, Sanchez-Loyo, Medina & Basar-Eroglu, 2009). This implicates higher-
order processing. It has been proposed that abnormal N250 suggests that those with

Literature Review - Visual Processing in Schizophrenia and Binocular Rivalry 9
schizophrenia are less efficient at decoding features of facial affect (Wynn, Lee,
Horan & Green, 2008). Individuals with schizophrenia showed abnormal P100 and
N170 responses to spatial frequency changes in faces, thus demonstrating decreased
ability to process facial features (Obayshi et al., 2009). P100 amplitude reductions
that occur early in visual processing have been implicated in working memory
deficits and have been observed in adolescents with schizophrenia and are a feature
of early onset psychosis (Haenschel et al., 2007). These disruptions of visual steady-
state responses in schizophrenia are consistent with neuropathological and medical
resonance imaging (MRI) evidence of anatomic abnormalities in visual cortices
(Brenner et al., 2009). Visual-evoked potentials (and contrast sensitivity measures)
significantly predict community functioning in schizophrenia (Butler et al., 2005),
suggesting that abnormal visual processing contributes to the fundamental cognitive
decline and perceptual disturbances seen in the disorder.
In schizophrenia, event-related brain potentials have revealed reduced inter-
hemispheric co-operation and slower corpus-callosal transfer times when information
is presented to the right hemisphere. Visual information appears to require more time
to cross from the right to the left hemisphere for analysis, thereby reducing the speed
of visual information processing in these individuals (Endrass, Mohr & Rockstroh,
2002; Mohr, Pulvermuller, Rockstroh & Endrass, 2008; Schwartz, Winstead &
Walker, 1984). Significant correlation between left- and right-hand bisection errors
and loss of callosal integrity (McCourt, Shpaner, Javitt & Foxe, 2008) is suggestive
of abnormal connectivity between frontal and parietal circuits (Frecska, White &
Luna, 2004) in schizophrenia. Slow transfer speed and lack of connectivity may
contribute to thought disorder, poverty of thought and prominent perceptual
hallucinations (McCourt et al., 2008). This abnormal connectivity between cortical

10 Literature Review - Visual Processing in Schizophrenia and Binocular Rivalry
regions renders individuals with schizophrenia less able to predict the relation
between ‘action’ and ‘effect’. This difficulty strongly correlates with severity of
positive psychotic symptoms, specifically delusions and hallucinations (Voss et al.,
2010).
Andreasen, Paradiso and O'Leary (1998) postulated that a cortico-cerebellar-
thalamic-cortical brain circuit is responsible for fluid, temporal coordination of
sequences of behaviour. The cognitive fragmentation, or thought disorder, in
schizophrenia is likely to be due to timing anomalies associated with cortico-
cerebellar-thalamic-cortical brain circuit dysfunction (Bolbecker, Mehta, Edwards,
Steinmetz, O'Donnell & Hetrick, 2009). This has been termed ‘cognitive dysmetria’;
meaning difficulty in prioritising, processing, coordinating, and responding to
information. This ‘poor mental coordination’ is a fundamental cognitive deficit in
schizophrenia, and can account for its broad diversity of symptoms (Andreasen et al.,
1998). A meta-analysis of published functional neuroimaging studies showed that
individuals with schizophrenia have lower activation of most right-hemisphere
regions of the cortico-cerebellar-thalamic circuit; a pattern that further indicates poor
connectivity between brain regions (Ortuno, Guillen-Grima, Lopez-Garcia, Gomez &
Pla, 2010). This timing circuit may be connected with cognitive tasks also known to
be abnormal in schizophrenia (Andreasen & Pierson, 2008).
1.4.2 Functional magnetic resonance imaging Studies (fMRI) in schizophrenia.
Functional magnetic resonance imaging studies (fMRI) reveal that individuals
with schizophrenia, and their biological relatives, generate a greater number of
leading saccades during smooth-pursuit eye movement (Schwartz, O’Brien, Evans,
Sautter & Winstead, 1995; Schwartz et al., 1995). Slowed initial pursuit velocity,
more errors in pursuit tasks (Radant, Claypoole, Wingerson, Cowley & Roy-Byrne,

Literature Review - Visual Processing in Schizophrenia and Binocular Rivalry 11
1997; Radant & Hommer, 1992), and abnormal saccadic eye movements (Mather,
1986; Mather & Putchat, 1984; Schreiber et al., 1995) may reflect a trait for the
disorder (Bender, Weisbrod & Resch, 2007; Holzman, 1987; Keri & Janka, 2004;
Kinney, Levy, Yurgelun-Todd, Kajonchere & Holzman 1999; Levy, Holzman,
Matthysse & Mendell, 1994; Levy, Holzman, Matthysse & Mendell, 1993; Thaker,
2008). This is supported by twin studies (Holzman et al., 1988; Holzman, Levy,
Matthysse & Abel, 1977; Litman et al., 1997) where children with childhood-onset
schizophrenia exhibit a pattern of eye-tracking abnormalities similar to that seen in
adults with schizophrenia (Kimra et al., 2001). These abnormalities have been
associated with the compromised ability of individuals with schizophrenia to process
new and complex information (Schwartz et al, 1995).
Abnormalities in motion detection have been demonstrated using fMRI (Chen,
Levy et al., 1999; Chen, Palafox et al., 1999; Chen, Levy, Sheremata & Holzman,
2004; Chen et al., 2008; Low, Rockstroh, Elbert, Silberman & Bentin, 2006). Global
(direction of random dot patterns) rather than local (detection of moving gratings)
stages of the visual-motion processing system are impaired in those with
schizophrenia. Motion-sensitive brain areas, such as the middle temporal area and
medial superior temporal areas, where processing of large receptive fields for spatial
and temporal integration occurs (Chen, Makayama et al., 2003) are implicated in
schizophrenia. Signal changes detected by blood oxygen level dependence (BOLD)
fMRI in motion-detection tasks, consistent with cortical activation, were significantly
reduced in the middle temporal area (MT) and significantly increased in the inferior
prefrontal cortex (an area normally involved in higher-level cognitive processing).
This shift in cortical response from posterior to prefrontal regions suggests that

12 Literature Review - Visual Processing in Schizophrenia and Binocular Rivalry
motion perception in schizophrenia is associated with both deficient sensory
processing and compensatory cognitive processing (Chen et al., 2008).
Individuals with schizophrenia demonstrate temporal resolution deficits when
processing sequential information, such as moving dots, gratings or letters (Schwartz,
Maron, Evans & Winstead, 1999a) and tasks involving visuospatial working memory
(Bollini, Arnold & Keefe, 2000; Silver & Goodman, 2008). When the attentional
load of a visual monitoring task in schizophrenia was measured during fMRI
selective visual processing was integrated in posterior parietal areas, rather than the
earlier occipital cortex (Schwartz et al., 2004). These factors may be manifested as
the misinterpretation of visual (and other) perceptual stimuli commonly observed in
psychosis. Relative to control subjects, fMRI reveals that patients with
schizophrenia show markedly-reduced activation to low, but not high spatial
frequencies in multiple regions of the occipital, parietal, and temporal lobes
(Martinez et al., 2008). Low spatial frequency processing is suggestive of disrupted
magnocellular processing, necessary in locating and identifying moving visual
stimuli, that contributes to the perceptual and cognitive disturbances associated with
schizophrenia (Chen et al., 2008; Laycock, Crewther & Crewther, 2008).
1.4.3 Magnocellular and parvocellular visual pathways in schizophrenia.
Abnormalities associated with magnocellular (or ‘transient’) visual pathways
have been consistently reported in schizophrenia (Butler et al., 2001; Cadenhead,
Serper & Braff, 1998; Green, Nuechterlein & Mintz, 1994b; Green, Nuechterlein,
Mintz, 1994a; Kim et al., 2006; Schwartz & Winstead, 1998; Schwartz et al., 1994;
Slaghuis & Curran, 1999). Some have suggested that magnocellular pathway deficits
are an endophenotype for schizophrenia (Bedwell & Orem, 2008; Butler, Harkavy-
Friedman, Amador & Gorman, 1996; Green, Nuechterlein & Breitmeyer, 1997;

Literature Review - Visual Processing in Schizophrenia and Binocular Rivalry 13
Buttner et al., 1999; Hayashi, 2000; Holzman, 1987; Keri, Bendek & Janka, 2001;
Keri, Szendi, Kelemen, Benedek & Janka, 2000; Keri, Kelemen, Benedek & Janka,
2004; McClure, 2001).
The magnocellular (or ‘transient’) visual pathway integrates dynamic visual
information regarding the position and spatial relationships of visual stimuli. In
broad terms, this is the attention-capturing pathway (Schwartz et al., 1988). In
schizophrenia, the transient (or magnocellular) pathways are thought to be either
impaired or over-active, interrupting the neural processing of the sustained (or
parvocellular) visual pathway (Butler et al., 2003). Over-active magnocellular
pathways correlate with poor selective attention, poor concentration, heightened
awareness of background noise and distractibility (Butler et al., 2003). Individuals
with schizophrenia have difficulty filtering sensory information related to importance
(Hetrick, Erickson & Smith, 2010). These features are the most-frequently
associated symptoms of the disorder.
To investigate these abnormalities, experimental techniques have been
developed to assess early visual magnocellular or parvocellular pathway processing
that contributes to higher-order cognitive impairments. Many researchers have
observed deficits in magnocellular pathway processing in subjects with
schizophrenia using frequency-doubling tasks, (Keri et al., 2004) steady-state VEPs
(Kim et al., 2006) and backward masking tasks (Green & Nuechterlein, 1999; Green
Nuechterlein, Breitmeyer & Mintz, 1999; McClure, 2001; Nuechterlein, Dawson &
Green, 1994; Rund & Landra, 1990; Skottun & Skoyles, 2009). However, not all
researchers report magnocellular abnormalities in schizophrenia (Skottun & Skoyles,
2007). Delord et al., (2006) found no magnocellular dysfunction in participants with
schizophrenia using a four-alternative forced-choice luminance discrimination task; a

14 Literature Review - Visual Processing in Schizophrenia and Binocular Rivalry
task hypothesised to access visual processes early in the visual pathways. They
concluded that if magnocellular dysfunction is a feature of schizophrenia, the
abnormality is likely to reflect integrative processes at higher cortical levels where
the magnocellular and parvocellular paths interact.
1.4.4 The cerebral hemispheres and schizophrenia.
Schizophrenia is generally thought to involve disturbance of right hemisphere
mechanisms involved in spatial perception and sustained attention (Evans &
Schwartz, 1997; O’Donnell et al., 2002). In right-handed individuals with
schizophrenia, the left hemisphere is superior for temporal sequential analysis
(Schwartz et al., 1984). Subtle right-hemisphere dysfunction has been noted in
individuals diagnosed with schizophrenia, and in individuals at high risk for
schizophrenia (Leib et al., 1996). Others have observed laterality differences that
suggest the left hemisphere may be less efficient than the right (Holzman, 1987).
Spatial working memory deficits are more severe in the left hemisphere in patients
with schizophrenia and in 'psychosis-prone' individuals (Park, 1999). Poorer reaction
times in response to visuospatial information in schizophrenia also implicate left
hemispheric mechanisms (Frecska, White et al., 2004; Gastaldo, Umilta, Bianchin &
Prior, 2002) and frontal function (Levander, Bartfai & Schalling, 1985).
1.4.5 Neurotransmitters in schizophrenia.
In addition to brain region and pathway dysfunction, abnormalities at the
cellular level have been implicated in schizophrenia. Alterations in the structure of
neurons results in a loss of synaptic connectivity and the ability to transmit afferent
information (Benitez-King, Ramirez-Rodriguez, Ortiz & Meza, 2004). Abnormal
neurotransmission is a hallmark of schizophrenia, with a number of neurotransmitters
and neurotransmission pathways involved (Javitt, 2009). These include dopamine,

Literature Review - Visual Processing in Schizophrenia and Binocular Rivalry 15
glutamate, gamma aminobutyric acid (GABA), serotonin and acetylcholine (Benitez-
King, Ramirez-Rodriguez, Ortiz & Meza, 2004). However, the dopamine theory of
schizophrenia has remained the most dominant in the schizophrenia research
literature. The dopamine theory is based on observations that substances that
increase dopamine levels in the brain (for example, amphetamines) induce
schizophrenia-like symptoms (or psychosis) (Kapur & Mamo, 2003). However
substances that block dopamine (for example, antipsychotic medications, such as
Chlorpromazine) or antagonise dopamine receptors (particularly D2 receptors)
improve or reverse these symptoms (Kapur & Mamo, 2003).
Dopaminergic pathways predominantly project to the pre-frontal cortex in
humans, which prompted ‘top-down’ models to explain dysfunction in schizophrenia
(Javitt, 2009). Studies utilising the visuospatial working memory (George et al.,
2002), memory-related visual and cognitive tasks (McGowan, Lawrence, Sales,
Quested & Grasby, 2004; Sheremata & Chen, 2004) and neuroimaging studies
(McGowan et al., 2004; Tost, Alam & Meyer-Lindenberg, 2009) suggest top-down
visual-processing disturbances. However, studies in individuals with schizophrenia
that utilise spatial, temporal, and contrast sensitivities known to be mediated by
dopamine and dopamine receptors, suggest that dopamine-related dysfunction
originating in the primary visual pathway contribute to abnormalities detected at
higher levels of visual processing in schizophrenia (Chen et al., 2003; Harris, Calvert
& Snelgar, 1990; Keri, Antal et al., 2002; Keri, Janka & Benedek, 2002; Masson,
Mestre & Blin, 1993; Schwartz et al., 1988; Schwartz, 1990; Sheremata & Chen,
2004; Slaghuis, 1998; Slaghuis & Curran, 1999).
Both serotoninergic and dopaminergic systems are important in visuospatial
attention tasks that involve attentional performance, selective attention, vigilance and

16 Literature Review - Visual Processing in Schizophrenia and Binocular Rivalry
executive control exerted by the prefrontal cortex and striatum (Boulougouris &
Tsaltas, 2008; Chudasama & Robbins, 2004) and abnormal saccades (Gurvich,
Fitzgerald, Feorgiou-Karistianis & White, 2008). Visuospatial working memory is
partially mediated by prefrontal cortical dopamine, and dysregulation of prefrontal
cortical dopamine systems may contribute to the pathophysiology of schizophrenia
(George, Vessicchio, Termine, Sahady, Head, Pepper, Kosten & Wexler, 2002),
suggesting ‘top-down’ processing. Ketamine, a-N-methyl-d-aspartate (NMDA)
antagonist, disrupts leading saccades during smooth-pursuit eye movements in
schizophrenia (Avila et al., 2002). Dopamine imbalances (striatal excess and cortical
deficiency) in schizophrenia may be secondary to NMDA hypofunction in the
prefrontal cortex and its connections (Kapur & Seeman, 2002; Laruelle, Kegeles &
Abi-Dargham, 2003).
1.4.6 Dopamine genes in schizophrenia.
In recent times, researchers have investigated the genetic determinants of
schizophrenia and how genetic factors may moderate symptoms and treatment
outcomes. Many dopaminergic genes have been investigated in schizophrenia
including: DRD1, DRD2, DRD3, DRD4 and DRD5 receptor genes, catechol-O-
methyltransferase (COMT) and dopamine-transporter genes (DAT). Although
multiple polymorphisms of each of gene have been investigated in schizophrenia,
most are restricted to single studies or provide inconsistent results across studies
(Talkowski, Bamne, Mansour, Vishwajit & Nimgaonkar, 2007). The most
researched dopamine polymorphism in the literature is the Taq1 A allele of the
DRD2 receptor gene. There have been a number of associations and functional
interactions in schizophrenia investigated with this polymorphism, thereby making
the Taq1 A allele of the DRD2 receptor gene the most promising to investigate in the
Literature Review - Visual Processing in Schizophrenia and Binocular Rivalry 17
current study. Investigations into the effect of anti-psychotic medications in
schizophrenia in the presence of the A1 allele indicate that this polymorphism may
modify the efficiency of DRD2 antagonism of such drugs in the central nervous
system (Suzuki, Mihara et al., 2002). Serum prolactin levels, that index dopamine
D2 blockade (Cotes, Crow & Johnstone, 1997; Gruen, 1978, Seeman, 2002), are in
those with schizophrenia who are A1+ (that is, positive for the A1 allele of the
DRD2 receptor gene) receiving anti-psychotic medications compared to those
without (Young et al., 2004). It has been noted that individuals with schizophrenia
who are A1+ (A1/1A1 and A1/1A2 genotypes) tend to experience more favourable
responses to medications (Scharfetter, 2004) than those with A1- status (A2/A2
genotype). A1+ individuals show greater improvement in total Brief Psychiatric
Rating Scale (BPRS) scores and in positive symptoms with treatment (Suzuki,
Mihara et al., 2000), again indicating that the allele may have a moderating effect.
1.4.7 Perceptual rivalry in schizophrenia.
Bistable or ambiguous figures such as the Necker Cube, Rubin’s Vase,
duck/rabbit and Schroder’s Staircase (Meng & Tong, 2004; Miller, Gynther, Heslop,
Liu, Mitchell, Ngo, Pettigrew & Geffen, 2003), present pictorial images to the visual
system that can be perceptually organised in several ways (Meng & Tong, 2004).
These figures require the visual system to interpret information from two equally-
compelling interpretations. This results in spontaneous perceptual alternations
between the two images; a phenomenon known as perceptual rivalry. It is thought
that perception rivalry results from lateral competition between neural mechanisms
or alternative images at some level in the visual pathway (Tong, 2001; Meng &
Tong, 2004). However, there is debate as to exactly where this competition occurs.
Using event-related potentials, it has been demonstrated that perceptual rivalry is
18 Literature Review - Visual Processing in Schizophrenia and Binocular Rivalry
resolved before perceptual awareness is established at 200-300 msec (Kornmeier &
Bach, 2004), suggesting competition at lower levels in the visual system. However,
other studies indicate that competition occurs in higher cortical regions of the visual
system. Single-cell studies have suggested that fronto-parietal areas initiate the
competition during perceptual rivalry by sending top-down signals to guide activity
in the visual cortex toward one representation at a time (Leopold & Logothetis,
1999). These studies are supported by fMRI data that show that activity in frontal
and parietal areas correlate with perceptual alternations reported when viewing
bistable images (Lumer, Friston & Rees, 1998).
Difficulty integrating incoming visual information and attentional selection
has been associated with the perceptual disturbances and delusions observed in
schizophrenia (Stephan, Friston & Frith, 2009; Synofzik, Thier, Leube, Schlotterbeck
& Lindner, 2010). Individuals with schizophrenia have demonstrated abnormal
visual processing associated with early cortical processing (for example, deficits that
occur between 100-300 msec, discussed above in Section 1.3.1) and in deficits in
higher cortical regions (as discussed in Sections 1.3.2). Therefore, it is likely that
those with schizophrenia would also show impaired performance on perceptual
rivalry tasks.
Available perceptual rivalry data in schizophrenia inconclusive. Levander et
al., (1985) suggest slower reversals in subjects with schizophrenia. An earlier study
Hunt and Guilford (1933) demonstrated Necker cube reversals were not significantly
different to healthy controls in subjects with ‘dementia praecox’ (an older term for
schizophrenia), but were four times faster than those with manic depression. Using
the ‘Schroder’s Staircases’, Calvert et al., (1988) demonstrated that subjects with
schizophrenia perceived the staircase from above for significantly less time, and had
Literature Review - Visual Processing in Schizophrenia and Binocular Rivalry 19
a (non-significant) tendency to have more reversals than controls. More recent
studies, such as Hoffman, Quinlan, Mazure and McGlashan (2001) and Keil, Elbert,
Rockstroh and Ray (1998) have demonstrated that subjects with schizophrenia had
faster reversals compared to healthy controls using Rubin’s Vase and the Necker
Cube. It has also been demonstrated that long term anti-psychotic therapy has no
significant effect on reversal rate or dominance duration during perceptual rivalry
(Calvert et al., 1988).
1.4.8 Binocular rivalry in schizophrenia.
Binocular rivalry is a unique type of perceptual rivalry where two opposing
images (that cannot be fused into a single stable image) are presented to each eye
exclusively. Each eye’s image during binocular rivalry is perceived in alternating
fashion. Binocular rivalry is thus considered to be competition between the eyes,
rather than between images or patterns (Tong, 2001). Similar to perceptual rivalry,
the mechanisms involved in binocular rivalry are widely debated. Some suggest
competition in the primary visual pathway (Blake,1989; Tong, 2001; Meng & Tong,
2004), while others suggest that mechanisms higher in cortical regions (Lumer,
Friston & Rees, 1998; Leopold & Logothetis, 1999) or cortical hemispheres
(Pettigrew & Miller, 1998; Miller, Liu, Ngo, Hooper, Riek, Carson & Pettigrew,
2000; Miller, 2001) are responsible for the competition between images presented to
each eye.
Binocular rivalry has the advantage as a research method that each of the rival
stimuli can be altered to access specific aspects of the visual system. For example,
the stimulus presented to one eye may be a complex image (such as a face), and the
other may be a simple grid pattern (see Blake, 2001), to determine how visual
information is integrated and processed. The stimuli may also be presented at

20 Literature Review - Visual Processing in Schizophrenia and Binocular Rivalry
differing temporal or spatial frequencies or luminance to examine the effect of
processing early in the visual pathway (Blake, 2001; Liu, Tyler & Schor, 1992). The
specific effect of altering the stimuli can be measured by alternations over time
(binocular rivalry rate) or how long each image dominates (dominance duration).
Each image dominates for a fluctuating period of time, indicative of non-linear
dynamic processing within the visual system. Non-linear processes are also
associated with other biological phenomena, such as the cortical spreading that
occurs in depression and slow-wave sleep (Tong, 2001). These characterisitics of
binocular rivalry provide an opportunity to investigate the neural components of
conscious visual awareness (Blake & Logethetis, 2002) in clinical populations,
including in those with schizophrenia. By exploiting the visual deficits known to be
a feature of schizophrenia, and investigating factors that contribute to visual
awareness and selective visual attention, binocular rivalry may provide novel insights
into cortical processing in schizophrenia in specific cortical regions and pathways
within the visual system.
To date, there are few studies of classical binocular rivalry in schizophrenia.
(Miller et al., 2003) reported no significant differences binocular rivalry rates in
subjects with schizophrenia compared to those with depression or healthy controls;
however (Foxe, 1965; Frecska et al., 2003; Sappenfield & Ropke, 1961; Wright, et
al., 2003) report slower binocular rivalry rates in schizophrenia. Pettigrew and
Miller and colleagues have proposed that slow binocular rivalry rate is a trait maker
for bipolar disorder (see Pettigrew & Miller, 1998 and Miller et al., 2003), and not
schizophrenia. They suggest that slow binocular rivalry rate may be a helpful tool in
diagnosis. However, this issue remains unresolved, as there are conflicting reports.
Literature Review - Visual Processing in Schizophrenia and Binocular Rivalry 21
There are limited data related to eye swapping during binocular rivalry tasks in
subjects with schizophrenia. As discussed previously, eye swapping eliminates eye-
of-origin information, so explores ‘top–down’ visual processing. Frecska, White et
al., (2003), White et al., (2001) and Wright et al., (2003) have applied conflicting
stimuli to the eyes in rapid reversal in subjects with schizophrenia in a method they
coined ‘dichoptic stimulus alternation’. Binocular rivalry ceased in healthy control
subjects when dichoptic stimulus alternations were above 30 Hz, however
approximately half of subjects with schizophrenia continued to experience rivalry
under these conditions (White et al., 2001). Healthy controls reported a consistent
image (vertical or horizontal stripes) for up to one second, while those with
schizophrenia perceived stable images for up to four seconds (Sec) during dichoptic
stimulus alternation (even when the stimuli were swapped at 30 Hz) (Frecska, White
& Leonard et al., 2003; Wright et al., 2003). Increased dominance durations, and thus
binocular rivalry rate, observed in schizophrenia under dichoptic stimulus alternation
may be related to less-effective visual processing. These may result from slow
gamma oscillations within the visual pathway (Frecska, White et al., 2003). These
factors may account for the perceptual disturbances and visual processing anomalies
associated with the hallucinations, delusions and cognitive deficits observed in
schizophrenia.
Studying binocular rivalry in schizophrenia provides a unique opportunity to
investigate components of visual sensory input that ultimately affect perceptual
awareness. A systematic investigation in binocular rivalry in schizophrenia is
missing from the current literature. Advancing the understanding of the mechanisms
involved in binocular rivalry and brain functioning with regard to visual awareness

22 Literature Review - Visual Processing in Schizophrenia and Binocular Rivalry
may provide insights into cortical processing in schizophrenia. The focus of this
review now turns to binocular rivalry.
1.5 Binocular Rivalry
As noted, binocular rivalry refers to the perceptual alternation of images that
occurs when two dis-similar images are presented simultaneously, one to each eye, in
the same spatial location (Blake, 2001; Logethietis, Leopold & Sheinberg, 1996;
Tong & Engel, 2001). For example, when vertical lines are presented to one eye and
horizontal lines are presented to the other in the same retinal location, the vertical
and horizontal lines are perceived in alternating fashion, rather than forming a grid or
composite pattern. During binocular rivalry the observer perceives the opposing
images in alternating fashion, even though the sensory input to each eye remains
constant. The alternation of perceptual images is therefore dissociated from the
sensory input (Clifford, 2009), allowing a unique opportunity to investigate human
visual perceptual awareness, or the ‘neural correlates of consciousness’ (Crick &
Koch, 1998). Thus, in recent times the focus of binocular rivalry research has been
the investigation of factors affecting the dominance of one image for awareness, and
subsequent suppression of the other. Reciprocal suppression and awareness during
rivalry are linked to conscious perception (Mitchell, Stoner & Reynolds, 2004; Ooi
& He, 1999; Tong, Nakayama, Vaughan & Kanwisher, 1998). It is this feature that
makes binocular rivalry a useful tool to investigate the contribution of perceptual and
cortical processes to the cognitive deficits observed in neurocognitive disorders, such
as psychosis and mood disorders.
Binocular rivalry testing yields two measures. The first is the frequency of
perceptual alternation between images (binocular rivalry rate), generally expressed as
alternations per second (Hz). The second is the portion of time spent perceiving the
Literature Review - Visual Processing in Schizophrenia and Binocular Rivalry 23
image of one eye relative to the other, assessed by predominance or perceptual
dominance durations (Blake, 2005; Breese, 1899; Levelt, 1968) in seconds.
Inhibitory processes during rivalry behave in an ‘all or none’ fashion (Blake &
Camisa, 1979), typically causing the suppressed image to return to dominance within
20 msec (Walker & Powell, 1979).
It is argued that the factors that affect the rate, rather than dominance or
suppression durations are the most critical to understanding the underlying process of
binocular rivalry (Chen & He, 2003). Binocular rivalry rates are thought to be driven
by monocular image contrast during the suppressed phase (Mueller & Blake, 1989),
with rates decreasing monotonically with increasing stimulus strength (Levelt, 1968;
Shpiro, Curtu, Rinzel & Rubin, 2006). It is generally accepted that manipulations to
the rival stimuli can modulate binocular rivalry rate (increasing or decreasing
dominance durations), however the fluctuations in perception between the two
images are ‘hard wired’ into the visual system (Blake, 2005). Breese (1899) made
the observation that subjects could exert some control over the length of time they
could perceive the dominant image during binocular rivalry; however they could not
control the fluctuations between images. Therefore, binocular rivalry rate may
provide some measure of underlying cognitive efficiency (Fox, 1965).
The alternation of perceptual images during rivalry has been argued to reflect
cortical responses to active, programmed events initiated by brain areas that integrate
sensory and non-sensory information to coordinate behaviour (Leopold &
Logothetis, 1999). When dominance durations are expressed as a function of their
mean and plotted as histograms, they typically approximate gamma-density functions
(Carter & Pettigrew, 2003; Fox & Herman, 1967; Levelt, 1968; Miller, 2001; Miller
et al., 2003; O’Shea, Parker, La Rooy & Alais, 2009) although this less convincing in

24 Literature Review - Visual Processing in Schizophrenia and Binocular Rivalry
some studies, (Kobayashi, 1992). Leopold (1999) suggests activity throughout the
visual cortex in higher, largely non-sensory brain centres, is consistent with
perceptual reversals during rivalry. This activity is associated with planning and
motor programming, and serves an important role in perceptual organisation and
selective attention. However, Levelt (1968) argued that mechanisms lower in the
visual system are responsible for the alternations in rivalry. He argued that
suppressed images produce, “A series of randomly-distributed excitation spikes”,
that were related to a ‘flick’ in eye-movements, and that these were necessary for the
suppressed image to return to dominance. He noted that plotted time intervals of
each of these ‘flicks’ fitted gamma distributions. The parameters of these
distributions were consistent between subjects (Logothetis et al., 1996).
Although several authors have fitted dominance durations to gamma
distributions, others note that binocular rivalry dominance durations can also be
fitted to Weibul, log-normal (Lehky, 1995; Zhou, Gao, White, Merk & Yao, 2004),
Wiener and Capocelli-Riciardi distributions (De Marco, Penego & Trabucco, 1977).
Voluntary control changes the shape of the distributions (Van Ee, Noest, Brascamp
& van den Berg, 2006). These observations question whether gamma distributions
are truly a mechanism of binocular rivalry, and therefore perception. Thus, the
validity of gamma-distribution-based computer models to describe the neural events
during binocular rivalry have been questioned (Brascamp, van Ee, Pestman & van
den Berg, 2005; Brascamp et al., 2006; Kobayashi, 1992; Murata, Matsui, Miyauchi,
Kakita & Yanagida, 2003; Sugie, 1982).
1.5.1 Stimulus parameters moderate binocular rivalry
Investigations into the binocular rivalry phenomenon have spanned a century
with most attention on the effect of stimulus features on binocular rivalry. ‘Strong’
Literature Review - Visual Processing in Schizophrenia and Binocular Rivalry 25
figures (in terms of figure-ground contrast) are thought to alternate more quickly
than ‘weak’ (figure-ground contrast) when viewed stereoscopically (Alexander,
1951) and rivalry rate is faster the more disparate the competing stimuli (Whittle,
1965). Additionally, changing the temporal frequency, spatial frequency or contrast
of an image at the beginning of suppression alters the course of binocular rivalry
(Walker & Powell, 1979).
The perception of binocular rivalry stimuli depends on temporal and spatial
frequency, contrast and luminance of the rival stimuli (Lui, Tyler & Schor,1992),
along with the size (Blake, O’Shea & Muller, 1992; O’Shea et al., 2009) colour
(Andrews & Purves, 1997; Hong & Shebell, 2008a; O’Shea & Williams 1996; Ooi &
Loop, 1994; Wade, 1975), orientation (O’Shea, 1997; Andrews & Purves, 1997;
Blake & Lema, 1978) and context of each image (Blake, 2001; Carter, Campbell, Lui
& Wallis, 2004; Hong & Shevell, 2008b).
1.5.1.1 Spatial frequency.
The spatial frequencies that produce the crispest binocular rivalry are those
between 2 cycles per degree (cpd) (Carlson & He, 2000) and 10 cpd (Livingstone &
Hubel, 1987). When the spatial frequency of the stimuli presented to each eye is
equal, gratings of high spatial frequency (and especially those of low contrast) tend
to fuse to produce a stable perception of a dichoptic plaid (Burke, Alais &
Wenderoth, 1999). Lower spatial frequency gratings typically alternate. The greater
the difference between the spatial frequencies of the stimulus presented to each eye,
the faster the binocular rivalry rate (O’Shea, 1997; Wade 1994). O’Shea (1997)
noted that when exclusive visibility of one grating relative to the other was plotted,
an inverted U-shaped relationship with spatial frequency emerged. The peak of this
curve shifted to larger spatial frequencies as the field size increased (O’Shea, Sims &
26 Literature Review - Visual Processing in Schizophrenia and Binocular Rivalry
Govam, 1997). These findings suggest that spatial frequency channels in human
vision are employed during binocular rivalry (Fahle, 1982), where each spatial-
frequency-dependent cortical column inhibits only the adjacent column (Aladi,
1976). Each cortical column is a basic unit for sensory processing, containing
neurons with similar spatial-response properties stacked on top of each other in
different layers throughout the depth of the cortex.
1.5.1.2 Movement.
Flickering images, eye blink and moving stimuli all produce transient
stimulation across the retina (Blake & Fox, 1974). A moving image (irrespective of
speed and direction) presented to one eye remains visible for longer than a static
image presented to the other (Blake, Yu, Lokey & Norman 1998; Wade, 1994).
Moving rivalrous stimuli presented at equal strength to each eye, lead to a greater
suppression than static patterns (Norman, Norman & Bilotta, 2000; Cobo-Lewis,
Gilfory & Smallwood, 2000).
1.5.1.3 Luminance.
Dominance or suppression of rival images is determined by the relative image
luminance contrast between the two eyes, with dominance of the higher-contrast
image being favoured (Freeman & Nguyen, 2001; Mueller & Blake, 1989; Whittle,
1965). Blurred patterns are suppressed by sharply-focused ones (Fahle, 1982), and
textured stimuli of high contrast (randomly-orientated patches) are more dominant
than uniform textures (Bonneh & Sagi, 1999). Functional magnetic resonance
imaging studies (fMRI) indicate that when luminance contrast is increased in one
eye, activity in the primary visual cortex (V1) increases, and decreases with a lower
contrast image (Polonsky, Blake, Braun & Heeger, 2000). At very low luminance,
Literature Review - Visual Processing in Schizophrenia and Binocular Rivalry 27
rivalry does not occur, allowing a stable summation between the two images to form
(Lui et al., 1992).
1.5.1.4 Colour.
Presenting images of different colours to each eye increases rivalry (Andrews
& Purves, 1997; Hong & Shevell, 2008a; Oois & Loop, 1994; O’Shea & Williams,
1996; Wade, 1975). Long-, medium- (Rogers et al., 1977) and short-cone pathways
all contribute to binocular rivalry (O’Shea & Williams, 1996). However, it has been
shown that opposing gratings that differ with respect to chromaticity can produce a
unified percept of mixed colour at high-luminance contrast (Hong & Shevell, 2006).
Counter phased gratings of different colours, equal in terms of their luminance and
chrominance, produce a single, fused moving grating (Carney, Shadlen & Switkes,
1987).
1.5.1.5 Orientation.
Greater differences in orientation between the two eyes increases binocular
rivalry rate (Andrews & Purves, 1997; O’Shea, 1997). Threshold levels for the
mechanism responsible for suppression operating non-selectively over a wide range
of orientations (Blake & Lema, 1978). It is argued that binocular rivalry occurs early
in the visual pathway as orientation-selective channels are monocularly driven.
Orientation response is hypothesised to be established before the level at which the
two monocular channels converge (Walker, 1978). Changes during rivalry between
stimuli differing in orientation occur after about 100 msec (P1) (Veser, O’Shea,
Schroger, Trujillo-Barreto & Roeber, 2008). There is some agreement that vertical
gratings predominate over horizontal gratings (vertical gratings are viewed for
approximately 30% longer) (Wade, 1994).

28 Literature Review - Visual Processing in Schizophrenia and Binocular Rivalry
1.5.1.6 Size.
Binocular rivalry is affected by the size of the rival images (O’Shea et al.,
2009). Presenting different-sized stimuli to each eye increases binocular rivalry rate
(Andrews & Purves, 1997), and for a given-sized target exclusive visibility increases
with retinal eccentricity (Blake et al., 1992). The optimal size for targets to gain
exclusive visibility during rivalry is a diameter of 5.3 or 7.3 minutes of visual angle
(Blake et al., 1992), with the target size being inversely proportional to spatial
frequency (O’Shea et al., 1997).
1.5.1.7 Context.
Contradictory contextual information increases dominance duration during
binocular rivalry (Blake, 2001; Carter, Campbell et al., 2004; Hong & Shevell,
2008b). When different objects are presented to each eye at the same location in
visual space, they are likely to rival even if all of the other stimulus features (such as
colour) are identical. Conversely when different, monocular stimuli (with respect to
colour and luminance) represent the same object at the same location in space, fusion
is more likely to result (Andrews & Lotto, 2004).
1.6 Theories of Binocular Rivalry
Two opposing theories have dominated the binocular rivalry phenomenon.
One suggests that binocular rivalry involves inter-ocular competition or “eye rivalry”
(a “bottom-up” theory). While the other suggests binocular rivalry is competition of
the perceptual images higher in the visual cortex or “pattern rivalry” (a “top-down”
theory) - see Blake (1989) and Tong (2001) for reviews. Bottom-up theorists of
binocular rivalry argue the alternation of images during binocular rivalry is due to
events in the early stages of visual perception; that is, in the primary visual pathway
(Tong & Engel, 2001). Detailed investigation of the effect of specific features of the
Literature Review - Visual Processing in Schizophrenia and Binocular Rivalry 29
rival stimuli and manipulation of stimulus features has on the binocular rivalry
phenomena have provided insights into visual information processing at higher levels
of the visual pathway. These insights have informed our understanding of cognition,
memory and executive functioning.
Conversely ‘top-down’ theorists posit that during binocular rivalry the observer
attends to, or selectively concentrates on, one image while ignoring the other. Thus,
higher-level cortical processes influence what the observer perceives. Researchers
investigating binocular rivalry using a ‘top-down’ approach examined the effect that
higher-order cognitive processing (i.e. visual memory, planning and decision
making) has on visual perception (Li, Freeman & Alais, 2005; Logothetis, 1998;
Logothetis et al., 1996).
Theorists have also suggested binocular rivalry involves hierarchical
processing that involve both ‘top-down‘ and ‘bottom-up’ neural processes (Blake &
Logothetis, 2002; Pearson & Clifford, 2005). Others suggest competition between
visual pathways (Carlson & He, 2000; Livingstone & Hubel, 1987; Nguyen,
Freeman & Alais, 2003) or the cortical hemispheres (Carter & Pettigrew, 2003;
Carter et al., 2005; Miller et al., 2000; Miller et al., 2003; Pettigrew & Miller, 1998;
Ngo, Lui, Tilley, Pettigrew & Miller, 2008). Evidence for and against these four
theories (i.e. bottom-up, top-down, pathway and inter-hemispheric processing) will
be critically reviewed.
1.6.1 Bottom-up theories of binocular rivalry.
Evidence drawn from psychophysical studies suggests that binocular rivalry is
fully resolved at the earliest stages of cortical processing in monocular V1 neurons
(Tong & Engel, 2001). Thus, binocular rivalry is hypothesised to be the result of
inter-ocular competition, with suppression and dominance between the two eyes
30 Literature Review - Visual Processing in Schizophrenia and Binocular Rivalry
occurring early in the visual system, where the two neural inputs from the eyes
converge (Levelt, 1965). Central to this model are three basic concepts. Firstly,
signals from each monocular stimulus travel down pathways that connect to
monocular cortical areas to higher areas that subserve perception. Secondly, that at
any one moment during binocular rivalry one of these pathways is suppressed
(neurons along the pathway are suppressed) and, finally, that the depth of
suppression (or the suppression threshold) increases along the suppressed pathway
(Freeman, Nguyen & Alais, 2005).
Tong (2001) presented opposing rival stimuli to each eye and measured the
activity of the area in the primary visual cortex representing the blind-spot using
fMRI. Tong found larger activation in the blind-spot area when gratings presented to
the ipsilateral eye were dominant, as opposed to when they were suppressed. This
suggests that binocular rivalry is resolved within the monocular visual cortex. These
findings indicate V1 may be important for processing conscious visual information.
This is supported by Polonsky et al., (2000) who found that rivalry-related
fluctuations in V1 activity are roughly equal to those observed in other visual areas
(i.e. V2, V3, V3a and V4), indicating that neural mechanisms responsible for
binocular rivalry are localised early in the visual pathway. Therefore, it is possible
that V1 plays a role as a ‘gatekeeper’ of consciousness (Tong & Engel, 2001), and
that neurons in the primary visual cortex have a direct role in visual awareness
(Blake, Tadin, Sobel, Raissian & Chong, 2006). This is further supported by lesion
and inactivation studies (Tong, 2003).
These observations are further supported by single-neuron studies. Single-cell
recordings in the lateral geniculate nucleus (LGN) and area 17 of the cat brain
indicate that switches in perceptual dominance during binocular rivalry depend on

Literature Review - Visual Processing in Schizophrenia and Binocular Rivalry 31
inter-ocular interactions at the level of binocular neurons of the primary visual cortex
(Sengpiel, Blakemore & Harrad, 1995). It is likely that inter-ocular suppression is
directly related to the functional architecture of V1 (interactions between
neighbouring cortical columns) (Sengpiel, Bonhoeffer, Freeman & Blakemore,
2001). This pattern is also observed in human studies (de Labra & Valle-Inclan,
2001). Dominance of one image over the other is thought to result from small
activity differences between channels in the low-level visual cortex (Freeman & Lui,
2009), with the duration of suppression related to the size of the pool of monocular
neurons innervated by the suppressed eye, and to the strength of excitation generated
by the suppressed stimulus (Blake, 1989). When psychophysical studies using fMRI
data are combined, a close association between the dynamics of perception during
rivalry and neural events in human primary visual cortex (V1) are observed,
supporting eye-rivalry theories (Lee, Blake & Heeger, 2005; Nguyen, Freeman &
Wenderoth, 2001). However, it should be noted that neural activity representing the
physical characteristics of a stimulus (sensory neuronal response) does not
necessarily imply that those signals contribute to consciousness (Andrews, 2001) as a
resultant perceptual image.
1.6.2 Visual-evoked potentials (VEPs) in binocular rivalry
Scalp VEPs can be analysed to identify separate responses from monocular and
binocular neurons (Apkarian, Nakayama & Tyler, 1981). Visual-evoked potentials
associated with the perceptual shift in rivalry to perceptual dominance occur with a
corresponding shift in cortical signals (Brown & Norcia, 1997) that correspond to the
time course of activity observed across the retinotopic map in V1 (Valle-Onclan,
Hackley, de Labra & Alvarez, 1999). Dominant patterns produce smaller VEPs early
in the visual pathway (70-240 msec), while suppressed patterns produce activity later
32 Literature Review - Visual Processing in Schizophrenia and Binocular Rivalry
(400-700 msec) (Valle-Inclan et al., 1999). Furthermore, when stimuli differ in
orientation, evoked related potentials occurred after about 100 ms (Veser et al.,
2008). However when the rival stimuli differ in colour, evoked potentials do not
occur until after 200 ms (Veser et al., 2008). This difference suggests that property-
dependent cortical networks influence the timing of visual awareness. It is possible
that neural events in V1 create an endogenous potential (or rivalry-related potential)
that marks the alternation between images (de Labra & Valle-Inclan, 2001). It is
proposed that a p300-like wave response is related to the perceptual shift from the
dominant to the suppressed pattern (or to piecemeal fusion). This event may mark
the breakthrough into awareness of the suppressed eye when attention is captured by
the appearance of a new object into the field of view of that eye (Valle-Inclan et al.,
1999).
1.7 Top- down Theories of Binocular Rivalry
Theorists subscribing to ‘top-down’ models of binocular rivalry argue that each
image during rivalry is available until the late stages of attentional selection. Thus,
binocular rivalry arises from the spontaneous fluctuations in visual attention (Li et
al., 2005; Logothetis, 1998; Logotheties et al., 1996). Binocular rivalry involves
competition between alternative perceptual interpretations at higher levels of analysis
(Logothetis et al., 1996). Neurons that respond to input from both eyes (binocular)
found in higher cortical areas of the visual cortex beyond the primary visual area (Li
et al., 2005), are thought to be responsible for the perceptual alternation of images
that occurs during binocular rivalry (Li et al., 2005; Logothetis, 1998; Logothetis et
al., 1996).

Literature Review - Visual Processing in Schizophrenia and Binocular Rivalry 33
1.7.1 Single-cell studies.
Evidence to support ‘top-down’ processing also includes the results of single-
cell studies. In monkeys trained to respond to perceptions during binocular rivalry
(Logothetis, 1998), correlations between neural activity in many cells of V1, V2 and
especially V4 (which are highly populated with binocular cells) and perceptual
alternation of the rivalling stimuli during rivalry were observed (Leopold &
Logothetis, 1996). Neural firing within the inferior and superior temporal cortices of
monkeys has been interpreted as signalling the change in perception during rivalry,
with the associated response by the monkeys indicating recognition of the stimulus
image (Sewards & Sewards, 2001). This is likely to be due to the computations made
in these same areas (Sewards & Sewards, 2001), where neural activity is thought to
reflect the brain's internal view of objects, rather than the effect of the retinal
stimulus on cells encoding simple visual features (Sheinberg & Logothetis, 1997).
1.7.2 Imaging studies.
Imaging studies using fMRI have revealed an association between the
perceptual alternations during rivalry and frontoparietal cortex activity, thought to
play a central role in conscious perception (Lumer, Friston & Rees, 1998). Other
associations between cortical activity and the perceptual changes during binocular
rivalry have been observed in the visual cortex, medial parietal and left frontal
regions using magnetoencephalography (MEG). Co-activation of occipital and
frontal regions, including anterior cingulate and medial frontal areas, were apparent
when the rival stimulus was dominant (Cosmelli et al., 2004). Tononi and Edelman
(2000) using whole-head MEG measured brain electrical activity by frequency-
tagging the opposing flickering stimuli (temporal frequencies of 7 and 12 Hz) during
binocular rivalry in healthy subjects. They observed widely-distributed activity in the
34 Literature Review - Visual Processing in Schizophrenia and Binocular Rivalry
frontal, parietal, temporal and occipital areas (Tononi, Srinivasanm Russell &
Edelman, 1998).
When house and face stimuli were presented to different eyes, and responses in
the human fusiform face area and parahippocampal place area were measured by
fMRI, responses during binocular rivalry were equal in magnitude to those evoked
by non-rivalrous stimulus (Tong et al., 1998). This suggests that activity in the
fusiform face area and parahippocampal place area reflects the perceived (rather than
the retinal) stimulus, and that neural competition during binocular rivalry has been
resolved prior to these stages of visual processing (Tong et al., 1998). ‘Top-down’
processing may therefore account for slower binocular rivalry rates in subjects with
negative symptoms of schizophrenia observed in response to facial stimuli
(representing four emotional states: happy, sad, angry and neutral) (Yang, Blake &
Park, 2007).
1.7.3 Eye-swapping methodologies.
Investigations incorporating ‘eye swapping’ paradigms into binocular rivalry
have further challenged monocular competition (bottom-up) theories (Ngo, Miller,
Liu & Pettigrew, 2000). Eye-swapping paradigms involve presenting opposing
images of equal strength to each eye, and periodically swapping them between the
two eyes during rivalry (Logothetis et al., 1996). The eye-swapping technique
eliminates perceptual alternations during rivalry because the monocular pathways are
fatigued (Logothetis et al., 1996). Although opposing stimuli are swapped between
the two eyes, images generally stabilise to one eye (Chen & He, 2004), suggesting
that the alternation of images is independent of which eye the information originates
(Person & Clifford, 2005). Perceptual alternations are observed as either slow,
irregular alternations between images (independent of stimulus swapping) or fast,

Literature Review - Visual Processing in Schizophrenia and Binocular Rivalry 35
regular alternations that are time-locked to the stimulus alternations (Silver &
Logothetis, 2006). Some authors suggest that inter-ocular suppression accounts for
the stabilisation effect, rather than the memory of the stimulus (Chen & He, 2004).
Others argue that the brain combines information across multiple visual features to
resolve ambiguities in visual inputs (Silver & Logothetis, 2006).
1.7.4 Neurotransmitter involvement in binocular rivalry.
The observation that pharmacological agents influence binocular rivalry,
including ethanol (Donnelly & Miller, 1995), sodium-amytal and caffeine (George,
1936), has prompted researchers to investigate neurotransmitter involvement. The
traditional hallucinogenic beverage ‘Ayahuasca’ (Carter et al., 2005; Fercska, White,
& Luna, 2003; Frecska, White et al., 2003) affects binocular rivalry via the active
ingredient Psilocybin. This serotoninergic 5HT1A and 5HT2A agonist decreases
binocular rivalry rate in a dose-dependent manner, (Carter et al., 2005; Frecska,
White et al., 2003. Psilocybin has been demonstrated to selectively impair motion
coherence sensitivity for random-dot patterns. This is likely to be mediated by high-
level global motion detectors, but not contrast sensitivity for drifting gratings,
believed to be mediated by low-level detectors (Carter et al., 2004). Binocular
rivalry rate decreases significantly one-to-two hours after oral ingestion (Carter et al.,
2005; Nagamine, Yishino, Miyazaki, Takahashi & Nomura, 2008), and returns to
placebo rates at five to six hours after administration, consistent with the
pharmacokinetics of these compounds (Vollenweider, Vollenweider-
Scherpenhuyzen, Babler, Vogel & Hell, 1998; Vollenweider, Vontobel, Hell &
Leenders, 1999). Similar results have been reported using Tandospurone, a 5HT1A
agonist (Nagamine et al., 2008).
36 Literature Review - Visual Processing in Schizophrenia and Binocular Rivalry
Gamma-aminobutyric acid (GABA) has been suggested to be involved in
binocular rivalry, via suppression of dorsal lateral geniculate nucleus (dLGN) inter-
neurons (Bickford et al., 2008). Selective loss of inter-ocular suppression is
observed in the presence of the GABA antagonist Bicuculline (Sengpiel &
Vorobyov, 2005). Noradrenaline may also have a role in binocular rivalry as
increased pupillary dilation, immediately prior to a switch in perception, reflects
levels of noradrenaline released from the locus coeruleus. The locus coeruleus and
noradrenaline involvement may be via perceptual selection (Einhauser, Stout, Koch
& Carter, 2008).
1.7.5 Monocular rivalry compared to binocular rivalry.
Monocular rivalry differs to binocular rivalry in that one (or both) eyes can
view the two alternative precepts of an image simultaneously. Monocular rivalry
may be observed when viewing a bistable image, such as the Necker Cube, Rubin’s
Vase, or Schroder’s Staircase. Each aspect of the image fluctuates in awareness in a
rhythmical alternation. It is argued that binocular and monocular rivalry is mediated
by a common, high-level mechanism for resolving ambiguity (O’Shea et al., 2009).
However, binocular rivalry is a more automatic, stimulus-driven form of visual
competition than rivalry between bistable images, and is less easily biased by
selective attention (Meng & Tong, 2004) or voluntary control (van Ee, 2005; vand,
Dam & Brouwer, 2005; van Ee et al., 2006).
1.8 Multi-level or Hierarchical Theories
Recent evidence supports a view of rivalry as a series of processes, each
implemented by neural mechanisms at different levels of the visual hierarchy (Blake
& Logothetis, 2002; Pearson & Clifford, 2005) with suppression preceding the
synthesis of subjective contours (Sobel & Blake, 2003). This view suggests multiple

Literature Review - Visual Processing in Schizophrenia and Binocular Rivalry 37
sites of binocular rivalry, each corresponding to analysis of different aspects of the
stimuli (Cobo-Lewis et al., 2000). It is proposed that the brain combines information
across multiple visual features to resolve ambiguities in visual inputs (Solver &
Logothetis, 2006) at different levels of the visual-processing hierarchy (Pearson,
Tadin & Blake, 2007). Therefore, it is possible that rivalry can operate at both the
monocular and binocular levels (Pearson & Clifford, 2004); with both high- and low-
level processes being involved in binocular rivalry perception (Carter, Campbell et
al., 2004). Connections between V1 and higher areas form functional circuits that
are thought to support awareness (Tong, 2003), with synchronisation in cortical
neurons being necessary for the establishment of perceptual states and awareness of
sensory stimuli (Engel, Fries, Konigm Brecht & Singer, 1999). Tong (2003) noted
that damage to V1 disrupts the flow of information to extrastriate areas that are
crucial for awareness.
1.8.1 Visual pathway theories of binocular rivalry
1.8.1.1 Monocular and binocular pathways.
The existence of paired monocular and binocular neural pathways that project
to dorsal and lateral streams has been the focus of many binocular rivalry
researchers. It has been suggested that binocular rivalry suppression occurs at a
number of stages along both the monocular and binocular cortical pathways, with
suppression increasing as the visual signal progresses along these pathways (Nguyen
et al., 2003). Wolfe (1986) suggests these two pathways constitute a ‘rivalry only’
pathway and a ‘stereopsis’ pathway, with the mechanisms responsible for binocular
rivalry closely associated with those responsible for stereopsis. Similarly, Barker,
Meese and Summers (2007) conceptualised these two pathways as a ‘within-eye’
(ipsiocular) pathway and a ‘between-eye’ (interocular) pathway, and suggested the
38 Literature Review - Visual Processing in Schizophrenia and Binocular Rivalry
inter-ocular pathway may be a sound candidate for binocular rivalry. It is possible
that rivalry can operate at both monocular and binocular levels (Pearson & Clifford,
2004), and that binocular rivalry and stereopsis can coexist at the same spatial
location (Blake, Yang & Wilson, 1991). Perhaps binocular rivalry always occurs,
even when the two monocular images are identical, but only becomes apparent when
the two monocular images differ (Blake et al., 1988). Hence, the perception of one
image over the other during binocular rivalry is due to inter-ocular suppression
between the two eyes, rather than the memory of the stimulus (Chen & He, 2004).
1.8.1.2 Magnocellular and parvocellular pathways.
Magnocellular and parvocellular neurons originate in the retina and project to
the dLGN, forming distinct visual pathways to V1 and beyond (Livingstone &
Hubel, 1987). Livingstone and Hubel (1987) observed that binocular rivalry
disappears at very high spatial frequencies. They also noted that two half-images
differing in colour but were equal in luminance failed to alternate, and so attributed
binocular rivalry to be a function of the magnocellular system. When investigating
the cortical components of the Westheimer function (an increment-threshold curve
based on a luminance hierarchy, described by Gerald Westheimer, 1965). Yu and
Levi (1997) observed that when a disc presented to one eye and ring to the other
flickered experimentally (i.e. were presented under conditions that engage processing
of the magnocellular pathways) binocular rivalry resulted. However, when the
objects were presented under conditions that engaged processing of the parvocellular
pathway (presented continuously), fusion resulted. Further, indirect support of
magnocellular processing in binocular rivalry is that binocular rivalry alternation
frequency peaks for 3 cpd (Hollins, 1980); the spatial frequency at which the
transient (magnocellular) system is most sensitive (Kulikowski & Tolhurst, 1973).

Literature Review - Visual Processing in Schizophrenia and Binocular Rivalry 39
It is possible that binocular rivalry may be due to interactions higher in the
visual cortex within two independent motion channels; one for low velocities (<20
Hz) the dorsal (mainly magnocellular) pathway, and one for higher velocities (>20
Hz) the ventral (manly parvocellular) pathways, rather than between them (van de
Grind, van Hof, van der Smagt & Verstraten, 2001). This is supported by
modulations of single-neuron activity in MT (Logothetis & Schall, 1989) that
correspond with a state of binocular rivalry (Blake et al., 1998). Another
interpretation is that two pathways forming independent binocular interactions
between form (V1) and motion (MT) (Andrews & Blakemore, 2002) may be
responsible for the alternations of visual stimuli in binocular rivalry.
1.8.2 Inter-hemispheric theory of binocular rivalry.
The inter-hemispheric ‘switching’ hypothesis has been proposed as an
alternative model of binocular rivalry (Carter & Pettigrew 2003; Carter et al., 2005;
Miller et al., 2000; Miller et al., 2003; Ngo, 2008; Pettigrew & Miller, 1998). This
hypothesis posits that the cortical hemispheres compete for perceptual dominance
during rivalry, rather than the competing visual pathways. The inter-hemispheric
switching hypothesis suggests that synchronised activation of homologous areas of
each cerebral hemisphere alternate, by means of a bistable oscillator circuit that
straddles the midline of the ventral tegmentum (Pettigrew, 2001). This oscillator
may be responsible for timing aspects of all forms of perceptual rivalry and may be
linked to circadian rhythms, despite their different periodicities (Pettigrew & Carter,
2005).
Support for this comes from experiments using cold vestibular stimulation and
the application of transmagnetic stimulation to one of the hemispheres during
binocular rivalry. Cold vestibular stimulation during binocular rivalry stimulates

40 Literature Review - Visual Processing in Schizophrenia and Binocular Rivalry
shifts of attention (Miller et al., 2000) and increases the predominance of the face
stimuli (over other types of stimuli), partially supporting brain imaging lateralisation
reports (Miller, 2001). The application of trans-magnetic stimulation to one
hemisphere can trigger a switch in stimulus predominance, suggesting that inter-
hemispheric switching involves alternating uni-hemispheric attentional selection of
neuronal processes for access to visual consciousness (Miller, 2001). This is
supported by fMRI studies, during cold-caloric vestibular stimulation (stimulating
vestibules by applying cold water to the ear cannel) during rivalry, that indicate
perceptual rivalry engages high-level cortical structures that mediate uni-hemispheric
attentional selection (Ngo et al., 2008).
Although supporters of the inter-hemispheric switching hypothesis propose that
binocular rivalry involves competition between higher cortical processes, there are
those that argue that inter-hemispheric involvement may support low-level
processing. It has been demonstrated that visual processes similar to rivalry occur in
the left and right hemispheres of two split-brain observers, consistent with switching
being mediated by low-level processes within each hemisphere (O’Shea & Corballis,
2005a, 2005b). Mechanisms low in the visual system, where the two hemispheres
conduct similar analyses of each half of the visual space (O’Shea & Corballis, 2001),
compete for perceptual dominance. Faster binocular rivalry rate has been observed
when stimuli were presented to the right visual field rather than the left, suggesting
the rivalry may be driven by retinotopically-local processes; visual analysis in the
left hemisphere may be faster in right-handed people (Chen & He, 2003). Trans-
magnetic stimulation during binocular rivalry has also been observed to effect
retinotopic processes, suggesting that binocular rivalry mechanisms are reliant on
neural activity early in the visual pathway (Pearson et al., 2007), and that the
Literature Review - Visual Processing in Schizophrenia and Binocular Rivalry 41
temporal dynamics during rivalry are likely to be local and hemisphere-specific
processes (He, Carlson & Chen, 2005).
1.9 Summary and introduction to Chapters
This chapter has explored the literature surrounding visual abnormalities that
contribute to visual processing deficits and cognitive disturbances in schizophrenia,
the contemporary theories of binocular rivalry, and the effects of altering stimuli with
respect to movement, colour, spatial frequency and luminance binocular rivalry. It is
apparent that although binocular rivalry has been intensively investigated, and much
is known regarding the physical characteristics that modify binocular rivalry, much
has been left unexplained. Binocular rivalry provides a unique opportunity to
explore visual processes and visual perception, and provides a promising tool to
investigate neurological and mental illness. There are only a few studies that
investigate binocular rivalry in schizophrenia. The limited research available is
contradictory, with some claiming slower binocular rivalry rates (Fox, 1965;
Sappenfield & Ripke, 1961) and others showing no differences (Miller et al., 2003).
The research presented in this Thesis seeks to resolve this discrepancy.
There are many methods of collecting binocular rivalry data. For this study the
binocular rivalry method of Pettigrew and Miller (1998) was selected as it had a
number of advantages over other methods. This method had previously been
demonstrated to reliably collect binocular rivalry data in individuals with mental
illness, providing some comparison data. The characteristic alternation of opposing
perceptual images is easily achieved with minimal training and without the need for
individuals to fix their gaze on a central point. This method allows the stimuli to be
manipulated with respect to colour, luminance, movement and spatial frequency to
investigate specific parts of the visual system.
42 Literature Review - Visual Processing in Schizophrenia and Binocular Rivalry
The selection of the method provides a natural starting point for this research.
Pettigrew and Miller (1998) and Miller et al., (2003) investigated binocular rivalry in
groups of participants with mental illness and controls using two stimulus conditions.
Miller et al., (2003) investigated participants with bipolar disorder, depression,
schizophrenia and controls using low-strength stimuli (stationary, 4 cpd horizontal
and vertical monochromatic lines of 90% luminance contrast). These authors
compared their data with data provided in Pettigrew and Miller (1998) from
participants with bipolar disorder and controls using a high-strength stimulus
(monochromatic 8 cpd vertical and horizontal lines of moving at approximately 4
cps). They noted that alterations to the strength of the stimuli effected binocular
rivalry rate. Because these comparisons were between different groups it is not clear
what the effect of increasing the stimuli strength would have on individuals using
this method of binocular rivalry. The investigation in the next chapter (Chapter 2)
explores this issue.
In Chapter 2, the binocular rivalry stimulus is manipulated to produce
horizontal and vertical lines that vary in their presentation with respect to colour,
movement, spatial frequency and luminance. Stimuli are presented in two colour
conditions (red/black), two temporal conditions (moving or stationary), two spatial
frequency conditions (4 cpd and 8 cpd) and two luminance conditions (low and high)
to investigate stimulus effects in binocular rivalry. A total of 16 stimulus conditions
are tested; two being the same as those reported in Pettigrew and Miller (1998) and
Miller et al., (2003). Stimulus effects are investigated in a group of twenty
participants with no mental illness using a 2X2X2X2 repeat within-group design. In
this chapter the ‘inter-hemispheric switch’ hypothesis of binocular rivalry proposed
by these authors is also investigated.

Literature Review - Visual Processing in Schizophrenia and Binocular Rivalry 43
The disadvantage of the Pettigrew and Miller’s method of binocular rivalry is
that the computer software only allows one image to be presented on the computer
screen. There is no way to adjust the stimuli so that a different stimulus can be
presented to each eye. Thus, opposing orientation of lines (vertical and horizontal) is
the only ‘between eye’ difference that can be achieved. Other methods of binocular
rivalry that use stereoscopes or alternative computer methods allow stimuli different
in colour, spatial frequency, temporal frequency or luminance to be presented
independently to the left and right eyes. This allows the researcher to investigate the
effect that the stimulus presented to one eye has on dominance and suppression that
occurs during binocular rivalry. Many researchers in recent times have taken
advantage of this feature to explore the neural events that occur in binocular rivalry
and reported their data in terms of Levelt’s second proposition. Although it is not
possible to test Levelt’s second proposition, Levelt’s fourth proposition that
“increasing the stimulus strength in both eyes will increase the alternation frequency”
can be tested using in a variety of stimulus conditions. This allows confidence in the
validity of the results.
Pettigrew and Miller and colleagues have proposed that slow binocular rivalry
rate is a trait maker for bipolar disorder and may be an important tool for diagnosis
(see Pettigrew and Miller, 1998 and Miller et al., 2003). However, there are little
data to support this claim, and little support is provided by perceptual rivalry studies.
Krug, Brunskill, Scarna, Goodwin & Parker (2008) refute this claim with respect to
bistable figures. There are only three studies that have investigated classical
binocular rivalry in schizophrenia (Fox, 1965, Miller et al., 2003, Sappenfield &
Ripke, 1961). In order to support Pettigrew and Miller’s claim that slow binocular
44 Literature Review - Visual Processing in Schizophrenia and Binocular Rivalry
rivalry is a trait marker for bipolar disorder, there is a need to demonstrate that slow
binocular rivalry is not present in schizophrenia.
Miller et al., (2003) investigated binocular rivalry in schizophrenia using
stationary, 4 cpd horizontal and vertical monochromatic lines of 90% luminance
contrast in participants who had bipolar disorder, depression or schizophrenia and
controls. They reported no difference in binocular rivalry rate in participants with
schizophrenia compared to controls which is contrary to previous reports (Fox, 1965;
Pettigrew & Miller, 1998; Sappenfield & Pike, 1961; White et al., 2001). They then
compared their data with that provided in Pettigrew and Miller (1998) and with other
published data relating to perceptual rivalry. Participants with schizophrenia were
only tested in one stimulus condition using the binocular rivalry method of Pettigrew
and Miller. In order to extend this work and to settle this discrepancy in the
literature, binocular rivalry is investigated in the current study in participants with
schizophrenia and controls using a ‘within group’ design. This design employs low
and high strength stimuli and a perceptual rivalry task; the Necker cube, a task
frequently reported in the schizophrenia literature.
As previously noted, individuals with schizophrenia experience both subjective
sensory anomalies and objective deficits of sensory function (Brenner, Krishnan &
Vohs et al., 2009) that contribute to many of the symptoms of the disease. They have
marked deficits in visual processing that contribute to perceptual abnormalities,
hallucination and the misinterpretation of perceptual information associated with
delusions. Individuals with schizophrenia have delayed or interrupted visual
processing that may account for many of the negative symptoms, such as poverty of
thought and speech, and decreased reaction to the immediate surrounding
environment (Cadenhead, Geyer, Butler, Perry, Sprock & Braff, 1997; Uhlhaas,
Literature Review - Visual Processing in Schizophrenia and Binocular Rivalry 45
Phillips & Silverstein, 2005). Over-active magnocellular pathways correlate with
poor selective attention, poor concentration, heightened awareness of background
noise and distractibility in individuals with schizophrenia (Hetrick, Erickson, &
Smith, 2010). It is suggested that tasks that combine contrast sensitivity to
magnocellular versus parvocellular biased stimuli may be useful in future
schizophrenia research (Green & Butler, 2009). In section 1.8.1.2 it is noted that the
contribution that magnocellular and parvocellular visual pathways have been
investigated in binocular rivalry, with one (Livingstone & Hubel, 1987) or both of
these systems implicated in initiating perceptual alternations (Yu & Levi, 1997).
However the research in this area is scant. Binocular rivalry stimuli that bias the
magnocellular and parvocellular visual pathways can be achieved by modifying the
stimuli presented to each with respect to luminance contrast, movement, colour and
spatial frequency. This provides a unique opportunity to explore magnocellular and
parvocellular processing in participants with schizophrenia and controls using two
binocular rivalry tasks, one to bias the magnocellular and the other the parvocellular
visual pathways in Chapter 4.
An inter-hemispheric model of binocular rivalry has been proposed that
suggests binocular rivalry is the result of competition between the two cortical
hemispheres that occurs by virtue of an ‘inter-hemispheric switching’ mechanism
(Pettigrew & Miller, 1998). Individuals with schizophrenia deficits in spatial
perception and attention related to right hemisphere functioning (O'Donnell, Potts et
al., 2002) and deficits associated with the transfer verbal information from the right
to the left hemisphere via the corpus callosum (Endrass, Mohr et al., 2002). To
investigate whether abnormal right hemisphere functioning has an effect on
binocular rivalry, binocular rivalry rates recorded by participants with schizophrenia

46 Literature Review - Visual Processing in Schizophrenia and Binocular Rivalry
are compared to the Benton’s Judgment of Line Orientation (BJLO) task (Benton,
Varney & Hamsher, 1978); the BJLO task is widely accepted to be processed within
the right cortical hemisphere in Chapter 5.
One of the limitations to researching schizophrenia is most individuals are
taking at least one antipsychotic medication. For clinical diagnosis of schizophrenia
according to Diagnostic and Statistical Manual of Mental Disorders – Edition 4
(DSM-IV) criteria to be determined, a six-month trial period of an antipsychotic
medication with improvement in symptoms is needed. This makes an investigation
into the role of dopamine in binocular rivalry difficult as antipsychotic medications
block dopamine receptors; in particular the dopamine D2 receptor (Javitt, 2009).
Additionally, many hospital human research ethics committees are reluctant to allow
medications to be withheld from individuals with schizophrenia as they are likely to
experience return of symptoms and a reduction in long term cognitive functioning.
This restricts to investigations in medicated individuals or in un-medicated
individuals in the prodromal phase of schizophrenia; that is, the period before a
definite diagnosis is established. These challenges require novel approaches to the
investigation of neurotransmitter involvement in neural visual processing in
medicated participants.
Given that D2 receptors within the visual system play an important role in
visual functioning, and that schizophrenia has been associated with abnormal D2
receptor density and functioning, it is plausible to examine visual processing
according to genetic variations in D2 receptors. The TaqI A of dopamine D2
receptor (DRD2) gene is a commonly-investigated genetic locus in schizophrenia
(Behravan, Hemayatkar, Toufani & Abdollahian, 2008). Carriers of the A1 allele of
the Taq1 of dopamine D2 receptor (DRD2) gene polymorphisms (A1+ individuals
Literature Review - Visual Processing in Schizophrenia and Binocular Rivalry 47
with A1/A1 or A1/A2 genotypes) typically have a lowered DRD2 density and
diminished function of DRD2 in the striatum, (Kondo, Mihara, Suzuki, Yasui-
Furukori & Kaneko, 2003; Mihara, Kondo et al., 2000; Noble, 2000). The presence
of the A1 allele of the DRD2 receptor gene, and thus the distribution of dopamine
receptors and dopamine function, offers a non-invasive and novel approach to
investigating dopamine involvement in binocular rivalry, explored in the final study
(Chapter 6).


Chapter 2: Altering Binocular Rivalry Rate by Increasing Luminance Contrast and Temporal Frequency: Support for an Oscillation Model of Binocular Rivalry 49
Chapter 2: Altering Binocular Rivalry Rate by Increasing Luminance Contrast and
Temporal Frequency: Support for an Oscillation Model of Binocular Rivalry
2.1 Binocular rivalry
2.1.1 Binocular rivalry rate.
Binocular rivalry rates are stable within individuals over time. High
correlations (above r = 0.8) are evident in binocular rivalry rates recorded weeks, or
years, after the initial test using the same stimulus (Miller et al., 2003, Pettigrew &
Miller, 1998; Pettigrew & Carter, 2005). Large between-individuals differences in
binocular rivalry rates have been reported by a number of authors (Carter et al.,
2005; Leat & Woodhouse, 1987, Miller et al., 2003; Pettigrew, 2001; Ukai, Ando &
Kuze, 2003), indicating that binocular rivalry rate may be determined by an
endogenously-driven individual characteristic.
It has been suggested that the less-frequently investigated binocular rivalry
rate, a measure of the rhythmical alternation between rivalling stimuli, reflects an
inextricable component of all forms of visual perception (Pettigrew & Carter, 2005).
Therefore, rate can be considered a key feature of the binocular rivalry phenomenon.
Pettigrew and Miller (1998) suggest that individuals have an endogenous ‘switch
rate’ or an internal rhythm of perceptual oscillations that remains fairly constant for
an individual, however may be modifiable by alterations made to the strength of the
stimulus. Pettigrew and Miller propose that a switching mechanism, located outside
the visual system, regulates binocular rivalry rate and rhythm. This model predicts
that individuals who have a faster endogenous ‘switch rate’ (‘fast switchers’) will
demonstrate more rapid perceptual alternations than ‘slow switchers’. Furthermore,
as the strength of the stimulus increases, perceptual alternations for ‘fast switchers’
50 Chapter 2: Altering Binocular Rivalry Rate by Increasing Luminance Contrast and Temporal Frequency: Support for an Oscillation Model of Binocular Rivalry
will increase at a more rapid rate than that seen in ‘slow switchers’. Pettigrew (2001)
provides a representation of this model as a figure, but provides no empirical data.
As noted in Chapter 1, binocular rivalry is significantly influenced by the
stimuli used. Subtle changes in the characteristics of the binocular rivalry stimulus
can produce large variations in binocular rivalry rates. Increasing stimulus strength,
achieved by increasing the luminance contrast, spatial frequency, colour and
temporal frequency of the competing stimuli (Breese, 1899; Levelt, 1968)
subsequently increases binocular rivalry rate (Fahle, 1982; O’Shea & Williams,
1996; O’Shea et al., 1997; Rogers, Rogers & Tootle, 1977).
Alternation of images is more rapid, and thus dominance durations are reduced,
when the stimuli presented to each eye vary greatly in terms of luminance contrast
(Mueller & Blake, 1989; Whittle, 1965), velocity (Blake, Aimba & Williams, 1985),
colour (Hong & Shevell, 2006; Rogers & Hollins, 1982; Wade, 1976), and spatial
frequency (Fahle, 1982; Wade, 1976). Presenting conflicting rival stimuli of different
strengths is appropriate when examining the effect of stimulus characteristics on
suppression (or dominance) of one eye’s perceptual image over the other. However,
this may not be the case when the rate or frequency of perceptual alternations is of
primary importance. Experimental evidence of binocular rivalry rate is generally
reliant on the examination of dominance duration, or exclusive visibility of the
competing stimuli, rather than a measure of alternation frequency (Hollins, 1980;
Mueller & Blake, 1989; O’Shea et al., 1997, Whittle, 1965).
To investigate the possibility that binocular rivalry rate is regulated by an
intrinsic rhythm or endogenous ‘switching mechanism’ located outside the visual
system, care must be taken in selecting the binocular rivalry stimuli. Experimental
methods allow binocular rivalry data to be collected in conditions where the stimuli

Chapter 2: Altering Binocular Rivalry Rate by Increasing Luminance Contrast and Temporal Frequency: Support for an Oscillation Model of Binocular Rivalry 51
presented to each eye are equal, to ensure the visual system is not biased to observe
one image over the other. Levelt (1968) suggests that when conflicting stimuli are
presented to each eye equally (in terms of stimulus strength, the rate of alternations
recorded using a two-choice paradigm, and assuming all other things being equal) the
time spent viewing the right-eye (Tr) image will be equal to that spent viewing the
left-eye image (Tl), (so Tr = Tl) with the only effect on Tr or Tl being eye
dominance. In his fourth proposition, Levelt concluded that an, “increase of the
stimulus strength in both eyes will increase the alternation frequency” (Levelt, 1968:
page 76). Levelt defined ‘stimulus strength’ as the, “Amount of contour per area,
and for a constant amount of contour per area, the strength of those contours.”
Examining binocular rivalry rate using Levelt’s fourth proposition is therefore
appropriate to test the hypothesis of Pettigrew’s model, as this hypothesis assumes
that the oscillations occur between two stimuli of equal strength, with no inherent
bias. Collecting binocular rivalry data using the method by Pettigrew and Miller
(1998) presents stimuli of equal strength to each eye, with the orientation of the lines
being the only difference.
There are only a small number of studies in the binocular rivalry literature that
investigate the effect of increasing the strength of the stimuli presented to each eye
equally, and therefore Levelt’s fourth proposition. Alexander demonstrated that
‘stronger’ images will alternate more rapidly than ‘weaker’ images using two
conditions of stimulus strength, broken versus continuous contour, and greater or
lesser contrast between figure and ground (Alexander, 1951). However, luminance
levels and spatial frequency were not quantified. In a later experiment, Hollins
(1980) demonstrated that exclusive visibility increases as contrast increases equally
in both eyes; however this significant difference was only seen for one participant.

52 Chapter 2: Altering Binocular Rivalry Rate by Increasing Luminance Contrast and Temporal Frequency: Support for an Oscillation Model of Binocular Rivalry
In an earlier classic study Breese, using red gratings presented to one eye and green
gratings to the other, demonstrated that binocular rivalry rate increased when
luminance levels were increased from low-intensity light to the brightest intensity
(without dazzle) by the same amount in both eyes (Breese, 1899). Once more,
luminance levels were not quantified, and green gratings were present to one eye
while red gratings were presented to the other adding a colour confound. None of
these studies are recent and provide minimal data to support Levelt’s fourth
proposition, and provide insufficient quantifiable data to assess Pettigrew’s
hypothesis.
2.1.2 Dominance durations.
The distribution of perceptual dominance durations produced during binocular
rivalry tend to be right-skewed. More predictable distributions allow researchers a
greater opportunity to examine the relationship between perceptual awareness and
neural function. It has been widely reported that frequency histograms of perceptual
dominance durations during binocular rivalry approximate a gamma-density function
(Borsellino, De Marco, Allazetta, Rinesi & Bartolini, 1972; Carter & Pettigrew;
2003; De Marco et al., 1977, Levelt, 1968; Logothetis et al., 1996, Miller et al.,
2003; Pettigrew & Miller, 1998; Van Ee et al., 2006). Histograms of perceptual
dominance durations are proposed to fit a gamma distribution more adequately when
there are greater than 150 alternations/time periods recorded (Brascamp et al., 2006).
Thus, better fit would theoretically be achieved with high-strength stimuli, rather
than low-strength stimuli. However, there are a number of authors who have failed to
fit empirical data to the gamma distribution (Brascamp et al., 2005; Cogna, 1973;
Zhou et al., 2004), making this assertion controversial. Testing this proposition and
that of Pettigrew and colleagues, with empirical data may allow us the opportunity to

Chapter 2: Altering Binocular Rivalry Rate by Increasing Luminance Contrast and Temporal Frequency: Support for an Oscillation Model of Binocular Rivalry 53
investigate the interaction between stimulus characteristics and individual variability
in binocular rivalry. Mapping dominance durations, as a behavioural measure of
neural activity in participants with schizophrenia and controls, may provide a greater
understanding of the neural processes involved in the perceptual disturbances
attributed to this disorder.
2.2 Study 1
2.2.1 Aims.
The first aim of this study was to determine if increasing the strength of
rivalling stimuli (vertical and horizontal gratings of equal strength) in terms of
luminance, spatial frequency, colour or movement increased the rate of binocular
rivalry alternation in a group of 20 healthy participants. The second aim was to
determine whether binocular rivalry alternations increase to a greater extent in ‘fast
alternators’ than in ‘slow alternators’ using the binocular rivalry method used by
Pettigrew and Miller (1998) and Miller et al., (2003). A third aim was to determine
whether the perceptual dominance durations of fast alternators would more readily fit
a gamma distribution than those produced by slower alternators, when the gamma
distribution is defined as f(x) = λr / Г(r) xr-1exp (-λx), where Г(r) = (r-1)!
2.2.2 Hypotheses.
The hypotheses tested were:
Increasing the stimulus strength of binocular rivalry stimuli
subsequently increases binocular rivalry rates. Furthermore, these
increases are greater in ‘fast binocular rivalry alternators’ compared to
‘slow binocular rivalry alternators’;
Histograms of perceptual dominance durations derived from faster
alternators would approximate a gamma distribution.

54 Chapter 2: Altering Binocular Rivalry Rate by Increasing Luminance Contrast and Temporal Frequency: Support for an Oscillation Model of Binocular Rivalry
2.3 Method
Before commencing the study, a power analysis was performed to determine
the minimum number of participants required to reject the null hypothesis that,
“Increasing stimulus strength (by increasing spatial frequency, luminance, movement
and colour) does not increase binocular rivalry rate.” The published binocular rivalry
rates reported in healthy participants by Miller et al., (2003) were entered into the
G*power3 program (Faul & Erdfelder, 1992). It was estimated that a sample size of
20 individuals was required for a two-sided 5% significance level and power of 80 to
produce an overall effect.
2.3.1 Participants.
Twenty healthy volunteers, who were screened to exclude neuropsychiatric
disease with the Structured Clinical Interview for the DSM-IV (SCID), were
recruited. Four participants were male, and 16 were female. The age range was 22-
64 years (M = 39.8, SD = 12.97). All participants were right-handed, as assessed
using the Annett Handed Questionnaire (Annett, 1970). All participants had normal
vision (that is, were free from strabismus, astigmatism or eye disease) and 6/6 visual
acuity (corrected or uncorrected) in each eye as assessed by Snellen visual acuity
testing. All participants had normal vision and at least 6/9 visual acuity (corrected or
uncorrected) in each eye assessed by the Snellen visual acuity testing. To reduce any
eye dominance effect related to inter-ocular differences in visual acuity, participants
were excluded from the study if visual acuity in each eye was not equal (to within
two letters). In addition, each participant undertook a keyhole task to determine
sighting eye dominance as described in (Osburn & Klingsporn, 1998).
Written informed consent was provided by each participant prior to the
commencement of testing. Ethical clearance was obtained from the Royal Brisbane

Chapter 2: Altering Binocular Rivalry Rate by Increasing Luminance Contrast and Temporal Frequency: Support for an Oscillation Model of Binocular Rivalry 55
and Women’s Hospital Human Research Ethics Committee, and the Queensland
University of Technology Human Research Ethics Committee. Binocular rivalry
testing took place at an outpatient facility of the Royal Brisbane and Women’s
Hospital and in the Optometry Clinic at the Queensland University of Technology.
2.3.2 Apparatus.
2.3.2.1 Binocular rivalry stimuli.
The binocular rivalry stimuli were presented as a stationary, circular-grid
target, subtending 1.5 of visual angle, generated on a personal computer monitor
using BRtestTM software (BiReme Pty Ltd. Brisbane, Australia). The grid was
achieved by rapidly alternating the two rivalling stimuli (vertical and horizontal
square wave gratings) at 120 Hz (this methodology reduces any Troxler effect; see
(Blake, 2005; Levelt, 1968). The grid was viewed from a distance of three metres
through liquid crystal shutter goggles (NuVisionTM60GX, MacNaughton, Canada).
This system of collecting binocular rivalry data presents horizontal and vertical line
stimuli (square wave gratings) of equal strength to each eye with respect to contour,
luminance, movement and colour, in the same retinal location with minimal
crosstalk; the only difference being the orientation of the lines. The use of liquid
crystal glasses eliminated the need for fixation, and thus required minimal instruction
allowing completely näive participants to experience binocular rivalry and accurately
record their precepts. Additionally, the researcher could manipulate the presentation
of vertical and horizontal lines to either the left or right eye without the participant
being aware, allowing orientation of the lines to be counter-balanced across
participants and stimulus conditions. This eliminates any potential effects of eye
dominance or vertical/horizontal preference.
56 Chapter 2: Altering Binocular Rivalry Rate by Increasing Luminance Contrast and Temporal Frequency: Support for an Oscillation Model of Binocular Rivalry
Luminance and chromaticity levels were measured at a distance of three metres
through the shutter goggles (NuVisionTM60GX , MacNaughton, Canada) by a
luminance colourimeter (model BM-7, Topcon, Japan). The maximum luminance
condition was determined by the maximum luminance capability of the computer
monitor, with luminance levels measured through the goggles being 60% less than
without the goggles. This limited the maximum actual test luminance, and the range
over which luminance could be varied. Average luminance of each stimulus was
calculated as Lmax+Lmin/2. Lmax and Lmin were measured through the shutter
goggles using a 0.2 field to ensure that the black and red/white bars were measured
independently. However, because the 0.2 field covered the entire diameter of the
target bar in the 8 cpd conditions but not in the 4 cpd conditions, slight variations in
the measurements occurred, however these were small (< 0.4 cd/m2) and therefore
the average was taken. Luminance levels for the high-luminance condition were
(Lmax) 9.6 – 10.0cd/m2 and (Lmin) 1.6–1.7 cd/m2. Luminance levels for the low-
luminance condition were (Lmax) 1.9 – 2.2 cd/m2 and (Lmin) 1.4– 1.6 cd/m2.
Average luminance for low-luminance stimuli was 1.6cd/m2, and in the high
luminance stimuli 5.8 cd/m2. Luminance contrast was calculated using Michelson’s
formula, (Lmax-Lmin)/(Lmax +Lmin); 15% for the low- and 68% for high-contrast
conditions in both the red/black and white/black conditions. For consistency,
reported luminance levels were measured from the centre of the field for the vertical
grating. Cross-talk between the goggle lenses was minimal. Lmax was <0.01 cd/m2
when the vertical lines were measured through the horizontal shutter lens (and vice
versa).
To measure the effect of ‘colour’ and achieve equal-strength coloured stimuli
presented to each eye, vertical and horizontal monochromatic lines were presented
Chapter 2: Altering Binocular Rivalry Rate by Increasing Luminance Contrast and Temporal Frequency: Support for an Oscillation Model of Binocular Rivalry 57
on the same background (consistent with (Carter & Pettigrew, 2003; Miller et al.,
2003; Pettigrew & Miller, 1998). White/black versus red/black gratings were chosen
(white stimulating all cones, and therefore theoretically ‘stronger’ than red gratings
that stimulate only medium- and long-wavelength cones). The chromaticity
recordings were consistent for the red and white bars in all stimulus conditions; white
achromatic gratings (x= 0.3102, y= 0.3307) and red chromatic gratings (x= 0.6181,
y= 0.3251). Chromaticity measures reported here were without the goggles, as
recordings through the lenses could not be achieved.
Moving 4 cycles per second (c/s) versus not moving (stationary, 0 c/s) stimuli
were selected to insure comparison of two discrete groups of stimuli; stationary or
not moving with moving stimuli. Ideally, the rivalling stimuli should be presented at
two different temporal speeds (for example, 2 c/s versus 4 c/s). However, because
stimuli are also presented at two different spatial frequencies (4 cpd and 8 cpd),
movement/spatial frequency confound is introduced. Stimuli of 4 cpd and 8 cpd
appear to move at different speeds when temporally modulated at 2 c/s, as do 4 cpd
and 8 cpd stimuli modulated at 4 c/s. It could not be determined with any certainty
that stimuli moving at 4 c/s were moving faster, and therefore produced increased
stimulus strength, than at 2 c/s when using stimuli of two different spatial
frequencies. The moving stimuli were presented at 4 c/s. This was calculated by
counting the number of cycles (one light and dark bar comprising one cycle) that
crossed the side of the stimulus aperture in 10 seconds. One cycle measured 0.25
cpd for the 4 cpd stimuli and 0.125 cpd for the 8 cpd stimuli.
This study provides a number of methodological improvements over previous
classical studies of binocular rivalry. The binocular rivalry method allowed the
manipulation of luminance contrast, spatial frequency, temporal frequency and
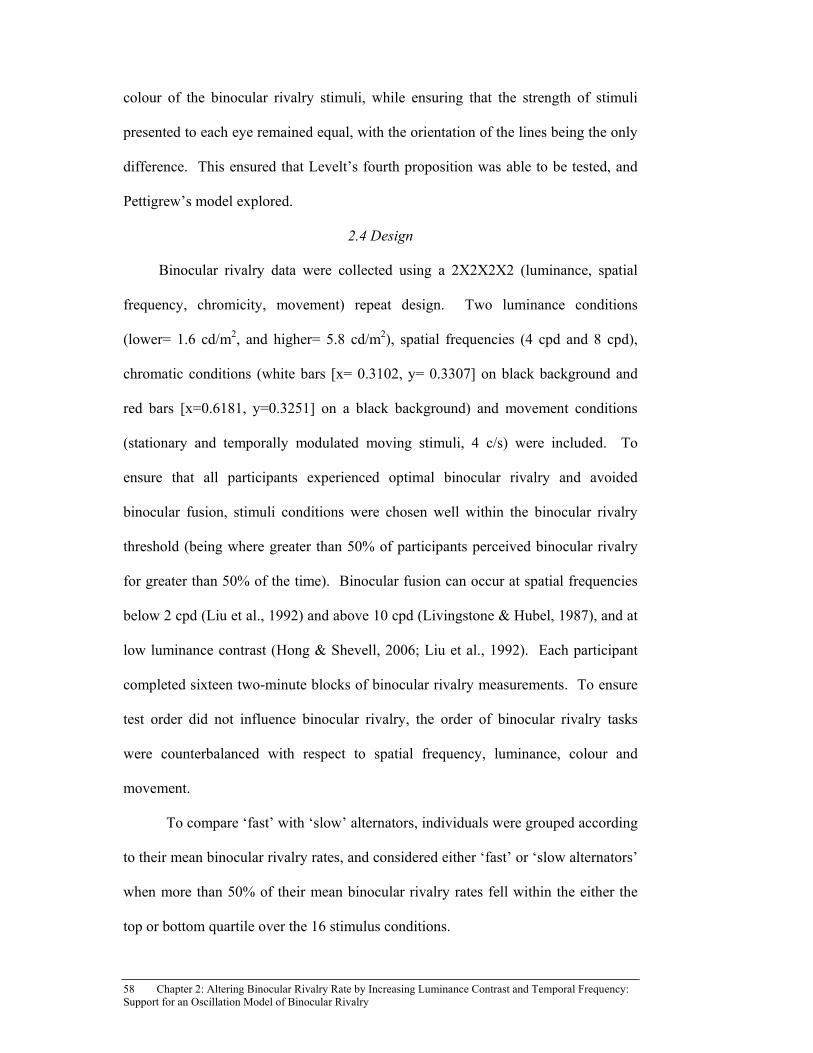
58 Chapter 2: Altering Binocular Rivalry Rate by Increasing Luminance Contrast and Temporal Frequency: Support for an Oscillation Model of Binocular Rivalry
colour of the binocular rivalry stimuli, while ensuring that the strength of stimuli
presented to each eye remained equal, with the orientation of the lines being the only
difference. This ensured that Levelt’s fourth proposition was able to be tested, and
Pettigrew’s model explored.
2.4 Design
Binocular rivalry data were collected using a 2X2X2X2 (luminance, spatial
frequency, chromicity, movement) repeat design. Two luminance conditions
(lower= 1.6 cd/m2, and higher= 5.8 cd/m2), spatial frequencies (4 cpd and 8 cpd),
chromatic conditions (white bars [x= 0.3102, y= 0.3307] on black background and
red bars [x=0.6181, y=0.3251] on a black background) and movement conditions
(stationary and temporally modulated moving stimuli, 4 c/s) were included. To
ensure that all participants experienced optimal binocular rivalry and avoided
binocular fusion, stimuli conditions were chosen well within the binocular rivalry
threshold (being where greater than 50% of participants perceived binocular rivalry
for greater than 50% of the time). Binocular fusion can occur at spatial frequencies
below 2 cpd (Liu et al., 1992) and above 10 cpd (Livingstone & Hubel, 1987), and at
low luminance contrast (Hong & Shevell, 2006; Liu et al., 1992). Each participant
completed sixteen two-minute blocks of binocular rivalry measurements. To ensure
test order did not influence binocular rivalry, the order of binocular rivalry tasks
were counterbalanced with respect to spatial frequency, luminance, colour and
movement.
To compare ‘fast’ with ‘slow’ alternators, individuals were grouped according
to their mean binocular rivalry rates, and considered either ‘fast’ or ‘slow alternators’
when more than 50% of their mean binocular rivalry rates fell within the either the
top or bottom quartile over the 16 stimulus conditions.

Chapter 2: Altering Binocular Rivalry Rate by Increasing Luminance Contrast and Temporal Frequency: Support for an Oscillation Model of Binocular Rivalry 59
2.5 Procedure
Testing took place in dimly lit room (40 lux). Participants were adapted to the
luminance conditions of the binocular rivalry tasks for five minutes, and completed
the low-luminance tasks before completing the high-luminance binocular rivalry
tasks. Participants were seated three metres from the computer screen with the
goggles in place.
They were asked to record binocular rivalry alternations, by pushing a key on a
response keypad, when each image was exclusively dominant (when the image
comprised only vertical or horizontal lines). This method produces a forced two-
choice paradigm consistent with Levelt’s alternation model (1968), where time spent
viewing the right-eye (Tr) image will be equal to time spent viewing the left-eye
image (Tl), (so Tr = Tl), with the only effect on Tr or Tl being eye dominance.
Although in a two-choice forced paradigm the inclusion of mixed images inflates the
period that either the vertical or horizontal image is perceived, this has no effect on
binocular rivalry alternation rate (Blake, 2005; Kovacs & Eisenberg, 2005).
A small experiment was conducted in a subgroup of participants (n = 10) prior
to the main study to compare the accuracy of recording binocular rivalry using a two-
and three-choice paradigm using moving and stationary stimuli. A binocular rivalry
simulation task was developed and presented to ten participants (two males and eight
females) on a personal computer. The two-button task generally produced more
accurate responses than the three-button task (96.5% and 91% correct, respectively)
and seven out of the ten participants reported the two-button task as less confusing.
The frequency of alternations (referred from here on as binocular rivalry rate)
was calculated by dividing the number of button pushes by the total time of rivalry,
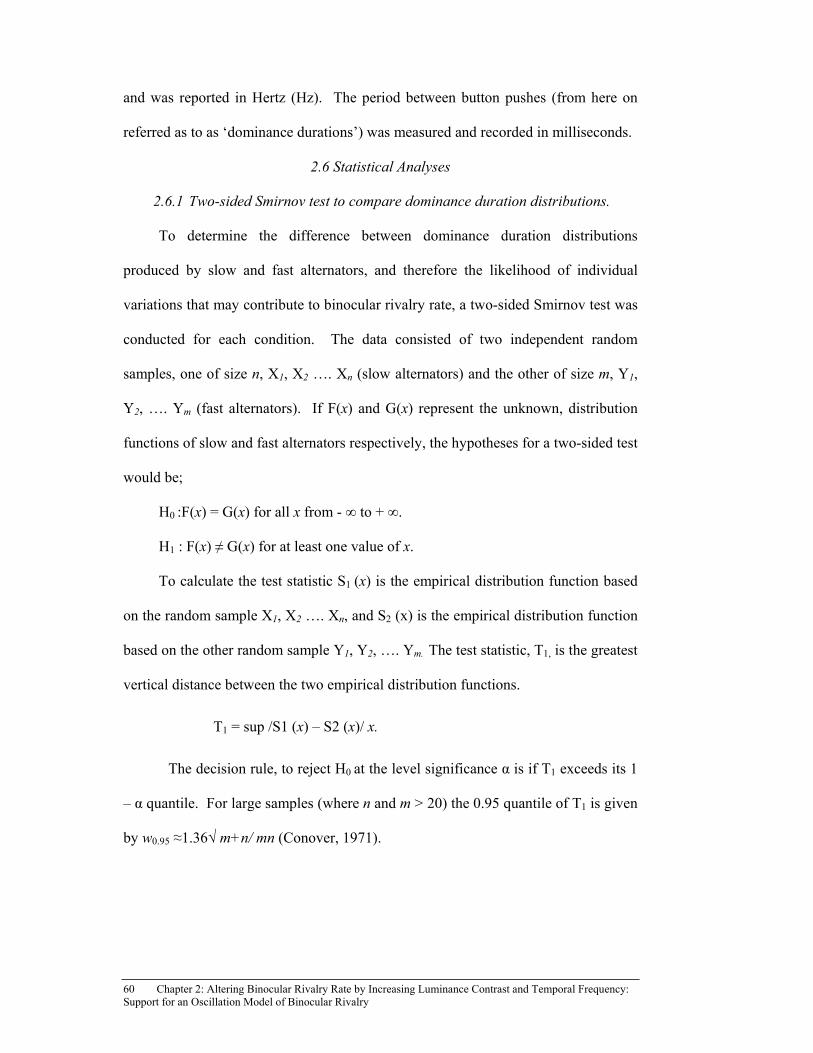
60 Chapter 2: Altering Binocular Rivalry Rate by Increasing Luminance Contrast and Temporal Frequency: Support for an Oscillation Model of Binocular Rivalry
and was reported in Hertz (Hz). The period between button pushes (from here on
referred as to as ‘dominance durations’) was measured and recorded in milliseconds.
2.6 Statistical Analyses
2.6.1 Two-sided Smirnov test to compare dominance duration distributions.
To determine the difference between dominance duration distributions
produced by slow and fast alternators, and therefore the likelihood of individual
variations that may contribute to binocular rivalry rate, a two-sided Smirnov test was
conducted for each condition. The data consisted of two independent random
samples, one of size n, X1, X2 …. Xn (slow alternators) and the other of size m, Y1,
Y2, …. Ym (fast alternators). If F(x) and G(x) represent the unknown, distribution
functions of slow and fast alternators respectively, the hypotheses for a two-sided test
would be;
H0 :F(x) = G(x) for all x from - ∞ to + ∞.
H1 : F(x) ≠ G(x) for at least one value of x.
To calculate the test statistic S1 (x) is the empirical distribution function based
on the random sample X1, X2 …. Xn, and S2 (x) is the empirical distribution function
based on the other random sample Y1, Y2, …. Ym. The test statistic, T1, is the greatest
vertical distance between the two empirical distribution functions.
T1 = sup /S1 (x) – S2 (x)/ x.
The decision rule, to reject H0 at the level significance α is if T1 exceeds its 1
– α quantile. For large samples (where n and m > 20) the 0.95 quantile of T1 is given
by w0.95 ≈1.36√ m+n/ mn (Conover, 1971).

Chapter 2: Altering Binocular Rivalry Rate by Increasing Luminance Contrast and Temporal Frequency: Support for an Oscillation Model of Binocular Rivalry 61
2.7 Results
2.7.1 Binocular rivalry rate.
Binocular rivalry rates were normally distributed so parametric analyses were
used. Test conditions included two levels of luminance (lower and higher),
stationary and moving, two spatial frequencies (4 cpd and 8 cpd), and achromatic
(white) and chromatic (red) bars. Individual differences in mean binocular rivalry
rates recorded across the 16 stimulus conditions ranged from 0.26 Hz to 0.89 Hz.
The slowest individual binocular rivalry rate (0.11 Hz) was recorded using the
stationary 8 cpd coloured stimuli of low luminance, while the fastest individual
binocular rivalry rate (1.32 Hz) was recorded using the achromatic, stationary, and
high-luminance 8 cpd stimulus.
Figure 2.1 shows binocular rivalry rates for each participant across the 16
stimulus conditions. Examination of Figure 2.1 shows that altering the binocular
rivalry stimuli characteristic affects binocular rivalry rate more in some participants
than seen in others. For example, participant six (M = 0.321 Hz, SD = 0.042 Hz,
min 0.27 Hz, max 0.42 Hz, range 0.15 Hz) contrasts with participant 13 (M = 0.901
Hz, SD = 0.247 Hz, min 0.43 Hz, max 1.32 Hz, range 0.89 Hz).
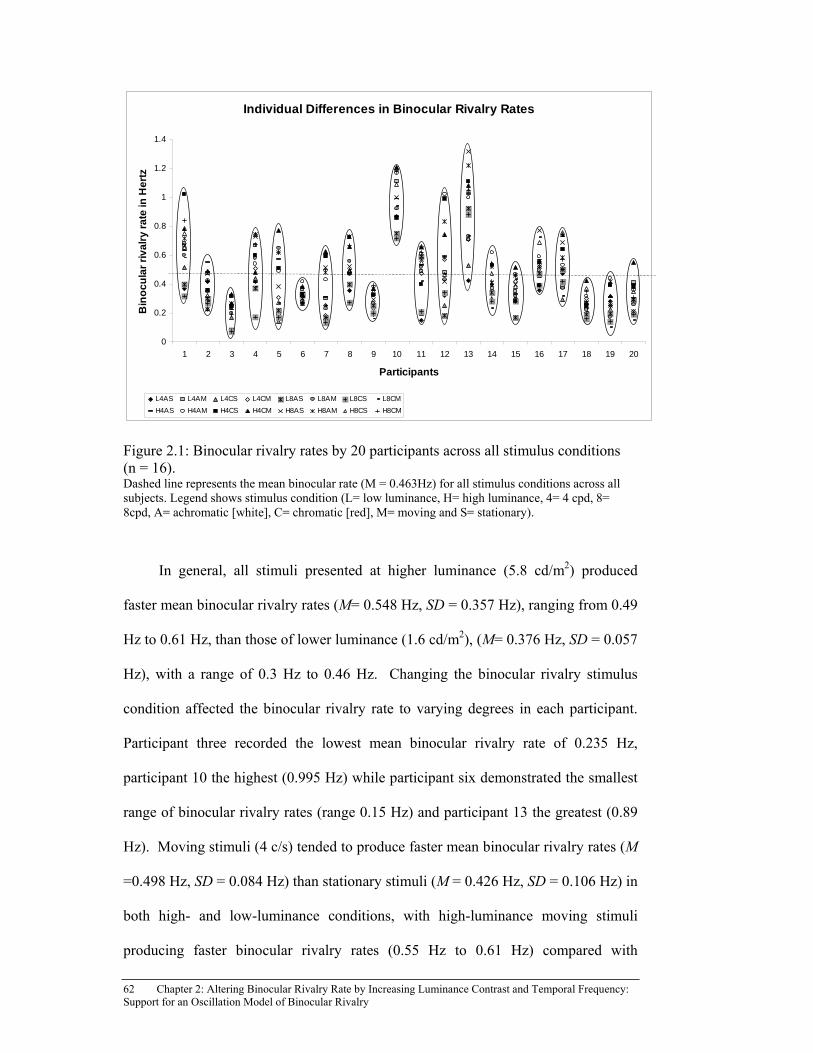
62 Chapter 2: Altering Binocular Rivalry Rate by Increasing Luminance Contrast and Temporal Frequency: Support for an Oscillation Model of Binocular Rivalry
Individual Differences in Binocular Rivalry Rates
0
0.2
0.4
0.6
0.8
1
1.2
1.4
1 2 3 4 5 6 7 8 9 10 11 12 13 14 15 16 17 18 19 20
Participants
Bin
oc
ula
r ri
va
lry
ra
te in
He
rtz
L4AS L4AM L4CS L4CM L8AS L8AM L8CS L8CM
H4AS H4AM H4CS H4CM H8AS H8AM H8CS H8CM
Figure 2.1: Binocular rivalry rates by 20 participants across all stimulus conditions (n = 16). Dashed line represents the mean binocular rate (M = 0.463Hz) for all stimulus conditions across all subjects. Legend shows stimulus condition (L= low luminance, H= high luminance, 4= 4 cpd, 8= 8cpd, A= achromatic [white], C= chromatic [red], M= moving and S= stationary).
In general, all stimuli presented at higher luminance (5.8 cd/m2) produced
faster mean binocular rivalry rates (M= 0.548 Hz, SD = 0.357 Hz), ranging from 0.49
Hz to 0.61 Hz, than those of lower luminance (1.6 cd/m2), (M= 0.376 Hz, SD = 0.057
Hz), with a range of 0.3 Hz to 0.46 Hz. Changing the binocular rivalry stimulus
condition affected the binocular rivalry rate to varying degrees in each participant.
Participant three recorded the lowest mean binocular rivalry rate of 0.235 Hz,
participant 10 the highest (0.995 Hz) while participant six demonstrated the smallest
range of binocular rivalry rates (range 0.15 Hz) and participant 13 the greatest (0.89
Hz). Moving stimuli (4 c/s) tended to produce faster mean binocular rivalry rates (M
=0.498 Hz, SD = 0.084 Hz) than stationary stimuli (M = 0.426 Hz, SD = 0.106 Hz) in
both high- and low-luminance conditions, with high-luminance moving stimuli
producing faster binocular rivalry rates (0.55 Hz to 0.61 Hz) compared with

Chapter 2: Altering Binocular Rivalry Rate by Increasing Luminance Contrast and Temporal Frequency: Support for an Oscillation Model of Binocular Rivalry 63
stationary stimuli (0.49 Hz to 0.55 Hz). Mean binocular rivalry rates across the 16
stimulus conditions are shown in Figure 2.2.
To ensure that the low- and high-stimulus strength conditions produced a
difference in binocular rivalry rates and were appropriate to test the hypotheses,
repeated measures ANOVA was performed. Repeated measures ANOVA revealed
that luminance and movement had a significant main effect on binocular rivalry rate,
(F[16,19] = 60.571, p < .001 and F[16,19] = 18.692, p < .001, respectively) and that
spatial frequency and colour had no effect on binocular rivalry rate (F[16,19] =
1.015, p = .326 and F[16,19]=0.82, p = .377 respectively). As declines in the visual
system may occur with age, age was added as a covariate, the significant main effect
for movement remained (F(1,18) = 18.677, p < .001), but was reduced to a trend for
luminance contrast (F(1,18) = 4.188, p = .056). Gender, eye dominance and
handedness showed no effect (p > .05).
0.00
0.10
0.20
0.30
0.40
0.50
0.60
0.70
0.80
0.90
1.00
4cpd/White 4cpd/Red 8cpd/White 8cpd/Red 4cpd/White 4cpd/Red 8cpd/White 8cpd/Red
Stationary Moving
BR
Rat
e in
Hz
Low Luminance High Luminance
Figure 2.2: Mean binocular rivalry rates (n = 20) across the 16 stimulus conditions. Note: Error bars show standard error.
64 Chapter 2: Altering Binocular Rivalry Rate by Increasing Luminance Contrast and Temporal Frequency: Support for an Oscillation Model of Binocular Rivalry
Normalised dominance durations (time periods between button pushes,
measured in milliseconds expressed as fractions of their means), approximated a
gamma-density function (Carter & Pettigrew, 2003; Logothetis et al., 1996, Miller et
al., 2003). When histograms of the normalised dominance durations of the 16
stimulus conditions were drawn, typical right-skewed distributions resulted. To
determine whether these empirical binocular rivalry data approximated a gamma-
density function, a one-sample Kolmogorov-Smirnov goodness-of-fit test was
performed against the normalised dominance durations for each of the 16 stimulus
conditions, using the Statistical Analysis System (SAS®) computer software. Only
one of the 16 stimulus conditions (the stationary, low-luminance, achromatic of 4 c/d
condition) demonstrated an acceptable fit to the gamma density function
(Kolmogorov-Smirnov D = 0.0288, p = .140). The other conditions demonstrated an
unacceptable fit (p < .05) to the gamma-density function (a p value of greater than
.05, demonstrating a good fit).
2.7.2 Fast versus slow alternators (binocular rivalry rate).
Because colour and spatial frequency did not have a significant main effect on
binocular rivalry rate, mean binocular rivalry rates calculated from the original
analyses were averaged across the conditions of colour and spatial frequency, leaving
luminance and movement. A second analysis was then performed to determine
whether participants who had slower binocular rivalry alternations (‘slow
alternators’) were less affected by changes to stimulus conditions compared to those
with faster binocular rivalry alternations (‘fast alternators’), as proposed by Pettigrew
(2001). The mean binocular rivalry rate of the 320 trials (20 participants x 16
conditions) was 0.41 Hz. ‘Fast alternators’ (n = 3) were those who recorded
binocular rivalry rates within the fastest 25% quartile (with mean binocular rivalry

Chapter 2: Altering Binocular Rivalry Rate by Increasing Luminance Contrast and Temporal Frequency: Support for an Oscillation Model of Binocular Rivalry 65
rates > 0.58 Hz) in more than 50% of the 16 stimulus conditions. ‘Slow alternators’
(n = 3) recorded mean rates within the slowest 25% quartile (with mean binocular
rivalry rates <0.28 Hz) in more than 50% of the 16 stimulus conditions. The
resultant ‘fast’ and ‘slow’ groups were similar with respect to age (mean ages of 37
years and 42 years, respectively). The fast group comprised of three females and the
slow group of one male and two females. The resulting analysis was a 2 X 2 X 2
design (luminance, movement and group).
Repeated measures ANOVA revealed there was a between-participant effect in
binocular rivalry rates (F[1] = 8.201, p = .006) when stimulus strength was increased
by increasing luminance and movement. However, within-participant analyses
revealed an overall difference in binocular rivalry rates between the fast and slow
groups when luminance was increased (F[1] = 8.092, p = .047) but not when
movement was increased (F[1] = 0.774, p = .429). Paired samples t-tests revealed
significant differences between binocular rivalry rates for slow alternators (n = 3)
using stationary stimuli and when stimulus strength was increased from low to high
luminance (t[2] = -10.961, p = .008), and high luminance stimuli with stimulus
strength increasing from stationary to moving (t[2] = -13.0, p = .006). Significant
differences between binocular rivalry rates were observed in stationary stimuli when
stimulus strength was increased from low to high luminance (t (2) = 5.615, p =.03) in
fast alternators (n = 3).
To investigate whether fast binocular rivalry alternators showed a steeper
increase in binocular rivalry rate as stimulus strength increased, the difference in
binocular rivalry rate recorded at low and high stimulus strength was calculated and
compared in each of the four stimulus conditions; stationary, moving, low and high
luminance stimuli conditions and presented graphically in Figure 2.3.
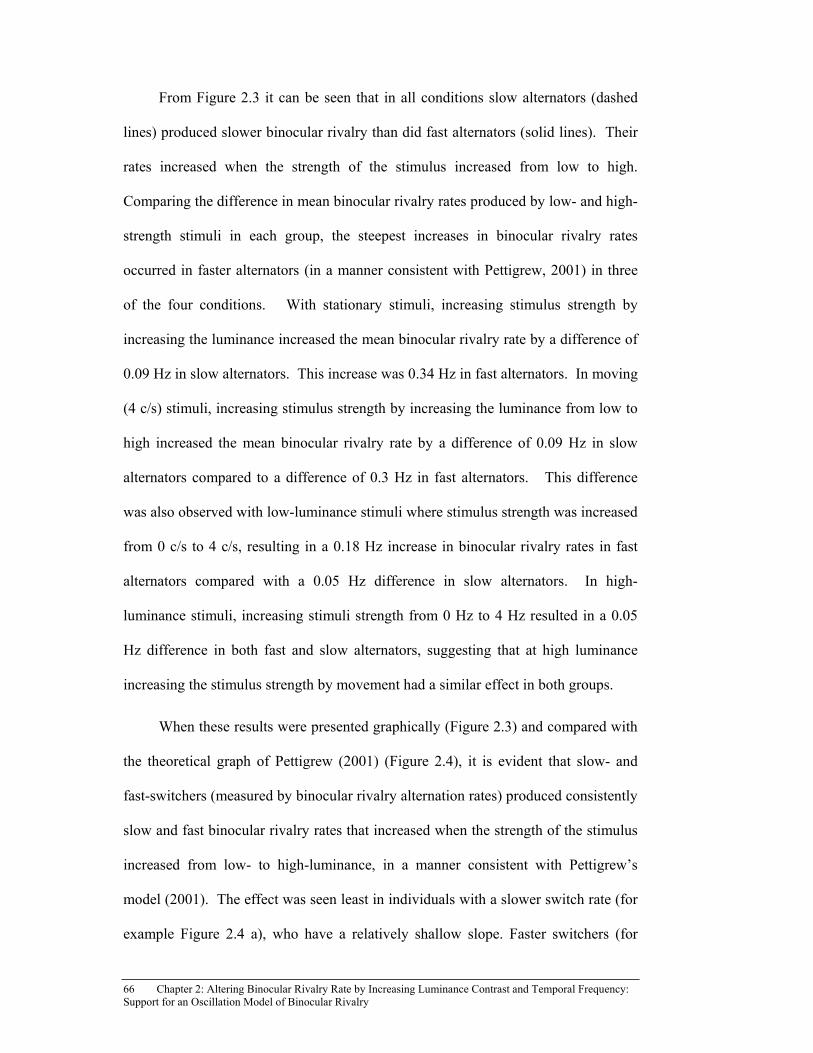
66 Chapter 2: Altering Binocular Rivalry Rate by Increasing Luminance Contrast and Temporal Frequency: Support for an Oscillation Model of Binocular Rivalry
From Figure 2.3 it can be seen that in all conditions slow alternators (dashed
lines) produced slower binocular rivalry than did fast alternators (solid lines). Their
rates increased when the strength of the stimulus increased from low to high.
Comparing the difference in mean binocular rivalry rates produced by low- and high-
strength stimuli in each group, the steepest increases in binocular rivalry rates
occurred in faster alternators (in a manner consistent with Pettigrew, 2001) in three
of the four conditions. With stationary stimuli, increasing stimulus strength by
increasing the luminance increased the mean binocular rivalry rate by a difference of
0.09 Hz in slow alternators. This increase was 0.34 Hz in fast alternators. In moving
(4 c/s) stimuli, increasing stimulus strength by increasing the luminance from low to
high increased the mean binocular rivalry rate by a difference of 0.09 Hz in slow
alternators compared to a difference of 0.3 Hz in fast alternators. This difference
was also observed with low-luminance stimuli where stimulus strength was increased
from 0 c/s to 4 c/s, resulting in a 0.18 Hz increase in binocular rivalry rates in fast
alternators compared with a 0.05 Hz difference in slow alternators. In high-
luminance stimuli, increasing stimuli strength from 0 Hz to 4 Hz resulted in a 0.05
Hz difference in both fast and slow alternators, suggesting that at high luminance
increasing the stimulus strength by movement had a similar effect in both groups.
When these results were presented graphically (Figure 2.3) and compared with
the theoretical graph of Pettigrew (2001) (Figure 2.4), it is evident that slow- and
fast-switchers (measured by binocular rivalry alternation rates) produced consistently
slow and fast binocular rivalry rates that increased when the strength of the stimulus
increased from low- to high-luminance, in a manner consistent with Pettigrew’s
model (2001). The effect was seen least in individuals with a slower switch rate (for
example Figure 2.4 a), who have a relatively shallow slope. Faster switchers (for

Chapter 2: Altering Binocular Rivalry Rate by Increasing Luminance Contrast and Temporal Frequency: Support for an Oscillation Model of Binocular Rivalry 67
example Figure 2.4 d) show the steepest increase in binocular rivalry rate as a
function of stimulus strength. Generally, binocular rivalry rates increased until
rivalry gave way to a mixed precept; this transition varied between individuals. The
highlighted rectangular area relates to the approximate variation in stimulus strength
of the binocular rivalry stimuli used and depicted in Figures 2.3 and approximate
rivalry rates measured.
A
B
Figure 2.3: The effect of increasing stimulus strength on binocular rivalry rate in ‘slow’ and ‘fast’ alternators: mean binocular rivalry rates recorded by 20 healthy volunteers grouped based on the participants mean binocular rivalry alternation rate, A. The effect of increasing stimulus strength by introducing movement to low and high luminance stimuli in fast (n=3) and slow (n=3) alternators. B. Error bars show standard error.
Data in Figure 2.3 A are rearranged to highlight that binocular rivalry rates increased for both stationary and moving stimuli when stimulus strength was increased by increasing luminance contrast. Note: Error bars show standard error.
Low Luminance
0.24
0.80
0.19
0.62
0.0
0.2
0.4
0.6
0.8
1.0
1.2
0c/s 4c/s
BR
Rat
e in
Hz
High Lumiance
0.33
1.01
0.28
0.96
0.0
0.2
0.4
0.6
0.8
1.0
1.2
0c/s 4c/sB
R R
ate
in H
z
Moving
0.33
1.01
0.24
0.80
0.0
0.2
0.4
0.6
0.8
1.0
1.2
Low Luminance High Luminance
BR
Rat
e in
Hz
LegendFast Slow
Stationary
0.280
0.960
0.19
0.62
0.0
0.2
0.4
0.6
0.8
1.0
1.2
Low Luminance High Luminance
BR
Rat
e in
Hz
*
*
*
Statistically significant *
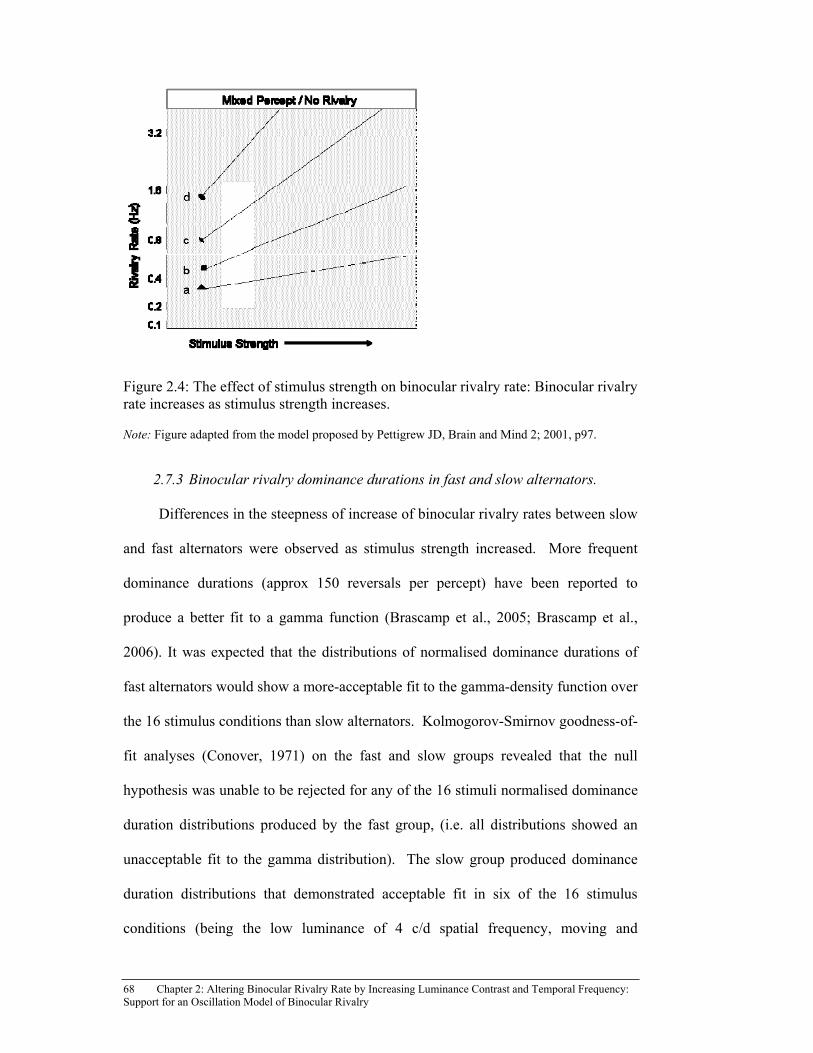
68 Chapter 2: Altering Binocular Rivalry Rate by Increasing Luminance Contrast and Temporal Frequency: Support for an Oscillation Model of Binocular Rivalry
Figure 2.4: The effect of stimulus strength on binocular rivalry rate: Binocular rivalry rate increases as stimulus strength increases.
Note: Figure adapted from the model proposed by Pettigrew JD, Brain and Mind 2; 2001, p97.
2.7.3 Binocular rivalry dominance durations in fast and slow alternators.
Differences in the steepness of increase of binocular rivalry rates between slow
and fast alternators were observed as stimulus strength increased. More frequent
dominance durations (approx 150 reversals per percept) have been reported to
produce a better fit to a gamma function (Brascamp et al., 2005; Brascamp et al.,
2006). It was expected that the distributions of normalised dominance durations of
fast alternators would show a more-acceptable fit to the gamma-density function over
the 16 stimulus conditions than slow alternators. Kolmogorov-Smirnov goodness-of-
fit analyses (Conover, 1971) on the fast and slow groups revealed that the null
hypothesis was unable to be rejected for any of the 16 stimuli normalised dominance
duration distributions produced by the fast group, (i.e. all distributions showed an
unacceptable fit to the gamma distribution). The slow group produced dominance
duration distributions that demonstrated acceptable fit in six of the 16 stimulus
conditions (being the low luminance of 4 c/d spatial frequency, moving and
Chapter 2: Altering Binocular Rivalry Rate by Increasing Luminance Contrast and Temporal Frequency: Support for an Oscillation Model of Binocular Rivalry 69
stationary, chromatic and achromatic conditions; the low luminance, chromatic, 8c /d
moving stimulus and the high luminance chromatic, 8 c/d stationary stimulus).
When these results were presented graphically (Figure 2.5), differences in the
shape of the cumulative frequency distributions of binocular rivalry recordings of
slow switchers compared with fast switchers in nine stimulus conditions can be seen.
Level of significance α is if T1 exceeds its 1 – α quantile. The test statistic, T1, is the
greatest vertical distance between the two empirical distribution functions.
Normalised perceptual dominance durations in fast and slow alternators were
significantly different in nine of the 16 stimulus conditions.

70 Chapter 2: Altering Binocular Rivalry Rate by Increasing Luminance Contrast and Temporal Frequency: Support for an Oscillation Model of Binocular Rivalry
Table 2.1: The Kolmogorov-Smirnov goodness of fit analysis statistics for the dominance duration distributions for fast and slow alternators over 16 stimulus conditions (n=20).
Slow Alternators Fast Alternators
Stimuli KS_T p KS_T p
L4AS 0.0629 *.5 0.1041 .001
L4AM 0.0575 * .5 0.0864 .001
L4CS 0.0928 * .162 0.0821 .002
L4CM 0.0746 * .25 0.0948 .001
L8AS 0.134 .029 0.0948 .001
L8AM 0.1234 .007 0.0848 .001
L8CS 0.1502 .025 0.0918 .001
L8CM 0.0728 * .25 0.0939 .001
H4AS 0.1109 .008 0.1107 .001
H4AM 0.1314 .001 0.098 .001
H4CS 0.1442 .001 0.1095 .001
H4CM 0.1418 .001 0.0974 .001
H8AS 0.1295 .001 0.1244 .001
H8AM 0.1478 .001 0.1025 .001
H8CS 0.0575 * .5 0.1003 .001
H8CM 0.1259 .001 0.06969 .001
Note: Values indicate* p >.05 acceptable fit to Gamma Distribution. Stimuli Legend: L= low luminance, H= high luminance, 4= spatial frequency of 4 c/d, 8= spatial frequency of 8 c/d, A= achromatic white/black gratings, C= coloured red/black gratings, S= stationary 0c/s and M= moving at 4 c/s.
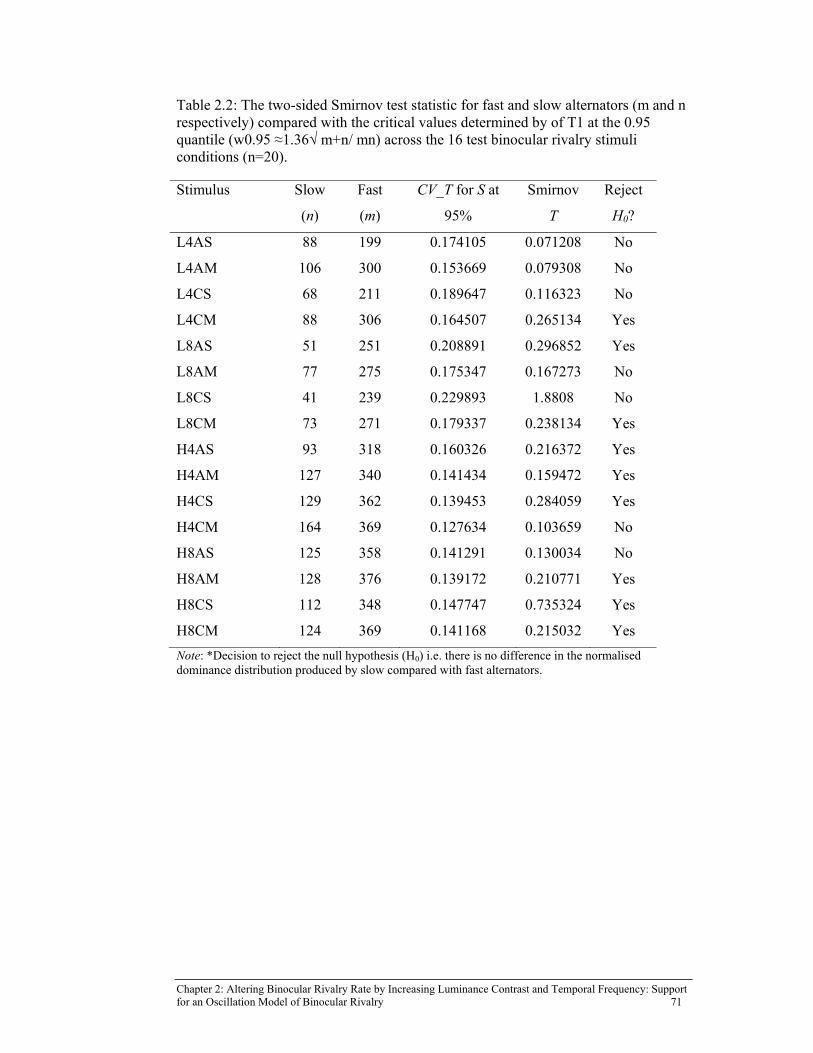
Chapter 2: Altering Binocular Rivalry Rate by Increasing Luminance Contrast and Temporal Frequency: Support for an Oscillation Model of Binocular Rivalry 71
Table 2.2: The two-sided Smirnov test statistic for fast and slow alternators (m and n respectively) compared with the critical values determined by of T1 at the 0.95 quantile (w0.95 ≈1.36√ m+n/ mn) across the 16 test binocular rivalry stimuli conditions (n=20).
Stimulus
Slow
(n)
Fast
(m)
CV_T for S at
95%
Smirnov
T
Reject
H0?
L4AS 88 199 0.174105 0.071208 No
L4AM 106 300 0.153669 0.079308 No
L4CS 68 211 0.189647 0.116323 No
L4CM 88 306 0.164507 0.265134 Yes
L8AS 51 251 0.208891 0.296852 Yes
L8AM 77 275 0.175347 0.167273 No
L8CS 41 239 0.229893 1.8808 No
L8CM 73 271 0.179337 0.238134 Yes
H4AS 93 318 0.160326 0.216372 Yes
H4AM 127 340 0.141434 0.159472 Yes
H4CS 129 362 0.139453 0.284059 Yes
H4CM 164 369 0.127634 0.103659 No
H8AS 125 358 0.141291 0.130034 No
H8AM 128 376 0.139172 0.210771 Yes
H8CS 112 348 0.147747 0.735324 Yes
H8CM 124 369 0.141168 0.215032 Yes
Note: *Decision to reject the null hypothesis (H0) i.e. there is no difference in the normalised dominance distribution produced by slow compared with fast alternators.
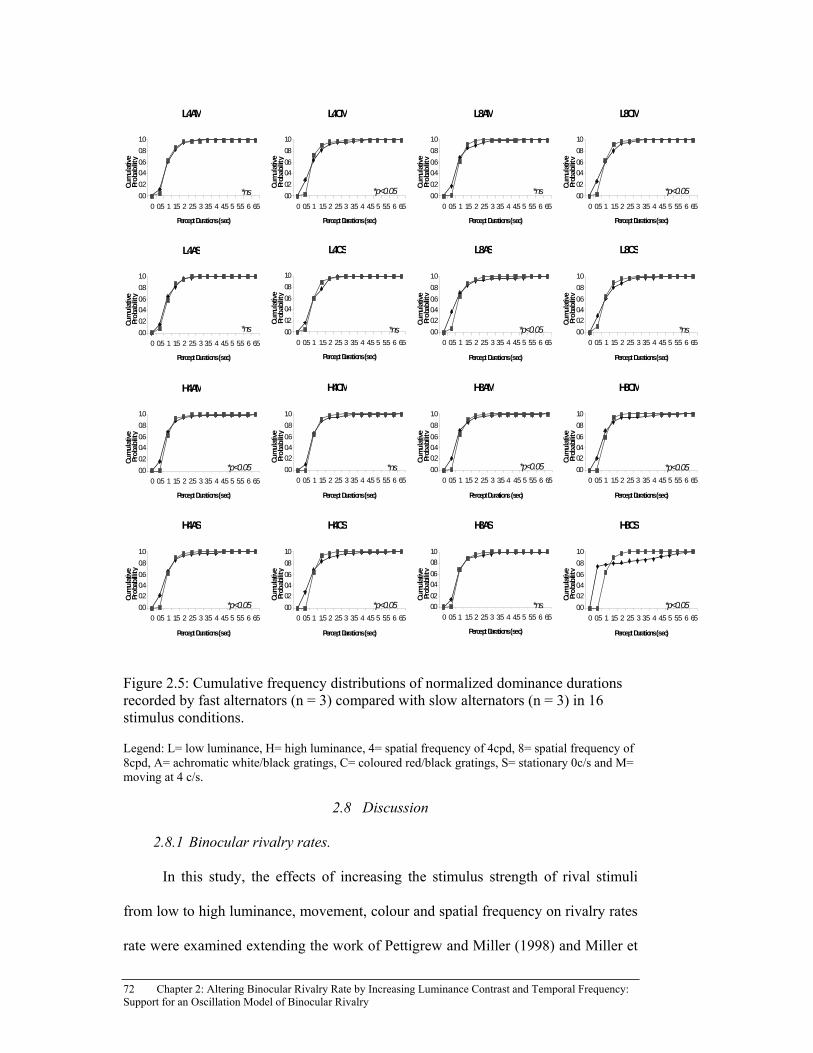
72 Chapter 2: Altering Binocular Rivalry Rate by Increasing Luminance Contrast and Temporal Frequency: Support for an Oscillation Model of Binocular Rivalry
Figure 2.5: Cumulative frequency distributions of normalized dominance durations recorded by fast alternators (n = 3) compared with slow alternators (n = 3) in 16 stimulus conditions.
Legend: L= low luminance, H= high luminance, 4= spatial frequency of 4cpd, 8= spatial frequency of 8cpd, A= achromatic white/black gratings, C= coloured red/black gratings, S= stationary 0c/s and M= moving at 4 c/s.
2.8 Discussion
2.8.1 Binocular rivalry rates.
In this study, the effects of increasing the stimulus strength of rival stimuli
from low to high luminance, movement, colour and spatial frequency on rivalry rates
rate were examined extending the work of Pettigrew and Miller (1998) and Miller et
L4AM
0.0
0.2
0.4
0.6
0.8
1.0
0 0.5 1 1.5 2 2.5 3 3.5 4 4.5 5 5.5 6 6.5
Percept Durations (sec)
Cum
ulat
ive
Prob
abilit
y
L4CM
0.0
0.2
0.4
0.6
0.8
1.0
0 0.5 1 1.5 2 2.5 3 3.5 4 4.5 5 5.5 6 6.5
Percept Durations (sec)
Cum
ulat
ive
Prob
abili
ty
L8AM
0.0
0.2
0.4
0.6
0.8
1.0
0 0.5 1 1.5 2 2.5 3 3.5 4 4.5 5 5.5 6 6.5
Percept Durations (sec)
Cum
ulat
ive
Prob
abilit
y
L8CM
0.0
0.2
0.4
0.6
0.8
1.0
0 0.5 1 1.5 2 2.5 3 3.5 4 4.5 5 5.5 6 6.5
Percept Durations (sec)
Cum
ulat
ive
Prob
abili
ty
L4CS
0.0
0.2
0.4
0.6
0.8
1.0
0 0.5 1 1.5 2 2.5 3 3.5 4 4.5 5 5.5 6 6.5
Percept Durations (sec)
Cum
ula
tive
Prob
abili
ty
L8AS
0.0
0.2
0.4
0.6
0.8
1.0
0 0.5 1 1.5 2 2.5 3 3.5 4 4.5 5 5.5 6 6.5
Percept Durations (sec)
Cum
ula
tive
Pro
babi
lity
L8CS
0.0
0.2
0.4
0.6
0.8
1.0
0 0.5 1 1.5 2 2.5 3 3.5 4 4.5 5 5.5 6 6.5
Percept Durations (sec)
Cum
ula
tive
Pro
babi
lity
H4AM
0.0
0.2
0.4
0.6
0.8
1.0
0 0.5 1 1.5 2 2.5 3 3.5 4 4.5 5 5.5 6 6.5
Percept Durations (sec)
Cum
ulat
ive
Prob
abilit
y
H4AS
0.0
0.2
0.4
0.6
0.8
1.0
0 0.5 1 1.5 2 2.5 3 3.5 4 4.5 5 5.5 6 6.5
Percept Durations (sec)
Cum
ula
tive
Prob
abilli
ty
H4CM
0.0
0.2
0.4
0.6
0.8
1.0
0 0.5 1 1.5 2 2.5 3 3.5 4 4.5 5 5.5 6 6.5
Percept Durations (sec)
Cum
ula
tive
Pro
babi
lity
H4CS
0.0
0.2
0.4
0.6
0.8
1.0
0 0.5 1 1.5 2 2.5 3 3.5 4 4.5 5 5.5 6 6.5
Percept Durations (sec)
Cum
ula
tive
Prob
abili
ty
H8AM
0.0
0.2
0.4
0.6
0.8
1.0
0 0.5 1 1.5 2 2.5 3 3.5 4 4.5 5 5.5 6 6.5
Percept Durations (sec)
Cum
ula
tive
Prob
abili
ty
H8CM
0.0
0.2
0.4
0.6
0.8
1.0
0 0.5 1 1.5 2 2.5 3 3.5 4 4.5 5 5.5 6 6.5
Percept Durations (sec)
Cum
ula
tive
Prob
abili
ty
H8AS
0.0
0.2
0.4
0.6
0.8
1.0
0 0.5 1 1.5 2 2.5 3 3.5 4 4.5 5 5.5 6 6.5
Percept Durations (sec)
Cum
ula
tive
Prob
abili
ty
H8CS
0.0
0.2
0.4
0.6
0.8
1.0
0 0.5 1 1.5 2 2.5 3 3.5 4 4.5 5 5.5 6 6.5
Percept Durations (sec)
Cum
ula
tive
Pro
babi
lity
L4AS
0.0
0.2
0.4
0.6
0.8
1.0
0 0.5 1 1.5 2 2.5 3 3.5 4 4.5 5 5.5 6 6.5
Percept Durations (sec)
Cum
ulat
ive
Prob
abilit
y
*ns
*ns *ns
*ns *ns
*ns
*ns*p<0.05 *p<0.05 *p<0.05
*p<0.05 *p<0.05 *p<0.05
*p<0.05 *p<0.05
*p<0.05
Chapter 2: Altering Binocular Rivalry Rate by Increasing Luminance Contrast and Temporal Frequency: Support for an Oscillation Model of Binocular Rivalry 73
al., (2003). Increasing stimulus strength of rival targets, from low to high, equally in
each eye by increasing luminance and movement of the rival targets significantly
increased rivalry rates in healthy volunteers. Significantly faster binocular rivalry
rates were produced for stimuli of higher luminance contrast compared to those of
lower luminance contrast. This is consistent with previous reports where luminance
contrast was increased equally in both eyes (Alexander, 1951; Breese, 1899; Hollins,
1980; Liu et al., 1992; Mueller & Blake, 1989; Whittle, 1965) and when moving (4
c/s) were compared with stationary gratings (Blake et al., 1985). Although Blake,
Sobel and Gilroy (2003) reported longer dominance duration and slower alternation
rates with moving compared to stationary rival stimuli when the stimulus was altered
in only one eye. In the current study spatial frequency and colour had no effect on
binocular rivalry rate. This was unexpected as long- and medium-cone pathways
(Rogers et al., 1977), as well as short-cone pathways (O’Shea & Williams, 1996), are
thought to be able to generate binocular rivalry. No significant differences in
binocular rivalry rates were found for high spatial frequencies (8 cpd) compared with
lower spatial frequencies (4 cpd), consistent with (Blake & Fox, 1974). These results
differed to Fahle (1982), Hollins (1980) Miller et al., (2003) and O’Shea et al.,
(1997), and Levelt’s alternation model (1968) with respect to spatial frequency. It
should be noted that these authors did not hold luminance contrast constant, so this
difference in binocular rivalry rates may reflect spatial frequency/luminance contrast
interactions. The failure to find an increase in binocular rivalry rate as spatial
frequency increased from 4 cpd to 8 cpd cannot be interpreted as evidence that
spatial frequency does not affect binocular rivalry rate, as the range of spatial
frequencies tested was limited (4 cpd versus 8 cpd was used in the current study, as
these spatial frequencies were well within the binocular rivalry frequency threshold).
74 Chapter 2: Altering Binocular Rivalry Rate by Increasing Luminance Contrast and Temporal Frequency: Support for an Oscillation Model of Binocular Rivalry
Stimuli of 1 cpd versus 10 cpd may have produced greater differences than those
noted in the current study.
Regardless of whether individuals were classified as slow or fast switchers,
binocular rivalry rates increased as stimulus strength increased from low to high in
terms of luminance and movement. These findings were consistent with Pettigrew’s
proposed oscillation model in both groups. Moreover, alternation rates in ‘faster
switchers’ increased to a greater extent than in ‘slower switchers’ as stimulus
strength increased from low to high - this is demonstrated by the steeper gradient of
‘faster switchers’ binocular rivalry rates in Figure 2. Although the data presented
here support Pettigrew’s model in terms of the intrinsic nature of binocular rivalry
rate, this study did not examine whether the perceptual alternation between
conflicting images during rivalry is an inter-hemispheric phenomenon resulting from
an oscillatory mechanisms that originates in brainstem (Carter et al, 2005). Other
authors have suggested that reciprocal inhibition oscillators may be responsible for
the binocular rivalry phenomena (Mueller & Blake, 1989). Other oscillation models
of binocular rivalry have been proposed, based on neural oscillation activity
occurring both in the early and late stages of the visual pathway (Laing & Chow,
2002; Lumer, Edelman & Tononi, 1997; Stollemwerk & Bode, 2003; Sohmiya,
Sohmiya & Sohmiya, 1998; Wilson, 2005).
It has been hypothesised that synchronous oscillations, involving all levels of
the visual system, play a major role in the generation of rhythmic activity in
binocular rivalry (Lumer et al., 1997). Oscillatory activity early in the primary visual
cortex has been implicated in binocular rivalry (Lee et al., 2005; Lumer, 1998;
Polonsky et al., 2000), further along the visual pathway in the thalamus and
corticothalamocortical loop (Lumer et al., 1997) and in cortical neurons (Carter et al.,
Chapter 2: Altering Binocular Rivalry Rate by Increasing Luminance Contrast and Temporal Frequency: Support for an Oscillation Model of Binocular Rivalry 75
2005; Cosmelli et al., 2004; Srinivasan, Russell, Edelman & Tononi, 1999).
Cortical-form vision associated with binocular rivalry has been suggested to
comprise multiple, hierarchically-arranged areas with feed-forward and feed-back
interconnections, with neural competition a general characteristic throughout the
form-vision hierarchy (Wilson, 2003). Synchronised oscillations are thought to be
generated in the visual system when concentric circles and parallel lines are
presented half of each form, to opposite eyes, provoking binocular rivalry (Diaz-
Caneja, 1928; O’Shea, 1999). It is thought that these oscillations enable the
dichoptically viewed halves of the one form to be perceived as a whole (Alais,
O’Shea, Mesana-Alais & Wilson, 2000).
Critics of models of binocular rivalry suggest binocular rivalry originates in
early stages of visual processing (V1) and have argued that early stages of visual
processing produce oscillations that are too fast (in the 30 Hz range) to contribute to
the rhythmic alternations of images seen in binocular rivalry. However there is
ample physiological evidence indicating that slower oscillations, at speeds of 1-5 Hz
(reflecting the approximate speed of alternations in binocular rivalry) occur early in
visual processing (Castelo-Branco, Neuenschwander & Singer, 1998; Cosmelli et al.,
2004; Neuenschwander, Castelo-Branco & Singer, 1999; Newman & Grace, 1999;
Rudrauf et al., 2006; Sohmiya et al., 1998; Srinivasan et al., 1999; Srinivasan et al.,
1999; Tononi et al., 1998). If this is the case, then subtle differences in the features
of the rivalling stimuli are likely to increase neural firing, for example changes in
target movement and luminance will result in large individual variations in binocular
rivalry rate (as demonstrated here). Although these data do not enable speculation on
whether the perceptual alternation of competing stimuli that occurs in binocular
rivalry is related to a single switching mechanism in the visual pathway, or is the
76 Chapter 2: Altering Binocular Rivalry Rate by Increasing Luminance Contrast and Temporal Frequency: Support for an Oscillation Model of Binocular Rivalry
result of synchronisation of oscillatory mechanisms along, or in, pathways of the
visual system, the data presented here support a general oscillation model of
binocular rivalry. That is, individuals have an intrinsic binocular rivalry rhythm that
can be modulated with alterations to the stimulus strength.
The main findings of the current study are consistent with physiological studies
that demonstrate an increase in contrast and target movement produces increased
neural activity in the cortex (Freeman, 2003; Livingstone & Hubel, 1988; Logothetis
& Schall, 1989; Sengpiel, Baddeley, Freeman, Harrad & Blakemore, 1998; Sengpiel
et al., 1995). An increase in binocular rivalry rate as luminance increases is thought
to correlate with an increase in the ‘stimulus energy’, therefore increasing the mean
firing rate of early cortical neurons (Hess, Dakin & Field, 1998). It is suggested that
V1 maps reflect the layout of neurons selective for stimulus energy, not for isolated
stimulus features such as orientation, direction, and speed (Mante & Carandini,
2005). No significant increase in binocular rivalry rate was found with increasing
stimulus strength in terms of spatial frequency and colour, which arguably may not
contribute to ‘stimulus energy’. It is therefore possible that increased binocular
rivalry rates associated with an increase in stimulus strength tracks the activity of
these V1 neurons, thus presenting a behavioural measure of neural activity within the
visual system.
2.8.2 Dominance durations.
The second aim of this study was to determine whether the perceptual
dominance durations of faster alternators would more readily fit a gamma
distribution than those produced by slower alternators (as in Brascamp et al., 2005).
The data presented here suggest the opposite. Slower alternators, those who produce
fewer dominance durations, produced normalised dominance-duration distributions

Chapter 2: Altering Binocular Rivalry Rate by Increasing Luminance Contrast and Temporal Frequency: Support for an Oscillation Model of Binocular Rivalry 77
that more frequently predicted a gamma distribution (six of a possible 16 conditions
in slow alternators) compared to none in the fast alternators. Significant differences
were found in the shape of the normalised perceptual dominance durations of fast
and slow alternators in nine of the 16 stimulus conditions (Figure 2.5), which is
cautiously interpreted as suggesting individual physiological differences that effect
binocular rivalry processing.
It is unlikely that the failure to fit dominance durations to a theoretical gamma
distribution function was because the binocular rivalry data from 20 individuals were
pooled. Other authors demonstrated a good fit to theoretical gamma distribution
functions using the method adopted here (Carter & Pettigrew, 2003; Logothetis et al.,
1996; Miller et al, 2003; Pettigrew, 1998). The unacceptable fit of the current data to
the gamma distribution may have resulted from the inclusion of mixed precepts due
to the two-choice method of recording the binocular rivalry perceptions. The
inclusion of mixed perceptions increases the length of the dominance duration, so we
would expect that in slow alternators binocular rivalry data would be less likely to
approximate a gamma distribution than in fast alternators; the results presented here
suggest the opposite. Furthermore, it was noted during pilot testing that recording
data where mixed images were included was more difficult when using moving
stimuli, producing less accurate results, than that seen with stationary stimuli.
When the distribution of normalised dominance durations were compared,
using a two-sided Smirnov test, greater differences were found between slow and
faster alternators at higher luminance contrast (six of the eight stimulus conditions at
high luminance compared to only three in at lower luminance). The fast alternators
recorded significantly shorter dominance durations (with the interval between button
pushes/alternations being less than 1 second) in each condition. This suggests faster

78 Chapter 2: Altering Binocular Rivalry Rate by Increasing Luminance Contrast and Temporal Frequency: Support for an Oscillation Model of Binocular Rivalry
visual processing at high luminance contrast in fast alternators. Thus, fast alternators
are more likely to ‘see’ images of short duration and respond to them (by recording
a response), so will demonstrate faster temporal resolution than slow alternators (see
Di Lollo, Hogben & Dixon, 1994; Dixon & Di Lollo, 1994; Johnson, Nozawa &
Bourassa, 1998; Kawabata, 1994; Schwartz & Winstead, 1988; Schwartz et al.,
1995).
2.8.3 Age.
Age affected the rate of binocular rivalry at low and high luminance in the
study sample. This may be due to age-related visual and luminance contrast deficits
that are consequential of age-induced changes in the optics of the eye and
degeneration of the visual neural pathway (Jackson & Owsley, 2003; Masson et al.,
1993). Other researchers have reported similar effects (Tarita-Nistor, Gonzalez,
Markowitz & Steinbach, 2006; Ukai et al., 2003). The effects of age strengthen the
view that individual physiological characteristics play a role in binocular rivalry.
Although specific conclusions cannot be drawn from the data presented here, it can
be speculated that physiological factors that influence visual processing of luminance
and movement, such as age related changes in dopamine and GABA activity
(Djamgoz, 1997) may play a significant role in binocular rivalry. Further
investigation into these stimuli attributes, in groups with physiological variation such
and in the aged or in clinical groups, may be fruitful for unlocking the mechanisms
contributing to binocular rivalry and visual awareness.
2.9 Conclusion
Increasing the stimulus strength by comparing low- and high-strength stimuli
in terms of luminance and movement equally in both eyes, produced significantly-
increased binocular rivalry rates in 20 healthy volunteers, consistent with Levelt’s
Chapter 2: Altering Binocular Rivalry Rate by Increasing Luminance Contrast and Temporal Frequency: Support for an Oscillation Model of Binocular Rivalry 79
fourth proposition. Individuals were grouped into slow- and fast-switchers, according
to their mean binocular rivalry rate. As stimulus strength was increased from low to
high, individuals with fast-switch rates showed a steeper increase in binocular rivalry
rates than those with slower-alternation rates. Individuals who had slower binocular
rivalry rates produced normalised perceptual dominance distributions that could be
approximated to the gamma distribution more readily than those with faster
alternation rates. These data support models of binocular rivalry that recognise that
individual factors may influence binocular rivalry, and provide empirical data
relating to Levelt’s fourth proposition.
In this study participants were classified as ‘fast switchers’ or ‘slow switchers’
according to their mean binocular rivalry rate across the sixteen stimulus conditions.
Two small comparison groups (n=3) were identified. It may have been beneficial to
classify participants according to their performance on a task that provided an
alternative measured visual processing speed, for example a reaction time task.
Levelt’s model suggests that participants with faster binocular rivalry rates would
perform better on tasks that require faster visual processing than those with slower
binocular rivalry rates. Correlations between binocular rivalry rate and comparision
task may provide insights into how binocular rivalry is processed within the visual
system. These investigations may inform researchers how to incorporate binocular
rivalry tasks into a battery of tasks to investigate visual processing in schizophrenia
and other mental illnesses in future studies.
The group of ‘fast switchers’ comprised three females with a mean age of 37
years where the group of ‘slow switchers’ comprised one male and two females with
a mean age of 42 years. This introduced a potential age and gender bias. Replication
80 Chapter 2: Altering Binocular Rivalry Rate by Increasing Luminance Contrast and Temporal Frequency: Support for an Oscillation Model of Binocular Rivalry
in a larger age and gender-matched groups is therefore necessary to confirm the
results presented here.
In the next chapter, group differences in binocular rivalry are explored.
Binocular rivalry rate and dominance durations elicited from high-strength stimuli
(as reported in Pettigrew & Miller, 1998) will be compared with low-strength
binocular rivalry stimuli (as reported in Miler et al., 2003) in participants with
schizophrenia compared to controls, using the methods of collecting binocular
rivalry.

Chapter 3: Slower Binocular Rivalry Rates in Individuals with Schizophrenia Compared to Healthy Controls 81
3.1 Binocular Rivalry Rate in Major Psychiatric Illness
Abnormal binocular rivalry has been reported in individuals with a clinical
diagnosis of bipolar disorder (BPD), schizophrenia, schizoaffective disorder or
depression and their relatives (Fox, 1965; Miller et al., 2003; Pettigrew & Miller,
1998; Sappenfield & Ripke, 1961; White et al., 2001; Yang et al., 2007). Slow
binocular rivalry rate has been suggested as a trait marker for BPD (Pettigrew &
Miller, 1998). Miller and colleagues (2003) reliably separated participants with BPD
from healthy participants using a low-strength binocular rivalry stimulus, but failed
to separate healthy participants from those with either schizophrenia or depression.
However, other researchers have identified participants with schizophrenia based on
their slower binocular rivalry rates (or increased mean dominance durations) (Fox,
1965; Frecska, White & Leonard et al., 2003; Sappenfield & Ripke, 1961; White et
al., 2001; Wright et al., 2003), suggesting that binocular rivalry rate may not be able
differentiate the type of mental illness present.
In seven out of the nine studies examining the rate of binocular rivalry and
duration of dominance in rivalry in subjects with schizophrenia, the primary aim of
the study was not to investigate classical binocular rivalry characteristics. Two
neuroimaging studies incorporated binocular rivalry tasks in subjects with
schizophrenia; one utilising functional MRI (Valle-Inclan & Gallego, 2006) and the
other whole-head MEG (Tononi et al., 1998). Although these studies provide
hypotheses related to defective interactions between brain regions, such as the
frontoparietal network and prefrontal area and aberrations in consciousness, they
provide no information about the form and frequency of binocular rivalry
Chapter 3: Slower Binocular Rivalry Rates in Individuals with Schizophrenia Compared
to Healthy Controls
82 Chapter 3: Slower Binocular Rivalry Rates in Individuals with Schizophrenia Compared to Healthy Controls
alternations in participants with schizophrenia. Most of the available data relating to
binocular rivalry rate and dominance durations in schizophrenia have been produced
as comparison data to address other research questions. For example, secondary
hypotheses investigated binocular rivalry switch rate in BPD in the Miller et al.,
(2003) study, Yang et al., (2007) examined binocular rivalry in first-line relatives of
subjects with schizophrenia and the effect of applying conflicting stimuli in rapid
reversal (dichoptic stimulus alternation, DSA) were examined in two studies White
et al., (2001) and Frecska, White et al., (2003). Yang et al., (2007) investigated the
effect of mood states on dominance period during rivalry in subjects with
schizophrenia and schizoaffective disorder. They found that increased dominance
periods were related to negative mood states in those with schizophrenia, but not in
healthy controls. Two early studies measured binocular rivalry in schizophrenia as
their primary aim. Both found binocular rivalry rate was slower in subjects with
schizophrenia compared to healthy controls (Fox, 1965; Sappenfield & Ripke, 1961).
Sappenfield and Ripke (1961) indicated that retinal rivalry in two thirty-second
periods discriminated between subjects with schizophrenia and healthy participants.
Similarly, Fox (1965) noted that participants with schizophrenia recorded slower
binocular rivalry rates compared to healthy participants. Their results were consistent
with the view that binocular rivalry rates are inversely correlated with
psychopathology; however this effect only manifested in the second two minutes of
their binocular rivalry testing paradigm. No contemporary studies have primarily
focussed on binocular rivalry in schizophrenia. Furthermore, the findings of
Pettigrew & Miller (1998) and Miller et al., (2003) are not well supported.
Drawing on perceptual rivalry data, and the assumption that binocular and
perceptual rivalry share common mechanisms (Brascamp et al., 2006; Kanai,
Chapter 3: Slower Binocular Rivalry Rates in Individuals with Schizophrenia Compared to Healthy Controls 83
Moradi, Shimojo & Verstraten, 2005; Miller et al., 2000, Miller et al., 2003). Miller
et al., (2003) argued that the perceptual rivalry findings of previous studies Eysenck
(1952), Hunt & Guilford (1933) and Philip (1953) supported their claim that slow
binocular rivalry rate is a trait maker of BPD. Perceptual rivalry, or monocular
rivalry, differs to binocular rivalry in that the two alternative precepts of an image are
viewed by one or both eyes simultaneously, and can be seen even when one eye is
closed (examples include the Necker Cube, Rubin’s Vase, and Schroder’s Staircase).
Some suggest that binocular and perceptual rivalry share several common
characteristics (Kornmeier & Bach, 2004; O’Shea et al., 2009). For example, the
distribution of the duration of dominance also seems to emulate a gamma distribution
(Borsellino et al., 1972; Lehky, 1995; O’Shea et al., 2009). There is high inter-
participant variability in reversal rates (Borsellino et al., 1972; Kornmeier & Bach,
2004). Reversal rates can be influenced by physical properties of the stimulus (Meng
& Tong, 2004) and through voluntary control by the participants (Gomez,
Argandona, Solier, Angulo & Vazquez, 1995; Horlitz & O’Leary, 1993; Lack, 1970).
However, there are also potential mechanistic differences. For example, depth of
suppression is less pronounced in perceptual rivalry (Breese, 1899; O’Shea et al.,
2009) and increases in contrast affect perceptual and binocular rivalry in opposite
ways (O’Shea & Wishart, 2007). Increased contrast results in an increased
alternation rate in binocular rivalry, and a decreased alternation rate in perceptual
rivalry (O’Shea et al., 2009). Attention may influence Necker Cube reversals more
than binocular rivalry alternations (Meng & Tong, 2004; Tong, 2001; Van Ee et al.,
2006).
As previously noted, in terms of schizophrenia, the available perceptual rivalry
data are not conclusive. The data of Levander et al., (1985) suggest slower reversals
84 Chapter 3: Slower Binocular Rivalry Rates in Individuals with Schizophrenia Compared to Healthy Controls
in participants with schizophrenia, whereas a much earlier study (Hunt & Guilford,
1933) reported that participants with ‘dementia praecox’ (an older term for
schizophrenia) had normal Necker reversal rates. Participants with schizophrenia
perceived the Schroder’s Staircases from above for significantly less time then the
perception of the stimulus from below, and had a tendency to have more reversals
than controls; however this was not significant (Calvert, et al., 1988). Similarly,
Hoffman et al., (2011) and Keil et al., (1998) reported that participants with
schizophrenia had faster reversals than healthy controls for the Rubin’s Vase. Thus,
it is difficult to argue that perceptual rivalry data support binocular rivalry data in
schizophrenia.
There is also discussion in the literature as to whether binocular rivalry and
perceptual rivalry reflect distinct (or similar) neural mechanisms based on whether or
not the percept durations have similarly-shaped distributions (Van Ee et al., 2006).
Dominance durations vary, are stochastic (random) (Blake, Fox & McIntyre, 1971),
statistically independent of each other (Fox & Herrmann, 1967; Walker, 1975) and
typically form gamma distributions when plotted as histograms (Brascamp et al.,
2005; Brascamp et al., 2006; Fox & Herrmann, 1967; Levelt, 1967; Logothetis et al.,
1996). However, there is debate as to whether gamma-shaped distributions of
dominance durations are a true characteristic of binocular rivalry. Dominance
durations reported in the current study fitted gamma distributions on six of 16
occasions. Other researchers have also failed to fit normalised dominance durations
derived from healthy participants to gamma distributions (Brascamp et al., 2005;
Brascamp 2006; Murata et al., 2003). Zhou et al., (2004) found that during
monocular rivalry, perceptual dominance distributions in participants with
Chapter 3: Slower Binocular Rivalry Rates in Individuals with Schizophrenia Compared to Healthy Controls 85
schizophrenia fitted log-normal, Weibull and gamma distributions. This suggests that
multiple or different neural pathways may be involved.
In terms of dominance durations, Miller et al., (2003) found that normalised
dominance durations of binocular rivalry in healthy participants or those with
depression, BPD or schizophrenia were able to be ‘fitted’ to gamma distributions.
However, these authors provided no information regarding perceptual rivalry. The
data from Miller et al., (2003) and the existing available literature paint an unclear
picture with respect to whether participants with schizophrenia have binocular rivalry
rates and dominance distributions that differ from those of healthy participants. In
order to support Pettigrew and Miller’s assertion that slow binocular rivalry rate is a
trait marker for BPD, it is important to examine binocular rivalry rate in other mental
disorders, such as schizophrenia, to examine the generalisability of this
characteristic.
3.2 Study 2
3.2.1 Aims.
Two classic studies, Fox (1965) and Sappenfield & Ripke (1961) report slower
binocular rivalry rates in schizophrenia, that contrast with the study of Miller et al.,
(2003) which found no difference. In order to address this conflict, the aim of the
current study was to advance the work of Miller et al (2003), to ascertain whether
there are differences in binocular rivalry rate and dominance durations in individuals
with schizophrenia compared to healthy controls using their methods. It was
predicted there would be no difference in binocular rivalry rates recorded by
participants with schizophrenia compared to healthy controls using low-strength
binocular rivalry stimuli (as in Miller et al., 2003), but would be faster or the same
when using high-strength binocular rivalry stimuli (as in Pettigrew & Miller, 1998

86 Chapter 3: Slower Binocular Rivalry Rates in Individuals with Schizophrenia Compared to Healthy Controls
with BPD). Faster or similar binocular rivalry rates in participants with
schizophrenia would support the claim that slower binocular rivalry rates are a trait
marker for BPD. Conversely, slower binocular rivalry rates in participants with
schizophrenia would question whether slow binocular rivalry is a trait marker for
BPD, and the utility of this task as a potential diagnostic tool. Alternation rates and
dominance durations in binocular rivalry and in a perceptual rivalry task (Necker
Cube) were also compared in subjects with schizophrenia using a within-participant
design.
3.2.2 Hypotheses.
The main hypothesis of the current study was that binocular rivalry rates
recorded by participants with schizophrenia and a perceptual rivalry task (the Necker
Cube) would be slower than those recorded by controls. It was also hypothesised that
normalised dominance durations would approximate a gamma distribution.
3.3 Method
Binocular rivalry rate and dominance durations were recorded for two
binocular rivalry tasks (one low-strength stimulus and one high-strength stimulus)
and one perceptual rivalry task in participants with schizophrenia (n = 20) and
healthy controls (n = 20). The same binocular rivalry methods and stimulus
conditions as described in Chapter 2, Section 2.2.2.1, were used.
3.3.1 Participants.
Written and informed consent were obtained from each participant before
commencement of binocular rivalry testing. Ethical clearance for this study was
obtained from the Royal Brisbane and Women’s Hospital Human Research Ethics
Committee and the Queensland University of Technology Human Research Ethics
Committee. Binocular rivalry testing took place at an outpatient facility of the Royal

Chapter 3: Slower Binocular Rivalry Rates in Individuals with Schizophrenia Compared to Healthy Controls 87
Brisbane and Women’s Hospital and in the Optometry Clinic at the Queensland
University of Technology.
All participants were right-handed, as assessed using the Annett Handed
Questionnaire (Annett, 1970). All participants had normal vision and at least 6/9
visual acuity (corrected if necessary) in each eye assessed by the Snellen visual
acuity testing. To reduce any eye dominance effect related to inter-ocular differences
in visual acuity, participants were excluded from the study if visual acuity in each
eye was not equal (to within two letters). In addition, each participant undertook a
keyhole task to determine sighting eye dominance as described in (Osburn &
Klingsporn, 1998). The dominant sighting eye identified by the hole-in-card test
reliably coincides with the dominant eye as determined by binocular rivalry, which is
a useful quantitative indicator of eye dominance in clinical applications (Handa, et
al., 2004). As an indication of predicted IQ all participants completed the National
Adult Reading Test (NART) (O’Carroll et al., 1992; Crawford et al., 1992; Morrsion,
Sharkey, Allardyce Kelly & McCreadie, 2000). All participants were instructed to
abstain from caffeinated drinks for four hours and nicotine for one hour prior to
binocular rivalry testing, as caffeine and nicotine may increase binocular rivalry rate
(George, 1936).
3.3.1.1 Healthy participants.
Twenty control participants, with no previous history of neurological disease
or mental illness (confirmed using the Structured Clinical Interview for the
Structured Clinical Interview for the DSM-IV [SCID]), were recruited to the study.
3.3.1.2 Participants with schizophrenia.
Twenty participants with a clinical diagnosis of schizophrenia were recruited.
Clinical diagnosis of schizophrenia was confirmed using the DSM-IV (SCID). The
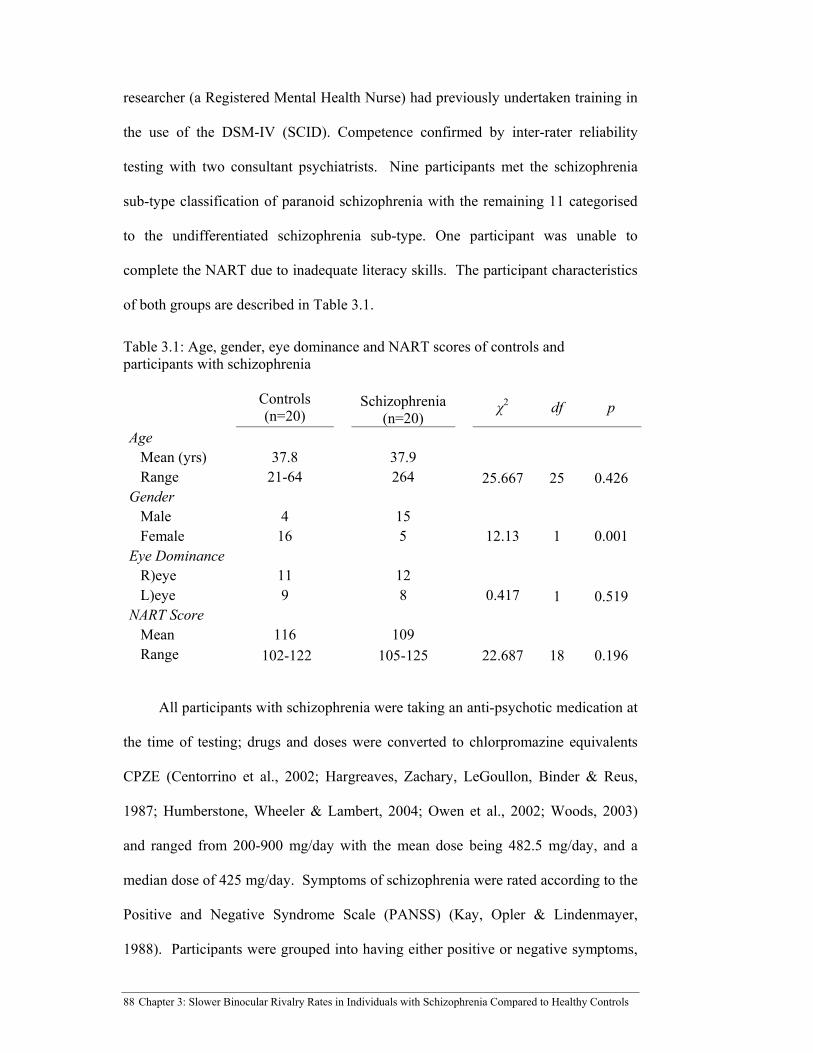
88 Chapter 3: Slower Binocular Rivalry Rates in Individuals with Schizophrenia Compared to Healthy Controls
researcher (a Registered Mental Health Nurse) had previously undertaken training in
the use of the DSM-IV (SCID). Competence confirmed by inter-rater reliability
testing with two consultant psychiatrists. Nine participants met the schizophrenia
sub-type classification of paranoid schizophrenia with the remaining 11 categorised
to the undifferentiated schizophrenia sub-type. One participant was unable to
complete the NART due to inadequate literacy skills. The participant characteristics
of both groups are described in Table 3.1.
Table 3.1: Age, gender, eye dominance and NART scores of controls and participants with schizophrenia
Controls (n=20)
Schizophrenia(n=20)
χ2 df p
Age Mean (yrs) 37.8 37.9 Range 21-64 264 25.667 25 0.426 Gender Male 4 15 Female 16 5 12.13 1 0.001 Eye Dominance R)eye 11 12 L)eye 9 8 0.417 1 0.519 NART Score Mean 116 109 Range 102-122 105-125 22.687 18 0.196
All participants with schizophrenia were taking an anti-psychotic medication at
the time of testing; drugs and doses were converted to chlorpromazine equivalents
CPZE (Centorrino et al., 2002; Hargreaves, Zachary, LeGoullon, Binder & Reus,
1987; Humberstone, Wheeler & Lambert, 2004; Owen et al., 2002; Woods, 2003)
and ranged from 200-900 mg/day with the mean dose being 482.5 mg/day, and a
median dose of 425 mg/day. Symptoms of schizophrenia were rated according to the
Positive and Negative Syndrome Scale (PANSS) (Kay, Opler & Lindenmayer,
1988). Participants were grouped into having either positive or negative symptoms,

Chapter 3: Slower Binocular Rivalry Rates in Individuals with Schizophrenia Compared to Healthy Controls 89
based on a composite scale derived from subtracting negative symptom rating scores
from positive scores on the PANSS (see Kay et al., 1988). Participants were
classified as experiencing a predominance of positive symptoms if their resulting
score was >0 (n = 9), or a predominance of negative symptoms if their score was <0
(n = 9). Two participants had a score of 0, indicative of equal positive and negative
symptoms. The two groups were well matched for age but not gender.
3.3.1.3 Procedure
3.3.1.3.1 Binocular rivalry testing.
To ensure that reliable data were collected, all participants received training in
the binocular rivalry task before testing. Binocular rivalry stimuli were presented on
a personal computer placed three metres from the participant. The participant viewed
the stimulus through liquid crystal shutter goggles that presented vertical or
horizontal gratings exclusively to each eye. Participants recorded their percepts on a
computer key pad attached to a second personal computer that collected binocular
rivalry data. The apparatus and method of collecting binocular rivalry used here
were identical to those employed in the study by Miller et al., (2003).
Each participant was tested using two binocular rivalry stimulus conditions; a
low- and high-strength stimulus. The low-strength stimulus consisted of a circular
field (1.5 degrees diameter) filled with monochromatic, stationary, 4 cpd, square
wave gratings of 90% luminance contrast. The high-strength stimulus consisted of
the same circular field filled with monochromatic, 8 cpd, square wave gratings of
100% luminance contrast, moving at approximately 4 cps. The velocity of the
moving lines was determined by separately counting the number of vertical and
horizontal lines that moved beyond the edge of the circular grid in a one minute time
period; this was then converted to cycles per second. The stimulus characteristics of

90 Chapter 3: Slower Binocular Rivalry Rates in Individuals with Schizophrenia Compared to Healthy Controls
these two targets were chosen to match the low- and high-strength stimuli used in
Pettigrew and Miller, (1998) and Miller et al., (2003).
Luminance levels were measured at a distance of three metres through the
shutter goggles (NuVisionTM60GX , MacNaughton, Canada) using a luminance
colourimeter (model BM-7, Topcon, Japan). The maximum luminance condition was
determined by the maximum luminance capability of the computer monitor, with
luminance levels measured through the goggles averaging 60% less than those
without the goggles. The luminance contrast of each stimulus was calculated using
Michelson’s formula, (Lmax - Lmin) / (Lmax + Lmin) (Slaghuis, 1998). Luminance
contrast was calculated as 1.0 in the high-strength stimulus condition and 0.9 in the
low-strength condition.
Initially participants were asked to record when they perceived horizontal lines,
vertical lines and mixed images (as reported in Miller et al., 2003). However, during
pilot experiments it became obvious that the percept changing from vertical to
horizontal was difficult to determine for the high-strength task; there was high
measurement variability when data were collected in this manner. To improve the
accuracy of the data collected, participants were required to report only two
conditions, that is when vertical lines were exclusively seen and when horizontal
lines were exclusively seen. Participants were told to ignore mixed or combined
images. Participants only commenced the formal binocular rivalry testing when the
researcher was satisfied they understood the instructions by verbally reporting their
perceptions and accurately recording the alternation between vertical and horizontal
perceptions on a computer key pad (i.e. their verbal reports matched keyboard
responses).
3.3.1.3.2 Perceptual rivalry testing; the Necker cube.

Chapter 3: Slower Binocular Rivalry Rates in Individuals with Schizophrenia Compared to Healthy Controls 91
For the perceptual rivalry task, a black line drawing of the Necker Cube
measuring 7.5cm, extending 1.5 degrees of visual angle, was presented on a personal
computer at a distance of three metres. Each participant was instructed to view the
Necker Cube passively and to verbally indicate when they perceived the cube
viewed, as seen from above, and when it changed and appeared to be seen from
below. When participants could confidently verbally signal the alternation between
views they were asked to indicate when the cube appeared to be viewed from the
front using the left response key, and when viewed from the back using the right
response key of the computer key pad (Kornmeier & Bach, 2004).
3.4 Statistical Analyses
A power analysis was performed to determine the minimum number of
participants that were required to demonstrate a difference in binocular rivalry rates
in low-strength stimuli (as used in Miller et al., 2003) and high-strength stimuli (as
used in Pettigrew and Miller (1998). The data provided by Miller et al., (2003) were
entered into the G*power3 program (Faul, Erdfelder, Lang & Buchner, 2007). It was
estimated that a sample size of 20 in each group was required for a two-sided 5%
significance level and power of 80 to demonstrate a difference in binocular rivalry
rate in the low- and high-strength binocular rivalry tasks in the participants with
schizophrenia compared to the healthy controls.
As the resulting binocular rivalry rates did not form normal distributions, non-
parametric statistics were used. Kruksal-Wallis one-way non-parametric ANOVAs
were performed to determine the effects that group, gender, age, education and
NART score had on binocular rivalry rate. To examine influences on binocular
rivalry rate in participants with schizophrenia, the analyses focussed on three factors
unique to the participants with schizophrenia: diagnostic sub-group (by DSM-IV

92 Chapter 3: Slower Binocular Rivalry Rates in Individuals with Schizophrenia Compared to Healthy Controls
classification), type of schizophrenia symptoms (positive versus negative, as
determined by PANSS), and the dose of anti-psychotic medication quantified as
chlorpromazine equivalents (CPZE) were made (Mann-Whitney U tests). Data are
mean ± SD, unless otherwise stated.
The time intervals between responses that signal the onset of perceptual
alternations (measured in seconds) were normalised by dividing each interval by the
mean. Dominance duration intervals were normalised and cumulative gamma
distributions plotted. Classically, normalised dominance durations have been plotted
as histograms and fitted to a gamma distribution using a Kolmogorov-Smirnov
goodness-of-fit test (Borsellino et al., 1972; Carter & Pettigrew, 2003; De Marco et
al., 1997; Levelt, 1968; Logothetis et al., 1996; Miller et al., 2003; Pettigrew &
Miller, 1998; Van Ee et al., 2006). However, normalised binocular rivalry
dominance durations do not always form gamma distributions in healthy participants
(Brascamp et al., 2005; Brascamp et al., 2006; Cogan, 1973, De Marco et al., 1977;
Zhou et al., 2004), or those with schizophrenia (Miller et al., 2003). Thus,
differences in the resulting distributions of normalised dominance intervals were
compared, rather than attempting to fit dominance intervals to gamma distributions.
To determine whether there were any differences in the distributions of dominance
intervals produced by participants with schizophrenia compared to healthy controls, a
two-sided Smirnov test was conducted for each condition, as described in Section
2.5.3.1. In each binocular rivalry condition the data consisted of two independent
random samples, one of size n, X1, X2 …. Xn (dominance durations recorded by
participants with schizophrenia) and the other of size m, Y1, Y2, …. Ym (dominance
durations recorded by healthy controls). The decision rule, to reject H0 at the level
significance α is if T1 exceeds its 1 – α quantile; where n (the number of dominance

Chapter 3: Slower Binocular Rivalry Rates in Individuals with Schizophrenia Compared to Healthy Controls 93
durations for the smallest sample- schizophrenia participants) and m (the number of
dominance durations for the largest sample- healthy controls) is greater than 20, the
0.95 quantile of T1 is given by w0.95 ≈1.36√ m+n/ mn (Conover, 1971).
In essence, the Smirnov test is a statistical test that determines the degree of
difference in the normalised distributions of data, regardless of the shape of the
distribution. The Smirnov test compares the differences of the values along the
distribution at specific points (bins). If there is more than a 0.05 difference in values
at any point along the two distributions (as indicated by the vertical distance between
two values) the criteria for a statistical difference in the dominance durations is met
(Conover, 1971).
3.5 Results
3.5.1 Binocular rivalry rate.
Binocular rivalry rate was significantly slower in participants with
schizophrenia compared the control group for both the high- and low-strength
stimulus conditions (Figure 3.1). Participant group had a significant main effect on
binocular rivalry rate for both stimulus conditions; low-strength condition χ2 =
12.952, df =1, p < .001 and high-strength condition χ2 = 12.662, df =1, p < .001. In
the low-strength stimulus condition binocular rivalry rates in the participants with
schizophrenia averaged M= 0.28 Hz, SD = 0.108 Hz, which was nearly half the speed
of that for controls participants where binocular rivalry rates averaged M= 0.545, SD
= 0.256Hz. Binocular rivalry rates in the group comprising of participants with
schizophrenia were significantly slower (Z = -3.612, p < .001). Binocular rivalry
rates in the high-strength stimulus condition were also significantly slower (Z = -
3.545, p < .001) in this group (M = 0.298, SD = 0.126 Hz) compared to controls (M
= 0.548, SD = 0.256Hz).
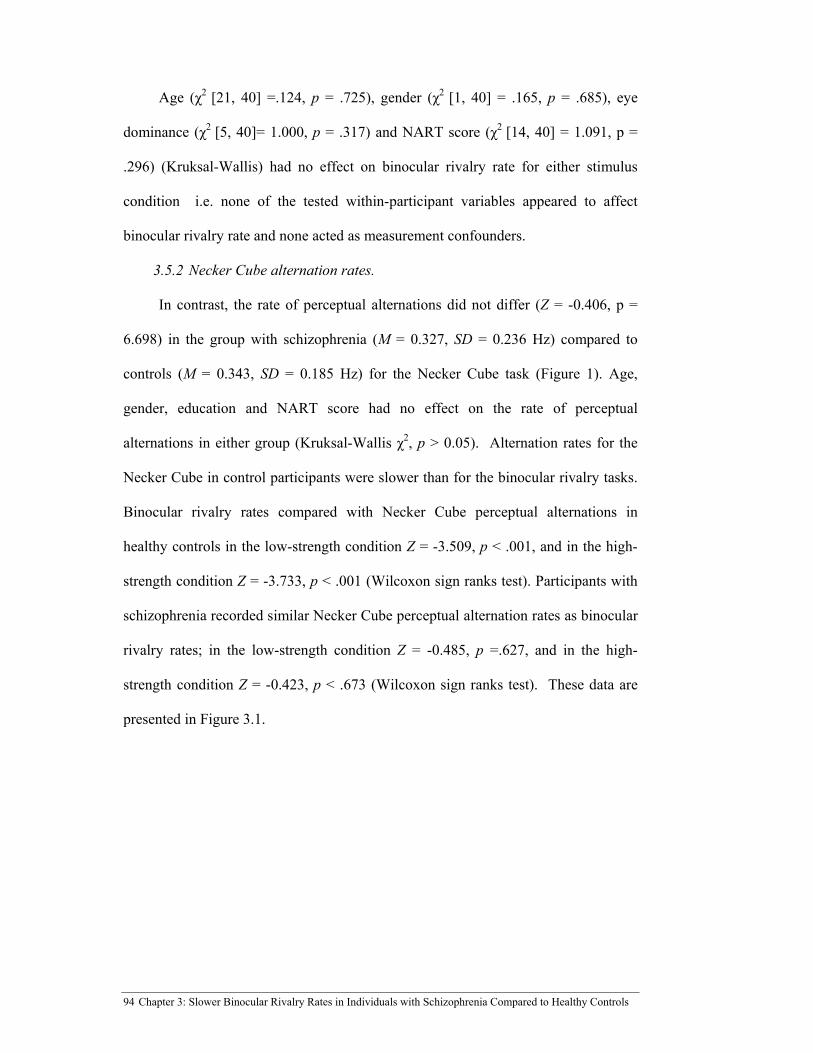
94 Chapter 3: Slower Binocular Rivalry Rates in Individuals with Schizophrenia Compared to Healthy Controls
Age (χ2 [21, 40] =.124, p = .725), gender (χ2 [1, 40] = .165, p = .685), eye
dominance (χ2 [5, 40]= 1.000, p = .317) and NART score (χ2 [14, 40] = 1.091, p =
.296) (Kruksal-Wallis) had no effect on binocular rivalry rate for either stimulus
condition i.e. none of the tested within-participant variables appeared to affect
binocular rivalry rate and none acted as measurement confounders.
3.5.2 Necker Cube alternation rates.
In contrast, the rate of perceptual alternations did not differ (Z = -0.406, p =
6.698) in the group with schizophrenia (M = 0.327, SD = 0.236 Hz) compared to
controls (M = 0.343, SD = 0.185 Hz) for the Necker Cube task (Figure 1). Age,
gender, education and NART score had no effect on the rate of perceptual
alternations in either group (Kruksal-Wallis χ2, p > 0.05). Alternation rates for the
Necker Cube in control participants were slower than for the binocular rivalry tasks.
Binocular rivalry rates compared with Necker Cube perceptual alternations in
healthy controls in the low-strength condition Z = -3.509, p < .001, and in the high-
strength condition Z = -3.733, p < .001 (Wilcoxon sign ranks test). Participants with
schizophrenia recorded similar Necker Cube perceptual alternation rates as binocular
rivalry rates; in the low-strength condition Z = -0.485, p =.627, and in the high-
strength condition Z = -0.423, p < .673 (Wilcoxon sign ranks test). These data are
presented in Figure 3.1.
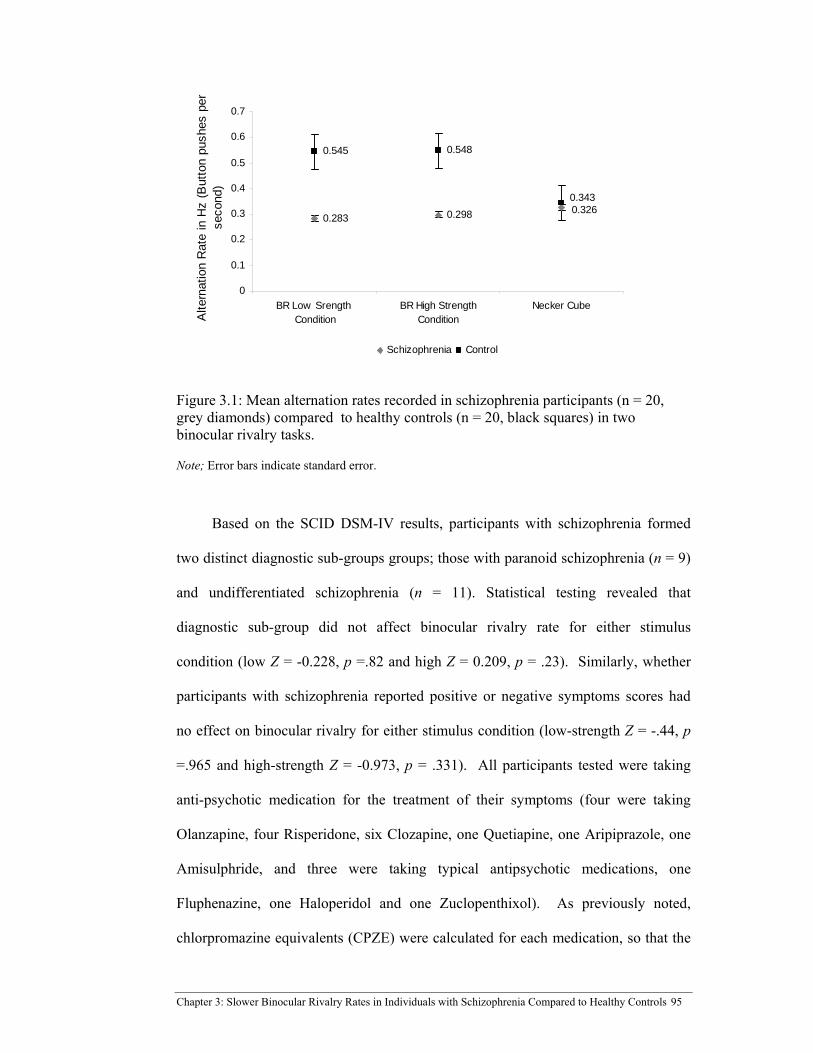
Chapter 3: Slower Binocular Rivalry Rates in Individuals with Schizophrenia Compared to Healthy Controls 95
0.283 0.298
0.545 0.548
0.3260.343
0
0.1
0.2
0.3
0.4
0.5
0.6
0.7
BR Low Srength Condition
BR High StrengthCondition
Necker Cube
Alte
rnat
ion
Rat
e in
Hz
(But
ton
push
es p
er
seco
nd)
Schizophrenia Control
Figure 3.1: Mean alternation rates recorded in schizophrenia participants (n = 20, grey diamonds) compared to healthy controls (n = 20, black squares) in two binocular rivalry tasks.
Note; Error bars indicate standard error.
Based on the SCID DSM-IV results, participants with schizophrenia formed
two distinct diagnostic sub-groups groups; those with paranoid schizophrenia (n = 9)
and undifferentiated schizophrenia (n = 11). Statistical testing revealed that
diagnostic sub-group did not affect binocular rivalry rate for either stimulus
condition (low Z = -0.228, p =.82 and high Z = 0.209, p = .23). Similarly, whether
participants with schizophrenia reported positive or negative symptoms scores had
no effect on binocular rivalry for either stimulus condition (low-strength Z = -.44, p
=.965 and high-strength Z = -0.973, p = .331). All participants tested were taking
anti-psychotic medication for the treatment of their symptoms (four were taking
Olanzapine, four Risperidone, six Clozapine, one Quetiapine, one Aripiprazole, one
Amisulphride, and three were taking typical antipsychotic medications, one
Fluphenazine, one Haloperidol and one Zuclopenthixol). As previously noted,
chlorpromazine equivalents (CPZE) were calculated for each medication, so that the

96 Chapter 3: Slower Binocular Rivalry Rates in Individuals with Schizophrenia Compared to Healthy Controls
effects of medication could be compared across participants, see Woods, (2003) and
Centorrino et al., (2002). Medication dose was compared using a median split;
CPZEs of lower than 425 mg were considered a lower dose, and higher doses were
considered as those greater than 425 mg. Statistical testing revealed no effect of
medication on binocular rivalry rates measured using the low-strength stimulus (Z =
0.63, p = .103), however for the high-strength stimulus condition a medication effect
was found (Z = -2.271, p = .023). Participants taking lower doses (lower than the
median) of anti-psychotic medications recorded faster binocular rivalry rates (mean
0.311 Hz compared 0.278 Hz).
3.5.3 Normalised mean dominance durations.
For all three rivalry tasks (both binocular rivalry tasks and the Necker Cube
task), the normalised mean dominance durations recorded by both groups failed to
form gamma distributions (Kolmogorov-Smirnov p >.05). Whether participants with
schizophrenia and healthy controls produced different distributions of dominance
durations were examined (see Section 3.5). No differences in the normalised
dominance distribution were produced by participants with schizophrenia compared
to healthy controls. Table 3.2 shows the Smirnov test statistic for participants with
schizophrenia and healthy control participants (m and n, respectively) compared with
the critical values determined by w0.95 ≈1.36√ m+n/ mn (CV-T for S) compared to
the Smirnov T (the greatest distance in values along the distribution) across the three
test conditions.

Chapter 3: Slower Binocular Rivalry Rates in Individuals with Schizophrenia Compared to Healthy Controls 97
Table 3.2: Smirnov test statistic for participants with schizophrenia (n=20) and controls (n=20).
Test stimulus Schizophrenia (n)
Healthy (m)
CV_T for S at 95%
Smirnov T
Reject H0?
Low Strength 4992 10488 0.06614 0.062034 No
High Strength 5024 9920 0.06661 0.056328 No
Necker Cube 6672 6904 0.06603 0.019091 No
Viewing the plotted cumulative normalised dominance durations in Figure 3.2,
that compare the two distributions, there were no discernible differences. On
examination of the cumulative probability functions, there were no significant
differences in the vertical distances between the two plots at any point in Figure 3.2,
indicating that the mean dominance durations recorded by participants with
schizophrenia were not significantly different to that of the healthy controls. These
results indicated that it was only rate of binocular rivalry alternations that differed
between participants with schizophrenia and healthy controls, and not the duration or
proportion of time spent viewing (or suppressing) each image before being
interrupted by the alternative image.
3.6 Discussion
Binocular rivalry rates in participants with schizophrenia were slower than
healthy controls in both the low-strength and high-strength binocular rivalry tasks.
However, no differences in the perceptual alternation rates of the Necker Cube
(monocular rivalry) task were found between the two groups. Perceptual alternation
rates for the Necker Cube task in schizophrenia were similar to the alternation rates
recorded in the two binocular rivalry tasks, however Necker Cube alternation rates
were slower in healthy controls compared to binocular rivalry rates. There were no
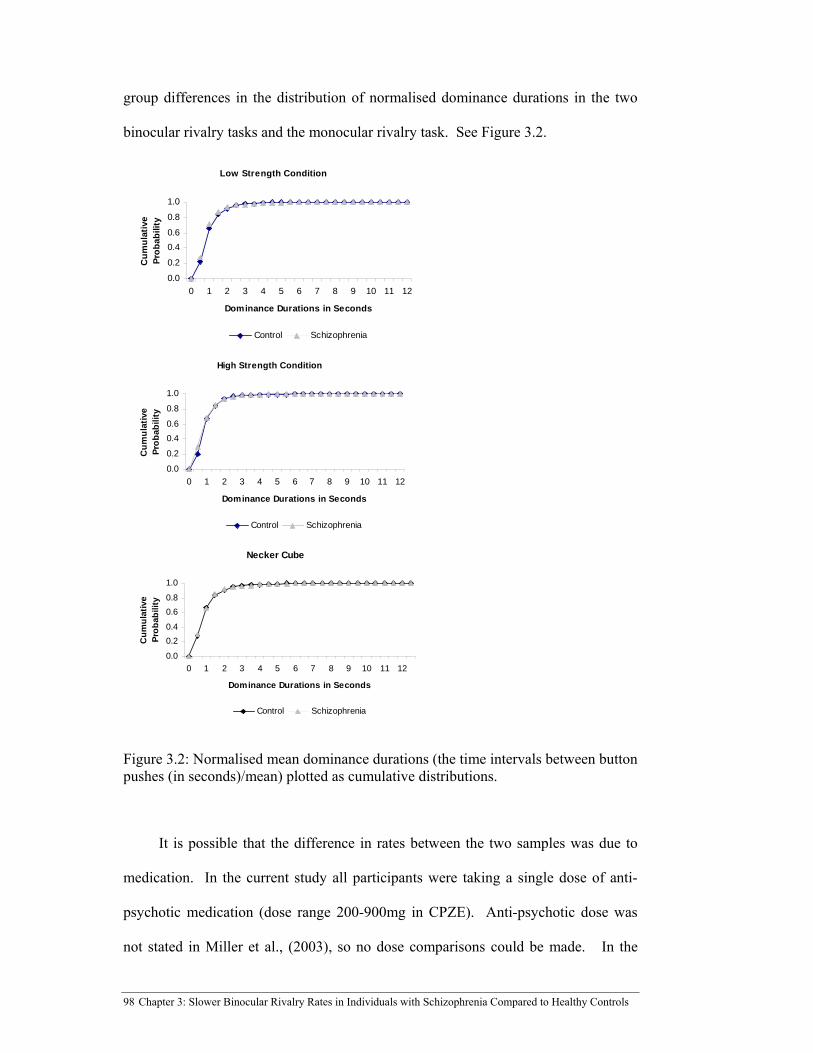
98 Chapter 3: Slower Binocular Rivalry Rates in Individuals with Schizophrenia Compared to Healthy Controls
group differences in the distribution of normalised dominance durations in the two
binocular rivalry tasks and the monocular rivalry task. See Figure 3.2.
Low Strength Condition
0.0
0.2
0.4
0.6
0.8
1.0
0 1 2 3 4 5 6 7 8 9 10 11 12
Dominance Durations in Seconds
Cu
mu
lati
ve
Pro
bab
ility
Control Schizophrenia
High Strength Condition
0.0
0.2
0.4
0.6
0.8
1.0
0 1 2 3 4 5 6 7 8 9 10 11 12
Dominance Durations in Seconds
Cu
mu
lati
ve
Pro
bab
ility
Control Schizophrenia
Necker Cube
0.0
0.2
0.4
0.6
0.8
1.0
0 1 2 3 4 5 6 7 8 9 10 11 12
Dominance Durations in Seconds
Cu
mu
lati
ve
Pro
bab
ility
Control Schizophrenia
Figure 3.2: Normalised mean dominance durations (the time intervals between button pushes (in seconds)/mean) plotted as cumulative distributions.
It is possible that the difference in rates between the two samples was due to
medication. In the current study all participants were taking a single dose of anti-
psychotic medication (dose range 200-900mg in CPZE). Anti-psychotic dose was
not stated in Miller et al., (2003), so no dose comparisons could be made. In the

Chapter 3: Slower Binocular Rivalry Rates in Individuals with Schizophrenia Compared to Healthy Controls 99
Miller et al., (2003) study the four participants were taking two different types of
medication. Three subjects were taking both a typical and an atypical anti-psychotic,
and one was taking lithium. Lithium is typically prescribed for mood disturbances.
It is not clear from Miller et al., (2003) whether co-morbidity was an exclusion
criterion as it was in the current study. Another possible reason for the difference in
results is that only 12 of the 18 participants with schizophrenia in the Miller et al.,
(2003) study had normal vision. All participants in the current study had normal
vision (or normal corrected vision).
It is unlikely that these findings are due to group differences between the
studies. Participants with schizophrenia in the current study were similar in age to
those in Miller et al., (2003); mean age 37.9 years (range 23 -64 years) and 37.7
years (range 21-69 years) respectively. Although in Miller et al., (2003) the group
with schizophrenia comprised nine males and nine females compared to 15 males
and five females, in the current study, this difference was not significant (χ2 = 2.544,
p = .11). Age and gender had no effect on binocular rivalry rate for either stimulus
condition or acted as measurement confounders for either group in the current study.
3.6.1 Binocular rivalry rates in schizophrenia.
Binocular rivalry rates in participants with schizophrenia were consistently
slower than those in healthy participants for both low- and high-strength stimulus
conditions. The data presented here are consistent with the work of Fox (1965) and
Sappenfield and Ripke (1961) who found binocular rivalry rate to be slower in
participants with schizophrenia compared to healthy controls. Furthermore, they
contrast with the findings of Miller et al., (2003) where no differences were found.
Miller and colleagues dismissed the work of Sappenfield and Ripke (1961) and Fox
(1965) on the basis that these studies were limited by the short observation period
100Chapter 3: Slower Binocular Rivalry Rates in Individuals with Schizophrenia Compared to Healthy Controls
where binocular rivalry data were collected for less than two minutes for each
participant. The data presented here replicate slow binocular rivalry rate in a group
of 20 participants with schizophrenia over eight minutes of binocular rivalry data
collection. In addition, this was across two different binocular rivalry stimulus
conditions.
3.6.2 Monocular rivalry rates in schizophrenia.
No differences were found when rivalry rates and dominance durations of the
two perspectives of the Necker Cube were compared between the two groups. These
results suggest that perceptual rivalry may be a product of different mechanisms than
binocular rivalry. Meng and Tong (2004), Tong (2001) and Van Ee et al., (2006)
propose a higher cortical based mechanism of binocular rivalry. However, in terms
of rate, healthy control participants recorded slower Necker Cube rates than
binocular rivalry rates. This effect in healthy participants has been found previously
by Breese who reported that monocular rivalry alternations tended to occur at a
slower rate than binocular rivalry alternations and tended to be less vivid (Breese,
1899). Slower Necker Cube alternations or monocular rates were not observed in
participants with schizophrenia. It could be that the slow binocular rivalry rate
observed in the group with schizophrenia limits the ability to detect further slowing
in the monocular task. A more likely explanation is that the features of
schizophrenia that effects higher cortical processing (for example attention, visual
and verbal learning and memory, working memory and executive functioning), also
effect processing in the visual cortex. Recent models suggest that monocular rivalry
(or alternation between alternative images in ambiguous figures) involves
competition for visual awareness between the monocular neurons higher in the visual
cortex (V2 and beyond), whereas binocular rivalry involves both bottom-up and top-
Chapter 3: Slower Binocular Rivalry Rates in Individuals with Schizophrenia Compared to Healthy Controls101
down processing (Struber, 1999) that includes processing as early as V1 (Tong &
Engel, 2001). That is, inter-ocular competition between binocular neurons earlier in
visual processing are influenced by local stimulus characteristics (contrast, temporal
frequency) that drive binocular and monocular neurons higher in cortical visual
processing (V1 and beyond) are responsible for bringing the opposing images into
consciousness (Kornmeier & Bach, 2005; O’Shea et al., 2009; Tong, 2001).
Therefore, abnormal monocular neurons in the higher visual cortex may affect the
rate in which opposing images are brought into conscious in both binocular and
monocular rivalry in schizophrenia).
3.6.3 Distributions, gamma plots.
The distributions of dominance durations between the two groups were directly
compared using the Smirnov test. No statistical differences were found in the
distributions of dominance duration between participants with schizophrenia or
healthy controls for either the binocular rivalry task or the perceptual rivalry task.
Thus the characteristics of binocular rivalry in terms of dominance durations were
similar, with the two groups only showing differences in binocular rivalry rates.
These data are at odds with the findings of Miller et al., (2003). These authors
reported normalised dominance durations produced by healthy participants, those
with BPD and those with depression fitted a gamma distribution (with R2 values of
greater than 0.96), while those produced by participants with schizophrenia fitted less
well (R2 = 0.92). These differences between the two studies in reported dominance
durations in schizophrenia may be due to the statistical methods employed. Miller et
al., (2003) fitted dominance durations of the respective groups to Gamma
distributions using the Kolmogorov-Smirnov test. This was not attempted here as it
was reported in Chapter 2 that dominance durations reported by the sample of control
102Chapter 3: Slower Binocular Rivalry Rates in Individuals with Schizophrenia Compared to Healthy Controls
participants in this study did not generally fit Gamma distributions (see Section
2.7.1). Here the ‘Two Sample Smirnov Test’ was used to compare distributions of
dominance durations reported by controls and participants with schizophrenia.
Although there was no difference in the cumulative dominance distributions,
allowing one to assume that both groups recorded binocular rivalry dominance
distributions that were ‘normal’ and ‘expected’, it is impossible to distinguish
whether either group’s distributions fitted a Gamma distribution. Although unlikely,
based on the study reported in Chapter 2, it possible that both controls and
participants with schizophrenia recorded binocular rivalry dominance durations that
fitted a Gamma distribution, or they both deviated from the Gamma distribution to
the same degree.
3.6.4 Effect of stimulus strength.
It was expected that a significant increase in binocular rivalry rate would be
seen in both groups as stimulus strength increased, as it has been repeatedly reported
that increasing the strength of the binocular rivalry stimulus increases binocular
rivalry rate in healthy controls (Breese, 1899; Fahle, 1982; Levelt, 1968; O’Shea,
1997; O’Shea & Williams, 1996; Rogers et al., 1977). The stimulus strength for
high- and low-stimulus used here were the same as those reported by Miller et al.,
(2003) and Pettigrew and Miller, (1998). However, binocular rivalry rates were
unchanged by alterations to stimulus strength in both participant groups. This
contrasts with the results for healthy control participants in Miller et al., (2003), who
reported binocular rivalry rates of 0.42 Hz (n = 30) in a lower-strength stimulus, and
in Pettigrew and Miller (1998), who reported rates of 0.60 Hz (n = 63) with the
higher strength stimulus. Binocular rivalry rates here are approximately 0.54 Hz for
both stimulus strengths.

Chapter 3: Slower Binocular Rivalry Rates in Individuals with Schizophrenia Compared to Healthy Controls103
While moving rivalrous stimuli presented at equal strength to each eye, lead to
a greater suppression, and therefore faster binocular rivalry rates, than static patterns
(Norman, Norman & Bilotta, 2000; Cobo-Lewis, Gilfory & Smallwood, 2000), it is
unlikely that a change in spatial frequency from 4 cpd to 8 cpd or a 10% difference in
luminance contrast (0.9 compared to 1.0) would contribute to an increase in
binocular rivalry rate. Thus, it is not surprising that there was no difference in
binocular rivalry rate observed with stimulus strength. This is most likely due to the
inclusion of movement and a modest increase in luminance contrast in the higher-
strength task. Previous data (Liu et al., 1992) suggest that stimulus luminance
contrast would need to be reduced to below 0.5 for a change in binocular rivalry rate
of the magnitude observed by Miller et al., (2003) and Pettigrew and Miller (1998),
when measured in the same participants.
3.6.5 Diagnostic value of binocular rivalry rate.
Prior research has proposed that binocular rivalry rate is able distinguish those
with schizophrenia from non-psychotic illness. The current data, taken together with
previous findings, suggest binocular rivalry rate may distinguish those with major
psychiatric illness from healthy individuals. The classic ‘Kraepelin differentiation of
schizophrenia and bipolar disorder’ is questionable (see Greene (2007) for a review).
It is possible that differences in binocular rivalry rate reflect general cognitive
deficits or abnormal neurotransmitter function within the central nervous system. As
previously noted, neurotransmitter involvement in binocular rivalry has been
demonstrated using the traditional hallucinogenic beverage ‘Ayahuasca’ (Carter et
al., 2005; Frecska, White & Luna, 2003; Frecska, White et al., 2003). The active
ingredient is Psilocybin, a (serotonin) 5HT1A and 5HT2A agonist, decreases
binocular rivalry rate in a dose-dependent manner (Carter et al., 2005; Carter et al.,
104Chapter 3: Slower Binocular Rivalry Rates in Individuals with Schizophrenia Compared to Healthy Controls
2007; Nagamine et al., 2007). Similar results have been reported using
Tandospurone, a 5HT1A agonist (Nagamine et al., 2008).
3.6.6 Physiological mechanisms for the slowing of binocular rivalry rate.
While the exploration of serotonin agonists’ effects on binocular rivalry rate is
logical based on Pettigrew and Miller’s suggestion that slow binocular rivalry rate is
a trait maker for BPD, this is not direct evidence to support this suggestion.
Although serotonin is related to the pathogenesis of BPD other neurotransmitters also
play a role, for example the glutamatergic and cholinergic systems (muscarinic and
nicotinic systems) and melatonin (Zarate, 2008). Pettigrew and colleagues suggest
the slow binocular rivalry rate is due to the effect of serotonin on oscillatory
mechanisms within the brainstem, where there is a high concentration of serotonin
receptors. However, serotonin receptors are widely throughout the human brain
including the mesolimbic regions. In these regions agonism of serotonin (particularly
5HT2A) receptors is likely to stimulate dopamine release. Psilocybin ingestion has
been shown, using positron emission tomography (PET) to enhance striatal dopamine
release in healthy volunteers (Vollenweider et al., 1999). Modifications in qEEG
with ingestion of Tandospurone are reported to be in line with other pro-
serotoninergic and pro-dopaminergic drugs (Riba, Rodriguez-Fornells & Barbanjo,
2002). These effects on binocular rivalry rate can as easily be accounted for in the
serotonin-mediated release of dopamine in the striatum. Furthermore, stimulation of
5HT2A receptors has also been implicated in dopamine release through the action of
GABA pathways (Vollenweider et al., 1999). Dopamine has also been implicated in
BPD (Pearson et al., 1995; Yatham et al., 2005) and post-traumatic stress disorder
(PTSD), depression and anxiety (Barnes et al., 2006; Freeman, Freeman & McElroy,
2002; Seeman et al., 2002). Neurotransmitters have complex interactions within the

Chapter 3: Slower Binocular Rivalry Rates in Individuals with Schizophrenia Compared to Healthy Controls105
central nervous system; it is likely that most mental illnesses will involve common
neurotransmitter activity, which is reflected in the overlapping of symptoms and
treatment modalities.
3.6.7 Effect of schizophrenia medication dose.
Slow binocular rivalry rates were found in participants with schizophrenia, a
disorder hypothesised to be caused by abnormally high levels of dopamine in the
central nervous system, with major treatments consisting of agents that block
dopamine (Abi-Dragham, 2004; Fudge & Emiliano, 2003; Kapur & Mamo, 2003).
In the current study significant differences were seen in binocular rivalry rate by dose
of anti-psychotic agents, with slower binocular rivalry rates seen at higher doses.
Furthermore, severity of symptoms of schizophrenia (measured by PANSS scores)
was associated with increased anti-psychotic dose (in CPZE) (Z = -3.93, p < .001),
suggesting that participants with schizophrenia experiencing more symptoms of their
illness recorded slower binocular rivalry. These factors suggest a role of dopamine
activity in binocular rivalry. Dopamine involvement in binocular rivalry seems
likely as factors known to be related to dopamine such as age (Tarita-Nistor et al.,
2006), visual acuity and luminance contrast have also been demonstrated to alter
binocular rivalry rate in groups of individuals (Fahle, 1982; Hollins, 1980; Mueller,
1990; O’Shea, Blake, & Wolfe, 1994). It is acknowledged that our results do not
argue against a role of serotonin per se, as the majority of participants with
schizophrenia in our sample were taking medications that interact with both
dopamine and serotonin receptors. Anti-psychotic medications vary in their
serotoninergic and dopaminergic affinities, with some typical anti-psychotic drugs
having little or no influence on serotonin (for example, Haloperidol) while other have
specific Serotonin (5-HT2A) affinity (for example, Olanzapine) (Seeman, 2002).

106Chapter 3: Slower Binocular Rivalry Rates in Individuals with Schizophrenia Compared to Healthy Controls
While most antipsychotic agents block dopamine (for example, Risperidone), others
are dopamine agonists (for example, Aripiprazole) (Seeman, 2002). Slower
binocular rivalry rate may be associated with reduced dopamine release in the visual
pathways, either by known dopaminergic processes within the primary visual
pathways or by the stimulatory effect of serotonin receptors on striatal dopamine
release.
3.7 Conclusion
The main finding of this study was that binocular rivalry rates were
significantly slower in participants with schizophrenia than in healthy controls. This
was evident for both low-strength and high-strength binocular rivalry stimuli.
However, no difference in binocular rivalry rate was found in the rate of perceptual
alternations in a monocular task (Necker Cube). These data suggest that slow
binocular rivalry rate is not specific to BPD as previously reported, but may be a
feature of major psychiatric disorders more broadly. High-dose anti-psychotic
medication affected binocular rivalry rate, suggesting that slow binocular rivalry rate
may indicate increased dopamine release within the striatum or visual pathways.
This effect may be moderated by dopamine release.
Although not sensitive enough to separate diagnostic groups within those
with schizophrenia, the binocular rivalry task may be an appropriate measure to
include in a battery of tasks to investigate neurotransmitter involvement in psychosis
including schizophrenia and other mental illnesses. It is also possible that there are
more fundamental differences in binocular rivalry in schizophrenia that can be
attributed to abnormal visual processing within specific visual pathways.
Differences within the ‘transient visual pathway’ (closely associated to the
magnocellular system) and the ‘sustained visual pathway’ (associated with the

Chapter 3: Slower Binocular Rivalry Rates in Individuals with Schizophrenia Compared to Healthy Controls107
parvocellular visual system) (Bretmeyer & Ganz, 1976) require further exploration in
this regard.
Chapter 4: Binocular Rivalry and Backward-Masking Tasks Reveal Pathway-Specific Abnormalities in Schizophrenia 108
4.1 Magnocellular and Parvocellular Pathways in Schizophrenia
The most prominent theory related to visual abnormalities in schizophrenia is
the ‘Transient Channel Hypothesis’ (Breitmeyer & Ganz, 1976; Butler et al., 2003;
Green, Neuchterlein, Breitmeyer, Tsuang & Mintz, 2003; Keri, Antal, Szekeres,
Bebedek & Janka, 2000; Schechter et al., 2005). The Transient Channel Hypothesis
proposes that the neuronal pathway that integrates dynamic visual information (i.e.
the magnocellular pathway), such as the position and spatial relationships of visual
stimuli and the attention-capturing mechanism, is impaired in schizophrenia. Over
activity may interrupt the neural processing of the sustained (or parvocellular) visual
pathway (Butler et al., 2003). There is general agreement that the anomalous
perceptual abnormalities observed in schizophrenia (seen in both medicated and
medication-näive first-episode schizophrenia) are associated with the heightened
sensitivity of the magnocellular pathway (Kiss, Fabian, Benedek & Keria, 2010). It
is possible that early visual processing deficits occur in both magnocellular and
parvocellular systems; however it is considered that those with predominantly
magnocellular input contribute to down-stream processing (Brittain, Surguladze,
McKendrick & Ffytche, 2010).
Transient visual-pathway (or magnocellular-pathway) abnormalities in
schizophrenia have been reported to account for altered backward-masking task
performance (Breitmeyer & Ganz, 1976; Butler et al., 2003; Candenhead et al., 1998;
Green et al., 1999; Green et al., 1994a, 1994b; Green et al., 2003; Keri et al., 2000;
Schechter, Butler, Silipo, Zemon & Javitt, 2003; Slaghuis, 1998, 2004), impaired
motion-defined letter task performance (Schwartz et al., 1999a), inaccurate smooth
Chapter 4: Binocular Rivalry and Backward-Masking Tasks Reveal Pathway-Specific
Abnormalities in Schizophrenia
Chapter 4: Binocular Rivalry and Backward-Masking Tasks Reveal Pathway-Specific Abnormalities in Schizophrenia 109
pursuit tracking (Schwartz et al., 1999b) and reduced amplitudes and increased
latency of components of the transient visual-evoked potential (tVEP) (Schechter, et
al., 2005).
Exploring binocular rivalry using stimuli that bias task processing to either
the magnocellular or parvocellular pathways in this group of individuals provides a
unique opportunity to explore the ‘visual pathway’ theories of binocular rivalry,
while investigating further visual awareness functions in schizophrenia. While it is
not possible to completely separate the magnocellular and parvocellular pathways
during psychophysical testing, due to considerable inter-play between them
(Livingstone & Hubel, 1987; Shapley, 1992), it is possible to use binocular rivalry
stimuli biased to preferentially stimulate either pathway. Changing the
characteristics of stimuli used to bias the task to a particular anatomical visual
pathway is an approach taken by other researchers using other neurophysiologic
measures. For example, magnocellular and parvocellular selective stimuli have been
used to elicit differential components in measuring tVEP (Crewther, Crewther,
Klistorner & Kiely, 1999; Foxe, Strugstad, Sehatpour, Molholm, Pasieka, Schroede,
& McCourt, 2008; Klistorner, Crewther, & Crewther 1996; Klistorner, Crewther &
Crewther, 1997; Lalor, Yeap, Reilly, Pearlmutter & Foxe, 2008; Schechter et al.,
2005) in backward-masking tasks (Breitmeyer & Ganz, 1976; Butler et al., 2003;
Cadenhead et al., 1998; Green et al., 1994a, 1994b; Green et al., 1999; Keri et al.,
2000; Schechter et al., 2003), in motion-defined letter tasks (Schwartz et al., 1999a)
and in smooth pursuit tracking tasks (Schwartz et al., 1999b). Using tasks for
selective biasing of the parvocellular and magnocellular systems is an approach that
has been endorsed by the Cognitive Neuroscience Treatment Research to Improve
Cognition in Schizophrenia (CNTRICS) (Green et al., 2009).

110 Chapter 4: Binocular Rivalry and Backward-Masking Tasks Reveal Pathway-Specific Abnormalities in Schizophrenia
4.1.1 Physiological differences in the magnocellular and parvocellular
pathways.
Parvocellular neurons show a sustained response when presented with long-
duration stimuli. Magnocellular neurons respond to the same stimuli in a transient
fashion, with only a brief burst of activity at stimulus onset and offset (Schwartz,
1999). These time-course differences suggest that parvocellular and magnocellular
neurons play different roles in processing temporal information. The magnocellular
neurons that constitute the transient (magnocellular) pathway have large axons that
transfer information quickly to cortical areas (with conduction velocities of
approximately 4 m/s (Kolb, Ferandez & Neslon, 2009), therefore are more suited to
carry information regarding the onset and offset of stimuli. They respond rapidly to
changes in illumination, and can resolve high-temporal-frequency stimuli and
moving or flickering stimuli. Magnocellular-biased binocular rivalry stimuli should
therefore be moving or flickering. However, the smaller parvocellular neurons of the
sustained parvocellular pathway transfer temporal information more slowly (at
conduction velocities of approximately 2 m/s (Kolb et al., 2009), so are best suited to
code low temporal frequencies and stationary, or near-stationary, stimuli
(Livingstone & Hubel, 1988). Thus, stationary binocular rivalry stimuli are most
appropriate to stimulate parvocellular processing.
In terms of the colour of the binocular rivalry stimuli, parvocellular neurons
display colour opponency while magnocellular neurons do not (Shapley, 1992). That
is, stimuli of a particular wavelength may either stimulate or inhibit parvocellular
neurons, thus these cells are thought to play a large role in colour perception
(Schwartz 1999; Shapley, 1990). In contrast, the majority of magnocellular neurons
show little or no colour opponency. The magnocellular neurons’ responses to a

Chapter 4: Binocular Rivalry and Backward-Masking Tasks Reveal Pathway-Specific Abnormalities in Schizophrenia 111
stimulus are the same regardless of the wavelength; these cells are monochromatic
and do not contribute to wavelength-based discriminations (Schwartz, 1999).
However, a small portion of magnocellular cells have an inhibitory mechanism
selective to long wavelength red light (Shapley, 1990; Wiesel & Hubel, 1990; Wiesel
& Hubel, 1966). Therefore, red light inhibits some magnocellular processing
(Shapley, 1990). Using red stimuli for the parvocellular binocular rivalry (BR) task
and colourless (black and white) stimuli for the magnocellular BR task exploits this
property and allows greater relative separation of the pathways.
Magnocellular and parvocellular cells are 'tuned' (i.e. respond best) to objects
of particular sizes or with particular spatial frequency distributions. Parvocellular
cells are small (often referred to as midget cells) with small receptive fields (a term
that describes the spatial properties of retinal ganglion cells) (Kolb et al., 2009). The
smaller diameter of the parvocellular neurons manifest higher spatial frequency
resolution, allowing these cells to discriminate the fine detail of a stimulus, including
coding for colour and spatial detail. Magnocellular cells (parasol cells) are large
cells with broader dendritic fields and larger receptive fields, and are less responsive
to spatial detail. These large cells operate when there is low luminance contrast; that
is when there is only a small difference in the brightness of the image compared to
its background (Skottun & Skoyles, 2007). Therefore, using stimuli of high spatial
frequency for the parvocellular binocular rivalry task and low spatial frequency
stimuli for the magnocellular binocular rivalry tasks are appropriate.
Parvocellular cells are generally receptive to colour, but not to fast movement,
and are concerned with the spatial detail of objects. Contrastingly, magnocellular
cells are ‘colour blind’, sensitive to movement at low luminance contrast but do not
possess fine spatial discrimination (Shapley, 1992). The transient (or magnocellular)
112 Chapter 4: Binocular Rivalry and Backward-Masking Tasks Reveal Pathway-Specific Abnormalities in Schizophrenia
visual pathway is considered to be concerned with the ‘Where is it?’ component of
vision, while the sustained (or parvocellular) visual pathway is concerned with the
‘What is it?’ component (Livingstone & Hubel, 1988; Schwartz, 1999). The
experiments described in this chapter use binocular rivalry stimuli with different
characteristics to produce a relative processing bias toward either the magnocellular
or parvocellular system, as described in Section 4.2.1.1.
4.1.2 Magnocellular and parvocellular pathways in binocular rivalry.
There is debate about the nature of the binocular rivalry process, particularly in
terms of localisation. There are two widely-held arguments: ‘pattern rivalry’ and
‘eye rivalry’ (reviewed in Blake, 2001 and Tong, 2001). Proponents of ‘pattern
rivalry’ theories suggest that binocular rivalry occurs with competition between the
monocular neurons in the extra striate visual cortex V1 (Blake, 1989) or in the lateral
geniculate nucleus (LGN) (Lehky, 1988). Supporters of an ‘eye rivalry’ theory
assert binocular rivalry arises from competition between the cortical representations
of each image in higher visual cortical areas (Leopold & Logothetis, 1996;
Logothetis & Schall, 1989; Sheinberg & Logothetis, 1997). The ‘eye rivalry’ theory
proposes that binocular rivalry occurs within both lower- and higher-visual
processing areas, and that binocular rivalry is a consequence of the actions of either
the magnocellular (Livingstone & Hubel, 1987) or parvocellular visual pathways
(Carlson & He, 2000; He et al., 2005). This view suggests that binocular rivalry
results from neuronal processes that occur at all stages of visual processing. This
includes magnocellular and parvocellular cells in the monocular neurons of the
LGN, superior colliculi (Livingstone & Hubel, 1988) and V1, as well as higher
processing areas in the cortex, such as the ventral and dorsal streams carrying
information to parietal and temporal cortical areas (Wandell, 1995).

Chapter 4: Binocular Rivalry and Backward-Masking Tasks Reveal Pathway-Specific Abnormalities in Schizophrenia 113
The findings of the few studies that have investigated magnocellular and
parvocellular pathway contributions to binocular rivalry have not been consistent
(Blake, 2001). For example, Hollins and Hudnell (1980) speculated that rivalry was
dependent on the transient or magnocellular pathway, as the spatial frequencies of
patterns that resulted in the strongest rivalry percept were within the range usual for
magnocellular processing. This notion was supported by Livingstone and Hubel
(1987) who found that stimuli with characteristics thought to be processed via the
parvocellular pathway yielded fusion rather than rivalry. To further support the case
for magnocellular involvement, rivalry occurs for competing stimuli presented at
alternation rates that favour the magnocellular pathway (Blake & Boothroyd, 1985).
Furthermore, rivalry can occur between competing motion after-effects (Blake, et al.,
1998) which are generally thought to arise from magnocellular processing (Tootell et
al., 1995). However, some studies using stimuli that strongly activate the
magnocellular pathway have failed to generate rivalry (Liu et al., 1992; O’Shea &
Blake, 1986) or have (at best) yielded weak rivalry (Carlson & He, 2000).
Furthermore, the work of Kulikowski, (1992) and O’Shea (1996) demonstrated that
stimuli that are processed primarily by the parvocellular pathway could yield clear,
crisp rivalry, and stimuli with luminance contrasts above the saturation of
magnocellular cells also produced crisp binocular rivalry (Alexander, 1951; Levelt,
1965, 1967). Flickering stimuli (Wade, 1975; Wolfe, 1983a; Wolfe, 1983b), and
those that differ in the temporal characteristics of two stimuli, tend to fuse (O’Shea
& Blake, 1986) whereas colour conflict stimulates crisp binocular rivalry
(Kulikowski, 1992; Wade, 1975). This also suggests that parvocellular pathways
are involved in binocular rivalry (He et al., 2005). The observation that motion
information can be integrated at the same time as form rivalry (Andrews &
114 Chapter 4: Binocular Rivalry and Backward-Masking Tasks Reveal Pathway-Specific Abnormalities in Schizophrenia
Blakemore, 1999; Carlson & He, 2000) and colour rivalry (Carney et al., 1987) has
led to the hypothesis that both pathways are necessary for binocular rivalry (He et
al., 2005).
This chapter is divided into two sections. The first measures binocular rivalry
rates and dominance durations in participants with schizophrenia and healthy
controls, using visual stimuli biased towards the magnocellular and parvocellular
visual pathways. The second compares this binocular rivalry task with a visual
backward-masking task, a task that has been used extensively to investigate
magnocellular pathway abnormalities in participants with schizophrenia (Butler et
al., 2003; Cadenhead et al., 1998; Green et al., 1994b; Green, Nuechterlein,
Breitmeyer & Mintz, 2005; Green, Nuechterlein, Breitmeyer & Mintz, 2006). A
model of binocular rivalry is proposed based on the sustained-transient theory of
visual backward masking.
4.2 Study 3, Experiment 1: Assessing Binocular Rivalry in Schizophrenia Using
Stimuli that Bias the Magnocellular and Parvocellular Visual Pathways
The aim of the first study was to measure binocular rivalry rates in participants
with schizophrenia and healthy controls, using visual stimuli biased towards the
magnocellular and parvocellular visual pathways. It was predicted that binocular
rivalry rates in participants with schizophrenia would be slower than that of healthy
controls, with the greatest abnormality observed using stimuli biased towards the
magnocellular pathway, given that deficits in the magnocellular pathway are reported
in schizophrenia (Breitmeyer & Ganz, 1976; Butler et al., 2003; Cadenhead et al.,
1998; Keri et al., 2000; Green et al., 1999; Green et al., 1994a, Green et al., 1994b;
Green et al., 2003; Schechter et al., 2003; Schechter et al., 2005; Schwartz et al.,
1988; Schwartz et al., 1999b, Slaghuis, 1998; Slaghuis, 2004).
Chapter 4: Binocular Rivalry and Backward-Masking Tasks Reveal Pathway-Specific Abnormalities in Schizophrenia 115
4.2.1 Method.
4.2.1.1 Participants with schizophrenia.
Twenty individuals with schizophrenia, who participated in the study described
in Chapter 3, were recruited to the study; however three were excluded due to
insufficient contrast sensitivity to reliably perform the magnocellular BR task,
leaving 17 remaining participants. Six participants met the schizophrenia sub-type
classification of paranoid schizophrenia, with the remaining 11 categorised as
undifferentiated schizophrenia sub-type (Structured Clinical Interview for the DSM-
IV). Six participants had positive symptoms of schizophrenia, nine had negative
symptoms and two had equal positive and negative symptoms as assessed by the
PANSS (Kay et al., 1988). Fourteen participants were taking atypical anti-psychotic
medication (four taking Olanzapine, three taking Risperidone, five taking Clozapine,
one taking Quetiapine and one taking Amisulphride) and three were taking typical
anti-psychotic medication. The CPZEs of their dosages ranged from 200-800
mg/day, with the average being 479.4 mg/day. All participants had normal vision and
6/6 visual acuity (corrected or uncorrected) in each eye, as assessed by Snellen visual
acuity testing.
4.2.1.2 Control participants.
Twenty-five control participants were recruited to the study. Of the 25 control
participants, 17 had participated in the study described in Chapter 2, and eight new
participants were recruited. One male participant was excluded as he had
insufficient contrast sensitivity to reliably perform the magnocellular BR task
leaving 24 participants. All participants had normal vision and 6/6 visual acuity
(corrected or uncorrected) in each eye measured by Snellen visual acuity testing.
Participant characteristics are detailed in Table 4.1.

116 Chapter 4: Binocular Rivalry and Backward-Masking Tasks Reveal Pathway-Specific Abnormalities in Schizophrenia
Table 4.1: Age, gender, eye dominance and NART score of participants with schizophrenia and controls
Controls (n=24)
Schizophrenia(n=17)
χ2 df p
Age Mean (yrs) 38.4 36.5 Range 21-64 23-54 24.382 23 0.383 Gender Male 4 13 Female 20 4 14.664 1 <0.001 Eye Dominance R)eye 15 11 L)eye 9 6 0.021 1 0.575 NART Score Mean 116.4 113.7 Range 102-122 101-124 19.514 16 0.243
4.2.1.3 Binocular rivalry stimuli to bias the magnocellular and parvocellular
pathways.
The binocular rivalry stimuli were presented in the same manner as described
in Chapter 2 (Section 2.2.2.1). The stimuli to bias task processing to the
magnocellular pathway (herein referred as magnocellular BR stimulus) consisted of
achromatic horizontal and vertical lines of low spatial frequency (1 cpd), at low
luminance contrast (8%) moving at approximately 4 Hz presented in a circular
aperture measuring 1.5 degrees of visual angle. The stimuli biasing the task to the
parvocellular pathway (herein referred to as parvocellular BR stimulus) consisted of
stationary red vertical and horizontal lines of high spatial frequency (10 cpd) and at
high luminance contrast (90%). Red vertical and horizontal lines were chosen for
the parvocellular BR tasks as it been demonstrated that red light or red backgrounds
can suppress magnocellular neural function (Bedwell, Brown & Miller, 2003;
Breitmeyer & Williams, 1990; Breitmeyer & Breier, 1994; Edwards, Hogben, Clark
& Pratt, 1996; Pammer & Lovegrove, 2001; Skottun, 2004).
Chapter 4: Binocular Rivalry and Backward-Masking Tasks Reveal Pathway-Specific Abnormalities in Schizophrenia 117
While every effort has been made to produce binocular rivalry stimuli that
bias the magnocellular and parvocellular pathway, complete separation cannot be
assured. It is difficult to produce a stimulus that biases only the parvocellular visual
system as the two pathways overlap in their spatial frequency selectivity (Ellemberg,
Hammarrenger, Lepore, Roy & Guilemot, 2001). Although the sensitivity of
magnocellular neurons is lower than parvocellular neurons at higher spatial
frequency, allowing free eye movements which generate transients suggests that the
magnocellular neurons may potentially respond to the stimuli presented in the
parvocellular BR task.
4.2.1.4 Recording binocular rivalry.
Each participant completed three two-minute blocks of binocular rivalry using
the magnocellular- and parvocellular-biased binocular rivalry stimuli described
above. The methods for recording the binocular rivalry data were the same as
described previously in Chapter 2 (see Section 2.4, procedure).
4.2.2 Statistical analyses.
A power analysis was performed to determine the minimum number of
participants required to demonstrate a difference in binocular rivalry rates between
the two groups. The findings from the studies presented in Chapters 2 and 3 were
entered into the G*power3 program (Faul et al., 2007). It was estimated that a
sample size of 14 in each group was required for a two-sided 5% significance level
and power of 80 to demonstrate a difference in binocular rivalry rate in the
magnocellular and parvocellular BR tasks in the two groups.
The effects of group, gender, age, education and NART score on binocular
rivalry rate were determined by Kruksal-Wallis one-way non-parametric analyses of
variance. Planned comparison Mann-Whitney U tests were performed to determine

118 Chapter 4: Binocular Rivalry and Backward-Masking Tasks Reveal Pathway-Specific Abnormalities in Schizophrenia
the differences in binocular rivalry rate between participants with schizophrenia and
controls in both the magnocellular and parvocellular BR tasks. Analyses of three
factors unique to the schizophrenia group (diagnostic sub-group, dose of
antipsychotic medication measured in CPZEs, and positive and negative symptoms
of schizophrenia) were conducted, to more-fully examine influences on binocular
rivalry rate in participants with schizophrenia. These contrasts utilised the Mann-
Whitney U test.
Dominance durations, i.e. the time between button pushes (time intervals spent
viewing horizontal lines and vertical lines) were normalised for each participant (by
dividing each time interval by the grand mean for each participant) and then each
group was compared using the Smirnov test (Conover, 1971). The resulting
distributions were considered significant at the p<0.05 level of significance where α
is if T1 exceeds its 1 – α quantile. The 0.95 quantile of T1 is given by w0.95 ≈1.36√
m+n/ mn (Conover, 1971) (see previous chapter, Section 2.5.1 for details).
4.2.3 Results.
4.2.3.1 Binocular rivalry rate.
There was a significant between-group difference in binocular rivalry rate for
both the magnocellular and parvocellular BR tasks (χ2 [1, 41] = 10.6-6, p = .001 in
the magnocellular BR task and χ2 [1, 41] = 14.761, p < .001 in the parvocellular BR
task). Gender also had an effect on binocular rivalry rate in both tasks, with males
showing slower rates (magnocellular BR task gender χ2 [1, 41] = 4.486, p = .034 and
parvocellular BR task χ2 [1, 40] = 9.775, p= .002). Age and NART score had no
effect on binocular rivalry rate in either task (age; magnocellular BR task χ2 [1, 23] =
21.283, p = .564, parvocellular BR task χ2 [1, 23] = 23.383, p <.283, and NART;
Chapter 4: Binocular Rivalry and Backward-Masking Tasks Reveal Pathway-Specific Abnormalities in Schizophrenia 119
magnocellular BR task χ2 [1, 15] = 17.557, p = .287, parvocellular BR task χ2 [1, 15]
= 17.206, p = .307).
In the magnocellular BR task, binocular rivalry rates were significantly slower
in the group with schizophrenia (n = 17, mean rate 0.22Hz, SD= 0.11) compared to
healthy controls (n = 24, mean rate 0.38Hz, SD=0.17, Z = -3.257, p< .001).
Participants with schizophrenia were on average 0.16 Hz slower than healthy
participants (range group with schizophrenia 0.092-0.438 Hz; healthy 0.192-0.775
Hz) in the magnocellular BR task. Those with schizophrenia also recorded
significantly slower binocular rivalry rates in the parvocellular BR task (n = 17,
mean rate 0.24Hz, SD= 0.09) compared to controls (n = 24 mean rate 0.46Hz, SD=
0.22, Z = -3.842, p< .001). Participants with schizophrenia were 0.22 Hz slower than
control participants on average (range for schizophrenia 0.125-0.392 Hz, healthy
participants 0.217-1.050 Hz) in the parvocellular BR task. These data are presented
in Figure 4.1.
Control participants recorded significantly faster binocular rivalry rates in the
parvocellular, compared to the magnocellular BR task (n = 24), mean rate 0.457 Hz,
SD = 0.22 compared to 0.384 Hz, SD = 0.17 respectively (Z = -2.387, p =. 017).
This effect was not observed in the participants with schizophrenia, (n = 17) mean
rate 0.237 Hz, SD = 0.088 compared to 0.224 Hz, SD = 0.113 respectively (Z = -
0.621, p =. 535).
Planned comparisons revealed that females recorded significantly faster
binocular rivalry rates than males in both tasks. For the magnocellular BR task, the
oscillation rate was 0.64 Hz for females (n =2 4, M = 0.636 Hz, SD = 0.178) and 0.25
Hz for males (n = 17, M = 0.253Hz, SD = 0.137; Z = -2.188, p = .034). For the
parvocellular BR task the rate was 0.45 Hz in females (n = 24, M = 0.445 Hz, SD =

120 Chapter 4: Binocular Rivalry and Backward-Masking Tasks Reveal Pathway-Specific Abnormalities in Schizophrenia
0.23) and 0.25 Hz in males (n = 17, M = 0.254 Hz, SD = 0.07; Z = -3.127, p = .002).
Females recorded significantly faster binocular rivalry rates in the magnocellular BR
tasks than in parvocellular BR tasks (Z = -2.601, p = .009), however no differences
were found in magnocellular verses parvocellular binocular rivalry rates in males (Z
= -0.388, p = .698). Females with schizophrenia (n = 4) recorded slower binocular
rivalry rates in the parvocellular BR task (n = 4, M = 0.191 Hz, SD = 0.06) than
healthy controls (n = 20, M = 0.495 Hz, SD = 0.217) (Z = -2.983, p < .001), but not
in the magnocellular BR task (M = 0.249 Hz, SD = 0.175 compared with M =
0.249Hz, SD = 0.161, Z = -1.822, p = .068). The low participant numbers in some
sub-groups warrant a cautious interpretation of these findings.
Figure 4.1: Binocular rivalry rates recorded in participants with schizophrenia (black triangles) compared to healthy controls (black diamonds).
Diagnostic sub-group, medication dose and negative and positive symptoms of
schizophrenia had no effect on binocular rivalry rates in either the magnocellular or
parvocellular tasks in participants with schizophrenia (Mann-Whitney U tests).
Diagnostic sub-group (paranoid schizophrenia [n = 6] versus undifferentiated
schizophrenia [n = 11] ); magnocellular BR task (Z = -0.453, p = .66) and
0.224 0.237
0.384
0.457
0
0.1
0.2
0.3
0.4
0.5
0.6
Magnocellular BR Task Parvocellular BR Task
BR
Rat
e in
Hz
(but
ton
pus
he
s/se
c)
Schizophrenia (n=17)
Healthy Control (n=24)
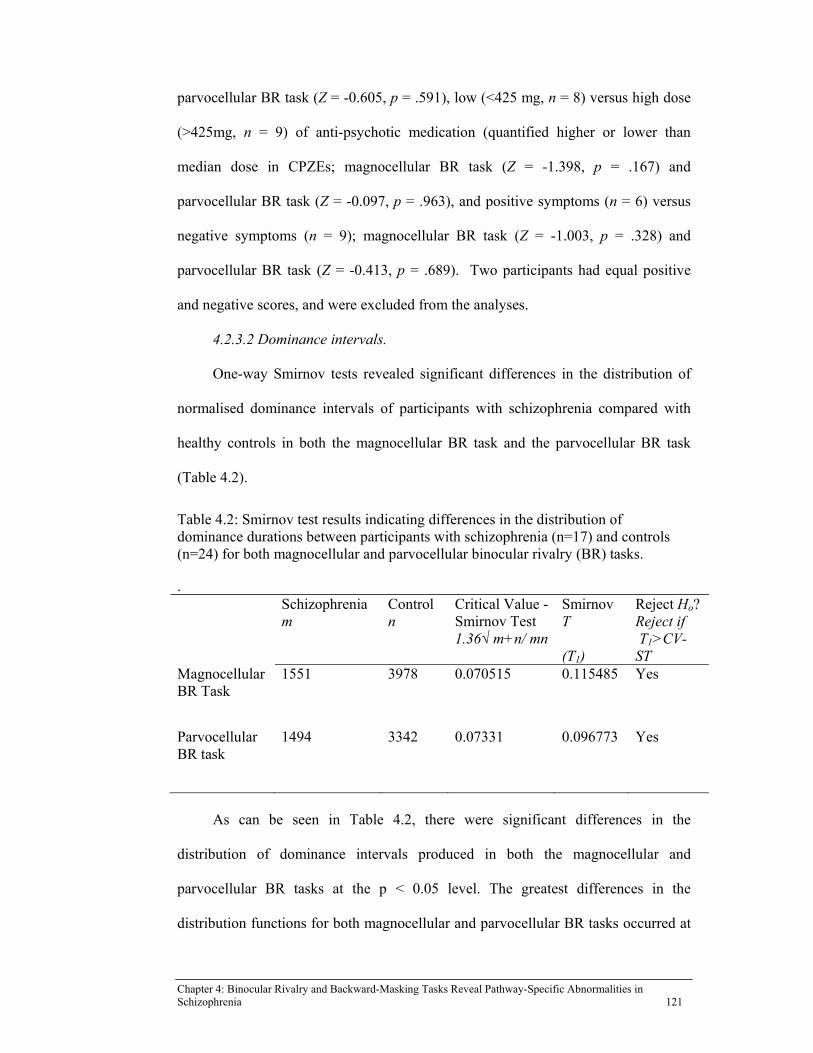
Chapter 4: Binocular Rivalry and Backward-Masking Tasks Reveal Pathway-Specific Abnormalities in Schizophrenia 121
parvocellular BR task (Z = -0.605, p = .591), low (<425 mg, n = 8) versus high dose
(>425mg, n = 9) of anti-psychotic medication (quantified higher or lower than
median dose in CPZEs; magnocellular BR task (Z = -1.398, p = .167) and
parvocellular BR task (Z = -0.097, p = .963), and positive symptoms (n = 6) versus
negative symptoms (n = 9); magnocellular BR task (Z = -1.003, p = .328) and
parvocellular BR task (Z = -0.413, p = .689). Two participants had equal positive
and negative scores, and were excluded from the analyses.
4.2.3.2 Dominance intervals.
One-way Smirnov tests revealed significant differences in the distribution of
normalised dominance intervals of participants with schizophrenia compared with
healthy controls in both the magnocellular BR task and the parvocellular BR task
(Table 4.2).
Table 4.2: Smirnov test results indicating differences in the distribution of dominance durations between participants with schizophrenia (n=17) and controls (n=24) for both magnocellular and parvocellular binocular rivalry (BR) tasks.
. Schizophrenia
m Control n
Critical Value -Smirnov Test 1.36√ m+n/ mn
Smirnov T (T1)
Reject Ho? Reject if T1>CV-ST
Magnocellular BR Task
1551 3978 0.070515 0.115485
Yes
Parvocellular BR task
1494 3342 0.07331 0.096773
Yes
As can be seen in Table 4.2, there were significant differences in the
distribution of dominance intervals produced in both the magnocellular and
parvocellular BR tasks at the p < 0.05 level. The greatest differences in the
distribution functions for both magnocellular and parvocellular BR tasks occurred at
122 Chapter 4: Binocular Rivalry and Backward-Masking Tasks Reveal Pathway-Specific Abnormalities in Schizophrenia
the 0.5 second time interval, as seen in Figure 4.2. This reflects significantly more
dominance intervals of 0.5 seconds in duration being recorded in participants with
schizophrenia. It is notable that although participants with schizophrenia recorded
more dominance durations of less than one second in the magnocellular BR task,
they recorded fewer dominance durations from 1.5 to 4 seconds compared to those
recorded in controls, resulting in a slightly flatter distribution (Figure 4.2a). A
significant separation between any two points on each curve indicates a significant
difference in mean normalised dominance durations. There are significant
differences in the number of dominance durations recorded of 0.5 seconds for both
the magnocellular and parvocellular BR tasks.
4.2.4 Discussion related to magnocellular and parvocellular tasks.
4.2.4.1 Binocular rivalry rates.
Binocular rivalry rates recorded by participants with schizophrenia were
significantly slower for both the magnocellular and parvocellular BR tasks (p <
.001). Slower binocular rivalry rates (or increased mean dominance intervals) in
participants with schizophrenia have been reported elsewhere (Fox, 1965; Frecska,
White et al., 2003; Sappenfield & Ripke, 1961; White et al., 2001; Wright et al.,
2003), suggesting a general finding of slower binocular rivalry rates in
schizophrenia. These data suggest an overall visual abnormality in binocular rivalry
consistent with the findings of backward masking, motion-defined letter tasks,
smooth pursuit eye movement tracking tasks and VEPs (Breitmeyer & Ganz, 1976;
Butler et al., 2003; Cadenhead et al., 1998; Green et al., 1999; Green et al., 2003;
Green et al., 1994a, 1994b; Keri et al., 2000; Schechter et al., 2003; Schechter et al.,
2005; Schwartz, 1999a 1999b; Slaghuis, 1998; Slaghuis, 2004). In this study the
greatest difference in binocular rivalry rates between participants with schizophrenia

Chapter 4: Binocular Rivalry and Backward-Masking Tasks Reveal Pathway-Specific Abnormalities in Schizophrenia 123
and healthy controls was recorded in the parvocellular BR task, rather than the
magnocellular BR task (difference in binocular rivalry rate of 0.22 Hz compared to
0.16 Hz).
Some authors have suggested that the parvocellular visual pathway is
responsible for binocular rivalry (Carlson & He, 2000; He et al., 2005; O’Shea &
Williams, 1996), however one earlier study suggested the opposite (Livingstone &
Hubel, 1987). Therefore, it would be expected that stimuli that bias the binocular
rivalry task to the parvocellular pathway would yield crisp alternations of opposing
images, with few composite images, and thus a faster alternation rate. Conversely,
stimuli that bias the binocular rivalry task to the magnocellular pathway would be
expected to elicit more mixed images where the vertical and horizontal lines attempt
to fuse into a stable percept, leading to longer inter-stimulus intervals and a slower
binocular rivalry rate. It can be seen from Figure 4.1 that control participants
recorded significantly faster binocular rivalry rates in the parvocellular BR task
compared to the magnocellular BR task (magnocellular and parvocellular BR tasks
respectively; M = 0.38 Hz, SD = 0.17 and M = 0.46 Hz, SD = 0.22, Wilcoxon signed
ranks test Z = -2.387, p = .017), which is consistent with the binocular rivalry
literature.
4.2.4.2 Dominance duration intervals.
There was a significant difference (p< .05) in the distribution of dominance
durations recorded by participants with schizophrenia compared to healthy controls
in both binocular rivalry conditions (Conover, 1971). Participants with
schizophrenia recorded significantly more short dominance durations of less than
one second (see Figures 4.2a and 4.2b), resulting in an overall statistical difference in
the distribution of dominance durations between the two groups, and less dominance

124 Chapter 4: Binocular Rivalry and Backward-Masking Tasks Reveal Pathway-Specific Abnormalities in Schizophrenia
durations between 1.5 to 4 seconds. This was reflected in a flatter dominance
distribution curve. The short dominance durations recorded in participants with
schizophrenia did not correlate with faster alternations of rivalling images (i.e. the
binocular rivalry rate). In fact, participants with schizophrenia recorded significantly
slower binocular rivalry rates in both binocular rivalry tasks compared to control
participants. This is likely due to the greater number of dominance durations greater
than 4 seconds recorded by participants with schizophrenia in each task.
a.
Cumulative Frequency Normalised Dominance Durations - Magnocellular BR Task
0.0
0.1
0.2
0.3
0.4
0.5
0.6
0.7
0.8
0.9
1.0
0 0.5 1 1.5 2 2.5 3 3.5 4 4.5 5 5.5 6 6.5 7 7.5 8 8.5 9
Time in seconds
Cu
mu
lati
ve P
rob
abili
ty
Schizophrenia Controls
b.
.
Cumulative Frequency Normalised Dominance Durations - Parvocellular BR Task
0.0
0.1
0.2
0.3
0.4
0.5
0.6
0.7
0.8
0.9
1.0
0 0.5 1 1.5 2 2.5 3 3.5 4 4.5 5 5.5 6 6.5 7 7.5 8 8.5 9
Time in Seconds
Cu
mu
lati
ve P
rob
abili
ty
Schizophrenia Controls
Figure 4.2: Difference between the dominance durations of participants with schizophrenia (n=17) (black lines) and control participants (n=24) (grey lines) for (a) the magnocellular binocular rivalry (BR) task and (b) the parvocellular BR task.

Chapter 4: Binocular Rivalry and Backward-Masking Tasks Reveal Pathway-Specific Abnormalities in Schizophrenia 125
These data are consistent with the idea that individuals with schizophrenia
have abnormal processing in both the magnocellular and parvocellular visual
pathways. If magnocellular processing is ‘overactive in individuals with
schizophrenia, they would be likely to perceive more visual information arising from
short bursts of activity of the magnocellular neurons, interrupting parvocellular
processing further along the visual pathway. This would result in more frequent short
dominance durations. Abnormalities in parvocellular processing may account for the
abnormally long dominance durations in the schizophrenia group that act to slow the
binocular rivalry rate.
The method of binocular rivalry recording employed here requires that
participants ignore mixed or composite images and only record the change in
perception to the opposing image (that is, to record the change from a horizontal or
mixed image to one that is exclusively vertical, or a vertical or mixed image to one
that is exclusively horizontal). There are few stimuli that will produce perfect
binocular rivalry alteration of opposing images. Generally all participants
experiencing binocular rivalry perceive alternation of opposing images interspersed
with periods of mixed or composite image (Burke et al., 1999; Liu et al., 1992;
Mueller & Blake, 1989). As this experiment presented opposing images to each eye
in a continuous fashion, the parvocellular system had sufficient time to process the
spatial and chromatic details of stimuli to produce fast, crisp binocular rivalry
alternations. It has been posited that that one of the functions of the magnocellular
pathway may be to gate parvocellular signals to the cortex (Shapley, 1992) (based on
the observation that the detection of iso-luminant colour patterns is facilitated by
luminance patterns (Switkes, Bradely & De Valois, 1988). It is possible that the
magnocellular pathway simultaneously attempts to fuse the images into a single

126 Chapter 4: Binocular Rivalry and Backward-Masking Tasks Reveal Pathway-Specific Abnormalities in Schizophrenia
percept based on the temporal and luminance properties of the images. Thus the
resulting phenomenon is a period where a single stable image is perceived, followed
by a period of mixed image before a change in perception of the alternative image.
Binocular integration and binocular rivalry have been demonstrated to coexist
in the same spatial location in the visual pathways (Carlson & He, 2000). Carlson
and He (2000) demonstrated that observers were able to perceive binocular rivalry
with respect to the colour and shape of the opposing triangles, while integrating two
temporal frequencies into a ‘slow flicker’ amplitude modulation (beat) using
information from the suppressed stimulus. It is accepted that two flickering
frequencies close together do not lead to binocular rivalry in participants with normal
stereovision; rather a slow flicker amplitude modulation (beat) that corresponds to
the difference between the primary frequencies is seen (Baitch & Levi, 1989; Karrer,
1967). These observations were explained by the authors as being the consequence
of the independent processing of the different attributes in the magnocellular and
parvocellular pathways. They posited that the parvocellular pathway, which
preferentially processes information regarding colour and shape of the stimulus,
leads to binocular rivalry. Carlson & He (2000) and He et al., (2005) suggest that
because the magnocellular pathway was more likely responsible for processing
flicker and temporal features of the stimulus that leads to fusion. Both of these
phenomena could occur at the same time within the same visual location. It could be
argued that the two visual pathways contribute to binocular rivalry, but are both
necessary to process the opposing images presented in binocular rivalry tasks. It can
be seen that participants with schizophrenia and controls were able to maintain crisp
perceivable binocular rivalry in both stimulus conditions. Therefore, if both
pathways contribute to the alternation of perceptual images seen in binocular rivalry
Chapter 4: Binocular Rivalry and Backward-Masking Tasks Reveal Pathway-Specific Abnormalities in Schizophrenia 127
it may be the case that they occur between processes well beyond V1, and after the
computations between stimuli attributes have occurred.
It is possible that significant differences in binocular rivalry rates recorded by
participants with schizophrenia for both the magnocellular and parvocellular BR
tasks demonstrate an abnormality in both pathways, as there is considerable interplay
between the pathways. Although the pathways have been discussed as being quite
distinct, they do interact higher in the visual pathway, in particular in V1 and V2 of
the visual cortex (Shapley, 1990; Livingstone & Hubel, 1987). Schizophrenia
researchers have suggested cognitive disability is related to parvocellular pathway
functioning (Vidyasagar, 1999), while the magnocellular input may be vital for
controlling sequential attention (Kessels, Postma & de Haan, 1999). Hyperactive
magnocellular pathways have also been proposed as being responsible for some
anomalous perceptual experiences, including abnormal intensity of environmental
stimuli, feelings of being flooded and inundated and the inability to focus attention
on relevant details (Keri & Bemedek, 2007).
4.2.4.3 Gender differences.
There is little published research reporting gender differences in binocular
rivalry, with two studies reporting that females recorded faster binocular rivalry rates
than males (Cogan, 1973; Goldstein & Cofoid, 1965). Data from developmental
studies (Gwiazda, Bauer, & Held, 1989) indicate that female infants prefer to view a
rivalrous stimulus (rather than a fusible stimulus) until a mean age of 9.9 weeks; this
preference ceasing significantly earlier than in male infants (averaging 13.8 weeks).
Similarly, females showed evidence of stereopsis at an earlier age (9.1 weeks,
compared with 12.1 weeks for males). No studies could be located where males
were reported to have faster binocular rivalry rates than females. Miller et al., (2003)

128 Chapter 4: Binocular Rivalry and Backward-Masking Tasks Reveal Pathway-Specific Abnormalities in Schizophrenia
found no overall gender effects in their sample of 18 participants with schizophrenia
(males n = 9, females n = 9). Gender effects in subjects with schizophrenia were not
reported in Sappenfield and Ripke (1961), males n = 21, females n = 9, Fox (1965)
males n = 10, females n = 5, and White et al., (2005) males n = 21, females n = 3.
The gender of 24 participants with schizophrenia tested in Frecska et al., (2003) was
not specified. Although statistically significant, the gender differences found in the
current study require replication, given the small number of female participants with
schizophrenia included in the sample (n = 4).
It is possible that the gender-related differences in binocular rivalry observed
here are due to hormonal changes associated with the menstrual cycle. The actions
of oestrogen, progesterone, and androgen have been suggested to contribute to
improved colour vision performance at ovulation (Giuffre, Di Rosa & Fiorino,
2007), increases in visual sensitivity during menstruation (Barris, Dawson & Theiss,
1980) and decreases in pattern reversal evoked potentials (Yilmaz, Erkin, Mavioglu
& Sungurtekin, 1998). Hormonal changes, and the use of oral contraceptives, have
been linked to alterations in retinal function and sensitivity changes in some women
(Eisner, Burkes & Toomey, 2004), however these alterations are not the same for all
visual pathways, and there were pronounced individual differences with individual’s
visual adaptation capabilities varying substantially over periods of weeks (Eisner et
al., 2004). The gender effect observed in the current study may be related to
hormonal effects in the small number female participants included in the sample.
Future studies should control for menstrual cycle variations or use of the
contraceptive pill.
Chapter 4: Binocular Rivalry and Backward-Masking Tasks Reveal Pathway-Specific Abnormalities in Schizophrenia 129
4.3 A Backward-Masking Task Utilising Stimuli that Bias the Magnocellular and
Parvocellular Visual Pathways
4.3.1 Introduction.
Based on a comprehensive review of published literature, no binocular rivalry
studies were identified that used a similar method employing stimuli that bias the
magnocellular and parvocellular visual pathways outlined in Experiment 1 (Section
4.2). Consequently, there are no normative data with which to compare the results
presented in Section 4.2. The current study conducted to validate these results using
another visual task that is widely accepted to reliably bias the magnocellular and
parvocellular visual pathways, using a ‘within-subject design’.
4.3.1.1 Comparing binocular rivalry with other neurophysical tasks.
A search of the literature revealed that a variety of methods have been used to
investigate magnocellular and parvocellular processing in schizophrenia. These
include: contrast sensitivity tasks (Keri & Benedek, 2007; Slaguis, 1998), luminance-
flicker sensitivity (Slaghuis & Bishop, 2001) luminance discrimination tasks
(Delord et al., 2006), random dot patterns and global motion tasks (Chapman, Hoag
& Giaschi, 2004), spatial alignment of dots and gratings and frequency-doubling
(Keri et al., 2004), smooth pursuit tracking where participants were asked to track
dots moving a varying speeds (Schwartz et al., 1999b) and visual backward masking
(Bedwell & Orem, 2008; Birch, 1997; Butler et al., 2003; Buttner et al., 1999;
Cadenhead et al., 1998; Green et al., 1994b; Birch, 1997; Green et al., 2003; Green et
al., 2005; Green et al., 2006; Holzman, 1987; Keri et al., 2000; Keri, Benedek et al.,
2001; Keri, Szendi et al., 2001; McClure, 2001; Slaghuis & Curran, 1999; Weiss,
Chapman, Strauss & Gilmore, 1992). There have also been a number of
electrophysiological studies; VEPs (Butler et al., 2001; Butler et al., 2005; Butler et
130 Chapter 4: Binocular Rivalry and Backward-Masking Tasks Reveal Pathway-Specific Abnormalities in Schizophrenia
al., 2007; Schechter et al., 2005), event related potentials (ERPs) (Butler et al., 2007;
Doniger et al., 2002), along with functional MRI (Martinez et al., 2008).
Visual backward-masking (VBM) tasks have been used most extensively,
with many researchers reporting transient channel or magnocellular pathway
abnormalities in participants with schizophrenia (Butler et al., 2003; Cadenhead et
al., 1998; Green et al., 1994b; Green et al., 2005; Green et al., 2006). Some authors
suggest both pathways are abnormal in participants with schizophrenia (Green et al.,
2003; Keri et al., 2000; Slaghuis & Curran, 1999), unaffected siblings (Birch, 1997;
Green et al., 2005), remitted patients (Butler et al., 2003; Buttner et al., 1999), and
individuals prone to psychosis. Backward masking is thus a promising indicator of
vulnerability to schizophrenia, with backward-masking abnormalities being
suggested as a trait marker for the disease (Bedwell & Orem, 2008; Buttner et al.,
1999; Green et al., 1997; Holzman, 1987; Keri, Benedej et al., 2001; Keri, Szendi, et
al., 2001; McClure, 2001).
There are a number of attributes of VBM that make this an attractive task to
compare with binocular rivalry. Firstly, the stimulus characteristics of the task can
be altered to bias the task for processing via the magnocellular or parvocellular
pathways with the use of colour, luminance contrast, and movement in a similar way
to binocular rivalry. The VBM task can be presented to participants using a
computer and response keypad with minimal specialist training required for the
researcher. Both binocular rivalry and visual backward masking involve suppression
of one image and dominance of an alternative image (image presented to the left
versus right eye in binocular rivalry, the target by the mask in VBM), and abnormal
visual processing has been demonstrated in participants with schizophrenia.
Chapter 4: Binocular Rivalry and Backward-Masking Tasks Reveal Pathway-Specific Abnormalities in Schizophrenia 131
4.3.1.2 Development of the visual backward masking task.
A VBM task was developed based on the task described in Cadenhead et al.,
(1998). Like Cadenhead et al, (1998) a location task for process bias via the
magnocellular visual system (transient pathway) and an identification task for
process bias via the parvocellular visual system (sustained pathway) was adopted.
Identification versus location VBM tasks along with centrally- or peripherally-
located tasks have been used by others in VBM research (Koelebeck, Ohrmann,
Hetzel, Arolt & Suslow, 2005: Saccuzzo, Cadenhead & Braff, 1996). To further
bias the location task to the magnocellular pathway, dark grey letters (chromaticity
x= 0.2751, y= 0.3262, luminance 7.155 cd/m2) were presented at four spatial
locations on a lighter grey background with a 6.9% luminance contrast (chromaticity
x= 0.2756, y= 0.331, luminance 8.245 cd/m2). To further bias the task for the
parvocellular (sustained) pathway red letters (chromaticity x= 0.2967, y= 0.5853,
luminance 2.306 cd/m2) that were 30 pixels (or 8 mm high) were presented centrally
on a green iso-luminant background (chromaticity x=0.5548, y=0.3883, luminance
2.306 cd/m2). Iso-luminance was determined by flashing a test patch of the red and
green patches available on the computer at temporal frequencies of around 20 Hz the
point at which the flicker cannot be detected. When green and red are of equal
luminance, rather than perceiving flashes of green and red, a yellow sheen results
(this is a minimum flicker test) (Anstis & Cavanagh, 1983; Dobkins, Gunther &
Peterzell, 2000). The author and the programmer acted as participants in the
preliminary testing during the development of the backward-masking tasks.
The target letters used in Cadenhead et al., (1998) were changed from A, V, W
and Y to A, V, Y and T as the target letter W was spatially larger to the other three
letters and was unable to be sufficiently masked. Cadenhead et al., (1998) used

132 Chapter 4: Binocular Rivalry and Backward-Masking Tasks Reveal Pathway-Specific Abnormalities in Schizophrenia
overlapping upper case Xs as the mask. Limitations in the software allowed for only
a single letter or symbol to be used as the mask in our task, so overlapping Xs were
not able to be achieved. A single upper-case letter X masked the V and the Y more
effectively than it did the A or T, allowing for the A and T to be more readily
identified in preliminary testing by both the author and programmer. Each letter and
symbol on the computer keyboard was then trialled as the mask letter/symbol. This
showed that the upper case S masked the target letters to the same degree and yielded
more consistent results, with A, T, V and Y targets being identified with equal
proficiency by the author and programmer.
The resulting VBM task was presented on a standard colour computer monitor
in two conditions; an identification task to bias the parvocellular pathway (herein
referred to as the parvocellular VBM task) and a location to bias the magnocellular
pathway (herein referred to as the magnocellular VBM task). The target stimuli in
each task consisted of one of four letters (A, T, V, or Y) presented either centrally in
the parvocellular VBM task, or in one of four locations (up, down, left or right) in
the magnocellular VBM task. The targets were presented at 2.1 degrees of visual
angle from the fixation point (a small black +). The mask consisted of the letter S
that was of equal size to the target letters, positioned so that it spatially overlapped
the target stimuli, centrally in the parvocellular VBM task and in the all four possible
locations in the magnocellular VBM task. In order to keep the VBM task as close to
the binocular rivalry tasks as possible, the target letters and masks were presented for
the same duration in each task. This differed from the tasks administered by
Cadenhead et al., (1998), who used an equal-strength target and mask in the
identification task but increased the energy of the mask in the location task by
presenting the mask for double the duration of the target. In the current study, the
Chapter 4: Binocular Rivalry and Backward-Masking Tasks Reveal Pathway-Specific Abnormalities in Schizophrenia 133
duration of the target stimuli and the mask was 10 msecs. The mask was presented
after each target letter (A, T, V, or Y) or in all locations (up, down, left or right) at
four different inter-stimulus intervals (ISI); 27, 53, 107 and 213 msec (rounded up to
the nearest frame during presentation). Letter/letter location and inter stimulus
interval were counterbalanced over the duration of the task resulting in 64 trials of
stimulus target followed by mask. In each trial a fixation point was presented on the
screen (for 10 msec) following a short tone to indicate the onset of each trial.
4.3.1.3 The visual backward masking task procedure.
Written instructions were developed to ensure that each participant was given
the same information (see Appendix 1 and 2).
A pilot test to trial the backward-masking task was undertaken. Five
participants took part in the pilot test; all participants were female, aged between 27
and 40 years (average age 36.8 years). All were right handed and right-eye dominant
(as determined by a keyhole task), with 6/6 visual acuity.
Each participant completed 256 trials (representing four runs) of both the
magnocellular VBM task and parvocellular VBM tasks. In the parvocellular VBM
task the mask (S) was presented after each target letter (A, T, V, or Y) at four
different inter-stimulus intervals; 27, 53, 107 and 213 msec. This allowed each
target letter to be presented at each inter-stimulus interval on 16 occasions. Letters
and inter-stimulus intervals were counterbalanced over the duration of the task.
Similarly, in the magnocellular VBM task the mask was presented after the target
location (up, down, left or right) at four different inter-stimulus intervals; 27, 53, 107
and 213 msec, and counterbalanced over the duration of the task.

134 Chapter 4: Binocular Rivalry and Backward-Masking Tasks Reveal Pathway-Specific Abnormalities in Schizophrenia
4.3.1.4 Results of preliminary testing.
In the magnocellular VBM task each participant identified the correct location
of each target more than 80% of the time (see Table 4.3). Paired sample t-tests
revealed no significant differences in the number of correct scores between the four
target locations in the magnocellular VBM task (t > 0.05). However, in the
parvocellular VBM task the letters A and V were correctly identified more than 80%
of the time, while the letters T and V were more difficult to locate with correct scores
of less than 80%. Paired t-tests revealed that there were significant differences in the
number of correct scores when comparing A and T (t = 4.0 df = 4, p = .016) and A
and Y (t = 3.64, df = 4, p = .022).
Although there was a significant difference in correct scores between the letter
A and the letters T and Y, it was decided not to change the target or the mask as
preliminary testing identified these letters as the optimal letters to be used within
programming limitations.
A significant practice effect was seen where each of the five participants were
able to almost complete each task without error (reaching a ceiling for near-perfect
scores) in the last 64 trials. A significant improvement in the scores was observed
when comparing the first 64 trials with the last 64 trials in our group; 201 out of a
possible 320 (5 x 64 trials) correct scores (62.5%) in the first 64 trials compared with
310 (96.87%) in the last. This practice effect reflects what is reported in the literature
(Maehara & Goryo, 2003; Wolford, Marchak & Hughes, 1988; Braffin Saccuzzo,
Ingram, McNeill & Langford, 1980). These five pilot participants were excluded
from the later comparison between binocular rivalry and VBM tasks.

Chapter 4: Binocular Rivalry and Backward-Masking Tasks Reveal Pathway-Specific Abnormalities in Schizophrenia 135
Table 4.3: Correct target letter identification by location and letter in a preliminary test of the magnocellular and parvocellular visual backward masking (VBM) task (n = 5).
Magnocellular VBM task Parvocellular VBM task
Location of Target Correctly identified Target Letter Correctly Identified
Down 85% A 93.75%
Left 87.5% T 73.75%
Right 86.25% V 86.25%
Up 81.25% Y 61.25%
Because the VBM tasks were designed to be at (or near) visual threshold, it
was expected that nãive participants would not be able to achieve scores of 100%
correct. A practice non-masking task was developed to ensure that participants had
adequate contrast sensitivity to complete the task, and so that that each participant
understood the task and could accurately identify the targets without introducing a
practice effect. During the development of this task it was evident that the target
letters used in the parvocellular VBM task were more easily identified than the
letters of the magnocellular VBM task. In order to simplify the magnocellular VBM
task to improve the consistency of results, the target letters could either be darkened
to increase the luminance contrast or the letter size could be increased. The letter
size was increased to 40 pixels, as this could be done without fear of reducing the
bias toward the magnocellular visual pathway, as increasing the luminance contrast
to more than 6.9% was more likely to reduce the desired pathway bias.
In the non-masking practice task, participants were asked to identify letters in
the parvocellular VBM task and locate the letters briefly presented on the screen
under the same stimulus conditions as those to be used in the final VBM task. That
136 Chapter 4: Binocular Rivalry and Backward-Masking Tasks Reveal Pathway-Specific Abnormalities in Schizophrenia
is, red letters of 30 pixels on a green iso-luminant background for the parvocellular
non-VBM task, and darker grey letters of 40 pixels presented on a lighter grey
background in for the magnocellular non-VBM task. Each letter was presented on
the screen for 10 msec. An 85% accuracy score was required for the participant to
be considered sufficiently reliable and having adequate visual sensitivity to complete
the VBM task.
4.4 Experiment 2: Comparing Visual Backward Masking and Binocular Rivalry
Tasks to Investigate Magnocellular and Parvocellular Processes.
The aim of Experiment 2 was to compare task performance of participants with
schizophrenia and controls on the magnocellular and parvocellular BR tasks (using
the same stimuli and binocular rivalry method as in Experiment 1) with the
magnocellular and parvocellular VBM tasks (as described in Section 4.3.1.2).
4.4.1 Methods.
4.4.1.1 Schizophrenia participants.
Of the 17 participants with schizophrenia that participated in the magnocellular
and parvocellular BR tasks, one participant was unable to complete the backward
masking task due to an increase in psychotic symptoms associated with their illness,
one participant was unable to achieve 85% correct responses in the non-masking task
and one participant was unable to identify the letters in the parvocellular VBM task
as he was red-green colour blind. This was later confirmed with Ishihara Test for
Colour Blindness (Birch, 1997). This resulted in 14 participants with schizophrenia.
Five participants met the schizophrenia sub-type classification of paranoid
schizophrenia with the remaining nine categorised as undifferentiated schizophrenia
sub-type. Four participants displayed positive symptoms of schizophrenia, eight
negative symptoms and two had equal positive and negative symptoms as assessed
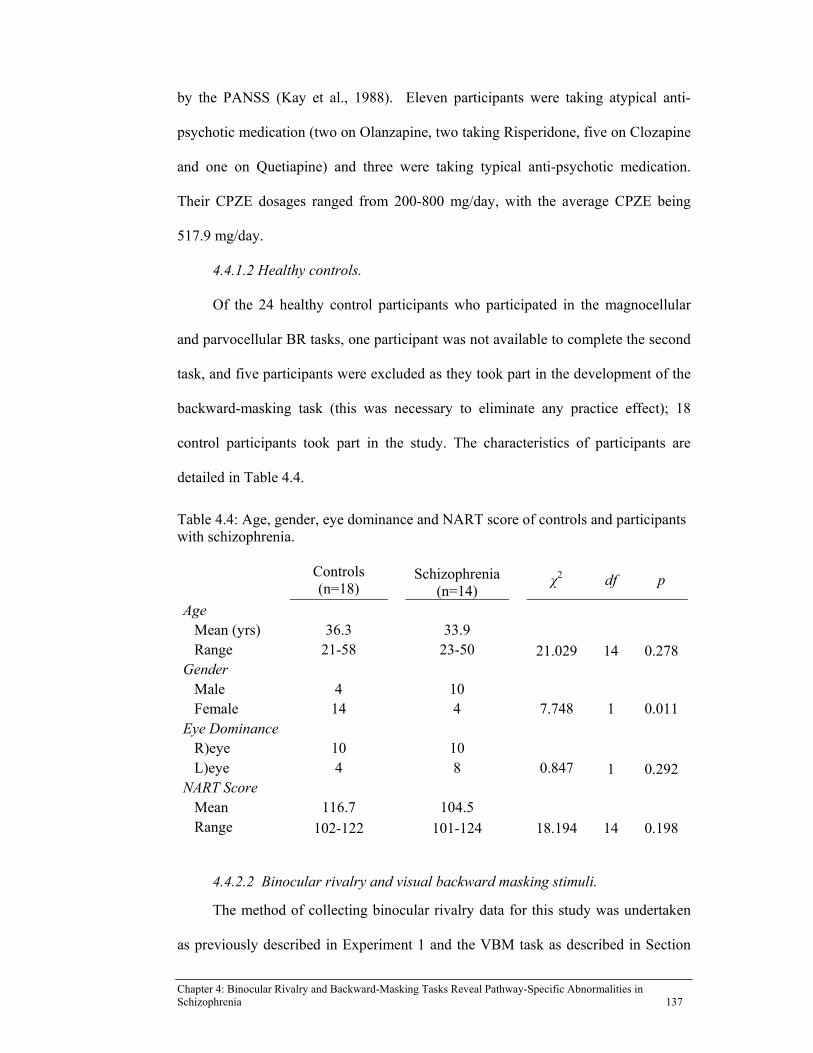
Chapter 4: Binocular Rivalry and Backward-Masking Tasks Reveal Pathway-Specific Abnormalities in Schizophrenia 137
by the PANSS (Kay et al., 1988). Eleven participants were taking atypical anti-
psychotic medication (two on Olanzapine, two taking Risperidone, five on Clozapine
and one on Quetiapine) and three were taking typical anti-psychotic medication.
Their CPZE dosages ranged from 200-800 mg/day, with the average CPZE being
517.9 mg/day.
4.4.1.2 Healthy controls.
Of the 24 healthy control participants who participated in the magnocellular
and parvocellular BR tasks, one participant was not available to complete the second
task, and five participants were excluded as they took part in the development of the
backward-masking task (this was necessary to eliminate any practice effect); 18
control participants took part in the study. The characteristics of participants are
detailed in Table 4.4.
Table 4.4: Age, gender, eye dominance and NART score of controls and participants with schizophrenia.
Controls (n=18)
Schizophrenia(n=14)
χ2 df p
Age Mean (yrs) 36.3 33.9 Range 21-58 23-50 21.029 14 0.278 Gender Male 4 10 Female 14 4 7.748 1 0.011 Eye Dominance R)eye 10 10 L)eye 4 8 0.847 1 0.292 NART Score Mean 116.7 104.5 Range 102-122 101-124 18.194 14 0.198
4.4.2.2 Binocular rivalry and visual backward masking stimuli.
The method of collecting binocular rivalry data for this study was undertaken
as previously described in Experiment 1 and the VBM task as described in Section

138 Chapter 4: Binocular Rivalry and Backward-Masking Tasks Reveal Pathway-Specific Abnormalities in Schizophrenia
4.3.1.2 (see Appendix 1 and 2 for the written and verbal instructions given to each
participant).
4.4.2 Statistical analyses.
Binocular rivalry rate (button pushes per second, Hz), binocular rivalry
dominance intervals (the time from onset of perceiving one eye’s image to the onset
of the opposing image (measured in msec), and VBM correct scores (number correct
total and at each inter-stimulus-interval) were entered into a computerised statistical
package (SPSS – Student Version 14) for analysis. Kolmogorov-Smirnov and
Shapiro-Wilks statistics for normality were calculated for both binocular rivalry and
VBM tasks.
Kruksal-Wallis one-way non-parametric ANOVAs were performed to
determine the effect that group, gender, age, education and NART score had on
binocular rivalry rate in the binocular rivalry tasks and number of correct VBM
scores. Planned comparison Mann-Whitney U tests were performed to determine
differences in binocular rivalry rate and visual backward masking scores between
participants with schizophrenia and healthy controls in both the magnocellular and
parvocellular tasks. Plotted normalised dominance intervals for the BR tasks were
compared using a one-way Smirnov test.
4.4.3 Results.
4.4.3.1 Binocular rivalry rates.
As the binocular rivalry rate data were not normally distributed, Kruksal-
Wallis one-way non-parametric ANOVAs were performed. It was revealed that
group had a significant main effect on binocular rivalry rate for both the
magnocellular and parvocellular BR tasks; χ2 (1, 41) = 5.374, p<.02 magnocellular
BR task and χ2 (1, 41) = 7.498, p<.006 in the parvocellular BR task. Age and gender

Chapter 4: Binocular Rivalry and Backward-Masking Tasks Reveal Pathway-Specific Abnormalities in Schizophrenia 139
had no effect on binocular rivalry rate in either task (age χ2 [18, 41] = 15.210, p=
.648 and χ2 [18, 41] = 19.656, p= .353; gender χ2 [1, 41] = 1.977, p =. 16 and χ2 [18,
41] = 0.925, p = .335 for magnocellular BR task and parvocellular BR tasks,
respectively). The gender effect reported in Experiment 1 was not replicated here.
Six female healthy control participants and three male participants with
schizophrenia were excluded from participating in the second experiment, which was
likely to account for this.
Participants with schizophrenia recorded significantly slower binocular rivalry
rates in both the magnocellular and the parvocellular BR tasks compared to controls
(see Figure 4.3). Mean binocular rivalry rate for the magnocellular task in the group
with schizophrenia was 0.24 Hz (SD = 0.12) compared with 0.39 Hz (SD = 0.16) in
healthy controls (Mann-Whitney U test, Z = -2.318, p < .02). In the parvocellular BR
task, the mean binocular rivalry rate in the schizophrenia group was 0.24 Hz (SD =
0.09), compared to 0.44 Hz (SD = 0.24) in healthy controls (Mann-Whitney U test, Z
= -2.738, p < .005).
A significant difference in binocular rivalry rates for the magnocellular and
parvocellular tasks was found in healthy participants (magnocellular mean rate 0.39
Hz, SD = 0.156, versus parvocellular 0.44Hz, SD = 0.24, Z = -1.47, p= .047).
Participants with schizophrenia showed no difference in binocular rivalry rates
between the magnocellular and parvocellular BR tasks (mean rate 0.24 Hz, S =. 0.09
and mean rate 0.22 Hz, SD = 0.11 respectively, Z = -0.621, p= .535).

140 Chapter 4: Binocular Rivalry and Backward-Masking Tasks Reveal Pathway-Specific Abnormalities in Schizophrenia
Figure 4.3: Mean binocular rivalry (BR) rates recorded in participants with schizophrenia (black triangles) compared to healthy controls (black diamonds).
Note: Error bars show standard errors of the mean.
Diagnostic sub-group, medication dose and negative and positive symptoms of
schizophrenia had no effect on binocular rivalry rate for either the magnocellular or
parvocellular tasks (Mann-Whitney U tests): diagnostic subgroup (paranoid
schizophrenia [n = 5] versus undifferentiated schizophrenia [n = 9] magnocellular
BR task Z = -0.468, p= .699) and parvocellular BR task [Z = -1.470, p= .147]; low-
[<425 mg, n = 4] versus high-dose [>425 mg, n = 8] of anti-psychotic medication
magnocellular BR task [Z = -0.142, p = .945] and parvocellular BR task [Z = -0.354,
p = 9.733] and positive symptom [n = 4] versus negative symptom [n = 8]
schizophrenia magnocellular BR task [Z = -0.595, p= .507] and parvocellular BR
task [Z = -0.766, p = .461]). Two participants had equal positive and negative
symptom scores, and were excluded from the analyses.
4.4.3.2 Dominance intervals.
One-way Smirnov tests revealed significant differences in the distribution of
normalised dominance intervals in participants with schizophrenia compared with
healthy controls in both the magnocellular and the parvocellular BR tasks.
0.390.44
0.24 0.24
0
0.1
0.2
0.3
0.4
0.5
0.6
Magnocellular BR Task Parvocellular BR Task
BR
rat
e in
Hz
(b
utto
n p
ush
es/
seco
nd)
Key Control (n=18)
Schizophrenia (n=14)
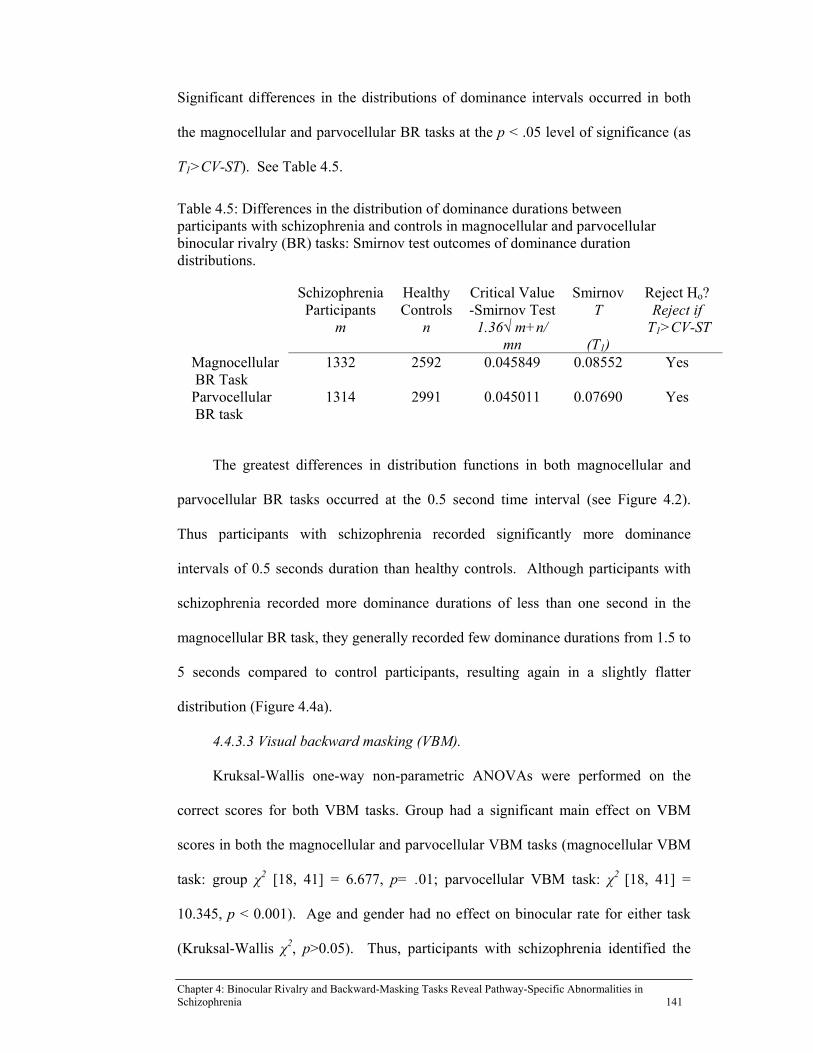
Chapter 4: Binocular Rivalry and Backward-Masking Tasks Reveal Pathway-Specific Abnormalities in Schizophrenia 141
Significant differences in the distributions of dominance intervals occurred in both
the magnocellular and parvocellular BR tasks at the p < .05 level of significance (as
T1>CV-ST). See Table 4.5.
Table 4.5: Differences in the distribution of dominance durations between participants with schizophrenia and controls in magnocellular and parvocellular binocular rivalry (BR) tasks: Smirnov test outcomes of dominance duration distributions.
Schizophrenia Participants
m
Healthy Controls
n
Critical Value -Smirnov Test
1.36√ m+n/ mn
Smirnov T
(T1)
Reject Ho? Reject if
T1>CV-ST
Magnocellular BR Task
1332 2592 0.045849 0.08552
Yes
Parvocellular BR task
1314 2991 0.045011 0.07690
Yes
The greatest differences in distribution functions in both magnocellular and
parvocellular BR tasks occurred at the 0.5 second time interval (see Figure 4.2).
Thus participants with schizophrenia recorded significantly more dominance
intervals of 0.5 seconds duration than healthy controls. Although participants with
schizophrenia recorded more dominance durations of less than one second in the
magnocellular BR task, they generally recorded few dominance durations from 1.5 to
5 seconds compared to control participants, resulting again in a slightly flatter
distribution (Figure 4.4a).
4.4.3.3 Visual backward masking (VBM).
Kruksal-Wallis one-way non-parametric ANOVAs were performed on the
correct scores for both VBM tasks. Group had a significant main effect on VBM
scores in both the magnocellular and parvocellular VBM tasks (magnocellular VBM
task: group χ2 [18, 41] = 6.677, p= .01; parvocellular VBM task: χ2 [18, 41] =
10.345, p < 0.001). Age and gender had no effect on binocular rate for either task
(Kruksal-Wallis χ2, p>0.05). Thus, participants with schizophrenia identified the

142 Chapter 4: Binocular Rivalry and Backward-Masking Tasks Reveal Pathway-Specific Abnormalities in Schizophrenia
location of the target in the magnocellular VBM and the identity of the target in the
parvocellular VBM task less frequently than controls at all inter-stimulus intervals
(however these differences only reached statistical significance [Mann-Whitney U
test] for inter-stimulus intervals of 27, 53 and 107 msecs in the parvocellular VBM
task). See Table 4.6 for results.
Table 4.6: Differences in correct identification of a target scores in magnocellular and parvocellular visual backward- masking (VBM) tasks between participants with schizophrenia and healthy controls at four inter-stimulus intervals (ISI)
Magnocellular VBM Task Controls
(n = 18) Schizophrenia
(n = 14)
M SD M SD U Z p ISI 27msec 7.4 3.2 7.5 3.4 125.5 -0.190 .985 ISI 53msec 10.0 3.9 8.5 3.8 100.5 -0.973 .330 ISI 107msec 11.3 4.0 9.1 3.9 85.0 -1.565 .118 ISI 213msec 11.8 3.9 10.6 5.3 114.0 -0.460 .646 Parvocellular VBM Task Controls
(n = 18) Schizophrenia
(n = 14)
M SD M SD U Z p ISI 27msec 9.7 2.3 7.4 2.7 64.0 -2.376 .018* ISI 53msec 11.6 2.3 8.6 3.3 61.0 -2.499 .012* ISI 107msec 12.7 2.8 9.9 4.3 70.0 -2.138 .032* ISI 213msec 12.5 2.4 12.2 3.6 122.0 -0.153 .878 ISI 27msec 9.7 2.3 7.4 2.7 64.0 -2.376 .018* Note: * indicates p < .05 significance
Mann Whitney U tests revealed no significant effect of medication dose or
positive and negative symptom ratings in either the magnocellular or
parvocellularVBM task (p < .05). However, a significant effect of schizophrenia
sub-type (un-differentiated or paranoid schizophrenia) was found in the
magnocellular VBM task at inter-stimulus intervals of 27 msec and 53 msec (Z = -
2.665, p = .007, and Z = -2.094, p = .042 respectively), with no effect observed in the
parvocellular VBM task at these inter-stimulus intervals.
Dose level had a significant effect on VBM score for inter-stimulus intervals of
27 msec in the magnocellular VBM task (Z = -2.030, p= .042) and DSM-IV

Chapter 4: Binocular Rivalry and Backward-Masking Tasks Reveal Pathway-Specific Abnormalities in Schizophrenia 143
diagnostic sub-group had a significant effect on VBM score for inter-stimulus
intervals of 27 msec and 53 msec in the magnocellular VBM task (Z = -2.665, p =
.008 and Z = -2.094, p= .036 respectively). However, DSM-IV diagnostic sub-group
(paranoid schizophrenia versus undifferentiated schizophrenia as per DSM-IV
classification) and medication dose had no effect on the remaining VBM scores.
Negative and positive symptoms of schizophrenia had no effect on VBM scores in
the remaining inter-stimulus intervals in the magnocellular VBM task or at any inter-
stimulus intervals in the parvocellular VBM task for participants with schizophrenia
(Mann-Whitney U tests) (See Table 4.5, Appendix C).
a.
b.
Figure 4.4: The dominance durations between participants with schizophrenia (n=14; black lines) compared to control participants (n=18; grey lines) for (A) magnocellular binocular rivalry (BR) task and (b) parvocellular BR task.
Note: A separation in location of any two time points on each curve indicates a significant difference in mean normalised dominance durations.
0.0
0.1
0.2
0.3
0.4
0.5
0.6
0.7
0.8
0.9
1.0
0 0.5 1 1.5 2 2.5 3 3.5 4 4.5 5 5.5 6 6.5 7 7.5 8 8.5 9
Time in Seconds
Cum
ulat
ive
Pro
babi
lity
Schizophrenia Control
0.0
0.1
0.2
0.3
0.4
0.5
0.6
0.7
0.8
0.9
1.0
0 0.5 1 1.5 2 2.5 3 3.5 4 4.5 5 5.5 6 6.5 7 7.5 8 8.5 9
Time in Seconds
Cum
ulat
ive
Pro
babi
lity
schizophrenia Control
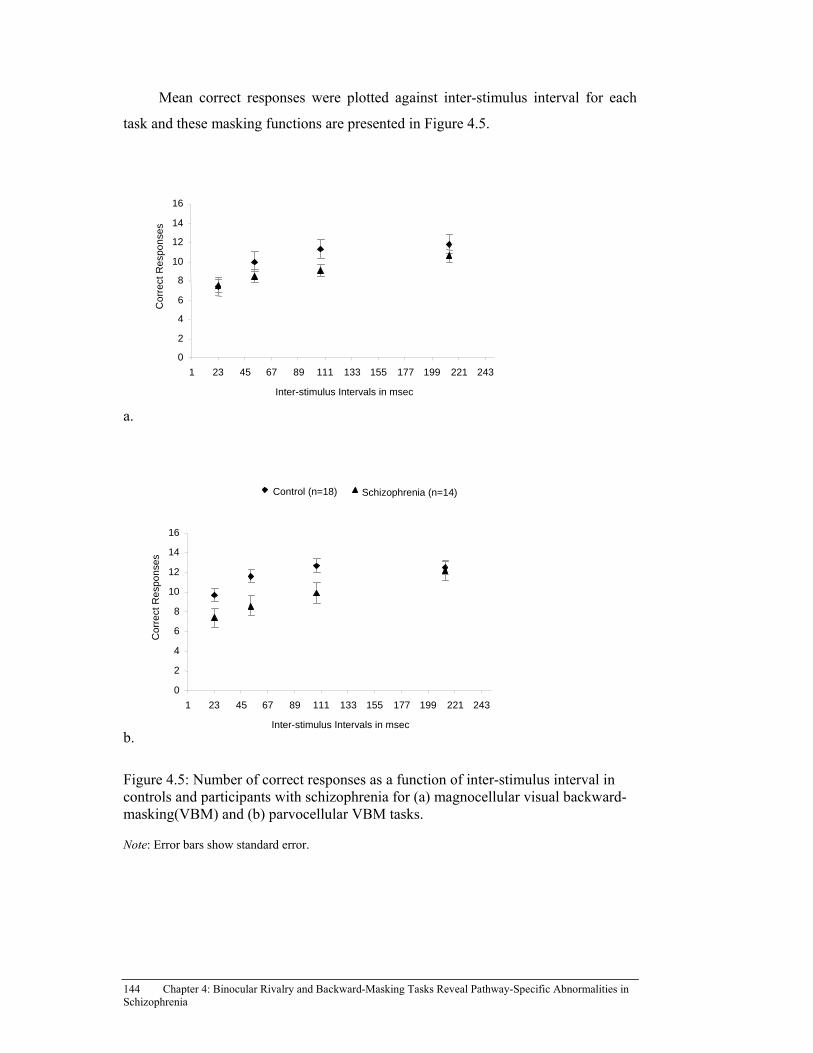
144 Chapter 4: Binocular Rivalry and Backward-Masking Tasks Reveal Pathway-Specific Abnormalities in Schizophrenia
Mean correct responses were plotted against inter-stimulus interval for each
task and these masking functions are presented in Figure 4.5.
a.
b.
Figure 4.5: Number of correct responses as a function of inter-stimulus interval in controls and participants with schizophrenia for (a) magnocellular visual backward-masking(VBM) and (b) parvocellular VBM tasks.
Note: Error bars show standard error.
0
2
4
6
8
10
12
14
16
1 23 45 67 89 111 133 155 177 199 221 243
Inter-stimulus Intervals in msec
Co
rre
ct R
esp
on
ses
Schizophrenia (n=14)Control (n=18)
0
2
4
6
8
10
12
14
16
1 23 45 67 89 111 133 155 177 199 221 243
Inter-stimulus Intervals in msec
Co
rrec
t Re
spo
nse
s

Chapter 4: Binocular Rivalry and Backward-Masking Tasks Reveal Pathway-Specific Abnormalities in Schizophrenia 145
4.4.3.4 Comparing binocular rivalry and visual backward masking results.
To be confident in the binocular rivalry data presented in Experiments 1 and 2
and validating the use of pathway-biased stimuli in binocular rivalry, it would be
expected that magnocellular binocular rivalry and VBM, and parvocellular binocular
rivalry and VBM tasks would be significantly associated. Correlation coefficients
are presented in Table 4.7.
When VBM correct scores were compared with the binocular rivalry rates (in
Hz) it can be seen that participants with schizophrenia performed more poorly in
both magnocellular and parvocellular tasks compared to the control participants, with
the greatest differences recorded in the parvocellular tasks. Correlations between
correct VBM scores and binocular rivalry rates were examined. Significant
correlations were evident between parvocellular binocular rivalry rates in
parvocellular VBM task scores at inter-stimulus intervals of 27, 53, 107 and 213
msec and between magnocellular binocular rivalry rates and parvocellular visual
backward masking task scores at inter-stimulus intervals of 53, 107 and 213 msec in
healthy control participants. Thus control participants with slower binocular rivalry
rates, in both magnocellular and parvocellular BR tasks, performed more poorly on
parvocellular VBM tasks than participants with faster binocular rivalry rates.
Participants with schizophrenia did not show any significant correlations
between binocular rivalry rates and visual backward masking scores in either
parvocellular or magnocellular tasks (with the exception of a near significant
correlation of p= .053 at inter-stimulus interval 53 msec in parvocellular binocular
rivalry and VBM tasks).

146 Chapter 4: Binocular Rivalry and Backward-Masking Tasks Reveal Pathway-Specific Abnormalities in Schizophrenia
Table 4.7: Correlations between magnocellular and parvocellular binocular rivalry (BR) rates (in Hz) with magnocellular and parvocellular visual backward masking (VBM) correct scores (Spearman’s correlation coefficient rho).
Controls (n=18)
Magnocellular BR task
(rate in Hz) Parvocellular BR task
(rate in Hz) r2 p r2 p Magnocellular VBM Task (correct scores) ISI 27msec 0.205 .414 0.301 .224 ISI 53msec 0.104 .680 0.269 .281 ISI 107msec 0.142 .575 0.283 .256 ISI 213msec 0.147 .560 0.066 .795 Parvocellular VBM task (correct scores) ISI 27msec 0.353 .151 0.474 .047* ISI 53msec 0.518 .028* 0.581 .011* ISI 107msec 0.501 .034* 0.484 .042* ISI 213msec 0.655 .003* 0.587 .010* Schizophrenia (n=14)
Magnocellular BR task
(rate in Hz) Parvocellular BR task
(rate in Hz) r2 p r2 p Magnocellular VBM Task (correct scores) ISI 27msec 0.016 .957 0.248 .392 ISI 53msec -0.039 .895 0.025 .934 ISI 107msec -0.243 .403 -0.208 .477 ISI 213msec -0.235 .418 -0.089 .763 Parvocellular VBM task (correct scores) ISI 27msec -0.161 .583 -0.443 .113 ISI 53msec -0.333 .244 -0.526 .053* ISI 107msec -0.226 .436 0.020 .946 ISI 213msec -0.129 .661 -0.154 .598 Note. * indicates p < .05 significance (two tailed).
With respect to the magnocellular VBM and binocular rivalry tasks, no
correlations were evident in either healthy control participants or participants with
schizophrenia when the magnocellular VBM task was compared with magnocellular
and parvocellular BR tasks. It is also possible that methodological differences
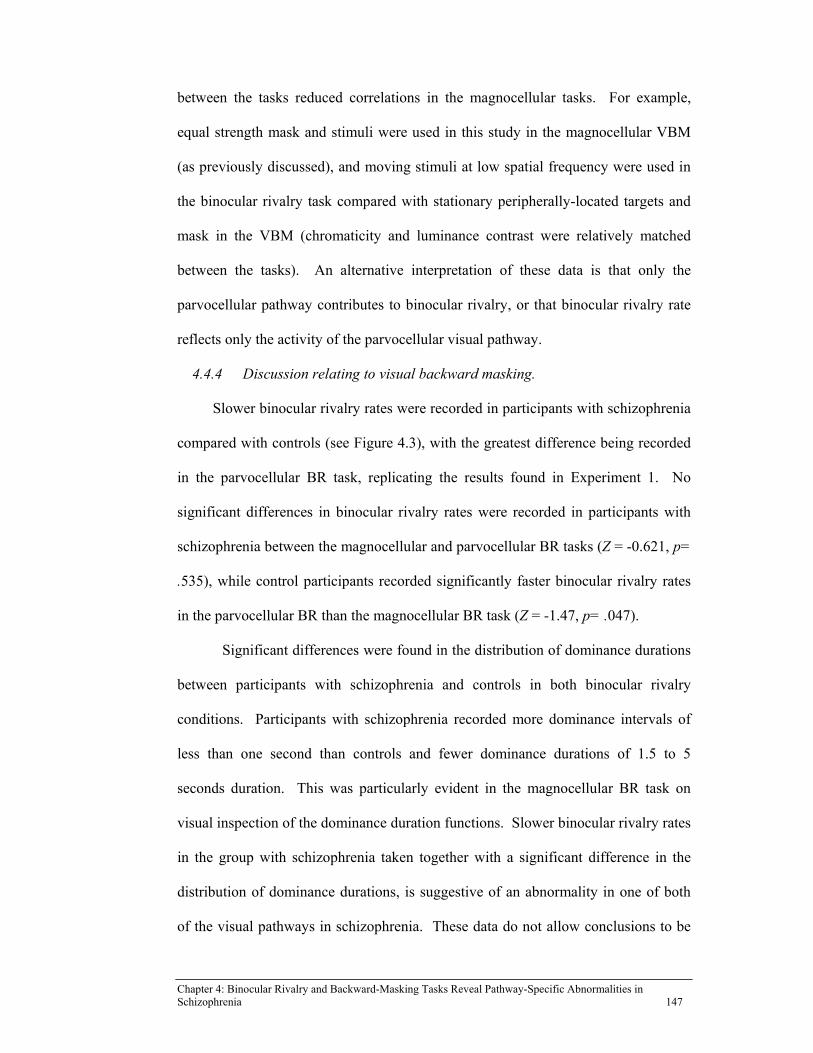
Chapter 4: Binocular Rivalry and Backward-Masking Tasks Reveal Pathway-Specific Abnormalities in Schizophrenia 147
between the tasks reduced correlations in the magnocellular tasks. For example,
equal strength mask and stimuli were used in this study in the magnocellular VBM
(as previously discussed), and moving stimuli at low spatial frequency were used in
the binocular rivalry task compared with stationary peripherally-located targets and
mask in the VBM (chromaticity and luminance contrast were relatively matched
between the tasks). An alternative interpretation of these data is that only the
parvocellular pathway contributes to binocular rivalry, or that binocular rivalry rate
reflects only the activity of the parvocellular visual pathway.
4.4.4 Discussion relating to visual backward masking.
Slower binocular rivalry rates were recorded in participants with schizophrenia
compared with controls (see Figure 4.3), with the greatest difference being recorded
in the parvocellular BR task, replicating the results found in Experiment 1. No
significant differences in binocular rivalry rates were recorded in participants with
schizophrenia between the magnocellular and parvocellular BR tasks (Z = -0.621, p=
.535), while control participants recorded significantly faster binocular rivalry rates
in the parvocellular BR than the magnocellular BR task (Z = -1.47, p= .047).
Significant differences were found in the distribution of dominance durations
between participants with schizophrenia and controls in both binocular rivalry
conditions. Participants with schizophrenia recorded more dominance intervals of
less than one second than controls and fewer dominance durations of 1.5 to 5
seconds duration. This was particularly evident in the magnocellular BR task on
visual inspection of the dominance duration functions. Slower binocular rivalry rates
in the group with schizophrenia taken together with a significant difference in the
distribution of dominance durations, is suggestive of an abnormality in one of both
of the visual pathways in schizophrenia. These data do not allow conclusions to be

148 Chapter 4: Binocular Rivalry and Backward-Masking Tasks Reveal Pathway-Specific Abnormalities in Schizophrenia
drawn as to which pathway, or whether both pathways are contributing to abnormal
binocular rivalry rates and dominance distributions in schizophrenia. A plausible
explanation is that over-active magnocellular neurons distributed across the retina
send rapid transient responses to visual stimuli during binocular rivalry (as evidenced
by the increased number of short dominance durations), interrupting the sustained
response of the parvocellular neural processing (Butler et al., 2003).
In participants with schizophrenia, increased numbers of short dominance
durations do not correspond with faster binocular rivalry rates, thus an overall slower
rate must be accounted for by some abnormally long dominance durations (more 1.5-
5 second dominance durations were recorded in the schizophrenia group). Slower
binocular rivalry rates in participants with schizophrenia may reflect more “sluggish”
or prolonged processing by parvocellular neurons in schizophrenia. The data
presented here are suggestive of abnormalities in both the magnocellular and
parvocellular pathways. Further investigation is needed to determine whether
abnormalities is the two pathways is responsible for the atypical dominance
durations and slower binocular rivalry rates in schizophrenia.
Participants with schizophrenia performed more poorly on VBM tasks than
healthy participants, consistent with previous reports (Braff, Saccuzzo & Geyer,
1991; Green et al., 2003; Green et al., 1994b; Koelkebeck et al., 2005). Participants
with schizophrenia generally identified the location of the target in the magnocellular
VBM task and the identity of the target in the parvocellular VBM task less
frequently than healthy participant’s at all inter-stimulus intervals. Overall group
differences in correct scores were observed in both the magnocellular and
parvocellular VBM tasks; however the greatest difference in mean scores was
recorded in the parvocellular VBM task (2.3 at inter-stimulus of 27 msec, 3 at 53
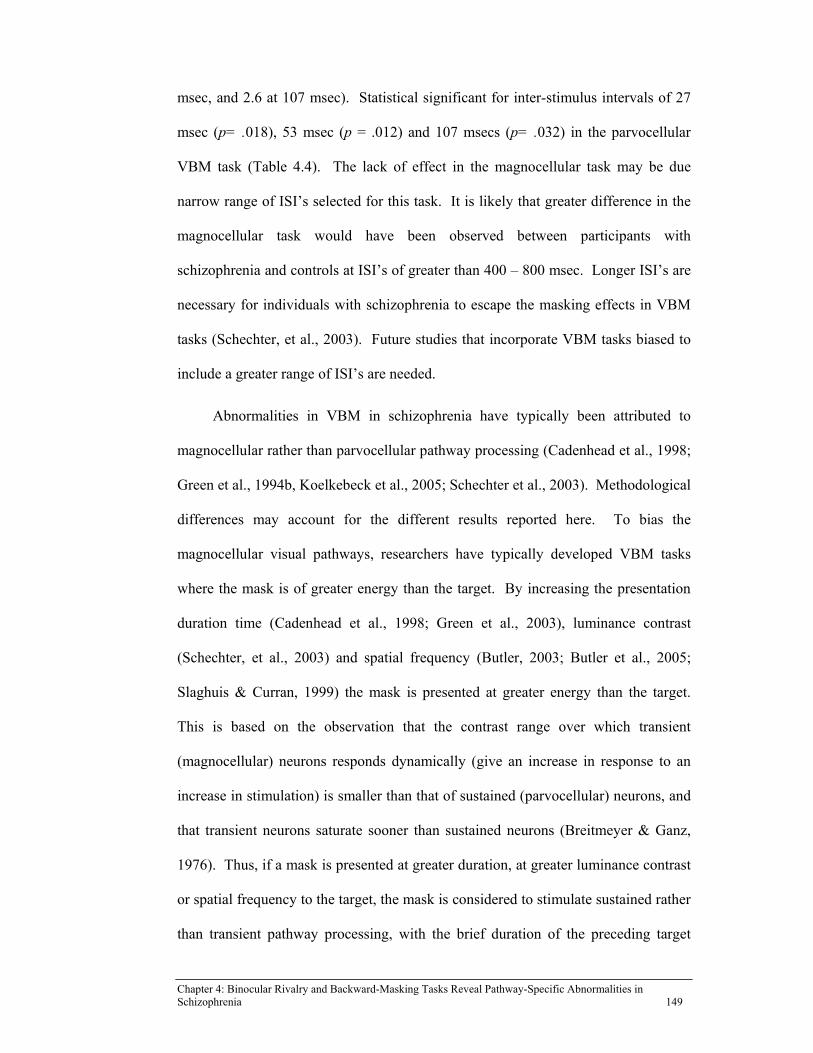
Chapter 4: Binocular Rivalry and Backward-Masking Tasks Reveal Pathway-Specific Abnormalities in Schizophrenia 149
msec, and 2.6 at 107 msec). Statistical significant for inter-stimulus intervals of 27
msec (p= .018), 53 msec (p = .012) and 107 msecs (p= .032) in the parvocellular
VBM task (Table 4.4). The lack of effect in the magnocellular task may be due
narrow range of ISI’s selected for this task. It is likely that greater difference in the
magnocellular task would have been observed between participants with
schizophrenia and controls at ISI’s of greater than 400 – 800 msec. Longer ISI’s are
necessary for individuals with schizophrenia to escape the masking effects in VBM
tasks (Schechter, et al., 2003). Future studies that incorporate VBM tasks biased to
include a greater range of ISI’s are needed.
Abnormalities in VBM in schizophrenia have typically been attributed to
magnocellular rather than parvocellular pathway processing (Cadenhead et al., 1998;
Green et al., 1994b, Koelkebeck et al., 2005; Schechter et al., 2003). Methodological
differences may account for the different results reported here. To bias the
magnocellular visual pathways, researchers have typically developed VBM tasks
where the mask is of greater energy than the target. By increasing the presentation
duration time (Cadenhead et al., 1998; Green et al., 2003), luminance contrast
(Schechter, et al., 2003) and spatial frequency (Butler, 2003; Butler et al., 2005;
Slaghuis & Curran, 1999) the mask is presented at greater energy than the target.
This is based on the observation that the contrast range over which transient
(magnocellular) neurons responds dynamically (give an increase in response to an
increase in stimulation) is smaller than that of sustained (parvocellular) neurons, and
that transient neurons saturate sooner than sustained neurons (Breitmeyer & Ganz,
1976). Thus, if a mask is presented at greater duration, at greater luminance contrast
or spatial frequency to the target, the mask is considered to stimulate sustained rather
than transient pathway processing, with the brief duration of the preceding target

150 Chapter 4: Binocular Rivalry and Backward-Masking Tasks Reveal Pathway-Specific Abnormalities in Schizophrenia
stimulating transient pathway processing. Because the primary interest in this
experiment was to develop a task that preferentially biased the transient and
sustained pathways to compare with a binocular rivalry task, the mask and targets
were of the same energy in terms of stimulus duration, luminance contrast and
spatial frequency to match the stimulus characteristics of the binocular rivalry tasks.
The binocular rivalry stimuli only differed in terms of line orientation (vertical
versus horizontal lines).
The lack of a medication effect on VBM performance observed here is
consistent with other studies (Butler et al., 2003, Braff & Saccuzzo, 1992;
Cadenhead et al., 1998). However, the absence of a finding related to positive and
negative symptoms of schizophrenia has not been reported previously, where VBM
information processing deficits have been consistently reported in groups with more
negative rather than positive or disorganised symptoms of schizophrenia (Butler et
al., 2003; Cadenhead et al., 1997; Schechter et al., 2003; Slaghuis & Bakker, 1995;
Slaghuis & Curran, 1999). This may be due to the small sample size (four
participants with positive symptoms compared to eight with negative symptoms) and
the fact that this sample comprised a group of out-patient participants who did not
have acute symptoms of illness at the time of testing.
4.5 General Discussion
The key to the sustained versus transient (or magnocellular versus
parvocellular) explanations of visual masking is the difference in transmission time
from the retina to the cortex of the two pathways (May, Grannis & Dunlap, 1988).
Breitmeyer and Ganz (1976) demonstrated that transient (magnocellular) channel
neurons respond to the onset and offset of a stimulus 50-80 msecs before the
sustained (parvocellular) channel neuron, with the response of the sustained channel
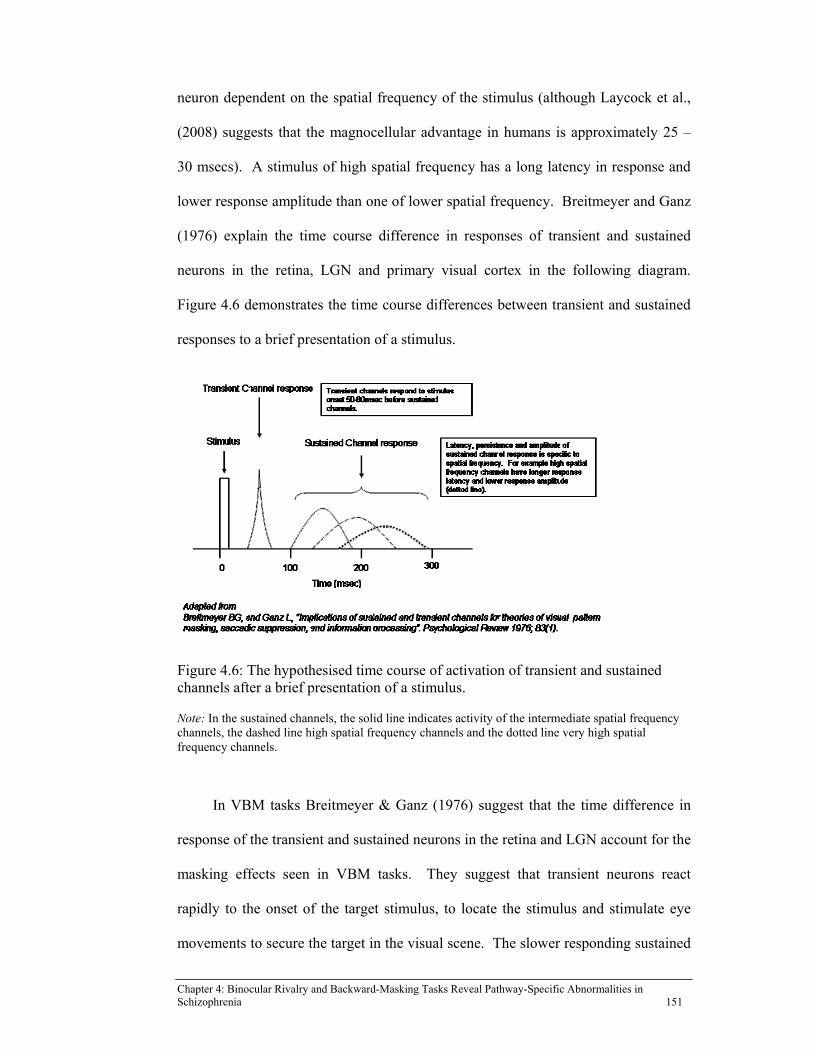
Chapter 4: Binocular Rivalry and Backward-Masking Tasks Reveal Pathway-Specific Abnormalities in Schizophrenia 151
neuron dependent on the spatial frequency of the stimulus (although Laycock et al.,
(2008) suggests that the magnocellular advantage in humans is approximately 25 –
30 msecs). A stimulus of high spatial frequency has a long latency in response and
lower response amplitude than one of lower spatial frequency. Breitmeyer and Ganz
(1976) explain the time course difference in responses of transient and sustained
neurons in the retina, LGN and primary visual cortex in the following diagram.
Figure 4.6 demonstrates the time course differences between transient and sustained
responses to a brief presentation of a stimulus.
Figure 4.6: The hypothesised time course of activation of transient and sustained channels after a brief presentation of a stimulus.
Note: In the sustained channels, the solid line indicates activity of the intermediate spatial frequency channels, the dashed line high spatial frequency channels and the dotted line very high spatial frequency channels.
In VBM tasks Breitmeyer & Ganz (1976) suggest that the time difference in
response of the transient and sustained neurons in the retina and LGN account for the
masking effects seen in VBM tasks. They suggest that transient neurons react
rapidly to the onset of the target stimulus, to locate the stimulus and stimulate eye
movements to secure the target in the visual scene. The slower responding sustained
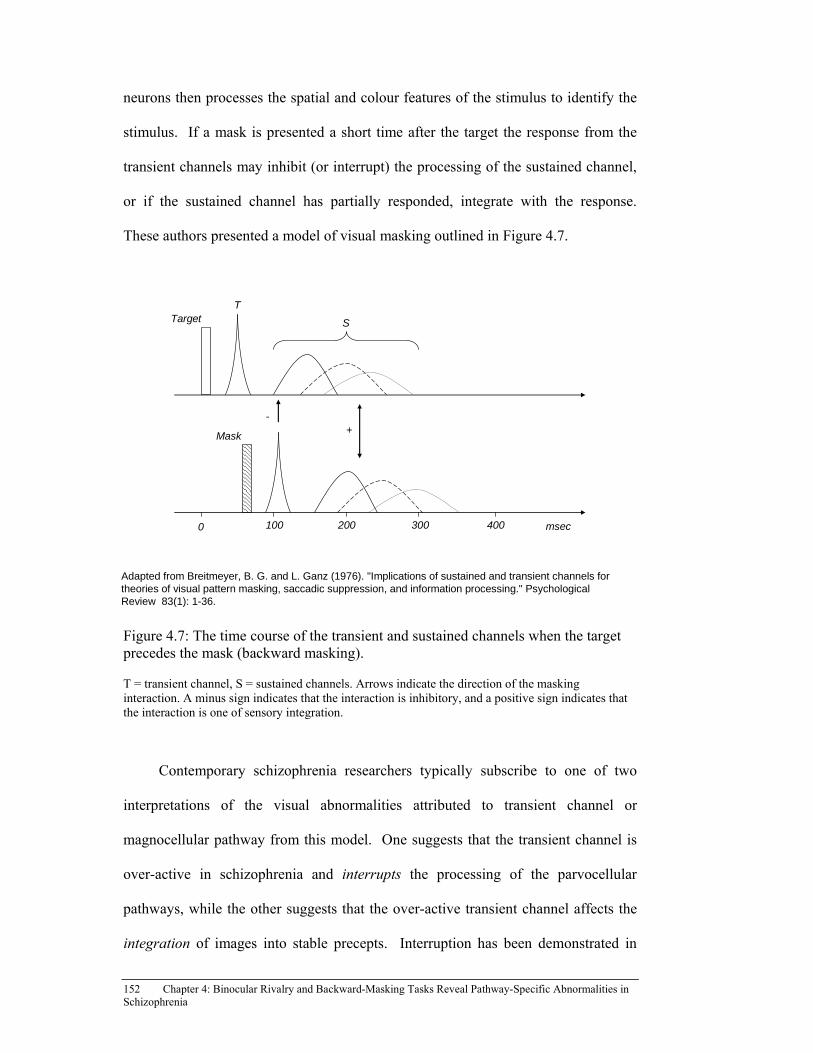
152 Chapter 4: Binocular Rivalry and Backward-Masking Tasks Reveal Pathway-Specific Abnormalities in Schizophrenia
neurons then processes the spatial and colour features of the stimulus to identify the
stimulus. If a mask is presented a short time after the target the response from the
transient channels may inhibit (or interrupt) the processing of the sustained channel,
or if the sustained channel has partially responded, integrate with the response.
These authors presented a model of visual masking outlined in Figure 4.7.
Figure 4.7: The time course of the transient and sustained channels when the target precedes the mask (backward masking).
T = transient channel, S = sustained channels. Arrows indicate the direction of the masking interaction. A minus sign indicates that the interaction is inhibitory, and a positive sign indicates that the interaction is one of sensory integration.
Contemporary schizophrenia researchers typically subscribe to one of two
interpretations of the visual abnormalities attributed to transient channel or
magnocellular pathway from this model. One suggests that the transient channel is
over-active in schizophrenia and interrupts the processing of the parvocellular
pathways, while the other suggests that the over-active transient channel affects the
integration of images into stable precepts. Interruption has been demonstrated in
100 200 3000
+-
400 msec
Adapted from Breitmeyer, B. G. and L. Ganz (1976). "Implications of sustained and transient channels for theories of visual pattern masking, saccadic suppression, and information processing." Psychological Review 83(1): 1-36.
Target
Mask
T
S
Chapter 4: Binocular Rivalry and Backward-Masking Tasks Reveal Pathway-Specific Abnormalities in Schizophrenia 153
VBM tasks where the sustained channel sensitive to stimuli that is moderate-to-high
spatial frequency and slow temporal frequency codes fine detail necessary for object
recognition (the target) is interrupted by faster responding transient channel activity
elicited by the mask (Cadenhead et al., 1998; Green et al., 1994a; Green et al.,
1994b; Rassovsky, Green, Nuechterlein, Breitmeyer & Mintz, 2004). This theory
has been put forward to describe the visual and auditory hallucinations that are
commonly seen in schizophrenia. The second theory suggests that the transient
pathway is defective in schizophrenia, needing abnormally long periods of time
between the presentation of images in order to recognise and code them. When
images are seen in quick succession (with short inter-stimulus intervals) the
information from both images is integrated or fused. Individuals with schizophrenia
may therefore be creating ‘false’ or ‘incorrect’ visual images and be mis-interpreting
visual information contributing to the paranoia and perceptual disturbances
commonly experienced in this illness. Impairments in visual integration have been
linked to increases in disorganised symptoms (Butler, Silverstein & Dakin, 2008;
Uhlhaas, Phillips & Siverstein, 2005; Uhlhaas, Phillips, Mitchell & Silverstein,
2006), poorer pre-morbid social functioning (Chen, Nakayama et al., 2003) and
increased illness severity and chronicity (Silverstein et al., 2006). Deficits in
integration have also been reported in first-episode participants (Javitt, 2009;
Uhlhaas et al., 2006) and deficits in the magnocellular system correlate significantly
with global outcome and level of community functioning (Schechter et al., 2005).
Although it remains unresolved whether the VBM dysfunction in
schizophrenia reflects the abnormality of sub-cortical transient channels or deficient
cortical mechanisms (Keri et al., 2000), data from fMRI studies show that
participants with schizophrenia have markedly lower activation to low spatial
154 Chapter 4: Binocular Rivalry and Backward-Masking Tasks Reveal Pathway-Specific Abnormalities in Schizophrenia
frequency stimuli in regions of the occipital, parietal and temporal lobes (Martinez et
al., 2008), suggesting cortical regions are involved, especially when the LGN is
functioning normally. It is possible that the initial abnormality may occur earlier in
the pathway. Deficits in early-stage visual processing predict higher cognitive
deficits in schizophrenia (Butler et al., 2005) and may contribute to higher-order
cognitive deficits in working memory, executive functioning and attention (Martinez
et al., 2008).
4.5.1 A model of binocular rivalry based on visual backward masking theory.
According to the sustained-transient theory in VBM, if the mask and test
stimuli are similar in orientation and spatial frequency, maximum masking will occur
at stimulus onset synchrony. This prediction stems from the assumption that when
the mask and target are similar, equal proportions of magnocellular and parvocellular
cells are stimulated and masking effects derive from ‘within channel’ inhibition
(transient on transient and sustained on sustained) (May et al., 1988). Breitmeyer
and Ganz (1976) postulated that transient neurons inhibited sustained ones via
internuncial neurons at the LGN and cortex based on their response duration. See
Figure 4.8.
It is conceivable that binocular rivalry processing may occur in a similar way.
Visual information from the left and right eyes travels via monocular neurons and
binocular neurons to the LGN and to the left and right visual cortex. Visual
information is carried more rapidly to the cortex by monocular than binocular
neurons, and both types contain magnocellular and parvocellular cells, with
parvocellular neurons concentrated around the fovea while the density of
magnocellular neurons increases with foveal eccentricity (Livingstone & Hubel,
1987).
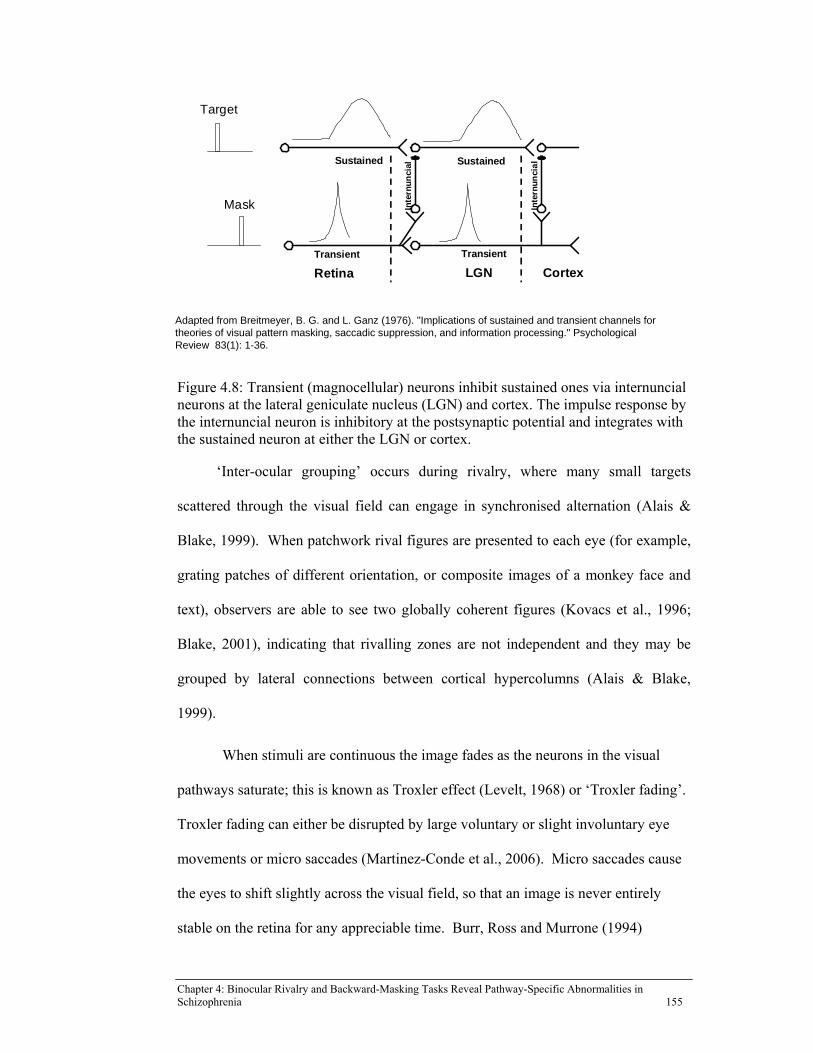
Chapter 4: Binocular Rivalry and Backward-Masking Tasks Reveal Pathway-Specific Abnormalities in Schizophrenia 155
Figure 4.8: Transient (magnocellular) neurons inhibit sustained ones via internuncial neurons at the lateral geniculate nucleus (LGN) and cortex. The impulse response by the internuncial neuron is inhibitory at the postsynaptic potential and integrates with the sustained neuron at either the LGN or cortex.
‘Inter-ocular grouping’ occurs during rivalry, where many small targets
scattered through the visual field can engage in synchronised alternation (Alais &
Blake, 1999). When patchwork rival figures are presented to each eye (for example,
grating patches of different orientation, or composite images of a monkey face and
text), observers are able to see two globally coherent figures (Kovacs et al., 1996;
Blake, 2001), indicating that rivalling zones are not independent and they may be
grouped by lateral connections between cortical hypercolumns (Alais & Blake,
1999).
When stimuli are continuous the image fades as the neurons in the visual
pathways saturate; this is known as Troxler effect (Levelt, 1968) or ‘Troxler fading’.
Troxler fading can either be disrupted by large voluntary or slight involuntary eye
movements or micro saccades (Martinez-Conde et al., 2006). Micro saccades cause
the eyes to shift slightly across the visual field, so that an image is never entirely
stable on the retina for any appreciable time. Burr, Ross and Murrone (1994)
Transient Transient
Sustained Sustained
Retina LGN Cortex
Inte
rnu
nci
al
Inte
rnu
nci
al
Target
Mask
Adapted from Breitmeyer, B. G. and L. Ganz (1976). "Implications of sustained and transient channels for theories of visual pattern masking, saccadic suppression, and information processing." Psychological Review 83(1): 1-36.
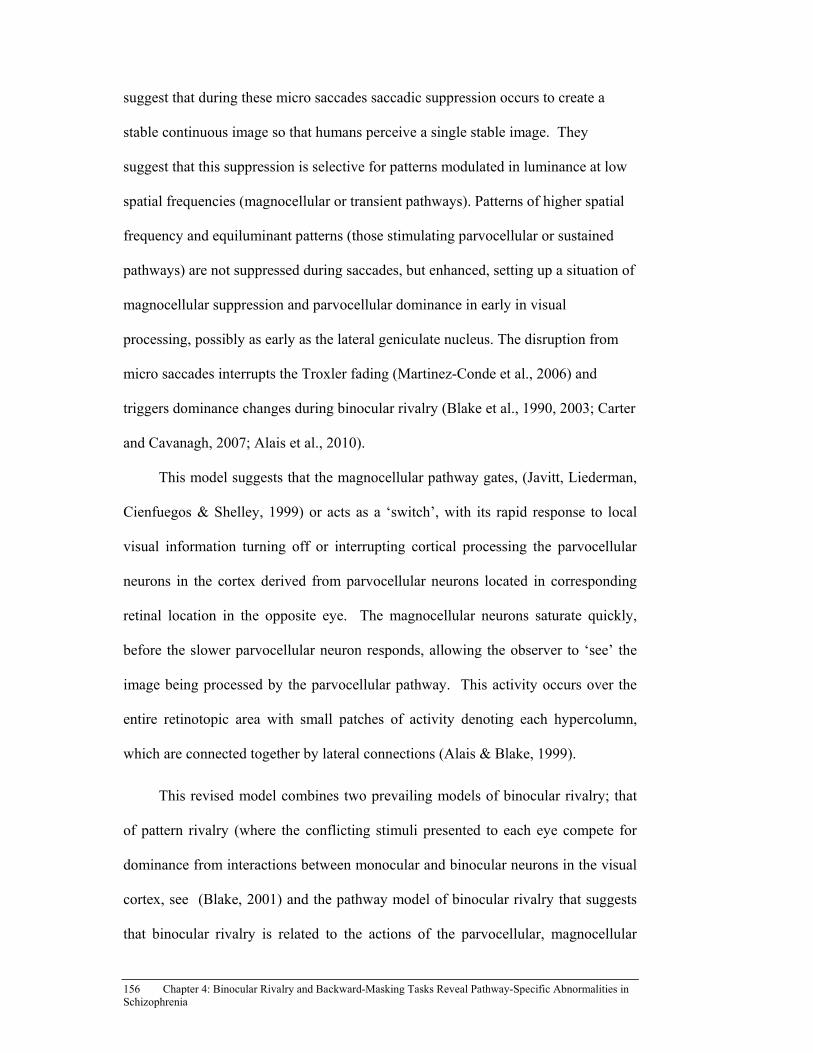
156 Chapter 4: Binocular Rivalry and Backward-Masking Tasks Reveal Pathway-Specific Abnormalities in Schizophrenia
suggest that during these micro saccades saccadic suppression occurs to create a
stable continuous image so that humans perceive a single stable image. They
suggest that this suppression is selective for patterns modulated in luminance at low
spatial frequencies (magnocellular or transient pathways). Patterns of higher spatial
frequency and equiluminant patterns (those stimulating parvocellular or sustained
pathways) are not suppressed during saccades, but enhanced, setting up a situation of
magnocellular suppression and parvocellular dominance in early in visual
processing, possibly as early as the lateral geniculate nucleus. The disruption from
micro saccades interrupts the Troxler fading (Martinez-Conde et al., 2006) and
triggers dominance changes during binocular rivalry (Blake et al., 1990, 2003; Carter
and Cavanagh, 2007; Alais et al., 2010).
This model suggests that the magnocellular pathway gates, (Javitt, Liederman,
Cienfuegos & Shelley, 1999) or acts as a ‘switch’, with its rapid response to local
visual information turning off or interrupting cortical processing the parvocellular
neurons in the cortex derived from parvocellular neurons located in corresponding
retinal location in the opposite eye. The magnocellular neurons saturate quickly,
before the slower parvocellular neuron responds, allowing the observer to ‘see’ the
image being processed by the parvocellular pathway. This activity occurs over the
entire retinotopic area with small patches of activity denoting each hypercolumn,
which are connected together by lateral connections (Alais & Blake, 1999).
This revised model combines two prevailing models of binocular rivalry; that
of pattern rivalry (where the conflicting stimuli presented to each eye compete for
dominance from interactions between monocular and binocular neurons in the visual
cortex, see (Blake, 2001) and the pathway model of binocular rivalry that suggests
that binocular rivalry is related to the actions of the parvocellular, magnocellular
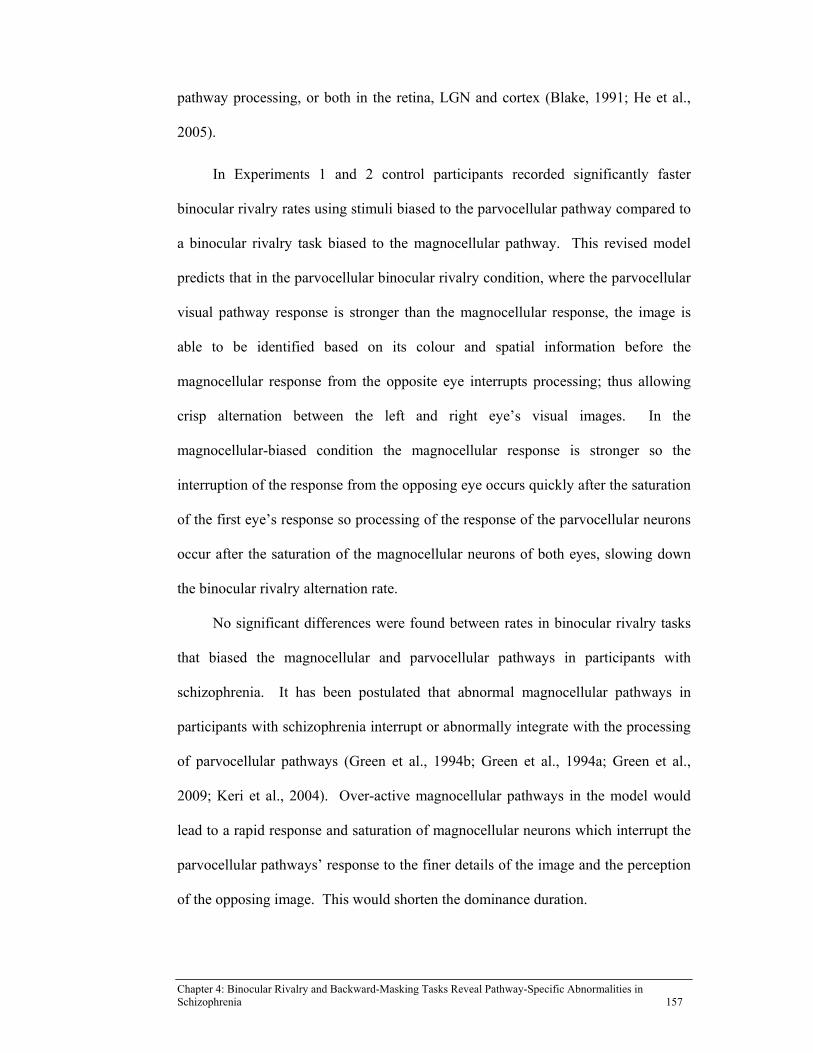
Chapter 4: Binocular Rivalry and Backward-Masking Tasks Reveal Pathway-Specific Abnormalities in Schizophrenia 157
pathway processing, or both in the retina, LGN and cortex (Blake, 1991; He et al.,
2005).
In Experiments 1 and 2 control participants recorded significantly faster
binocular rivalry rates using stimuli biased to the parvocellular pathway compared to
a binocular rivalry task biased to the magnocellular pathway. This revised model
predicts that in the parvocellular binocular rivalry condition, where the parvocellular
visual pathway response is stronger than the magnocellular response, the image is
able to be identified based on its colour and spatial information before the
magnocellular response from the opposite eye interrupts processing; thus allowing
crisp alternation between the left and right eye’s visual images. In the
magnocellular-biased condition the magnocellular response is stronger so the
interruption of the response from the opposing eye occurs quickly after the saturation
of the first eye’s response so processing of the response of the parvocellular neurons
occur after the saturation of the magnocellular neurons of both eyes, slowing down
the binocular rivalry alternation rate.
No significant differences were found between rates in binocular rivalry tasks
that biased the magnocellular and parvocellular pathways in participants with
schizophrenia. It has been postulated that abnormal magnocellular pathways in
participants with schizophrenia interrupt or abnormally integrate with the processing
of parvocellular pathways (Green et al., 1994b; Green et al., 1994a; Green et al.,
2009; Keri et al., 2004). Over-active magnocellular pathways in the model would
lead to a rapid response and saturation of magnocellular neurons which interrupt the
parvocellular pathways’ response to the finer details of the image and the perception
of the opposing image. This would shorten the dominance duration.
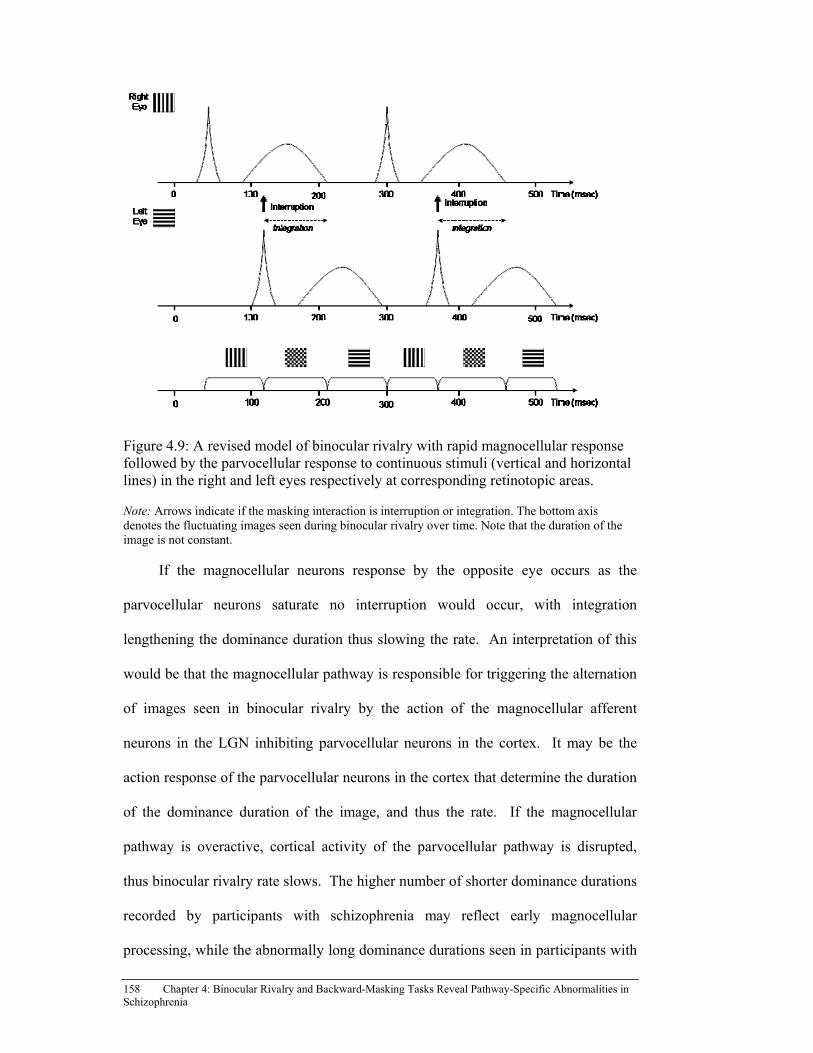
158 Chapter 4: Binocular Rivalry and Backward-Masking Tasks Reveal Pathway-Specific Abnormalities in Schizophrenia
Figure 4.9: A revised model of binocular rivalry with rapid magnocellular response followed by the parvocellular response to continuous stimuli (vertical and horizontal lines) in the right and left eyes respectively at corresponding retinotopic areas.
Note: Arrows indicate if the masking interaction is interruption or integration. The bottom axis denotes the fluctuating images seen during binocular rivalry over time. Note that the duration of the image is not constant.
If the magnocellular neurons response by the opposite eye occurs as the
parvocellular neurons saturate no interruption would occur, with integration
lengthening the dominance duration thus slowing the rate. An interpretation of this
would be that the magnocellular pathway is responsible for triggering the alternation
of images seen in binocular rivalry by the action of the magnocellular afferent
neurons in the LGN inhibiting parvocellular neurons in the cortex. It may be the
action response of the parvocellular neurons in the cortex that determine the duration
of the dominance duration of the image, and thus the rate. If the magnocellular
pathway is overactive, cortical activity of the parvocellular pathway is disrupted,
thus binocular rivalry rate slows. The higher number of shorter dominance durations
recorded by participants with schizophrenia may reflect early magnocellular
processing, while the abnormally long dominance durations seen in participants with

Chapter 4: Binocular Rivalry and Backward-Masking Tasks Reveal Pathway-Specific Abnormalities in Schizophrenia 159
schizophrenia (and not healthy participants) may reflect abnormal parvocellular
processing at the cortical level.
A limitation of the binocular rivalry task is that it relies on self-report reporting
of perceptual alternation is effected by reaction time. It is not possible to be sure that
the participant is accurately report what they perceive. Participants that experience
quicker perceptual alternations during binocular rivalry may not have sufficient time
to respond pressing a response key before the opposing image becomes dominant. In
humans recognition of an object generally occurs prior 180 msec with a motor
response intiated from 540-720 msec (Castelo-Branco, Neuenschwande & Singer,
1998). If a change in perceptual dominance occurs around 500 msec, it is possible
that an individual with schizophrenia may not be able to register their perception of
the image before the next alternation occurs. Measuring participant’s reaction times
in future studies to ensure no confound related to reaction time (slower in
schizophrenia) would be a useful methodological advance (Ngan & Liddle, 2000).
Furthermore, Braff and Saccuzzo (1985) note that information-processing
deficits in individuals with schizophrenia occur at ISI’s between 60 msec and 500
msec in VBM tasks. Future VBM studies that include longer ISIs between target and
mask, that reflect the temporal characteristics of perceptual alternations or
dominance durations in binocular rivalry, may allow greater exploration of
magnocellular and parvocellular processing in schizophrenia. VBM tasks that
include greater ISI’s (of 400 – 800 msec) may revealed greater seperation between
participants with schizophrenia and controls.
4.6 Conclusion
Participants with schizophrenia recorded slower binocular rivalry rates than
healthy controls in two binocular rivalry tasks that were biased to processing via the
160 Chapter 4: Binocular Rivalry and Backward-Masking Tasks Reveal Pathway-Specific Abnormalities in Schizophrenia
magnocellular and parvocellular pathways, with the greatest difference in binocular
rivalry rates being observed in the parvocellular binocular rivalry task. Two
backward-masking tasks were developed; a location task to access magnocellular
processing, and an identification task to access parvocellular processing, to compare
performance with the binocular rivalry tasks. Participants with schizophrenia
performed more poorly in both the magnocellular and parvocellular backward
masking conditions, with the greatest difference being in the parvocellular backward-
masking task.
A revised model of binocular rivalry that combines pattern rivalry theory with
a pathway theory was proposed to explain the results. However further investigation
into this model of binocular rivalry are needed. Future studies that include binocular
rivalry tasks that are biased toward the magnocellular and parvocellular visual
pathways compared VBM studies that include longer ISIs between target and mask
(400-1200msec), that reflect the temporal characteristics of perceptual alternations or
dominance durations in binocular rivalry, may allow greater exploration of
magnocellular and parvocellular processing in schizophrenia.

Chapter 5: Benton’s Judgment of Line Orientation - An Indicator of Visuospatial Ability in Schizophrenia 161
5.1 The Right Hemisphere and Visuospatial Dysfunction
Pettigrew and Miller (1998) and Miller et al., (2003) suggested that binocular
rivalry is the result of competition between the two cortical hemispheres that occurs
by virtue of an ‘inter-hemispheric switching’ mechanism (see Chapter 3 for further
discussion). This theory assumes that visual information originating from both eyes
combines to form a stable percept within each hemisphere that competes for
dominance over the other. Thus, if visual processing within one hemisphere was
abnormal (or one hemisphere was damaged) binocular rivalry processing would be
impaired. Right hemisphere processing abnormalities have been observed in
individuals with schizophrenia during neuro-psychological testing, such as a
lateralised lexical decision task (Endrass et al., 2002; Evans & Schwartz, 1997;
Gastaldo et al., 2002; Lieb et al., 1996; O’Donnell et al., 2002) a two-pulse temporal
discrimination task (Schwartz, et al., 1984) backward masking tasks (Lieb et al.,
1996; Wynn, Light, Breitmeyer, Nuechterlein & Green, 2005). To determine
whether the slow binocular rivalry rates observed in individuals with schizophrenia
(see Chapters 3 and 4) can be attributed to dysfunction in the cortical hemispheres,
results for binocular rivalry were compared to task performance on the Benton’s
Judgment of Line Orientation (BJLO) task (Benton et al., 1978); the BJLO task is
widely accepted to be processed within the right cortical hemisphere.
The BJLO task (Benton et al., 1978) has most frequently been used to test the
presence of visuospatial abnormalities and right hemisphere dysfunction (Benton,
Hannay & Varney, 1975; Benton et al., 1978, Hamsher, Capruso & Benton, 1992;
Hannay, Varney & Benton, 1976; Treccani, Torri & Cubelli, 2005; Trahan, 1998).
Chapter 5: Benton’s Judgment of Line Orientation - An Indicator of Visuospatial
Ability in Schizophrenia

162 Chapter 5: Benton’s Judgment of Line Orientation - An Indicator of Visuospatial Ability in Schizophrenia
Benton, Hannay and Varney (1975) observed that right-handed, right-brain-damaged
individuals were poorer at line orientation tasks compared to their healthy
counterparts, with left-brain-damaged individuals performing no differently to
healthy controls. These data have been replicated in a number of studies and are
supported by neurophysiological studies in both brain-diseased and healthy adults
(Hamsher et al., 1992; Isaacs, Edmonds, Chong, Lucas & Gadian, 2003; Finton,
Lucas, Graff-Radford & Uitti, 1998; Ng et al., 2001). Imaging studies (fMRI) reveal
that performing judgments of line orientation activate the right ventral extrastriate
cortex (Deutsch, Bourbon, Papanicolaou & Eisenberg, 1988; Hamsher et al., 1992;
Hannay et al., 1976; Isaacs et al., 2003; Ng et al., 2001; Tranel, Vianna, Manzel,
Damasio & Graowski, 2009) and increased blood flow in the right tempro-occipital
region has been observed using blood-oxygen-level dependent BOLD fMRI
(Deutsch et al., 1988; Hannay et al., 1976; Finton et al., 1998). In contrast, one fMRI
study reported robust bilateral cortical activation of equal strength in both right and
left superior parietal lobes, suggesting that both hemispheres were involved
(Nurnberger et al., 2000). This was corroborated by lesion data. However, when
these authors analysed wavelet data they observed an earlier and stronger high-
frequency signal over the right parietal lobe (four times stronger than those recorded
from the left), suggesting the right lobe has a ‘priming’ effect in visuospatial
processing. More recently, Tranel et al., (2009) found defective performance on the
BJLO task to be associated with damage to the right posterior parietal region
(specifically, in the angular gyrus and posterior supramarginal gyrus) and
occipitoparietal region (specifically, extending into the lateral superior occipital
gyri). These findings, using detailed modern lesion analysis techniques, are
consistent with the traditional proposed hemispheric underpinning of the BJLO (e.g.

Chapter 5: Benton’s Judgment of Line Orientation - An Indicator of Visuospatial Ability in Schizophrenia 163
Benton et al., 1994). Cortical processing observed by fMRI during the BJLO tends is
hypothesised to reflect ‘dorsal stream’ processing systems, occurring within the
posterior sector of the supramarginal gyrus, generally related to spatial functions.
Tranel et al., (2009) suggests the BJLO task is thus as an ‘occipitoparietal’ test,
consistent with the dorsal ‘where’ visual processing stream. In summary, the BJLO
provides an indication of right hemisphere cortical processing and is a relatively pure
visuospatial task. A large body of evidence supports the right hemisphere being the
‘dominant’ or ‘preferred’ system for processing visuospatial information (Tranel et
al., 2009). It is noteworthy that no parietal activation was observed (with fMRI) in a
non-spatial visual perception task; the Facial Recognition Test (Benton & Van Allen,
1968), suggesting parietal lobe activation may be specific to visuospatial processing
(Nurnberger et al., 2000; Tranel,et al., 2009).
In this chapter, two experiments are described. The first being the
development of a computer version of the BJLO and data collection tool; the second
comparing BJLO performance in a group of individuals with schizophrenia
compared to a group of healthy control participants.
5.2 The Benton’s Judgment of Line Orientation Task
As described, the BJLO is a relatively pure visuospatial task. It requires
minimal motor involvement and has good validity and reliability (Benton, 1983;
Eden, Stein, Wood & Wood, 1996; Woodard et al., 1996). The BJLO is performed
under free-space viewing conditions; it is easily administered and has no time
restrictions (Benton, 1978; Benton, 1983). The task has a test retest reliability of r =
0.90 (Benton et al., 1978). Task performance has been associated with gender and
age; with performance declining with increasing age and females on average,
performing more poorly than males (Benton et al., 1978; Benton, 1983; Benton,

164 Chapter 5: Benton’s Judgment of Line Orientation - An Indicator of Visuospatial Ability in Schizophrenia
1994; Caparelli-Daquer, Oliveira- Souza & Filho, 2009). Population norms and
adjustments for group comparisons have been established. See Benton (1983) and
Benton (1994).
The BJLO task comprises 30 different items. Presented in the lower portion of
each item is a reference image comprising an array of lines numbered 1 through 11,
3.8 cm in length which are separated by an angle of 18 degrees arranged in a semi-
circular fashion around an imaginary locus (Benton et al., 1978). Above each
reference image a pair of stimulus black lines measuring 1.9 cm are drawn in a
position that represents the proximal, middle or distal half of one of the reference
lines appearing below. The task is to indicate (by number) the two lines in the
reference array that have the same angle and the same location as the two stimulus
lines (Figure 5.1 depicts an example of a test item).
5.2.1 Scoring the Benton’s Judgment of Line Orientation task.
5.2.1.1 Global score.
Performance on the BJLO is typically reported using global scores (a
maximum possible score of 30) (Benton, 1983). Benton, Varney and Hamsher
(1978) demonstrated that individuals with lesions in the right hemisphere had lower
global scores than those with lesions in the left hemisphere when using global scores.
Those with left hemisphere lesions showed a performance comparable to that of
healthy participants. It is expected that individuals with schizophrenia would
perform more poorly on the BJLO as visual abnormities observed in schizophrenia
are generally associated with right hemisphere dysfunction (Endrass et al., 2002;
Frecska, Symer, White, Piscanu & Kulcsar, 2004; Lee et al., 2005; McCourt et al.,
2008; O’Donnell et al., 2002; Park, 1999; Wynn et al., 2005).

Chapter 5: Benton’s Judgment of Line Orientation - An Indicator of Visuospatial Ability in Schizophrenia 165
Figure 5.1: An item from the Benton’s Judgement of Line Orientation (BJLO) task.
Note: The participant is required to identify the two lines from the 11-line array below that match the slope and thus orientation of the two line segments presented above.
However, the published data relating to BJLO task performance in schizophrenia are
inconsistent. Some studies report poorer BJLO performance in participants with
schizophrenia than control participants (Blanchard & Neale, 1994; Halari, Mehrotra,
Sharma, Ng & Kumari, 2006; Harody et al., 2004; Lee et al., 2005), whereas others
report similar performance (Fleming et al., 1997; Riley et al., 2000). In these studies
schizophrenia data are reported as global scores out of 30 (Benton et al., 1978), with
no further line- or error-type analysis reported. It is possible that a closer
examination of judgment of line-orientation performance may reveal diminished
performance associated with right hemisphere dysfunction, with more errors
resulting from left hemi-space lines (lines 1-5) and more horizontal and vertical line
errors.
Other clinical populations have successfully been separated from controls by
analysing line errors or error types in situations where between-group differences

166 Chapter 5: Benton’s Judgment of Line Orientation - An Indicator of Visuospatial Ability in Schizophrenia
were not observed when comparing global BJLO scores alone (Finton et al., 1998;
Montse, Pere, Carne, Francesc & Eduardo, 2001; Ska, Poissant & Joanette, 1990).
Differences in Alzheimer’s disease (Finton et al., 1998; Ska et al., 1990), Parkinson’s
disease (Montse et al., 2001) and alcohol-related disorders (Berman & Noble, 1995)
have been identified using alternative methods to analyse BJLO data. Using
alternative scoring systems, similar to those proposed by (Ska et al., 1990), may
prove more informative than global scores analysis reported in the schizophrenia
literature to date.
5.2.1.2 Error type.
Ska, Poissant and Yves (1990) devised a method of analysing BJLO data by
error type (see Table 5.1 for a detailed description). Based on the assumption that
line orientation is related to dysfunction of the right hemisphere, these authors
suggested it would be reasonable to expect that the cortical decline in normal ageing
would affect line orientation judgment task performance. They noted from previous
studies that normal ageing was associated with a moderate-but-steady decline in line
orientation performance (Eslinger & Benton, 1983; Eislinger, Damasio, Benton &
Van Allen, 1985). Ska, Poissant and Yves (1990) compared global BJLO scores in a
group of patients with dementia (Alzheimer’s disease) n = 11 with 95 healthy
volunteers divided into three groups according to age (55-64 years, 65-74 years and
75-84 years). Global BJLO scores revealed no significant differences between
groups. However, the analysis according to error type (described in Table 5.1)
separated those with dementia from normal aged individuals. Chi-square analyses
revealed significant differences in QO2 (an oblique confused with another oblique
different by two or three spacings of 18 degrees), QO4 (both oblique lines displaced
without maintaining the initial spacing) V (a vertical error involving an incorrect

Chapter 5: Benton’s Judgment of Line Orientation - An Indicator of Visuospatial Ability in Schizophrenia 167
identification of the vertical line numbered 6), H (a horizontal error involving an
incorrect identification of the horizontal lines numbered 1 or 11), IQOV (a combined
oblique inter-quadrant and vertical error involving the incorrect answer in
combination) and IQOH (a combined oblique inter-quadrant and horizontal error
involving the incorrect answer in combination ) error scores for the two groups; no
healthy control participants made errors in VH, IQOV and IQOH, whereas these
were common errors for participants with dementia. Ska, Poissant and Yves (1990)
concluded that when a V, H, IQOV or IQOH error occur, or more than two V, H, or
IQO1 occur in a participant without visual impairment, brain dysfunction may be
suspected. These results have since been replicated in other studies (Finton et al.,
1998; Simard, van Reekum & Myran, 2003) and similar findings, using this type of
analysis have been reported for Parkinson’s disease (Finton et al., 1998; Montse et
al., 2001).
5.2.1.3 Individual line errors.
Berman and Noble analysed individual line errors (a possible score of 60)
rather than BJLO item errors (a score of 30) (Berman & Noble, 1995). Correctly
identifying both lines in each item provides a measure of ‘local’ rather than ‘global’
visual information processing. Berman and Noble (1995) in examining the Taq 1A
polymorphism of the DRD2 receptor gene found that boys who were A1+ (A1/A1
and A1/A2 genotypes) made a higher proportion of errors on all lines compared to
those carrying the A1- (A2/A2 genotype). Thus A1+ participants were more
influenced by ‘local’ than ‘global’ details based on their total line error scores.
5.2.1.4 Hemi-space errors.
Berman and Noble (1995) also grouped lines according to hemi-space as a
measure of laterality differences between the groups, (left, lines 1-5 compared with
168 Chapter 5: Benton’s Judgment of Line Orientation - An Indicator of Visuospatial Ability in Schizophrenia
right, lines 7-11). Hemi-space differences were then compared according to allele
status. Generally A1+ participants made more errors for the lines presented in the
right hemi-space than the left, with significant between-group differences observed
for right hemi-space errors. In contrast Eden et al., (1996) analysed BJLO by using
hemi-space in a study to distinguish children with reading disabilities from poor
readers and normal readers. They found that children with reading disabilities
performed more poorly on lines presented in the left hemi-space compared to normal
and poor readers. Those with reading disabilities scanned the BJLO task from the
opposite direction (left to right) to that of normal readers (right to left).
5.3 Pilot Testing the Computer Version of BJLO and Alternative Scoring Systems
A computer version of the BJLO was developed along with a method of
collecting and scoring BJLO data that could easily be entered into a computer
database for analysis (see Appendix D for an example). A computer version of the
task was considered necessary for the current study as this allowed all visual data to
be collected using the same medium, under standard conditions (stimuli presented on
a computer screen under laboratory conditions). This allowed the researcher to be
confident that all tasks were performed using similar methods to those used in the
binocular rivalry and backward-masking tasks.
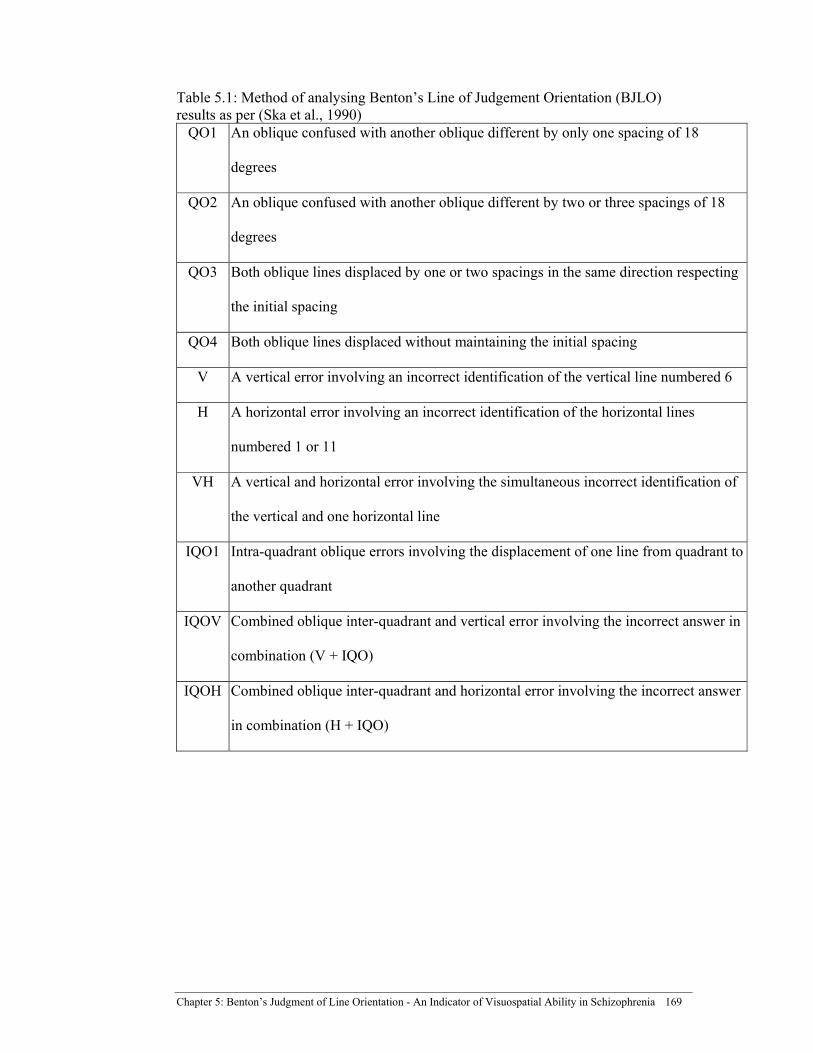
Chapter 5: Benton’s Judgment of Line Orientation - An Indicator of Visuospatial Ability in Schizophrenia 169
Table 5.1: Method of analysing Benton’s Line of Judgement Orientation (BJLO) results as per (Ska et al., 1990)
QO1 An oblique confused with another oblique different by only one spacing of 18
degrees
QO2 An oblique confused with another oblique different by two or three spacings of 18
degrees
QO3 Both oblique lines displaced by one or two spacings in the same direction respecting
the initial spacing
QO4 Both oblique lines displaced without maintaining the initial spacing
V A vertical error involving an incorrect identification of the vertical line numbered 6
H A horizontal error involving an incorrect identification of the horizontal lines
numbered 1 or 11
VH A vertical and horizontal error involving the simultaneous incorrect identification of
the vertical and one horizontal line
IQO1 Intra-quadrant oblique errors involving the displacement of one line from quadrant to
another quadrant
IQOV Combined oblique inter-quadrant and vertical error involving the incorrect answer in
combination (V + IQO)
IQOH Combined oblique inter-quadrant and horizontal error involving the incorrect answer
in combination (H + IQO)
170 Chapter 5: Benton’s Judgment of Line Orientation - An Indicator of Visuospatial Ability in Schizophrenia
5.3.1 Method.
5.3.1.1 Participants.
To confirm that the computer version of the BJLO yielded the same error rates
as a paper version, 14 right-handed healthy volunteers were recruited from available
staff at Royal Brisbane Hospital. Seven males and seven females, ranging in age
from 17 to 71 years (M = 41.6 years), who all had normal vision (two had spectacle-
lens-corrected vision) were presented with both the paper version and the computer
version of the task.
5.3.1.2 Procedure.
The computer version of the BJLO task was presented on a personal computer
monitor at a distance of one metre from the participant. The background luminance
was 1.398 cd/m2 (measured by Topcon BM7 Luminance Colorimeter, Japan). The
paper version, in booklet form, was placed on a table in front of the participant at a
distance of approximately 40 cm (comfortable working distance for the participant).
The 30 items comprising the BJLO were presented in the original prescribed
order for paper version of the test (1 through 30). However, the order of the items
presented in the computer version was altered to reduce the practice effect. The
order of BJLO tasks (paper or computer versions) was counterbalanced across the
participants to prevent potential order effects (that is, seven participants performed
the computer version first, and seven the paper version first). The task was performed
under free space viewing conditions with no time limit set for task completion.
To limit potential practice effects, each participant completed five practice
items prior to the commencement of the task. Participants were instructed to
verbally identify each line by identifying the corresponding number in the reference
diagram presented below. Verbal responses were recorded by the researcher onto a
Chapter 5: Benton’s Judgment of Line Orientation - An Indicator of Visuospatial Ability in Schizophrenia 171
data collection score sheet designed to enable BJLO data to be scored according the
three alternative scoring systems, that of (Benton et al., 1978; Ska et al., 1990:
Berman & Noble, 1995). This data recording system eliminated unnecessary motor
involvement or interruptions in concentration by the participant, providing the
researcher confidence that the results were purely related to visuospatial processing.
5.3.2 Results of pilot test
No significant difference between total number of errors were made by each
participant on the computer version of the BJLO task compared with the paper
version (257 and 256 respectively; t [32] = 0.50, p = .960). All participants obtained
global scores that were average or better (range 26-30), according to the scoring
system adopted by Benton et al., (1978), on both the computer and paper versions of
the BJLO.
All participants obtained normal error scores using the scoring system
developed by Ska, Poissant and Yves (1990) and had error scores consistent with
those found previously for healthy participants (Finton et al., 1998; Montse et al.,
2001; Ska et al., 1990). Participants made either QO1 errors (line confused with
another oblique line different by only one spacing of 18 degrees) or QO3 errors
(where both oblique lines are displaced one or two spacings in the same direction of
the initial spacing) which are not suggestive of a visuospatial abnormality (Ska, et
al., 1990). Participants made an average of 2.21 (SD = 1.88) QO1 errors on the
computer version of the BJLO compared with 1.64 (SD = 1.78) on the paper version
(t [26] = 0.467, p = .494) and 0.07 (SD = 0.267) QO3 errors on both the computer
and paper versions (t [26] = 0.00, p = 1.000).
Total number of line errors (a possible of 60 per participant), line number on
which these errors occurred (1 through 11), and hemi-space errors were not
172 Chapter 5: Benton’s Judgment of Line Orientation - An Indicator of Visuospatial Ability in Schizophrenia
statistically different between the computer and paper versions of the BJLO (p>.05).
All were within the range reported in control participants by Berman and Noble
(1995). A protocol incorporating all three systems of scoring (Appendix 4), a score
sheet and analyses were adopted for the major study investigating performance in
schizophrenia.
5.4 Study 4, Benton’s Judgment of Line Orientation in Participants with
Schizophrenia
Based on the neurophysiologic processes underlying BJLO (for example,
(Brown, 2009; Butler & Javitt, 2005; Cadenhead et al., 1998; Goodale et al., 1994;
Ng et al., 2001; Shapiro, Hillstrom & Husain, 2002) and results described in Chapter
4, it was predicted that participants with schizophrenia would demonstrate poorer
performance on the BJLO task compared to control participants. In addition, it was
predicted that performance for binocular rivalry magnocellular biased stimuli and
BJLO would be correlated.
5.4.1 Aims.
There were two aims of the study. The first aim was to compare performance
on a computer version of the BJLO, with respect to global scores (maximum possible
score 30), line segment scores (Benton et al., 1978), individual-line error scores,
hemi-space error scores (Berman & Noble, 1995), and line-type scores (Ska et al.,
1990), as an indicator of visuospatial ability in participants with schizophrenia
compared to healthy controls. The second aim was to compare BJLO scores with
binocular rivalry rates recorded using stimuli biased to magnocellular and
parvocellular visual pathways.

Chapter 5: Benton’s Judgment of Line Orientation - An Indicator of Visuospatial Ability in Schizophrenia 173
5.4.2 Method.
5.4.2.1 Participants with schizophrenia.
Twenty-five participants with schizophrenia were recruited to the study, 20
males and five females. Of the 25 participants 17 had participated in the study as
presented in Chapter 4; a further 8 participants were recruited from the outpatient
clinic at Royal Brisbane Hospital. All had a DSM-IV diagnosis of schizophrenia; 11
participants had a diagnosis of paranoid schizophrenia and 14 had undifferentiated
schizophrenia. Eleven participants had positive symptoms of schizophrenia, 11
negative and three had equal positive and negative symptoms (as assessed by the
PANSS). All participants with schizophrenia were taking a single dose of anti-
psychotic medication (four were taking Olanzapine, six Risperidone, seven
Clozapine, three Quetiapine and five were taking typical anti-psychotics); the mean
dose in chlorpromazine equivalents (CPZE) was 512 mg (SD = 286 mg).
5.4.2.2 Healthy control participants.
A total of 26 healthy control participants took part in the study.
Characteristics of participants are detailed in Table 5.2.
5.4.2.3 Procedures.
The BJLO computer-based task was performed as described in Section 5.4. All
participants were näive to the BJLO task and received the same instructions to
complete the task. Participants were asked to verbally report the position of two lines
by indicating the number of each line with respect to a reference array of lines
presented directly below (see Figure 5.1). The researcher recorded the responses on
the score sheet (see Appendix D). All participants completed five practice items
prior to the commencement of the BJLO task. The data from the practice items were
discarded.
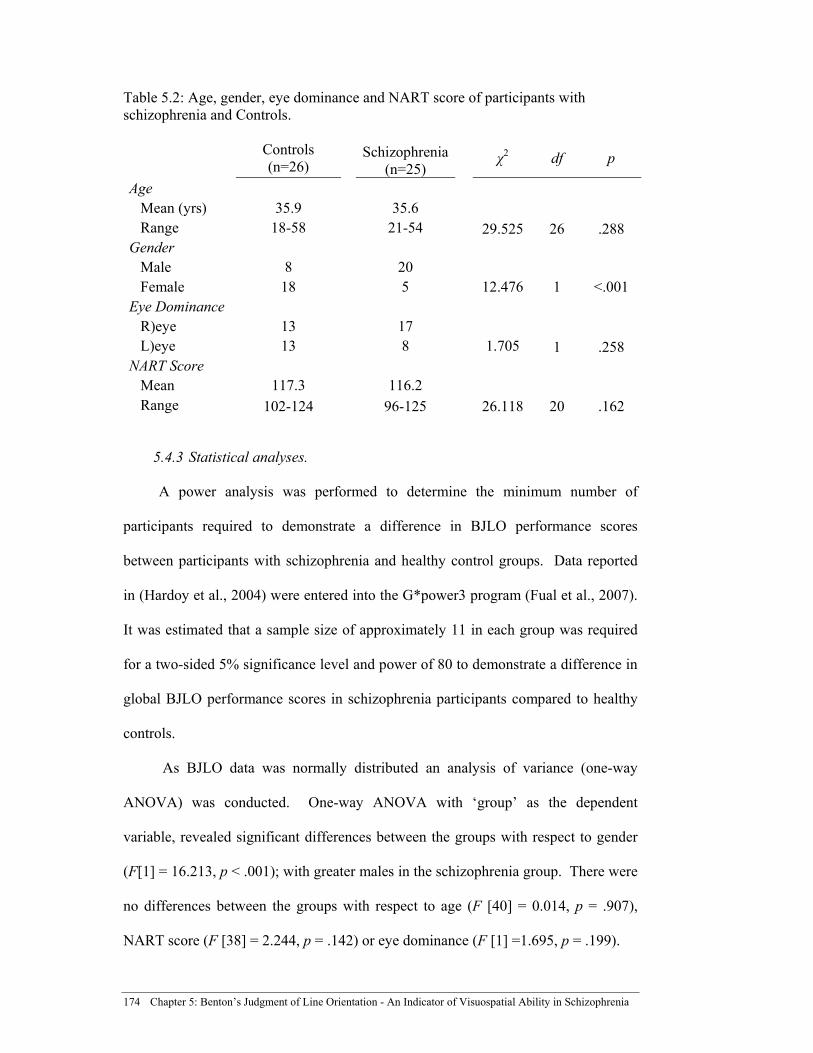
174 Chapter 5: Benton’s Judgment of Line Orientation - An Indicator of Visuospatial Ability in Schizophrenia
Table 5.2: Age, gender, eye dominance and NART score of participants with schizophrenia and Controls.
Controls (n=26)
Schizophrenia(n=25)
χ2 df p
Age Mean (yrs) 35.9 35.6 Range 18-58 21-54 29.525 26 .288 Gender Male 8 20 Female 18 5 12.476 1 <.001 Eye Dominance R)eye 13 17 L)eye 13 8 1.705 1 .258 NART Score Mean 117.3 116.2 Range 102-124 96-125 26.118 20 .162
5.4.3 Statistical analyses.
A power analysis was performed to determine the minimum number of
participants required to demonstrate a difference in BJLO performance scores
between participants with schizophrenia and healthy control groups. Data reported
in (Hardoy et al., 2004) were entered into the G*power3 program (Fual et al., 2007).
It was estimated that a sample size of approximately 11 in each group was required
for a two-sided 5% significance level and power of 80 to demonstrate a difference in
global BJLO performance scores in schizophrenia participants compared to healthy
controls.
As BJLO data was normally distributed an analysis of variance (one-way
ANOVA) was conducted. One-way ANOVA with ‘group’ as the dependent
variable, revealed significant differences between the groups with respect to gender
(F[1] = 16.213, p < .001); with greater males in the schizophrenia group. There were
no differences between the groups with respect to age (F [40] = 0.014, p = .907),
NART score (F [38] = 2.244, p = .142) or eye dominance (F [1] =1.695, p = .199).

Chapter 5: Benton’s Judgment of Line Orientation - An Indicator of Visuospatial Ability in Schizophrenia 175
One-way ANOVAs with ‘group’ as the dependent variable and global scores
and line error scores as independent variables (adjusted for gender as per Benton,
1983) were conducted to determine group differences between global scores (Benton
et al., 1978), individual line error scores, left and right hemi-space error scores
(Berman & Noble, 1995), and line type scores (Ska et al., 1990). Pearson’s
correlation coefficients were used to establish whether there was an association
between BJLO performance scores and binocular rivalry rates using stimuli that
biased the magnocellular and parvocellular pathways. The effect of DSM-IV
diagnosis and medication dose in the schizophrenia group on global score, line error
scores, line segment scores, and hemi-space errors was assessed. Due to the small
number of participants in each of these schizophrenia sub-groups the Chi Square (χ2)
statistic was used.
5.4.4 Results.
5.4.5.1 Global score analysis.
There was a significant between-group difference in BJLO correct global score
(out of a possible 30 points) (Benton, et al., 1978). Participants with schizophrenia
had lower average correct global scores on the BJLO task (ANOVA) than control
participants; M = 20.92 (SD = 5.6) compared with M = 25 (SD = 2.87) for
participants with schizophrenia and healthy control participants respectively (F[(1,
49] = 10.764, p = .002). When scores were adjusted for gender (as per (Benton,
1983), the overall difference increased as there were more females in the control
group; schizophrenia mean correct score was 21.48 (SD = 2.96) compared with 26.46
(SD = 2.96) for healthy control participants (F[1, 49] = 5.933, p < .001). As
adjustment for gender favoured the control group, increasing the already large effect,
further analyses regarding line and spatial errors were conducted using raw scores.
176 Chapter 5: Benton’s Judgment of Line Orientation - An Indicator of Visuospatial Ability in Schizophrenia
Unlike previously-reported data (Benton et al., 1978; Benton, 1994; Caparelli-
Daquer et al., 2009), age, gender, NART score and eye dominance had no effect on
global BJLO scores; age F(26, 24) = 0.785, p = .727, gender F(1, 49) = 0.563, p
=.457, NART score F(20, 22) =1.602, p = .142, and eye dominance F( 1, 49) =
1.116, p = .296.
Medication dose, DSM-IV diagnosis and symptom ratings (PANSS) had no
effect on BJLO global scores in the schizophrenia group; (F = 0.333, df = 13, p =
.968, F = 2.13, df = 13, p = .108, F = 0.776, df = 13, p = .670, respectively).
5.4.5.2 Error type analysis.
Significant between-group differences were observed for QO1 errors (F [1, 49]
= 6.515, p = .014) and (H) horizontal errors (F[1, 49] = 4.163, p = .047) (Ska et al.,
1990). Although no other error type reached significance, participants with
schizophrenia generally made more QO2 and QO4 errors than controls (F[1, 49] =
3.232, p = .078, and F[1, 49] = 3.012, p = .089 respectively). Only participants with
schizophrenia made V, H, 1QOV and 1QOH errors (as reported for participants with
Alzheimer’s disease (Ska et al., 1990) and Parkinson’s disease (Montse et al., 2001).
5.5.5.3 Line error analysis.
Analyses with respect to line errors, with a maximum score out of 60 (Berman
and Noble, 1995), revealed significant group differences; schizophrenia M = 48.60,
SD = 8.91) correct responses, control participants M = 54.31, SD = 3.53, F(1, 49) =
9.183, p = .004. Analyses of individual lines revealed significant group differences
in error scores for Line 2, F(1, 49) = 4.294, p = .044, Line 3, F(1, 49) = 11.746, p =
.001, Line 4, F(1, 49) = 7.043, p = .011, and Line 9, F(1, 49) = 5.582, p = .022. No
errors were made for Lines 1 and 6 in either group.
Chapter 5: Benton’s Judgment of Line Orientation - An Indicator of Visuospatial Ability in Schizophrenia 177
5.5.5.4 Hemi-space analyses.
To explore possible laterality differences, separate line analyses of left hemi-
space (Lines 1-5) and right hemi-space (Lines 7-11) (Berman & Noble, 1995) were
undertaken. There were significant group differences in both left and right hemi-
space error scores. Participants with schizophrenia had lower scores in both hemi-
spaces; left hemi-space mean errors, schizophrenia M = 5.0, SD = 3.81, controls M =
2.12, SD = 1.56, F(1, 49) = 12.72, p = .001; right hemi-space errors, schizophrenia M
= 6.2, SD = 4.8, controls M = 3.54, SD = 2.6), F(1, 49) = 6.12, p = .017. Participants
with schizophrenia made significantly more errors in the right hemi-space (M = 6.2,
SD = 4.8) compared to the left hemi-space (M = 5.0, SD = 3.8) t (24) = -2.502, p =
.02. See Tables 5.3 and 5.4 for a summary of the results.
5.5 Association between Benton’s Judgment of Line Orientation and binocular
rivalry
Significant negative correlations between binocular rivalry rate for the
magnocellular biased stimulus condition and BJLO global scores (rho =-0.471, n =
17, p = .056), and line error scores (rho = -0.483, n = 17, p = .05) were observed in
participants with schizophrenia (non-parametric correlations (spearman’s rank order
- rho) were used as binocular rivalry data was not normally distributed). However,
no correlations between binocular rivalry rates elicited by parvocellular biased
stimuli and global BJLO scores were observed in the group with schizophrenia. No
correlations were found between binocular rivalry rates (magnocellular biased and
parvocellular biased) and BJLO global scores and line error scores in control
participants (see Table 5.4).
178 Chapter 5: Benton’s Judgment of Line Orientation - An Indicator of Visuospatial Ability in Schizophrenia
5.6. Global score
Based on the neurophysiological processes underlying BJLO (Brown, 2009:
Butler & Javitt, 2005; Cadenhead et al., 1998; Goodale et al., 1994; Ng et al., 2001;
Shapiro et al., 2002) and results described in Chapter 4, it was predicted that
participants with schizophrenia would demonstrate poorer performance on the BJLO
task compared to healthy participants. Consistent with these predictions, participants
with schizophrenia had significantly lower BJLO global performance scores than
participants without schizophrenia (Benton et al., 1978). These data are consistent
with previous studies in participants with schizophrenia (Blancharf & Neale, 1994;
Halari et al., 2006; Hardoy et al., 2004; Lee et al., 2005: Silver & Goodman, 2008).
The significant differences in global BJLO performance between participants
with schizophrenia and controls observed in this study are consistent with processing
in the right (and possibly left) hemisphere involving the superior parietal lobes right
temporo-occipital region (Benton et al., 1975; Benton et al., 1978; Deutschm et al.,
1988; Hamsher et al., 1992; Isaacs et al., 2003; Hannay et al., 1976; Treccani et al.,
2005; Trahan, 1998; Ng et al., 2001). Low BJLO scores (< 19) have been most-
frequently associated with right hemisphere dysfunction (Benton et al., 1975; Benton
et al., 1978; Deutsch et al., 1998; Hamsher et al., 1992; Hannay et al., 1976; Treccani
et al., 2005; Trahan, 1998; Ng et al., 2001).

Chapter 5: Benton’s Judgment of Line Orientation - An Indicator of Visuospatial Ability in Schizophrenia 179
Table 5.3: Benton’s Judgement of Line Orientation (BJLO) data for control participants and participants with schizophrenia: mean global scores (out of 30 and 60), line error scores and hemi-space errors for the BJLO task.
Controls
Schizophrenia
ANOVA (n = 26) (n = 25)
M SD. M SD df F p
Benton (1978)
Global Score
(30) 25 2.87 20.92 5.63 1 10.76 .002*
Berman & Noble (1995).
Total line
errors (60) 54.31 3.53 48.60 8.91 1 9.183 .004*
Line 1 0 0 0 0 1 - -
Line 2 0.23 0.43 0.84 1.43 1 4.294 .044*
Line 3 0.69 0.88 1.76 1.30 1 11.84 .001*
Line 4 0.88 0.99 1.68 1.14 1 7.043 .011*
Line 5 0.27 0.45 0.44 0.71 1 1.054 .310
Line 7 0.23 0.43 0.68 1.18 1 3.312 .075
Line 8 1.77 1.37 2.44 1.83 1 2.216 .143
Line 9 1 1.06 1.88 1.56 1 5.582 .022*
Line 10 0.58 1.14 1.12 1.64 1 1.899 .174
Line 11 0.08 0.27 0.28 0.68 1 1.999 .164
L Hemi-space
Lines 1 -5 2.12 1.56 5.00 3.81 1 12.72 .001*
R Hemi-space
Lines 7 - 11 3.54 2.6 6.20 4.80 1 6.12 .017*
Note: * Indicates p < .05 significance (two tailed).
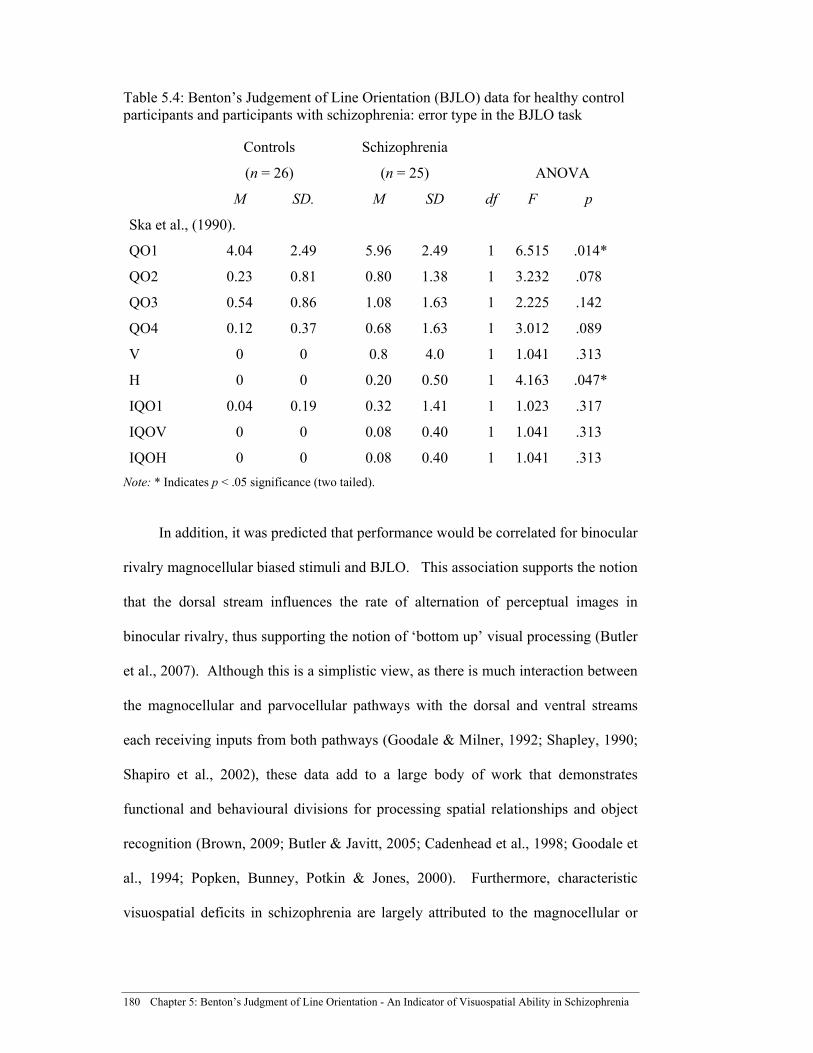
180 Chapter 5: Benton’s Judgment of Line Orientation - An Indicator of Visuospatial Ability in Schizophrenia
Table 5.4: Benton’s Judgement of Line Orientation (BJLO) data for healthy control participants and participants with schizophrenia: error type in the BJLO task
Controls Schizophrenia
ANOVA (n = 26) (n = 25)
M SD. M SD df F p
Ska et al., (1990).
QO1 4.04 2.49 5.96 2.49 1 6.515 .014*
QO2 0.23 0.81 0.80 1.38 1 3.232 .078
QO3 0.54 0.86 1.08 1.63 1 2.225 .142
QO4 0.12 0.37 0.68 1.63 1 3.012 .089
V 0 0 0.8 4.0 1 1.041 .313
H 0 0 0.20 0.50 1 4.163 .047*
IQO1 0.04 0.19 0.32 1.41 1 1.023 .317
IQOV 0 0 0.08 0.40 1 1.041 .313
IQOH 0 0 0.08 0.40 1 1.041 .313
Note: * Indicates p < .05 significance (two tailed).
In addition, it was predicted that performance would be correlated for binocular
rivalry magnocellular biased stimuli and BJLO. This association supports the notion
that the dorsal stream influences the rate of alternation of perceptual images in
binocular rivalry, thus supporting the notion of ‘bottom up’ visual processing (Butler
et al., 2007). Although this is a simplistic view, as there is much interaction between
the magnocellular and parvocellular pathways with the dorsal and ventral streams
each receiving inputs from both pathways (Goodale & Milner, 1992; Shapley, 1990;
Shapiro et al., 2002), these data add to a large body of work that demonstrates
functional and behavioural divisions for processing spatial relationships and object
recognition (Brown, 2009; Butler & Javitt, 2005; Cadenhead et al., 1998; Goodale et
al., 1994; Popken, Bunney, Potkin & Jones, 2000). Furthermore, characteristic
visuospatial deficits in schizophrenia are largely attributed to the magnocellular or

Chapter 5: Benton’s Judgment of Line Orientation - An Indicator of Visuospatial Ability in Schizophrenia 181
dorsal stream (Cadenhead et al., 1998; Doinger et al., 2002; MClure, 2001; Schechter
et al., 2003).
Table 5.5: Correlations between global Benton’s Judgement of Line Orientation (BJLO) scores and binocular rivalry (BR) rates for stimuli that bias the BR task for either the magnocellular or parvocellular visual pathways (spearman rank order).
BR rate - Magnocellular
Stimuli
BR rate - Parvocellular
Stimuli
rho p n rho p n
Control participants
Global scores (30) 0.183 .426 21 0.360 .109 21
Line error scores (60) 0.181 .432 21 0.411 .064 21
Schizophrenia Participants
Global scores (30) -0.502 .04* 17 -0.282 .257 17
Line error scores (60) -0.483 .05* 17 -0.312 .207 17
Note. * Indicates p < .05
The findings of other studies indicate that participants with schizophrenia have
abnormalities in one (or both) of these visual pathways (Brown, 2009; Butler &
Javitt, 2005; Cadenhead et al., 1998; Doinger et al., 2002; Goodale et al., 1994;
McClure, 2001; Popken et al., 2000;Schechter et al., 2003) and one (or both) of the
cerebral hemispheres (Endrass et al., 2002; Evans & Schwartz, 1997; Frecska, Symer
et al., 2004; Gastaldo et al., 2002; Levander et al., 1985; McCourt et al., 2008; Narr,
Green, Capetillo-Cunliffe, Toga & Zaidel, 2003; O’Donnell et al., 2002; Park, 1999;
Schwartz et al., 1984; Wynn et al., 2005). Data presented in Chapter 4 of this thesis
provides further evidence for this position.

182 Chapter 5: Benton’s Judgment of Line Orientation - An Indicator of Visuospatial Ability in Schizophrenia
5.7.1.1 Error type.
Significant between-group differences were observed for QO1 errors
suggestive of poorer overall global processing in schizophrenia. Although no other
error type reached significance, participants with schizophrenia generally made more
QO2 and QO4 errors than controls. A previous study noted that QO2 and QO4
errors distinguished participants with dementia from controls (Ska et al., 1990), thus
some degeneration of cortical visual processing may occur in Schizophrenia. Only
participants with schizophrenia made V, H, 1QOV and 1QOH errors, consistent with
previous reports in Alzheimer’s disease (Simard et al., 2003; Ska et al., 1990) and
Parkinson’s disease (Montse et al., 2001). Ska et al., (1990) suggest that a
participant without primary visual impairment may be suspected to have some brain
dysfunction when type VH, 1QOV, or 1QOH errors occur, or more than two, type V,
H or 1QO1 errors occur. Two participants with schizophrenia made errors that
would indicate some form of brain dysfunction consistent with the position made by
(Ska et al., 1990); one participant with schizophrenia made two H and two 1QOH
errors, and another made two 1QOH errors and seven 1QO1 errors.
It is generally agreed that the visuospatial abnormalities elicited by the BJLO
task observed in ageing populations, such as Alzheimer’s and Parkinson’s Disease,
are related to dopamine depletion (Finton,et al., 1998; Montse et al., 2001; Ska et al.,
1990). Participants with Parkinson’s disease, a condition where reduced dopamine is
neuropathological, are reliably separated from normal participants with the BJLO
task. Schizophrenia is also considered to be a disease related to dopamine, with
many authors suggesting schizophrenia to be a hyper-dopaminergic disorder
(Hirvonen et al., 2005; Seeman & Kapur, 2000). It would be reasonable to assume

Chapter 5: Benton’s Judgment of Line Orientation - An Indicator of Visuospatial Ability in Schizophrenia 183
that specific intra-quadrant errors on the BJLO task made by participants with
schizophrenia were indicative of dopamine related visuospatial abnormalities.
5.7.1.2 Hemi-space.
Participants with schizophrenia made significantly more errors in each hemi-
space than did healthy controls. These results are consistent with a large body of
work indicating overall visual abnormalities in schizophrenia related to hemi-space
presentation of visual data to stimulate the left and right visual hemispheres. Deficits
in left and right hemispheric visual processing in schizophrenia have been noted in a
variety of visual tasks associated with spatial perception and attention (O’Donnell et
al., 2002), sustained attention (Evans & Schwartz, 1997) selective attention
(Holzman, 1987) working memory, (Park, 1999), and detecting visual information
(Schwartz et al., 1994).
Participants with schizophrenia in this sample made significantly more right
hemi-space errors compared to left, however control participants also made more
right than left hemi-space errors. Right hemi-space errors are generally processed by
the left hemisphere, and this is opposite to the hemisphere thought to be typically
most effected in schizophrenia. However, it should be noted that significant
differences were found between the groups for Lines 2, 3 and 4, which are left hemi-
space presentations and only one of right hemi-space presentation, Line 9. The
results reported here support the notion that visuospatial information is processed
within each cortical hemisphere. Tranel et al., (2009) make the point that although
the BJLO is considered to be subjected to predominantly processing in the right
hemisphere, fMRI and lesion studies also indicate some left hemisphere
involvement. There is a large body of evidence to support the right hemisphere
being the ‘dominant’ or ‘preferred’ system for processing visuospatial information.

184 Chapter 5: Benton’s Judgment of Line Orientation - An Indicator of Visuospatial Ability in Schizophrenia
5.7.2 Potential Impact of BJLO Performance
5.7.2.1 Age and gender.
The results recorded by controls were within previously established population
norms (Benton, 1983). No age or gender effects were seen on global performance
scores or individual line and line spacing errors in this study, although age and
gender have been reported to impact on BJLO in previous studies (Collaer & Nelson,
2002; Montse et al., 2001; Woodard et al., 1998). Normative standards of
performance for the BJLO for age and sex have been established by Benton and
correcting global scores for age and gender increases these group differences further
(Benton, 1983). Interpreting BJLO performance data on the basis of age and gender
is limited as age- and sex-matched samples were not used in this study.
5.7.2.2. Medication effects.
The type of anti-psychotic medication taken and anti-psychotic dose, based on
CPZEs had no effect on BJLO scores in participants with schizophrenia. These data
are consistent with other studies reporting no medication effect on BJLO
performance (Buchanan, Holstein & Breier, 1994; Halari et al., 2006; Riley et al.,
2000; Sweeney, Hass, Keilp & Long, 1991). Double-blind studies have also observed
that BJLO performance was not different in participants with schizophrenia either
after twelve weeks of treatment with Clozapine or Haloperidol, or after twelve
months of treatment with Clozapine (Buchanan et al., 1994).
5.7.2.3 Schizophrenia sub-types and symptom ratings.
Schizophrenia sub-types (whether the participant had paranoid schizophrenia
or undifferentiated schizophrenia) and symptomology (negative or positive
schizophrenia measured by PANSS) had no effect on BJLO scores. This was
expected as BJLO performance has been found not to be related to the symptoms of
Chapter 5: Benton’s Judgment of Line Orientation - An Indicator of Visuospatial Ability in Schizophrenia 185
schizophrenia (Buchanan et al., 1994; Riley et al., 2000). Furthermore, all the
participants with schizophrenia in this cohort were relatively stable on current
medication and living in community settings. Greater differences may have been
seen in a more symptomatic cohort of participants.
5.7.2.4 Cognitive ability.
It may be that differences in BJLO performance scores are related to general
cognitive decline in schizophrenia (Fleming et al., 1997; Halari et al., 2006; Lee et
al., 2005; Trahan, 1998). It is unlikely that the differences in BJLO are attributed
solely to cognitive ability as NART (a measure of pre-morbid cognitive functioning)
scores were not found to be significantly different between the two groups in this
sample (as found in the previous chapters).
5.7.3 Comparing Benton’s Judgment of Line Orientation with Binocular Rivalry
Significant negative correlations between binocular rivalry rate in the
magnocellular stimulus condition and BJLO global scores were found only in
participants with schizophrenia. This faster binocular rivalry rate in participants with
schizophrenia was associated with fewer BJLO errors. In the previous three
chapters, a slower binocular rivalry rate was demonstrated over a range of stimulus
conditions in participants with schizophrenia, which has been interpreted as an
abnormal binocular rivalry rate. Taking this together with the results of the current
chapter suggest that this slower binocular rivalry rate is an indication of reduced
visuospatial ability in schizophrenia largely attributable to magnocellular processing
or functions of the dorsal visual pathway (Butler & Javitt, 2005; Doniger et al., 2002;
McClure, 2001; Schechter et al., 2003). In participants with schizophrenia, no
significant correlations were evident between binocular rivalry rates elicited by
parvocellular binocular rivalry stimuli, perhaps suggesting that ventral visual

186 Chapter 5: Benton’s Judgment of Line Orientation - An Indicator of Visuospatial Ability in Schizophrenia
processing was not a feature of binocular rivalry. However, this is unlikely as slow
binocular rivalry rate and abnormal backward-masking performance were observed
in schizophrenia when using stimuli that biased the parvocellular pathways in the
previous chapter. Previous published studies (Brown, 2009; Butler & Javitt, 2005;
Cadenhead et al., 1998; Doniger et al., 2002; Goodale et al., 1994; McClure, 2001;
Popken et al., 2000; Schechter et al., 2003) also indicate that participants with
schizophrenia have abnormalities in one (or both) of these visual pathways and one
(or both) of the cerebral hemispheres (Endrass et al., 2002; Evans & Schwartz, 1997;
Ferecska, Symer et al., 2004; Gastaldo et al., 2002; Levander et al., 1985; McCourt,
et al., 2008; Narr et al., 2003; O’Donnell et al., 2002; Park, 1999; Schwartz et al.,
1984; Wynn et al., 2005).
5.7.4 Cortical Pathway and Hemispheric Models of Involvement
5.7.4.1 Dorsal and Ventral Pathways
No association was found between binocular rivalry rates for both the
magnocellular or parvocellular biased tasks and BJLO global or hemi-space scores in
control participants. To be confident that binocular rivalry rate was attributable to
processing via the dorsal stream it would be expected that binocular rivalry rates
elicited from magnocellular binocular rivalry stimuli would also correlate with BJLO
global scores in these participants. This lack of correlation must therefore be
interpreted cautiously. Although the ventral stream receives some magnocellular
input, the magnocellular pathway provides the dominant initial input to the dorsal
necessary for processing movement and spatial location information; the prominent
feature of the dorsal stream (Brown, 2009). Moreover, it has been noted using brain
mapping techniques that the normal adult dorsal stream in humans has additional
intra- and inter-hemispheric connections (Loenneker et al., 2010). Dorsal fibres
Chapter 5: Benton’s Judgment of Line Orientation - An Indicator of Visuospatial Ability in Schizophrenia 187
penetrate into contralateral hemispheres via commissural structures and projection
fibres that extend to the superior temporal gyrus and ventral association pathways,
with intra-hemispheric connectivity being particularly strong in the dorsal stream of
the right hemisphere (Loenneker et al., 2010). If binocular rivalry is subject to
magnocellular or dorsal stream processes, it is conceivable that the slow binocular
rivalry rate in schizophrenia may be related to the slow exchange of visuospatial
information from one hemisphere to the other.
As stated previously, the BJLO is considered a task involving predominantly
right cortical hemisphere processes. Performance on the BJLO in individuals with
schizophrenia was poorer than in control participants, suggesting abnormal
processing of the ‘Where is it?’ system, the magnocellular pathway/dorsal stream.
Although it is likely the parvocellular or ventral system is also involved in binocular
rivalry. The results presented in Chapter 4 and in the current chapter suggest that the
magnocellular or dorsal stream plays a prominent role in visuospatial processing in
schizophrenia. Binocular rivalry may therefore be reliant on intact magnocellular or
dorsal systems, with abnormalities slowing the alternation between opposing
perceptual images.
5.7.4.2 The Cortical Hemispheres
Poorer performance on BJLO task was suggestive of impaired right hemisphere
processing in schizophrenia. Individuals with schizophrenia also performed more
poorly in binocular rivalry tasks. Rather than an ‘inter-hemispheric switch’ driving
binocular rivalry (Funk & Pettigrew, 2003; Miller et al., 2000; Miller, 2001;
Pettigrew & Miller, 1998), it may be that interactions between magnocellular (or
dorsal stream) and parvocellular (or ventral stream) processing spatial and temporal
information from the rival stimuli within the hemisphere drive binocular rivalry.

188 Chapter 5: Benton’s Judgment of Line Orientation - An Indicator of Visuospatial Ability in Schizophrenia
Prefrontal cortical involvement is not necessary to generate binocular rivalry,
suggesting this is a locally-driven process resolved ‘lower down’ in the visual
pathway within each hemisphere (Calle-Inclan & Gallego, 2006). Interaction
between the ventral and dorsal streams lower in the visual pathways would explain
why binocular rivalry is able to occur in split-brain observers (O’Shea, Corballis,
2005b; O’Shea & Corballis, 2003).
5.6 Conclusion
A significant difference was measured between participants with schizophrenia
and control participants in BJLO global scores (Benton et al., 1978; Berman &
Noble, 1995), individual line error scores, line segment scores (Berman & Noble,
1995), hemi-space error scores (Benton et al., 1978), and line type scores (Ska et al.,
1990). These data suggest overall abnormalities in visuospatial ability in participants
with schizophrenia. Cognitive ability (measured by the NART), age, medication
dose, DSM-IV diagnosis and symptom ratings (PANSS) had no effect on BJLO
global scores, line error scores, line segment scores, and hemi-space errors in the
schizophrenia group, suggesting that the abnormalities demonstrated are due to
visuospatial processing in schizophrenia. Visuospatial processing is considered to be
predominantly processed by structures within the right cortical hemispheres,
involving the magnocellular or dorsal pathway systems. These results are consistent
with previous studies in schizophrenia.
These results presented in this chapter, considered together with the results of
the previous chapter, indicate that the binocular rivalry may be initiated by
competition between the magnocellular and parvocellular pathways within (rather
than between) each cortical hemisphere. If this is the case the mechanisms involved
in binocular rivalry would be distributed throughout the visual hierarchy. Abnormal
Chapter 5: Benton’s Judgment of Line Orientation - An Indicator of Visuospatial Ability in Schizophrenia 189
binocular rivalry rate thus indicating processing and information transfer
abnormalities at all levels of visual processing (i.e. involving occipital, parietal,
temporal and frontal cortical structures). It is pertinent to investigate the role that
neurotransmitters would have in these processes.
The neurotransmitter most frequently associated with schizophrenia is
dopamine. Given that dopamine is also responsible for moderating many functions
within the visual system, it is reasonable to expect that some of the visual
abnormalities seen in schizophrenia, and perhaps binocular rivalry to be associated
with dopamine. In the following chapter (Chapter 6), the role of dopamine in visual
processing is examined.
Chapter 6: Taq1 allele of the DRD2 dopamine receptor gene, binocular rivalry, visual backward masking and Benton’s Judgment of Line Orientation 190
6.1 Dopamine in Vision
It is well established that dopamine plays a role in human visual processing
(Brandies & Yehuda, 2008; Bodis-Wollner, 2009; Djamgoz, Hankins, Hirano &
Archer, 1997; Masson et al., 1993; Witovsky, 2004). Many patients with
Parkinson’s disease, a disorder of diminished dopamine function are demonstrated to
have abnormal VEPs, and therapy with dopamine precursors has been shown to
improve the evoked potentials (Bodis-Wollner, 1997). Conversely, drugs with
dopamine-blocking properties delay the normal VEPs in sufferers of schizophrenia
(Bodis-Wollner, 1988). Using animal models (monkeys), when VEPs were
measured pre- and post-administration of sulpiride (a dopamine D2 antagonist), the
P100 component of the VEP decreased, while the amplitude of the cognitive P300
component decreased (Antal, Keri & Bodis-Wollner, 1997). This suggests that D2
receptors play a major role in visuo-cognitive processes in dopamine-related
conditions, such as Parkinson's disease and schizophrenia. The progressive loss of
colour discrimination and contrast sensitivity in Parkinson’s disease (Crevits, 2003;
Diederich, Raman, Leurgans & Foetz, 2002; Zahodne & Fernandex, 2008) that
occurs with depletion of dopamine receptors in the retina and visual pathways with
age has also been suggested to be due in part to D2 depletion.
Animal models have provided evidence that density and frequency of D2
dopamine receptors found in the retina and primary visual pathway are similar to
those in the primate striate cortex (Djamgoz et al., 1997; Schorderet & Nowak, 1990;
Witkovsky, 2004). Therefore, a better understanding of function of dopamine and
D2 receptors in the retina and striatum provides a unique opportunity to examine
Chapter 6: Taq1 allele of the DRD2 dopamine receptor gene, binocular rivalry, visual
backward masking and Benton’s Judgment of Line Orientation
Chapter 6: Taq1 allele of the DRD2 dopamine receptor gene, binocular rivalry, visual backward masking and Benton’s Judgment of Line Orientation 191
neurotransmitter involvement in visual neurocognitive processing along the visual
pathways (Bodis-Wollner & Antal, 1995).
6.1.1 The A1 allele of the DRD2 receptor gene.
Given this interest in D2 receptors within the visual system, and that
schizophrenia has been associated with abnormal D2 receptor density and
functioning, it is plausible to examine visual processing according to genetic
variations in D2 receptors. Dopamine receptor genes that have commonly been
investigated in neuropsychiatric diseases, including schizophrenia, include DRD2,
DRD3 and DRD4 receptor genes and their polymorphisms (Talkowski, Bamme,
Hader & Nimgaonkar, 2007; Ohara, 1996). The TaqI A of dopamine D2 receptor
(DRD2) gene is a commonly investigated gene in schizophrenia (Behravan,
Hemayatkar, Toufani, & Abdollahian, 2008), with data available relating to
functional interactions of the gene (Matsumoto et al., 2005: Mihara et al., 2003),
making it a promising genetic variant to explore. The TaqI A of dopamine D2
receptor (DRD2) gene has been mapped to an adjacent kinase gene and is also
sometimes referred to as ANKK1.
Carriers of TaqI A of dopamine D2 receptor (DRD2) gene (A1+ individuals
with A1/A1 or A1/A2 genotypes) typically have a lowered DRD2 density and
diminished function of DRD2 in the striatum, (Kondo et al., 2003; Mihara, Kondo et
al., 2000; Nobel, 2000). The human dopamine D2 receptor gene (DRD2) has been
posited as a candidate gene for neuro-psychiatric disease (Finckh et al., 1996; Noble,
2000; Noble, 2003). This has been associated with Tourette's syndrome, post-
traumatic stress disorder (PTSD) and certain symptoms associated with affective
disorders and schizophrenia, Parkinson's disease and iatrogenically-induced
movement disorders (Noble, 2000). It is hypothesised that the DRD2 is a
192Chapter 6: Taq1 allele of the DRD2 dopamine receptor gene, binocular rivalry, visual backward masking and Benton’s Judgment of Line Orientation
reinforcement or reward gene, as variants of the DRD2 gene have been associated
with addictive disorders, including alcoholism (Blum et al., 1991; Blum et al., 1993),
cocaine, nicotine and opioid dependence (Laruelle, Gelenter & Innis, 1998; Noble,
2003; Young, Lawford, Nutting & Noble, 2004) and obesity (Noble, 2003).
The A1 allele of the DRD2 gene has been found in post-mortem studies to be
over represented in patients with schizophrenia (Noble, 2000; Noble, 2003).
However association studies in schizophrenia generally show no relationship
(Behravan, Hemayatkar, Toufani & Adbollahian, 2008; Suzuki, Kondo et al., 2000;
Parsons et al., 2007; Ohara et al., 1996; Kishida et al., 2003), suggesting the A1
allele acts as a modifying gene in schizophrenia rather than being of primary
aetiological significance (Comings et al., 1991).
A1+ individuals generally have more symptoms of schizophrenia (Ohara et al.,
1996; Sanjuan et al., 2004) and are at greater risk of significant adverse effects
(Alenius et al., 2008; Kaiser, Tremblay, Klufmoller, Roots & Brookmoller, 2002).
They tend to suffer more extra-pyramidal symptoms (Guzey, Scordo, Spina,
Landsem & Spigset, 2007; Mihara, Suzuki et al., 2000, Kaiser et al., 2002;
Hedenmalm, Guzey, Dahl, Yue & Spigset, 2006; Young, Lawford et al., 2004), and
are more at risk of tardive dyskinesia (Chen, Wei, Koong & Hsiao, 1997), polydipsia
(Matsumoto, et al., 2005) and neuroleptic malignant syndrome (Mihara et al., 2003;
Suzuki et al., 2001). These findings have been confirmed in most studies. Mihara et
al., (2000) found that A1+ female patients were at greater risk of developing
neuroleptic-induced hyperprolactinemia, and had increased serum prolactin when
treated with bromocriptine (a dopamine agonist) (Mihara, Kondo et al., 2000; Mihara
et al., 2001).

Chapter 6: Taq1 allele of the DRD2 dopamine receptor gene, binocular rivalry, visual backward masking and Benton’s Judgment of Line Orientation 193
Although A1+ individuals with schizophrenia tend to experience more adverse
effects, the general consensus is they also tend to have more favourable responses to
medication (Schargetter, 2004). A1+ individuals show greater improvement in total
Brief Psychiatric Rating Scale (BPRS) scores and in positive symptoms with anti-
psychotic treatment (Suzuki, Mihara et al., 2000). A1+ individuals are also more
likely to benefit from anti-psychotics with weaker dopamine D2 receptor
antagonistic properties (Alenius et al., 2008).
Investigations into the effect of anti-psychotic medications in schizophrenia in
the presence of the A1 allele indicate that this polymorphism may modify the
efficiency of DRD2 antagonism of the drugs in the central nervous system (Suzuki,
Mihar, et al., 2000). Higher serum prolactin levels, as an indicator or dopamine D2
receptor blockade (Cotes et al., 1977; Gruen, 1978; Seeman, 2002), have been found
in A1+ carriers with schizophrenia receiving anti-psychotic medications compared to
those without. Furthermore, A1 + individuals were over-represented in those with
hyperprolactinemia (Young, et al., 2004).
In disorders associated with depleted dopamine, for example Parkinson’s
disease, the Taq1 A polymorphism has been investigated (Bartres-Faz et al., 2007;
Oliveri et al., 2000). Researchers investigating this gene in Parkinson’s disease
propose that the genetic variation in the DRD2 gene influences the risk of developing
Parkinson’s disease, and therefore is a susceptibility locus for Parkinson’s disease
(Oliveri et al., 2000; Grevle et al., 2000), rather than a modifying gene. However,
imaging (fMRI) studies have revealed that larger networks of bilateral cerebral areas,
including cerebellar and pre-motor regions, are involved in complex sequential motor
tasks in A1+ individuals with Parkinson’s disease than A1- individuals, regardless of
medication treatment (Bartres-Faz et al., 2007). This is more suggestive of a trait-
194Chapter 6: Taq1 allele of the DRD2 dopamine receptor gene, binocular rivalry, visual backward masking and Benton’s Judgment of Line Orientation
like feature, rather than a modifying effect of the allele. Furthermore, the presence of
the A1 allele had no significant impact on the efficacy of Pramipexole in treating
patients with Parkinson’s disease (Liu et al., 2009), again suggesting a trait-like
feature. In other memory-impaired older adults, for example those with Alzheimer’s
disease, the A1- Status has been associated with diminished cognitive performance
and increased atrophy in the striatum (Bartres-Faz et al., 2002). However, while the
A1 allele of the DRD2 receptor gene may be a trait marker for Parkinson’s disease, a
larger amount of evidence suggests that this gene acts as a modifying gene in
schizophrenia.
6.1.2 The A1 allele of the DRD2 receptor in vision.
The A1 allele may have a moderating effect on visuospatial processing in
schizophrenia. Berman and Noble (1995) reported significantly-reduced visuospatial
performance in children with the A1 allele of the D2 dopamine receptor (DRD2)
gene. A1 + boys made more errors than A1- boys (Berman & Noble, 1995; Berman
& Noble, 1997), whereas A1- boys showed latency in the P300 wave of VEPs
(Berman et al., 2006). Girls with the A1+ status have demonstrated poorer
visuospatial functioning than that of boys with the A1+ status (Berman et al., 2003).
Because no statistically significant association between the A1 allele and IQ has been
demonstrated (Petrill et al., 1997), these authors suggest that the DRD2 receptor gene
association is specific to visuospatial performance and independent of general
cognitive ability.
The Taq 1A polymrphism of the DRD2 dopamine receptor gene therefore
provides a putative model to investigate whether the differences in binocular rivalry
rate and poorer performance on VBM and BJLO tasks in the group of schizophrenia
subjects, compared with healthy controls.
Chapter 6: Taq1 allele of the DRD2 dopamine receptor gene, binocular rivalry, visual backward masking and Benton’s Judgment of Line Orientation 195
6.2 Aims
The primary aim of this study was to determine whether DRD2 Taq 1A status
was associated with binocular rivalry, backward masking and BJLO tasks
performance. The second aim is to determine whether A1+ (A1A1 and A1A2
genotype) participants with schizophrenia performed more poorly on binocular
rivalry, backward masking and the BJLO tasks than those participants with
schizophrenia with A1- (A2A2 genotype) status.
6.3 Method
6.3.1 DNA collection and extraction.
Participants were asked to provide 2 mls of saliva for DNA extraction. Saliva
samples were collected using an Oragene.DNA® (DNA Genotek, Ontario, Canada)
collection tube. Collection tubes were stored at room temperature until the DNA was
extracted as per the manufacturer’s instructions.
Genomic DNA was extracted employing standard techniques and used as a
template for determination of Taq1 A DRD2 alleles by the polymerase chain reaction
(Grandy, Zhang & Civelli, 1993). A Perkin Elmer GeneAmp 9600 Thermocycler
was used in the amplification of DNA. Approximately 500 mg of amplified DNA
was digested with five units of Taq1 restriction enzyme (New England Biolabs) at
65oC overnight. The resulting products were separated by electrophoresis in a 2.5%
agarose gel containing ethidium bromide and visualized under ultraviolet light. The
Taq1 A DRD2 alleles were identified as described in Lawford, et al., (2005). Three
genotypes were obtained. The A1A2 genotype was revealed by three fragments: 310,
180 and 130 base pairs (bp), the A2A2 genotype was shown by two fragments: 180
and 130 bp and the A1A1 genotype was revealed by the uncleaved 310 bp fragment.
196Chapter 6: Taq1 allele of the DRD2 dopamine receptor gene, binocular rivalry, visual backward masking and Benton’s Judgment of Line Orientation
As noted, A1+ allele participants have either A1A1 or A1A2 genotypes whereas the
A1- participants have only the A2A2 genotype.
6.3.2 Participants.
Thirty-three control participants were recruited to participate in the study (20
participated in the study described in Chapter 2, of these 14 participated in the study
described in Chapter 3, with a further six participants recruited specifically for the
current study). Seven further participants were recruited to the current study from
the study detailed in Chapter 4. Of these, 29 provided a saliva sample and four
declined to provide a sample. One participant’s DNA sample had degenerated (due
to a compromised seal on the collection tube) so their DNA was unable to be
amplified.
Twenty-five participants with schizophrenia were recruited to the study.
Twenty participants completed the study described in Chapter 3, of these 17 provided
a sample of salvia for DNA extraction and three refused. A further five participants
were recruited to the studies detailed in Chapters 4 and 5, however only one
additional saliva sample was obtained; the four remaining participants did not
consent to DNA extraction.
Genotype and allelic information were available for 46 participants (18 with
schizophrenia and 28 controls). DNA data were not available for seven participants
with schizophrenia and five healthy subjects. The participants who did not provide
DNA did not differ to the larger group with respect to age, gender, dominant eye or
NART scores (Mann-Whitey U, p > .05).
Chapter 6: Taq1 allele of the DRD2 dopamine receptor gene, binocular rivalry, visual backward masking and Benton’s Judgment of Line Orientation 197
6.3.2.1 Control participants who participated in the binocular rivalry tasks in
Study 1.
Of the 20 control participants who participated in Study One (Chapter 2) 16
were genotyped for the presence of the A1 allele of the DRD2 receptor gene; five
were identified as A1+ and 11 as A1-. Of the five who were identified as A1+, all
were female, three were right-eye dominant, two left-eye dominant, and had an
average age of 42.4 years (range 22-60 years) and an average NART score of 116.8
(range 114-122). Of the 11 as classified as A1-, four were male, seven female, seven
were right-eye dominant, four left-eye dominant with an average age of 39.3 years
(range 22-64 years), and average NART score of 116.1 (range 108-121). There were
no significant group differences in gender (U = 58, Z = -1.508, p =.132), eye
dominance (U = 49, Z = -1.891, p = .059), age (U = 78.5, Z=-0.79, p = .937) or
NART score (U = 56, Z = -0.260, p = .795).
6.3.2.2 Participants with schizophrenia and healthy controls who participated
in binocular rivalry, Studies 2 and 3 and the Necker Cube task in Study 2
(Chapters 3 and 4).
Of the 24 genotyped control participants who participated in the binocular
rivalry tasks described in Chapters 3 and 4, seven were A1+ and seventeen A1-; the
average age 39.8 years (range 18-64 years) with an average NART score of 116.9
(range 105-122).
Of the 17 genotyped participants with schizophrenia, five were A1+ and twelve
A1-; the average age 34.76 years (range 23-51years) with an average NART score of
111.6 (range 101-121). See Table 6.1 for the breakdown of age, gender, eye
dominance and mean NART score according to Allele status.
198Chapter 6: Taq1 allele of the DRD2 dopamine receptor gene, binocular rivalry, visual backward masking and Benton’s Judgment of Line Orientation
6.3.2.3 Participants with schizophrenia and healthy controls who participated
in visual backward masking tasks in Study 3 (Chapter 4).
Of the genotyped control participants who participated in the VBM tasks Four
were classified as A1+ and ten A1-; the average age 36.4 years (range 21-58) and an
average NART score was 113.5 (range 104-121).
Of the genotyped participants with schizophrenia who participated in the VBM
tasks, four were A1+ and eight were A1-; the average age 33.9 years (range 23-50
years) with an average NART score of 111.6 (range 101-121). See Table 6.1 for the
breakdown of age, gender, eye dominance and mean NART score according to
Allele status.
6.3.2.4 Participants with schizophrenia and healthy controls who participated
in Benton’s Judgment of Line Orientation in Study 4 (Chapter 5).
Of the 20 healthy participants genotyped, eight were A1+ and twelve were
A1-; the average age 35.9 years (range 18-58 years) with an average NART score of
116.4 (range 102-124).
Of the 18 genotyped participants with schizophrenia who participated in the
BJLO, six were A1+ and twelve A1- ; the average age 34.2 years (range 21-51 years)
with an average NART score of 111.9 (range 96-124). See Table 6.1 for the
breakdown of age, gender, eye dominance and mean NART score according to
Allele status.

Chapter 6: Taq1 allele of the DRD2 dopamine receptor gene, binocular rivalry, visual backward masking and Benton’s Judgment of Line Orientation 199
Table 6.1: Demographic characteristics of participants genotyped for the presence of the Taq1 A DRD2 alleles receptor for studies 2, 3 and 4.
Study 2 Study 3 Study 4
Controls A1+ (n=7)
A1- (n=17)
A1+ (n=4)
A1- (n=10)
A1+ (n=8)
A1- (n=12)
Age (mean yrs) 38.5 39.8 33.6 37.8 38.4 38.7 Male 0 5 0 4 1 6 Female 7 12 4 6 7 6 L)eye dominant 4 6 3 2 7 4 R)eye dominant 3 11 1 8 1 8 NART (mean) 116.7 116.9 116.8 117.6 117.7 118.2
Schizophrenia A1+ (n=5)
A1- (n=12)
A1+ (n=4)
A1- (n=8)
A1+ (n=6)
A1- (n=12)
Age (mean yrs) 29.7 36.9 31 36.3 29.7 35.3 Male 2 9 3 6 3 10 Female 3 3 1 2 3 2 L)eye dominant 2 5 2 5 2 5 R)eye dominant 3 7 2 3 4 7 NART (mean) 110.7 114.8 111.8 114.4 110.7 112.3 CPZE (mg) 425 540 410 555.6 425 583.3
6.4 Results
6.4.1 Binocular rivalry results.
6.4.1.1 Binocular rivalry in control participants in 16 stimulus Conditions from
Study 1.
There were no differences in binocular rivalry rates recorded by A1+ control
participants (n = 5) and A1- control participants (n = 11) over the 16 stimulus
conditions in Study 1 described in Chapter 2 (Mann-Whitney U, p > .05). See Table
6.2 for results.
200Chapter 6: Taq1 allele of the DRD2 dopamine receptor gene, binocular rivalry, visual backward masking and Benton’s Judgment of Line Orientation
Furthermore, allelic status did not account for differences in the range of
binocular rivalry scores observed in Table 2.1 in Chapter 2. A1+ participants’
binocular rivalry rates ranged from 0.15 to 0.89 Hz, whereas those with A1- status
ranged from 0.23 to 1.0 Hz (Mann-Whitney U = 22.0, Z=-. 623, p=.583). The
median binocular rivalry rates for A1+ participants were 0.478 Hz, compared with
A1- median binocular rivalry rates of 0.453 Hz (Mann-Whitney U = 25.0, Z = -. 283,
p = .827).
6.4.1.2 Binocular rivalry rates in low- and high-strength, magnocellular and
parvocellular biased binocular rivalry tasks and the Necker cube.
There were no group differences in binocular rivalry rates recorded in A1+ (n =
13) and A1- (n = 28) participants (Mann-Whitney U, p > .05). When participants
with schizophrenia were considered separately from control participants, those who
were A1+ (n = 6) generally recorded slower binocular rivalry rates than A1- (n = 11)
participants, and there a statistical trend in the magnocellular biased binocular rivalry
task (Z = -1.764, p = .078). However, no other statistical differences were observed
in any other binocular rivalry stimulus. No differences in binocular rivalry rates
were observed between A1+ (n = 7) and A1- (n = 17) healthy participants (Mann-
Whitney U, p > .05). See Table 6.3 for results.
6.4.2 Backward masking results.
No differences between allelic groups were evident in the backward masking
scores in either participants with schizophrenia (A1+ n = 4, A1- n = 8) or control
participants (A1+ n = 4, A1- n = 10). See Table 6.4 and 6.5 for results.
6.4.3 Benton’s Judgment of Line Orientation Task results.
Subjects with schizophrenia in this sample who had A1+ (n = 6) status
performed more poorly on the BJLO than those who were A1- (n = 12); M = 45.17,
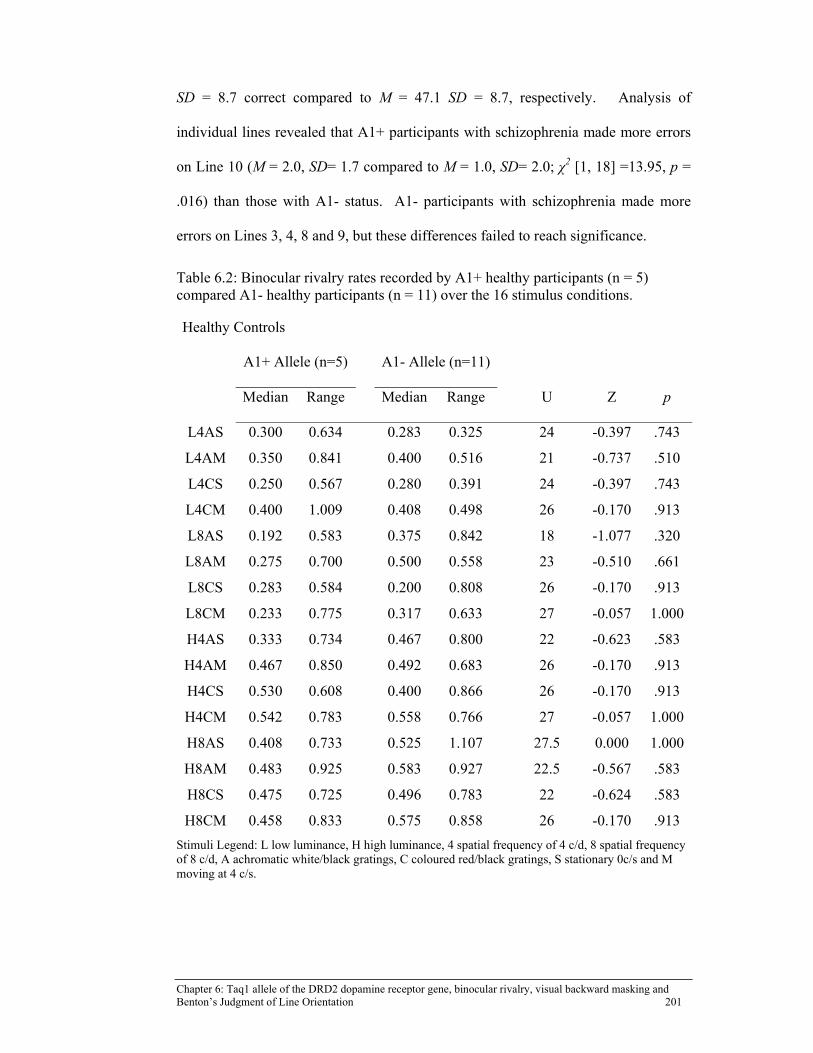
Chapter 6: Taq1 allele of the DRD2 dopamine receptor gene, binocular rivalry, visual backward masking and Benton’s Judgment of Line Orientation 201
SD = 8.7 correct compared to M = 47.1 SD = 8.7, respectively. Analysis of
individual lines revealed that A1+ participants with schizophrenia made more errors
on Line 10 (M = 2.0, SD= 1.7 compared to M = 1.0, SD= 2.0; χ2 [1, 18] =13.95, p =
.016) than those with A1- status. A1- participants with schizophrenia made more
errors on Lines 3, 4, 8 and 9, but these differences failed to reach significance.
Table 6.2: Binocular rivalry rates recorded by A1+ healthy participants (n = 5) compared A1- healthy participants (n = 11) over the 16 stimulus conditions.
Healthy Controls
A1+ Allele (n=5) A1- Allele (n=11)
Median Range Median Range U Z p
L4AS 0.300 0.634 0.283 0.325 24 -0.397 .743
L4AM 0.350 0.841 0.400 0.516 21 -0.737 .510
L4CS 0.250 0.567 0.280 0.391 24 -0.397 .743
L4CM 0.400 1.009 0.408 0.498 26 -0.170 .913
L8AS 0.192 0.583 0.375 0.842 18 -1.077 .320
L8AM 0.275 0.700 0.500 0.558 23 -0.510 .661
L8CS 0.283 0.584 0.200 0.808 26 -0.170 .913
L8CM 0.233 0.775 0.317 0.633 27 -0.057 1.000
H4AS 0.333 0.734 0.467 0.800 22 -0.623 .583
H4AM 0.467 0.850 0.492 0.683 26 -0.170 .913
H4CS 0.530 0.608 0.400 0.866 26 -0.170 .913
H4CM 0.542 0.783 0.558 0.766 27 -0.057 1.000
H8AS 0.408 0.733 0.525 1.107 27.5 0.000 1.000
H8AM 0.483 0.925 0.583 0.927 22.5 -0.567 .583
H8CS 0.475 0.725 0.496 0.783 22 -0.624 .583
H8CM 0.458 0.833 0.575 0.858 26 -0.170 .913
Stimuli Legend: L low luminance, H high luminance, 4 spatial frequency of 4 c/d, 8 spatial frequency of 8 c/d, A achromatic white/black gratings, C coloured red/black gratings, S stationary 0c/s and M moving at 4 c/s.
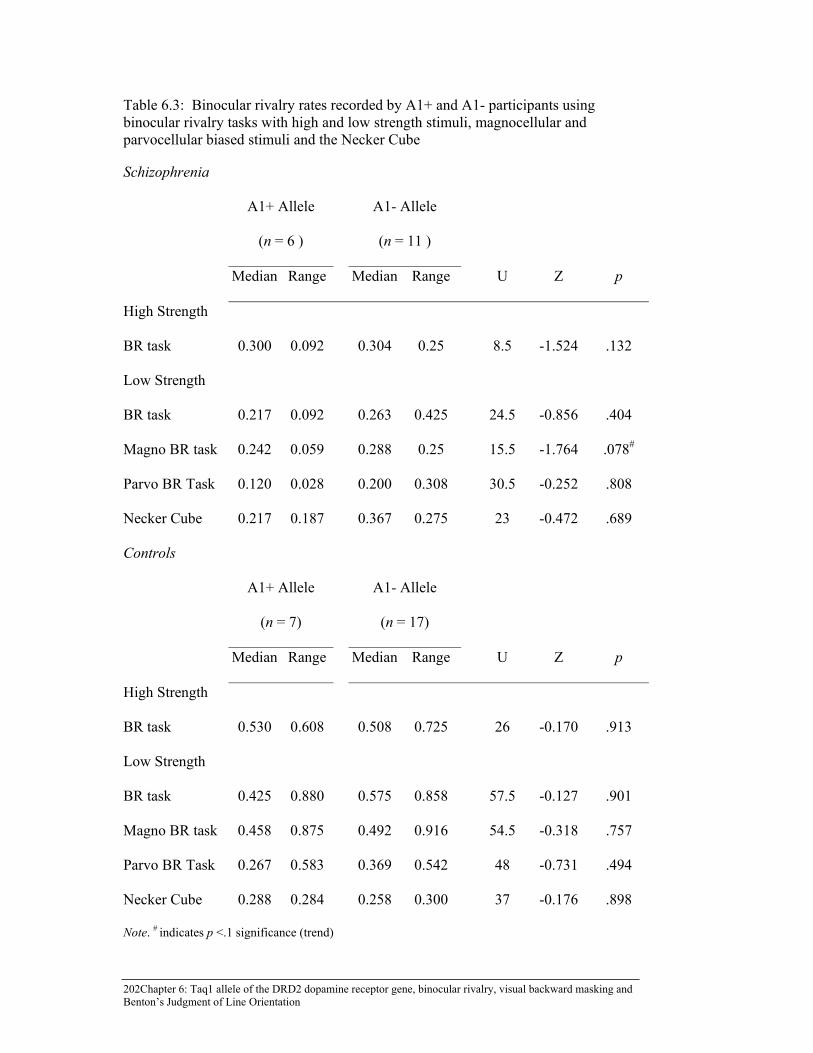
202Chapter 6: Taq1 allele of the DRD2 dopamine receptor gene, binocular rivalry, visual backward masking and Benton’s Judgment of Line Orientation
Table 6.3: Binocular rivalry rates recorded by A1+ and A1- participants using binocular rivalry tasks with high and low strength stimuli, magnocellular and parvocellular biased stimuli and the Necker Cube
Schizophrenia
A1+ Allele
(n = 6 )
A1- Allele
(n = 11 )
Median Range Median Range U Z p
High Strength
BR task 0.300 0.092 0.304 0.25 8.5 -1.524 .132
Low Strength
BR task 0.217 0.092 0.263 0.425 24.5 -0.856 .404
Magno BR task 0.242 0.059 0.288 0.25 15.5 -1.764 .078#
Parvo BR Task 0.120 0.028 0.200 0.308 30.5 -0.252 .808
Necker Cube 0.217 0.187 0.367 0.275 23 -0.472 .689
Controls
A1+ Allele
(n = 7)
A1- Allele
(n = 17)
Median Range Median Range U Z p
High Strength
BR task 0.530 0.608 0.508 0.725 26 -0.170 .913
Low Strength
BR task 0.425 0.880 0.575 0.858 57.5 -0.127 .901
Magno BR task 0.458 0.875 0.492 0.916 54.5 -0.318 .757
Parvo BR Task 0.267 0.583 0.369 0.542 48 -0.731 .494
Necker Cube 0.288 0.284 0.258 0.300 37 -0.176 .898
Note. # indicates p <.1 significance (trend)

Chapter 6: Taq1 allele of the DRD2 dopamine receptor gene, binocular rivalry, visual backward masking and Benton’s Judgment of Line Orientation 203
Table 6.4: Correct scores in backward masking tasks that bias magnocellular and parvocellular visual pathways at 4 inter-stimulus intervals (ISI) recorded by A1+ and A1- participants with schizophrenia A1+ Allele (n=4) A1- Allele (n=8)
Median Range Median Range U Z p
Magnocellular VBM Task
ISI 27msec 8 8 7.5 12 8.5 -1.299 .194
ISI 53msec 8 9 7 11 10.5 -0.954 .340
ISI 107msec 9.5 11 6.5 11 11.5 -0.767 .443
ISI 213msec 13 15 10.5 14 13.5 -0.429 .668
Parvocellular VBM Task
ISI 27msec 6.5 2 7 8 11 -0.860 .390
ISI 53msec 9 7 8.5 10 15 -0.171 .864
ISI 107msec 12 8 10 14 12.5 -0.600 .549
ISI 213msec 13 9 12.5 10 14 -0.342 .732
In the control group, there were no differences in the error scores for Lines 1,
5, 6, 7 and 11 (Figure 5.2 b). Line error scores failed to reach statistical significance
in this group (see Appendix 5 for results). When total line error scores for all
participants (those with schizophrenia and healthy controls) were combined the
significant difference detected in line 10 between the alleles was preserved (M =1.1,
SD = 1.4 compared to M = 0.5, SD = 1.4; χ2 [1, 5] =14.583, p = .012). No other
significant differences were found.
Berman et al., (2003) observed a gender effect where girls carrying the A1+
allele had lower visuospatial functioning than that of boys with the A1+ allele.
Gender differences were not accounted for in the present study. In Berman’s study
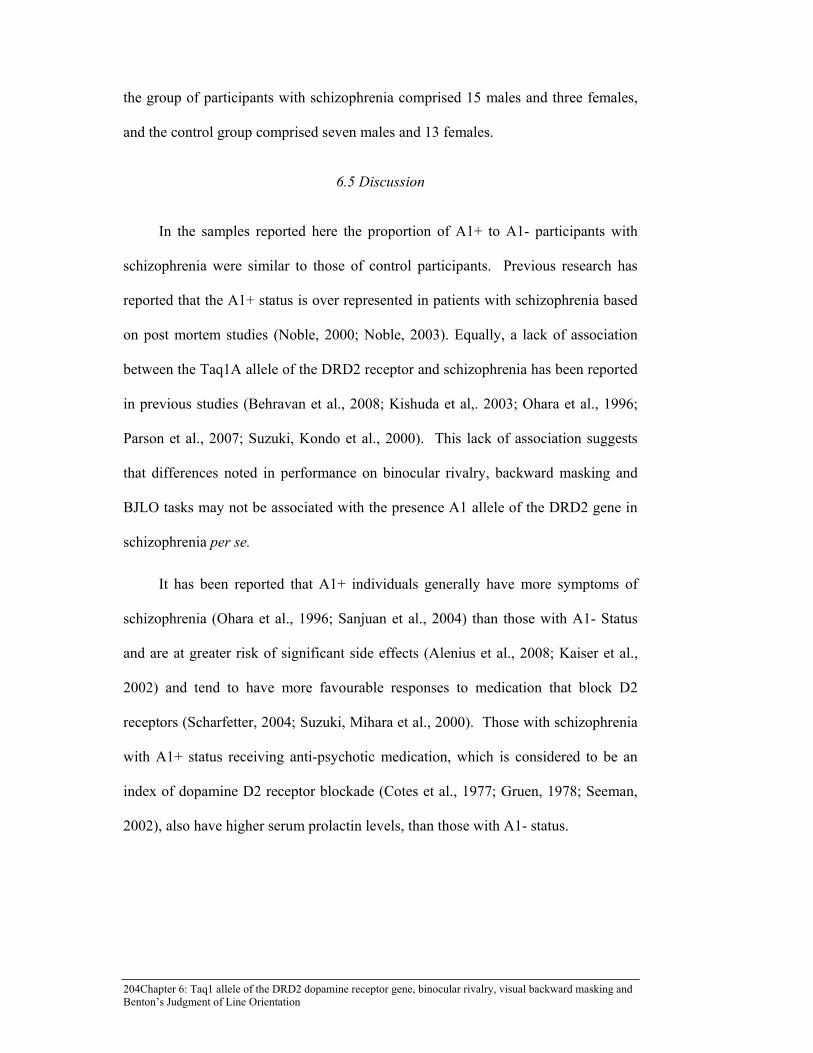
204Chapter 6: Taq1 allele of the DRD2 dopamine receptor gene, binocular rivalry, visual backward masking and Benton’s Judgment of Line Orientation
the group of participants with schizophrenia comprised 15 males and three females,
and the control group comprised seven males and 13 females.
6.5 Discussion
In the samples reported here the proportion of A1+ to A1- participants with
schizophrenia were similar to those of control participants. Previous research has
reported that the A1+ status is over represented in patients with schizophrenia based
on post mortem studies (Noble, 2000; Noble, 2003). Equally, a lack of association
between the Taq1A allele of the DRD2 receptor and schizophrenia has been reported
in previous studies (Behravan et al., 2008; Kishuda et al,. 2003; Ohara et al., 1996;
Parson et al., 2007; Suzuki, Kondo et al., 2000). This lack of association suggests
that differences noted in performance on binocular rivalry, backward masking and
BJLO tasks may not be associated with the presence A1 allele of the DRD2 gene in
schizophrenia per se.
It has been reported that A1+ individuals generally have more symptoms of
schizophrenia (Ohara et al., 1996; Sanjuan et al., 2004) than those with A1- Status
and are at greater risk of significant side effects (Alenius et al., 2008; Kaiser et al.,
2002) and tend to have more favourable responses to medication that block D2
receptors (Scharfetter, 2004; Suzuki, Mihara et al., 2000). Those with schizophrenia
with A1+ status receiving anti-psychotic medication, which is considered to be an
index of dopamine D2 receptor blockade (Cotes et al., 1977; Gruen, 1978; Seeman,
2002), also have higher serum prolactin levels, than those with A1- status.
Chapter 6: Taq1 allele of the DRD2 dopamine receptor gene, binocular rivalry, visual backward masking and Benton’s Judgment of Line Orientation 205
Table 6.5: Correct scores in backward masking tasks that bias magnocellular and parvocellular visual pathways at 4 inter-stimulus intervals (ISI) recorded by A1+ and A1- control participants
A1+ Allele (n=4) A1- Allele (n=10)
Median Range Median Range U Z p
Magnocellular VBM Task
ISI 27msec 9 6 8 11 14.5 -0.784 .433
ISI 53msec 13.5 8 8.5 11 11 -1.287 .198
ISI 107msec 14.5 8 12 11 15.5 -0.645 .519
ISI 213msec 14.5 8 13.5 9 15.5 -0.648 .517
Parvocellular VBM Task
ISI 27msec 10.5 5 10.5 5 18.5 -0.219 .826
ISI 53msec 13.5 6 11 5 9 -1.578 .114
ISI 107msec 13.5 3 13 9 20 0.000 1.000
ISI 213msec 13 4 12 8 11 -1.290 .197
Studies in individuals with schizophrenia that utilise spatial, temporal, and
contrast sensitivities known to be mediated by dopamine and dopamine receptors,
indicate that dopamine-related abnormalities originating in the primary visual
pathway contribute to abnormalities detected at higher levels of visual processing in
schizophrenia (Chen, Levy et al., 2003; Harris et al., 1990; Keri, Antal et al., 2002;
Keri, Janka et al., 2002; Masson et al., 1993; Schwartz et al., 1988; Schwartz 1990;
Shermata & Chen, 2004; Slaghuis, 1998; Slaghuis & Curran, 1999).

206Chapter 6: Taq1 allele of the DRD2 dopamine receptor gene, binocular rivalry, visual backward masking and Benton’s Judgment of Line Orientation
a.
b.
Figure 6.1: Benton’s Judgement of Line Orientation (BJLO) line error scores according to the presence of the A1 allele in subjects with (a) schizophrenia and (b) healthy controls.
Note: * p < .05. Error bars indicate standard error.
Animal models suggest that density and frequency of D2 dopamine receptors
found in the retina and primary visual pathway are similar to those in the primate
striate cortex (Djamgoz et al., 1997; Schorderet & Nowak, 1990; Witkovsky, 2004)
and the genetic expression of D2 receptors in the retina reflects that of the striatum
Healthy Controls by Allele
0
1
2
3
4
L1 L2 L3 L4 L5 L6 L7 L8 L9 L10 L11
BJL
O L
ine
Err
ors
A1+ (n=8) A1- (n=12)
0
1
2
3
4
L1 L2 L3 L4 L5 L6 L7 L8 L9 L10 L11
BJL
O L
ine
Err
ors
A1+ (n=6) A1- (n=12)
Schizophrenia by Allele
*

Chapter 6: Taq1 allele of the DRD2 dopamine receptor gene, binocular rivalry, visual backward masking and Benton’s Judgment of Line Orientation 207
(Stormann, Gdula, Weiner & Brann, 1990). Lower densities of D2 receptors in the
retina and primary visual pathway in A1+ individuals are likely to affect temporal
and luminance contrast discrimination and visuospatial processing in these
individuals. Although greater concentrations of exogenous dopamine may be present
in the visual pathway and striatum of individuals with schizophrenia, dopamine
binding will be diminished in those who carry the A1 allele due to the lower density
of D2 dopamine receptors, compared to their A1- counterparts. In the current study a
trend was noted in binocular rivalry rates between A1+ and A1- participants with
schizophrenia using stimuli that biased the magnocellular visual pathway. Although
no other statistical differences were observed between the two groups on other
binocular rivalry tasks or backward masking task, it may be speculated that this
effect is related to the action of dopamine on the magnocellular or dorsal pathway,
which may play a role in binocular rivalry. Replication in a larger sample may
provide better insights.
The density and function of D2 receptor sites in the striatum provide the
rationale for including studying this particular dopamine related gene. A1+ status
has been associated with diminished dopaminergic activity in the central nervous
system, as evidenced by prolonged P300 associated latency, (Noble et al., 1994),
reduced visuospatial function (Berman & Noble, 1995) and reduced glucose
metabolism in the brain (Noble, 1998). Thus the Taq 1A polymorphism of the
DRD2 gene may provide a useful tool to investigate dopaminergic involvement in
visual processing and binocular rivalry.
Visuospatial abnormalities have previously been associated with the A1+ status
Berman & Noble, (1995), Berman & Noble, (1997), and Berman et al., (1996) found
that A1+ boys made more errors than A1- boys on all eleven of the lines of the BJLO
208Chapter 6: Taq1 allele of the DRD2 dopamine receptor gene, binocular rivalry, visual backward masking and Benton’s Judgment of Line Orientation
task, with the effect being largest on the right in most presentations. Analysis of
individual lines in the current study revealed A1+ participants with schizophrenia
made fewer errors on lines 3, 4, 8 and 9 than their A1- counterparts and that A1+
participants with schizophrenia made more errors on Line 10 (χ2[1, 18] =13.95, p =
.016) than those with A1- status. However, it is impossible to tell if this difference in
Line 10 of the BJLO is artefact or a real effect. The data are difficult to interpret due
to the small sample size, as there are no prior comparative studies in schizophrenia
where visuospatial ability is investigated in relation to line errors.
The sample size in the current study was calculated on previous data to
determine if a difference in BJLO performance existed between subjects with
schizophrenia versus healthy controls, rather than between the alleles. Replication in
a larger sample is necessary. Future studies investigating visuospatial ability and
binocular rivalry that include analyses of an array of dopamine-related genes in a
larger sample may provide insights into these mechanisms.
Chapter 7: Overview, General Discussion and Conclusions 209
7.1 Overview and General Discussion
Binocular rivalry provides a unique opportunity to investigate visual awareness
and specific elements of visual processing in schizophrenia. Theoretical models of
binocular rivalry were examined in participants with schizophrenia and healthy
controls using a ‘within-subject between-groups’ design. The apparatus and method
of collecting binocular rivalry data (Miller et al., 2003) was able to be manipulated
so that specific stimulus characteristics (luminance contrast, spatial frequency,
colour, movement and stimulus strength) could be investigated.
7.1.1 Exploring binocular rivalry rate.
The first study explored the effect of stimulus characteristics on binocular
rivalry data in a group of healthy participants using a 2x2x2x2 repeated measures
‘within-subject’ design. Each participant completed 16 binocular rivalry tasks, to
investigate the effect that increasing luminance contrast, spatial frequency, colour
and movement had on binocular rivalry rate and dominance durations. Luminance
contrast and movement had a significant effect on binocular rivalry rate in this group,
however large individual variations in binocular rivalry rates were observed. When
participants were sorted into fast and slow alternators according to mean binocular
rivalry rates across the 16 stimulus conditions, fast alternators demonstrated a greater
increase in binocular rivalry rate as stimulus strength increased. These data provided
general support for an oscillation model.
Slow binocular rivalry rates were observed in participants with schizophrenia
using high- and low-strength binocular rivalry stimuli, extending the work of
Pettigrew and Miller (1998) and Miller et al., (2003). These results challenge the
assertion that slow binocular rivalry is a trait maker for bipolar disorder (Pettigrew &
Chapter 7: Overview, General Discussion and Conclusions
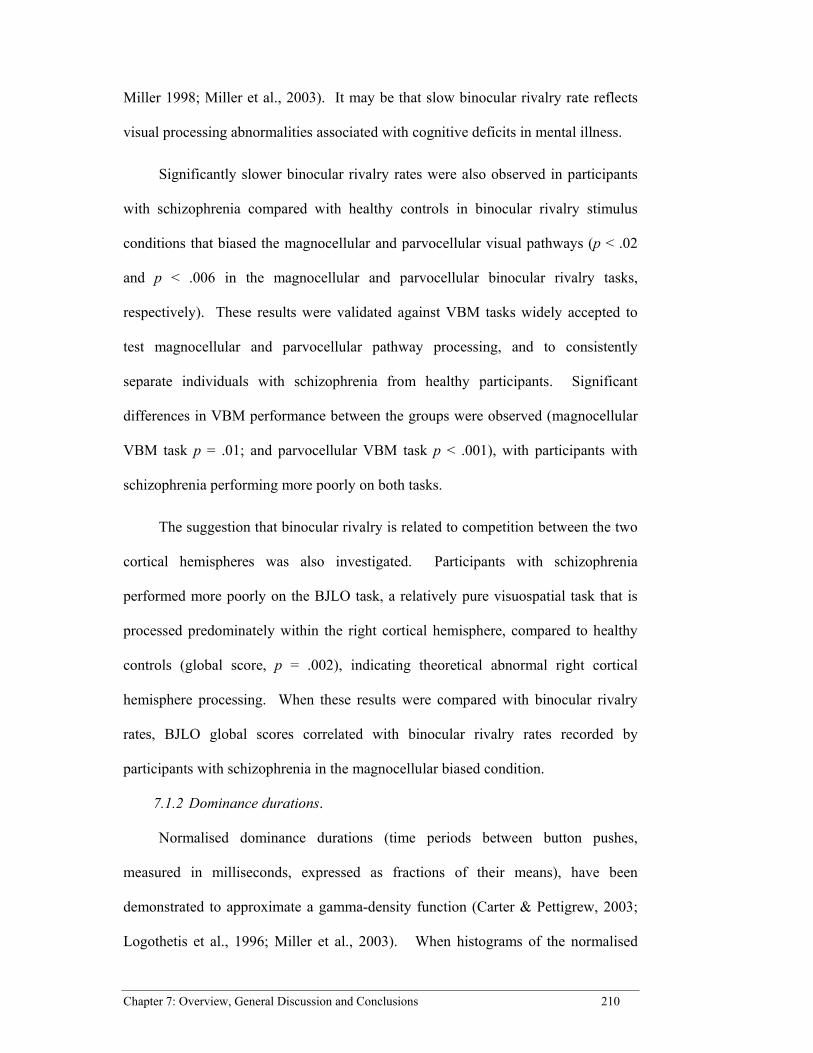
Chapter 7: Overview, General Discussion and Conclusions 210
Miller 1998; Miller et al., 2003). It may be that slow binocular rivalry rate reflects
visual processing abnormalities associated with cognitive deficits in mental illness.
Significantly slower binocular rivalry rates were also observed in participants
with schizophrenia compared with healthy controls in binocular rivalry stimulus
conditions that biased the magnocellular and parvocellular visual pathways (p < .02
and p < .006 in the magnocellular and parvocellular binocular rivalry tasks,
respectively). These results were validated against VBM tasks widely accepted to
test magnocellular and parvocellular pathway processing, and to consistently
separate individuals with schizophrenia from healthy participants. Significant
differences in VBM performance between the groups were observed (magnocellular
VBM task p = .01; and parvocellular VBM task p < .001), with participants with
schizophrenia performing more poorly on both tasks.
The suggestion that binocular rivalry is related to competition between the two
cortical hemispheres was also investigated. Participants with schizophrenia
performed more poorly on the BJLO task, a relatively pure visuospatial task that is
processed predominately within the right cortical hemisphere, compared to healthy
controls (global score, p = .002), indicating theoretical abnormal right cortical
hemisphere processing. When these results were compared with binocular rivalry
rates, BJLO global scores correlated with binocular rivalry rates recorded by
participants with schizophrenia in the magnocellular biased condition.
7.1.2 Dominance durations.
Normalised dominance durations (time periods between button pushes,
measured in milliseconds, expressed as fractions of their means), have been
demonstrated to approximate a gamma-density function (Carter & Pettigrew, 2003;
Logothetis et al., 1996; Miller et al., 2003). When histograms of the normalised

Chapter 7: Overview, General Discussion and Conclusions 211
dominance durations were drawn for each task, typical right-skewed distributions
resulted. However, few were able to be fitted to a gamma-density function using
Kolmogorov-Smirnov goodness-of-fit tests, making these data difficult to interpret.
As an alternative to fitting dominance durations to a theoretical gamma-density
function, the distribution of dominance durations between groups were compared
statistically using the Smirnov test statistic. Differences in cumulative dominance
distributions for schizophrenia participants and healthy control participants (m and n
respectively) were compared. Critical values, determined by w0.95 ≈1.36√ m+n/ mn
(CV-T for S), were compared to the Smirnov T (the greatest distance in values along
the distribution) across all test conditions. This allowed a direct comparison to
between groups in each task.
There were no differences in the cumulative dominance durations recorded by
participants with schizophrenia in the low- and high-strength binocular rivalry tasks
when compared to those of healthy participants. However, significant differences
were observed between the groups in the tasks that used stimuli to bias
magnocellular and parvocellular visual pathways. Participants with schizophrenia
recorded more 0.5-second dominance durations in both conditions, but less
dominance durations of 1.5 to 4 seconds compared to those recorded in control
participants in the magnocellular binocular rivalry task. This increased number of
shorter dominance durations recorded by participants with schizophrenia may be
interpreted as reflecting abnormal magnocellular processing early in the visual
pathway, while the abnormally-long dominance durations seen in participants with
schizophrenia (and not healthy participants) may reflect abnormal parvocellular
processing at the cortical level.

Chapter 7: Overview, General Discussion and Conclusions 212
7.2 Neurotransmission and Binocular Rivalry: Does Dopamine Have a Role?
Investigating binocular rivalry, VBM and visuospatial ability in schizophrenia,
a disease associated with abnormal dopaminergic function (Hirvonen et al., 2005;
Seeman & Kapur, 2000), provides the opportunity to explore the potential role of
dopamine in human subjects. Animal models provide evidence that density and
frequency of D2 dopamine receptors found in the retina and primary visual pathway
are similar to those in the primate striate cortex, and that D2 receptors play a major
role in visuo-cognitive processes in dopamine-related conditions such as
schizophrenia (Djamgoz et al., 1997; Schorderet & Nowak, 1990; Witkovsky, 2004).
General support for the notion that dopamine plays a role in binocular rivalry
was provided as participants with schizophrenia consistently recorded slower
binocular rivalry rates than healthy participants. Additionally, higher doses of anti-
psychotic medication had an effect on binocular rivalry rates in response to higher-
strength stimuli. Slow binocular rivalry rates may indicate increased dopamine
release within the striatum or visual pathways. This effect may be direct or due to
the stimulatory effect of serotonin on dopamine release.
It was theorised that that a genetic variation in the density and distribution of
D2 receptors in the retina and cortex (the presence of the A1 allele of the Taq 1A
DRD2 receptor gene) may account for some of the individual variation in
performance in visual tasks reported here. It was hypothesised that A1+ individuals
would perform more poorly on binocular rivalry, backward masking and the BJLO
tasks than those with A1- status.
A trend was noted in binocular rivalry rates between A1+ and A1- participants
with schizophrenia using stimuli that biased the magnocellular visual pathway (p =
.78). However, no other statistical differences were observed between the two

Chapter 7: Overview, General Discussion and Conclusions 213
groups on binocular rivalry tasks or backward-masking tasks were noted in either the
group with schizophrenia or the control group. The BJLO task revealed that A1+
participants with schizophrenia made significantly more errors for line 10 than those
without, but made fewer errors on lines 3, 4, 8 and 9 than their A1- counterparts.
These data are difficult to interpret and replication in larger groups is necessary.
Future studies investigating several alleles may provide more fruitful data.
7.3 Combining Theories to Produce a New Model of Binocular Rivalry
Studies have demonstrated that transient (magnocellular) channel neurons
respond to the onset and offset of a stimulus 50-80 msecs before the sustained
(parvocellular) channel neuron, with the response of the sustained channel neuron
dependent on the spatial frequency of the stimulus (Breitmeyer & Ganz, 1976). In
the VBM paradigm it is thought that magnocellular neurons inhibit parvocellular
neurons via internuncial neurons at the LGN and cortex based on their response
duration. Thus, when a mask stimulus follows a target stimulus the magnocellular
neurons carrying information regarding the mask interrupt the sustained
parvocellular response elicited from the target stimulus at the LGN cortical junction.
Breitmeyer & Ganz, (1976) presented a model of visual masking outlined in (recall
Figure 4.7 from Chapter 4).
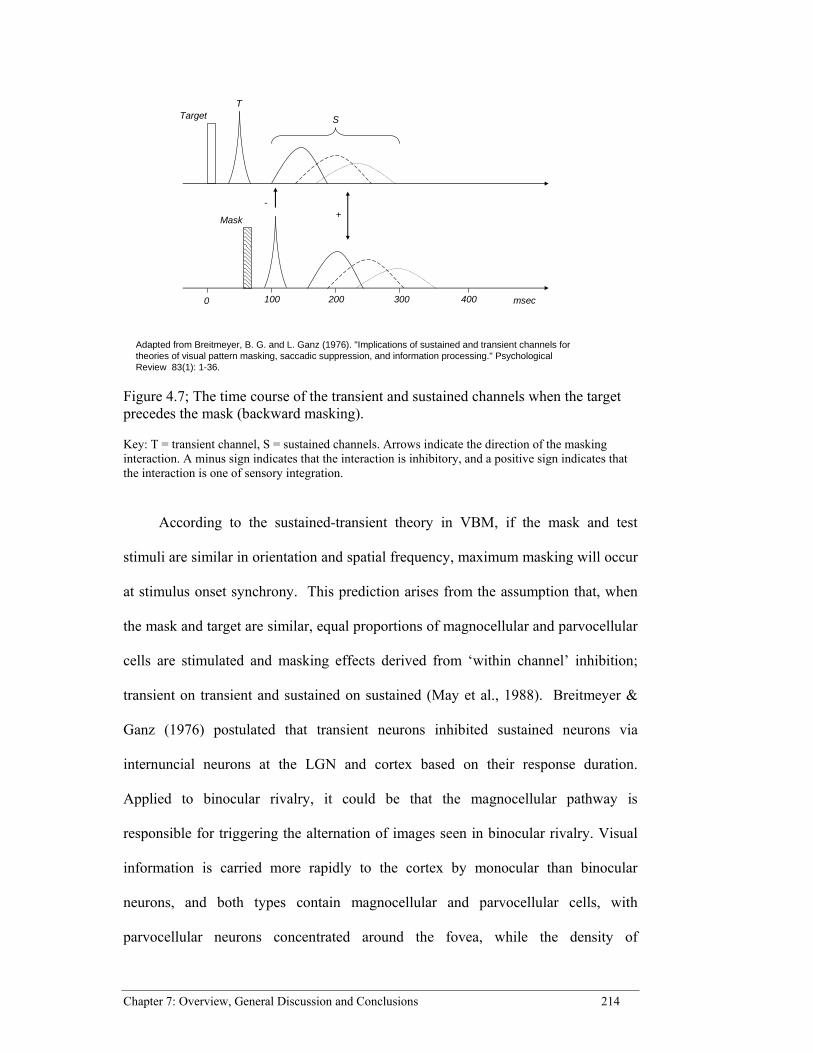
Chapter 7: Overview, General Discussion and Conclusions 214
Figure 4.7; The time course of the transient and sustained channels when the target precedes the mask (backward masking).
Key: T = transient channel, S = sustained channels. Arrows indicate the direction of the masking interaction. A minus sign indicates that the interaction is inhibitory, and a positive sign indicates that the interaction is one of sensory integration.
According to the sustained-transient theory in VBM, if the mask and test
stimuli are similar in orientation and spatial frequency, maximum masking will occur
at stimulus onset synchrony. This prediction arises from the assumption that, when
the mask and target are similar, equal proportions of magnocellular and parvocellular
cells are stimulated and masking effects derived from ‘within channel’ inhibition;
transient on transient and sustained on sustained (May et al., 1988). Breitmeyer &
Ganz (1976) postulated that transient neurons inhibited sustained neurons via
internuncial neurons at the LGN and cortex based on their response duration.
Applied to binocular rivalry, it could be that the magnocellular pathway is
responsible for triggering the alternation of images seen in binocular rivalry. Visual
information is carried more rapidly to the cortex by monocular than binocular
neurons, and both types contain magnocellular and parvocellular cells, with
parvocellular neurons concentrated around the fovea, while the density of
100 200 3000
+-
400 msec
Adapted from Breitmeyer, B. G. and L. Ganz (1976). "Implications of sustained and transient channels for theories of visual pattern masking, saccadic suppression, and information processing." Psychological Review 83(1): 1-36.
Target
Mask
T
S

Chapter 7: Overview, General Discussion and Conclusions 215
magnocellular neurons increases with foveal eccentricity (Livingstone & Hubel,
1987). Thus, during binocular rivalry monocular magnocellular channel neurons
from one eye reach the LGN, inhibit binocular neurons carrying information from
both eyes at the LGN and thus interrupt parvocellular neuronal processing in the
cortex. Thus, it is the action response of the parvocellular neurons in the cortex that
determine the dominance duration of the image, and thus the rate (recall Figure 4.9
from Chapter 4 below).
Figure 4.9A model of binocular rivalry with rapid magnocellular response followed by the parvocellular response to continuous stimuli (vertical and horizontal lines) in the right and left eyes respectively at corresponding retinotopic areas.
Note: Arrows indicate if the masking interaction is interruption or integration. The bottom axis denotes the fluctuating images seen during binocular rivalry over time. Note that the duration of the image is not constant.
This revised model combines the two prevailing models of binocular rivalry;
the pattern rivalry model and the pathway model. The pattern model suggests
binocular rivalry occurs where the conflicting stimuli presented to each eye compete

Chapter 7: Overview, General Discussion and Conclusions 216
for dominance from interactions between monocular and binocular neurons in the
visual cortex (see Blake, 2001). The pathway model suggests that binocular rivalry
is related to the actions of the parvocellular, magnocellular pathway processing, or
both in the retina, LGN and cortex (He et al., 2005; Carlson & He, 2000; Blake et al.,
1991). This model suggests that the magnocellular pathway gates (Javitt, et al., 1999)
or acts as a ‘switch’, with its rapid response to local visual information ‘turning off’
or interrupting cortical processing the parvocellular neurons in the cortex derived
from parvocellular neurons located in corresponding retinal location in the opposite
eye.
7.4 Slower Binocular Rivalry and Visual Processing in Schizophrenia
The use of binocular rivalry enables questions regarding perceptual selection
and unconscious processing to be addressed experimentally (Carmel, Arcaro,
Kastners & Hasson, 2010). Binocular rivalry is a task that provides an objective
behavioural measure of the temporal characteristics of neural processes within the
visual system. The binocular rivalry stimuli can be manipulated to access specific
aspects of the visual system known to be abnormal in schizophrenia. Previous
studies have identified that individuals with schizophrenia have deficits when
processing low-luminance, temporally-modulated stimuli and abnormal processing in
the magnocellular pathway (Green et al., 2009). Using binocular rivalry to examine
visual processes in schizophrenia can be achieved by exploiting visual anomalies
known to exist in schizophrenia. Here, it has been demonstrated that individuals with
schizophrenia consistently record slow rates binocular rivalry alternations. Slow
binocular rivalry in schizophrenia may indicate slow processing of visual
information at a number of stages along the visual pathways that may contribute to
Chapter 7: Overview, General Discussion and Conclusions 217
higher-order cognitive deficits in working memory, executive functioning and
attention (Martinez et al., 2008).
Investigating binocular rivalry in schizophrenia using stimuli to bias the
magnocellular and parvocellular visual pathways adds to a large body of research
undertaken in schizophrenia. Using tasks that selectively bias the parvocellular and
magnocellular systems to study schizophrenia is an approach that has been endorsed
by the CNTRICS (Green et al., 2009). Applying the above model to the
schizophrenia binocular rivalry data provided in this study indicates that the
perceptual abnormalities associated with schizophrenia are likely to be due to
abnormalities in parvocellular and magnocellular pathway processing, or in the
retina, LGN and cortex. An over-active magnocellular pathway, with its rapid
response to local visual information from the retina to the LGN, interrupts or gates
cortical processing of the parvocellular neurons in the cortex. Individuals with
schizophrenia may therefore be creating ‘false’ or ‘incorrect’ visual images and be
misinterpreting visual information contributing to paranoia and perceptual
disturbances commonly experienced in this illness. Binocular rivalry may be able to
provide new insights into the neural mechanisms involved in mental illness.
7.5 Limitations
It is not possible to be completely confident in the magnocellular and
parvocellular binocular rivalry tasks access the magnocellular and parvocellular
visual pathways. Although every effort was made to use stimulus parameters that
biased either the magnocellular or parvocellular pathway, it is acknowledged that
there is considerable overlap in the pathways (Ellemberg, Hammarrenger, Lepore,
Roy & Guilemot, 2001). The sensitivity of magnocellular neurons is lower than
parvocellular neurons at higher spatial frequency. Allowing free eye movements that
Chapter 7: Overview, General Discussion and Conclusions 218
generate transients during binocular rivalry tasks introduces the possibility of a
response by magnocellular neurons in the parvocellular BR task. There is much
debate in the current literature regarding the degree of separation that can be
achieved by manipulating stimulus parameters (see Skottun & Skoyles, 2011).
Kuo, Schmid and Atchison (2011) suggest that the degree to which a low contrast
location task such as the Magnocellular VBM task used in this study creates bias
toward magnocellular processing is unclear. Lesions studies indicate damage to the
parvocellular system in the parvocellular layer of the LGN result greater contrast
sensitivity losses than leisions in the magnocellular layer (Skutton & Skoyles, 2011).
However it should be noted that although both pathways may be activated,
manipulations of the lumiance and spatial contrast vary the relative balance of the
activation to effectively bias either the magnocellular or parvocellular proccessing.
The resolution and refresh rates of the computer presentation screen also
limited the extent that luminance contrast and temporal frequency could be altered in
the binocular rivalry tasks, and luminance and ISI could be altered in the backward
masking task. This was an issue particularly for the magnocellular binocular rivalry
task and the magnocellular backward masking tasks. To be confident that adequate
separation between parvocellular and magnocellular pathways was achieved a more
sophisticated presentation monitor would need to be employed. Due to the financial
constraints of the project the available computer monitor was adopted as it
adequately biased the magnocellular and parvocellular pathways to allow sufficient
investigation of the pathways.
Reporting of perceptual alternation by pressing keys on a computer key pad
during the binocular rivalry task relies on the participant accurately reporting
changes in perception. It has been observed that in humans recognition of an object

Chapter 7: Overview, General Discussion and Conclusions 219
generally occurs around 180msec with motor responses intiated from 540-720msec
(Castelo-Branco, Neuenschwander & Singer, 1998). It is possible that participants
who experience quicker perceptual alternations during binocular rivalry may not
have sufficient time to respond pressing a response key before the opposing image
becomes dominant. It possible that the slow binocular rivlary rate observed in
particpants with schizophrenia reflects slower reaction time rather than slower
alternation rate. This is unlikely, as particpants verbal reports during practice
sessions matched their key repsonses. However future studies may eliminate this
uncertainity by employing a task that assesses how well each participant responds to
known stimuli. For example Carter et al., (2007) employed ‘rivalry pre-test catch
trials’, where a ‘movie’ of perceptual alternations was played to assess accuracy of
responses and response time for each individual before they commenced the
binocular rivalry task.
All tasks used in this study required participants to attend to the task and some
level of concentration. However ‘attention’ was not controlled for in this study.
Deficits related to attention have been reported in individuals with schizophrenia
(Saccuzzo et al., 1996). It is possible that attention impacted on the performance in
VBM and BJLO tasks, and to a lesser degree the binocular rivalry tasks (which are
thought by many to be a perceptual task, or a pre-attentive task). Although every
effort to was made to ensure that participants attended to each task, and recorded
reliable data, the addition of a test to measure attention (for example the Span of
Attention Task, Kay & Sing, 1974), may have improved the study. Future studies
should control for attention.
Participants with schizophrenia were not well matched to controls with respect
to age and gender. An age effect was noted with respect to luminance contrast in
Chapter 7: Overview, General Discussion and Conclusions 220
binocular rivalry in controls the second chapter. The effect that age has on
luminance contrast is well established in the vision literature, so the results reported
in Chapter 2 were not unexpected. Although age was not strictly controlled, and
some effects noted, this was minimised by only a small variation in mean ages
between the two groups.
With respect to gender, males out-numbered females in the group of
participants with schizophrenia while in the control group females’ out- numbered
males. Although no gender differences noted in binocular rivalry rates in the first
two studies; it was noted in Chapter 4 that female controls recorded faster binocular
rivalry rates than males in both magnocellular and parvocellular tasks. This is
consistent with a small number of reports that that indicate females record faster
binocular rivalry rates than males (Cogan, 1973; Goldstein & Cofoid, 1965). No
studies report males record faster binocular rivalry rates. However, it was noted in
Chapter 4 that females with schizophrenia recorded slower binocular rivalry rates
than their male counterparts on the binocular rivalry task that biased the
magnocellular pathway, but no differently to males on the parvocellular biased task.
This effect has not been previous reported.
It is possible that the gender-related differences in binocular rivalry observed
here are due to hormonal changes associated with the menstrual cycle. Hormonal
changes, and the use of oral contraceptives, have been linked to alterations in retinal
function and sensitivity changes in some women (Eisner et al., 2004). The actions of
oestrogen and progesterone may contribute to improved colour vision performance at
ovulation (Giuffre et al., 2007), increases in visual sensitivity during menstruation
(Barris et al., 1980) and decreases in pattern reversal evoked potentials (Yilmaz et
al., 1998). Hormonal alterations are not the same for all visual pathways, and
Chapter 7: Overview, General Discussion and Conclusions 221
pronounced individual differences with individual’s visual adaptation capabilities
vary substantially over periods of weeks (Eisner et al., 2004). If the binocular
rivalry task is sensitive to these changes future studies should match participants with
respect to gender and in female participants control for menstrual cycle variations or
use of the contraceptive pill when luminance contrast and colour are measured.
It is important to note, that the gender effect noted in the first study reported in
Chapter 4 was not replicated in the second study in Chapter 4 where binocular rivalry
rates reported from rivalry tasks that biased the magnocellular and parvocellular
pathway were compared with magnocellular and parvocellular biased VBM. The
gender effect reported in the first may therefore be an artefact.
It is possible that the slower rate observed in participants with schizophrenia
may be related to medication. All participants with schizophrenia were relatively
symptom free at the time of testing largely due to the fact they were receiving
adequate doses of antipsychotic medication to treat their symptoms. In Chapter 3, a
medication effect was observed in the high-strength binocular rivalry task.
Participants taking lower doses of anti-psychotic medications recorded faster
binocular rivalry rates. However no difference was observed in the low strength
condition. No medication effects were observed in either the magnocellular and
parvocellular binocular rivalry task reported in Chapter 4. Similarly there was no
medication effect on BJLO scores in participants with schizophrenia in Chapter 5.
These results are consistent with other studies reporting no medication effect on
BJLO performance (Buchanan et al., 1994; Halari et al., 1994; Riley et al., 2000).
In this study, participants with schizophrenia were taking a variety
antipsychotic medication. To enable comparisons doses of antipsychotic medication
were converted to chlorpromazine equivalents (CPZE) and then categorised into high

Chapter 7: Overview, General Discussion and Conclusions 222
and low by median split. Although the conversion of antipsychotic doses into
CPZE’s is generally accepted and widely practiced in schizophrenia research
(Centorrino et al., 2002; Hargreaves et al., 1987; Humberstonse et al., 2004; Owen et
al., 2002; Woods, 2003), it is acknowledged that these comparisons may be
inaccurate. Many newer antipsychotic medications have been compared in
comparative clinic trials with haloperidol and then converted to CPZE’s; 2mg
Haloperidol being comparative to 100mg Chlorpromazine (Wood, 2003).
The effect that dopamine and dopamine antagonists (antipsychotic
medications) on binocular rivalry is currently unknown. The observed effect of other
neurotransmitters suggests that dopamine has an effect on binocular rivalry.
Serotoninergic 5HT1A and 5HT2A agonist have been observed to decreases
binocular rivalry rate in a dose-dependent manner, (Carter et al., 2005; Frecska
White, et al., 2003) while Gamma-aminobutyric acid (GABA), is thought to be
involved in binocular rivalry, via suppression of dLGN inter-neurons (Bickford, et
al., 2008). Agents such as ethanol (Donnelly & Miller, 1995), sodium amytal and
caffeine have been observed to influence binocular rivalry rate in control participants
providing some suggestive evidence of a dopamine effect. The results presented in
this study are also suggestive of a dopamine effect. However due to the explorative
nature of this study and the many logistical and ethical issues surrounding the
collection of data from un-medicated participants with schizophrenia, a thorough
investigation of the role of dopamine and the effect of specific antipsychotics on
binocular rivalry was beyond the scope of this study. These issues require further
investigation in future studies.

Chapter 7: Overview, General Discussion and Conclusions 223
7.6 Implications for Future Research
Although classical binocular rivalry does not appear sensitive enough to
separate individuals with schizophrenia from controls, it may be appropriate to
include a binocular rivalry task that biases the magnocellular and parvocellular
pathways in a battery of tests to aid the early detection of psychosis and
schizophrenia. Despite many years of research into schizophrenia, no single
causative factor has been determined. It is conceivable that schizophrenia is not a
disease that affects specific cortical areas or neural pathways, but a disease
associated with the integration of a number of neural processes, particularly the
integration of perceptual information into higher-order cognitions. Gains in future
research may be made by incorporating binocular rivalry methodologies with fMRI
and VEP technologies to investigate how visual information is integrated along the
visual pathway. A study utilising binocular rivalry and fMRI or VEPs may be
particularly useful to target the transfer of information in the thalamus, which is often
considered the transfer station of all cortical information.
Carefully designed binocular rivalry tasks combined with a battery of cognitive
tasks may provide unexplored insights into the visual aspects to cognitive processing.
Although cognitive deficits in schizophrenia are relatively stable over time (Gold,
2004), they are relatively independent of the symptomatic manifestations of the
illness (Gold, 2004; Heinrichs & Zakzanis, 1998). Future studies that compare
perceptual alternation rates during periods of illness (when a participant display
marked psychotic symptoms) with symptoms free periods may provide some insights
into the cognitive decline associated with schizophrenia.
The binocular rivalry task provides a unique opportunity to investigate visual
awareness in schizophrenia as manipulations can be made to the stimulus
Chapter 7: Overview, General Discussion and Conclusions 224
characteristics to investigate specific components of the visual system without the
participant being aware. Adjustments to stimulus parameters in this study were
observed to effected binocular rivalry rate and dominance durations in participants
with schizophrenia and controls. It was noted that stimuli that biased the
magnocellular pathway slowed the binocular rivalry rate in controls to a greater
extent than in participants with schizophrenia. These data provide a platform on
which to base further research that are consistent with the recommendations from the
third meeting of the CNTRICS (Green et al., 2009).
Manipulations to the binocular rivalry task may also allow research to be
undertaken into neurotransmitter involvement in schizophrenia and other mental
illnesses. Testing samples of subjects with a variety of mental illnesses on and off
antipsychotic medications may advance what is known about neurotransmitter
involvement in binocular rivalry and visual information processing. There have been
many advances made in vision research utilising studies in Parkinson’s disease in to
explore the role of dopamine in retinal functioning, spatial and luminance contrast
(Bodis-Wollner, 2003; Harris et al., 1992; Haug, Trenkwalder, Arden & Paulus,
1994). Including participants with Parkinson’s disease both on and off dopamine
agonist medication may therefore provide valuable insights into binocular rivalry.
Furthermore, investigating the role of dopamine along with other neurotransmitters
such as GABA and glutamate in vision by including a binocular rivalry tasks may
provide new methods of investigating neurotransmitter involvement and the effect of
medication in visual processing in schizophrenia and other mental illnesses.
In this study a single allele for the DRD2 receptor gene was utilised to
investigate large individual and group differences in binocular rivalry rates observed
in this study and poorer performance on visuospatial tasks in this study in

Chapter 7: Overview, General Discussion and Conclusions 225
participants with schizophrenia compared to controls. Although the results did not
provided conclusive evidence that the Taq1A dopamine gene for the DRD2 receptor
accounted for differences in visual processing, the role of dopamine was implicated.
Future studies that incorporate imagining studies with genetic studies may integrate
the basic biology with the disease mechanisms associated with schizophrenia.
Gene’s related to prefrontal brain functions associated with working memory and
executive function implicate genetic variation in dopaminergic systems. Genetic
variations in the dopaminergic system for example Catechol-O-methyl tranferase
(COMT) and downstream signalling molecules such as V-akt murine thymoma viral
oncogene homologue 1 (AKT1) repeatedly associated with schizophrenia (Mathur,
Law, Megson, Shaw & Wei, 2010; Tan, Callicott &Weinberger, 2009) may prove
useful sites for future binocular rivalry studies. Studies that include analyses of an
array of genes in a larger sample of healthy participants and participants with
schizophrenia may enable researchers to investigate aspects of visual processing
currently not investigated in the literature.
7.7 Conclusion
The research contributes empirical data and adds to what is known about
binocular rivalry in schizophrenia. Consistently slower binocular rivalry rates were
observed in participants with schizophrenia, indicating abnormally-slow visual
processing in this group. These data support previous studies reporting visual
processing abnormalities in schizophrenia and suggest that a slow binocular rivalry
rate is not a feature specific to bipolar disorder, but may be a feature of psychosis in
general.
Although the mechanisms of binocular rivalry remain unexplained, this
research provides a platform on which to base future studies. Binocular rivalry like
Chapter 7: Overview, General Discussion and Conclusions 226
psychosis is an internal perceptual phenomenon experienced by the individual. The
only outward sign that the phenomena is occurring is the verbal or other report of
person’s visual experience. An objective behavioural measure of internal
perceptions allows the locus of awareness, perceptual selection and unconscious
processing (Carmel, Arcaro, Kastners & Hasson, 2010) to be investigated in
schizophrenia. Carefully designed binocular rivalry tasks combined with a battery
of cognitive tasks may provide unexplored insights into the visual aspects to
cognitive processing in schizophrenia.
The contributions of the magnocellular or dorsal pathways and parvocellular or
ventral pathways to binocular rivalry, and therefore to perceptual awareness, provide
a rich area of research. Slow binocular rivalry rates, recorded by participants with
schizophrenia when the stimuli biased the magnocellular and parvocellular visual
pathways, correlated with poorer performance on VBM tasks effective in separating
those with schizophrenia from controls. These data supported an alternative model
of binocular rivalry based on VBM theory. This alternative model suggests that the
magnocellular (or dorsal system) initiates perceptual awareness of an image and the
parvocellular (or ventral system) maintains the perception of the image, making it
available to higher cortical processing occurring within the cortical hemispheres.
Thus abnormalities in both the magnocellular and parvocellular pathways contribute
to perceptual disturbances that ultimately contribute to the cognitive dysfunction
associated with schizophrenia. Combining binocular rivalry tasks that bias
magnocellular and parvocellular pathways with fMRI or VEPs methodologies in
future research in schizophrenia may further advance what is currently known about
the fluctuating course and cognitive decline associated with the disorder.

Chapter 7: Overview, General Discussion and Conclusions 227
Although this research was limited in terms of age and gender matching the use
of a within-subject between-group design provides some confidence in the results not
currently available in the literature. The results reported in the current study raise a
number of interesting questions that can be investigated in future studies. As
discussed, the group of participants with schizophrenia in this study was limited to an
out patient population with a relatively narrow range of presenting psychotic
symptoms, who all receiving therapeutic doses of antipsychotic medications. Future
studies that expand to sample population to include individuals with a number a
greater range of symptom profiles that include deficits associated with spatial
memory and executive functioning may allow further investigation into cognitive
processing in schizophrenia and other mental illnesses. The effect of the illness and
long term use of antipsychotic medication is yet to be determined in binocular
rivalry. Testing participants with schizophrenia using binocular rivalry tasks during
periods of illness and remission both on and off antipsychotic medication may
unlock some of the complex issues related to dopamine functioning within the visual
system provide some insights into the fluctuating course of the disorder.
References 228
References
Abadi, R. V. (1976). Induction masking--a study of some inhibitory interactions
during dichoptic viewing. Vision Research, 16(3), 269-275.
Abi-Dargham, A. (2004). Do we still believe in the dopamine hypothesis? New data
bring new evidence. International Journal of Neuropsychopharmacology, 7
Suppl 1, S1-5.
Alais, D., & Blake, R. (1999). Grouping visual features during binocular rivalry.
Vision Research, 39(26), 4341-4353.
Alais, D., O'Shea, R. P., Mesana-Alais, C., & Wilson, I. G. (2000). On binocular
alternation. Perception, 29(12), 1437-1445.
Alenius, M., Wadelius, M., Dahl, M. L., Hartvig, P., Lindstrom, L., & Hammarlund-
Udenaes, M. (2008). Gene polymorphism influencing treatment response in
psychotic patients in a naturalistic setting. Journal of Psychiatric Research,
42(11), 884-893.
Andreasen, N. C., Arndt, S., Alliger, R., Miller, D., & Flaum, M. (1995). Symptoms
of Schizophrenia: Methods, Meanings, and Mechanisms. Achieves of General
Psychiatry, 52(5), 341-351.
Andreasen, N. C., Paradiso, S., & O'Leary, D. S. (1998). "Cognitive dysmetria" as an
integrative theory of schizophrenia: a dysfunction in cortical-subcortical-
cerebellar circuitry? Schizophrenia Bulletin, 24(2), 203-218.
Andreasen, N.C., & Pierson, R. (2008). The Role of the Cerebellum in
Schizophrenia. Biological Psychiatry, 64(2), 81-88.
Alexander, L. T. (1951). The influence of figure-ground relationships in binocular
rivalry. Journal of Experimental Psychology, 41(5), 376-381.

References 229
Andrews, T. J. (2001). Binocular rivalry and visual awareness. Trends in Cognitive
Sciences, 5(10), 407-409.
Andrews, T. J., & Blakemore, C. (1999). Form and motion have independent access
to consciousness. The International Journal of Neuroscience, 2(5), 405-406.
Andrews, T. J., & Blakemore, C. (2002). Integration of motion information during
binocular rivalry. Vision Research, 42(3), 301-309.
Andrews, T. J., & Lotto, R. B. (2004). Fusion and rivalry are dependent on the
perceptual meaning of visual stimuli. Current Biology, 14(5), 418-423.
Andrews, T. J., & Purves, D. (1997). Similarities in normal and binocularly rivalrous
viewing. Proceedings of the National Academy of Sciences of the United
States of America, 94(18), 9905-9908.
Annett, M. (1970). A classification of hand preference by association analysis. The
British Journal of Clinical Psychology, 61(3), 303-321.
Anstis, S., & Cavanagh, P. (1983). A minimum motion technique for judging
equilumunance. Colour Vision, 153-166.
Antal, A., Keri, S., & Bodis-Wollner, I. (1997). Dopamine D2 receptor blockade
alters the primary and cognitive components of visual evoked potentials in
the monkey, Macaca fascicularis. Neuroscience Letters, 232(3), 179-181.
Apkarian, P. A., Nakayama, K., & Tyler, C. W. (1981). Binocularity in the human
visual evoked potential: facilitation, summation and suppression.
Electroencephalography and Clinical Neurophysiology, 51(1), 32-48.
Avila, M. T., Weiler, M. A., Lahti, A. C., Tamminga, C. A., & Thaker, G. K. (2002).
Effects of ketamine on leading saccades during smooth-pursuit eye
movements may implicate cerebellar dysfunction in schizophrenia. The
American Journal of Psychiatry, 159(9), 1490-1496.
References
Baitch, L. W., & Levi, D. M. (1989). Binocular beats: psychophysical studies of
binocular interaction in normal and stereoblind humans. Vision Research,
29(1), 27-35.
Baker, D. H., Meese, T. S., & Summers, R. J. (2007). Psychophysical evidence for
two routes to suppression before binocular summation of signals in human
vision. Neuroscience, 146(1), 435-448.
Barnes, M., Lawford, B. R., Burton, S. C., Heslop, K. R., Noble, E. P., Hausdorf, K.,
& Young, R. M.. (2006). Smoking and schizophrenia: is symptom profile
related to smoking and which antipsychotic medication is of benefit in
reducing cigarette use? The Australian and New Zealand Journal of
Psychiatry, 40(6), 575-580.
Barris, M. C., Dawson, W. W., & Theiss, C. L. (1980). The visual sensitivity of
women during the menstrual cycle. Documenta Ophthalmologica, 49(2), 293-
301.
Barrett, S. L., Mulholland, C. C., Cooper, S. J., & Rushe, T. M. (2009). Patterns of
neurocognitive impairment in first-episode bipolar disorder and
schizophrenia. British Journal of Psychiatry, 195(1), 67-72.
Bartfai, A., Levander, S. E., Nyback, H., Berggren, B. M., & Schalling, D. (1985).
Smooth pursuit eye tracking, neuropsychological test performance, and
computed tomography in schizophrenia. Psychiatry Research, 15(1), 49-62.
Bartres-Faz, D., Junque, C., Serra-Grabulosa, J. M., Lopez-Alomar, A., Moya, A.,
Bargallo, N., Mercader, J. M., Moral, P., & Clemente, I. C. (2002). Dopamine
DRD2 Taq I polymorphism associates with caudate nucleus volume and
cognitive performance in memory impaired subjects. Neuroreport, 13(9),
1121-1125.

References 231
Bartres-Faz, D., Marti, M. J., Junque, C., Sole-Padulles, C., Ezquerra, M., Bralten, L.
B., Gaig, C., Campdelacreu, J., Mercader, J. M., & Tolosav, E. (2007).
Increased cerebral activity in Parkinson's disease patients carrying the DRD2
TaqIA A1 allele during a demanding motor task: a compensatory
mechanism? Genes, Brain, and Behavior, 6(6), 588-592.
Bedwell, J. S., Brown, J. M., & Miller, L. S. (2003). The magnocellular visual
system and schizophrenia: what can the color red tell us? Schizophrenia
Research, 63(3), 273-284.
Bedwell, J. S., & Orem, D. M. (2008). The effect of red light on backward masking
in individuals with psychometrically defined schizotypy. Cognitive
Neuropsychiatry, 13(6), 491-504.
Bedwell, J. S., Orem, D. M., Rassovsky, Y., Allen, L. G., & Sutterby, S. R. (2009). A
potential qualitative endophenotype for schizophrenia: Backward masking
response to red light. Psychiatry Research, 166(2-3), 166-173.
Behravan, J., Hemayatkar, M., Toufani, H., & Abdollahian, E. (2008). Linkage and
association of DRD2 gene TaqI polymorphism with schizophrenia in an
Iranian population. Archives of Iranian Medicine, 11(3), 252-256.
Bender, S., Weisbrod, M., & Resch, F. (2007). Which perspectives can
endophenotypes and biological markers offer in the early recognition of
schizophrenia? Journal of Neural Transmission, 114(9), 1199-1215.
Benitez-King, G., Ramirez-Rodriguez, G., Ortiz, L., & Meza, I. (2004). The neuronal
cytoskeleton as a potential therapeutical target in neurodegenerative diseases
and schizophrenia. Current Drug Targets CNS Neurological Disorders, 3(6),
515-533.
References
Benton, A., Hannay, H. J., & Varney, N. R. (1975). Visual perception of line
direction in patients with unilateral brain disease. Neurology, 25(10), 907-
910.
Benton, A. L., & Van Allen, M. W. (1968). Impairment in facial recognition in
patients with cerebral disease. Transactions of the American Neurological
Association, 93, 38-42.
Benton, A. L., Varney, N. R., & Hamsher, K. D. (1978). Visuospatial judgment. A
clinical test. Archives of Neurology, 35(6), 364-367.
Benton, A.L. (1983). Judgement of Line Orientation. In A.L. Benton, K. Hamsher,
N. R. Varney & O. Spreen (Eds.), Contributions to Neurological Assessment:
A Clincial Manual. (pp. 44-54). New York: Oxford University Press.
Benton, A.L. (1994). Judgment of Line Orientation. In A.L. Benton, A.B. Sivan, K.
Hamsher, N. R. Varney & O. Spreen (Eds.), Contributions to
Neuropsychological Assessment: A Clinical Manual. (2 ed., pp. 53-64.). New
York.: Oxford University Press.
Berman, S. M., & Noble, E. P. (1995). Reduced visuospatial performance in children
with the D2 dopamine receptor A1 allele. Behavior genetics, 25(1), 45-58.
Berman, S. M., & Noble, E. P. (1997). The D2 dopamine receptor (DRD2) gene and
family stress; interactive effects on cognitive functions in children. Behavior
Genetics, 27(1), 33-43.
Berman, S. M., Noble, E. P., Antolin, T., Sheen, C., Conner, B. T., & Ritchie, T.
(2006). P300 development during adolescence: effects of DRD2 genotype.
Journal of Clinical Neurophysiology 117(3), 649-659.
Berman, SM., Ozkaragoz, T., Noble, EP., Antolin, T., Sheen, C., Siddarth, P.,

References 233
Conner, B. T., & Ritchie, T. (2003). Differential associations of sex and D2
dopamine receptor (DRD2) genotype with negative affect and other substance
abuse risk markers in children of alcoholics. Alcohol, 30(3), 201-210.
Bestelmeyer, P. E., Phillips, L. H., Crombie, C., Benson, P., & St Clair, D. (2009).
The P300 as a possible endophenotype for schizophrenia and bipolar
disorder: Evidence from twin and patient studies. Psychiatry Research,
169(3), 212-219.
Bickford, M. E., Wei, H., Eisenback, M. A., Chomsung, R. D., Slusarczyk, A. S., &
Dankowsi, A. B. (2008). Synaptic organization of thalamocortical axon
collaterals in the perigeniculate nucleus and dorsal lateral geniculate nucleus.
The Journal of Comparative Neurology, 508(2), 264-285.
Birch, J. (1997). Efficiency of the Ishihara test for identifying red-green colour
deficiency. Ophthalmic & Physiological Optics, 17(5), 403-408.
Blake, R. (1989). A neural theory of binocular rivalry. Psychological Review, 96(1),
145-167.
Blake, R. (2001). A primer on binocular rivalry, including current controversies.
Brain and Mind, 2(1), 5-38.
Blake, R. (2005). Landmarks in the History of Binocular Rivalry. In D. Alais & R.
Blake (Eds.), Binocular Rivalry (pp. 1-27). Cambridge, Massachusetts: The
MIT Press.
Blake, R., & Boothroyd, K. (1985). The precedence of binocular fusion over
binocular rivalry. Perception & Psychophysics, 37(2), 114-124.
Blake, R., & Camisa, J. (1979). On the inhibitory nature of binocular rivalry
suppression. Journal of Experimental Psychology. 5(2), 315-323.
References
Blake, R., & Fox, R. (1974). Binocular rivalry suppression: insensitive to spatial
frequency and orientation change. Vision Research, 14(8), 687-692.
Blake, R., & Lema, S. A. (1978). Inhibitory effect of binocular rivalry suppression is
independent of orientation. Vision Research, 18(5), 541-544.
Blake, R., & Logothetis, N. K. (2002). Visual competition. Nature Reviews.
Neuroscience, 3(1), 13-21.
Blake, R., O'Shea, R. P., Halpern, D. L., Patterson, R., Zimba, L., & Williams, D.
(1988). "Abnormal fusion" of stereopsis and binocular rivalry. Psychological
Review, 95(1), 151-158.
Blake, R., O'Shea, R. P., & Mueller, T. J. (1992). Spatial zones of binocular rivalry
in central and peripheral vision. Visual Neuroscience, 8(5), 469-478.
Blake, R. R., Fox, R., & McIntyre, C. (1971). Stochastic properties of stabilized-
image binocular rivalry alternations. Journal of Experimental Psychology,
88(3), 327-332.
Blake, R., Sobel, K. V., & Gilroy, L. A. (2003). Visual motion retards alternations
between conflicting perceptual interpretations. Neuron, 39(5), 869-878.
Blake, R., Tadin, D., Sobel, K. V., Raissian, T. A., & Chong, S. C. (2006). Strength
of early visual adaptation depends on visual awareness. Proceedings of the
National Academy of Sciences of the United States of America, 103(12),
4783-4788.
Blake, R., Yang, Y. D., & Wilson, H. R. (1991). On the coexistence of stereopsis and
binocular rivalry. Vision Research, 31(7-8), 1191-1203.
Blake, R., Yu, K., Lokey, M., & Norman, H. (1998). Binocular rivalry and motion
perception. Journal of Cognitive Neuroscience 10(1), 46-60.

References 235
Blake, R., Zimba, L., & Williams, D. (1985). Visual motion, binocular
correspondence and binocular rivalry. Biological Cybernetics 52(6), 391-397.
Blanchard, J. J., & Neale, J. M. (1994). The neuropsychological signature of
schizophrenia: generalized or differential deficit? The American Journal of
Psychiatry, 151(1), 40-48.
Blum, K., Noble, E. P., Sheridan, P. J., Finley, O., Montgomery, A., Ritchie, T.,
Ozkaragoz, T, Fitch, R. J, Sadlack, F., & Sheffield, D. (1991). Association
of the A1 allele of the D2 dopamine receptor gene with severe alcoholism.
Alcohol, 8(5), 409-416.
Blum, K., Noble, E. P., Sheridan, P. J., Montgomery, A., Ritchie, T., Ozkaragoz, T.,
Fitch, R. J., Sadlack, F., & Sheffield, D. (1993). Genetic predisposition in
alcoholism: association of the D2 dopamine receptor TaqI B1 RFLP with
severe alcoholics. Alcohol, 10(1), 59-67.
Bodis-Wollner, I. (1988). Visual contrast sensitivity. Neurology, 38(2), 336-337.
Bodis-Wollner, I. (2009). Retinopathy in Parkinson Disease. Journal of Neural
Transmission 116(11), 1493-1501.
Bodis-Wollner, I., & Antal, A. (1995). On the functional significance of primate
retinal dopamine receptors. Journal of Neural Transmission Suppl, 45, 67-74.
Bolbecker, A. R., Mehta, C. S. , Edwards, C. R., Steinmetz, J. E. , O'Donnell, B. F.,
& Hetrick, W. P. (2009). Eye-blink conditioning deficits indicate temporal
processing abnormalities in schizophrenia. Schizophrenia Research, 111(1),
182-191.
Bollini, A. M., Arnold, M. C., & Keefe, R. S. (2000). Test-retest reliability of the dot
test of visuospatial working memory in patients with schizophrenia and
controls. Schizophrenia Research, 45(1-2), 169-173.

References
Bonneh, Y., & Sagi, D. (1999). Configuration saliency revealed in short duration
binocular rivalry. Vision Research, 39(2), 271-281.
Bora, E., Yucel, M., & Pantelis, C. (2010). "Cognitive impairment in schizophrenia
and affective psychoses: implications for DSM-V criteria and beyond."
Schizophrenia Bulletin 36(1): 36-42.
Borsellino, A., De Marco, A., Allazetta, A., Rinesi, S., & Bartolini, B. (1972).
Reversal time distribution in the perception of visual ambiguous stimuli.
Kybernetik, 10(3), 139-144.
Boulougouris, V., & Tsaltas, E. (2008). Serotonergic and dopaminergic modulation
of attentional processes. Progress in Brain Research, 172, 517-542.
Braff, D. L., Saccuzzo, D. S., & Geyer, M. A. (1991). Information processing
dysfunctions in schizophrenia: studies of visual backward masking,
sensorimotor gating, and habituation. In J.H. Gruzelier S. R. Steinhauer, and
J. Zubin (Ed.), Handbook of Schizophrenia. (Vol. 5): Elsevier Science
Publishers.
Braff, D., Saccuzzo, D., Ingram, R., McNeill, B., & Langford, R. (1980). Effect of
practice on visual backward masking. Perceptual and Motor Skills, 50(2),
511-517.
Braff, D. L., & Saccuzzo, D. P. (1982). Effect of antipsychotic medication on speed
of information processing in schizophrenic patients. The American Journal of
Psychiatry 139(9), 1127-1130.
Brandies, R., & Yehuda, S. (2008). The possible role of retinal dopaminergic system
in visual performance. Neuroscience and Biobehavioral Reviews, 32(4), 611-
656.
References 237
Brascamp, J. W., van Ee, R., Noest, A. J., Jacobs, R. H., van den Berg, A. V., &
Pestman, W. R. (2006). The time course of binocular rivalry reveals a
fundamental role of noise. Journal of Vision, 6(11), 1244-1256.
Brascamp, J. W., van Ee, R., Pestman, W. R., & van den Berg, A. V. (2005).
Distributions of alternation rates in various forms of bistable perception.
Journal of Vision, 5(4), 287-298.
Breese, B. (1899). On Inhibition. Psychological Monographs, 3(1).
Breitmeyer, B. G., & Breier, J. I. (1994). Effects of background color on reaction
time to stimuli varying in size and contrast: inferences about human M
channels. Vision Research, 34(8), 1039-1045.
Breitmeyer, B. G., & Ganz, L. (1976). Implications of sustained and transient
channels for theories of visual pattern masking, saccadic suppression, and
information processing. Clinical Psychology Review, 83(1), 1-36.
Breitmeyer, B. G., & Ganz, L. (1977). Temporal studies with flashed gratings:
inferences about human transient and sustained channels. Vision Research,
17(7), 861-865.
Breitmeyer, B. G., & Williams, M. C. (1990). Effects of isoluminant-background
color on metacontrast and stroboscopic motion: interactions between
sustained (P) and transient (M) channels. Vision Research, 30(7), 1069-1075.
Brenner, C. A., Krishnan, G. P., Vohs, J. L., Ahn, W. Y., Hetrick, W. P., Morzorati,
S. L., & O'Donnell, B. F. (2009). Steady state responses: electrophysiological
assessment of sensory function in schizophrenia. Schizophrenia Bulletin,
35(6), 1065-1077.
Brittain, P. J., Surguladze, S., McKendrick, A. M., & Ffytche, D. H. (2010).
Backward and forward visual masking in schizophrenia and its relation to
References
global motion and global form perception. Schizophrenia Research, 124(1-3),
134-141.
Brown, J. M. (2009). Visual streams and shifting attention. Progress in Brain
Research, 176, 47-63.
Brown, R. J., & Norcia, A. M. (1997). A method for investigating binocular rivalry
in real-time with the steady-state VEP. Vision Research, 37(17), 2401-2408.
Buchanan, R. W., Holstein, C., & Breier, A. (1994). The comparative efficacy and
long-term effect of clozapine treatment on neuropsychological test
performance. Biological Psychiatry, 36(11), 717-725.
Burke, D., Alais, D., & Wenderoth, P. (1999). Determinants of fusion of
dichoptically presented orthogonal gratings. Perception, 28(1), 73-88.
Butler, P. D., DeSanti, L. A., Maddox, J., Harkavy-Friedman, J. M., Amador, X. F.,
& Goetz, R. R. (2003). Visual backward-masking deficits in schizophrenia:
relationship to visual pathway function and symptomatology. Schizophrenia
Research, 59(2-3), 199-209.
Butler, P. D., Harkavy-Friedman, J. M., Amador, X. F., & Gorman, J. M. (1996).
Backward masking in schizophrenia: relationship to medication status,
neuropsychological functioning, and dopamine metabolism. Biological
Psychiatry, 40(4), 295-298.
Butler, P. D., & Javitt, D. C. (2005). Early-stage visual processing deficits in
schizophrenia. Current Opinion in Psychiatry, 18(2), 151-157.
Butler, P. D., Martinez, A., Foxe, J. J., Kim, D., Zemon, V., Silipo, G., Mahoney, J.,
Shpaner, M., Jalbrzikowski, M., & Javitt, D. C. (2007). Subcortical visual
dysfunction in schizophrenia drives secondary cortical impairments. Brain,
130(Pt 2), 417-430.
References 239
Butler, P. D., Schechter, I., Zemon, V., Schwartz, S. G., Greenstein, V. C., Gordon,
J., Schroeder, C. E., & Javitt, D. C. (2001). Dysfunction of early-stage visual
processing in schizophrenia. The American Journal of Psychiatry, 158(7),
1126-1133.
Butler, P. D., Silverstein, S. M., & Dakin, S. C. (2008). Visual perception and its
impairment in schizophrenia. Biological Psychiatry, 64(1), 40-47.
Butler, P. D., Zemon, V., Schechter, I., Saperstein, A. M., Hoptman, M. J., Lim,
K.O., Revheim, N., Silipo, G., & Javitt, D. C. (2005). Early-stage visual
processing and cortical amplification deficits in schizophrenia. Archives of
General Psychiatry, 62(5), 495-504.
Büttner, T., Kuhn, W., Dietz, M., Muller, T., Postert, T., Przuntek, H., & Welter, F.
L. (1999). Impaired visual function in focal idiopathic dystonia. European
Neurology, 41(2), 94-98.
Cadenhead, K. S., Geyer, M. A., Butler, R. W., Perry, W., Sprock, J., & Braff, D. L.
(1997). Information processing deficits of schizophrenia patients: relationship
to clinical ratings, gender and medication status. Schizophrenia Research,
28(1), 51-62.
Cadenhead, K. S., Serper, Y., & Braff, D. L. (1998). Transient versus sustained
visual channels in the visual backward masking deficits of schizophrenia
patients. Biological Psychiatry, 43(2), 132-138.
Calvert, J. E., Harris, J. P., Phillipson, O. T., Babiker, I. E., Ford, M. F., & Antebi, D.
L. (1988). The perception of visual ambiguous figures in schizophrenia and
Parkinson's disease. International Clinical Psychopharmacology, 3(2), 131-
150.
References
Campanella, S., & Guerit, J. M. (2009). How clinical neurophysiology may
contribute to the understanding of a psychiatric disease such as schizophrenia.
Clinical Neurophysiology, 39(1), 31-39.
Caparelli-Daquer, E. M., Oliveira-Souza, R., & Moreira Filho, P. F. (2009).
Judgment of line orientation depends on gender, education, and type of error.
Brain and Cognition, 69(1), 116-120.
Carlson, T. A., & He, S. (2000). Visible binocular beats from invisible monocular
stimuli during binocular rivalry. Current biology, 10(17), 1055-1058.
Carney, T., Shadlen, M., & Switkes, E. (1987). Parallel processing of motion and
colour information. Nature, 328(6131), 647-649.
Carter, O., & Cavanagh, P. (2007). Onset rivalry: brief presentation isolates an early
independent phase of perceptual competition. PLoS One, 2(4), e343. doi:
10.1371/journal.pone.0000343
Carter, O. L., Campbell, T. G., Liu, G. B., & Wallis, G. (2004). Contradictory
influence of context on predominance during binocular rivalry. Clinical &
Experimental Optometry 87(3), 153-162.
Carter, O. L., Hasler, F., Pettigrew, J. D., Wallis, G. M., Liu, G. B., & Vollenweider,
F. X. (2007). Psilocybin links binocular rivalry switch rate to attention and
subjective arousal levels in humans. Psychopharmacology 195(3), 415-424.
Carter, O. L., & Pettigrew, J. D. (2003). A common oscillator for perceptual
rivalries? Perception, 32(3), 295-305.
Carter, O. L., Pettigrew, J. D., Burr, D. C., Alais, D., Hasler, F., & Vollenweider, F.
X. (2004). Psilocybin impairs high-level but not low-level motion perception.
Neuroreport, 15(12), 1947-1951.
References 241
Carter, O. L., Pettigrew, J. D., Hasler, F., Wallis, G. M., Liu, G. B., Hell, D., &
Vollenweider, F. X. (2005). Modulating the rate and rhythmicity of
perceptual rivalry alternations with the mixed 5-HT(2A) and 5-HT(1A)
agonist psilocybin. Neuropsychopharmacology, Jun 30(6), 1154-1162.
Castelo-Branco, M., Neuenschwander, S., & Singer, W. (1998). Synchronization of
visual responses between the cortex, lateral geniculate nucleus, and retina in
the anesthetized cat. The Journal of Neuroscience 18(16), 6395-6410.
Centorrino, F., Eakin, M., Bahk, W. M., Kelleher, J. P., Goren, J., Salvatore, P.,
Egli,S., & Baldessarini, R. J. (2002). Inpatient antipsychotic drug use in 1998,
1993, and 1989. The American Journal of Psychiatry, 159(11), 1932-1935.
Chapman, C., Hoag, R., & Giaschi, D. (2004). The effect of disrupting the human
magnocellular pathway on global motion perception. Vision Research,
44(22), 2551-2557.
Chen, C. H., Wei, F. C., Koong, F. J., & Hsiao, K. J. (1997). Association of TaqI A
polymorphism of dopamine D2 receptor gene and tardive dyskinesia in
schizophrenia. Biological Psychiatry, 41(7), 827-829.
Chen, X., & He, S. (2003). Temporal characteristics of binocular rivalry: visual field
asymmetries. Vision Research, 43(21), 2207-2212.
Chen, X., & He, S. (2004). Local factors determine the stabilization of monocular
ambiguous and binocular rivalry stimuli. Current Biology, 14(11), 1013-
1017.
Chen, Y., Grossman, E. D., Bidwell, L. C., Yurgelun-Todd, D., Gruber, S. A., Levy,
D. L., Nakayama, K., & Holzman, P. S. (2008). Differential activation
patterns of occipital and prefrontal cortices during motion processing:

References
evidence from normal and schizophrenic brains. Cognitive, Affective &
Behavioral Neuroscience, 8(3), 293-303.
Chen, Y., Levy, D. L., Nakayama, K., Matthysse, S., Palafox, G., & Holzman, P. S.
(1999). Dependence of impaired eye tracking on deficient velocity
discrimination in schizophrenia. Archives of General Psychiatry, 56(2), 155-
161.
Chen, Y., Levy, D. L., Sheremata, S., & Holzman, P. S. (2004). Compromised late-
stage motion processing in schizophrenia. Biological Psychiatry, 55(8), 834-
841.
Chen, Y., Levy, D. L., Sheremata, S., Nakayama, K., Matthysse, S., & Holzman, P.
S. (2003). Effects of typical, atypical, and no antipsychotic drugs on visual
contrast detection in schizophrenia. The American Journal of Psychiatryy,
160(10), 1795-1801.
Chen, Y., Levy, D., Matthysse, S., Holzman, P., & Nakayama, K. (2000). Contrast
detection in schizophrenia. Archives of General Psychiatry, 57(10), 995.
Chen, Y., Nakayama, K., Levy, D., Matthysse, S., & Holzman, P. (2003). Processing
of global, but not local, motion direction is deficient in schizophrenia.
Schizophrenia Research, 61(2-3), 215-227.
Chen, Y., Palafox, G. P., Nakayama, K., Levy, D. L., Matthysse, S., & Holzman, P.
S. (1999). Motion perception in schizophrenia. Archives of General
Psychiatry, 56(2), 149-154.
Chudasama, Y., & Robbins, T. W. (2004). Psychopharmacological approaches to
modulating attention in the five-choice serial reaction time task: implications
for schizophrenia. Psychopharmacology 174(1), 86-98.
References 243
Clementz, B. A., Wang, J., & Keil, A. (2008). Normal electrocortical facilitation but
abnormal target identification during visual sustained attention in
schizophrenia. The Journal of Neuroscience 28(50), 13411-13418.
Clifford, C. W. (2009). Binocular rivalry. Current Biology, 19(22), R1022-1023.
Cobo-Lewis, A. B., Gilroy, L. A., & Smallwood, T. B. (2000). Dichoptic plaids may
rival, but their motions can integrate. Spatial Vision, 13(4), 415-429.
Cogan, R. (1973). Distributions of durations of perception in the binocular rivalry of
contours. The Journal of General Psychology, 89(2d Half), 297-304.
Collaer, M. L., & Nelson, J. D. (2002). Large visuospatial sex difference in line
judgment: possible role of attentional factors. Brain and Cognition, 49(1), 1-
12.
Comings, D. E., Comings, B. G., Muhleman, D., Dietz, G., Shahbahrami, B., Tast,
D., Knell, E., Kocsis, P., Baumgarten, R., & Kovacs, B. W. (1991). The
dopamine D2 receptor locus as a modifying gene in neuropsychiatric
disorders. JAMA : the Journal of the American Medical Association, 266(13),
1793-1800.
Conover, W.J. (1971). Practical Nonparametric Statistics. New York: John Wiley
and Sons Inc.
Cosmelli, D., David, O., Lachaux, J. P., Martinerie, J., Garnero, L., Renault, B., &
Varela, F. (2004). Waves of consciousness: ongoing cortical patterns during
binocular rivalry. Neuroimage, 23(1), 128-140.
Cotes, P. M., Crow, T. J., & Johnstone, E. C. (1977). Serum prolactin as an index of
dopamine receptor blockade in acute schizophrenia [proceedings]. British
Journal of Clinical Pharmacology, 4(5), 651P.

References
Couture, S. M., Granholm, E. L., & Fish, S. C. (2010). A path model investigation of
neurocognition, theory of mind, social competence, negative symptoms and
real-world functioning in schizophrenia. Schizophrenia Research, (Epub
ahead of print)
Crawford, J. R., Besson, J. A., Bremner, M., Ebmeier, K. P., Cochrane, R. H., &
Kirkwood, K. (1992). Estimation of premorbid intelligence in schizophrenia.
The British Journal of Psychiatry 161, 69-74.
Crevits, L. (2003). Abnormal psychophysical visual perception in Parkinson's disease
patients. Acta Neurologica Belgica, 103(2), 83-87.
Crewther, S. G., Crewther, D. P., Klistorner, A., & Kiely, P. M. (1999).
Development of the magnocellular VEP in children: implications for reading
disability. Electroencephalography and Clinical Neurophysiology
Supplement, 49, 123-128.
Crick, F., & Koch, C. (1990). Some reflections on visual awareness. Cold Spring
Cold Spring Harbo Symposia on Quantitative Biology, 55, 953-962.
Crick, F., & Koch, C. (1998). Consciousness and neuroscience. Cerebral Cortex
8(2), 97-107.
de Labra, C., & Valle-Inclan, F. (2001). Electrical activity in primary visual area due
to interocular suppression. Neuroreport, 12(18), 4099-4102.
De Marco, A., Penengo, P., & Trabucco, A. (1977). Stochastic models and
fluctuations in reversal time of ambiguous figures. Perception, 6(6), 645-656.
Delord, S., Ducato, M. G., Pins, D., Devinck, F., Thomas, P., Boucart, M., &
Knoblauch, K. (2006). Psychophysical assessment of magno- and
parvocellular function in schizophrenia. Visual Neuroscience 23(3-4), 645-
650.

References 245
Deutsch, G., Bourbon, W. T., Papanicolaou, A. C., & Eisenberg, H. M. (1988).
Visuospatial tasks compared via activation of regional cerebral blood flow.
Neuropsychologia, 26(3), 445-452.
Di Lollo, V., Hogben, J. H., & Dixon, P. (1994). Temporal integration and
segregation of brief visual stimuli: patterns of correlation in time. Perception
& Psychophysics, 55(4), 373-386.
Diederich, N. J., Raman, R., Leurgans, S., & Goetz, C. G. (2002). Progressive
worsening of spatial and chromatic processing deficits in Parkinson disease.
Archives of Neurology, 59(8), 1249-1252.
Dixon, P., & Di Lollo, V. (1994). Beyond visible persistence: an alternative account
of temporal integration and segregation in visual processing. Cognitive
Psychology, 26(1), 33-63.
Djamgoz, M. B., Hankins, M. W., Hirano, J., & Archer, S. N. (1997). Neurobiology
of retinal dopamine in relation to degenerative states of the tissue. Vision
Research, 37(24), 3509-3529.
Dobkins, K. R., Gunther, K. L., & Peterzell, D. H. (2000). What covariance
mechanisms underlie green/red equiluminance, luminance contrast sensitivity
and chromatic (green/red) contrast sensitivity? Vision Research, 40(6), 613-
628.
Doniger, G. M., Foxe, J. J., Murray, M. M., Higgins, B. A., & Javitt, D. C. (2002).
Impaired visual object recognition and dorsal/ventral stream interaction in
schizophrenia. Archives of General Psychiatry, 59(11), 1011-1020.
Donnelly, M., & Miller, R. J. (1995). Ingested ethanol and binocular rivalry.
Investigative Ophthalmology & Visual Science, 36(8), 1548-1554.
References
Eden, G. F., Stein, J. F., Wood, H. M., & Wood, F. B. (1996). Differences in
visuospatial judgement in reading-disabled and normal children. Perceptual
and Motor Skills, 82(1), 155-177.
Edwards, V. T., Hogben, J. H., Clark, C. D., & Pratt, C. (1996). Effects of a red
background on magnocellular functioning in average and specifically
disabled readers. Vision Research, 36(7), 1037-1045.
Einhauser, W., Stout, J., Koch, C., & Carter, O. (2008). Pupil dilation reflects
perceptual selection and predicts subsequent stability in perceptual rivalry.
Proceedings of the National Academy of Sciences of the United States of
America, 105(5), 1704-1709.
Eisner, A., Burke, S. N., & Toomey, M. D. (2004). Visual sensitivity across the
menstrual cycle. Visual neuroscience, 21(4), 513-531.
Ellemberg, D., Hammarrenger, B., Lepore, F., Roy, M. S., & Guillemot, J. P. (2001).
Contrast dependency of VEPs as a function of spatial frequency: the
parvocellular and magnocellular contributions to human VEPs. Spatial
Vision, 15(1), 99-111.
Endrass, T., Mohr, B., & Rockstroh, B. (2002). Reduced interhemispheric
transmission in schizophrenia patients: evidence from event-related
potentials. Neuroscience Letters, 320(1-2), 57-60.
Engel, A. K., Fries, P., Konig, P., Brecht, M., & Singer, W. (1999). Temporal
binding, binocular rivalry, and consciousness. Consciousness and Cognition,
8(2), 128-151.
Eslinger, P. J., & Benton, A. L. (1983). Visuoperceptual performances in aging and
dementia: clinical and theoretical implications. Journal of Clinical and
Experimental Neuropsychology, 5(3), 213-220.

References 247
Eslinger, P. J., Damasio, A. R., Benton, A. L., & Van Allen, M. (1985).
Neuropsychologic detection of abnormal mental decline in older persons.
JAMA : the Journal of the American Medical Association, 253(5), 670-674.
Evans, W. J., & Schwartz, B. D. (1997). Attentional mechanisms of saccadic eye
movements in schizophrenia. Neuropsychiatry Neuropsychology and
Behavioral Neurology, 10(1), 17-24.
Eysenck, H. J. (1952). Schizothymia-cyclothymia as a dimension of personality. II.
Experimental. Journal of Personality, 20(3), 345-384.
Fahle, M. (1982). Binocular rivalry: suppression depends on orientation and spatial
frequency. Vision Research, 22(7), 787-800.
Faul, F., & Erdfelder, E. (1992). GPOWER: A priori, post-hoc and compromise
power analyses for MS-DOS [ComputerProgram]. Bon, Germany: Bon,
University, Department of Psychology.
Faul, F., Erdfelder, E., Lang, A.-G., & Buchner, A. (2007). G*Power 3: A flexible
statistical power analysis program for the social, behavioral, and biomedical
sciences. Behavior Research Methods, 39, 175-191. 39. Retrieved April 19
2009.
Finckh, U., Giraldo-Velasquez, M., Pelz, J., Otto, G., Sander, T., Schmidt, L. G.,
Rommelspacher, H., & Rolfs, A. (1996). Dopamine D2 receptor gene
(DRD2) haplotypes in Caucasians. Genetics, 179(2), 251-255.
Finton, M. J., Lucas, J. A., Graff-Radford, N. R., & Uitti, R. J. (1998). Analysis of
visuospatial errors in patients with Alzheimer's disease or Parkinson's disease.
Journal of Clinical and Experimental Neuropsychology, 20(2), 186-193.
References
Fleming, K., Goldberg, T. E., Binks, S., Randolph, C., Gold, J. M., & Weinberger, D.
R. (1997). Visuospatial working memory in patients with schizophrenia.
Biological Psychiatry, 41(1), 43-49.
Fox, R. (1965). Rate of binocular rivalry alternation in psychotic and nonpsychotic
patients. Journal of Abnormal Psychology, 70, 34-37.
Fox, R. & Herrmann, J. (1967). Stochastic properties of binocular rivalry
alternations. Perception & Psychophysics, 2(9), 432-436.
Foxe, J. J., Strugstad, E. C., Sehatpour, P., Molholm, S., Pasieka, W., Schroeder, C.
E., & McCourt, M.E., (2008). Parvocellular and magnocellular contributions
to the initial generators of the visual evoked potential: high-density electrical
mapping of the "C1" component. Brain Topography, 21(1), 11-21.
Frecska, E., Symer, C., White, K., Piscani, K., & Kulcsar, Z. (2004). Perceptional
and executive deficits of chronic schizophrenic patients in attentional and
intentional tasks. Psychiatry Research, 126(1), 63-75.
Frecska, E., White, K. D., & Luna, L. E. (2003). Effects of the Amazonian
psychoactive beverage Ayahuasca on binocular rivalry: interhemispheric
switching or interhemispheric fusion? Journal of Psychoactive Drugs, 35(3),
367-374.
Frecska, E., White, K., Leonard, C., Kuldau, J., Bengston, M., & Ricciuti, N. (2003).
Binocular rivalry in schizophrenia and drug-induced pyschosis.
Neuropsychopharmacologica Hungarica, 2, 4-13.
Freeman, A. W., Nguyen, A. V., & Alais, D. (2005). The nature and depth of
binocular rivalry supression. In D. Alais & R Blake (Eds.), Binocular Rivalry
Massachusetts: The MIT Press.

References 249
Freeman, A. W., & Nguyen, V. A. (2001). Controlling binocular rivalry. Vision
Research, 41(23), 2943-2950.
Freeman, A., & Li, D. (2009). Conditions required for binocular rivalry suppression.
Attention, Perception & Psychophysics, 71(1), 174-182.
Freeman, M. P., Freeman, S. A., & McElroy, S. L. (2002). The comorbidity of
bipolar and anxiety disorders: prevalence, psychobiology, and treatment
issues. Journal of Affective Disorders, 68(1), 1-23.
Freeman, R.D. (2003). Binocular Interaction in the Visual Cortex. In L.M. and
Werner Chalupa, J.S. (Ed.), The Visual Neurosciences (Vol. 1, pp. 765-778).
Cambridge, Massachusetts: The MIT Press.
Frith, C., & Dolan, R. J. (1997). Brain mechanisms associated with top-down
processes in perception. Philosophical Transactions of the Royal Society B:
Biological Sciences, 352(1358), 1221-1230.
Fudge, J. L., & Emiliano, A. B. (2003). The extended amygdala and the dopamine
system: another piece of the dopamine puzzle. The Journal of
Neuropsychiatry and Clinical Neurosciences, 15(3), 306-316.
Funk, A. P., & Pettigrew, J. D. (2003). Does interhemispheric competition mediate
motion-induced blindness? A transcranial magnetic stimulation study.
Perception, 32(11), 1325-1338.
Gastaldo, S., Umilta, C., Bianchin, G., & Prior, M. (2002). The simon effect in
schizophrenic patients with negative symptoms. Cortex, 38(2), 149-159.
George, R. W. (1936). The significance of the fluctuations experienced
in observing ambiguous figures and in binocular rivalry. Journal of General
Psychology, 15, 39–66.

References
George, T. P., Vessicchio, J. C., Termine, A., Sahady, D. M., Head, C. A., Pepper,
W. T., Kosten, T. R., & Wexler, B. E (2002). Effects of smoking abstinence
on visuospatial working memory function in schizophrenia.
Neuropsychopharmacology, 26(1), 75-85.
Gilbert, C. D., & Sigman, M. (2007). Brain states: top-down influences in sensory
processing. Neuron, 54(5), 677-696.
Giuffre, G., Di Rosa, L., & Fiorino, F. (2007). Changes in colour discrimination
during the menstrual cycle. Ophthalmologica, 221(1), 47-50.
Goldstein, A. G., & Cofoid, D. (1965). A Developmental Study of Retinal Rivalry.
Perceptual and Motor Skills, 20, 235-238.
Gomez, C., Argandona, E. D., Solier, R. G., Angulo, J. C., & Vazquez, M. (1995).
Timing and competition in networks representing ambiguous figures. Brain
and Cognition, 29(2), 103-114.
Goodale, M. A., Meenan, J. P., Bulthoff, H. H., Nicolle, D. A., Murphy, K. J., &
Racicot, C. I. (1994). Separate neural pathways for the visual analysis of
object shape in perception and prehension. Current Biology, 4(7), 604-610.
Goodale, M. A., & Milner, A. D. (1992). Separate visual pathways for perception
and action. Trends in Neurosciences, 15(1), 20-25.
Grandy, D. K., Zhang, Y., & Civelli, O. (1993). PCR detection of the TaqA RFLP at
the DRD2 locus. Human Molecular Geneticst, 2(12), 2197.
Grawe, R. W., & Levander, S. (1995). Smooth pursuit eye movements and
neuropsychological impairments in schizophrenia. Acta psychiatrica
Scandinavica, 92(2), 108-114.
References 251
Green, M. F. (2006). "Cognitive impairment and functional outcome in
schizophrenia and bipolar disorder." Journal of Clinical Psychiatry 67 Suppl
9: 3-8; discussion 36-42.
Green, M. F., Butler, P. D., Chen, Y., Geyer, M. A., Silverstein, S., Wynn, J. K.,
Yoon, J. H., & Zemon, V. (2009). Perception Measurement in Clinical Trials
of Schizophrenia: Promising Paradigms From CNTRICS. Schizophrenia
Bulletin, 35(1), 163-181.
Green, M. F., Nuechterlein, K. H., & Breitmeyer, B. (1997). Backward masking
performance in unaffected siblings of schizophrenic patients. Evidence for a
vulnerability indicator. Archives of General Psychiatry, 54(5), 465-472.
Green, M. F., Nuechterlein, K. H., Breitmeyer, B., & Mintz, J. (1999). Backward
masking in unmedicated schizophrenic patients in psychotic remission:
possible reflection of aberrant cortical oscillation. The American Journal of
Psychiatry, 156(9), 1367-1373.
Green, M. F., Nuechterlein, K. H., Breitmeyer, B., & Mintz, J. (2006). Forward and
Backward Visual Masking in Unaffected Siblings of Schizophrenic Patients.
Biological Psychiatry, Mar 1;59(5):446-51.
Green, M. F., Nuechterlein, K. H., Breitmeyer, B., & Mintz, J. (2006). Forward and
backward visual masking in unaffected siblings of schizophrenic patients.
Biological Psychiatry, 59(5), 446-451.
Green, M. F., Nuechterlein, K. H., Breitmeyer, B., Tsuang, J., & Mintz, J. (2003).
Forward and backward visual masking in schizophrenia: influence of age.
Psychological Medicine, 33(5), 887-895.
References
Green, M. F., Nuechterlein, K. H., & Mintz, J. (1994a). Backward masking in
schizophrenia and mania. I. Specifying a mechanism. Archives of General
Psychiatry, 51(12), 939-944.
Green, M. F., Nuechterlein, K. H., & Mintz, J. (1994b). Backward masking in
schizophrenia and mania. II. Specifying the visual channels. Archives of
General Psychiatry, 51(12), 945-951.
Greene, T. (2007). The Kraepelinian dichotomy: the twin pillars crumbling? History
of Psychiatry, 18(71 Pt 3), 361-379.
Grevle, L., Guzey, C., Hadidi, H., Brennersted, R., Idle, J. R., & Aasly, J. (2000).
Allelic association between the DRD2 TaqI A polymorphism and Parkinson's
disease. Movement Disorders 15(6), 1070-1074.
Groom, M. J., Bates, A. T., Jackson, G. M., Calton, T. G., Liddle, P. F., & Hollis, C.
(2008). Event-related potentials in adolescents with schizophrenia and their
siblings: a comparison with attention-deficit/hyperactivity disorder.
Biological Psychiatry, 63(8), 784-792.
Grossberg, S. (2000). How hallucinations may arise from brain mechanisms of
learning, attention, and volition. Journal of the International
Neuropsychological Society, 6(5), 583-592.
Gruen, P. H. (1978). The prolactin response in clinical psychiatry. The Medical
Clinics of North America, 62(2), 409-424.
Gurvich, C. T., Fitzgerald, P. B., Georgiou-Karistianis, N., & White, O. B. (2008).
Saccadic impairment in schizophrenia with prominent negative symptoms.
Neuroreport, 19(14), 1435-1439.
Guzey, C., Scordo, M. G., Spina, E., Landsem, V. M., & Spigset, O. (2007).
Antipsychotic-induced extrapyramidal symptoms in patients with
References 253
schizophrenia: associations with dopamine and serotonin receptor and
transporter polymorphisms. European Journal of Clinical Pharmacology,
63(3), 233-241.
Gwiazda, J., Bauer, J., & Held, R. (1989). Binocular function in human infants:
correlation of stereoptic and fusion-rivalry discriminations. Journal of
Pediatric Ophthalmology and Strabismus, 26(3), 128-132.
Haenschel, C., Bittner, R. A., Haertling, F., Rotarska-Jagiela, A., Maurer, K., Singer,
W., & Linden, D, E. (2007). Contribution of impaired early-stage visual
processing to working memory dysfunction in adolescents with
schizophrenia: a study with event-related potentials and functional magnetic
resonance imaging. Archives of General Psychiatry, 64(11), 1229-1240.
Halari, R., Mehrotra, R., Sharma, T., Ng, V., & Kumari, V. (2006). Cognitive
impairment but preservation of sexual dimorphism in cognitive abilities in
chronic schizophrenia. Psychiatry Research, 141(2), 129-139.
Hamsher, K., Capruso, D. X., & Benton, A. (1992). Visuospatial judgment and right
hemisphere disease. Cortex, 28(3), 493-495.
Handa, T., Mukuno, K., Uozato, H., Niida, T., Shoji, N., & Shimizu, K. (2004).
Effects of dominant and nondominant eyes in binocular rivalry. Optometry
and Vision Science 81(5), 377-383.
Hannay, H. J., Varney, N. R., & Benton, A. L. (1976). Visual localization in patients
with unilateral brain disease. Journal of Neurology, Neurosurgery, and
Psychiatry, 39(4), 307-313.
Hardoy, M. C., Carta, M. G., Catena, M., Hardoy, M. J., Cadeddu, M., & Dell'Osso,
L. (2004). Impairment in visual and spatial perception in schizophrenia and
delusional disorder. Psychiatry Research, 127(1-2), 163-166.

References
Hargreaves, W. A., Zachary, R., LeGoullon, M., Binder, R., & Reus, V. (1987).
Neuroleptic dose: a statistical model for analyzing historical trends. Journal
of Psychiatric Research, 21(3), 199-214.
Harris, J. P., Calvert, J. E., & Snelgar, R. S. (1990). Adaptation to peripheral flicker:
relationship to contrast detection thresholds. Vision Research, 30(3), 381-386.
Hayashi, Y. (2000). [Visual backward masking in schizophrenia]. Seishin
Shinkeigaku Zasshi = Psychiatria Et Neurologia Japonica, 102(9), 776-792.
He, S., Carlson, T. A., & Chen, X. (2005). Parallel pathways and temporal dynamics
in binocular rivalry. In D. Alais & R. Blake (Eds.), Binocular Rivalry (pp. 81-
100). Cambridge, Massachusetts: The MIT Press.
Hedenmalm, K., Guzey, C., Dahl, M. L., Yue, Q. Y., & Spigset, O. (2006). Risk
factors for extrapyramidal symptoms during treatment with selective
serotonin reuptake inhibitors, including cytochrome P-450 enzyme, and
serotonin and dopamine transporter and receptor polymorphisms. Journal of
Clinical Psychopharmacology, 26(2), 192-197.
Hess, R. F., Dakin, S. C., & Field, D. J. (1998). The role of "contrast enhancement"
in the detection and appearance of visual contours. Vision Research, 38(6),
783-787.
Hetrick, W. P., Erickson, M. A., & Smith, D. A. (2010). Phenomenological
Dimensions of Sensory Gating. Schizophrenia Bulletin (Epub ahead of print).
Hirvonen, J., van Erp, T. G., Huttunen, J., Aalto, S., Nagren, K., Huttunen, M.,
Lönnqvist, J., Kaprio, J., Hietala, J., & Cannon, T. D. (2005). Increased
caudate dopamine D2 receptor availability as a genetic marker for
schizophrenia. Archives of General Psychiatry, 62(4), 371-378.

References 255
Hoffman, R. E., Quinlan, D. M., Mazure, C. M., & McGlashan, T. M. (2001).
Cortical instability and the mechanism of mania: a neural network simulation
and perceptual test. Biological Psychiatry, 49(6), 500-509.
Hollins, M. (1980). The effect of contrast on the completeness of binocular rivalry
suppression. Perception & Psychophysics, 27(6), 550-556.
Hollins, M., & Hudnell, K. (1980). Adaptation of the binocular rivalry mechanism.
IInvestigative Ophthalmology & Visual Science, 19(9), 1117-1120.
Holzman, P. S. (1987). Recent studies of psychophysiology in schizophrenia.
Schizophrenia Bulletin, 13(1), 49-75.
Holzman, P. S., Kringlen, E., Matthysse, S., Flanagan, S. D., Lipton, R. B., Cramer,
G., Levin, S., Lange, K., & Levy, D. L. (1988). A single dominant gene can
account for eye tracking dysfunctions and schizophrenia in offspring of
discordant twins. Archives of General Psychiatry, 45(7), 641-647.
Holzman, P. S., Levy, D. L., Matthysse, S. W., & Abel, L. A. (1997). Smooth pursuit
eye tracking in twins. A critical commentary. Archives of General Psychiatry,
54(5), 429-431.
Holzman, P. S., O'Brian, C., & Waternaux, C. (1991). Effects of lithium treatment on
eye movements. Biological Psychiatry, 29(10), 1001-1015.
Hong, L. E., Tagamets, M., Avila, M., Wonodi, I., Holcomb, H., & Thaker, G. K.
(2005). Specific motion processing pathway deficit during eye tracking in
schizophrenia: a performance-matched functional magnetic resonance
imaging study. Biological Psychiatry, 57(7), 726-732.
Hong, S. W., & Shevell, S. K. (2006). Resolution of binocular rivalry: Perceptual
misbinding of color. Visual Neuroscience, 23(3-4), 561-566.

References
Hong, S. W., & Shevell, S. K. (2008a). Binocular rivalry between identical retinal
stimuli with an induced color difference. Visual Neuroscience, 25(3), 361-
364.
Hong, S. W., & Shevell, S. K. (2008b). The influence of chromatic context on
binocular color rivalry: perception and neural representation. Vision
Research, 48(8), 1074-1083.
Horlitz, K. L., & O'Leary, A. (1993). Satiation or availability? Effects of attention,
memory, and imagery on the perception of ambiguous figures. Perception &
Psychophysics, 53(6), 668-681.
Humberstone, V., Wheeler, A., & Lambert, T. (2004). An audit of outpatient
antipsychotic usage in the three health sectors of Auckland, New Zealand.
The Australian and New Zealand Journal of Psychiatry, 38(4), 240-245.
Hunt, J., & Guilford, J. P. (1933). Fluctuation of an ambiguous figure
in dementia praecox and in manic-depressive patients. Journal of Abnormal
and Social Psychology, 27, 443– 452.
Isaacs, E. B., Edmonds, C. J., Chong, W. K., Lucas, A., & Gadian, D. G. (2003).
Cortical anomalies associated with visuospatial processing deficits. Annals of
Neurology, 53(6), 768-773.
Jackson, G. R., & Owsley, C. (2003). Visual dysfunction, neurodegenerative
diseases, and aging. Neurologic Clinics, 21(3), 709-728.
Jardri, R., Pouchet, A., Pins, D., & Thomas, P. (2010). Cortical activations during
auditory verbal hallucinations in schizophrenia: A coordinate-based meta-
analysis. American Journal of Psychiatry. (Epub ahead of print)

References 257
Javitt, D. C. (2009). When doors of perception close: bottom-up models of disrupted
cognition in schizophrenia. Annual Review of Clinical Psychology, 5, 249-
275.
Javitt, D. C., Liederman, E., Cienfuegos, A., & Shelley, A. M. (1999). Panmodal
processing imprecision as a basis for dysfunction of transient memory storage
systems in schizophrenia. Schizophrenia Bulletin 25(4), 763-775.
Johnson, B., Nozawa, G., & Bourassa, C. M. (1998). Differences in the luminance of
the first and second displays affects visible persistence in opposite ways.
Vision Research, 38(9), 1233-1238.
Kaiser, R., Tremblay, P. B., Klufmoller, F., Roots, I., & Brockmoller, J. (2002).
Relationship between adverse effects of antipsychotic treatment and
dopamine D(2) receptor polymorphisms in patients with schizophrenia.
Molecular Psychiatry, 7(7), 695-705.
Kanai, R., Moradi, F., Shimojo, S., & Verstraten, F. A. (2005). Perceptual alternation
induced by visual transients. Perception, 34(7), 803-822.
Kapur, S., & Mamo, D. (2003). Half a century of antipsychotics and still a central
role for dopamine D2 receptors. Progress in Neuro-psychopharmacology &
Biological Psychiatry, 27(7), 1081-1090.
Kapur, S., & Seeman, P. (2002). NMDA receptor antagonists ketamine and PCP
have direct effects on the dopamine D(2) and serotonin 5-HT(2)receptors-
implications for models of schizophrenia. Molecular Psychiatry, 7(8), 837-
844.
Karrer, R. (1967). Visual beat phenomena as an index to the temporal characteristics
of perception. Journal of experimental psychology. Learning, Memory, and
Cognition, 75(3), 372-378.
References
Kawabata, Y. (1994). Temporal integration at equiluminance and chromatic
adaptation. Vision Research, 34(8), 1007-1018.
Kay, S. R. (1990). Positive-negative symptom assessment in schizophrenia:
psychometric issues and scale comparison. The Psychiatric Quarterly, 61(3),
163-178.
Kay, S. R., Opler, L. A., & Lindenmayer, J. P. (1988). Reliability and validity of the
positive and negative syndrome scale for schizophrenics. Psychiatry
Research, 23(1), 99-110.
Kay, S.R., & Singh, M.M. (1974). Cognitive abnormality in schizophrenia; a dual-
process model. Biological Psychiartry, 14(1), 155-76.
Keil, A., Elbert, T., Rockstroh, B. , & Ray, W. J. (1998). Dynamical aspects of motor
and perceptual processes in schizophrenic patients and healthy controls.
Schizophrenia Research(33), 169–178.
Keri, S., Antal, A., Benedek, G., & Janka, Z. (2000). Contrast detection in
schizophrenia. Archives of General Psychiatry, 57(10), 995-996.
Keri, S., Antal, A., Szekeres, G., Benedek, G., & Janka, Z. (2000). Visual
information processing in patients with schizophrenia: evidence for the
impairment of central mechanisms. Neuroscience Letters, 293(1), 69-71.
Keri, S., Antal, A., Szekeres, G., Benedek, G., & Janka, Z. (2002). Spatiotemporal
visual processing in schizophrenia. The Journal of Neuropsychiatry and
Clinical Neurosciences, 14(2), 190-196.
Keri, S., & Benedek, G. (2007). Visual contrast sensitivity alterations in inferred
magnocellular pathways and anomalous perceptual experiences in people at
high-risk for psychosis. Visual Neuroscience, 24(2), 183-189.

References 259
Keri, S., Benedek, G., & Janka, Z. (2001). Impaired visual information processing in
unaffected siblings of schizophrenia patients. Orvosi Hetilap, 142(15), 787-
790.
Keri, S., & Janka, Z. (2004). Critical evaluation of cognitive dysfunctions as
endophenotypes of schizophrenia. Acta Psychiatrica Scandinavica, 110(2),
83-91.
Keri, S., Janka, Z., & Benedek, G. (2002). Early-stage vision and schizophrenia. The
American Journal of Psychiatry, 159(4), 678; author reply 678-679.
Keri, S., Kelemen, O., Benedek, G., & Janka, Z. (2004). Vernier threshold in patients
with schizophrenia and in their unaffected siblings. Neuropsychology, 18(3),
537-542.
Keri, S., Szendi, I., Kelemen, O., Benedek, G., & Janka, Z. (2001). Remitted
schizophrenia-spectrum patients with spared working memory show
information processing abnormalities. European Archives of Ppsychiatry and
Clinical Neuroscience, 251(2), 60-65.
Kessels, R. P., Postma, A., & de Haan, E. H. (1999). P and M channel-specific
interference in the what and where pathway. Neuroreport, 10(18), 3765-3767.
Kim, D., Wylie, G., Pasternak, R., Butler, P. D., & Javitt, D. C. (2006).
Magnocellular contributions to impaired motion processing in schizophrenia.
Schizophrenia Research, 82(1), 1-8.
Kinney, D. K., Levy, D. L., Yurgelun-Todd, D. A., Lajonchere, C. M., & Holzman,
P. S. (1999). Eye-tracking dysfunction and birth-month weather in
schizophrenia. Journal of Abnormal Psychology, 108(2), 359-362.
Kishida, I., Kawanishi, C., Furuno, T., Matsumura, T., Hasegawa, H., & Sugiyama,
N. (2003). Lack of association in Japanese patients between neuroleptic

References
malignant syndrome and the TaqI A polymorphism of the dopamine D2
receptor gene. Psychiatric Genetics, 13(1), 55-57.
Kiss, I., Fabian, A., Benedek, G., & Keri, S. (2010). When doors of perception open:
visual contrast sensitivity in never-medicated, first-episode schizophrenia.
Journal of Abnormal Psychology, 119(3), 586-593.
Klistorner, A., Crewther, D. P., & Crewther, S. G. (1996). Temporal analysis of the
VEP: evidence for separable magnocellular and parvocellular contributions.
Austrailian and New Zealand Journal of Ophthalmology, 24(2 Supplement),
32-34.
Klistorner, A., Crewther, D. P., & Crewther, S. G. (1997). Separate magnocellular
and parvocellular contributions from temporal analysis of the multifocal
VEP. Vision Research, 37(15), 2161-2169.
Kobayashi, T. (1992). Psychophysical experiments and a neural network model of
binocular rivalry. Frontiers of Medical and Biological Engineering, 4(1), 19-
34.
Koelkebeck, K., Ohrmann, P., Hetzel, G., Arolt, V., & Suslow, T. (2005). Visual
backward masking: deficits in locating targets are specific to schizophrenia
and not related to intellectual decline. Schizophrenia Research, 78(2-3), 261-
268.
Kolb, H., Fernandez, F., & Nelson, R. (2009). Webvision: The organization of the
retina and the visual system. Retrieved 14 March 2009, 2009
Kondo, T., Mihara, K., Suzuki, A., Yasui-Furukori, N., & Kaneko, S. (2003).
Combination of dopamine D2 receptor gene polymorphisms as a possible
predictor of treatment-resistance to dopamine antagonists in schizophrenic
References 261
patients. Progress in Neuro-psychopharmacology & Biological Psychiatry,
27(6), 921-926.
Kornmeier, J., & Bach, M. (2004). Early neural activity in Necker-cube reversal:
evidence for low-level processing of a gestalt phenomenon.
Psychophysiology, 41(1), 1-8.
Kornmeier, J., & Bach, M. (2005). The Necker cube--an ambiguous figure
disambiguated in early visual processing. Vision Research, 45(8), 955-960.
Kovacs, I., & Eisenberg, M (2005). Human Development and Binocular Rivalry. In
D. Alais & R. Blake (Eds.), Binocular Rivalry (pp. 101-116). Cambridge,
Massachusetts: The MIT Press.
Kovacs, I., Papathomas, T. V., Yang, M., & Feher, A. (1996). When the brain
changes its mind: interocular grouping during binocular rivalry. Proceedings
of the National Academy of Sciences of the United States of America, 93(26),
15508-15511.
Krug, K., Brunskill, E., Scarna, A., Goodwin, G. M., & Parker, A. J. (2008).
Perceptual switch rates with ambiguous structure-from-motion figures in
bipolar disorder. Proceedings of the Royal Society B: Biological Sciences,
275(1645), 1839-1848.
Kulikowski, J. J. (1992). Binocular chromatic rivalry and single vision. Ophthalmic
& Physiological Optics 12(2), 168-170.
Kulikowski, J. J., & Tolhurst, D. J. (1973). Psychophysical evidence for sustained
and transient detectors in human vision. The Journal of Physiology, 232(1),
149-162.
References
Kumra, S., Sporn, A., Hommer, D. W., Nicolson, R., Thaker, G., & Israel, E. (2001).
Smooth pursuit eye-tracking impairment in childhood-onset psychotic
disorders. The American Journal of Psychiatry, 158(8), 1291-1298.
Kuo, H. Y., Schmid, K. L., & Atchison, D. A. (2012). Visual backward masking
performance in young adult emmetropes and myopes. Optometry and Vision
Science, 89(1), E90-96. doi: 10.1097/OPX.0b013e31823733e6
Kveraga, K., Ghuman, A. S., & Bar, M. (2007). Top-down predictions in the
cognitive brain. Brain and Cognition, 65(2), 145-168.
Lack, L. C. (1970). Effects of knowledge of results and spacing of practice trials in
training of control of binocular rivalry. Perceptual and Motor Skills 31(3),
827-830.
Laing, C. R., & Chow, C. C. (2002). A spiking neuron model for binocular rivalry.
Journal of Computational Neuroscience, 12(1), 39-53.
Lalor, E. C., Yeap, S., Reilly, R. B., Pearlmutter, B. A., & Foxe, J. J. (2008).
Dissecting the cellular contributions to early visual sensory processing
deficits in schizophrenia using the VESPA evoked response. Schizophrenia
Research, 98(1-3), 256-264.
Laruelle, M., Gelernter, J., & Innis, R. B. (1998). D2 receptors binding potential is
not affected by Taq1 polymorphism at the D2 receptor gene. Molecular
Psychiatry, 3(3), 261-265.
Laruelle, M., Kegeles, L. S., & Abi-Dargham, A. (2003). Glutamate, dopamine, and
schizophrenia: from pathophysiology to treatment. Annals of the New York
Academy of Sciences, 1003, 138-158.
Lawford, B. R., Young, R. M., Swagell, C. D., Barnes, M., Burton, S. C., Ward,
W.K., Heslop, K. R., Shadforth, S, van Daal, & A, Morris, C. P. (2005). The

References 263
C/C genotype of the C957T polymorphism of the dopamine D2 receptor is
associated with schizophrenia. Schizophrenia Research, 73(1), 31-37.
Laycock, R., Crewther, D. P., & Crewther, S. G. (2008). The advantage in being
magnocellular: a few more remarks on attention and the magnocellular
system. Neuroscience and Biobehavioral Reviews, 32(8), 1409-1415.
Laycock, R., Crewther, S. G., & Crewther, D. P. (2007). A role for the
'magnocellular advantage' in visual impairments in neurodevelopmental and
psychiatric disorders. Neuroscience and Biobehavioral Reviews, 31(3), 363-
376.
Leat, S. J., & Woodhouse, J. M. (1984). Rivalry with continuous and flashed stimuli
as a measure of ocular dominance across the visual field. Perception, 13(3),
351-357.
Lee, S. H., Blake, R., & Heeger, D. J. (2005). Traveling waves of activity in primary
visual cortex during binocular rivalry. Nature Neuroscience 8(1), 22-23.
Lee, T. M., Cheung, P. P., Hardoy, M. C., Carta, M. G., Catena, M., & Hardoy, M. J.
(2005). The relationship between visual-perception and attention in Chinese
with schizophrenia. Schizophrenia Research, 72(2-3), 185-193.
Lehky, S. R. (1988). An astable multivibrator model of binocular rivalry. Perception,
17, 215-228.
Lehky, S. R. (1995). Binocular rivlary is not chaotic. Proceedings of the Royal
Society of London, B259, 71-76.
Leopold, D. A., & Logothetis, N. K. (1996). Activity changes in early visual cortex
reflect monkeys' percepts during binocular rivalry. Nature, 379(6565), 549-
553.

References
Leopold, D. A., & Logothetis, N. K. (1999). Multistable phenomena: changing views
in perception. Trends in Cognitive Sciences, 3(7), 254-264.
Levander, S. E., Bartfai, A., & Schalling, D. (1985). Regional cortical dysfunction in
schizophrenic patients studied by computerized neuropsychological methods.
Perceptual and Motor Skills, 61(2), 479-495.
Levelt, W. J. (1965). Binocular Brightness Averaging and Contour Information.
British Journal of Psychology, 56, 1-13.
Levelt, W. J. (1967). Note on the distribution of dominance times in binocular
rivalry. British Journal of Psychology, 58(1), 143-145.
Levelt, W.J.M. (1968). On Binocular Rivalry. The Hague, Paris: Mouton & Co.
Levin, S., Luebke, A., Zee, D. S., Hain, T. C., Robinson, D. A., & Holzman, P. S.
(1988). Smooth pursuit eye movements in schizophrenics: quantitative
measurements with the search-coil technique. Journal of Psychiatric
Research, 22(3), 195-206.
Levy, D. L., Holzman, P. S., Matthysse, S., & Mendell, N. R. (1993). Eye tracking
dysfunction and schizophrenia: a critical perspective. Schizophrenia Bulletin,
19(3), 461-536.
Levy, D. L., Holzman, P. S., Matthysse, S., & Mendell, N. R. (1994). Eye tracking
and schizophrenia: a selective review. Schizophrenia Bulletin, 20(1), 47-62.
Li, D. F., Freeman, A. W., & Alais, D. (2005). Contrast sensitivity of form and
motion discrimination during binocular rivalry. Vision Research, 45(10),
1255-1263.
Lieb, K., Denz, E., Hess, R., Schuttler, R., Kornhuber, H. H., & Schreiber, H. (1996).
Preattentive information processing as measured by backward masking and

References 265
texton detection tasks in adolescents at high genetic risk for schizophrenia.
Schizophrenia Research, 21(3), 171-182.
Litman, R. E., Hommer, D. W., Clem, T., Ornsteen, M. L., Ollo, C., & Pickar, D.
(1991). Correlation of Wisconsin Card Sorting Test performance with eye
tracking in schizophrenia. The American Journal of Psychiatry, 148(11),
1580-1582.
Litman, R. E., Hommer, D. W., Clem, T., Rapaport, M. H., Pato, C. N., & Pickar, D.
(1989). Smooth pursuit eye movements in schizophrenia: effects of
neuroleptic treatment and caffeine. Psychopharmacology Bulletin, 25(3),
473-478.
Litman, R. E., Hommer, D. W., Radant, A., Clem, T., & Pickar, D. (1994).
Quantitative effects of typical and atypical neuroleptics on smooth pursuit
eye tracking in schizophrenia. Schizophrenia Research, 12(2), 107-120.
Litman, R. E., Torrey, E. F., Hommer, D. W., Radant, A. R., Pickar, D., &
Weinberger, D. R. (1997). A quantitative analysis of smooth pursuit eye
tracking in monozygotic twins discordant for schizophrenia. Archives of
General Psychiatry, 54(5), 417-426.
Liu, L., Tyler, C. W., & Schor, C. M. (1992). Failure of rivalry at low contrast:
evidence of a suprathreshold binocular summation process. Vision Research,
32(8), 1471-1479.
Liu, Y. Z., Tang, B. S., Yan, X. X., Liu, J., Ouyang, D. S., & Nie, L. N. (2009).
Association of the DRD2 and DRD3 polymorphisms with response to
pramipexole in Parkinson's disease patients. European Journal of Clinical
Pharmacology, 65(7), 679-683.

References
Livingstone, M., & Hubel, D. (1988). Segregation of form, color, movement, and
depth: anatomy, physiology, and perception. Science, 240(4853), 740-749.
Livingstone, M. S., & Hubel, D. H. (1987). Psychophysical evidence for separate
channels for the perception of form, color, movement, and depth. The Journal
of Neuroscience, 7(11), 3416-3468.
Loenneker, T., Klaver, P., Bucher, K., Lichtensteiger, J., Imfeld,
A, & Martin, E. (2010). Microstructural development: Organizational
differences of the fiber architecture between children and adults in dorsal and
ventral visual streams. Human Brain Mapping,. 2010 Jun 9. [Epub ahead of
print].
Logothetis, N. K. (1998). Single units and conscious vision. Philosophical
Transactions of the Royal Society B: Biological Sciences, 353(1377), 1801-
1818.
Logothetis, N. K., Leopold, D. A., & Sheinberg, D. L. (1996). What is rivalling
during binocular rivalry? Nature, 380(6575), 621-624.
Logothetis, N. K., & Schall, J. D. (1989). Neuronal correlates of subjective visual
perception. Science, 245(4919), 761-763.
Low, A., Rockstroh, B., Elbert, T., Silberman, Y., & Bentin, S. (2006). Disordered
semantic representation in schizophrenic temporal cortex revealed by
neuromagnetic response patterns. BMC Psychiatry, 6, 23.
Lumer, E. D. (1998). A neural model of binocular integration and rivalry based on
the coordination of action-potential timing in primary visual cortex. Cerebral
Cortex (New York, NY), 8(6), 553-561.

References 267
Lumer, E. D., Edelman, G. M., & Tononi, G. (1997). Neural dynamics in a model of
the thalamocortical system. I. Layers, loops and the emergence of fast
synchronous rhythms. Cerebral Cortex (New York, NY), 7(3), 207-227.
Lumer, E. D., Friston, K. J., & Rees, G. (1998). Neural correlates of perceptual
rivalry in the human brain. Science, 280(5371), 1930-1934.
Maehara, G., & Goryo, K. (2003). Perceptual learning in visual backward pattern
masking. Perceptual and Motor Skills, 97(3 Pt 2), 1137-1149.
Mante, V., & Carandini, M. (2005). Mapping of stimulus energy in primary visual
cortex. Journal of Neurophysiology, 94(1), 788-798.
Martinez, A., Hillyard, S. A., Dias, E. C., Hagler, D. J., Jr., Butler, P. D., Guilfoyle,
D. N., Jalbrzikowski, M., Silipo, G., & Javitt, D.C. (2008). Magnocellular
pathway impairment in schizophrenia: evidence from functional magnetic
resonance imaging. The Journal of neuroscience, 28(30), 7492-7500.
Masson, G., Mestre, D., & Blin, O. (1993). Dopaminergic modulation of visual
sensitivity in man. Fundamental & Clinical Pharmacology, 7(8), 449-463.
Mather, J. A. (1986). Saccadic eye movements to seen and unseen targets:
oculomotor errors in normal subjects resembling those of schizophrenics.
Journal of Psychiatric Research, 20(1), 1-8.
Mather, J. A., & Putchat, C. (1984). Motor control of schizophrenics--II. Manual
control and tracking: sensory and motor deficits. Journal of Psychiatric
Research, 18(3), 287-298.
Matsumoto, C., Shinkai, T., De Luca, V., Hwang, R., Hori, H., & Lanktree, M.
(2005). Association between three functional polymorphisms of the dopamine
D2 receptor gene and polydipsia in schizophrenia. The International Journal
of Neuropsychopharmacology, 8(2), 245-253.
References
May, J. G., Grannis, S. W., & Dunlap, W. P. (1988). Reaction time measures of
backward masking. The Journal of General Psychology, 115(2), 171-185.
McClure, R. K. (2001). The visual backward masking deficit in schizophrenia.
Progress in Neuro-psychopharmacology & Biological Psychiatry, 25(2), 301-
311.
McCourt, M. E., Shpaner, M., Javitt, D. C., & Foxe, J. J. (2008). Hemispheric
asymmetry and callosal integration of visuospatial attention in schizophrenia:
a tachistoscopic line bisection study. Schizophrenia Research, 102(1-3), 189-
196.
McGowan, S., Lawrence, A. D., Sales, T., Quested, D., & Grasby, P. (2004).
Presynaptic dopaminergic dysfunction in schizophrenia: a positron emission
tomographic [18F]fluorodopa study. Archives of General Psychiatry, 61(2),
134-142.
Meng, M., & Tong, F. (2004). Can attention selectively bias bistable perception?
Differences between binocular rivalry and ambiguous figures. Journal of
Vision, 4(7), 539-551.
Menon, R. S., Ogawa, S., Strupp, J. P., & Ugurbil, K. (1997). Ocular dominance in
human V1 demonstrated by functional magnetic resonance imaging. Journal
of Neurophysiology, 77(5), 2780-2787.
Mihara, K., Kondo, T., Suzuki, A., Yasui-Furukori, N., Ono, S., Sano, A., Koshiro,
K., Otani, K., & Kaneko, S. (2003). Relationship between functional
dopamine D2 and D3 receptors gene polymorphisms and neuroleptic
malignant syndrome. American Journal of Medical Genetics. Part B,
Neuropsychiatric Genetics, 117(1), 57-60.
References 269
Mihara, K., Kondo, T., Suzuki, A., Yasui, N., Nagashima, U., Ono, S., Otani, K., &
Kaneko, S. (2000). Prolactin response to nemonapride, a selective antagonist
for D2 like dopamine receptors, in schizophrenic patients in relation to
Taq1A polymorphism of DRD2 gene. Psychopharmacology, 149(3), 246-
250.
Mihara, K., Suzuki, A., Kondo, T., Nagashima, U., Ono, S., Otani, K., & Kaneko, S.
(2000). No relationship between Taq1 a polymorphism of dopamine D(2)
receptor gene and extrapyramidal adverse effects of selective dopamine D(2)
antagonists, bromperidol, and nemonapride in schizophrenia: a preliminary
study. American Journal of Medical Genetics, 96(3), 422-424.
Mihara, K., Suzuki, A., Kondo, T., Yasui-Furukori, N., Ono, S., Otani, K., Kaneko,
S., & Inoue Y. (2001). Relationship between Taq1 A dopamine D2 receptor
(DRD2) polymorphism and prolactin response to bromperidol. American
Journal of Medical Genetics, 105(3), 271-274.
Miller, S. M. (2001). Binocular Rivalry and the Cerebral Hemispheres With a Note
on the Correlates and Constitution of Visual Consciousness. Brain and Mind,
2(1), 119-149.
Miller, S. M., Gynther, B. D., Heslop, K. R., Liu, G. B., Mitchell, P. B., Ngo, T. T.,
Pettigrew, J. D., & Geffen, L. B. (2003). Slow binocular rivalry in bipolar
disorder. Psychological Medicine, 33(4), 683-692.
Miller, S. M., Liu, G. B., Ngo, T. T., Hooper, G., Riek, S., Carson, R. G., &
Pettigrew, J. D. (2000). Interhemispheric switching mediates perceptual
rivalry. Current Biology 10(7), 383-392.
Mitchell, J. F., Stoner, G. R., & Reynolds, J. H. (2004). Object-based attention
determines dominance in binocular rivalry. Nature, 429(6990), 410-413.

References
Mohr, B., Pulvermuller, F., Rockstroh, B., & Endrass, T. (2008). Hemispheric
cooperation--a crucial factor in schizophrenia? Neurophysiological evidence.
Neuroimage, 41(3), 1102-1110.
Montse, A., Pere, V., Carme, J., Francesc, V., & Eduardo, T. (2001). Visuospatial
deficits in Parkinson's disease assessed by judgment of line orientation test:
error analyses and practice effects. Journal of Clinical and Experimental
Neuropsychology, 23(5), 592-598.
Morrison, G., Sharkey, V., Allardyce, J., Kelly, R. C., & McCreadie, R. G. (2000).
Nithsdale schizophrenia surveys 21: a longitudinal study of National Adult
Reading Test stability. Psychological Medicine, 30(3), 717-720.
Mueller, T. J. (1990). A physiological model of binocular rivalry. Visual
Neuroscience 4(1), 63-73.
Mueller, T. J., & Blake, R. (1989). A fresh look at the temporal dynamics of
binocular rivalry. Biological Cybernetics, 61(3), 223-232.
Murata, T., Matsui, N., Miyauchi, S., Kakita, Y., & Yanagida, T. (2003). Discrete
stochastic process underlying perceptual rivalry. Neuroreport, 14(10), 1347-
1352.
Nagamine, M., Yoshino, A., Miyazaki, M., Takahashi, Y., & Nomura, S. (2008).
Effects of selective 5-HT1A agonist tandospirone on the rate and rhythmicity
of binocular rivalry. Psychopharmacology, 198(2), 279-286.
Nagamine, M., Yoshino, A., Yamazaki, M., Obara, M., Sato, S., Takahashi, Y., &
Nomura, S. (2007). Accelerated binocular rivalry with anxious personality.
Physiology & Behavior, 91(1), 161-165.
Narr, K. L., Green, M. F., Capetillo-Cunliffe, L., Toga, A. W., & Zaidel, E. (2003).
Lateralized lexical decision in schizophrenia: hemispheric specialization and
References 271
interhemispheric lexicality priming. Journal of Abnormal Psychology,
112(4), 623-632.
Neuenschwander, S., Castelo-Branco, M., & Singer, W. (1999). Synchronous
oscillations in the cat retina. Vision Research, 39(15), 2485-2497.
Newman, J., & Grace, A. A. (1999). Binding across time: the selective gating of
frontal and hippocampal systems modulating working memory and
attentional states. Consciousness and Cognition, 8(2), 196-212.
Ng, V. W., Bullmore, E. T., de Zubicaray, G. I., Cooper, A., Suckling, J., &
Williams, S. C. (2001). Identifying rate-limiting nodes in large-scale cortical
networks for visuospatial processing: an illustration using fMRI. Journal of
Cognitive Neuroscience, 13(4), 537-545.
Ngo, T. T., Liu, G. B., Tilley, A. J., Pettigrew, J. D., & Miller, S. M. (2008). The
changing face of perceptual rivalry. Brain Research Bulletin, 75(5), 610-618.
Ngo, T. T., Miller, S. M., Liu, G. B., & Pettigrew, J. D. (2000). Binocular rivalry and
perceptual coherence. Current Biology : CB, 10(4), R134-136.
Nguyen, V. A., Freeman, A. W., & Alais, D. (2003). Increasing depth of binocular
rivalry suppression along two visual pathways. Vision Research, 43(19),
2003-2008.
Nguyen, V. A., Freeman, A. W., & Wenderoth, P. (2001). The depth and selectivity
of suppression in binocular rivalry. Perception & Psychophysics, 63(2), 348-
360.
Noble, E. P. (2000). The DRD2 gene in psychiatric and neurological disorders and its
phenotypes. Pharmacogenomics, 1(3), 309-333.

References
Noble, E. P. (2003). D2 dopamine receptor gene in psychiatric and neurologic
disorders and its phenotypes. American Journal of Medical Genetics. Part B,
Neuropsychiatric genetics, 116(1), 103-125.
Norman, H. F., Norman, J. F., & Bilotta, J. (2000). The temporal course of
suppression during binocular rivalry. Perception, 29(7), 831-841.
Norton, D., Ongur, D., Stromeyer, C., 3rd, & Chen, Y. (2008). Altered 'three-flash'
illusion in response to two light pulses in schizophrenia. Schizophrenia
Research, 103(1-3), 275-282.
Nurnberger, J. I., Jr., Adkins, S., Lahiri, D. K., Mayeda, A., Hu, K., Lewy, A.,
Miller, A., Bowman, E. S, Miller, M. J, Rau, L, Smiley, C., & Davis-Singh,
D. (2000). Melatonin suppression by light in euthymic bipolar and unipolar
patients. Archives of General Psychiatry, 57(6), 572-579.
O'Carroll, R., Walker, M., Dunan, J., Murray, C., Blackwood, D., Ebmeier, K. P., &
Goodwin, G. M. (1992). Selecting controls for schizophrenia research
studies: the use of the National Adult Reading Test (NART) is a measure of
premorbid ability. Schizophrenia Research, 8(2), 137-141.
O'Donnell, B. F., Potts, G. F., Nestor, P. G., Stylianopoulos, K. C., Shenton, M. E.,
& McCarley, R. W. (2002). Spatial frequency discrimination in
schizophrenia. Journal of Abnormal Psychology, 111(4), 620-625.
O'Driscoll, G. A., Strakowski, S. M., Alpert, N. M., Matthysse, S. W., Rauch, S. L.,
Levy, D. L., & Holzman, P. S. (1998). Differences in cerebral activation
during smooth pursuit and saccadic eye movements using positron-emission
tomography. Biological Psychiatry, 44(8), 685-689.
References 273
Ortuno, F., Guillen-Grima, F., Lopez-Garcia, P., Gomez, J., & Pla, J. (2010).
Functional neural networks of time perception: Challenge and opportunity for
schizophrenia research. Schizophrenia Research, (Epub ahead of print)
O'Shea R, P. (1997, 1998). Effects of orientation and spatial frequeny on monocular
and binocular rivalry. Paper presented at the International Conference on
Neural Information Processing and Intelligent Information Systems,
Singapore.
O'Shea R, P. (1999). Translation of Dutour (1763) [on-Line] Retrieved 1999
O'Shea R, P., & Corballis, P. M. (2005a). Binocular Rivalry in the Divided Brain. In
D. Alais & R. Blake (Eds.), Binocular Rivalry (pp. 301-316). Cambridge,
Massachusetts: The MIT Press.
O'Shea R, P., & Corballis, P. M. (2005b). Visual grouping on binocular rivalry in a
split-brain observer. Vision Research, 45(2), 247-261.
O'Shea R, P., & Wishart, B. (2007). Contrast enhances binocular rivalry and retards
monocular rivalry. [Abstract]. Australian Journal of Psychology, 59(1 supp
1), 51-52.
O'Shea, R. P., & Blake, R. (1986). Dichoptic temporal frequency differences do not
lead to binocular rivalry. Perception & Psychophysics, 39(1), 59-63.
O'Shea, R. P., Blake, R., & Wolfe, J. M. (1994). Binocular rivalry and fusion under
scotopic luminances. Perception, 23(7), 771-784.
O'Shea, R. P., & Corballis, P. M. (2003). Binocular rivalry in split-brain observers.
Journal of Vision, 3(10), 610-615.
O'Shea, R. P., Parker, A., La Rooy, D., & Alais, D. (2009). Monocular rivalry
exhibits three hallmarks of binocular rivalry: evidence for common processes.
Vision Research, 49(7), 671-681.
References
O'Shea, R. P., Sims, A. J., & Govan, D. G. (1997). The effect of spatial frequency
and field size on the spread of exclusive visibility in binocular rivalry. Vision
Research, 37(2), 175-183.
O'Shea, R. P., & Williams, D. R. (1996). Binocular rivalry with isoluminant stimuli
visible only via short-wavelength-sensitive cones. Vision Research, 36(11),
1561-1571.
O'Shea, R. P., & Corballis, P. M. (2001). Binocular rivalry between complex stimuli
in split-brain observers. Brain and Mind, 2(1), 151-160.
Obayashi, C., Nakashima, T., Onitsuka, T., Maekawa, T., Hirano, Y., Hirano, S.,
Oribe, N., Kaneko, K., Kanba, S., & Tobimatsu, S. (2009). Decreased spatial
frequency sensitivities for processing faces in male patients with chronic
schizophrenia. Clinical Neurophysiology, 120(8), 1525-1533.
Ohara, K., Nakamura, Y., Xie, D. W., Ishigaki, T., Deng, Z. L., Tani, K.,Zhang, H.
Y., Kondo, N., Liu, J. C., Miyasato, K., & Ohara, K. (1996). Polymorphisms
of dopamine D2-like (D2, D3, and D4) receptors in schizophrenia. Biological
Psychiatry 40(12), 1209-1217.
Oliveri, R. L., Annesi, G., Zappia, M., Civitelli, D., De Marco, E. V., Pasqua, A. A.,
Annesi, F., Spadafora, P., Gambardella, A., Nicoletti, G., Branca, D.,
Caracciolo, M., Aguglia, U., & Quattrone, A.. (2000). The dopamine D2
receptor gene is a susceptibility locus for Parkinson's disease. Movement
Disorders, 15(1), 127-131.
Ooi, T. L., & He, Z. J. (1999). Binocular rivalry and visual awareness: the role of
attention. Perception, 28(5), 551-574.
Ooi, T. L., & Loop, M. S. (1994). Visual suppression and its effect upon color and
luminance sensitivity. Vision Research, 34(22), 2997-3003.

References 275
Ortuno, F., Guillen-Grima, F., Lopez-Garcia, P., Gomez, J., & Pla, J. (2010).
Functional neural networks of time perception: Challenge and opportunity for
schizophrenia research. Schizophrenia Research, (Epub ahead of print)
Osburn, D M., & Klingsporn, M J. (1998). Consistency of performance on eyedness
tasks. British Journal of Psychology, 89(1), 27-37.
Owen, R. R., Thrush, C. R., Hudson, T. J., Mallory, S. R., Fischer, E. P., Clardy, J.
A., & Williams, D. K. (2002). Using an explicit guideline-based criterion and
implicit review to assess antipsychotic dosing performance for schizophrenia.
International Journal for Quality in Health Care, 14(3), 199-206.
Pammer, K., & Lovegrove, W. (2001). The influence of color on transient system
activity: implications for dyslexia research. Perception & Psychophysics,
63(3), 490-500.
Park, S. (1999). Hemispheric asymmetry of spatial working memory deficit in
schizophrenia. International Journal of Psychophysiology, 34(3), 313-322.
Park, S., & Holzman, P. S. (1993). Association of working memory deficit and eye
tracking dysfunction in schizophrenia. Schizophrenia Research, 11(1), 55-61.
Parsons, M. J., Mata, I., Beperet, M., Iribarren-Iriso, F., Arroyo, B., Sainz, R.,
Arrnaz, M. J., & Kerwin, R. (2007). A dopamine D2 receptor gene-related
polymorphism is associated with schizophrenia in a Spanish population
isolate. Psychiatric Genetics, 17(3), 159-163.
Pearlson, G. D., Wong, D. F., Tune, L. E., Ross, C. A., Chase, G. A., Links, J. M.,
Dannals, R. F, Wilson, A. A, Ravert, H. T., & Wagner, H. N Jr. (1995). In
vivo D2 dopamine receptor density in psychotic and nonpsychotic patients
with bipolar disorder. Archives of General Psychiatry, 52(6), 471-477.
References
Pearson, J., & Clifford, C. G. (2004). Determinants of visual awareness following
interruptions during rivalry. Journal of Vison,, 4(3), 196-202.
Pearson, J., & Clifford, C. W. (2005). When your brain decides what you see:
grouping across monocular, binocular, and stimulus rivalry. Psychological
Science, 16(7), 516-519.
Pearson, J., Tadin, D., & Blake, R. (2007). The effects of transcranial magnetic
stimulation on visual rivalry. Journal of Vision, 7(7), 2 1-11.
Petrill, S. A., Plomin, R., McClearn, G. E., Smith, D. L., Vignetti, S., Chorney, M. J.,
Thompson, L. A, Detterman, D. K, Benbow, C., Lubinski, D., Daniels, J.,
Owen, M., & McGuffin, P. (1997). No association between general cognitive
ability and the A1 allele of the D2 dopamine receptor gene. Behavior
Geneticst, 27(1), 29-31.
Pettigrew, J. D. (2001). Searching for the switch: neural bases for perceptual rivalry
alternations. Brain and Mind, 2(1), 85-118.
Pettigrew, J. D., & Carter, O. (2005). Perceptual Rivalry as an Ultradian Oscillation.
In D. Alais & R. Blake (Eds.), Binocular Rivalry (pp. 283-300). Cambridge,
Massachusetts: The MIT Press.
Pettigrew, J. D., & Miller, S. M. (1998). A 'sticky' interhemispheric switch in bipolar
disorder? Philosophical Transactions of the Royal Society B: Biological
Sciences, 265(1411), 2141-2148.
Peuskens, J., Demily, C., & Thibaut, F. (2005). Treatment of cognitive dysfunction
in schizophrenia. Clinical Therapeutics, 27 Suppl A, S25-37.
Philip, B. R. (1953). Reversals in the perception of Lissajou figures by psychotics.
Canadian Journal of Psychology, 7(3), 115-125.

References 277
Piskulic, D., Olver, J. S., Norman, T. R., & Maruff, P. (2007). Behavioural studies of
spatial working memory dysfunction in schizophrenia: a quantitative
literature review. Psychiatry Research 150(2), 111-121.
Poirel, N., Brazo, P., Turbelin, M. R., Lecardeur, L., Simon, G., Houde, O., Pineau,
A., & Dollfus, S. (2010). Meaningfulness and global-local processing in
schizophrenia. Neuropsychologia, 48(10), 3062-3068.
Polonsky, A., Blake, R., Braun, J., & Heeger, D. J. (2000). Neuronal activity in
human primary visual cortex correlates with perception during binocular
rivalry. Nature Neuroscience, 3(11), 1153-1159.
Popken, G. J., Bunney, W. E., Jr., Potkin, S. G., & Jones, E. G. (2000). Subnucleus-
specific loss of neurons in medial thalamus of schizophrenics. Proceedings of
the National Academy of Sciences of the United States of America, 97(16),
9276-9280.
Radant, A. D., Claypoole, K., Wingerson, D. K., Cowley, D. S., & Roy-Byrne, P. P.
(1997). Relationships between neuropsychological and oculomotor measures
in schizophrenia patients and normal controls. Biological Psychiatry, 42(9),
797-805.
Radant, A. D., & Hommer, D. W. (1992). A quantitative analysis of saccades and
smooth pursuit during visual pursuit tracking. A comparison of
schizophrenics with normals and substance abusing controls. Schizophrenia
Research, 6(3), 225-235.
Ramos-Loyo, J., Gonzalez-Garrido, A. A., Sanchez-Loyo, L. M., Medina, V., &
Basar-Eroglu, C. (2009). Event-related potentials and event-related
oscillations during identity and facial emotional processing in schizophrenia.
International Journal of Psychophysiology 71(1), 84-90.

References
Rassovsky, Y., Green, M. F., Nuechterlein, K. H., Breitmeyer, B. G., & Mintz, J.
(2005). Visual processing in schizophrenia: Structural equation modeling of
visual masking performance. Schizophrenia Research, 78(2-3), 251-260.
Rassovsky, Y., Green, M. F., Nuechterlein, K. H., Breitmeyer, B., & Mintz, J.
(2004). Paracontrast and metacontrast in schizophrenia: clarifying the
mechanism for visual masking deficits. Schizophrenia Research, 71(2-3),
485-492.
Reichenberg, A. (2010). The assessment of neuropsychological functioning in
schizophrenia. Dialogues in Clinical Neuroscience, 12(3), 383-392.
Riba, J., Rodriguez-Fornells, A., & Barbanoj, M. J. (2002). Effects of ayahuasca on
sensory and sensorimotor gating in humans as measured by P50 suppression
and prepulse inhibition of the startle reflex, respectively.
Psychopharmacology, 165(1), 18-28.
Riley, E. M., McGovern, D., Mockler, D., Doku, V. C., S, O. Ceallaigh, Fannon, D.
G., Tennakoon, L., Santamaria, M., Soni, W., Morris, R. G, & Sharma, T.
(2000). Neuropsychological functioning in first-episode psychosis-evidence
of specific deficits. Schizophrenia Research, 43(1), 47-55.
Rogers, D. C., & Hollins, M. (1982). Is the binocular rivalry mechanism tritanopic?
Vision Research, 22(5), 515-520.
Rogers, R. L., Rogers, S. W., & Tootle, J. S. (1977). Stimulus complexity and rate of
alternation in binocular rivalry. Perceptual and Motor Skills, 44(2), 669-670.
Rudrauf, D., Douiri, A., Kovach, C., Lachaux, J. P., Cosmelli, D., Chavez, M.,
Adam, C., Renault, B., Martinerie, J., & Le Van Quyen, M. (2006).
Frequency flows and the time-frequency dynamics of multivariate phase
synchronization in brain signals. Neuroimage, 31(1), 209-227.
References 279
Rund, B. R. (1993). Backward-masking performance in chronic and nonchronic
schizophrenics, affectively disturbed patients, and normal control subjects.
Journal of Abnormal Psychology, 102(1), 74-81.
Rund, B. R., Egeland, J., Sundet, K., Asbjørnsen, A., Hugdahl, K., Landro, N. I.,
Lund, A., Roness, A., & Stordal, K. I. (2004). Early visual information
processing in schizophrenia compared to recurrent depression. Schizophrenia
Research, 68(2-3), 111-118.
Saccuzzo, D. S., Cadenhead, K. S., & Braff, D. L. (1996). Backward versus forward
visual masking deficits in schizophrenic patients: centrally, not peripherally,
mediated? The American Journal of Psychiatry, 153(12), 1564-1570.
Sanjuan, J., Toirac, I., Gonzalez, J. C., Leal, C., Molto, M. D., Najera, C., & De
Frutos, R. (2004). A possible association between the CCK-AR gene and
persistent auditory hallucinations in schizophrenia. European Psychiatry,
19(6), 349-353.
Sappenfield, B. R., & Ripke, R. J. (1961). Validities of three visual tests for
differentiating organics from schizophrenics and normals. Journal of Clinical
Psychology, 17, 276-278.
Scharfetter, J. (2004). Pharmacogenetics of dopamine receptors and response to
antipsychotic drugs in schizophrenia--an update. Pharmacogenomics, 5(6),
691-698.
Schechter, I., Butler, P. D., Silipo, G., Zemon, V., & Javitt, D. C. (2003).
Magnocellular and parvocellular contributions to backward masking
dysfunction in schizophrenia. Schizophrenia Research, 64(2-3), 91-101.
Schechter, I., Butler, P. D., Zemon, V. M., Revheim, N., Saperstein, A. M.,

References
Jalbrzikowski, M., Pasternak, R., Silipo. G., & Javitt, D. C. (2005).
Impairments in generation of early-stage transient visual evoked potentials to
magno- and parvocellular-selective stimuli in schizophrenia. Clinical
Neurophysiology, 116(9), 2204-2215.
Schorderet, M., & Nowak, J. Z. (1990). Retinal dopamine D1 and D2 receptors:
characterization by binding or pharmacological studies and physiological
functions. Cellular and Molecular Neurobiology, 10(3), 303-325.
Schreiber, H., Rothmeier, J., Becker, W., Jurgens, R., Born, J., Stolz-Born, G.,
Westphal, K. P., & Kornhuber, H. H. (1995). Comparative assessment of
saccadic eye movements, psychomotor and cognitive performance in
schizophrenics, their first-degree relatives and control subjects. Acta
Psychiatrica Scandinavica, 91(3), 195-201.
Schwartz, B. D. (1990). Early information processing in schizophrenia. International
Journal of Psychiatry Medcine, 8(1), 73-94.
Schwartz, B. D., Evans, W. J., Pena, J. M., & Winstead, D. K. (1994). Visible
persistence decay rates for schizophrenics and substance abusers. Biological
Psychiatry, 36(10), 662-669.
Schwartz, B. D., Mallott, D. B., & Winstead, D. K. (1988). Preattentive deficit in
temporal processing by chronic schizophrenics. Biological psychiatry, 23(7),
664-669.
Schwartz, B. D., Maron, B. A., Evans, W. J., & Winstead, D. K. (1999a). High
velocity transient visual processing deficits diminish ability of patients with
schizophrenia to recognize objects. Neuropsychiatry, Neuropsychology and
Behaioral Neurology, 12(3), 170-177.
References 281
Schwartz, B. D., Maron, B. A., Evans, W. J., & Winstead, D. K. (1999b). Smooth
pursuit tracking deficits of patients with schizophrenia at specific within-sine
wave bins. Neuropsychiatry, Neuropsychology and Behaioral Neurology,
12(4), 221-229.
Schwartz, B. D., McGinn, T., & Winstead, D. K. (1987). Disordered spatiotemporal
processing in schizophrenics. Biological Psychiatry, 22(6), 688-698.
Schwartz, B. D., O'Brien, B. A., Evans, W. J., McDermott, B. E., Sautter, F. J., Jr., &
Winstead, D. K. (1995). Abnormal saccadic eye movements associated with
positive family history schizophrenics. Biological Psychiatry, 38(7), 487-491.
Schwartz, B. D., O'Brien, B. A., Evans, W. J., Sautter, F. J., Jr., & Winstead, D. K.
(1995). Smooth pursuit eye movement differences between familial and non-
familial schizophrenia. Schizophrenia Research, 17(2), 211-219.
Schwartz, B. D., & Winstead, D. K. (1988). Visible persistence in paranoid
schizophrenics. Biological Psychiatry, 23(1), 3-12.
Schwartz, B. D., Winstead, D. K., & Walker, W. G. (1984). A corpus callosal deficit
in sequential analysis by schizophrenics. Biological Psychiatry, 19(12), 1667-
1676.
Schwartz, B. D., Satter, E., O'Neill, P. T., & Winstead, D. K. (1990). Bilateral
hemispheric processing deficits in schizophrenia. Schizophrenia Research,
3(2), 147-154.
Schwartz, S., Vuilleumier, P., Hutton, C., Maravita, A., Dolan, R. J., & Driver, J.
(2005). Attentional load and sensory competition in human vision:
modulation of fMRI responses by load at fixation during task-irrelevant
stimulation in the peripheral visual field. Cerebral Cortex, Jun;15(6):770-86.
References
Schwartz, S.H. (1999). Visual perception: a clinical orientation (2nd Ed. ed.).
Norwalk: Appleton & Lange.
Seeman, P. (2002). Atypical antipsychotics: mechanism of action. Canadian Journal
of Psychiatry, 47(1), 27-38.
Seeman, P., & Kapur, S. (2000). Schizophrenia: more dopamine, more D2 receptors.
Proceedings of the National Academy of Sciences of the United States of
America, 97(14), 7673-7675.
Segman, R. H., Cooper-Kazaz, R., Macciardi, F., Goltser, T., Halfon, Y.,
Dobroborski, T., & Shalev, A. Y. (2002). Association between the dopamine
transporter gene and posttraumatic stress disorder. Molecular Psychiatry,
7(8), 903-907.
Sengpiel, F., Baddeley, R. J., Freeman, T. C., Harrad, R., & Blakemore, C. (1998).
Different mechanisms underlie three inhibitory phenomena in cat area 17.
Vision Research, 38(14), 2067-2080.
Sengpiel, F., Blakemore, C., & Harrad, R. (1995). Interocular suppression in the
primary visual cortex: a possible neural basis of binocular rivalry. Vision
Research, 35(2), 179-195.
Sengpiel, F., & Vorobyov, V. (2005). Intracortical origins of interocular suppression
in the visual cortex. Journal of Neuroscience Research, 25(27), 6394-6400.
Sengpiel, F., Bonhoeffer, T., Freeman, T. C. B., & Blakemore, C. (2001). On the
relationship between interocular suppression in the primary visual cortex and
binocular rivalry. Brain and Mind, 2(1), 39-54.
Sereno, A. B., & Holzman, P. S. (1995). Antisaccades and smooth pursuit eye
movements in schizophrenia. Biological Psychiatry, 37(6), 394-401.
References 283
Sewards, T. V., & Sewards, M. A. (2001). On the correlation between synchronized
oscillatory activities and consciousness. Consciousness and Cognition, 10(4),
485-495.
Shapiro, K., Hillstrom, A. P., & Husain, M. (2002). Control of visuotemporal
attention by inferior parietal and superior temporal cortex. Current Biology
12(15), 1320-1325.
Shapley, R. (1990). Visual sensitivity and parallel retinocortical channels. Annual
Review of Psychology, 41, 635-658.
Shapley, R. (1992). Parallel retinocortical channels: X and Y and P and M. In JR.
Brannan (Ed.), Applications of Parallel Processing in Vision (86 ed.). New
York: Elsevier Science Publishers.
Sheinberg, D. L., & Logothetis, N. K. (1997). The role of temporal cortical areas in
perceptual organization. Proceedings of the National Academy of Sciences of
the United States of America, 94(7), 3408-3413.
Sheremata, S., & Chen, Y. (2004). Co-administration of atypical antipsychotics and
antidepressants disturbs contrast detection in schizophrenia. Schizophrenia
Research, 70(1), 81-89.
Shpiro, A., Curtu, R., Rinzel, J., & Rubin, N. (2007). Dynamical characteristics
common to neuronal competition models. Journal of Neurophysiology, Jan;
97(1):462-73.
Silver, H., & Goodman, C. (2008). Verbal as well as spatial working memory
predicts visuospatial processing in male schizophrenia patients.
Schizophrenia Research, 101(1-3), 210-217.

References
Silver, M. A., & Logothetis, N. K. (2007). Temporal frequency and contrast tagging
bias the type of competition in interocular switch rivalry. Vision Research.
Feb; 47(4):532-43.
Silverstein, S. M., Hatashita-Wong, M., Schenkel, L. S., Wilkniss, S., Kovács, I.,
Fehér, A., Smith, T., Goicochea, C., Uhlhaas, P., Carpiniello, K., & Savitz, A.
(2006). Reduced top-down influences in contour detection in schizophrenia.
Cognitive Neuropsychiatry, 11(2), 112-132.
Simard, M., van Reekum, R., & Myran, D. (2003). Visuospatial impairment in
dementia with Lewy bodies and Alzheimer's disease: a process analysis
approach. International Journal of Geriatric Psychiatry, 18(5), 387-391.
Ska, B., Poissant, A., & Joanette, Y. (1990). Line orientation judgment in normal
elderly and subjects with dementia of Alzheimer's type. Journal of Clinical
and Experimental Neuropsychology, 12(5), 695-702.
Skottun, B. C. (2004). On the use of red stimuli to isolate magnocellular responses in
psychophysical experiments: a perspective. Visual Neuroscience 21(1), 63-
68.
Skottun, B. C., & Skoyles, J. R. (2007). Contrast sensitivity and magnocellular
functioning in schizophrenia. Vision Research, 47(23), 2923-2933.
Skottun, B. C., & Skoyles, J. R. (2011). On identifying magnocellular and
parvocellular responses on the basis of contrast-repsonse functions.
Schizophrenia Bulletin, 37(1), 23-26.
Slaghuis, W. L. (1998). Contrast sensitivity for stationary and drifting spatial
frequency gratings in positive- and negative-symptom schizophrenia. Journal
of Abnormal Psychology 107(1), 49-62.

References 285
Slaghuis, W. L. (2004). Spatio-temporal luminance contrast sensitivity and visual
backward masking in schizophrenia. Experimental Brain Research, 156(2),
196-211.
Slaghuis, W. L., & Bakker, V. J. (1995). Forward and backward visual masking of
contour by light in positive- and negative-symptom schizophrenia. Journal of
Abnormal Psychology, 104(1), 41-54.
Slaghuis, W. L., & Bishop, A. M. (2001). Luminance flicker sensitivity in positive-
and negative-symptom schizophrenia. Experimental Brain Research, 138(1),
88-99.
Slaghuis, W. L., & Curran, C. E. (1999). Spatial frequency masking in positive- and
negative-symptom schizophrenia. Journal of Abnormal Psychology, 108(1),
42-50.
Slaghuis, W. L., & Thompson, A. K. (2003). The effect of peripheral visual motion
on focal contrast sensitivity in positive- and negative-symptom schizophrenia.
Neuropsychologia, 41(8), 968-980.
Small, G. W., Noble, E. P., Matsuyama, S. S., Jarvik, L. F., Komo, S., Kaplan, A.,
Ritchie, T., Pritchard, M. L., Saunders, A. M., Conneally, P. M., Roses, A.
D., Haines, J. L., & Pericak-Vance, M. A. (1997). D2 dopamine receptor A1
allele in Alzheimer disease and aging. Archives of Neurology, 54(3), 281-285.
Sobel, K. V., & Blake, R. (2003). Subjective contours and binocular rivalry
suppression. Vision Research, 43(14), 1533-1540.
Sohmiya, S., Sohmiya, K., & Sohmiya, T. (1998). Connection between
synchronization of oscillatory activities at early stages and a final stage in the
visual system. Perceptual and Motor Skills, 86(3 Pt 1), 1107-1116.
References
Solomon, C. M., Holzman, P. S., Levin, S., & Gale, H. J. (1987). The association
between eye-tracking dysfunctions and thought disorder in psychosis.
Archives of General Psychiatry, 44(1), 31-35.
Srinivasan, R., Russell, D. P., Edelman, G. M., & Tononi, G. (1999). Increased
synchronization of neuromagnetic responses during conscious perception.
The European Journal of Neuroscience, 19(13), 5435-5448.
Stephan, K. E., Friston, K. J., & Frith, C. D. (2009). Dysconnection in schizophrenia:
from abnormal synaptic plasticity to failures of self-monitoring.
Schizophrenia Bulletin, 35(3), 509-527.
Stollenwerk, L., & Bode, M. (2003). Lateral neural model of binocular rivalry.
Neural Computation, 15(12), 2863-2882.
Sugie, N. (1982). Neural models of brightness perception and retinal rivalry in
binocular vision. Biological Cybernetics, 43(1), 13-21.
Suzuki, A., Kondo, T., Mihara, K., Furukori, H., Nagashima, U., Ono, S., Otoni, K.,
& Kaneko, S. (2000). Association between Taq1 a dopamine D2 receptor
polymorphism and psychopathology of schizophrenia in Japanese patients.
Progress in Neuro-psychopharmacology & Biological Psychiatry, 24(7),
1105-1113.
Suzuki, A., Kondo, T., Otani, K., Mihara, K., Yasui-Furukori, N., Sano, A., Koshiro,
K., & Kaneko, S. (2001). Association of the TaqI A polymorphism of the
dopamine D(2) receptor gene with predisposition to neuroleptic malignant
syndrome. The American Journal of Psychiatry, 158(10), 1714-1716.
Suzuki, A., Mihara, K., Kondo, T., Tanaka, O., Nagashima, U., Otani, K., & Kaneko,
S. (2000). The relationship between dopamine D2 receptor polymorphism at
the Taq1 A locus and therapeutic response to nemonapride, a selective

References 287
dopamine antagonist, in schizophrenic patients. Pharmacogenetics, 10(4),
335-341.
Sweeney, J. A., Haas, G. L., Keilp, J. G., & Long, M. (1991). Evaluation of the
stability of neuropsychological functioning after acute episodes of
schizophrenia: one-year followup study. Psychiatry Research, 38(1), 63-76.
Switkes, E., Bradley, A., & De Valois, K. K. (1988). Contrast dependence and
mechanisms of masking interactions among chromatic and luminance
gratings. Journal of the Optical Society of America, 5(7), 1149-1162.
Synofzik, M., Thier, P., Leube, D. T., Schlotterbeck, P., & Lindner, A. (2010).
Misattributions of agency in schizophrenia are based on imprecise predictions
about the sensory consequences of one's actions. Brain, 133(Pt 1), 262-271.
Tan, B. L. (2009). Profile of cognitive problems in schizophrenia and implications
for vocational functioning. Australian Occupational Therapy Journal, 56(4),
220-228.
Tarita-Nistor, L., Gonzalez, E. G., Markowitz, S. N., & Steinbach, M. J. (2006).
Binocular interactions in patients with age-related macular degeneration:
acuity summation and rivalry. Vision Research, 46(16), 2487-2498.
Tek, C., Gold, J., Blaxton, T., Wilk, C., McMahon, R. P., & Buchanan, R. W. (2002).
Visual perceptual and working memory impairments in schizophrenia.
Archives of General Psychiatry, 59(2), 146-153.
Thaker, G. K. (2008). Neurophysiological endophenotypes across bipolar and
schizophrenia psychosis. Schizophrenia Bulletin, 34(4), 760-773.
Thompson, D. A., & Drasdo, N. (1992). Colour, contrast and the visual evoked
potential. Ophthalmic & Physiological Optic, 12(2), 225-228.

References
Tomás, T., Fuentes, I., Roder, V & Ruiz, J.C. (2010). "Cognitive Rehabilitation
Programs in Schizophrenia: Current Status and Perspectives." International
Journal of Psychology and Psychological Therapy 10(2): 191-202.
Tomoda, H., Celesia, G. G., & Toleikis, S. C. (1991). Effect of spatial frequency on
simultaneous recorded steady-state pattern electroretinograms and visual
evoked potentials. Electroencephalography and Clinical Neurophysiology,
80(2), 81-88.
Tong, F. (2001). Competing Theories of Binocular Rivalry: A Possible Resolution.
Brain and Mind, 2(1), 55-83.
Tong, F. (2003). Primary visual cortex and visual awareness. Nat Rev Neurosci, 4(3),
219-229.
Tong, F., & Engel, S. A. (2001). Interocular rivalry revealed in the human cortical
blind-spot representation. Nature, 411(6834), 195-199.
Tong, F., Nakayama, K., Vaughan, J. T., & Kanwisher, N. (1998). Binocular rivalry
and visual awareness in human extrastriate cortex. Neuron, 21(4), 753-759.
Tononi, G., Srinivasan, R., Russell, D. P., & Edelman, G. M. (1998). Investigating
neural correlates of conscious perception by frequency-tagged neuromagnetic
responses. Proceedings of the National Academy of Sciences of the United
States of America, 95(6), 3198-3203.
Tootell, R. B., Reppas, J. B., Dale, A. M., Look, R. B., Sereno, M. I., Malach, R.,
Brady, T. J., & Rosen, B. R. (1995). Visual motion aftereffect in human
cortical area MT revealed by functional magnetic resonance imaging. Nature,
375(6527), 139-141.

References 289
Tost, H., Alam, T., & Meyer-Lindenberg, A. (2010). Dopamine and psychosis:
Theory, pathomechanisms and intermediate phenotypes. Neuroscience and
Biobehavioral Reviews, Apr; 34(5):689-700.
Trahan, D. E. (1998). Judgment of line orientation in patients with unilateral
cerebrovascular lesions. Assessment, 5(3), 227-235.
Tranel, D., Vianna, E., Manzel, K., Damasio, H., & Grabowski, T. (2009).
Neuroanatomical correlates of the Benton Facial Recognition Test and
Judgment of Line Orientation Test. Journal of Clinical and Experimental
Neuropsychology, 31(2), 219-233.
Treccani, B., Torri, T., & Cubelli, R. (2005). Is judgement of line orientation
selectively impaired in right brain damaged patients? Neuropsychologia,
43(4), 598-608.
Tsang, H. W., Leung, A. Y., Chung, R. C., Bell, M., & Cheung, W. M. (2010).
Review on vocational predictors: a systematic review of predictors of
vocational outcomes among individuals with schizophrenia: an update since
1998. Australian and New Zealand Journal Psychiatry, 44(6), 495-504.
Uhlhaas, P. J., Phillips, W. A., Mitchell, G., & Silverstein, S. M. (2006). Perceptual
grouping in disorganized schizophrenia. Psychiatry Research, 145(2-3), 105-
117.
Uhlhaas, P. J., Phillips, W. A., & Silverstein, S. M. (2005). The course and clinical
correlates of dysfunctions in visual perceptual organization in schizophrenia
during the remission of psychotic symptoms. Schizophrenia Research, 75(2-
3), 183-192.
Ukai, K., Ando, H., & Kuze, J. (2003). Binocular rivalry alternation rate declines
with age. Perceptual and Motor Skills, 97(2), 393-397.

References
Valle-Inclan, F., & Gallego, E. (2006). Chapter 13 Bilateral frontal leucotomy does
not alter perceptual alternation during binocular rivalry. Progress in Brain
Research, 155, 235-239.
Valle-Inclan, F., Hackley, S. A., de Labra, C., & Alvarez, A. (1999). Early visual
processing during binocular rivalry studied with visual evoked potentials.
Neuroreport, 10(1), 21-25.
van de Grind, W. A., van Hof, P., van der Smagt, M. J., & Verstraten, F. A. (2001).
Slow and fast visual motion channels have independent binocular-rivalry
stages. Proceedings of the Royal Society B: Biological Sciences, 268(1465),
437-443.
van Ee, R. (2005). Dynamics of perceptual bi-stability for stereoscopic slant rivalry
and a comparison with grating, house-face, and Necker cube rivalry. Vision
Research, 45(1), 29-40.
Van Ee, R., Noest, A. J., Brascamp, J. W., & van den Berg, A. V. (2006). Attentional
control over either of the two competing percepts of ambiguous stimuli
revealed by a two-parameter analysis: means do not make the difference.
Vision Research, 46(19), 3129-3141.
van Ee, R., van Dam, L. C., & Brouwer, G. J. (2005). Voluntary control and the
dynamics of perceptual bi-stability. Vision Research, 45(1), 41-55.
Veser, S., O'Shea, R. P., Schroger, E., Trujillo-Barreto, N. J., & Roeber, U. (2008).
Early correlates of visual awareness following orientation and colour rivalry.
Vision Research, 48(22), 2359-2369.
Vidyasagar, T. R. (1999). A neuronal model of attentional spotlight: parietal guiding
the temporal. Brain research Reviews, 30(1), 66-76.
References 291
Vohs, J. L., Hetrick, W. P., Kieffaber, P. D., Bodkins, M., Bismark, A., Shekhar, A.,
& O'Donnell, B. F. (2008). Visual event-related potentials in schizotypal
personality disorder and schizophrenia. Journal of Abnormal Psychology,
117(1), 119-131.
Vollenweider, F. X., Vollenweider-Scherpenhuyzen, M. F., Babler, A., Vogel, H., &
Hell, D. (1998). Psilocybin induces schizophrenia-like psychosis in humans
via a serotonin-2 agonist action. Neuroreport, 9(17), 3897-3902.
Vollenweider, F. X., Vontobel, P., Hell, D., & Leenders, K. L. (1999). 5-HT
modulation of dopamine release in basal ganglia in psilocybin-induced
psychosis in man-a PET study with [11C]raclopride.
Neuropsychopharmacology, 20(5), 424-433.
Voss, M., Moore, J., Hauser, M., Gallinat, J., Heinz, A., & Haggard, P. (2010)
Altered awareness of action in schizophrenia: a specific deficit in predicting
action consequences. Brain, 133(10), 3104-3112.
Wade, N. J. (1975). Monocular and binocular rivalry between contours. Perception,
4(1), 85-95.
Wade, N. J. (1976). On interocular transfer of the movement aftereffect in indivuals
with and without normal binocular vision. Perception, 5(1), 113-118.
Wade, N. J. (1994). A selective history of the study of visual motion aftereffects.
Perception, 23(10), 1111-1134.
Walker, P. (1978). Orientation-selective inhibition and binocular rivalry. Perception,
7(2), 207-214.
Walker, P., & Powell, D. J. (1979). The sensitivity of binocular rivalry to changes in
the nondominant stimulus. Vision Reserach, 19(3), 247-249.

References
Walker, P. (1975). Stochastic properties of binocular rivalry alternations. Perception
& Psychophysics, 18(6), 467-473.
Wandell, B. A. (1995). Foundations of vision. Sunderland, Mass: Sinauer Associates.
Weiss, K. M., Chapman, H. A., Strauss, M. E., & Gilmore, G. C. (1992). Visual
information decoding deficits in schizophrenia. Psychiatry Research, 44(3),
203-216.
White, K. D., Kuldau, J.M., Leonard, C.M., Maron, L., Bengston, M.A., Ricciuti, N.,
Marin, L., Mahoney, B., & Pettigrew, J. D. (2001). Binocular rivalry survives
high rates of dichoptic stimulus alternation in schizophrenia.(unpublished)
Whittle, P. (1965). Binocular rivalry and the contrast at contours. The Quarterly
Journal of Experimental Psychology. A, Human Experimental Psychology,
17(3), 217-226.
Wiesel, T. N., & Hubel, D. H. (1966). Spatial and chromatic interactions in the
lateral geniculate body of the rhesus monkey. Journal of Neurophysiology,
29(6), 1115-1156.
Wilson, H. R. (2003). Computational evidence for a rivalry hierarchy in vision.
Proceedings of the National Academy of Sciences of the United States of
America, 100(24), 14499-14503.
Wilson, H. R. (2005). Rivalry and Perceptual Oscillations: A Dynamical Synthesis.
In D. Alais & R. Blake (Eds.), Binocular Rivalry (pp. 317-336.). Cambridge,
Massachusetts: The MIT Press.
Witkovsky, P. (2004). Dopamine and retinal function. Documenta Ophthalmologica.
Advances in Ophthalmology, 108(1), 17-40.
Witkovsky, P., & Dearry, A., 1992. Functional roles of dopamine in the vertebrate
retina. Progress in Retinal Research 11, 247–292.
References 293
Wolfe, J. M. (1983a). Afterimages, binocular rivalry, and the temporal properties of
dominance and suppression. Perception, 12(4), 439-445.
Wolfe, J. M. (1983b). Influence of spatial frequency, luminance, and duration on
binocular rivalry and abnormal fusion of briefly presented dichoptic stimuli.
Perception, 12(4), 447-456.
Wolfe, J. M. (1986). Stereopsis and binocular rivalry. Clinical psychology Review
93(3), 269-282.
Wolford, G., Marchak, F., & Hughes, H. (1988). Practice effects in backward
masking. Journal of Experimental Psychology. Human Perception and
Performance, 14(1), 101-112.
Woodard, J. L., Benedict, R. H., Roberts, V. J., Goldstein, F. C., Kinner, K. M.,
Capruso, D. X., & Clark, A. N. (1996). Short-form alternatives to the
Judgment of Line Orientation Test. Journal of Clinical and Experimental
Neuropsychology, 18(6), 898-904.
Woodard, J. L., Benedict, R. H., Salthouse, T. A., Toth, J. P., Zgaljardic, D. J., &
Hancock, H. E. (1998). Normative data for equivalent, parallel forms of the
Judgment of Line Orientation Test. Journal of Clinical and Experimental
Neuropsychology, 20(4), 457-462.
Woods, S. W. (2003). Chlorpromazine equivalent doses for the newer atypical
antipsychotics. The Journal of Clinical Psychiatry, 64(6), 663-667.
Wright, P., Nolan, N.J., Mahoney, B.M., White, K. D., Kuldau, J.M., & Leonard,
C.M. (2003, Mar 29 - Apr 2 2003). Binocular Rivalry is Slower in First-
Degree Relatives of Schizophrenics. Paper presented at the International
Congress on Schizophrenia Research, Colorado Springs.

References
Wynn, J. K., Lee, J., Horan, W. P., & Green, M. F. (2008). Using event related
potentials to explore stages of facial affect recognition deficits in
schizophrenia. Schizophrenia Bulletin, 34(4), 679-687.
Wynn, J. K., Light, G. A., Breitmeyer, B., Nuechterlein, K. H., & Green, M. F.
(2005). Event-related gamma activity in schizophrenia patients during a
visual backward-masking task. The American Journal of Psychiatry, 162(12),
2330-2336.
Yang, E., Blake, R., & Park, S. (2007). Emotional binocular rivalry in
schizophrenia. Paper presented at the International Congress on
Schizophrenia Research.
Yatham, L. N., Goldstein, J. M., Vieta, E., Bowden, C. L., Grunze, H., Post, R. M.,
Suppes, T., & Calabrese, J. R. (2005). Atypical antipsychotics in bipolar
depression: potential mechanisms of action. The Journal of Clinical
Psychiatry, 66 Suppl 5, 40-48.
Yeap, S., Kelly, S. P., Sehatpour, P., Magno, E., Garavan, H., Thakore, J. H., &
Foxe, J. J. (2008). Visual sensory processing deficits in Schizophrenia and
their relationship to disease state. European Archives of Psychiatry and
Clinical Neuroscience, 258(5), 305-316.
Yilmaz, H., Erkin, E. F., Mavioglu, H., & Sungurtekin, U. (1998). Changes in pattern
reversal evoked potentials during menstrual cycle. International
Ophthalmology, 22(1), 27-30.
Young, R. M., Lawford, B. R., Barnes, M., Burton, S. C., Ritchie, T., Ward, W. K.,
& Noble, E. P. (2004). Prolactin levels in antipsychotic treatment of patients
with schizophrenia carrying the DRD2*A1 allele. The British Journal of
Psychiatry, 185, 147-151.
References 295
Young, R. M., Lawford, B. R., Nutting, A., & Noble, E. P. (2004). Advances in
molecular genetics and the prevention and treatment of substance misuse:
Implications of association studies of the A1 allele of the D2 dopamine
receptor gene. Addictive Behaviors, 29(7), 1275-1294.
Yu, C., & Levi, D. M. (1997). Cortical components of the Westheimer function.
Vision Research, 37(18), 2535-2544.
Zahodne, L. B., & Fernandez, H. H. (2008). Pathophysiology and treatment of
psychosis in Parkinson's disease: a review. Drugs & Aging, 25(8), 665-682.
Zhou, Y. H., Gao, J. B., White, K. D., Merk, I., & Yao, K. (2004). Perceptual
dominance time distributions in multistable visual perception. Biological
Cybernetics, 90(4), 256-263.
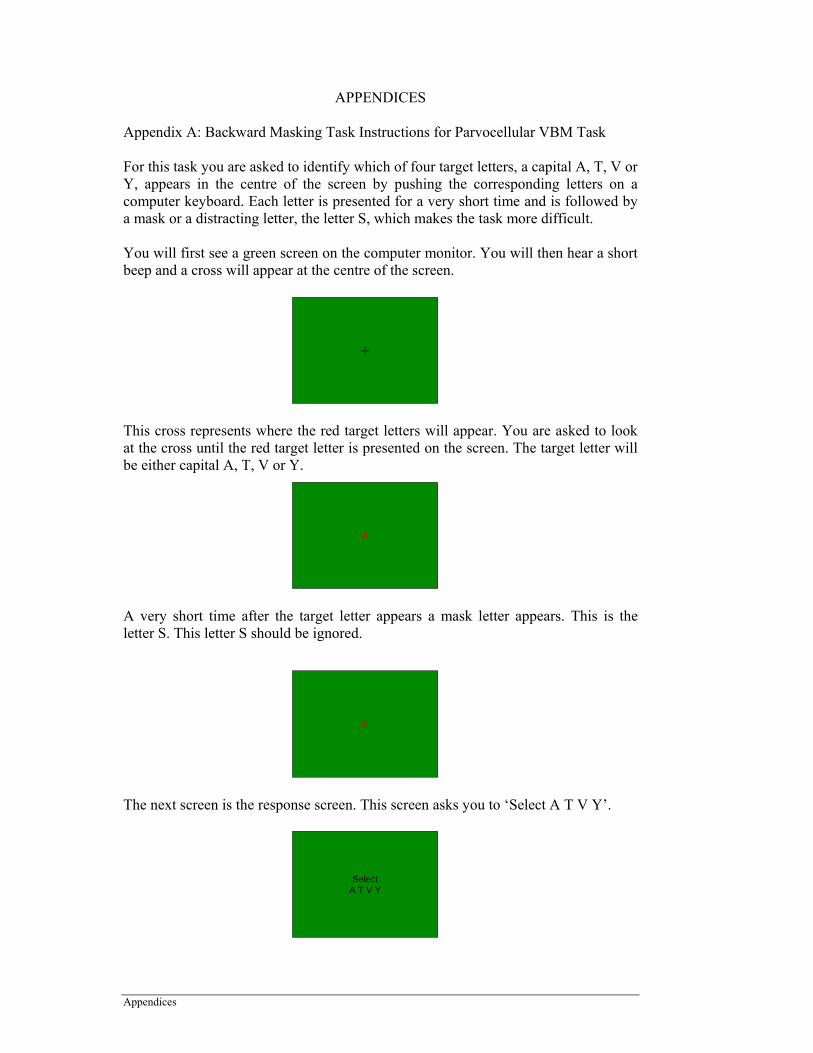
Appendices
APPENDICES
Appendix A: Backward Masking Task Instructions for Parvocellular VBM Task
For this task you are asked to identify which of four target letters, a capital A, T, V or Y, appears in the centre of the screen by pushing the corresponding letters on a computer keyboard. Each letter is presented for a very short time and is followed by a mask or a distracting letter, the letter S, which makes the task more difficult. You will first see a green screen on the computer monitor. You will then hear a short beep and a cross will appear at the centre of the screen.
This cross represents where the red target letters will appear. You are asked to look at the cross until the red target letter is presented on the screen. The target letter will be either capital A, T, V or Y.
A very short time after the target letter appears a mask letter appears. This is the letter S. This letter S should be ignored.
The next screen is the response screen. This screen asks you to ‘Select A T V Y’.
+
A
S
SelectA T V Y

Appendices 297
When this appears on the screen you are asked to record which letter (A T V or Y) appeared before the S, by pushing the corresponding letter on the computer keyboard. If you are unsure you are asked to guess. The task is designed so that most people get some wrong. Once you have selected your response on the computer keyboard, a blank green screen will appear and then the process is repeated. First you will hear a beep, then the cross will appear in the centre of the screen, then the target letter (A T V Y) will appear in the centre of the screen followed by the mask (the letter S) in the same location and then the screen that asks you to select your response appears. The process is repeated for 64 trials.

Appendices
Appendix B: Backward Masking Task Instructions for Magnocellular Visual Backward Masking (VBM) Task For this task a letter (A, T, V or Y) can appear in one of four locations, up, down, left or right. You are asked to record where you think the letters appear on the screen by pushing the arrow keys on a computer keyboard. Each letter is presented for a very short time and is followed by a mask, which consists of the letter S presented in all four possible locations which makes the task more difficult. You will first see a grey screen on the computer monitor. You will then hear a short beep and a cross will appear at the centre of the screen.
This cross marks the centre of the screen. You are asked to look at the cross until the grey target letters either to the right or to the left, or up or down of the centre of the screen. The target letter will be either capital A, T, V or Y.
A very short time after the target letter appears a mask appears, which consists of four letter S’s appearing in all four possible locations. These four S’s should be ignored.
The next screen is the response screen. This screen has four arrows on it representing the four possible positions of the target letter.
+
A
S S
S
S
Appendices 299
When this appears on the screen you are asked to record where the target letter appeared, by pushing the arrow keys on the computer keyboard. If you are unsure you are asked to guess. The task is designed so that most people get some wrong. Once you have selected your response on the computer keyboard, a blank grey screen will appear and the process is repeated for 64 trials. First you will hear a beep, then the cross will appear in the centre of the screen, then the target letter (A T V Y) will appear in one of four locations on the screen (up, down, left or right) followed by the mask (the four letter S’s, one in each of the four possible locations) and then the screen that asks you to select your response appears. Once you have responded by pushing the arrow keys the process is repeated.

Appendices
Appendix C: Effect of Schizophrenia Characteristics on Visual Backward Masking (VBM) Tasks Table A: Dose level had a significant effect on visual backward masking performance at 27msec inter-stimulus interval, and DSM-IV diagnosis had significant effects at 27 and 53 msec Dose levels (CPZE) Magnocellular VBM Task
<425mg CPZE
(n=4) >425mg CPZE
(n=10) M SD M SD U Z p ISI 27msec 4.5 3.42 8.7 2.63 6 -2.030 .042* ISI 53msec 6.3 5.19 9.4 2.95 9 -1.577 .115 ISI 107msec 6.8 3.59 10.0 3.74 9 -1.559 .119 ISI 213msec 7.3 7.09 12.0 4.14 11 -1.283 .200 Parvocellular VBM Task
<425mg CPZE
(n=4) >425mg CPZE
(n=10) M SD M SD U Z p ISI 27msec 8.3 2.63 7.1 2.73 15 -0.713 .476 ISI 53msec 7.0 4.24 9.2 2.94 15 -0.716 .474 ISI 107msec 8.0 5.94 10.6 3.53 14 -0.855 .392 ISI 213msec 11.0 5.77 12.7 2.58 19 -0.143 .887
DSM-IV diagnosis – SCID Magnocellular VBM Task
Paranoid
(n=5)
Undifferentiated
(n=9) M SD M SD U Z p ISI 27msec 10.4 2.61 5.9 2.62 3 -2.665 .008* ISI 53msec 11.4 3.65 6.9 2.93 7 -2.094 .036* ISI 107msec 11.0 4.00 8.0 3.57 11.5 -1.470 .142 ISI 213msec 13.8 2.59 8.9 5.75 10.5 -1.612 .107 Parvocellular VBM Task
Paranoid
(n=5)
Undifferentiated
(n=9) M SD M SD U Z p ISI 27msec 7.8 4.15 7.2 1.64 22 -0.067 .946 ISI 53msec 9.0 3.61 8.3 3.39 21.5 -0.135 .893 ISI 107msec 10.8 4.09 9.3 4.53 17 -0.739 .460 ISI 213msec 13.8 1.64 11.3 4.15 16 -0.874 .382
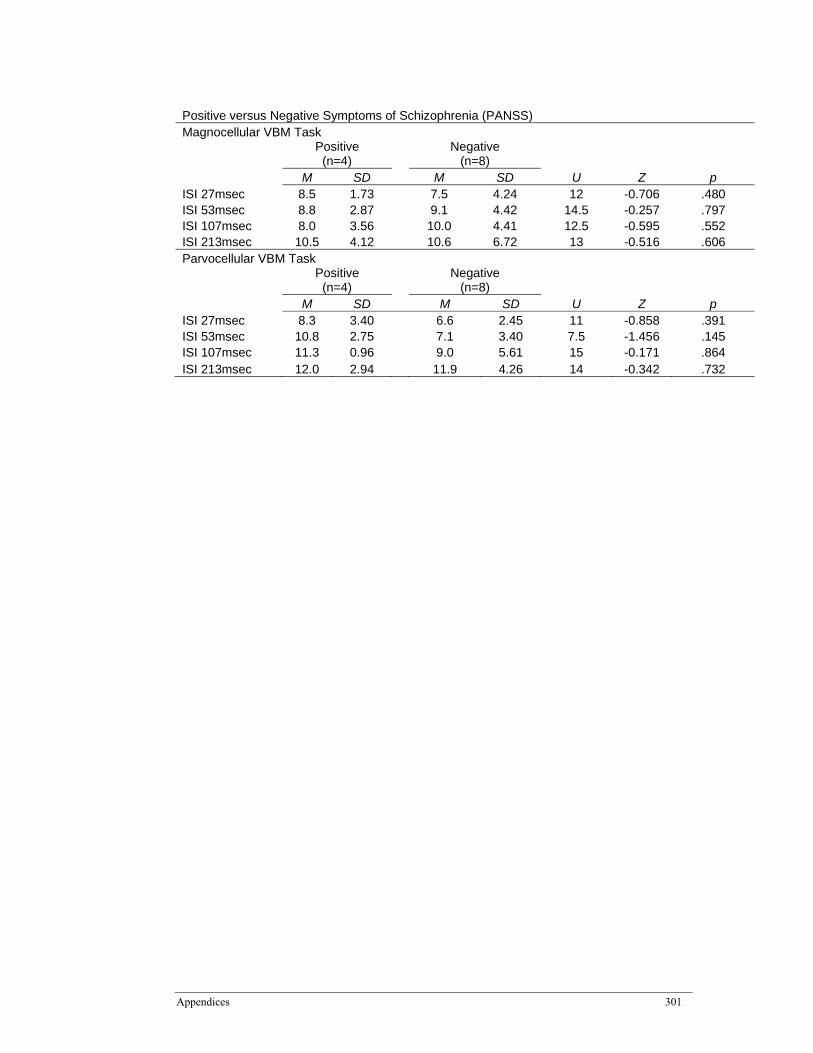
Appendices 301
Positive versus Negative Symptoms of Schizophrenia (PANSS) Magnocellular VBM Task
Positive
(n=4) Negative
(n=8) M SD M SD U Z p ISI 27msec 8.5 1.73 7.5 4.24 12 -0.706 .480 ISI 53msec 8.8 2.87 9.1 4.42 14.5 -0.257 .797 ISI 107msec 8.0 3.56 10.0 4.41 12.5 -0.595 .552 ISI 213msec 10.5 4.12 10.6 6.72 13 -0.516 .606 Parvocellular VBM Task
Positive
(n=4) Negative
(n=8) M SD M SD U Z p ISI 27msec 8.3 3.40 6.6 2.45 11 -0.858 .391 ISI 53msec 10.8 2.75 7.1 3.40 7.5 -1.456 .145 ISI 107msec 11.3 0.96 9.0 5.61 15 -0.171 .864 ISI 213msec 12.0 2.94 11.9 4.26 14 -0.342 .732

Appendices
Appendix D: Score Sheet - Benton’s Judgment of Line Orientation (BJLO) Date ………………………. Participant
Type of Line Error - Ska et al (1990) Benton (1978) Line 1 Line 2 Correct? Line 1 Line 2
Figure 1 Y N V H HV N R 6 11
Figure 2 Y N H QO QO1 QO2 IQOH R R 9 11
Figure 3 Y N QO1 QO2 QO3 QO4 IQO L R 4 7
Figure 4 Y N H QO QO1 QO2 IQOH L R 1 7
Figure 5 Y N H QO QO1 QO2 IQOH L R 5 11
Figure 6 Y N QO1 QO2 QO3 QO4 IQO IQO L R 2 8
Figure 7 Y N H QO QO1 QO2 IQOH L L 1 3
Figure 8 Y N QO1 QO2 QO3 QO4 IQO IQO L R 5 8
Figure 9 Y N QO1 QO2 QO3 QO4 IQO IQO L R 3 10
Figure 10 Y N H QO QO1 QO2 IQOH R R 7 11
Figure 11 Y N V Q0 QO1 QO2 IQOV L N 3 6
Figure 12 Y N QO1 QO2 QO3 QO4 IQO IQO L R 4 10
Figure 13 Y N V Q0 QO1 QO2 IQOV N R 6 8
Figure 14 Y N Q0 QO1 QO2 QO3 QO4 R R 8 10
Figure 15 Y N QO1 QO2 QO3 QO4 IQO IQO L R 2 9
Figure 16 Y N QO1 QO2 QO3 QO4 IQO IQO L R 3 8
Figure 17 Y N Q0 QO1 QO2 QO3 QO4 L L 4 5
Figure 18 Y N H QO QO1 QO2 IQOH L L 1 5
Figure 19 Y N V Q0 QO1 QO2 IQOV N R 6 10
Figure 20 Y N H QO QO1 QO2 IQOH L R 2 11
Figure 21 Y N H QO QO1 QO2 IQOH L R 1 10
Figure 22 Y N Q0 QO1 QO2 QO3 QO4 L L 2 5
Figure 23 Y N V H HV L N 1 6
Figure 24 Y N QO1 QO2 QO3 QO4 IQO IQO L R 2 7
Figure 25 Y N Q0 QO1 QO2 QO3 QO4 L R 4 9
Figure 26 Y N QO1 QO2 QO3 QO4 IQO IQO L R 7 10
Figure 27 Y N V Q0 QO1 QO2 IQOV L N 4 6
Figure 28 Y N Q0 QO1 QO2 QO3 QO4 R R 8 9
Figure 29 Y N Q0 QO1 QO2 QO3 QO4 L L 2 3
Figure 30 Y N Q0 QO1 QO2 QO3 QO4 R R 8 9
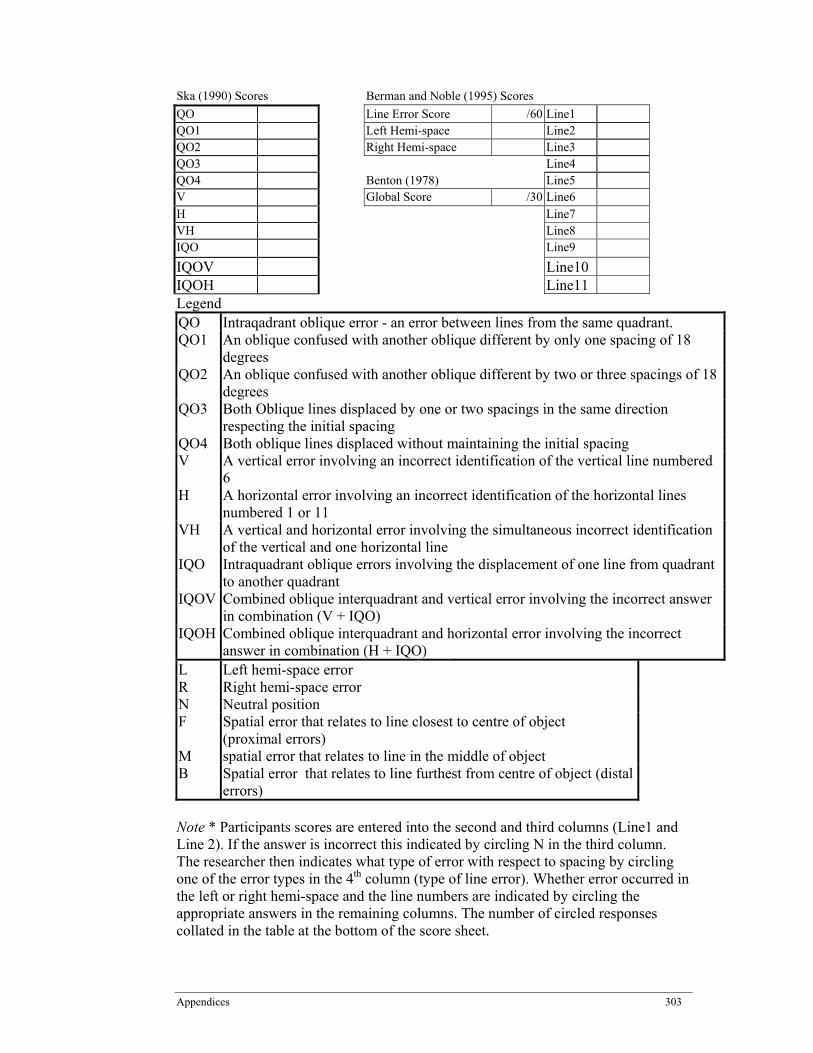
Appendices 303
Ska (1990) Scores Berman and Noble (1995) Scores
QO Line Error Score /60 Line1 QO1 Left Hemi-space Line2 QO2 Right Hemi-space Line3 QO3 Line4 QO4 Benton (1978) Line5 V Global Score /30 Line6 H Line7 VH Line8 IQO Line9
IQOV Line10 IQOH Line11 Legend QO Intraqadrant oblique error - an error between lines from the same quadrant. QO1 An oblique confused with another oblique different by only one spacing of 18
degrees QO2 An oblique confused with another oblique different by two or three spacings of 18
degrees QO3 Both Oblique lines displaced by one or two spacings in the same direction
respecting the initial spacing QO4 Both oblique lines displaced without maintaining the initial spacing V A vertical error involving an incorrect identification of the vertical line numbered
6 H A horizontal error involving an incorrect identification of the horizontal lines
numbered 1 or 11 VH A vertical and horizontal error involving the simultaneous incorrect identification
of the vertical and one horizontal line IQO Intraquadrant oblique errors involving the displacement of one line from quadrant
to another quadrant IQOV Combined oblique interquadrant and vertical error involving the incorrect answer
in combination (V + IQO) IQOH Combined oblique interquadrant and horizontal error involving the incorrect
answer in combination (H + IQO) L Left hemi-space error R Right hemi-space error N Neutral position F Spatial error that relates to line closest to centre of object
(proximal errors)
M spatial error that relates to line in the middle of object B Spatial error that relates to line furthest from centre of object (distal
errors)
Note * Participants scores are entered into the second and third columns (Line1 and Line 2). If the answer is incorrect this indicated by circling N in the third column. The researcher then indicates what type of error with respect to spacing by circling one of the error types in the 4th column (type of line error). Whether error occurred in the left or right hemi-space and the line numbers are indicated by circling the appropriate answers in the remaining columns. The number of circled responses collated in the table at the bottom of the score sheet.

Appendices
Appendix E. Benton Judgment of Line Orientation (BJLO) Performance Scores in Participants with Schizophrenia and Healthy Controls by A1 Allele of the DRD2 Receptor Gene.
Schizophrenia
A1 (n=6) A2 (n=12)
M SD M SD χ2 p
Benton (30) 19.0 7.9 19.7 4.9 15 .182
Berman (60) 45.2 11.9 47.1 8.7 18 .158
Left hemifield 6.5 6.1 5.7 2.9 15 .059
Right hemifield 8.2 5.7 6.9 4.9 12.375 .336
Line1 0.7 1.6 0.0 0.0 2.118 .146
Line 2 1.2 1.6 1.0 1.7 3.15 .533
Line 3 1.7 1.9 1.9 1.3 3.15 .533
Line 4 1.7 1.4 2.2 0.9 6.171 .187
Line 5 0.8 1.2 0.5 0.5 2.25 .325
Line 6 0.2 0.4 0.2 0.6 2.531 .282
Line 7 1.7 1.6 0.5 1.0 3.886 .422
Line 8 2.3 1.5 3.1 2.2 6 .423
Line 9 2.0 1.7 2.2 1.6 8.625 .125
Line 10 2.0 1.7 1.0 2.0 13.95 .016*
Line 11 0.7 1.2 0.3 0.5 2.163 .339
QO1 5.5 3.4 7.2 2.4 12.75 .174
QO2 1.0 1.3 0.8 1.5 2.932 .569
QO3 2.0 2.4 1.1 1.4 5.571 .35
QO4 1.5 1.5 0.7 2.0 8.25 .083
V 0.0 0.0 0.0 0.0 0
H 0.5 0.8 0.2 0.4 2.143 .343
VH 0.0 0.0 0.0 0.0 0
IQO 0.2 0.4 0.6 2.0 2.531 .282
IQOV 0.0 0.0 0.2 0.6 0.529 .467
IQOH 0.3 0.8 0.0 0.0 2.118 .146
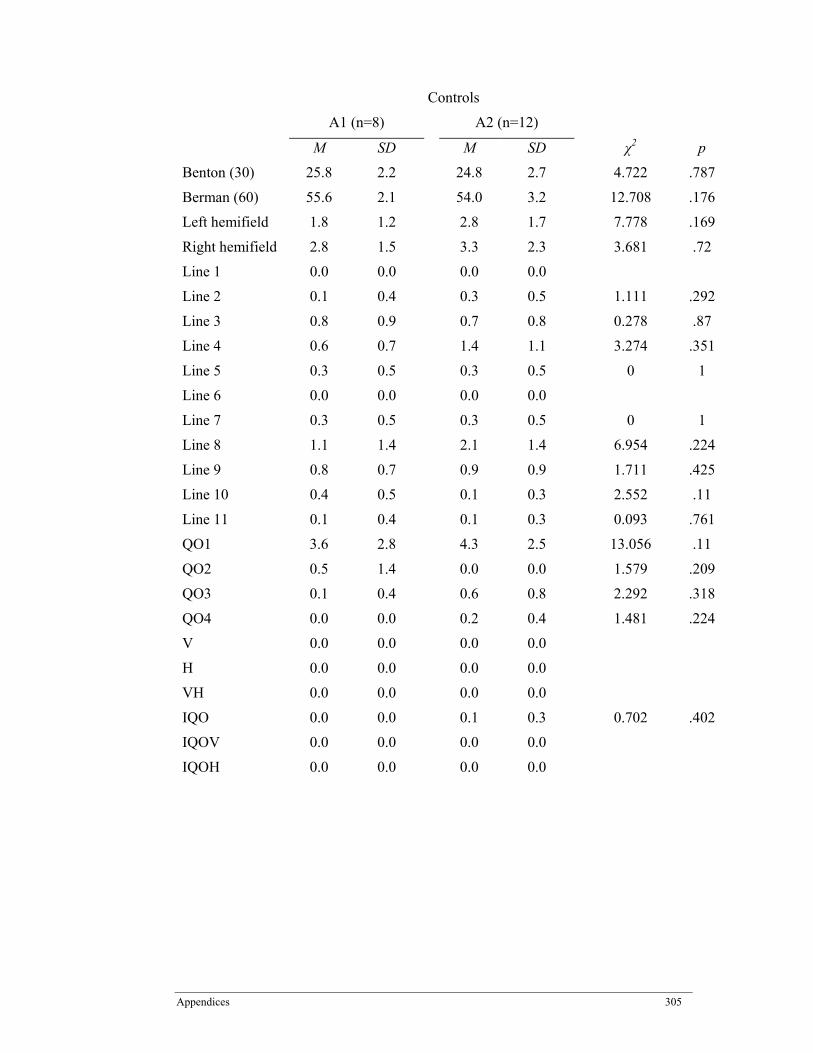
Appendices 305
Controls
A1 (n=8) A2 (n=12)
M SD M SD χ2 p
Benton (30) 25.8 2.2 24.8 2.7 4.722 .787
Berman (60) 55.6 2.1 54.0 3.2 12.708 .176
Left hemifield 1.8 1.2 2.8 1.7 7.778 .169
Right hemifield 2.8 1.5 3.3 2.3 3.681 .72
Line 1 0.0 0.0 0.0 0.0
Line 2 0.1 0.4 0.3 0.5 1.111 .292
Line 3 0.8 0.9 0.7 0.8 0.278 .87
Line 4 0.6 0.7 1.4 1.1 3.274 .351
Line 5 0.3 0.5 0.3 0.5 0 1
Line 6 0.0 0.0 0.0 0.0
Line 7 0.3 0.5 0.3 0.5 0 1
Line 8 1.1 1.4 2.1 1.4 6.954 .224
Line 9 0.8 0.7 0.9 0.9 1.711 .425
Line 10 0.4 0.5 0.1 0.3 2.552 .11
Line 11 0.1 0.4 0.1 0.3 0.093 .761
QO1 3.6 2.8 4.3 2.5 13.056 .11
QO2 0.5 1.4 0.0 0.0 1.579 .209
QO3 0.1 0.4 0.6 0.8 2.292 .318
QO4 0.0 0.0 0.2 0.4 1.481 .224
V 0.0 0.0 0.0 0.0
H 0.0 0.0 0.0 0.0
VH 0.0 0.0 0.0 0.0
IQO 0.0 0.0 0.1 0.3 0.702 .402
IQOV 0.0 0.0 0.0 0.0
IQOH 0.0 0.0 0.0 0.0

Appendices
All Subjects
A1 (n=14) A2 (n=24)
M SD M SD χ2 p
Benton (30) 22.9 6.2 22.3 4.7 15.939 .386
Berman (60) 51.1 9.2 50.5 7.3 28.686 .071
Left hemifield 3.8 4.6 4.2 2.8 15.652 .11
Right hemifield 5.1 4.6 5.1 4.2 8.705 .795
Line 1 0.3 1.1 0.0 0.0 1.761 .185
Line 2 0.6 1.2 0.7 1.3 3.906 .419
Line 3 1.1 1.4 1.3 1.2 2.276 .685
Line 4 1.1 1.1 1.8 1.1 5 .287
Line 5 0.5 0.9 0.4 0.5 1.925 .382
Line 6 0.1 0.3 0.1 0.4 2.306 .316
Line 7 0.9 1.3 0.4 0.8 2.533 .639
Line 8 1.6 1.5 2.6 1.8 4.429 .619
Line 9 1.3 1.3 1.5 1.4 5.149 .398
Line 10 1.1 1.4 0.5 1.4 14.583 .012*
Line 11 0.4 0.8 0.2 0.4 1.771 .413
QO1 4.4 3.1 5.8 2.8 22.385 .022*
QO2 0.7 1.3 0.4 1.1 4.553 .505
QO3 0.9 1.8 0.4 1.4 6.873 .23
QO4 0.6 1.2 0.0 0.0 6.126 .19
V 0.0 0.0 0.0 0.0
H 0.2 0.6 0.1 0.3 1.765 .414
VH 0.0 0.0 0.0 0.0
IQO 0.1 0.3 0.3 1.4 0.734 .693
IQOV 0.0 0.0 0.1 0.4 0.599 .439
IQOH 0.1 0.5 0.0 0.0 1.761 .185