karal clay in the far north cameroon: study on behavioural floor structures
TRANSCRIPT

International Journal of Engineering Research and Development
e-ISSN: 2278-067X, p-ISSN: 2278-800X, www.ijerd.com
Volume 10, Issue 11 (November 2014), PP.29-40
29
Karal Clay in the Far North Cameroon: Study on Behavioural
Floor Structures
E. Ngale Haulin1, F. Tchangnwa Nya
1,2,* and B. Touogam Touolak
1
1 Department of Materiel Processing, Architecture and Habitat, Higher Institute of the Sahel
2Department of physics, Faculty of Sciences, University of Maroua.
*Corresponding author: [email protected]
Abstract:- The north is known for its scorching heat and swelling clay which in the presence of water,
dramatical increase in water volume and by drying or even to crack [2] [5]. Many authors have addressed the
problems posed by this type of ground vis-à-vis the construction and especially the buildings. What exact type
of transport infrastructure can be built on these soils? It is to answer this question that we focus our research on
Karal clay, the main constituent of soil in the region of Far Northern Cameroon. Over 21,489 km of roads in
Cameroon in charge of the state, nearly 44.5% are in poor condition. The Far North Region of Cameroon is one
with the longest straight road in poor condition. In about 2374 km of road, only 1% is in good condition, 20% in
fair condition and 79 in poor condition [3] [8]. The damage seen on the N-1 Kousséri Maroua road in the region
of the Far North is related to a combination of stresses: it supports the traffic, the weather, the layer thickness
and the quality of materials that constitute it. All these stresses are associated in one way or another with the
clay soil blowing up known for its instability to participate in the degradation of these roads [3] [6] [13]. The
primary mission of this scientific work is to provide necessary information and capital on Karal clay,
mineralogy, and its behaviour with respect to pavement structures in the Sahel. However, laboratory studies on
Karal clay, allowed better assessment of its physical, chemical and mineralogical characteristics. Armed with
these scientific findings it allow us to better understand the Karal clay and its behaviour on the ground in the
Sahel region, we have developed strategies to increase the profitability of road investments on swelling clay
soil. To achieve the expected results, we submitted samples of Karal clay testing of physical-chemical-
mineralogical characterisation laboratory. It is in particular, the determination of the water content and organic
matter, the complete particle size analysis, determination of Atterberg limits, Proctor changed, testing
Californian Bearing Ratio of the oedometer test, the shear test straight to the box Casagrande, and finally the X-
ray diffraction
Keywords:- Karal Clay - Swelling Clay Soil - Geotechnical and Mineralogy Clay - Sahelian Zone.
1. INTRODUCTION The State of Cameroon has central goal of being an emerging country by 2035. To achieve this, we see
that the program since 2013 in the Ministry of Public Works is essentially built around communication channels
in general and more particularly road infrastructure, essential sector for the socio-cultural and economic
development of a country. This is fully in line with this quote after the World Summit on the road which was
held in Durban in 2003 "The road development through the development of the road" [1] [2] [3].
Around the Far North Cameroon is bordered to the North and east by the Republic of Chad, to the west by the
Federal Republic of Nigeria, and to the south by the north Cameroon. The axis-Kousséri Maroua is the main
communication channel and the shortest, linking Cameroon and Chad put off the air transport. This area is
subject to climatic variability (recurrent droughts and indigence rainfall) and soil meet there is mostly clay
commonly called 'Karal'. This soil is known for its instability (when the water content increases, its volume also
increase and when the water content decreases its volume does the same) making it very vulnerable structures
that support and causes premature deterioration of the pavement structures. This is one of the reasons why we
are interested in specific Karal clay, a major constituent of the soil of the road Maroua-Kousséri [3] [5] [8]. This
study also measures the impact due to the instability of swelling clay soil on pavement structures, in the case of
the road Maroua-Kousséri.
II. LOCATION OF THE STUDY AREA Created by Presidential Decree No. 83/392 of 22 August 1983 following the breakup of the former
province of Northern three provinces (Adamawa, North, and Far North) and Presidential Decree 2008 amending
appellation province in the region, the region in the Far North is one of the least equipped transport
infrastructure areas and soil is not conducive to its isolation. Yet this is an area that has many diverse assets be it

Karal Clay in the Far North Cameroon: Study on Behavioural Floor Structures
30
on the physical, social, cultural and economic need to return. Around the Far North extends over an area of
34,263 square kilometers, and has our six days (06) departments and 47 municipalities [2] [3].
Figure 1: Far North Cameroon map: Situation, lines of communication, administrative,
Tourism, parks and reserves
Source: Road Master Plan of Cameroon: Executive summary. Yaoundé, Centre, Cameroon
III. SYSTEM CLAY SOIL AND WATER-SWELLING CLAY SOIL 1.1. THE WATER IN CLAY SOIL
Clay soil as any soil is a mixture of three components namely: solid, liquid and gas. We are interested
in this subtitle to the liquid portion contained in this soil. Water exists in several forms in clay minerals. In order
to understand the phenomenon of swelling clay, we present the different types of water that are directly or
indirectly linked to this phenomenon [4] [10] [11] [12] [13]:
1.1.1. FREE WATER
By definition, free water in the soil is water that has the ability to move in the ground without any
constraint. It is also found in clay. It is completely evaporated when the soil sample is placed in an oven at a
constant temperature of 105°C.
1.1.2. CAPILLARY WATER
This water is retained in a meniscus shape in the vicinity of contact points between the particles by
capillary forces in clay unsaturated, creating between the grains of the attractive forces. Thus, the capillary flow
of water produced by a suction gradient across pores and results in generalised Darcy's law.
1.1.3. BOUND OR ADSORBED WATER
Clay soil are also characterised by the presence around each particle with a layer of water to the
different properties of the free water (it has the properties of a fluid less viscous and finally move towards the
properties of normal water border, water-free, water-adsorbed with equal to that of the open water final density):
it is adsorbed or bound water.
1.2. CLAY-WATER INTERACTION
In clay, the seats of different reactions and interaction mechanisms that are established in the
interfolliaire space (or in the vicinity of the outer surface of a particle) between particles and water are also
witnessing the isomorphic substitution, some of the cations in octahedral structure between the sheets. These
mechanisms work differently depending on whether or in the presence of one or clay, because of bonds between
their atoms.
1.3. SWELLING CLAY
In swelling clay soil, changes in water content are the main causes that trigger the instability of these
soils

Karal Clay in the Far North Cameroon: Study on Behavioural Floor Structures
31
1.3.1. CAUSES SWELLING
And swelling clay compaction are phenomena which occur once there is fluctuation in the presence of
stress in water-swellable clay. The change in water content in a soil may have several origins. The main cause of
the increase in water content is the change in groundwater level, which varies with seasonal fluctuations in
natural groundwater regime. However, it is more variable due to the implementation of agricultural, hydro and
construction work of development planning, implementing drainage, pipes, and other technical work that alter
food groundwater, the flatness of the ground, the water permeability and the aeration zone [4] [5].
1.3.2. KINEMATICS OF SWELLING
Inspired by the literature review on the swelling clay soil, the kinetics of swelling clay is defined as a
parameter that is a function of the deformation and time. Because of the very low permeability clay, the swelling
rate is slow. The kinetics of swelling clay soil depends on the nature of clay, their water status and condition of
loading [9] [10] [11].
IV. PHYSICAL, CHEMICAL AND MINERALOGICAL TESTS KARAL CLAY:
RESULTS AND DISCUSSIONS 1.4. STRAIGHT SHEAR TEST (UU) IN THE BOX CASAGRANDE (NF P94-071-1)
Soil resistance is an absolutely necessary criterion that he should be read in the context of earthworks,
embankments, foundations, retaining structures; this in order to solve the problems of soil stability. The
determination of this resistance depends on several tests, including triaxial, the simple compression test and
direct shear tests. We will use it to determine the short-term characteristics of our sample. It will also determine
the total stresses.
1.4.1. SCOPE AND PURPOSE
The shear tests straight to the box, are carried out on all types of natural soil, reconstituted or artificial,
the maximum grain size is 5 mm for trials in the box 60mm. The test provides strength parameters, straight
shear materials tested, it is the cohesion C., bar and angle of internal friction υ, in degrees. These two
parameters are used to calculate stability in soil mechanics.
1.4.2. PRINCIPLE OF THE TEST
The test is performed on a sample of disturbed soil or not placed in a shear box consisting of two
independent half-boxes. The parting plane of the two half-boxes is a sliding plane corresponding to the plane of
the shear specimen. It consists in applying to the upper face of the specimen a vertical load (N) maintained
constant during the entire duration of the test. It is also to produce shear specimen in the horizontal plane
according to the sliding of the two half-boxes one with respect to another, by imposing a relative movement at a
constant speed of 2 mm / min. And finally, it is to measure the horizontal shear stress (τ) corresponding.
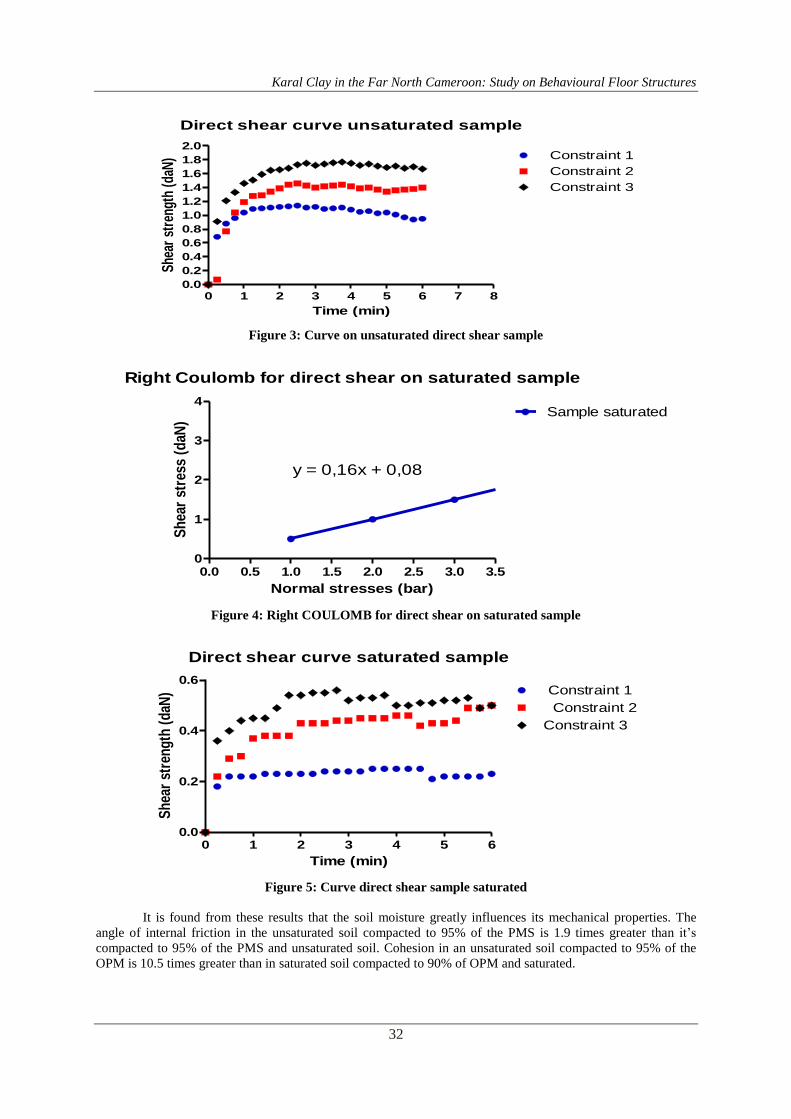
1.4.3. TEST RESULTS
Data from the shear test allowed us to represent the curves of shear unsaturated and saturated sample,
from which we got straight Coulomb which allowed us to identify the specific characteristics of our sample in
these two states. On unsaturated sample is obtained υu = 16.86 ° and Cu = 0.838 bar. And saturated sample was
obtained υu = 9.03 ° and Cu = 0.08 bar.
Right Coulomb for direct shear on unsaturated sample
0.0 0.5 1.0 1.5 2.0 2.5 3.0 3.50.0
0.2
0.4
0.6
0.8
1.0
1.2
1.4
1.6
1.8
2.0Sample unsaturated
y = 0,303x + 0,838
Normal stresses (bar)
Sh
ear
str
ess (
daN
)
Figure 2: Right COULOMB for direct shear on unsaturated sample
Karal Clay in the Far North Cameroon: Study on Behavioural Floor Structures
32
Direct shear curve unsaturated sample
0 1 2 3 4 5 6 7 80.0
0.2
0.4
0.6
0.8
1.0
1.2
1.4
1.6
1.8
2.0 Constraint 1
Constraint 2
Constraint 3
Time (min)
She
ar s
tren
gth
(daN
)
Figure 3: Curve on unsaturated direct shear sample
Right Coulomb for direct shear on saturated sample
0.0 0.5 1.0 1.5 2.0 2.5 3.0 3.50
1
2
3
4Sample saturated
y = 0,16x + 0,08
Normal stresses (bar)
Sh
ear
stre
ss (
daN
)
Figure 4: Right COULOMB for direct shear on saturated sample
Direct shear curve saturated sample
0 1 2 3 4 5 60.0
0.2
0.4
0.6 Constraint 1
Constraint 2
Constraint 3
Time (min)
Sh
ear
stre
ng
th (
daN
)
Figure 5: Curve direct shear sample saturated
It is found from these results that the soil moisture greatly influences its mechanical properties. The
angle of internal friction in the unsaturated soil compacted to 95% of the PMS is 1.9 times greater than it’s
compacted to 95% of the PMS and unsaturated soil. Cohesion in an unsaturated soil compacted to 95% of the
OPM is 10.5 times greater than in saturated soil compacted to 90% of OPM and saturated.

Karal Clay in the Far North Cameroon: Study on Behavioural Floor Structures
33
1.5. PROCTOR CHANGES (NF P 94 093)
1.5.1. AIM OF THE TEST
The lift of soil is the characteristic that determines its ability to withstand the loads applied to it. To
achieve the maximum capacity to support these charges, Proctor identifies a particular optimum water content
w, noted for Standard Proctor and wopm for modified Proctor compaction which leads to a density ρd dry (or dry
density) maximum. The maximum density corresponds to a state of maximum compactness and a maximum
capacity of resistance.
1.5.2. PRINCIPLE OF THE METHOD
The American engineer Proctor has shown that for a given compaction energy, the water content had a
great influence on the compactness obtained. The principle of the test is to moisten the soil water content to
several and compacted in a conventional method and energy. For each value of water content in question, it is
determined the dry density of the soil and the variation curve of the density as a function of the water content. In
general, this curve called Proctor curve has a maximum value of the dry density, it is obtained for a particular
value of the water content. These two values are called Standard Proctor compaction characteristics or Proctor
test performed according to Modified. Since these works are oriented in the road sector, we realised only the
modified Proctor.
1.5.3. RESULTS AND DISCUSSION
The results are translated into an x-axis representing the compaction water content and dry density
ordered graph. The curve obtained is in the form of a bell, it is also pointed at the top. We can tell our soil
compaction that is influenced by the water content: This is the inherent characteristic of clay soil. This curve
passes through a maximum also called Optimum Proctor. At the optimum Proctor, is the optimum moisture
content to achieve maximum compactness for a given soil and mode of compaction determined. The dry density
is thus obtained: γd = 1.80 kN / m3 and the optimum water content is of about: WOPM = 15%.
Figure 6: Proctor curve of Karal clay
1.6. CALIFORNIA BEARING RATIO (NP F 94078)
1.6.1. DEFINITION AND PURPOSE OF THE TEST
The CBR test is used to measure the lift of compacted material. It involves comparing the puncture
resistance of a material to be tested to that of a reference material California (severe natural). This material is
such that a depression of 2.5 mm is observed for a force of 13.2 kN; and a depression of 5 mm for a force of 20
KN. CBR tests to determine: the CBR index after immersion, the CBR immediate index and immediate bearing

Karal Clay in the Far North Cameroon: Study on Behavioural Floor Structures
34
index of a sample of soil or material to size of the pavement structures. This value is the CBR to 95% of the
OPM.
1.6.2. PRINCIPLE OF THE TEST
The general principle of the test is to measure the forces to be applied to a cylindrical punch to make it
penetrate to a constant speed in the axis of a specimen to rate of 1.27 mm / min into tubes of the compacted soil
energy Proctor (normal or modified) in the CBR mold. Continuously measuring the force applied as a function
of the penetration of the punch usually up to 10mm. During this test, a load is placed on the surface of the
specimen in order to simulate the load that the structure of the floor exercises.
1.6.3. TEST RESULT AND DISCUSSIONS
The test data have allowed us to draw the CBR curve from which we determined by projecting the x-
axis, the meeting point between the curve and the line y = dry density of 95% of the OPM (corresponding to
energy compaction to 25 shots) that the CBR value is equal to 7.2. In addition we got a swelling nearly 1.76%
on the mold packed with an energy of 25 shots (95% OPM) after 4 days of immersion. Yet the most often
recommended in the CCTP (Special Technical Papers Clauses) threshold is 1%. Therefore adequate soil
treatment to reduce the swelling rate is required, see paramount.
Figure 7: CBR curve Karal clay
1.7. FULL SIZE ANALYSIS (NF P 94-056 AND NF P 94-057)
1.7.1. PARTICLE SIZE ANALYSIS BY SIEVING
This is a set of operations leading to the separation by size of the components of a sample, using a
square mesh sieve to obtain a representation of the distribution of the mass of dry particles in a state according
to their size. The test consists in separating the agglomerated grains of a known mass of material in the water by
stirring, to split the soil once dried through a series of sieves, and the cumulative oversize successively weigh on
each screen. The mass accumulated on each sieve refusal is based on the total dry weight of the sample under
analysis.
PRESENTATION OF RESULTS AND DISCUSSION
The test particle size analysis has enabled us to get past the screening grading curve representative for a
given dimension D, the abscissa the opening screens, and ordered the lower percentage of grains passers
dimensions. These results show that the studied soil was 97.4% passing through a sieve of 80 µm (97.4% fine).
It is therefore deduced that our studied soil is in the range of clays. These are indeed the 97.4% previously
obtained allow us to continue with densitometry analysis.

Karal Clay in the Far North Cameroon: Study on Behavioural Floor Structures
35
Particle size analysis of the karal clay
0 20 40 60 80 1000
10
20
30
40
50
60
70% of passers sieve
Openings of the sieves (mm)
Perc
en
tag
e o
f p
assers
sie
ve (
%)
Figure 8: granulometric curve Karal clay
1.7.2. PARTICLE SIZE ANALYSIS BY SEDIMENTATION
Particle size analysis of a soil by the sedimentation is a method to determine the weight distribution of
the particle size of a ground object to end. This test applies to particles passing through a sieve with a square
mesh of 80 microns. However, particles of a size below 1 micron cannot be distinguished by this assay. The test
uses the fact that in a liquid medium at rest, the settling velocity of fine grained depends on their dimensions.
Stokes law given in the case of spherical grains of same density, the relationship between the diameter and the
speed of sedimentation. By convention, this law is applied to the elements of a soil to determine equivalent
particle diameters.
1.7.2.1. TEST RESULTS AND DISCUSSIONS
Table 1: results of particle size analysis by sedimentation
date
21/05/2014
heur
8h30
Time
0"
Températ
ure t°
Reading
Hydrome
ter R
Correctio
n M
Read
corrigé
e R+M
Depth
readi
ng
Hr
Diameter
of
Hydrome
ter
(µm)
% of
grain
s < d
15" 25 26 0,64 26,64 3,66 100 97,4
30" 25 25,8 0,64 26,44 3,66 70 96,7
1’ 25 25 0,64 25,64 3,66 50 93,7
2’ 25 23,7 0,64 24,34 3,66 36 89,0
5’ 25 21,6 0,64 22,14 3,66 23 81,3
8h40 10’ 25 21 0,64 21,64 3,66 16 79,1
20’ 25 19,3 0,64 19,94 3,66 11 72,9
40’ 25 18,5 0,64 19,14 3,66 8 70,0
80’ 25 17,2 0,64 17,84 3,66 5,5 65,2
10h30 2h 25 16,6 0,64 17,24 3,66 4,6 63,0
12h30 4h 25 15,8 0,64 16,44 3,66 1,6 60,1
22/05/2014 24 25 13,9 0,64 14,54 3,66 1,35 53,2
At the time of washing the material for particle size analysis, of less than 80 microns separate soil
particles are suspended in water containing defloculating (Solution of Hexametaphosphate Sodium 5%). The
particles settle at different speeds according to their sizes. By means of a densitometer, as and as time passes the

Karal Clay in the Far North Cameroon: Study on Behavioural Floor Structures
36
changing density of the solution is measured and the immersion depth of the device. The weight distribution is
calculated from these data.
1.8. LIMITS OF ATTERBERG
1.8.1. SCOPE AND PURPOSE
The behaviour of much soil varies with the amount of free water existing in the voids (pores), along
with the amount of absorbed water which coats the particles. The limits are ATTERBERG geotechnical
elements to identify and characterise its ground state through its consistency index. Both limits are set on the
ATTERBERG fraction of less than 400 microns grains. The liquid limit is geotechnical parameters for
identifying and characterising a soil nature. To achieve this we used the standard French NF_P 94-051.
1.8.2. SAMPLE PREPARATION
The test is performed on the portion of soil passing 400μm mesh sieve. This fraction is prepared by
sieving the soil dipped for 24 h wet. And passing the wash water is collected in a tray. Settling is allowed to
operate for at least 12 hours, and then the clear water is siphoned. The residue is then dried by baking at 60°C
maximum. However, if after drying the soil is in a paste form, it may still be appropriate for the test according to
the level of the state.
1.8.3. TEST RESULT AND DISCUSSIONS
Following this test, we found the liquid limit WL = 34.5. The plastic limit is itself WP = 16.1. Finally,
the withdrawal limit in the water content beyond which dried soil volume decreases almost, is expressed by the
following formula: WS = 5,4 + 0,27 WL - WP = - 1,385.
We also plasticity index IP = WL – WP = 18,4 ˃ 17. Conclusion, we are in the presence of a clay consistency
index = 1, 60 ˃ 1. Clay question also a semi-solid consistency. And liquidity index = -
0,60 ˂ 0 leads us to believe that we are in the presence of a plastic clay. The organic matter content is 6.20% of
MO = 6,20% ϵ [3 ; 10]. There is therefore a weak organic soil.
From Table soil classification end GTR NF 11300 torque (WL; IC) = (34,5 ; 1,6), our sample belongs to the class
of clay and marl or highly plastic silt (A3 , ts). Soils in this class are very consistent in content and low average
soil water. These soils are sticky or slippery when wet, making it difficult to implement on-site (and
manipulation in the laboratory). In addition, the permeability of the Karal clay is reduced, making their content
variations very slow water. However, an increase of the water content of these clay is fairly large, even
necessary to substantially change their consistency.
Table 2: SUMMARY OF RESULTS OF ATTERBERG LIMITS
Number of strokes 15 20 25 30 35
Number of tare 1 2 3 4 5
Total wet weight 24,139 23,587 23,266 22,574 21,87
Total dry weight 21,825 21,443 21,264 20,675 20,198
Weight tare 15,259 15,303 15,465 15,115 15,246
Weight water 2,314 2,144 2,002 1,899 1,672
Weight of dry material 6,566 6,14 5,799 5,560 4,952
Water content 35,2 34,9 34,5 34,2 33,8
Number of tare A B
Total wet weight 21,719 21,774
Total dry weight 20,916 20,928
Weight tare 15,917 15,671
Weight water 0,803 0,846
Weight of dry
material
4,999 5,257
Water content (%) 16,06 16,09
Average 16,1
WL 34,5
WP 16,1
IP 18,4

Karal Clay in the Far North Cameroon: Study on Behavioural Floor Structures
37
Figure 9: Variation curve of Atterberg limits of karal clay
1.9. OEDOMETER TEST
1.9.1. AIM OF THE TEST
Determining the void ratio of this test is intended, the coefficient of consolidation, the compression
index, the rate of settlement of consolidation pressure, the coefficient of kinematic swelling and swelling clay.
1.9.2. PRINCIPLE
The principle is to place the sample intact and undisturbed soil in a cylinder C of section S. This
cylinder is filled with interstitial water. Thus the sample is loaded with a normal stress σ applied using a piston
sealingly slidable in the cylinder. The measuring cylinder is placed in the cell and the frame oedometric allows
applying to the piston of the vertical loads of 5-2500 kPa. A comparator is used to measure compaction due to
the stress over time (15 s, 30 s, 1 min, 2 min, 4 min, 8 min, 2 h, 4 h, and 24 h). The test is carried out in 3 phases
including loading, unloading, and finally reloading. The results are in turn represented as empty eo index versus
log σ variation.
1.9.3. RESULTS AND DISCUSSION OF THE OEDOMETER TEST
The results of oedometer tests on unsaturated and saturated samples allow us to determine the
characteristics of soil resistance to compression. These results also provide information on soil permeability,
while allowing comparing the characteristics of the latter and not the saturated states.
Table 3: Worksheet test compressibility and permeability of unsaturated sample
Survey : OPM Sample n°OPM à 95% saturated Depth (m) 1
Nature : Karal
Wet weight (g)
:
136,8
7
Dry weight
(g) :
124.3 Tare (g) 58,92
Initial water content : Final water content (%) 19,23
Section unit (cm2) : 20 Specific weight γs (kN/m
3) : 27
hp (mm) = Ps/(γs x S) 12,11 Initial height H0 (mm) : 20
eo : Initial gap index Cc : Compression coefficient 0,156
σ0 : Consolidation pressure : (bar) Cg : Swell factor 0,010
CV: Consolidation coefficient (cm2/s) Eoed: Oedometer modulus
PRESSU
RE
(Kg/cm2)
M H = H0 -
M
e = (H -
Hp)/Hp
Scores Eoed CV
(cm2/s)
K (cm/s)
0 0 20 0,652
0,05 0,0110 19,989 0,651 e0 = 0,64
0
91,16 1,13*10-3
4,96E-
04 0,25 0,1756 19,824 0,637 σ0
(bar) =
0,60
0
24,30 4,14*10-
3
3,74E-04
0,50 0,4012 19,599 0,619 Cc = 0,15
6
22,16 1,97*10-3
3,14E-04
1,00 0,9653 19,035 0,572 Cg = 0,01
0
17,73 8,65*10-
4
2,77E-04
0,25 0,8708 19,129 0,580 158,73 4,93*10-
3
2,96E-04

Karal Clay in the Far North Cameroon: Study on Behavioural Floor Structures
38
0,05 0,7425 19,257 0,591 31,17 3,23E-04
0,25 0,7891 19,211 0,587 85,87 2,87E-04
1,00 1,0320 18,968 0,567 61,76 2,63E-04
2,00 1,1019 18,898 0,561 285,92 2,37E-04
4,00 1,7414 18,259 0,508 62,55 2,18E-04
8,00 2,2390 17,761 0,467 160,76 2,03E-04
Table 4: Worksheet test compressibility and permeability of saturated sample
Survey : OPM Sample n°OPM à 95% saturated Depth (m) 1
Nature : Karal
Wet weight
(g) :
141,03 Dry weight
(g) :
127,61 Tare (g) 58,76
Initial water content : Final water content (%) 19,49
Section unit (cm2) : 20 Specific weight γs (kN/m
3) : 27
hp (mm) = Ps/(γs x S) 12,75 Initial height H0 (mm) : 20
eo : Initial gap index Cc : Compression coefficient
σ0 : Consolidation pressure : (bar) Cg : Swell factor
CV: Consolidation coefficient (cm2/s) Eoed: Oedometer modulus
PRESSURE
(Kg/cm2)
M H = H0 - M e = (H -
Hp)/Hp
Scores Eoed CV
(cm2/s)
K
(cm/s)
0 0 20 0,569
0,05 0,4303 19,570 0,535 e0 = 0,495 2,32 2,19*10-4
2,46E-
04 0,25 0,7075 19,293 0,513 σ0(bar)
=
0,775 14,43 2,18*10-3
9,40E-
05 0,50 0,9547 19,045 0,494 Cc = 0,144 20,22 4,30*10-3
8,80E-
05 1,00 1,3269 18,673 0,465 Cg = 0,030 26,87 9,12*10-4
7,54E-
05 0,25 1,1775 18,822 0,476 100,4
1
4,86*10-3
9,73E-
05 0,05 0,7459 19,254 0,510 9,27 2,45*10-3
1,12E-
04 0,25 0,8484 19,152 0,502 39,04 2,43*10-4
9,16E-
05 1,00 1,2340 18,766 0,472 38,90 3,86*10-3
7,25E-
05 2,00 1,6869 18,313 0,436 44,16 3,81*10-3
5,87E-
05 4,00 2,2559 17,744 0,392 70,30 4,03*10-3
4,88E-
05 8,00 2,7890 17,211 0,350 150,0
5
3,64*10-3
4,30E-
05
Using these tests, we realise that for a specimen compacted to 95% of OPM, and the water content of
the OPM (unsaturated), a swelling coefficient Cg = 0.01 is obtained. Also note that the coefficient of inflation is
three times higher when the soil is saturated. Is a coefficient of swelling of Cg = 0, 03.
1.9.3.1. Kinematics of swelling
Figure 10: KINEMATIC SWELLING KARAL CLAY
Karal Clay in the Far North Cameroon: Study on Behavioural Floor Structures
39
We see three clear phases of swelling. First, we have a first phase of swelling that can characterise
primary blowing. In this phase, the clay is slightly permeable and unsaturated, resulting in a low swelling. In the
second phase called secondary, there is a change in concavity of the curve of swelling, water seeped into the
clay after a relatively long time, which has accelerated the swelling. In the third phase may be called tertiary,
there is a saturation of the clay and the gradual stabilisation of swelling.
1.10. X-RAY DIFFRACTION
1.10.1. SCOPE
The X-ray diffraction analysis is an analysis method that applies specifically to the crystalline material such as
metals, ceramics, minerals, to mention only these, but that is not used on materials amorphous.
1.10.2. AIM OF THE TEST
Basic analysis well known in the characterisation of crystalline materials, the X-ray diffraction method allows
the identification of micro mineral phases and / or poly-crystalline.
1.10.3. PRINCIPLE OF X-RAY DIFFRACTION
The process returns to send x-ray emanating from a metal anode, and which are initially collected by a
collimator in a divergence slit with a view to transmitting a sub-parallel beam. This beam is directed to the
material to be characterised by an angle θ and is diffracted when the elements of Bragg's law are observed.
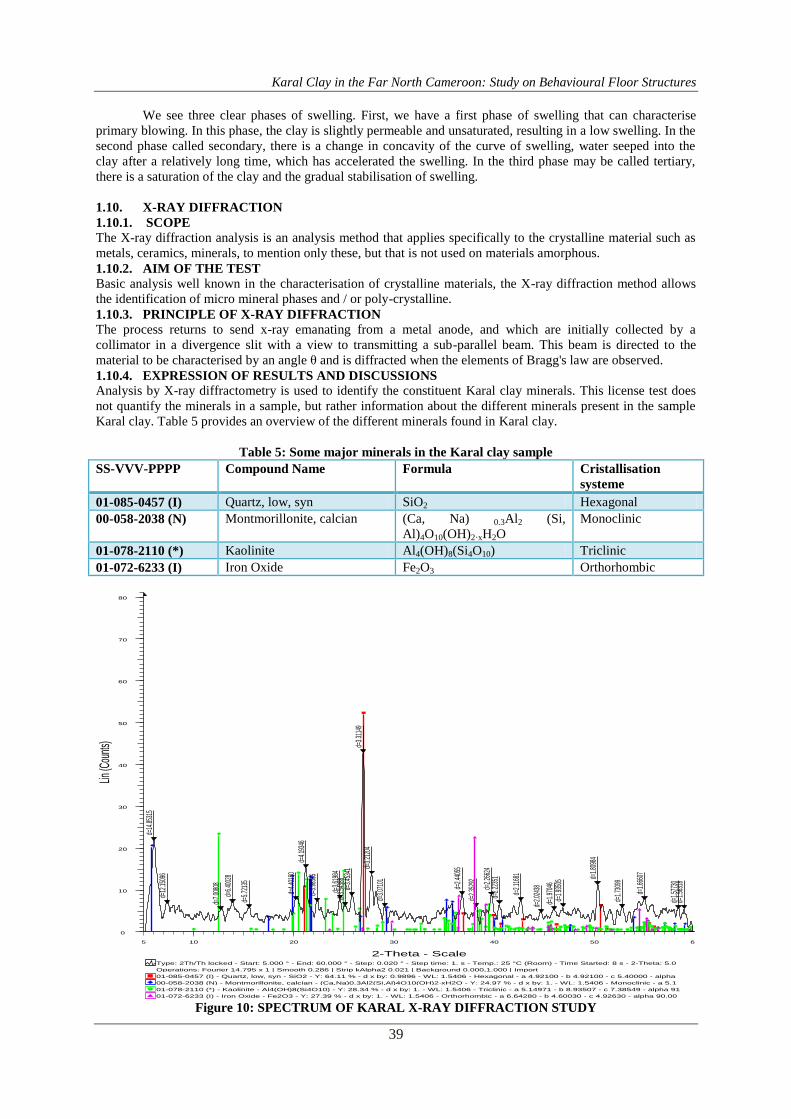
1.10.4. EXPRESSION OF RESULTS AND DISCUSSIONS
Analysis by X-ray diffractometry is used to identify the constituent Karal clay minerals. This license test does
not quantify the minerals in a sample, but rather information about the different minerals present in the sample
Karal clay. Table 5 provides an overview of the different minerals found in Karal clay.
Table 5: Some major minerals in the Karal clay sample
SS-VVV-PPPP Compound Name Formula Cristallisation
systeme
01-085-0457 (I) Quartz, low, syn SiO2 Hexagonal
00-058-2038 (N) Montmorillonite, calcian (Ca, Na) 0.3Al2 (Si,
Al)4O10(OH)2·xH2O
Monoclinic
01-078-2110 (*) Kaolinite Al4(OH)8(Si4O10) Triclinic
01-072-6233 (I) Iron Oxide Fe2O3 Orthorhombic
DEUTSOP JACQUES
01-072-6233 (I) - Iron Oxide - Fe2O3 - Y: 27.39 % - d x by: 1. - WL: 1.5406 - Orthorhombic - a 6.64280 - b 4.60030 - c 4.92630 - alpha 90.00
01-078-2110 (*) - Kaolinite - Al4(OH)8(Si4O10) - Y: 28.34 % - d x by: 1. - WL: 1.5406 - Triclinic - a 5.14971 - b 8.93507 - c 7.38549 - alpha 91
00-058-2038 (N) - Montmorillonite, calcian - (Ca,Na)0.3Al2(Si,Al)4O10(OH)2·xH2O - Y: 24.97 % - d x by: 1. - WL: 1.5406 - Monoclinic - a 5.1
01-085-0457 (I) - Quartz, low, syn - SiO2 - Y: 64.11 % - d x by: 0.9896 - WL: 1.5406 - Hexagonal - a 4.92100 - b 4.92100 - c 5.40000 - alpha
Operations: Fourier 14.795 x 1 | Smooth 0.286 | Strip kAlpha2 0.021 | Background 0.000,1.000 | Import
Type: 2Th/Th locked - Start: 5.000 ° - End: 60.000 ° - Step: 0.020 ° - Step time: 1. s - Temp.: 25 °C (Room) - Time Started: 8 s - 2-Theta: 5.0
Lin (C
ounts
)
0
10
20
30
40
50
60
70
80
2-Theta - Scale
5 10 20 30 40 50 60
d=14
.853
15
d=4.
1934
6
d=3.
3114
9d=
3.21
204
d=3.
0710
1
d=2.
4405
5
d=2.
2662
4
d=1.
8098
4
d=2.
1168
1
d=2.
2235
1
d=1.
6660
7
d=3.
4534
1
d=3.
9836
5
d=3.
6198
4
d=6.
4002
8
d=5.
7213
5
d=12
.150
96
d=7.
0080
8
d=4.
4016
0
d=1.
7309
9
d=1.
5773
0
d=2.
0243
8
d=1.
9704
6d=
1.93
505
d=1.
5631
8
d=2.
3529
2
d=3.
5438
8
Figure 10: SPECTRUM OF KARAL X-RAY DIFFRACTION STUDY

Karal Clay in the Far North Cameroon: Study on Behavioural Floor Structures
40
At the end of this test, we are able to identify minerals potentially present in our sample. These include
quartz, kaolinite, calcium montmorillonite, and finally the iron oxide.
IV. CONCLUSIONS AND PROSPECTS The Far North Region occupies a strategic position because of its geographical location between
Cameroon and countries such as Chad and Nigeria. National Highway N° 1, specifically the Maroua road -
Kousséri is the main highway that connects the region with the countries mentioned above. Above all, this is the
road that allows you to open up the entire region. Unfortunately, this road is now home to a multitude of damage
probably related to the instability of Karal on which it rests.
The main purpose of such a scientific work was to determine the direct or indirect impact due to the
instability of swelling clay soil, degradation present on a pavement structure based on swelling clay soil: the
case of Maroua Kousséri road. Following geotechnical tests at the conclusion of which we determined some soil
characteristics such as limits ATTERBERG (WL = 34.5; WP = 16.1) which is used to classify the soil and CBR
(7, 2); index for determining the strength class and combined with the class of traffic, we were able to determine
the thicknesses of the various layers of the pavement structure and materials that constitute them. This study
helps us to understand the degradation modes pavement on swelling clay soil, so it is now more convenient
knowing these degradation modes taken into account in the design of pavement structures on expansive clay soil
in the Sahel. And also to better understand the contours of the Karal clay on road works in the Northern part of
Cameroon.
REFERENCES [1] MINEPAT, M. D. (2010). REGIONAL PROGRESS REPORT FOR THE MILLENNIUM
DEVELOPMENT. Maroua, Cameroon.
[2] SEGNOBOS, C., & IYEBI-MANDJEK, O. (2000). Atlas de la province de l'extrême nord cameroun.
Paris, FRANCE: IRD.
[3] MINTP. (2006). Plan Directeur Routier du Cameroun :Document de synthèse. Yaoundé, Centre,
Cameroun.
[4] Blanck, G., Cuisinier, O. & Masrouri, F. 2013. Soil stabilisation with organic non- traditional additives
for the improvement of earthworks. Acta Geotechnica (DOI 10.1007/s11440-013-0251-6).
[5] Cuisinier, O., Javadi, A.A., Ahangarasr, A. & Masrouri, F. 2013. Identification of coupling parameters
between shear strength behavior and chemical’s effects with an evolutionary-based data mining
technique. Computers and Geotechnics. 48, 107- 116. 10.1016/j.compgeo.2012.10.005.
[6] LAROCHE, C. ( 1973). Etude de sol pour les routes sur sols argileux gonflants. Revue générale des
routes et aérodromes, n°486. Avril, Paris.
[7] MAGNAN, J., SHAKHIREV, V., EJJAAOUANI, H., & EL GAMALI, H. (1987). Etude expérimentale
du comportement des pieux forés dans les sols gonflants. bulletin de liaison des Laboratoires de ponts
et chaussée, n° 198.
[8] Stoltz,G., Cuisinier, O, & Masrouri, F. 2012. Multi-scale analysis of the swelling and shrinkage on a
lime-treated expansive soil. Applied Clay Science, 61, 44-51.
[9] Cuisinier, O., Auriol, J.-C., Le Borgne, T. & Deneele, D. 2011. Microstructure and hydraulic
conductivity of a lime-treated silt. Engineering Geology, 123, 187–193.
[10] Cuisinier, O., Le Borgne, T., Deneele, D. & Masrouri, F. 2011. Quantification of the detrimental effects
of some chemical compounds on soil stabilization. Engineering Geology, 117, 229–235.
[11] Le Runigo, B., V. Ferber, V., Cui, Y.J., Cuisinier, O. & Deneele, D. 2011. Performance of lime-treated
silty soil under long-term hydraulic conditions. Engineering Geology, 118, 20–28.
[12] Cuisinier, O. & Masrouri, F. 2010. Chemo-mechanical couplings in compacted argillite submitted to
high-pH environment. Journal of Rock Mechanics and Geotechnical Engineering, 2, 314-320.
[13] SOROCHAN, E. (1989). Construction d’ouvrages sur les sols gonflants. Moscou, RUSSIE: Strjidat.