kansas-lower republican basin total maximum …hydrology: data from usgs 06889630, located in...
TRANSCRIPT
1
KANSAS-LOWER REPUBLICAN BASIN TOTAL MAXIMUM DAILY LOAD
Waterbody / Assessment Unit: Shunganunga Creek Water Quality Impairment: Total Phosphorus
1. INTRODUCTION Subbasin: Middle Kansas Counties: Shawnee HUC8: 10270102 HUC10 (12): 09 (01, 02) Ecoregion: Central Irregular Plains, Osage Cuestas (40b) Drainage Area: 72.8 mi2
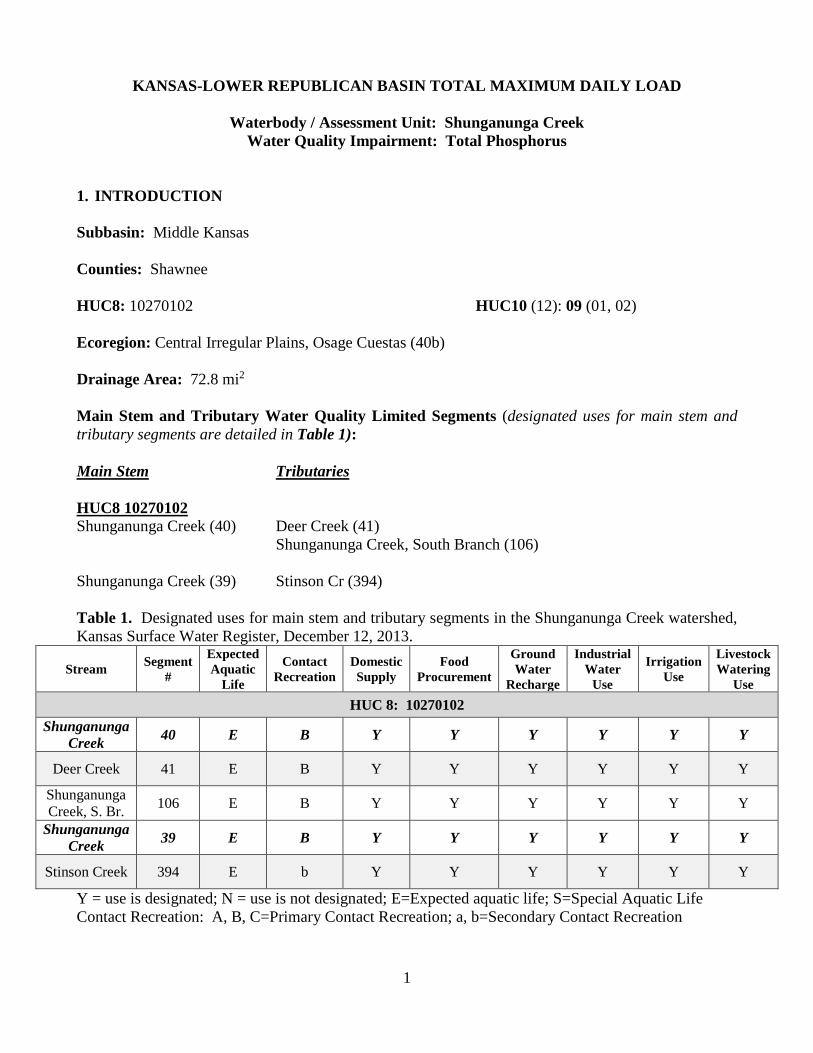
Main Stem and Tributary Water Quality Limited Segments (designated uses for main stem and tributary segments are detailed in Table 1): Main Stem Tributaries HUC8 10270102 Shunganunga Creek (40) Deer Creek (41) Shunganunga Creek, South Branch (106) Shunganunga Creek (39) Stinson Cr (394) Table 1. Designated uses for main stem and tributary segments in the Shunganunga Creek watershed, Kansas Surface Water Register, December 12, 2013.
Stream Segment #
Expected Aquatic
Life
Contact Recreation
Domestic Supply
Food Procurement
Ground Water
Recharge
Industrial Water
Use
Irrigation Use
Livestock Watering
Use HUC 8: 10270102
Shunganunga Creek 40 E B Y Y Y Y Y Y
Deer Creek 41 E B Y Y Y Y Y Y
Shunganunga Creek, S. Br. 106 E B Y Y Y Y Y Y
Shunganunga Creek 39 E B Y Y Y Y Y Y
Stinson Creek 394 E b Y Y Y Y Y Y
Y = use is designated; N = use is not designated; E=Expected aquatic life; S=Special Aquatic Life Contact Recreation: A, B, C=Primary Contact Recreation; a, b=Secondary Contact Recreation

2
303(d) Listings: Station SC238 (Figure 1), Shunganunga Creek near Topeka. Total Phosphorus (TP) Impairment: 2008, 2010, 2012, 2014, and 2016
Kansas-Lower Republican River Basin Streams. Figure 1. Map of contributing area for KDHE stream chemistry station SC238.
Impaired Use: Aquatic Life, Contact Recreation, and Domestic Water Supply. Water Quality Criteria: Nutrients – Narratives: The introduction of plant nutrients into streams, lakes, or wetlands from artificial sources shall be controlled to prevent the accelerated succession or replacement of aquatic biota or the projection of undesirable quantities or kinds of aquatic life (K.A.R. 28-16-28e(d)(2)(A)). The introduction of plant nutrients into surface waters designated for domestic water supply use shall be controlled to prevent interference with the production of drinking water (K.A.R. 28-16-28e(d)(3)(D)). The introduction of plant nutrients into surface waters designated for primary or secondary contact recreational use shall be controlled to prevent the development of objectionable concentrations of algae or algal by-products or nuisance growths of submersed, floating, or emergent aquatic vegetation (K.A.R. 28-26-28e(d)(7)(A)).
3
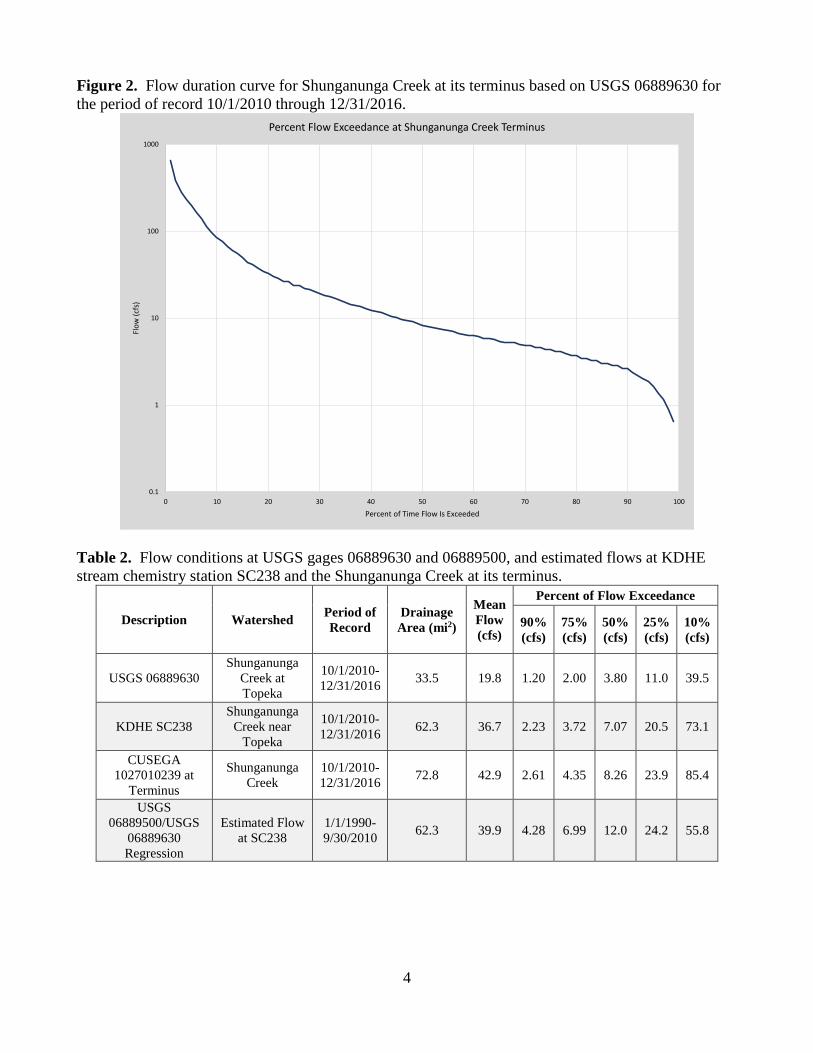
2. CURRENT WATER QUALITY CONDITIONS AND DESIRED ENDPOINT Level of Support for Designated Uses under the 2016 303(d) List: Phosphorus levels in Shunganunga Creek near Topeka (SC238) are consistently high. Excessive nutrients are not being controlled and are thus impairing aquatic life, domestic water supply, and contact recreation uses. Stream Chemistry Monitoring Sites and Periods of Record: Station SC238: Active permanent KDHE station located in Shunganunga Creek 1.33 miles north of the US Highway 40 and Croco Road intersection, east of Topeka (Figure 1). Period of Record: Sampled monthly 2/21/1979 through 9/10/1980 and bimonthly or quarterly 3/7/1990 through 10/4/2016. Stream Biology Monitoring Sites and Periods of Record: Station SB432: Shunganunga Creek below Sherwood Dam. Period of Record: Two samples taken on 6/24/1980 and 9/29/1980. Station SB433: Shunganunga Creek at Burlingame Rd. in Topeka. Period of Record: Two samples taking on 6/25/1980 and 9/29/1980. Station SB434: Shunganunga Creek at 29th St. in Topeka. Period of Record: Two samples taken on 6/27/1980 and 9/29/1980. Station SB411: Shunganunga Creek at Gage Blvd. in Topeka. Period of Record: One sample taken on 6/24/1980. Station SB238: Shunganunga Creek at SC238. Period of Record: Two samples taken on 6/26/1980 and 10/01/1980. Flow Record: USGS 06889500, located in Soldier Creek near Topeka. Period of Record: 1/1/1990 through 12/31/2016. USGS 06889630, located in Shunganunga Creek at Topeka. Period of Record: 10/1/2010 through 12/31/2016. Hydrology: Data from USGS 06889630, located in Shunganunga Creek near Topeka, were used together with the watershed area ratio to develop the flow duration curve for the Shunganunga Creek segment 39 terminus, displayed in Figure 2. Because the period of record at the Shunganunga Creek gage begins October 1, 2010, flows assigned to days at SC238 prior to that date were estimated by regression analysis between the Shunganunga Creek gage and USGS 06889500 located on Soldier Creek near Topeka. The common period of record of 10/1/2010 to 12/31/2016 was used to develop the regression, followed by applying the watershed area ratio (Table 2). Flows generated using regression analysis were used to estimate sampling daily flows for the 1/1/1990 to 9/30/2010 period of record. Long term estimated flows for segments in the Shunganunga Creek watershed are listed in Table 3 (Perry, et. al, 2004). Additionally, Lake Sherwood (LM020201) releases to the upper segment of Shunganunga Creek and Lake Shawnee (LM012201) releases to Deer Creek, a tributary to the lower segment of Shunganunga Creek. No record of release flows is available for either lake.
4
Figure 2. Flow duration curve for Shunganunga Creek at its terminus based on USGS 06889630 for the period of record 10/1/2010 through 12/31/2016.
Table 2. Flow conditions at USGS gages 06889630 and 06889500, and estimated flows at KDHE stream chemistry station SC238 and the Shunganunga Creek at its terminus.
Description Watershed Period of Record
Drainage Area (mi2)
Mean Flow (cfs)
Percent of Flow Exceedance
90% (cfs)
75% (cfs)
50% (cfs)
25% (cfs)
10% (cfs)
USGS 06889630 Shunganunga
Creek at Topeka
10/1/2010-12/31/2016 33.5 19.8 1.20 2.00 3.80 11.0 39.5
KDHE SC238 Shunganunga
Creek near Topeka
10/1/2010-12/31/2016 62.3 36.7 2.23 3.72 7.07 20.5 73.1
CUSEGA 1027010239 at
Terminus
Shunganunga Creek
10/1/2010-12/31/2016 72.8 42.9 2.61 4.35 8.26 23.9 85.4
USGS 06889500/USGS
06889630 Regression
Estimated Flow at SC238
1/1/1990-9/30/2010 62.3 39.9 4.28 6.99 12.0 24.2 55.8
0.1
1
10
100
1000
0 10 20 30 40 50 60 70 80 90 100
Flow
(cfs
)
Percent of Time Flow Is Exceeded
Percent Flow Exceedance at Shunganunga Creek Terminus
5
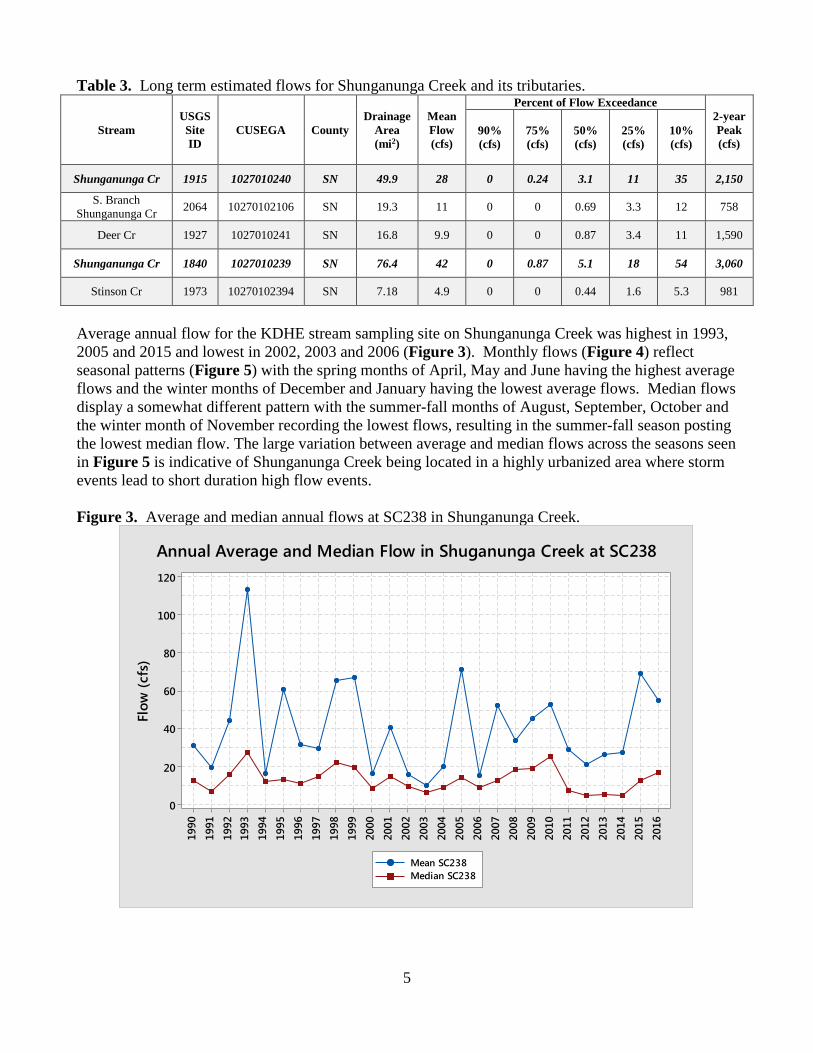
Table 3. Long term estimated flows for Shunganunga Creek and its tributaries.
Stream USGS Site ID
CUSEGA County Drainage
Area (mi2)
Mean Flow (cfs)
Percent of Flow Exceedance 2-year Peak (cfs)
90% (cfs)
75% (cfs)
50% (cfs)
25% (cfs)
10% (cfs)
Shunganunga Cr 1915 1027010240 SN 49.9 28 0 0.24 3.1 11 35 2,150
S. Branch Shunganunga Cr 2064 10270102106 SN 19.3 11 0 0 0.69 3.3 12 758
Deer Cr 1927 1027010241 SN 16.8 9.9 0 0 0.87 3.4 11 1,590
Shunganunga Cr 1840 1027010239 SN 76.4 42 0 0.87 5.1 18 54 3,060
Stinson Cr 1973 10270102394 SN 7.18 4.9 0 0 0.44 1.6 5.3 981
Average annual flow for the KDHE stream sampling site on Shunganunga Creek was highest in 1993, 2005 and 2015 and lowest in 2002, 2003 and 2006 (Figure 3). Monthly flows (Figure 4) reflect seasonal patterns (Figure 5) with the spring months of April, May and June having the highest average flows and the winter months of December and January having the lowest average flows. Median flows display a somewhat different pattern with the summer-fall months of August, September, October and the winter month of November recording the lowest flows, resulting in the summer-fall season posting the lowest median flow. The large variation between average and median flows across the seasons seen in Figure 5 is indicative of Shunganunga Creek being located in a highly urbanized area where storm events lead to short duration high flow events. Figure 3. Average and median annual flows at SC238 in Shunganunga Creek.
2016
2015
2014
2013
2012
2011
2010
2009
2008
2007
2006
2005
2004
2003
2002
2001
2000
1999
1998
1997
1996
1995
1994
1993
1992
1991
1990
120
100
80
60
40
20
0
Flow
(cfs
)
Mean SC238Median SC238
Annual Average and Median Flow in Shuganunga Creek at SC238

6
Figure 4. Average and median monthly flows at SC238 in Shunganunga Creek.
Figure 5. Boxplots of seasonal flows at SC238 in Shunganunga Creek.
0
10
20
30
40
50
60
70
80
90
100
January February March April May June July August September October November December
Flow
(cfs)
Monthly Average and Median Flow in Shuganunga Creek at SC238
Average Median
WinterSummer-FallSpring
90
80
70
60
50
40
30
20
10
0
Season
Flow
(cfs
)
24.46
34.90
72.12
11.148.56
22.32
Seasonal Flows in Shunganunga Creek at SC238
7
Seasonal analysis of total phosphorus (TP) concentrations in Shunganunga Creek shows the winter season (November-March) recorded the highest average and median TP concentrations (Figure 6) while the spring season (April-June) and summer-fall season (July-October) recorded the same median concentration of 0.192 mg/L TP. TP concentrations across the flow range can be seen Figure 7. The all season high median and average TP concentrations of 0.280 and 0.355 mg/L, respectively, occurred when the stream was between 76% and 90% flow exceedance (Table 4). Figure 8 plots TP concentrations against a flow duration curve showing high TP concentrations occur across the flow range indicating the influence of both urban runoff (high concentrations under higher flows) and wastewater treatment plant effluent (high concentrations under lower flow conditions) on TP concentrations in the creek. Figure 6. Total phosphorus concentration by season at SC238, 1990-2016.
WinterSummer-FallSpring
0.8
0.7
0.6
0.5
0.4
0.3
0.2
0.1
0.0
Season
Tota
l Pho
spho
rus
(mg/
L)
0.298
0.1920.192
Seasonal TP Concentrations in Shunganunga Creek
8
Figure 7. Total phosphorus concentration by flow range at SC238, 1990-2016.
Table 4. Average and median total phosphorus concentration with number of data (N) in Shunganunga Creek by season and flow condition, 1990-2016.
% Flow Exceedance
Total Phosphorus (mg/L) Spring Summer-Fall Winter All Seasons
Avg Med N Avg Med N Avg Med N Avg Med N 0-10% 0.326 0.282 5 0.275 0.222 6 0.344 0.230 3 0.308 0.245 14
11-25% 0.204 0.168 9 0.237 0.190 5 0.286 0.203 10 0.245 0.193 24
26-75% 0.232 0.196 22 0.183 0.192 19 0.319 0.307 28 0.254 0.210 69
76-90% 0.170 0.170 1 0.297 0.240 12 0.451 0.350 9 0.355 0.280 22
91-100% 0.264 0.264 1 0.177 0.177 7 0.494 0.448 4 0.290 0.230 12
All Flows 0.237 0.192 38 0.227 0.192 49 0.349 0.298 54 0.276 0.220 141
91-100%76-90%26-75%11-25%0-10%
0.9
0.8
0.7
0.6
0.5
0.4
0.3
0.2
0.1
0.0
Flow Range
Tota
l Pho
spho
rus
(mg/
L)
0.230.28
0.210.1930.245
TP in Shunganunga Creek by Flow Condition
9
Figure 8. Total phosphorus concentration versus percent flow exceedance at SC238 by season, 1990-2016.
Single samples with the highest TP concentrations occurred on January 22, 1992 with a value of 1.0 mg/L, on September 6, 2006 with a TP concentration of 0.807 mg/L, and on December 18, 2012 with a TP concentration of 0.785 mg/L (Figure 9). The 1992 and 2006 single sample highs contributed to 1992 and 2006 recording the highest annual averages at 0.448 mg/L and 0.425 mg/L, respectively. Period of record annual high median values occurred in 1991 and 2002 at 0.365 mg/L and 0.353 mg/L TP, respectively (Figure 10). The winter season months recorded the highest average and median values in the creek, indicating the influence of municipal discharge during the low flow winter season (Figure 11). May and June, both high flow months, also record relatively high average and median TP concentrations reflecting the occurrence of spring season precipitation runoff events.
1009080706050403020100
1.0
0.8
0.6
0.4
0.2
0.0
Percent of Time Flow Exceeded
Tota
l Pho
spho
rus
(mg/
L)
SpringSummer-FallWinter
Season
TP Concentration vs % Flow Exceedance at SC238

10
Figure 9. Total phosphorus concentration by sampling date in Shunganunga Creek at SC238.
Figure 10. Annual average and median total phosphorus concentration in Shunganunga Creek at SC238.
7/12
/201
66/
2/20
152/
24/2
014
12/1
8/20
128/
8/20
114/
27/2
010
4/7/
2009
5/6/
2008
8/8/
2007
9/6/
2006
12/7
/200
52/
2/20
053/
2/20
046/
4/20
037/
31/2
002
8/29
/200
19/
27/2
000
12/2
8/19
992/
24/1
999
2/25
/199
83/
26/1
997
6/5/
1996
5/3/
1995
6/22
/199
45/
26/1
993
7/29
/199
210
/16/
1991
11/7
/199
03/
7/19
90
1.0
0.8
0.6
0.4
0.2
0.0Tota
l Pho
spho
rus
Conc
entr
atio
n (m
g/L)
TP Concentration in Shunganunga Creek at SC238
0.00
0.05
0.10
0.15
0.20
0.25
0.30
0.35
0.40
0.45
0.50
1990
1991
1992
1993
1994
1995
1996
1997
1998
1999
2000
2001
2002
2003
2004
2005
2006
2007
2008
2009
2010
2011
2012
2013
2014
2015
2016
Tota
l Pho
spho
rus C
once
ntra
tion
(mg/
L)
Annual Average and Median TP Concentration in Shunganunga Creek at SC238
Average Median
11
Figure 11. Monthly average and median total phosphorus concentration in Shunganunga Creek at SC238, 1990-2016.
Figure 12 displays average monthly TP, by season, in the discharge of the Sherwood Regional WWTF with the average TP concentration at SC238 for the same month. Discharges from the Sherwood Regional WWTF appear to be influencing TP concentrations at SC238 particularly during the low flow winter season. Phosphorus is typically linked to sediment or total suspended solids (TSS) due to the propensity of those solids to adsorb phosphorus. As can be seen in Figure 13, under the high flow condition (0-25%), when runoff of sediment and sediment bound phosphorus is occurring, there is a correlation between TSS and TP indicating that flow in the stream is adequate to overcome the detrimental influence that wastewater effluent has on the correlation at lower flows. As flows move into the normal/low range, the correlation is lost as the concentration of TP outpaces TSS in the stream, highlighting the influence of effluent from the municipal wastewater treatment facility in the watershed.
DecNovOctSepAugJulJunMayAprMarFebJan
0.7
0.6
0.5
0.4
0.3
0.2
0.1
Tota
l Pho
spho
rus
Conc
entr
atio
n (m
g/L)
0.3260.360
0.1920.204
0.150
0.1980.230
0.251
0.184
0.343
0.29
0.193
TP in Shunganunga Creek by Month at SC238

12
Figure 12. Average monthly total phosphorus concentration in the Sherwood Regional WWTF discharge with average monthly total phosphorus concentration in Shunganunga Creek at SC238 for the same month. Period of record July 2004 through September 2016.
Figure 13. Total phosphorus concentration versus the concentration of total suspended solids in Shunganunga Creek at SC238 under high flow (0-25%) and normal/low flow (26-100%) conditions.
Oct-16
Jan-
16
Mar
-15
Feb-1
4
Jan-1
3
Mar-1
2
Feb-1
1
Jan-
10
Apr-09
Jul-0
8Oct-
07
Feb-0
7
May
-06
Oct-05
Feb-
05
Jul-0
4
10
1
0.1
Oct-16
Jan-1
6
Mar-1
5
Feb-
14
Jan-
13
Mar-1
2
Feb-1
1
Jan-1
0
Apr-0
9Ju
l-08
Oct-07
Feb-0
7
May-06
Oct-05
Feb-
05Ju
l-04
10
1
0.1
Spring
TP (m
g/L)
Summer-Fall
WinterSherwood TP SpringSherwood TP Summer-FallSherwood TP WinterShunga TP SpringShunga TP Summer-FallShunga TP Winter
Sherwood WWTF Effluent & Shunganunga CreekMonthly Average TP Concentrations
100010010
0.7
0.6
0.5
0.4
0.3
0.2
0.1
10010
1.0
0.8
0.6
0.4
0.2
0.0
0-25% Flow Exceedance
Total Suspended Solids Concentration (mg/L)
Tota
l Pho
spho
rus
Conc
entr
atio
n (m
g/L) 26-100% Flow Exceedance
TP vs TSS in Shuganunga Creek at SC238
R sq = 0.39
R sq = 0.02
13
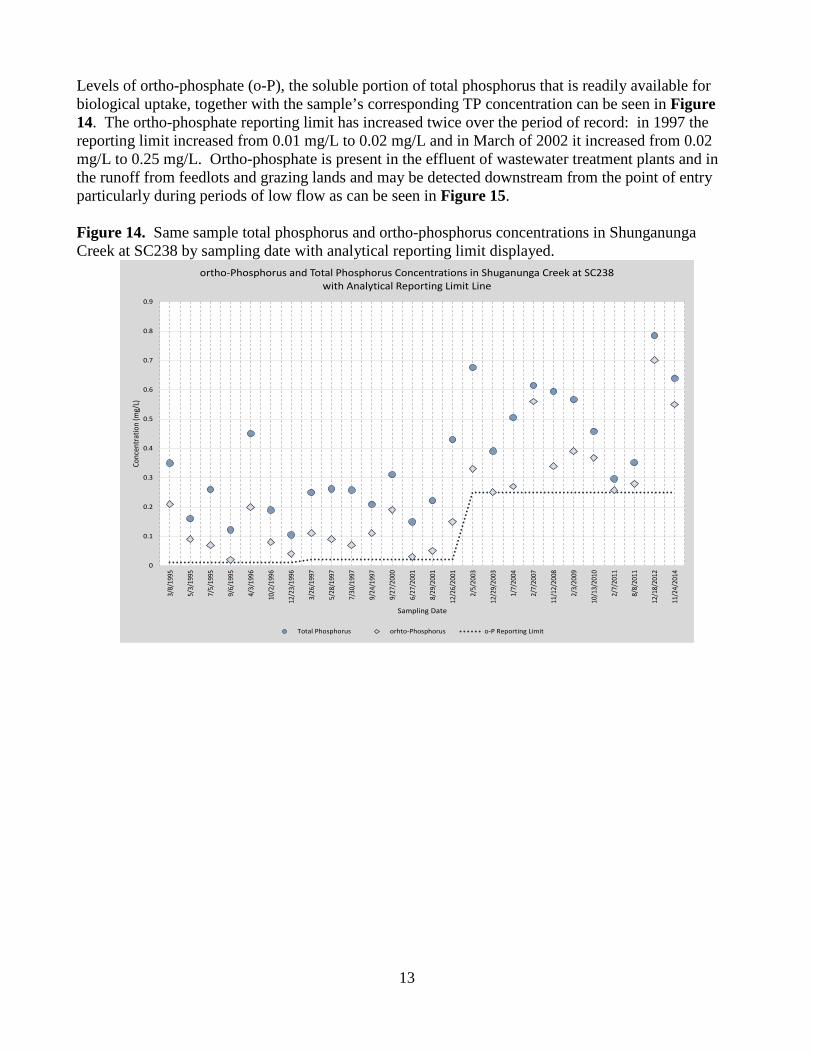
Levels of ortho-phosphate (o-P), the soluble portion of total phosphorus that is readily available for biological uptake, together with the sample’s corresponding TP concentration can be seen in Figure 14. The ortho-phosphate reporting limit has increased twice over the period of record: in 1997 the reporting limit increased from 0.01 mg/L to 0.02 mg/L and in March of 2002 it increased from 0.02 mg/L to 0.25 mg/L. Ortho-phosphate is present in the effluent of wastewater treatment plants and in the runoff from feedlots and grazing lands and may be detected downstream from the point of entry particularly during periods of low flow as can be seen in Figure 15. Figure 14. Same sample total phosphorus and ortho-phosphorus concentrations in Shunganunga Creek at SC238 by sampling date with analytical reporting limit displayed.
0
0.1
0.2
0.3
0.4
0.5
0.6
0.7
0.8
0.9
3/8/
1995
5/3/
1995
7/5/
1995
9/6/
1995
4/3/
1996
10/2
/199
6
12/2
3/19
96
3/26
/199
7
5/28
/199
7
7/30
/199
7
9/24
/199
7
9/27
/200
0
6/27
/200
1
8/29
/200
1
12/2
6/20
01
2/5/
2003
12/2
9/20
03
1/7/
2004
2/7/
2007
11/1
2/20
08
2/3/
2009
10/1
3/20
10
2/7/
2011
8/8/
2011
12/1
8/20
12
11/2
4/20
14
Conc
entra
tion
(mg/
L)
Sampling Date
ortho-Phosphorus and Total Phosphorus Concentrations in Shuganunga Creek at SC238with Analytical Reporting Limit Line
Total Phosphorus orhto-Phosphorus o-P Reporting Limit

14
Figure 15. Plot of ortho-phosphorus values greater than reporting limit versus percent flow exceedance by season in Shunganunga Creek.
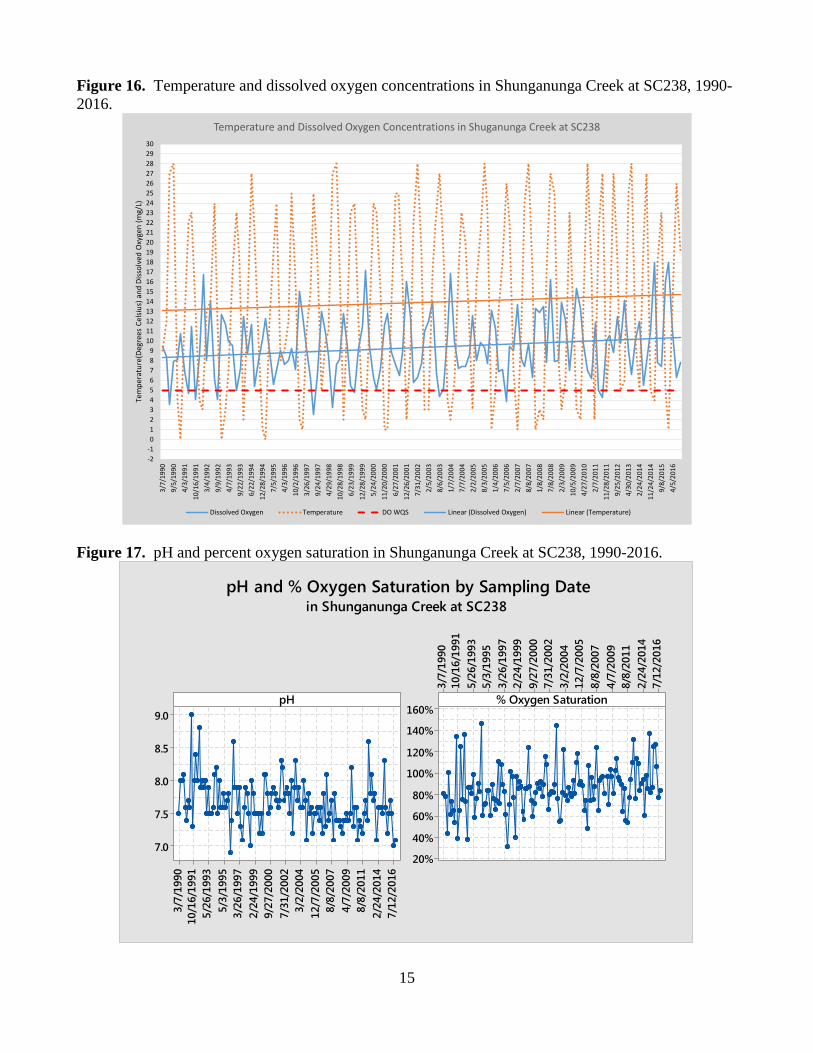
Relationship between Phosphorus and Biological Indicators: The narrative criteria of the Kansas Surface Water Quality Standards are based on conditions of the prevailing biological community. Excessive primary productivity may be indicated by extreme swings in dissolved oxygen (DO) or pH as the chemical reaction of photosynthesis and respiration alter the ambient levels of oxygen or acid-base balance of the stream. Dissolved oxygen is inversely related to the ambient temperature in Shunganunga Creek at SC238 as displayed in Figure 16. Figure 17 displays pH and oxygen saturation at SC238. Higher pH values tend to occur during periods when photosynthesis is ramped up and pH values have exceeded the water quality standard of 8.5 four times at SC238 over the period of record on 8/14/91, 5/27/92, 8/7/96, and 9/25/12. On average, pH values are consistent over the seasons (Table 5) while DO, temperature, and oxygen saturation show an expected seasonal pattern with lowest average DO and oxygen saturation coinciding with the highest average temperature of the summer-fall season. During the cooler winter season, average DO and oxygen saturation are highest at 12.1 mg/L and 92%, respectively. There is a negligible relationship between pH and dissolved oxygen over the period of record (Figure 18), however, oxygen saturation takes into account the stream’s temperature resulting in a slightly improved relationship between pH and oxygen saturation over the DO/pH correlation.
1009080706050403020100
0.7
0.6
0.5
0.4
0.3
0.2
0.1
0.0
Percent Flow Exceedance
orth
o-Ph
osph
orus
(mg/
L)
SpringSummer-FallWinter
Season
ortho-Phosphorus versus % Flow Exceedance by Seasonin Shuganunga Creek at SC238 1995-2014
15
Figure 16. Temperature and dissolved oxygen concentrations in Shunganunga Creek at SC238, 1990-2016.
Figure 17. pH and percent oxygen saturation in Shunganunga Creek at SC238, 1990-2016.
-2-10123456789
101112131415161718192021222324252627282930
3/7/
1990
9/5/
1990
4/3/
1991
10/1
6/19
913/
4/19
929/
9/19
924/
7/19
939/
22/1
993
6/22
/199
412
/28/
1994
7/5/
1995
4/3/
1996
10/2
/199
63/
26/1
997
9/24
/199
74/
29/1
998
10/2
8/19
986/
23/1
999
12/2
8/19
995/
24/2
000
11/2
0/20
006/
27/2
001
12/2
6/20
017/
31/2
002
2/5/
2003
8/6/
2003
1/7/
2004
7/7/
2004
2/2/
2005
8/3/
2005
1/4/
2006
7/5/
2006
2/7/
2007
8/8/
2007
1/8/
2008
7/8/
2008
2/3/
2009
10/5
/200
94/
27/2
010
2/7/
2011
11/2
8/20
119/
25/2
012
4/30
/201
32/
24/2
014
11/2
4/20
149/
8/20
154/
5/20
16
Tem
pera
ture
(Deg
rees
Cel
sius)
and
Diss
olve
d O
xyge
n (m
g/L)
Temperature and Dissolved Oxygen Concentrations in Shuganunga Creek at SC238
Dissolved Oxygen Temperature DO WQS Linear (Dissolved Oxygen) Linear (Temperature)
7/12
/201
62/
24/2
014
8/8/
2011
4/7/
2009
8/8/
2007
12/7
/200
53/
2/20
047/
31/2
002
9/27
/200
02/
24/1
999
3/26
/199
75/
3/19
955/
26/1
993
10/1
6/19
913/
7/19
90
9.0
8.5
8.0
7.5
7.0
7/12
/201
62/
24/2
014
8/8/
2011
4/7/
2009
8/8/
2007
12/7
/200
53/
2/20
047/
31/2
002
9/27
/200
02/
24/1
999
3/26
/199
75/
3/19
955/
26/1
993
10/1
6/19
913/
7/19
90
160%
140%
120%
100%
80%
60%
40%
20%
pH % Oxygen Saturation
pH and % Oxygen Saturation by Sampling Datein Shunganunga Creek at SC238

16
Table 5. Average dissolved oxygen, temperature, oxygen saturation and pH by season in Shunganunga Creek at SC238, 1990-2016.
Parameter Spring Summer-Fall Winter All
Seasons Number of Samples 38 49 54 140
Dissolved Oxygen (mg/L) 8.20 7.04 12.1 9.14 Temperature (oC) 17.4 21.6 4.43 13.7
Oxygen Saturation (%) 85% 79% 92% 84% pH 7.61 7.64 7.72 7.69
Figure 18. pH versus dissolved oxygen, percent oxygen saturation and temperature in Shunganunga Creek at SC238, 1990-2016.
15105 150%100%50%
9.0
8.5
8.0
7.5
7.0
3020100
9.0
8.5
8.0
7.5
7.0
Dissolved Oxygen (mg/L)
pH
% Oxygen Saturation
Temp (degrees C)
pH vs Dissolved Oxygen, % Oxygen Saturation, and Temperaturein Shuganunga Creek at SC238
R sq = 0.14 R sq = 0.25
R sq = 0
17
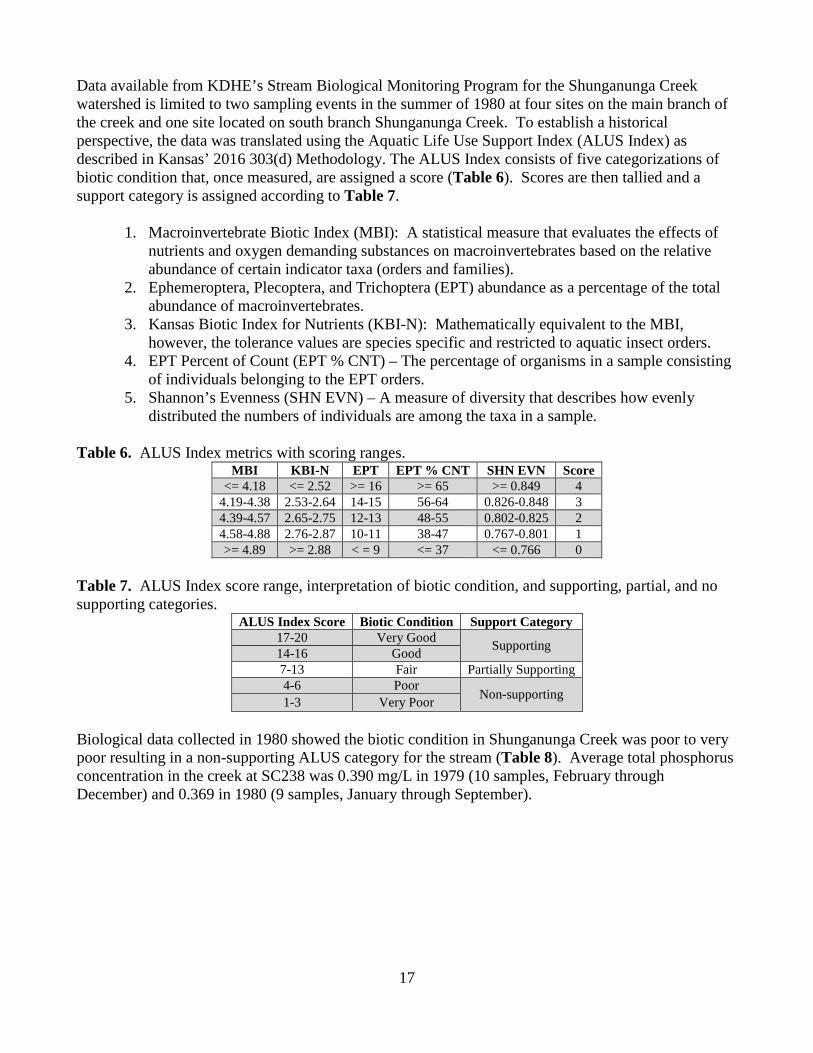
Data available from KDHE’s Stream Biological Monitoring Program for the Shunganunga Creek watershed is limited to two sampling events in the summer of 1980 at four sites on the main branch of the creek and one site located on south branch Shunganunga Creek. To establish a historical perspective, the data was translated using the Aquatic Life Use Support Index (ALUS Index) as described in Kansas’ 2016 303(d) Methodology. The ALUS Index consists of five categorizations of biotic condition that, once measured, are assigned a score (Table 6). Scores are then tallied and a support category is assigned according to Table 7.
1. Macroinvertebrate Biotic Index (MBI): A statistical measure that evaluates the effects of nutrients and oxygen demanding substances on macroinvertebrates based on the relative abundance of certain indicator taxa (orders and families).
2. Ephemeroptera, Plecoptera, and Trichoptera (EPT) abundance as a percentage of the total abundance of macroinvertebrates.
3. Kansas Biotic Index for Nutrients (KBI-N): Mathematically equivalent to the MBI, however, the tolerance values are species specific and restricted to aquatic insect orders.
4. EPT Percent of Count (EPT % CNT) – The percentage of organisms in a sample consisting of individuals belonging to the EPT orders.
5. Shannon’s Evenness (SHN EVN) – A measure of diversity that describes how evenly distributed the numbers of individuals are among the taxa in a sample.
Table 6. ALUS Index metrics with scoring ranges.
MBI KBI-N EPT EPT % CNT SHN EVN Score <= 4.18 <= 2.52 >= 16 >= 65 >= 0.849 4
4.19-4.38 2.53-2.64 14-15 56-64 0.826-0.848 3 4.39-4.57 2.65-2.75 12-13 48-55 0.802-0.825 2 4.58-4.88 2.76-2.87 10-11 38-47 0.767-0.801 1 >= 4.89 >= 2.88 < = 9 <= 37 <= 0.766 0
Table 7. ALUS Index score range, interpretation of biotic condition, and supporting, partial, and no supporting categories.
ALUS Index Score Biotic Condition Support Category 17-20 Very Good Supporting 14-16 Good 7-13 Fair Partially Supporting 4-6 Poor
Non-supporting 1-3 Very Poor Biological data collected in 1980 showed the biotic condition in Shunganunga Creek was poor to very poor resulting in a non-supporting ALUS category for the stream (Table 8). Average total phosphorus concentration in the creek at SC238 was 0.390 mg/L in 1979 (10 samples, February through December) and 0.369 in 1980 (9 samples, January through September).

18
Table 8. Average ALUS scores at biology sampling sites in the Shunganunga Creek watershed.
Site Biology Period of Record
Sample Number
Avg ALUS Index Score
ALUS Support Category
SB435 South Branch Shunganunga Cr.
June 25, 1980 September 29, 1980 2 4 Non-
supporting SB432
Shunganunga Cr. below Lake Sherwood Dam June 24, 1980
September 29, 1980 2 0 Non-supporting
SB434 Shunganunga Cr. at 29th St. in Topeka
June 27, 1980 September 29, 1980 2 4 Non-
supporting SB411
Shunganunga Cr. at Gage Blvd. in Topeka June 24, 1980 1 4 Non-supporting
SB433 Shunganunga Cr. at Burlingame Rd. in Topeka
June 25, 1980 September 29, 1980 2 3 Non-
supporting SB238
Shunganunga Cr. at SC238 June 26, 1980
October 1, 1980 2 4 Non-supporting
Desired Endpoint: The ultimate endpoint of this TMDL will be to achieve the Kansas Surface Water Quality Standards by eliminating the objectionable flora and other impacts to aquatic life, domestic water supply, or recreation associated with excessive phosphorus as described in the narrative criteria pertaining to nutrients. There are no existing numeric phosphorus criteria currently in Kansas. Total phosphorus data from stream chemistry stations that are unimpaired for total phosphorus located in the Osage Cuestas (40b) ecoregion and the Kansas-Lower Republican basin were used to develop the total phosphorus milestones for Shunganunga Creek. Average and median TP concentrations for the 14 unimpaired stations are summarized and compared in Table 9. Table 9. Summary data of ecoregion 40b stream chemistry stations located in the Kansas-Lower Republican River Basin that are unimpaired for total phosphorus, 1990-2017.
Basin Number
of Stations
Number of
Samples
Average TP
(mg/L)
50th Percentile of Station Averages (mg/L)
Average of Station Medians (mg/L)
50th Percentile of
Station Medians (mg/L)
25th Percentile of Station Averages (mg/L)
Kansas-Lower
Republican 14 963 0.173 0.170 0.108 0.106 0.133
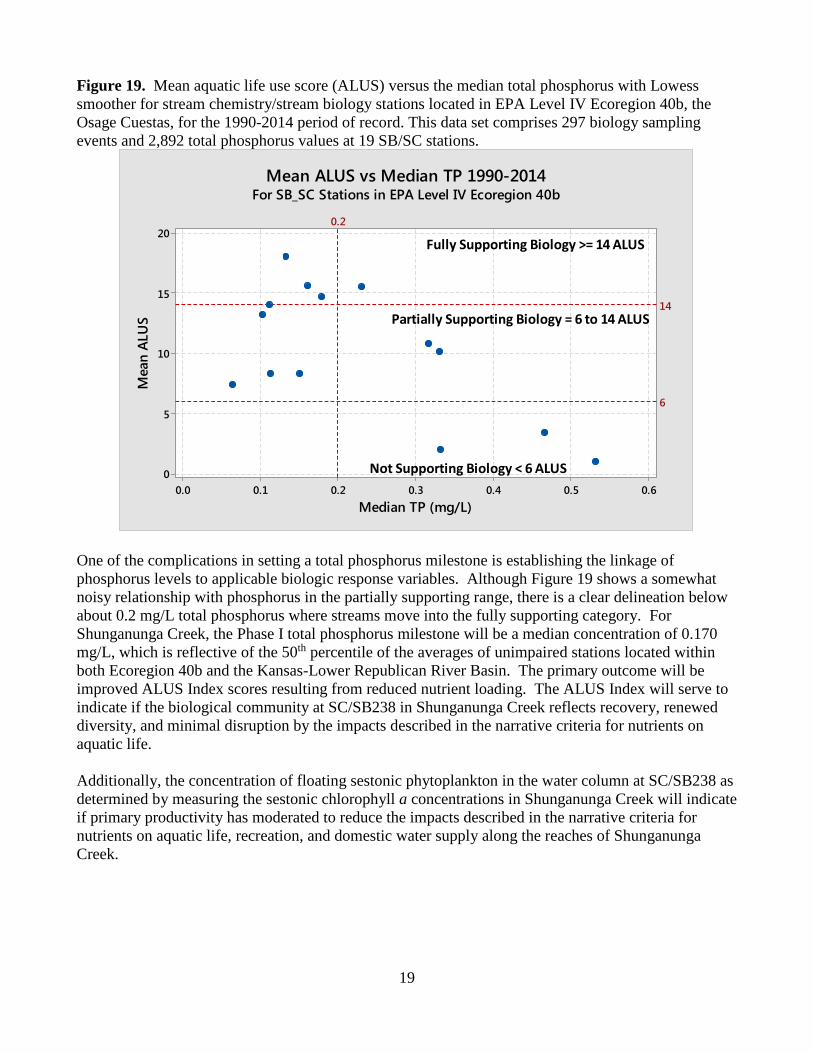
The average ALUS index was determined for sites in Ecoregion 40b that had both a stream biology data set and a stream chemistry data set. The resulting plot (Figure 19) reveals conditions of full support are mostly occurring span median total phosphorus levels of 0.06 to 0.325 mg/L. In most cases, full support of biology is occurring when median concentrations are below 0.2 mg/L total phosphorus. Generally, as phosphorus concentrations exceed a median TP concentration of 0.2 mg/L biological conditions in the streams deteriorate.
19
Figure 19. Mean aquatic life use score (ALUS) versus the median total phosphorus with Lowess smoother for stream chemistry/stream biology stations located in EPA Level IV Ecoregion 40b, the Osage Cuestas, for the 1990-2014 period of record. This data set comprises 297 biology sampling events and 2,892 total phosphorus values at 19 SB/SC stations.
One of the complications in setting a total phosphorus milestone is establishing the linkage of phosphorus levels to applicable biologic response variables. Although Figure 19 shows a somewhat noisy relationship with phosphorus in the partially supporting range, there is a clear delineation below about 0.2 mg/L total phosphorus where streams move into the fully supporting category. For Shunganunga Creek, the Phase I total phosphorus milestone will be a median concentration of 0.170 mg/L, which is reflective of the 50th percentile of the averages of unimpaired stations located within both Ecoregion 40b and the Kansas-Lower Republican River Basin. The primary outcome will be improved ALUS Index scores resulting from reduced nutrient loading. The ALUS Index will serve to indicate if the biological community at SC/SB238 in Shunganunga Creek reflects recovery, renewed diversity, and minimal disruption by the impacts described in the narrative criteria for nutrients on aquatic life. Additionally, the concentration of floating sestonic phytoplankton in the water column at SC/SB238 as determined by measuring the sestonic chlorophyll a concentrations in Shunganunga Creek will indicate if primary productivity has moderated to reduce the impacts described in the narrative criteria for nutrients on aquatic life, recreation, and domestic water supply along the reaches of Shunganunga Creek.
0.60.50.40.30.20.10.0
20
15
10
5
0
Median TP (mg/L)
Mea
n AL
US
14
6
0.2
Mean ALUS vs Median TP 1990-2014For SB_SC Stations in EPA Level IV Ecoregion 40b
Fully Supporting Biology >= 14 ALUS
Partially Supporting Biology = 6 to 14 ALUS
Not Supporting Biology < 6 ALUS

20
Secondary indicators of the health of the in-stream biological community include:
1. Dissolved oxygen concentrations greater than 5.0 mg/L and the percent dissolved oxygen nor more than 110%. Percent dissolved oxygen saturation is the measure of oxygen in the water relative to the water’s potential dissolved oxygen concentration. Dissolved oxygen concentrations below 5.0 mg/L put aquatic life under stress while dissolved oxygen percent saturation levels greater than 110% are indicative of over-active primary productivity.
2. Instream pH values remain below 8.5. Excessive nutrients can induce vigorous photosynthesis which will cause pH to rise above 8.5, the current Kansas criterion.
Therefore, the numeric endpoints for this TMDL as measured at SC/SB238 and indicating attainment of water quality standards within the watershed are:
1. An ALUS Index score greater than or equal to 14 at SB stations. 2. Maintain median sestonic chlorophyll a concentration equal to or below 10 µg/L at SC
stations. 3. Dissolved oxygen concentrations greater than 5.0 mg/L at SC stations. 4. Dissolved oxygen saturation below 110% at SC stations. 5. pH values within the range of 6.5 to 8.5.
All five endpoints have to be initially maintained over three consecutive years at SC/SB238 to constitute full support of the designated uses of Shunganunga Creek. After the endpoints are attained at SC/SB238, simultaneous digression of these endpoints more than once every three years, on average, constitutes a resumption of impaired conditions in the stream unless the TP impairment is delisted through the 303(d) process. There are no existing numeric phosphorus criteria currently in Kansas. Hence, the series of endpoints established by this TMDL will be the measures used to indicate full support of aquatic life, domestic water supply and recreation uses in the river. These endpoints will be evaluated periodically as phosphorus levels decline in the watershed over time with achievement of the ALUS index endpoint indicating restored status of the aquatic life use in the river. This TMDL looks to establish phased total phosphorus endpoints that will be the cue to examine for altered, improved biological conditions in the river. Assessment of the biological community in the creek will be initiated once concentrations approach the Phase I management milestone of a median concentration of 0.170 mg/L, representing the 50th percentile for stream chemistry stations currently unimpaired for total phosphorus located in both the 40b Level IV ecoregion and the Kansas-Lower Republican River Basin. Should the biological community fail to respond to Phase I reductions in total phosphorus, Phase II will commence with a TP milestone of a median concentration of 0.133 mg/L, representing the lower quartile total phosphorus value for stream chemistry stations currently unimpaired for total phosphorus located in both the 40b Level IV ecoregion and the Kansas-Lower Republican River Basin. Simultaneous achievement of the chlorophyll a, dissolved oxygen, oxygen saturation, and pH endpoints will signal phosphorus reductions are addressing the accelerated succession of aquatic biota and the development of objectionable concentrations of algae and algae by-products thereby restoring the domestic water supply and contact recreation uses in the river.
21
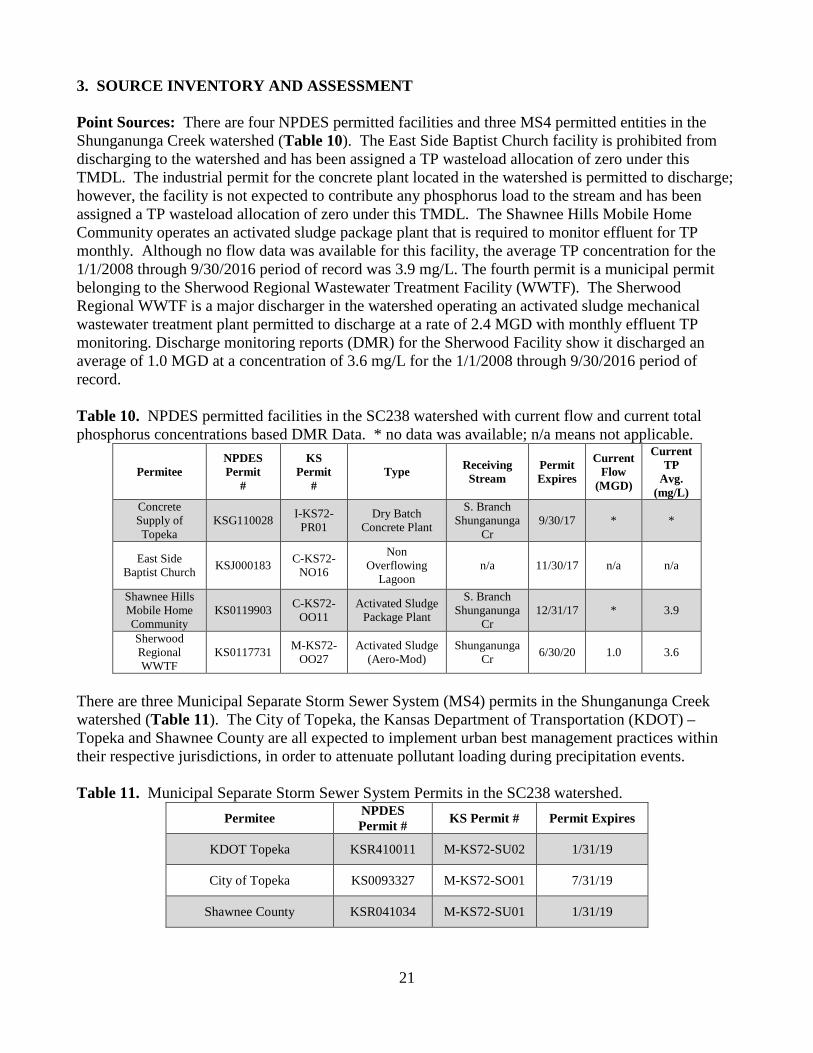
3. SOURCE INVENTORY AND ASSESSMENT Point Sources: There are four NPDES permitted facilities and three MS4 permitted entities in the Shunganunga Creek watershed (Table 10). The East Side Baptist Church facility is prohibited from discharging to the watershed and has been assigned a TP wasteload allocation of zero under this TMDL. The industrial permit for the concrete plant located in the watershed is permitted to discharge; however, the facility is not expected to contribute any phosphorus load to the stream and has been assigned a TP wasteload allocation of zero under this TMDL. The Shawnee Hills Mobile Home Community operates an activated sludge package plant that is required to monitor effluent for TP monthly. Although no flow data was available for this facility, the average TP concentration for the 1/1/2008 through 9/30/2016 period of record was 3.9 mg/L. The fourth permit is a municipal permit belonging to the Sherwood Regional Wastewater Treatment Facility (WWTF). The Sherwood Regional WWTF is a major discharger in the watershed operating an activated sludge mechanical wastewater treatment plant permitted to discharge at a rate of 2.4 MGD with monthly effluent TP monitoring. Discharge monitoring reports (DMR) for the Sherwood Facility show it discharged an average of 1.0 MGD at a concentration of 3.6 mg/L for the 1/1/2008 through 9/30/2016 period of record. Table 10. NPDES permitted facilities in the SC238 watershed with current flow and current total phosphorus concentrations based DMR Data. * no data was available; n/a means not applicable.
Permitee NPDES Permit
#
KS Permit
# Type Receiving
Stream Permit Expires
Current Flow
(MGD)
Current TP
Avg. (mg/L)
Concrete Supply of Topeka
KSG110028 I-KS72-PR01
Dry Batch Concrete Plant
S. Branch Shunganunga
Cr 9/30/17 * *
East Side Baptist Church KSJ000183 C-KS72-
NO16
Non Overflowing
Lagoon n/a 11/30/17 n/a n/a
Shawnee Hills Mobile Home Community
KS0119903 C-KS72-OO11
Activated Sludge Package Plant
S. Branch Shunganunga
Cr 12/31/17 * 3.9
Sherwood Regional WWTF
KS0117731 M-KS72-OO27
Activated Sludge (Aero-Mod)
Shunganunga Cr 6/30/20 1.0 3.6
There are three Municipal Separate Storm Sewer System (MS4) permits in the Shunganunga Creek watershed (Table 11). The City of Topeka, the Kansas Department of Transportation (KDOT) – Topeka and Shawnee County are all expected to implement urban best management practices within their respective jurisdictions, in order to attenuate pollutant loading during precipitation events. Table 11. Municipal Separate Storm Sewer System Permits in the SC238 watershed.
Permitee NPDES Permit # KS Permit # Permit Expires
KDOT Topeka KSR410011 M-KS72-SU02 1/31/19
City of Topeka KS0093327 M-KS72-SO01 7/31/19
Shawnee County KSR041034 M-KS72-SU01 1/31/19
22
Land Use: Land use within the Middle Kansas watershed is mostly developed land (56%) with some grassland (26%) according to the 2011 National Land Cover Database (Figure 22 & Table 12). About 50% of the watershed falls within the boundaries of the City of Topeka indicating runoff from urban lawns and impervious surfaces during precipitation events is a likely source of significant TP loading in Shunganunga Creek. Figure 22. Land use map for the Shunganunga Creek watershed (NLCD, 2011).
Table 12. Land use data for the Shunganunga Creek watershed (NLCD, 2011).
Watershed Approximate
Land Area (mi2)
Grassland/ Pasture
Cultivated Crops
Developed Land Forest Open
Water Wetlands Barren Land
SC238 Shunganunga
Creek 72.8 26% 6% 56% 10% 2% 0% 0%
Livestock Waste Management Systems: There is one permitted dairy operation with approximately 200 head of dairy cattle in the Shunganunga Creek watershed (A-KSSN-M003). This permitted confined animal feeding operation (CAFO) is designed to retain a 25-year, 24-hour rainfall/runoff event as well as an anticipated two weeks of normal wastewater from their operations. Typically, this rainfall event coincides with streamflow that is less than 1-5% flow exceedance. According to the USDA National Agricultural Statistics Service (NASS), on January 1, 2016 there were a total of 12,100 head of cattle, including calves, in Shawnee County. NASS withheld hog data for Shawnee

23
County to avoid disclosing data for individual operators as of December 31, 2012. The animal waste from both confined and unconfined feeding sites is considered a potential source of total phosphorus loading to the watershed. On-Site Waste Systems: The Shunganunga Creek watershed lies in an urban area where most residences are connected to public sewer systems. However, the Spreadsheet Tool for Estimating Pollutant Load (STEPL) indicates there are about 1,100 septic systems located in the two HUC 12s contributing to the Shunganunga Creek (SC238) watershed. The estimated septic failure rate in Kansas is somewhere in the 10-15% range, according to the survey performed by the Electric Power Research Institute. Failing on-site septic systems have the potential to contribute to nutrient loading in the watershed. However, because of the relatively small number of them, their small flows and because of phosphorus’ proclivity for adsorbing to soil, failing on-site septic systems would be a minor source of phosphorus loading within the watershed and would not significantly contribute to the phosphorus impairment in Shunganunga Creek. Population Density: According to the 2010 census tract data from the U.S. Census Bureau, the population of the Shunganunga Creek watershed is approximately 90,190 people giving a population density of about 1,238 people/square mile. This is a small decrease of about 2% over the 2000 census tract results. Population within the City of Topeka is growing according to the 2000 and 2010 census results and growth is expected to continue with a 25% increase over 2010 census results by 2040 (Table 13). Table 13. U.S. Census results and a 2040 population projection from the Kansas Water Office (KWO) for the City of Topeka.
City 2000 U.S. Census
2010 U.S. Census
% Change 2000 to 2010
2040 Population Projection
(KWO)
% Projected Population Growth
2010 to 2040 Topeka 122,377 127,473 + 4% 159,146 +25%
Contributing Runoff: According to the NRCS STATSGO database, the Shunganunga Creek watershed has a mean soil permeability of 0.5 inches/hour (Figure 23) reflecting the degree of impermeable land in the watershed due to its urban nature. Permeability in the watershed ranges from 0.01 to 13.0 inches/hour with over 50% of the watershed having a very low soil permeability of 1.13 inches/hour. According to a USGS open-file report (Juracek, 2000), the threshold soil-permeability values are set at 3.43 inches/hour for very high, 2.86 inches/hour for high, 2.29 inches/hour for moderate, 1.71 inches/hour for low, 1.14 inches/hour for very low, and 0.57 inches/hour for extremely low soil-permeability. Runoff is primarily generated as infiltration excess with rainfall intensities greater than soil permeability. As the watershed’s soil profiles become saturated, excess overland flow is produced. However, when taking into account the degree of development in this watershed, it may be difficult to distinguish between runoff from impermeable surfaces and overland flow during precipitation events.

24
Figure 23. Soil permeability in the Shunganunga Creek watershed.
Background and Natural Sources: Phosphorus is present over the landscape, in the soil profile as well as terrestrial and aquatic biota. Wildlife can contribute phosphorus loadings, particularly if they congregate to a density that exceeds the assimilative capacity of the land or water. 4. ALLOCATION OF POLLUTANT REDUCTION RESPONSIBILITY The endpoint for this TMDL is based on the biological condition, pH, sestonic chlorophyll a and dissolved oxygen concentrations; all of which should improve to a level of full attainment of designated uses in Shunganunga Creek as phosphorus concentrations decrease in the creek. This TMDL is established as two phases to reduce phosphorus loading and total phosphorus concentration with periodic assessment of the biological condition in the creek. The Phase I TMDL TP concentration is set at a median concentration of 0.170 mg/L with point source load reductions required from the Sherwood Regional WWTF. In addition, it is expected that best management practices prescribed in the MS4 permits will be implemented by the permitted entities to the maximum extent practicable. Furthermore, the application of riparian and livestock agricultural best management practices in the Shunganunga Creek watershed should continue in order to abate and reduce total phosphorus loading from nonpoint sources.
25
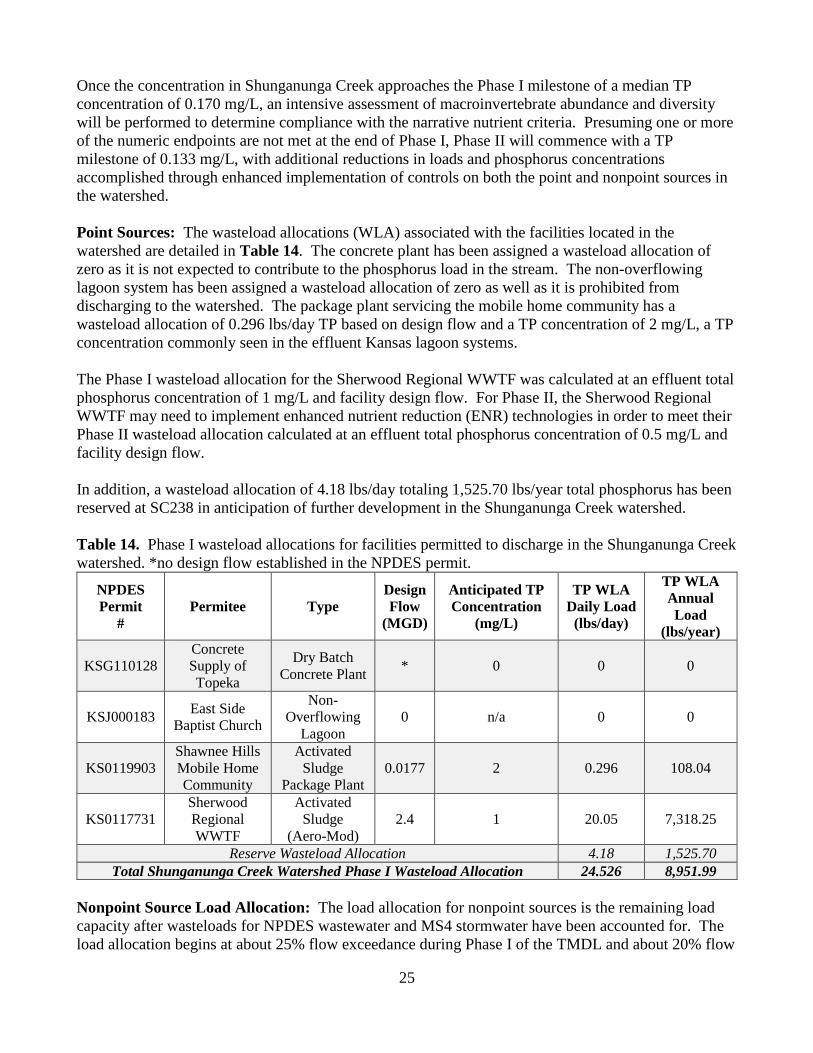
Once the concentration in Shunganunga Creek approaches the Phase I milestone of a median TP concentration of 0.170 mg/L, an intensive assessment of macroinvertebrate abundance and diversity will be performed to determine compliance with the narrative nutrient criteria. Presuming one or more of the numeric endpoints are not met at the end of Phase I, Phase II will commence with a TP milestone of 0.133 mg/L, with additional reductions in loads and phosphorus concentrations accomplished through enhanced implementation of controls on both the point and nonpoint sources in the watershed. Point Sources: The wasteload allocations (WLA) associated with the facilities located in the watershed are detailed in Table 14. The concrete plant has been assigned a wasteload allocation of zero as it is not expected to contribute to the phosphorus load in the stream. The non-overflowing lagoon system has been assigned a wasteload allocation of zero as well as it is prohibited from discharging to the watershed. The package plant servicing the mobile home community has a wasteload allocation of 0.296 lbs/day TP based on design flow and a TP concentration of 2 mg/L, a TP concentration commonly seen in the effluent Kansas lagoon systems. The Phase I wasteload allocation for the Sherwood Regional WWTF was calculated at an effluent total phosphorus concentration of 1 mg/L and facility design flow. For Phase II, the Sherwood Regional WWTF may need to implement enhanced nutrient reduction (ENR) technologies in order to meet their Phase II wasteload allocation calculated at an effluent total phosphorus concentration of 0.5 mg/L and facility design flow. In addition, a wasteload allocation of 4.18 lbs/day totaling 1,525.70 lbs/year total phosphorus has been reserved at SC238 in anticipation of further development in the Shunganunga Creek watershed. Table 14. Phase I wasteload allocations for facilities permitted to discharge in the Shunganunga Creek watershed. *no design flow established in the NPDES permit.
NPDES Permit
# Permitee Type
Design Flow
(MGD)
Anticipated TP Concentration
(mg/L)
TP WLA Daily Load
(lbs/day)
TP WLA Annual Load
(lbs/year)
KSG110128 Concrete Supply of Topeka
Dry Batch Concrete Plant * 0 0 0
KSJ000183 East Side Baptist Church
Non-Overflowing
Lagoon 0 n/a 0 0
KS0119903 Shawnee Hills Mobile Home Community
Activated Sludge
Package Plant 0.0177 2 0.296 108.04
KS0117731 Sherwood Regional WWTF
Activated Sludge
(Aero-Mod) 2.4 1 20.05 7,318.25
Reserve Wasteload Allocation 4.18 1,525.70 Total Shunganunga Creek Watershed Phase I Wasteload Allocation 24.526 8,951.99
Nonpoint Source Load Allocation: The load allocation for nonpoint sources is the remaining load capacity after wasteloads for NPDES wastewater and MS4 stormwater have been accounted for. The load allocation begins at about 25% flow exceedance during Phase I of the TMDL and about 20% flow
26
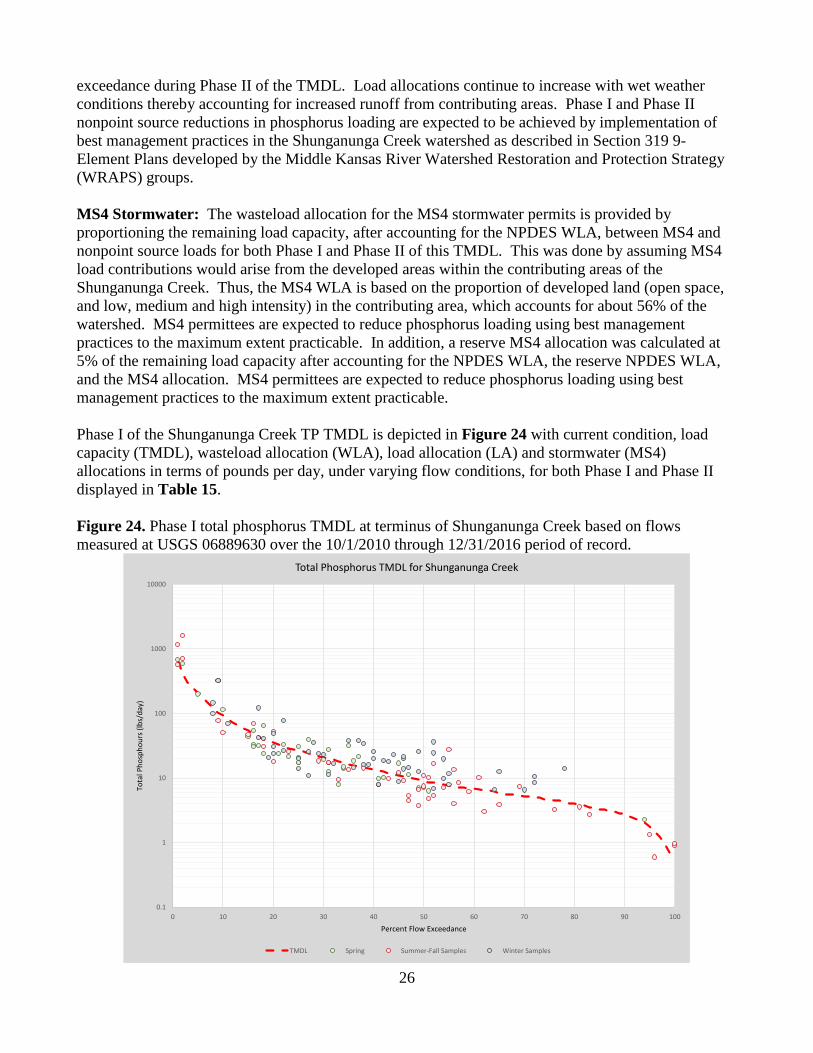
exceedance during Phase II of the TMDL. Load allocations continue to increase with wet weather conditions thereby accounting for increased runoff from contributing areas. Phase I and Phase II nonpoint source reductions in phosphorus loading are expected to be achieved by implementation of best management practices in the Shunganunga Creek watershed as described in Section 319 9-Element Plans developed by the Middle Kansas River Watershed Restoration and Protection Strategy (WRAPS) groups. MS4 Stormwater: The wasteload allocation for the MS4 stormwater permits is provided by proportioning the remaining load capacity, after accounting for the NPDES WLA, between MS4 and nonpoint source loads for both Phase I and Phase II of this TMDL. This was done by assuming MS4 load contributions would arise from the developed areas within the contributing areas of the Shunganunga Creek. Thus, the MS4 WLA is based on the proportion of developed land (open space, and low, medium and high intensity) in the contributing area, which accounts for about 56% of the watershed. MS4 permittees are expected to reduce phosphorus loading using best management practices to the maximum extent practicable. In addition, a reserve MS4 allocation was calculated at 5% of the remaining load capacity after accounting for the NPDES WLA, the reserve NPDES WLA, and the MS4 allocation. MS4 permittees are expected to reduce phosphorus loading using best management practices to the maximum extent practicable. Phase I of the Shunganunga Creek TP TMDL is depicted in Figure 24 with current condition, load capacity (TMDL), wasteload allocation (WLA), load allocation (LA) and stormwater (MS4) allocations in terms of pounds per day, under varying flow conditions, for both Phase I and Phase II displayed in Table 15. Figure 24. Phase I total phosphorus TMDL at terminus of Shunganunga Creek based on flows measured at USGS 06889630 over the 10/1/2010 through 12/31/2016 period of record.
0.1
1
10
100
1000
10000
0 10 20 30 40 50 60 70 80 90 100
Tota
l Pho
spho
urs (
lbs/
day)
Percent Flow Exceedance
Total Phosphorus TMDL for Shunganunga Creek
TMDL Spring Summer-Fall Samples Winter Samples
27
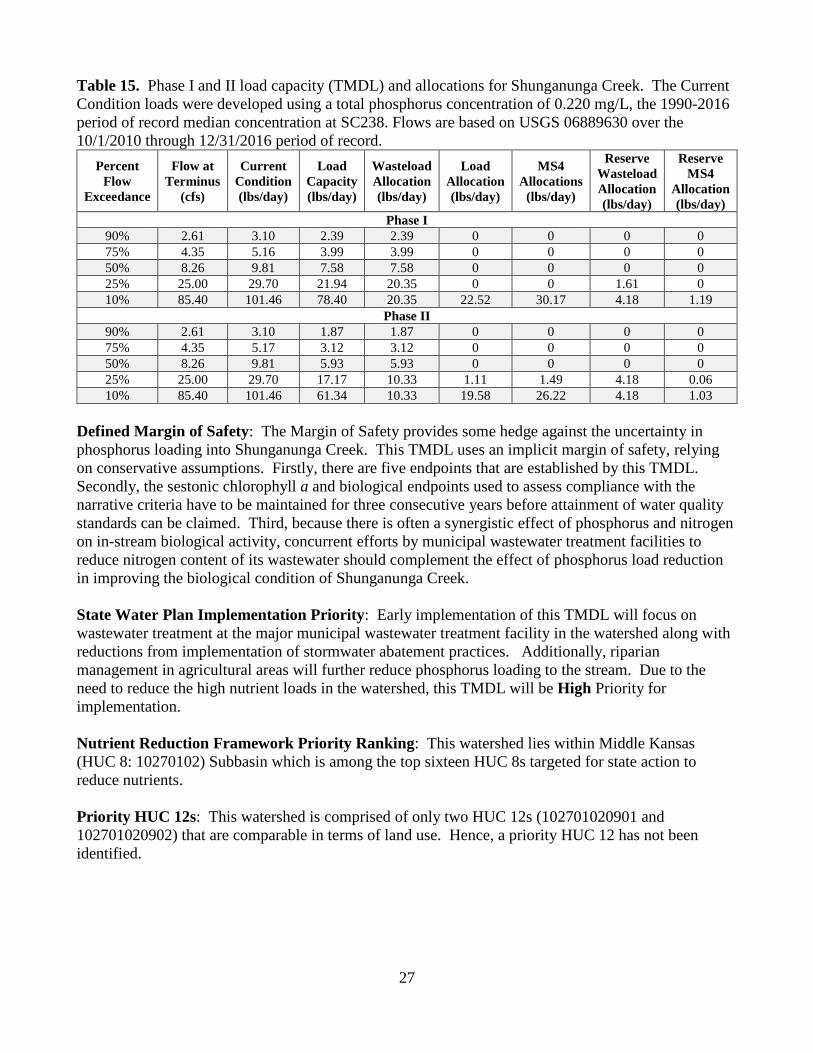
Table 15. Phase I and II load capacity (TMDL) and allocations for Shunganunga Creek. The Current Condition loads were developed using a total phosphorus concentration of 0.220 mg/L, the 1990-2016 period of record median concentration at SC238. Flows are based on USGS 06889630 over the 10/1/2010 through 12/31/2016 period of record.
Percent Flow
Exceedance
Flow at Terminus
(cfs)
Current Condition (lbs/day)
Load Capacity (lbs/day)
Wasteload Allocation (lbs/day)
Load Allocation (lbs/day)
MS4 Allocations
(lbs/day)
Reserve Wasteload Allocation (lbs/day)
Reserve MS4
Allocation (lbs/day)
Phase I 90% 2.61 3.10 2.39 2.39 0 0 0 0 75% 4.35 5.16 3.99 3.99 0 0 0 0 50% 8.26 9.81 7.58 7.58 0 0 0 0 25% 25.00 29.70 21.94 20.35 0 0 1.61 0 10% 85.40 101.46 78.40 20.35 22.52 30.17 4.18 1.19
Phase II 90% 2.61 3.10 1.87 1.87 0 0 0 0 75% 4.35 5.17 3.12 3.12 0 0 0 0 50% 8.26 9.81 5.93 5.93 0 0 0 0 25% 25.00 29.70 17.17 10.33 1.11 1.49 4.18 0.06 10% 85.40 101.46 61.34 10.33 19.58 26.22 4.18 1.03
Defined Margin of Safety: The Margin of Safety provides some hedge against the uncertainty in phosphorus loading into Shunganunga Creek. This TMDL uses an implicit margin of safety, relying on conservative assumptions. Firstly, there are five endpoints that are established by this TMDL. Secondly, the sestonic chlorophyll a and biological endpoints used to assess compliance with the narrative criteria have to be maintained for three consecutive years before attainment of water quality standards can be claimed. Third, because there is often a synergistic effect of phosphorus and nitrogen on in-stream biological activity, concurrent efforts by municipal wastewater treatment facilities to reduce nitrogen content of its wastewater should complement the effect of phosphorus load reduction in improving the biological condition of Shunganunga Creek. State Water Plan Implementation Priority: Early implementation of this TMDL will focus on wastewater treatment at the major municipal wastewater treatment facility in the watershed along with reductions from implementation of stormwater abatement practices. Additionally, riparian management in agricultural areas will further reduce phosphorus loading to the stream. Due to the need to reduce the high nutrient loads in the watershed, this TMDL will be High Priority for implementation. Nutrient Reduction Framework Priority Ranking: This watershed lies within Middle Kansas (HUC 8: 10270102) Subbasin which is among the top sixteen HUC 8s targeted for state action to reduce nutrients. Priority HUC 12s: This watershed is comprised of only two HUC 12s (102701020901 and 102701020902) that are comparable in terms of land use. Hence, a priority HUC 12 has not been identified.
28
5. IMPLEMENTATION Desired Implementation Activities:
1. Make operational changes in municipal wastewater treatment plants and implement alternative disposal such as irrigation and, if necessary, install enhanced nutrient reduction technology to reduce wasteloads.
2. Renew state and federal permits and inspect permitted facilities for permit compliance. 3. Facilitate urban and construction stormwater management in Shawnee County including the
city of Topeka to abate pollutant loads using best management practices to the maximum extent practicable.
4. Implement and maintain conservation farming, including conservation tilling, contour farming, and no-till farming to reduce runoff and cropland erosion in agricultural areas of the watershed.
5. Improve riparian conditions along stream systems by installing grass and/or forest buffer strips along the stream and drainage channels in the watershed.
6. Perform extensive soil testing to ensure excess phosphorus is not applied. 7. Ensure land applied manure is being properly managed and is not susceptible to runoff by
implementing nutrient management plans. 8. Install pasture management practices, including proper stock density to reduce soil erosion
and storm runoff. 9. Ensure that labeled application rates of chemical fertilizers are being followed and
implement runoff control measures. 10. The stakeholder leadership team for the Middle Kansas watershed WRAPS will coordinate
BMPs to address: a. Livestock: vegetative filter strips, relocate feeding sites, relocate pasture feeding
sites off-stream and alternate watering system. b. Cropland: waterways, terraces, conservation crop rotations and water retention
structures. NPDES and State Permits – KDHE
a. Monitor influent into and effluent from the discharging permitted wastewater treatment facilities, continue to encourage wastewater reuse and irrigation disposal and ensure compliance and proper operation to control phosphorus levels in wastewater discharges.
b. Establish applicable permit limits and conditions after 2021, with the initial implementation of goals and appropriate schedules of compliance for permits issued prior.
c. Establish TP concentration goal of 1.0 mg/L for the mechanical municipal wastewater treatment facility in accordance with the WLA.
d. Inspect permitted livestock facilities to ensure compliance. e. New livestock permitted facilities will be inspected for integrity of applied pollution
prevention technologies. f. New registered livestock facilities with less than 300 animal units will apply pollution
prevention technologies. g. Manure management plans will be implemented, to include proper land application rates
and practices that will prevent runoff of applied manure. h. Reduce runoff in MS4 permitted areas through stormwater management programs. i. Establish nutrient reduction practices among urban homeowners to manage application on
lawns and gardens, through respective stormwater management programs.
29
Nonpoint Source Pollution Technical Assistance – KDHE
a. Support Section 319 implementation projects for reduction of phosphorus runoff from agricultural activities as well as nutrient management.
b. Provide technical assistance on practices geared to the establishment of vegetative buffer strips.
c. Provide technical assistance on nutrient management for livestock facilities in the watershed and practices geared towards small livestock operations, which minimize impacts to stream resources.
d. Support the implementation efforts of the Middle Kansas WRAPS and incorporate long-term objectives of this TMDL into their 9-element watershed plan.
e. Engage the municipalities in the watershed to discuss stormwater load trading opportunities.
Water Resource Cost Share and Nonpoint Source Pollution Control Program – KDA-DOC
a. Apply conservation farming practices and/or erosion control structures, including no-till, terraces, and contours, sediment control basins, and constructed wetlands.
b. Provide sediment control practices to minimize erosion and sediment transport from cropland and grassland in the watershed.
c. Install livestock waste management systems for manure storage. d. Implement manure management plans.
Riparian Protection Program – KDA-DOC
a. Establish or reestablish natural riparian systems, including vegetative filter strips and streambank vegetation.
b. Develop riparian restoration projects along targeted stream segments, especially those areas with baseflow.
c. Promote wetland construction to reduce runoff and assimilate sediment loadings. d. Coordinate riparian management within the watershed and develop riparian restoration
projects. Buffer Initiative Program – KDA-DOC
a. Install grass buffer strips near streams. b. Leverage Conservation Reserve Enhancement Program to hold riparian land out of
production. Extension Outreach and Technical Assistance – Kansas State University
a. Educate agricultural producers on sediment, nutrient, and pasture management. b. Educate livestock producers on livestock waste management, land applied manure
applications, and nutrient management planning. c. Provide technical assistance on livestock waste management systems and nutrient
management planning. d. Provide technical assistance on buffer strip design and minimizing cropland runoff. e. Encourage annual soil testing to determine capacity of field to hold phosphorus. f. Educate residents, landowners, and watershed stakeholders about nonpoint source pollution.

30
g. Promote and utilize the WRAPS efforts for pollution prevention, runoff control and resource management. The WRAPS coordinator is also an extension watershed specialist that will provide technical assistance and outreach to producers for BMP implementation. Other entities for this task include NRCS and local conservation districts.
Timeframe for Implementation: Reduction strategies for the mechanical wastewater treatment facility should be evaluated by 2019 with subsequent planning, design, and construction of any necessary enhanced treatment initiated by the next permit starting in 2022. Urban stormwater and rural runoff management should expand in 2019 to ensure nutrients are addressed. Pollutant reduction practices should be installed within the priority subwatersheds before 2022 with follow-up implementation over 2022-2027. Phase I of this TMDL will occur from 2019 to 2039. If biology in Shunganunga Creek has not responded to Phase I reductions by 2039 then Phase II implementation will commence in 2040. Targeted Participants: The primary participants for implementation will be municipal wastewater and stormwater programs, and agricultural and livestock producers operating immediately adjacent to the Shunganunga Creek and its tributaries. Watershed coordinators and technical staff of the WRAPS, along with Conservation District personnel and county extension agents should assess possible sources adjacent to streams. Implementation activities to address nonpoint sources should focus on those areas with the greatest potential to impact nutrient concentrations adjacent to the river. Targeted Activities to focus attention toward include:
1. High-density urban and residential development in proximity to streams and tributary areas. 2. Urban residents should be informed on fertilizer and waste management through their
respective municipal Stormwater Management Programs to reduce urban runoff loads. 3. Overused grazing land adjacent to the streams. 4. Sites where drainage runs through or adjacent to livestock areas. 5. Sites where livestock have full access to the stream as a primary water supply. 6. Poor riparian area and denuded riparian vegetation along the stream. 7. Unbufferred cropland adjacent to the stream. 8. Conservation compliance on highly erodible areas. 9. Total row crop acreage and gully locations.
Milestone for 2023: By 2023, advancement of necessary and appropriate measures to decrease the effluent phosphorus content from the municipal wastewater facilitiy should be implemented. At that point in time, phosphorus data from the Shunganunga Creek stream chemistry station SC238 should show indication of declining concentrations relative to the pre-2016 data, particularly during low and normal flow conditions. Delivery Agents: The primary delivery agents for program participation will be Shawnee County, the City of Topeka, KDHE, and the Middle Kansas WRAPS. Reasonable Assurances: Authorities: The following authorities may be used to direct activities in the watershed to reduce pollution:
1. K.S.A. 65-164 and 165 empowers the Secretary of KDHE to regulate the discharge of sewage into the waters of the state.
31
2. K.S.A. 65-171d empowers the Secretary of KDHE to prevent water pollution and to protect the beneficial uses of the waters of the state through required treatment of sewage and established water quality standards and to require permits by persons having a potential to discharge pollutants into the waters of the state.
3. K.S.A. 2002 Supp. 82a-2001 identifies the classes of recreation use and defines impairment
for streams.
4. K.A.R. 28-16-69 through 71 implements water quality protection by KDHE through the establishment and administration of critical water quality management areas on a watershed basis.
5. K.S.A. 2-1915 empowers the Kansas Department of Agriculture, Division of Conservation
to develop programs to assist the protection, conservation and management of soil and water resources in the state, including riparian areas.
6. K.S.A. 75-5657 empowers the Kansas Department of Agriculture, Division of
Conservation to provide financial assistance for local project work plans developed to control nonpoint source pollution.
7. K.S.A. 82a-901, et. seq. empowers the Kansas Water Office to develop a state water plan
directing the protection and maintenance of surface water quality for the waters of the state.
8. K.S.A. 82a-951 creates the State Water Plan Fund to finance the implementation of the Kansas Water Plan, including selected Watershed Restoration and Protection Strategies.
9. The Kansas Water Plan and the Kansas Regional Planning Area plan provide the guidance
to state agencies to coordinate programs intent on protecting water quality and to target those programs to geographic areas of the state for high priority implementation.
Funding: The State Water Plan annually generates $12-13 million and is the primary funding mechanism for implementing water quality protection and pollution reduction activities in the state through the Kansas Water Plan. The state water planning process, overseen by the Kansas Water Office, coordinates and directs programs and funding toward watershed and water resources of highest priority. Typically, the state allocates at least 50% of the fund to programs supporting water quality protection. This watershed and its TMDL are located within a High Priority area and should receive support for pollution abatement practices that lower the loading of sediment and nutrients. Effectiveness: Use of Biological Nutrient Removal technology has been well established to reduce nutrient levels, including phosphorus, in wastewater and Enhanced Nutrient Removal establishes phosphorus levels approaching pragmatic limits of technology. Additionally, nutrient control has been proven effective through conservation tillage, contour farming and use of grass waterways and buffer strips. In addition, the proper implementation of comprehensive livestock waste management plans has proven effective at reducing nutrient runoff associated with livestock facilities. Presuming the biological endpoints are not met, this TMDL will be reevaluated after 2028 to assess the reductions in phosphorus loads and concentrations and the desired endpoints.
32
6. MONITORING Future stream chemistry sampling will continue at SC238 with sestonic chlorophyll a monitoring commencing once stream TP concentrations approach 0.170 mg/L. Monitoring of TP should be a condition of the MS4 permits within the TMDL watershed. Once TP concentrations approach 0.170 mg/L in Shunganunga Creek, macroinvertebrate sampling at SB238 will be performed to assess the biotic integrity of the stream. If the biological endpoints are achieved over 2023-2027 at SB238, the conditions descried by the narrative nutrient criteria will be viewed as attained and the Shunganunga Creek will be moved to Category 2 on the 2028-303(d) list. Once the water quality standards are attained, the adjusted ambient phosphorus concentrations in Shunganunga Creek will be the basis for establishing numeric phosphorus criteria through the triennial water quality standards process to protect the restored biological and chemical integrity of the stream. 7. FEEDBACK Public Notice: An active Internet Web site is established at http://www.kdheks.gov/tmdl/planning_mgmt.htm to convey information to the public on the general establishment of TMDLs and specific TMDLs for the Kansas-Lower Republican River Basin. This TMDL was posted to this site on June 8, 2017 for public review. Public Hearing: A Public Hearing on the Shunganunga Creek TP TMDL was held in Topeka, Kansas on June 28, 2017 to receive comments on this TMDL. There were no comments received. Milestone Evaluation: In 2023, evaluation will be made as to the degree of implementation that occurred within the TMDL watershed. Subsequent decisions will be made through the WRAPS regarding the non-points source implementation approach and follow up of additional implementation in the watershed. Consideration for 303(d) Delisting: Shunganunga Creek will be evaluated for delisting under Section 303(d), based on the monitoring data over the period 2017-2027. Therefore, the decision for delisting will come about in the preparation of the 2028 303(d) list. Should modifications be made to the applicable water quality criteria during the ten-year implementation period, consideration for delisting, desired endpoints of this TMDL, and implementation activities may be adjusted accordingly. Incorporation into the TMDL Vision Process, Water Quality Management Plan and the Kansas Water Planning Process: Under the current version of the Kansas TMDL Vision Process, the next anticipated revision would come in 2022, which will emphasize implementation of WRAPS activities and reduction of nutrients in wastewater developed by NPDES facilities. At that time, incorporation of this TMDL will be made into the WRAPS watershed plans. Recommendations of this TMDL will be considered in the Kansas Water Plan implementation decisions under the State Water Planning Process for Fiscal Years 2017-2025. Developed 08/24/17
33
References Electric Power Research Institute Survey on Septic System Failure Rate found at: http://it.tetratech-ffx.com/steplweb/Faq.htm#Q4 Juracek, K.E., 2000. Soils – Potential Runoff. U.S. Geological Survey Open-File Report 00-253. Kansas Department of Health and Environment. 2010. Kansas Reference Streams: Selection of
Suitable Candidates, Impending threats To Reference Stature, And Recommendations For Long-Term Conservation.
Kansas Department of Health and Environment. 2016. Methodology for the Evaluation and
Development of the 2016 Section 303(d) List of Impaired Water Bodies for Kansas. http://www.kdheks.gov/tmdl/download/2014_303_d_Methodology.pdf Kansas Surface Water Quality Standards and Supporting Material found at: http://www.kdheks.gov/water/download/kwqs_plus_supporting.pdf National Oceanic and Atmospheric Administration, National Centers for Environmental Information.
Accessed 10/6/2016: Custom Global Summary, Precipitation (PRCP), Station GHCND: USC00142652. http://www.ncdc.noaa.gov/cdo-web/confirmation
National Land Cover Database, 2011. http://www.mrlc.gov/ Perry, C.A., D.M. Wolock and J.C. Artman. 2004. Estimates of Flow Duration, Mean
Flow, and Peak-Discharge Frequency Values for Kansas Stream Locations, USGS Scientific Investigations Report 2004-5033.
United States Army Corps of Engineers. 2013. Annual Report of Reservoir Regulation Activities.
http://www.nwk.usace.army.mil/Portals/29/13AnnualRep.pdf United States Army Corps of Engineers. 2014. Monthly Charts of Reservoir Data. http://www.swt-
wc.usace.army.mil/ELDRcharts.html United States Census Bureau. 2010. http://www.census.gov/ United States Department of Agriculture. State of Kansas Quick Stats.
https://www.nass.usda.gov/Statistics_by_State/Kansas/index.php Watershed Restoration and Protection Strategy 9 Element Plan, Middle Kansas River. http://www.kswraps.org/files/attachments/middlekansas_plansummary_0.pdf