kansas energy plan - justfacts.com · beneficial effects, ... change, including the ... retain and...
TRANSCRIPT

Kansas Energy Report 2009
Kansas Energy Council
www.kec.kansas.gov
January 7, 2009

The Kansas Energy Report 2009 contains the policy and program recommendations approved by the Kansas Energy Council (KEC) during 2008, as well as associated background information. The Report, previously called the Kansas Energy Plan, was delivered to the Governor, Legislature, and Kansas Corporation Commission on January 7, 2009. It is also available online (http://www.kec.kansas.gov/energy_plan.htm), along with the recommendations and background information developed in previous years.
ii
Kansas Energy Report 2009 Chapter 2: Energy, Economics, and the Environment
Section 2.3: Greenhouse Gas Emissions and Global Climate Change .................. 1 Topic / Issue Description ................................................................................. 1 Existing Policies and Programs ....................................................................... 6 Policy and Program Recommendations ......................................................... 12
Chapter 8: Electricity
Overview .................................................................................................................... 18 Section 8.1: Electric Utilities in Kansas .............................................................. 21
Topic / Issue Description ............................................................................... 21 Existing Policies and Programs ..................................................................... 24
Section 8.2: Electricity Generation: Demand, Capacity ...................................... 26 Topic / Issue Description ............................................................................... 26 Existing Policies and Programs ..................................................................... 27
Section 8.4: Electricity Generation and Carbon Dioxide Emissions ................... 29 Topic / Issue Description ............................................................................... 29 Existing Policies and Programs ..................................................................... 30 Policy and Program Recommendations ......................................................... 32
Chapter 9: Energy Conservation and Efficiency
Overview .................................................................................................................... 38 Section 9.4: Public Structures .............................................................................. 40
Topic / Issue Description ............................................................................... 40 Existing Policies and Programs ..................................................................... 40 Policy and Program Recommendations ......................................................... 44
Chapter 10: Energy Use in the Transportation Sector Overview .................................................................................................................... 50
Section 10.1: Cars, Light Trucks ......................................................................... 51 Topic / Issue Description ............................................................................... 51 Existing Policies and Programs ..................................................................... 52 Policy and Program Recommendations ......................................................... 54
Chapter 11: Energy Use in the Agricultural Sector
Overview .................................................................................................................... 56 Section 11.1: Crop Agriculture ............................................................................ 57
Topic / Issue Description ............................................................................... 57 Existing Policies and Programs ..................................................................... 58 Policy and Program Recommendations ......................................................... 59
Appendix 1: Energy Consumption Forecasts ............................................................. 63 Table A1: Summary of Kansas petroleum products consumption ............................. 64 Table A2: Summary of Kansas natural gas consumption .......................................... 66 Table A2: Summary of Kansas electricity consumption ............................................ 67
iii

iv

Kansas Energy Report 2009 Section 2.3: Greenhouse Gas Emissions and Global Climate Change
1
Section 2.3: Greenhouse Gas Emissions and Global Climate Change Topic / Issue Description Climate change and the role of anthropogenic (human-caused) greenhouse gas emissions continue to be discussed by scientists, policymakers, and interested citizens in the U.S. and around the world.1 According to the U.N. Intergovernmental Panel on Climate Change (IPCC),2 global mean surface air temperature increased about 1.44°F (0.76°C) during the 20th century.3 Surface temperature data from around the world show an “especially pronounced warming trend during the past 30 years,” with nine of the ten warmest years on record occurring in the past decade.4 As for the probable cause of the warming, the IPCC report states that it is “very likely” (at least 90% probability) to be the result of human activities—primarily, the combustion of fossil fuels and release of carbon dioxide into the atmosphere.5 This conclusion is endorsed by many in the scientific community, including the national academies of the G8 countries, the National Research Council, the American Meteorological Society, and the American Geophysical Union; however, there are those who challenge the assumption and argue that the current warming trend is the result of natural variability.6 Although projections of impacts from climate change are highly uncertain, historical and statistical evidence suggest that a warmer global climate could produce both harmful and beneficial effects, and these effects will vary by region. People in developing countries are likely more vulnerable to damaging effects than those in developed countries, largely because they have fewer resources for coping with impacts and also because some of these countries have large populations in concentrated regions vulnerable to a rise in sea
1 In response to a mandate from Congress, the National Academy of Sciences has established a Climate Change Study Committee (http://dels.nas.edu/basc/climate-change/background.shtml) that will “investigate and study the serious and sweeping issues relating to global climate change and make recommendations regarding what steps must be taken and what strategies must be adopted in response to global climate change, including the science and technology challenges thereof.” 2 The IPCC was established by the World Meteorological Organization (WMO) and the United Nations Environment Programme (UNEP) in 1988. Its role “is to assess on a comprehensive, objective, open and transparent basis the scientific, technical and socio-economic information relevant to understanding the scientific basis of risk of human-induced climate change, its potential impacts and options for adaptation and mitigation”: http://www.ipcc.ch/about/about.htm). 3 Hegerl, G.C., F. W. Zwiers, P. Braconnot, N.P. Gillett, Y. Luo, J.A. Marengo Orsini, N. Nicholls, J.E. Penner, and P.A. Stott, 2007: Understanding and Attributing Climate Change, in Climate Change 2007: The Physical Science Basis, Contribution of Working Group I to the Fourth Assessment Report of the Intergovernmental Panel on Climate Change, p. 683: http://ipcc-wg1.ucar.edu/wg1/Report/AR4WG1_Print_Ch09.pdf. 4 National Research Council, 2008, Understanding and Responding to Climate Change: Highlights of National Academies Reports: http://dels.nas.edu/basc/climate-change/basics.shtml (accessed August 2008). 5 Experts generally focus on six major greenhouse gases: carbon dioxide (CO2), methane (CH4), nitrous oxide (N2O), hydrofluorocarbons (HFC), perfluorocarbons (PFC), and sulfur hexafluoride (SF6). Water vapor is also an important greenhouse gas, but its atmospheric concentration is not generally affected by human activity. 6 CNN, 2007, Global warming: A natural cycle or human result?, by Manav Tanneeru: http://www.cnn.com/2007/TECH/science/07/11/globalwarming.overview/index.html.
Kansas Energy Report 2009 Section 2.3: Greenhouse Gas Emissions and Global Climate Change
level or flooding or in marginal agricultural lands vulnerable to drought. Warming would probably increase natural range of insect-borne diseases and also disrupt deep ocean currents that strongly influence global climate (thermohaline circulation). Very rapid changes in climate could have drastic impacts on plants and animals.7 As the scientific community works towards better understanding of climate change and its potential impacts, policymakers around the world are considering strategies for stabilizing and then reducing global GHG emissions. In the U.S., a variety of approaches are being advocated by the public, industry, interest groups, and policymakers (see summary of Congressional bills below under Existing Policies and Programs). These approaches can be distinguished in terms of (1) their scope—international, national, regional, or statewide—and (2) total cost to achieve the same level of reduction. Scope—First, regarding the question of scope, it is perhaps important to reiterate the seemingly obvious point that global warming is a problem requiring an international, collective solution: greenhouse gas emissions cause equal harm to the global atmosphere no matter where they are emitted. Thus, in a global economy where nations and companies are increasingly forced to compete on cost, unilateral attempts to implement costly carbon regulation are unlikely to be successful. Moreover, as noted in a recent white paper prepared by the Congressional Budget Office: “One key factor that distinguishes climate change from other pollution problems our country has tackled is that local greenhouse gas emissions do not cause local environmental or health problems, except to the extent that the emissions contribute to global atmospheric concentrations.”8 As the history of the Kyoto Protocol suggests, establishing the framework and institutions for a truly global approach will be challenging and require a high level of political cooperation. It will also require a high level of participation, including participation by developing nations such as India and China. Among the many issues complicating the international approach are the widely varying costs of achieving GHG reductions and the dramatically different cost and benefit implications of climate change for different countries around the world—that is, the fact that there will be winners as well as losers.9 Nonetheless, broad participation is essential to success of any international framework and must include both developed and developing countries.10, 11
7 Congressional Budget Office (CBO), 2003, The Economics of Climate Change—A Primer: CBO Study, April 2003: www.cbo.org. URL’s for this and other resources related to greenhouse gas policy and economics are available, under the “Resources” heading, on the KEC web site: http://www.kec.kansas.gov/mga/index.htm. 8 CBO, 2008, Climate Change Legislation Design White Paper: Appropriate Roles for Different Levels of Government, Committee on Energy and Commerce Staff, February 2008: http://energycommerce.house.gov/Climate%5FChange/. 9 CBO, 2003, p. 25: “In sum, policymakers may be faced with the extraordinarily complicated task of managing a resource that no one owns, that everyone depends on, and that provides a wide range of very different—and often public—benefits to different people in different regions over very long periods.” 10 Stavins, Robert N., Beyond Kyoto: Getting Serious About Global Climate Change, Presentation at the Department of Economics, University of Warsaw, Warsaw, Poland, Harvard Project on International Climate Agreements, November 13, 2007: http://belfercenter.ksg.harvard.edu/publication/17698/beyond_kyoto.html.
2

Kansas Energy Report 2009 Section 2.3: Greenhouse Gas Emissions and Global Climate Change
To date, the U.S. has not implemented a national policy to reduce GHG emissions. Such a step is viewed by many as necessary to the establishment of a viable global framework, in part because the U.S. is responsible for roughly 21% of the annual global GHG emissions (China recently passed the U.S. as the nation with the greatest total annual emissions).12 At the national level, U.S. policymakers are considering regulation of GHG emissions.13 A federal approach would provide uniformity and a “level playing field,” so that GHG regulation would not create competitive disadvantages among the states nor strictly among U.S. companies. Many U.S. industries and businesses appear supportive of a national approach. Unlike a national approach, state or regional initiatives are likely to be redundant and lack uniformity, which will undermine their effectiveness. In advance of federal regulation, many states have implemented or are considering policies and programs in an effort to show leadership on the issue. These state efforts are largely focused around non-market-based mandates and standards, which are generally viewed as less efficient and less likely to achieve the stated goals (see discussion of costs below), in part because, absent federal regulation, some GHG emitters will simply avoid doing business in carbon-regulated states. Regional efforts—such as the Climate Registry, the Midwestern Greenhouse Gas Reduction Accord, the Western Climate Initiative, and Regional Greenhouse Gas Initiative—are also underway and, while plagued with some of the same problems, are likely to be more effective than unilateral state actions. Costs—Regarding the costs of the various policy options, there is widespread agreement that the most effective way to reduce carbon dioxide and other greenhouse gas emissions is to implement market-based initiatives, such as a carbon tax or cap-and-trade policy.14
11 William Nordhaus, 2008, A Question of Balance: Weighing the Options on Global Warming Policies: Yale University Press, 234 p. 12 A recent Congressional white paper highlights incentives in U.S. policy to encourage China and India to curb their emissions: Climate Change Legislation Design White Paper: Competitiveness Concerns/Engaging Developing Countries, prepared by the Committee on Energy and Commerce Staff, January 2008: http://energycommerce.house.gov/Climate%5FChange/ (accessed August 2008). 13 By July 2008, more than 235 bills, amendments, and resolutions had been introduced in the 110th Congress relating to climate change and greenhouse gas emissions. In March 2007, the House created the Select Committee on Energy Independence and Global Warming. As of November 2008, the major proposals in play are the Kerry-Snowe Global Warming Reduction Act, Sanders-Boxer Global Warming Pollution Reduction Act, Bingaman-Specter Low Carbon Economy Act, Olver-Gilchrest Climate Stewardship Act, Boxer-Lieberman-Warner Climate Security Act of 2008, Dogget Climate Market, Auction, Trust and Trade Emissions Reduction System Act of 2008, Markey Investing in Climate Action and Protection, Waxman Safe Climate Act of 2007, and McCain-Lieberman Climate Stewardship and Innovation Act. All of the aforementioned acts promulgate a market-based cap-and-trade system; two additional bills supporting a carbon tax have been introduced but have less legislative support: Stark Save Our Climate Act of 2007, and Larson America’s Energy Security Trust Fund Act of 2007. These two bills have proposed implementing an upstream $10 tax per ton of carbon content and an upstream and midstream $15 tax per ton of carbon dioxide content respectively 14 Unless noted otherwise, information comes from the 2007 KEC staff review, Greenhouse Gas Emissions—Policy and Economics: A Report Prepared for the Kansas Energy Council by Trisha Shrum, August 3, 2007: http://www.kec.kansas.gov/reports/GHG_Review_FINAL.pdf.
3

Kansas Energy Report 2009 Section 2.3: Greenhouse Gas Emissions and Global Climate Change
In addition to being more likely to achieve the goal of reducing greenhouse gas emissions, market-based initiatives are much more efficient—that is, they achieve the same amount of reduction at a lower cost—than non-market mandates and standards.15 Market-based approaches, such as a carbon tax or cap-and-trade policy, put a monetary value on something that was previously external to market forces—for example, health and environmental costs caused by pollutants such as SO2 or CO2,16 and provide the best incentives for individuals and firms to find low-cost ways to reduce emissions through behavioral changes and innovative technologies.17 Even optimal policies represent very large revenue transfers from consumers to producers (if permits are given away) or to governments (if emissions are taxed).18 Although estimates of economic impact of GHG regulation vary, most economists concur that the benefits of acting today to mitigate greenhouse gas emissions outweigh the costs.19 Carbon Tax—The policy most widely supported by economists is an economy-wide tax on carbon and other GHG emissions. The tax is a direct incentive to reduce consumption and spur development of alternatives, both of which can stimulate further reductions in emissions. Slowly increasing the tax allows the economy to make lowest cost improvements first, followed by more substantial changes. This puts steady pressure on the markets to determine the best pathway towards emissions reduction. One major advantage of a carbon tax is that it provides clear, more predictable prices. In a cap-and-trade system, permit prices fluctuate, with the potential of either extremely high permit prices causing debilitating compliance costs or extremely low permit prices creating insufficient incentive for emissions reductions. In addition, a carbon tax has much lower administrative costs and is more transparent than a cap-and-trade. Furthermore, since it does not create a new commodity (like the permits or allowances in the cap-and-trade system), a carbon tax is less vulnerable to profiteering and requires less oversight. Although a carbon tax is likely to be more efficient than a cap-and-trade mechanism, taxes are always politically unpopular, and even more so in a time of economic recession. Among the proposals currently under consideration by Congress, almost all call for a cap-and-trade mechanism, instead of a tax (see discussion under Recommendation 1). It is 15 Regulatory mandates that focus on particular solutions increase demand for targeted products, which creates even higher prices for consumers and a possible subsidy for producers. 16 Non-market policies, on the other hand, mandate particular solutions and technologies or set centrally directed standards that must be met, possibly without regard for the costs and resultant benefits. Non-market policies tend to be less flexible, a one-size-fits-all approach that leaves less room for innovation and individualized decisions. 17 CBO, 2003. 18 See Nordhaus, 2008, p. 202: “The transfers in the optimal ... programs rise gradually to around 1 percent of consumption, which is itself a major change in fiscal structure. Given the squawks that often arise from relatively small tax or price increases, even a modest program ... is likely to prove politically arduous.” 19 Nobel laureate Kenneth J. Arrow concluded that the benefits of acting today outweigh the costs, even without the absurdly high rates of future discounting (as were used in the Stern Review); see Arrow, 2007, Global Climate Change: A Challenge to Policy: Economist’s Voice: www.bepress.com/ev (accessed April 2008).
4

Kansas Energy Report 2009 Section 2.3: Greenhouse Gas Emissions and Global Climate Change
worth noting that opposition to a carbon tax may be reduced if the policy were “revenue neutral”—that is, if carbon tax revenues were used to offset other taxes.20 Tax revenues can also be used to mitigate the impact on low-income households. Cap-and-Trade—A cap-and-trade policy sets a limit on the quantity of carbon and other GHG emissions, issues permits equaling that quantity, and allows trading of the permits among entities that emit. This creates a market for greenhouse gas reductions, and, once that market is operational, a market-based price for each ton of emissions. Because emissions are capped at a fixed level, regardless of the cost to achieve that level of reduction, permit prices are subject to large fluctuations and unpredictability, which may complicate decisions to invest in abatement technologies and strategies. However, as discussed below (see hybrid cap-and-trade), a cap-and-trade system can be designed so that it operates as efficiently as a carbon tax. Significant administrative oversight will be required to track emissions, ensure permit compliance, and monitor trading in a cap-and-trade system, all of which adds to the administrative and, thus, overall costs of reducing emissions. Even though it is likely to cost consumers more, a cap-and-trade policy is generally favored by policymakers over a carbon tax. Industry has voiced considerable support for a cap-and-trade policy, though that support may depend on the design of the cap-and-trade mechanism and may wane if the permits are auctioned rather than given away for free. Another advantage of the cap-and-trade system is that it lends itself to clearly stated annual emissions limits (or goals), and quantitative goals are attractive to policymakers. Although there is an assumption that quantitative limits will “ensure that the globe remains on the safe side of "dangerous interferences’ with the climate system,”21 it is important to remember that the greenhouse effect depends on the accumulation of GHGs, and, thus, annual emissions have only a small, incremental impact on atmospheric concentrations. It is possible that focusing on the quantity of annual emissions may actually detract from the goal of reducing atmospheric concentrations over time in the most cost-effective manner. Hybrid Cap-and-Trade System—To address the potential political limitations of the tax and the economic efficiency issues of cap-and-trade approaches, some economists have proposed hybrid cap-and-trade systems that incorporate elements of a GHG tax scheme.22 One such proposal calls for an “upstream” cap-and-trade system in which “first sellers of
20 Gregory Mankiw, One answer to global warming: A new tax, New York Times, September 16, 2007: http://www.nytimes.com/2007/09/16/business/16view.html. Mankiw summarizes another proposed tax shift: “Gilbert Metcalf, a professor of economics at Tufts, has shown how revenue from a carbon tax could be used to reduce payroll taxes in a way that would leave the distribution of total tax burden approximately unchanged.” 21 Nordhaus, 2008, p. 25. 22 See, for example, Robert Repetto, 2007, National Climate Policy: Choosing the Right Architecture; Congressional Budget Office, 2008, Policy Options for Reducing CO2 Emissions; and other resources available on the KEC’s GHG Policy Committee web page: http://www.kec.kansas.gov/mga/index.htm.
5

Kansas Energy Report 2009 Section 2.3: Greenhouse Gas Emissions and Global Climate Change
fossil fuels” are required to hold permits, with enforcement at the refinery gate for petroleum, at the first distribution point for natural gas, at the mine shipping terminus for coal, and at the port for imports.23 Such a hybrid cap-and-trade approaches the comprehensiveness of a tax and is, thus, more efficient than proposals that concentrate only on some sectors. Other hybrid proposals create a fixed number of tradable, long-term emissions permits that equal long-term reduction goals as well as annual permits sold at a fixed price but in unlimited quantities. Like both the tax and cap-and-trade approaches, this hybrid proposal will help achieve the reductions where they are the cheapest.24 In summary, nearly all economists agree that market-based policies, which put a price on carbon, are the best way to reduce greenhouse gas emissions. This agreement was highlighted in the recent (October 2008) “open letter” to policymakers signed by over 250 Canadian economists (as well as a similar letter from Canadian scientists), which calls for implementation of market-based policies that focus directly on the problem of all GHG emissions, instead of targeting a few solutions.25 Moreover, market-based policies implemented at the federal level are more likely to be effective than such policies implemented at the state or regional level. However, this does not “lead to the conclusion that States, Tribes, or localities should not do anything to address climate change.”26 Existing Policies and Programs 1. The Kyoto Protocol is an agreement made under the United Nations Framework
Convention on Climate Change. Countries that ratified this protocol committed to reductions in their greenhouse gas emissions or to participation in emissions trading if emissions were not reduced. As of August, 2006, 165 countries and other governmental entities ratified the agreement. The United States and Australia, though signatories, did not ratify the agreement. The Kyoto Protocol has been criticized for having trivial short-term benefits without offering long-term solutions. In particular, the short-term emission targets for U.S. were viewed as overly ambitious; emission
23 Repetto, 2007. 24 However, the annual permits sold for a fixed price (which can be adjusted as needed) place an upper limit on the cost of emissions reduction, thus preventing undue economic hardship. Basing the value of long-term permits on the long-term goal avoids the problem of setting an overly lax short-term cap. In addition, the annual permit price can be controlled to adjust the pressure towards further reductions. 25 An Open Letter to the leaders of Canada’s Federal Political Parties: http://www.econ-environment.ca/open-letter.html. See also the letter from the Canadian scientists (http://www.site.climateletter.org/), which states “Economists around the world agree. There is only one way to deal with global warming. And that is to put a price on emissions. This can be done through either a carbon tax, a cap and trade system, or both.” It continues, “It is disingenuous to claim on the one hand that the carbon tax will cause an economic disaster and on the other hand advocate for a cap and trade system. They are equivalent economic instruments that have the same effect of pricing emissions. Ordinary Canadians deserve to be told this and not have the issue obscured in political rhetoric.” 26 CBO, 2008, p. 12. The white paper offers the following conclusion on p. 25: “The appropriate roles for Federal, State, Tribal, and local governments in a comprehensive, national approach to climate change will be affected by the design of the underlying approach.”
6
Kansas Energy Report 2009 Section 2.3: Greenhouse Gas Emissions and Global Climate Change
targets in general were relaxed in 2001 in order to entice Canada, Japan, and Russia to join the agreement.27
On December 14, 2007, the United Nations Framework Convention on Climate Change adopted the Bali roadmap, in which all participating countries acknowledged the findings of the IPCC 2007--that global climate change is happening and delaying action increases the risks of more severe climate change impacts. Furthermore, the Bail roadmap creates the Ad Hoc Working Group on Long-term Cooperative Action, which is charged with creating a new Kyoto Protocol-type agreement by the end of 2009.28
2. The European Union’s Emissions Trading Scheme (EU ETS) began on January 1,
2005, and included 25 countries. The program began with a “warm-up” phase ending December 31, 2007, during which only carbon dioxide was regulated and only four sectors—iron and steel, minerals (cement, glass, etc.), energy, and pulp and paper—were included in the emissions trading. Each country was required to submit an allocation plan for approval by the European Commission to ensure that permit allocation requirements were met. Banking and borrowing of credits was allowed within and between periods, with the flexibility for each country to restrict banking between the first and second phases. Penalties for exceeding allowances were set at €40 per ton of CO2 during the first phase, in addition to requiring the offset of excess emissions in the phase subsequent to the violation. The EU ETS suffered from an over-allocation of allowances in the first phase, which precipitated a dramatic crash in the price of carbon permits to below €0.30 in May 2007, compared with €31.50 in April 2006. Phase two of the scheme began in January of 2008, and to date 2008-vintage allowances have experienced less price volatility, fluctuating from a year-to-date high of €29.33 in July to a low of €17.63 in October. The EU ETS also allows for the U.N.’s Clean Development Mechanisms (CDM) and Joint Implementation credits to be converted into allowances suitable for trading. CDM and Joint Implementation credits are given to companies who invest in greenhouse-gas-reducing technologies in developing countries and allow for greenhouse gas reductions at lower costs than would be available domestically. However, these offsets have also provided opportunities for gaming and outright fraud.29
27 For further discussion of the failures of the Kyoto Protocol, and what sorts of mechanisms any agreement in the future should contain, see Stavins, 2007, Beyond Kyoto: Getting Serious about Global Climate Change. 28 See United Nations’ Framework Convention on Climate Change, December 2007, Revised Draft Decision -/CP.13: http://unfccc.int/resource/docs/2007/cop13/eng/l07r01.pdf (accessed December 2008). 29 For example, 28% of CDM’s offsets credits (in excess of $6.5 billion) were awarded for programs designed to reduce emissions of the very potent greenhouse gas HFC-23, emitted in the manufacture of industrial refrigerants. However, the simple technology needed to capture these HFC-23 emissions costs less than $150 million. The end result of credits given for this purpose was the creation of incentives within the developing world to produce excess amounts of HFC-23 simply to capture wastes for huge profits. See Michael Wara and David Victor, April 2008, A Realistic Policy on International Carbon Offsets, Freeman Spogli Institute for International Studies at Stanford University: http://pesd.stanford.edu/publications/a_realistic_policy_on_international_carbon_offsets/ (accessed 2008); see also Michael Wara, 2007, Is the global carbon market working?: Nature, vol. 445, p. 595-596. Numbers converted from Euros at a rate of 1.4195 Dollars per Euro.
7

Kansas Energy Report 2009 Section 2.3: Greenhouse Gas Emissions and Global Climate Change
3. On September 10, 2008, the New Zealand parliament approved the “Emissions Trading and Renewable Preference” bill, which establishes the first nation-wide mandatory cap-and-trade program outside of the EU. Trading of carbon permits under the New Zealand Emission Trading Scheme (NZ ETS) will begin in 2009 for the forestry and transportation industry, with other sectors of the economy gradually phased in through 2013. The NZ ETS targets emissions reductions from a variety of sources: forestry, transportation, electrical production, non-energy industrial processes, and agricultural uses.
4. Carbon taxes have been implemented by a number of nations. Sweden began taxing
carbon emissions in 1991. Currently, the tax is equivalent to $150 per ton of carbon dioxide, though fuels used for electricity generation are exempted and industries are required to pay only 50% of the tax (however, non-industrial consumers pay a separate tax on electricity). Because fuels from renewable sources such as ethanol, methane, biofuels, peat, and waste are exempted, Sweden has seen a great expansion of the use of biomass for heating and industry. The Swedish Ministry of Environment projected that the tax policy lowered carbon dioxide emissions in 2000 by 20 to 25% from 1990 levels. Following Sweden’s lead, Finland, Norway, and Denmark enacted carbon taxes in the early 1990’s. Following the Kyoto Protocol, Germany, Japan, the United Kingdom, and the Netherlands enacted various types and levels of carbon taxes or taxes on electricity.
In North America, Quebec implemented a carbon tax on October 1, 2007, affecting hydrocarbon fuels such as petroleum, coal, and natural gas. The tax is equivalent to about $13 per ton of carbon ($3.55 per ton of carbon dioxide) and adds 3.4 cents to the price of a gallon of gasoline. On July 1, 2008, British Columbia also implemented a carbon tax on hydrocarbon fuels; this tax is initially based on a rate of $10 per ton of carbon ($2.72 per ton of carbon dioxide) and will increase by $5 a year to $30 a ton by 2012. The city of Boulder recently enacted the first U.S. tax on carbon emissions from electricity. The tax is equivalent to $7 per ton of carbon ($1.91 per ton of carbon dioxide) and will cost the average household about $1.33 per month. The revenues, expected to be about $1 million, will be used to fund Boulder’s “climate action plan.” Other U.S. cities have begun to implement policies to reduce greenhouse gas emissions, often working together with other cities through programs such as the International Council for Local Environmental Initiatives and the U.S. Mayors Climate Protection Agreement.30
5. The 1990 Clean Air Act established a market-based permit trading system to control
the levels of sulfur dioxide emissions from power plants, which contribute to the formation of acid rain. The initial permits are allocated for free (i.e., at a zero price) based on fixed emissions rates established by law and by historic fossil fuel use. Allowance banking and trading is permitted, and strict fines, not subject to appeals or waivers, are levied on plants that exceed the emissions allowed by the permits they
30 See Pew Center on the States, October 2007, Climate Change 101: Understanding and Responding to Global Climate Change: http://www.pewcenteronthestates.org/report_detail.aspx?id=32912 (accessed November 2008).
8

Kansas Energy Report 2009 Section 2.3: Greenhouse Gas Emissions and Global Climate Change
held through allocation or trading. Significantly, there is a “hands-off” approach to how the reductions are achieved: the regulators closely track emissions results, but they are only concerned with compliance with the cap. Additionally, there is public access to actual emissions and trading data, which gives transparency to the process. The current SO2 cap-and-trade program is widely considered to be a success. Not only have emissions been reduced to the targeted levels, but the actual cost of reductions has been only half of what was expected when the program was enacted. Furthermore, it is estimated that the market-based approach saves $1 billion annually over a command-and-control regulatory policy.
6. The April 2007 Supreme Court ruling stated that carbon dioxide and other greenhouse
gas emissions fall unambiguously under the definition of air pollutants set out in the 1990 Clean Air Act. The Court directed the EPA to review its response to petitions from state and local governments asking for EPA regulation of carbon dioxide emissions—the EPA had previously held that it did not have jurisdiction to regulate such emissions. If the EPA finds that greenhouse gas emissions such as carbon dioxide lead to climate change, it is obligated by the Clean Air Act to regulate such emissions.31 Although the EPA has not released its decision regarding carbon dioxide emissions (as of December 2008), EPA’s Environmental Appeals Board recently blocked the Agency from issuing a permit for a proposed coal plant in Utah, based on the EPA’s Denver office failing to require controls for carbon dioxide emissions. This ruling stops the permitting process of perhaps 100 proposed coal plants. Because of this, the EPA is expected to make its decision regarding carbon dioxide and other greenhouse gases in early 2009.32
7. The Midwestern Greenhouse Gas Reduction Accord, released in November 2007, is a regional collaboration between the Governors/Premier of Iowa, Illinois, Kansas, Manitoba, Michigan, Minnesota, and Wisconsin. Through the accord, each participating state agreed to establish a collaborative program reducing greenhouse gas emissions in each participating state/province. The governors of Indiana, Ohio, South Dakota, and the premier of Ontario have joined the accord as observers. Details of the accord are currently being discussed by several advisory groups. Computer modeling of different scenarios—reductions of 10%, 15%, and 25% below 2005 levels by 2020—is expected to be completed by February 2009 and a draft plan will be presented to the Governor’s by the end of 2009.33
8. The Western Climate Initiative (WCI) is another regional collaboration, launched in
February 2007, between the Governors of Arizona, California, New Mexico, Oregon,
31 It should be noted that the EPA did not dispute that man-made greenhouse gases causes climate change while the case was being heard; see Massachusetts et al. v. Environmental Protection Agency et al., 549 U.S. 497 no. 05-1120: http://laws.findlaw.com/us/000/05-1120.html (accessed December 2008). 32 See Josef Hebert, November 2008, Utah coal plant permit blocked by EPA panel, Associated Press story: http://www.google.com/hostednews/ap/article/ALeqM5gSt_gge-bueZU2rGVTx1SPZzbkAwD94ECPU04 (accessed December 2008). 33 Midwestern Governors Association, 2007, Governors Sign Energy Security and Climate Stewardship Platform and Greenhouse Gas Accord: http://www.midwesterngovernors.org/govenergynov.htm (accessed December 2008).
9

Kansas Energy Report 2009 Section 2.3: Greenhouse Gas Emissions and Global Climate Change
and Washington. Participating states are identifying, evaluating, and implementing collective and cooperative ways to reduce greenhouse gases in the region. In April 2007, British Columbia joined the Initiative. Other states and provinces, including Kansas, have joined as observers.34
9. The Regional Greenhouse Gas Initiative, or RGGI, is a cooperative effort by ten Northeastern and Mid-Atlantic states to reduce carbon dioxide emissions from power plants. Under RGGI, all ten signatory states have established individual cap-and-trade programs, based on an agreed-upon model rule and linked through a program of allowance reciprocity—thus a credit issued in New York can be used by a company to meet obligations in Vermont. The initial cap is high, but gradually tightens until 2018, when the cap level will be 10% lower then the initial auction level. Like the EU ETS system, RGGI allows for the use of offsets, but limits the allowable offsets as well as their use (3.3% of a power plant’s total obligation).35
RGGI conducted its first carbon dioxide allowance auction on September 29, 2008, with 59 companies from the electrical, financial, and environmental sectors participating. All allowances were sold at a price of $3.07 per ton of carbon dioxide, resulting in over $39.5 million in proceeds. These proceeds will be distributed to the six member states that offered allowances: Connecticut, Maine, Maryland, Massachusetts, Rhode Island, and Vermont and used to support “low-carbon-intensity solutions,” such as programs promoting increased energy efficiency and renewable electrical generation. Delaware, New Hampshire, New Jersey, and New York did not issue allowances during the first auction period.
10. The Climate Registry is a non-profit organization governed by members appointed
from the 60 participating U.S. and Mexican states, Canadian provinces, and Indian tribes. It was formed in March 2007, with the goal of establishing consistent and transparent standards for the reporting of greenhouse gas emissions throughout North America. Currently, 281 businesses and government entities voluntarily report and verify their greenhouse gas emissions to the Registry.
11. Twenty-eight states have adopted policies outlining steps to reduce emissions of
greenhouse gases. Twelve of these 28 states—Arizona, California, Connecticut, Oregon, New Mexico, New York, New Jersey, Rhode Island, Massachusetts, New Hampshire, Vermont, and Maine—have also implemented emissions targets for their state. California made its emissions target (1990 levels by 2020) enforceable under state law.
12. On March 21, 2008, Governor Sebelius issued Executive Order 08-03, which created
the Kansas Energy and Environmental Policy (KEEP) Advisory Group. This advisory
34 Western Climate Initiative, 2008, Home: http://www.westernclimateinitiative.org/ (accessed December 2008). 35 See Regional Greenhouse Gas Initiative, About RGGI: http://www.rggi.org/about (accessed December 2008); see also RGGI Inc., September 2008, RGGI States’ First CO2 Auction Off to a Strong Start: http://www.rggi.org/docs/rggi_press_9_29_2008.pdf (accessed December 2008).
10
Kansas Energy Report 2009 Section 2.3: Greenhouse Gas Emissions and Global Climate Change
group is charged with exploring opportunities to reduce greenhouse gas emissions at the state level within all sectors of the economy and is facilitated by the Center for Climate Strategies. They will submit a preliminary report by January 12, 2009, and a final written report by early January 2010.
13. The Chicago Climate Exchange (CCX) is a voluntary, but contractually binding,
emissions trading system for all six greenhouse gases. Members include the states of New Mexico and Illinois, a few counties, and numerous cities (including Melbourne, Australia), businesses, NGOs, and universities. During Phase I, members pay a fee to join the exchange and agree to reduce emissions by 4% relative to a baseline of 1998-2001. Phase II calls for a further 6% reduction. Members who do not meet these reductions purchase “Carbon Financial Instruments”(CFIs) contracts—each representing 100 metric tons of carbon dioxide equivalent—from those members who exceeded these reductions; however, because most members met their initial targets, the exchange has had more sellers than willing buyers. The CCX also offers CFIs for certain offset projects including methane destruction, agricultural practices, forestry practices, mitigation in Brazil, renewable energy, and Clean Development Mechanisms credits established in the Kyoto Protocol.36 Some question whether some of the offsets available for purchase actually represent “additional” reductions that would not otherwise be undertaken. CFI prices reached record high levels of $7.40 in May 2008, but have since fallen to $1.55 on November 28, 2008.37
14. In 2006, the Chicago Climate Exchange (CCX) launched the Chicago Climate
Futures Exchange (CCFE) to meet the needs of companies facing environmental regulation. Unlike the CCX, the CCFE does not ask members to participate in a voluntary cap-and-trade program. Instead, the CCFE offers standardized future and option contracts on carbon allowances issued under the EU ETS and RGGI, as well as on EPA sulfur and nitrogen allowances issued through the Clear Air Act.38 The Green Exchange operated by the New York Mercantile Exchange (NYMEX) will begin trading similar products in the first quarter of 2009. Many of the world’s largest brokerage houses—such as Morgan Stanley, Credit Suisse, JP Morgan Chase—are named as partners in the exchange.39
36 See Chicago Climate Exchange, 2007, Overview: http://www.chicagoclimatex.com/content.jsf?id=821 (accessed December 2, 2008); see also Chicago Climate Exchange, 2007, CCX Offsets Program: http://www.chicagoclimatex.com/content.jsf?id=23 (accessed December 2, 2008). 37 Some suggest the recent price changes stem from the perception that a national cap-and-trade program is inevitable, making investors question whether the CCX offset program, with all of its flaws, offers a good model for a mandatory federal scheme. See Carbon Positive, December 2008, VER prices soften in November: http://www.carbonpositive.net/viewarticle.aspx?articleID=1326 (accessed December 2008). 38 Chicago Climate Futures Exchange, 2007, About Chicago Climate Futures Exchange: http://www.ccfe.com/about_ccfe/ (accessed December 2008). 39 New York Mercantile Exchange, 2007, The Green Exchange Initiative: http://nymex.greenfutures.com/overview/ (accessed December 2008).
11
Kansas Energy Report 2009 Section 2.3: Greenhouse Gas Emissions and Global Climate Change
Section 2.3 Policy and Program Recommendations 1. If a cap-and-trade policy or carbon tax is passed, it should be done at the federal
level.
Description U.S. policymakers are currently considering national policy—either a cap-and-trade or carbon tax—to reduce U.S. emissions of carbon dioxide and other greenhouse gases. Congress has introduced numerous bills to regulate GHG emissions in all 50 states, the latest of which, the Dingell-Boucher discussion draft, was released on October 7, 2008.40 Other bills introduced in 2007 and 2008 include the Kerry-Snowe Global Warming Reduction Act, the Sanders-Boxer Global Warming Pollution Reduction Act, the Bingaman-Spector Low Carbon Economy Act, and the Lieberman-Warner Climate Security Act of 2007 (recently reintroduced in a revised form with Senator Boxer as an added co-sponsor). Implementation of a carbon tax or cap-and-trade policy at the federal level will be far more environmentally effective—and economically efficient—than state or regional approaches (see Topic / Issue Description). It will provide uniformity and a level playing field for all 50 states and U.S. companies. Policymakers in the U.S. and around the world recognize that controlling atmospheric concentrations of greenhouse gases ultimately requires the implementation of an international, collective framework. Enactment of U.S. policy is commonly viewed as an essential step towards establishment of an international climate policy.
Recommended Actions
a. Responsible parties The Governor and Legislative leaders should send letters to the Kansas Congressional delegation and other key federal policymakers.
b. Legislative action
Legislators should consider adoption of a resolution in support of this recommendation.
c. Budget requirements
No additional funding required.
40 U.S. House of Representatives, Committee on Energy and Commerce, 2008, Executive Summary of the Discussion Draft: http://energycommerce.house.gov/index/ (accessed November 2008).
12

Kansas Energy Report 2009 Section 2.3: Greenhouse Gas Emissions and Global Climate Change
d. Implementation timeline Letters to the Congressional delegation should be delivered on or before January 31, 2009.
Implications of Proposal
a. Pros i. Market-based policies provide greater reductions in greenhouse gas
emissions than non-market regulation, mandates, standards.
ii. Market-based policies provide less-expensive reductions in greenhouse gas emissions than non-market regulation, mandates, standards.
iii. Reduces or avoids potential future damages associated with greenhouse gas emissions from human activities.
iv. Serves as an insurance policy, given the various uncertainties associated with climate change, because policy enacted now is likely to cost much less in the long term than “waiting and seeing.”
v. Reduces health and environmental damages from “traditional” pollutants associated with fossil fuel combustion.
vi. Spurs technological innovation and advantages all alternatives equally.
vii. May provide impetus for international agreement.
viii. May improve international standing of the United States.
b. Cons i. Will increase prices of goods and services that involve the combustion of
fossil fuels.
ii. May be politically unpopular because costs to consumers are not hidden.
iii. May be politically unpopular because it requires “sacrifices” from present generation in exchange for benefits to future generations.
iv. May be politically unpopular due to uncertainty surrounding future benefits.
v. May be perceived as avoidance of action on climate change.
vi. Restricts local, state, and regional policymakers who wish to take initiative with respect to climate policy.
13

Kansas Energy Report 2009 Section 2.3: Greenhouse Gas Emissions and Global Climate Change
2. Endorse policies that promote declines in greenhouse gas emissions, not policies that merely shift emissions within or between regions.
Description In the absence of federal regulation, local, state, and regional policies that restrict greenhouse gas emissions are unlikely to achieve their stated purpose—that is, to reduce atmospheric concentrations of greenhouse gases. Instead, such policies may simply result in shifting emissions (and the economic activity that produces them) to another location in the United States, thus economically disadvantaging one locality without achieving the intended reductions in emissions. Clearly, some climate policies and programs implemented at the local, state, and regional level may produce benefits, even if they are not effective at reducing global greenhouse gas emissions. For example, cost-effective policies to promote energy conservation and efficiency can be justified on grounds other than avoiding greenhouse gas emissions. However, the importance of implementing federal policy in the U.S.—and, ultimately, a coordinated, international framework—is widely accepted, if reductions in atmospheric concentrations of greenhouse gases are to be achieved.
Recommended Actions
a. Responsible parties The Governor and Legislative leaders should send letters to the Kansas Congressional delegation and other key federal policymakers.
b. Legislative action
Legislators should consider adoption of a resolution in support of this recommendation.
c. Budget requirements
No additional funding is requested. d. Implementation timeline
Letters to the Congressional delegation should be delivered on or before January 31, 2009.
Implications of Proposal
a. Pros i. Avoids implementing policies that are likely to be costly and unlikely to
achieve stated goal of reducing global greenhouse gas emissions.
14
Kansas Energy Report 2009 Section 2.3: Greenhouse Gas Emissions and Global Climate Change
ii. May promote public support for market-based, national and international policies.
iii. Allows opportunity to demonstrate effective complementary policies at the local, state, and regional level.
b. Cons
i. May be perceived as avoidance of action on climate change.
ii. Restricts local, state, and regional policymakers who wish to take initiative with respect to climate policy.
15

Kansas Energy Report 2009 Section 2.3: Greenhouse Gas Emissions and Global Climate Change
3. Urge Congressional delegation to include agricultural sequestration as an offset in any federal cap-and-trade policy.
Description Many view agricultural (i.e., soil) sequestration of carbon dioxide as a low-cost means to achieve short-term reductions in carbon dioxide emissions. Some estimate that U.S. cropland could sequester anywhere from 275 to 760 million metric tons of carbon per year, with pasture land potentially sequestering an additional 66 to 330 million metric tons.41 If these estimates are correct, soil carbon sequestration could offset 20% to 30% of annual U.S. carbon emissions by 2025.42 Because it may be cheaper for the regulated entity to purchase an offset than to achieve reductions through other means (for example, retrofitting factories or power plants), agricultural offsets may reduce costs associated with a federal cap-and-trade policy. According to the EPA’s economic modeling of the Lieberman-Warner cap-and-trade policy, offsets and international credits have the potential to significantly reduce permit prices, while also reducing volatility.43 Because offsets are subject to gaming and fraud,44 clear standards and protocols must be enforced to ensure that the payments result in additional, verifiable, and reasonably permanent reductions in emissions. Agricultural (and other) offsets are best viewed as short-term measures to facilitate the least-cost emissions reductions within a federal cap-and-trade program, allowing time for potential, new, low-carbon technologies to be developed.
Recommended Actions
a. Responsible parties The Governor and Legislative leaders should send letters to the Kansas Congressional delegation and other key federal policymakers.
41Charles W. Rice and Debbie Reed, 2007, PowerPoint presentation entitled “Soil Carbon Sequestration and Greenhouse Gas Mitigation: A Role for American Agriculture.” 42 Charles Rice, 2008, PowerPoint presentation entitled “Climate Change: Impacts, Adaptation and Mitigation Offsets Workshop.” 43 Michael Wara and David Victor, April 2008, A Realistic Policy on International Carbon Offsets, Freeman Spogli Institute for International Studies at Stanford University: http://pesd.stanford.edu/publications/a_realistic_policy_on_international_carbon_offsets/ (accessed 2008) 44 Recent problems with the United Nation’s Clean Development Mechanism (CDM) highlight some of the difficulties associated with offset programs. The CDM was established as part of the Kyoto Protocol to enable emitters in developed nations to invest in low-cost emission-reduction strategies in developing countries. Unfortunately, 28% of the offsets purchased (collectively valued in excess of $6.5 billion) resulted in reductions of the greenhouse gas HFC-23 that could have been achieved for less than $150 million (prices converted from Euros at 1.4195 Dollars per Euro). See Michael Wara and David Victor, April 2008, A Realistic Policy on International Carbon Offsets; also see Michael Wara, 2007, Is the global carbon market working?: Nature, v. 445, p. 595-596.
16

Kansas Energy Report 2009 Section 2.3: Greenhouse Gas Emissions and Global Climate Change
b. Legislative action
Legislators should consider adoption of a resolution in support of this recommendation.
c. Budget requirements
No additional funding is requested. d. Implementation timeline
Letters to the Congressional delegation should be delivered to the Kansas Congressional delegation on or before January 31, 2009.
Implications of Proposal
a. Pros i. Provides an additional benefit for Kansas (and U.S.) farmers who engage
in practices that sequester carbon dioxide.
ii. Encourages environmentally beneficial practices such as no-till agriculture, methane capture, and reforestation.
iii. Provides a lower-cost option for reductions of carbon dioxide emissions.
iv. May increase public support for federal cap-and-trade policy.
v. May bolster rural economies. b. Cons
i. May be perceived as a loophole that undermines effectiveness of cap-and-trade policy.
ii. May be perceived as an excessive benefit to farmers in light of existing state and federal incentives.
iii. Increases costs of administering cap-and-trade program, due to necessary monitoring and verification protocols.
17

Kansas Energy Report 2009 Chapter 8: Electricity
18
Chapter 8: Electricity Overview Electricity can be defined generally as a form of energy involving the flow of electrons (negatively charged particles) from one atom to another. This flow of electrons, or electric current, occurs when the balancing force electrons is upset, allowing atoms to gain or lose electrons. The balancing force may be upset by the application of an external force, such as that derived from a chemical reaction or from a magnetic field moving across a conductor, to name two examples.45 Alternating current (AC), which is the type of current used in the North American electricity industry, reverses its direction at regularly recurring intervals.46 AC results from the movement of a conductor, a material that conducts electricity easily (such as copper or aluminum), within an electromagnetic field. Direct current (DC) results from a chemical reaction, such as that occurring in a battery (also in a solar photovoltaic panel or in a fuel cell). Electronic circuits can also convert AC to DC and back. Electricity travels in closed loops, and an electrical circuit can be defined a closed, conducting pathway through which an electric current travels. If the circuit is open, as when a light switch is turned off, the electrons cannot flow; flipping the switch “on” closes the circuit and electrons flow through the wires and the wire filament (within a conventional bulb), producing light. The basic components of the electric industry are generation, transmission, and distribution. Generation refers to the source—for example, power plants, hydroelectric dams, wind turbines—where other forms of energy are converted to electricity. Transmission is the high-voltage system of wires that transports electricity over long distances. Distribution is the low-voltage system of wires that delivers electricity to customers. The network of power plants and interconnected electrical lines is often called the electric grid. Electric generation—Generators are devices that convert mechanical energy into electrical energy. Most U.S. electricity is produced in steam turbines (which convert the kinetic energy of moving fluids, liquid or gas, to mechanical energy). Generating electricity in steam turbines involves the following steps: (1) water is heated (either in a boiler or in a nuclear reactor) to produce steam, which is contained to produce high pressure; (2) the pressure from the released steam spins a turbine (an array of blades as on a fan), which is connected to a shaft that rotates as a turbine spins; (3) the spinning shaft
45 Unless otherwise noted, this information is derived from (1) a PowerPoint presentation entitled “Introduction to the technology, institutions, and history of the electric industry, by Douglas Gegax, Professor of Economics and Director, Center for Public Utilities, New Mexico State University, May 19, 2007; and (2) Electricity—A Secondary Energy Source, Energy Information Administration (EIA), Energy Kid’s Page: http://www.eia.doe.gov/kids/energyfacts/sources/electricity.html. Professor Ward Jewell, Wichita State University reviewed this draft and provided helpful comments. 46 Energy Information Administration (EIA), 2008, Glossary: http://www.eia.doe.gov/glossary/glossary_a.htm

Kansas Energy Report 2009 Chapter 8: Electricity
turns a magnetic rotor inside the generator; and (4) as the rotor magnetic field spins past stationary coils of wire mounted inside the generator, AC electricity is produced on the wires. Whether produced by fossil fuels or the fission of uranium, the resulting steam turns the turbine blades that turn the shaft of the generator to produce electricity. Other ways to “spin the turbine” include water falling down a dam, water running downstream, wind turning a wind turbine, or fossil fuels firing a combustion turbine (similar to a jet engine). Combustion turbines are designed to start quickly and are normally fueled with natural gas (or sometimes low-sulfur fuel oil). As in a jet engine, combustion turbines draw in air at the front of the unit, compress it, mix it with fuel, and ignite it; the hot combustion gases then expand through turbine blades connected to a generator. In a different process, the combined-cycle process, natural gas is ignited to spin a combustion turbine generator, and the hot-gas exhaust heat is transferred to a waste-heart recovery steam boiler that produces electricity by running a second steam-turbine generator. While a small amount of electric energy is stored in pumped-hydroelectric plants, almost all is used the instant it is generated. Generating units must be equipped to generate and “dispatch” electricity at any give time to meet the system’s load (instantaneous demand).47 As the table below suggests, the various (conventional) generation technologies differ in terms of their capital and operating costs as well as in their start-up times (that is, the time it takes for them to begin generating electricity after being switched on).
Generation Technology Capital Costs Operating Costs Start-up Times Hydroelectric High Very Low Quick Nuclear Very High Very Low Slow Coal High Low Slow Combined-cycle Gas Turbines Medium Medium Medium Simple Gas Turbines (“Peakers”) Low High Quick
Power plants that are used to meet the minimum or “base load” of the system are referred to as base-load generating units; they are run continuously and operated, in general, so as to produce electricity at a constant rate, and typically include nuclear facilities, coal-fueled power plants, and sometimes hydroelectric plants (though many of these are operated as peaking units because they have a limited amount of water to use and, thus, cannot run continuously).48 Base-load units are generally the cheapest to operate and the most expensive to build. Peak-load units, also called “peaking plants,” are used to meet the system’s peak load, and are typically gas-fired turbines that can be turned on quickly. Peaking plants are typically the expensive to operate and relatively inexpensive to build. 47 As economics change and new technologies advance, electricity storage may prove feasible; see, for example, Dan Rastler, 2008, New Demand for Energy Storage, Energy Power Research Institute (EPRI), September/October 2008 Energy Perspectives: http://www.eei.org/magazine/editorial_content/nonav_stories/2008-09-01-EnergyStorage.pdf. 48 Of course, any unit can be operated to meet the base load, as long as it provides firm, dispatchable energy.
19

Kansas Energy Report 2009 Chapter 8: Electricity
Intermediate units are used to meet the system requirements between base and peaking load. Transmission—Once electricity is generated, it needs to be delivered from that plant to population centers or other utilities, which are often located many miles away. To counter problems (line losses) associated with sending electricity over long distances, electricity produced by a generator is sent to a nearby substation, where transformers “step up” the voltage before transferring it to high-voltage transmission lines, which can carry electricity efficiently over long distances. Distribution—Before the high-voltage electricity can be delivered to end users, it is transferred to a second substation, called a distribution substation, where the voltage is stepped down.49 From here the electricity is sent to local medium-voltage distribution lines, commonly buried underground in newer housing and commercial developments, before it passes through one final transformer, which steps down the voltage once more before it reaches the end user. Utilities must constantly monitor both the status of transmission lines, to insure current capacities are not being exceeded, and the local distribution systems, to ensure that a constant voltage is maintained. Moreover, they must balance the amount of power coming into the service area with the amount of being taken out by use and line losses. Therefore, within a utility’s service area, a utility must monitor electrical supply to each distribution system, making sure that it matches electrical demand at every instant (two second intervals) in time. This process is called load balancing, as the utility “balances” electrical loads with available capacity.
49 Transmission lines throughout the United States have varying maximum voltages they can sustain. Because of this, an electrical current may actually pass through several transmission substations before reaching a distribution substation. These transmission substations work in the same fashion as other substations, adjusting voltages as needed to comply with the characteristics of different transmission lines.
20
Kansas Energy Report 2009 Chapter 8: Electricity
Section 8.1: Electric Utilities in Kansas Topic / Issue Description Electricity in Kansas is provided by three types of utilities: investor-owned utilities, municipal utilities, and rural electric cooperatives. Electric utilities in Kansas are regulated by both the Kansas Corporation Commission (KCC) and the Federal Energy Regulatory Commission (FERC) (see discussion below). Investor-owned utilities (IOUs) are operated by public corporations, and their stock is traded publicly and owned by shareholders. The IOUs operating in Kansas are Westar Energy, Kansas City Power & Light (KCP&L), and The Empire District Electric Company. Westar operates 12 power plants and owns over 33,000 miles of transmission and distribution lines. Its service territory covers about 10,130 square miles in east and east-central Kansas, and they provide electricity to more than 675,000 customers.50 KCP&L is based out of Kansas City, Missouri, and has a service territory of approximately 18,000 square miles in areas of northeastern Missouri and eastern Kansas. KCP&L operates nine power plants, supplying power to over 800,000 customers in Missouri and Kansas.51 The Empire District Electric Company is headquartered in Joplin, Missouri, and provides electric, natural gas, water, and fiber optics services throughout western Missouri. Outside Missouri, Empire serves about 168,00 customers in parts of three counties in Oklahoma, part of one county in Arkansas, and part of Cherokee County in Kansas.52 Kansas municipal utilities are customer-owned, not-for-profit, public power systems, operated by municipal governments. Their rates are set by the city council, commission, or a representative municipal board. The largest municipal utility is the Kansas City Board of Public Utilities, which serves approximately 69,000 customers in Kansas City, Kansas. Although roughly half of the state’s municipal utilities own and operate generating units, most municipal generation is operated only to serve demand, and the majority of the energy delivered by municipal electric utilities (also known as public power systems) is purchased through long-term contracts or on the wholesale market. Many municipal electric utilities in the state also work through a joint action agency to coordinate energy purchases. Under the provisions of K.S.A. 12-885, two joint action agencies, the Kansas Municipal Energy Agency (KMEA) and the Kansas Power Pool (KPP), operate in Kansas. KMEA, established in the late 1970’s as a partnership of ten municipal utilities called the Northwest Kansas Municipal Energy Agency, has grown to 75 members from across the state. KPP was organized in 2005 after many municipal utilities were given notice of the pending cancellation of long-term power supply contracts and combined resources to realize significant financial savings. KPP has 39 50 Westar Energy, 2008, Our Energy: http://www.westarenergy.com/corp_com/contentmgt.nsf/publishedpages/corporate%20governance (accessed December 2008). 51 Kansas City Power and Light, 2008, Company Overview: http://www.kcpl.com/about/about_corpintro.html (accessed December 2008). 52 The Empire District Electric Company, June 2008, Future Generation Planning, presented to the KEC electricity committee June 17, 2008: http://kec.kansas.gov/electricity/index.htm.
21

Kansas Energy Report 2009 Chapter 8: Electricity
members across central and eastern Kansas, some of which are also members of KMEA. Both KMEA and KPP purchase blocks of electricity for redistribution to individual cities. Rural electric cooperatives (RECs) are not-for-profit, member-owned electric utilities. Distribution cooperatives deliver electricity to consumers. Generation and transmission cooperatives (G&Ts) generate and transmit electricity to distribution co-ops. Kansas RECs are governed by a board of trustees elected from the membership. Most Kansas RECs were set up under the Kansas Electric Cooperative Act, which, together with the federal Rural Electrification Act of 1934, made electric power available to rural customers. Currently, Kansas has two G&Ts—Sunflower Electric Power Corporation, based in Hays, and Kansas Electric Power Cooperative, Inc. (KEPCo), headquartered in Topeka—and 29 distribution cooperatives. Some municipal utilities and rural electric cooperatives receive an allocation of renewable energy from federal hydropower projects, the Western Area Power Administration (WAPA) and the Southwestern Power Administration (SWPA). KPP also receives some hydropower from the Grand River Dam Authority (GRDA). The range of services provided by electric utilities are defined as either primary and ancillary services. Primary services are those associated with the general operation of an electrical utility—namely, generating and delivering electricity to end users. Ancillary services, on the other hand, are those services necessary for ensuring the reliability of the transmission and distribution system within a utility’s control area.53 As defined by FERC, ancillary services include system control, regulation and frequency response, energy imbalance, reactive supply and voltage control, and spinning and non-spinning generation contingency reserves. The first three services—system control, regulation and frequency response, and energy imbalance—refer to measures undertaken to balance electricity coming in (via generation or wholesale transactions) with electricity going out through usage, at any given time in a utility’s control area. Maintaining spinning and non-spinning generation contingency reserves involves having some generating units on standby (in essence, “turned on” or able to be “turned on,” even though disconnected from the grid) to quickly correct for unexpected generation and transmission outages. Reactive supply and voltage control is another ancillary service utilities provide in order to maintain stable voltages levels.54 Kansas Corporation Commission—The KCC is a state agency with the mission to protect the public interest through impartial and efficient resolution of all jurisdictional issues.55
53 In general, a control area represents the physical network of transmission and distribution lines owned and operated by an individual utility. Within a control area, systems are put in place by the utilities that controls electricty generated by the utility generators, as well as electricity transfers to and from neighboring utilities. See Gegax, 2007. 54 See Power Systems Engineering Research Center (PSERC), May 2001, Reactive Power Support Services in Electricity Markets: Costing and Pricing of Ancillary Services: http://www.pserc.wisc.edu/ecow/get/publicatio/2000public/Report.pdf (accessed December 2008); see also Douglas Gegax, 2007, Appendix 2: More on Ancillary Services. 55 Information regarding the KCC was provided by Janet Buchanan, KCC Utilities Division; additional information came from the KCC and Westar Energy web sites.
22

Kansas Energy Report 2009 Chapter 8: Electricity
It regulates rates, service, and safety of public utilities. It also regulates oil and gas production by protecting correlative rights and environmental resources. Decisions are made by a three-member Commission appointed by the Governor. In essence, the KCC’s job with respect to electric utilities is to ensure that they provide safe, adequate and reliable services at reasonable rates. Setting the rates for the electric utilities under their jurisdiction—all of the IOUs and the larger cooperatives—is perhaps the most widely recognized KCC function (and certainly the one that receives the most attention from the general public—i.e., ratepayers). The KCC’s rate-setting function is necessary because utilities in Kansas are granted a monopoly (that is, within their service territory, they don’t have to compete for their customer’s business). When utilities desire an increase in their rates, they submit an application to the Commission, in which they make a case for the level of revenue they need to continue to operate and provide safe, reliable service to their customers, as well as a reasonable return to their investors. The utility’s rate case application also includes its plan for recovering that revenue through rates charged to various classes of customers. KCC staff supports the three-member Commission in the evaluation and analysis of the utility’s rate case application and provides written testimony to Commission outlining and presenting evidence in support of staff’s analysis and/or evaluation. The Commission is required to issue an order on a rate application within 240 days of its filing. In addition to setting rates, the Commission is charged with the following responsibilities: (1) monitoring utility compliance with Commission orders; (2) investigating complaints regarding rates, quality of service, and safety; (3) reviewing energy procurement practices; (4) reviewing applications for siting of transmission lines; and (5) limited inspection of electric facilities. Technical staff provides information to the Commission on issues under deliberation; legal staff provides assistance interpreting statutes and maintaining consistency of orders and regulations with the statutes guiding the Commission’s duties. In recent years, the Commission has investigated many issues related to the financial health of a utility. This includes the evaluation of merger and acquisition plans, use of utility assets as collateral in transactions, registration of securities with the SEC, and filings with FERC regarding the issuance of debt. The Commission has also become engaged in general investigations of utility-sponsored energy efficiency programs. Federal Energy Regulatory Commission (FERC)—The FERC is an independent agency created by the federal government in 1977 to replace the existing Federal Power Commission in regulating the interstate transmission of electricity, natural gas, and oil. FERC’s responsibilities were expanded under the provisions of the Energy Policy Act of 2005. With respect to electricity, FERC has four main functions: (1) regulation the wholesale sales of electricity in interstate commerce, (2) licensing and inspecting hydroelectric projects, (3) regulation of transmission to ensure the reliability of the nation’s transmission system, and (4) oversight of environmental matters related to hydroelectricity projects and major electricity policy initiatives. FERC further oversees
23

Kansas Energy Report 2009 Chapter 8: Electricity
the accounting and financial reporting of regulated utilities, creating penalties for organizations and individuals who violate FERC rules and regulations.56 Southwest Power Pool (SPP)—The SPP is a Regional Transmission Organizations (RTO), mandated by FERC (Order 2000) to ensure reliable supplies of power, adequate transmission infrastructure, and competitive wholesale prices of electricity. As a North American Electric Reliability Corporation (NERC) Regional Entity, SPP oversees compliance enforcement and reliability standards development. SPP covers a geographic area of 255,000 square miles and manages transmission in Kansas and Oklahoma and in parts of Arkansas, Louisiana, Missouri, New Mexico, Oklahoma, and Texas. SPP has members in these states as well as in Nebraska and Mississippi. Like other RTOs and ISOs (Independent System Operators), SPP serves as the regional “air traffic controller” of the regional grid, coordinates regional scheduling of power transfers and operates the Energy Imbalance Service (EIS) market, which allows utilities to purchase electricity to correct for shortages on a real-time basis. SPP also administers the Open Access Transmission Tariff, ensuring fair and open access to the transmission system for all customers.57 Existing Policies and Programs 1. Chapter 66 of the Kansas Statutes deals with the state’s public utilities, including but
not limited to electric utilities. Chapter 66, Article 1 includes the statutes delineating the powers of the Kansas Corporation Commission (KCC).
2. K.S.A. 10-1202 allows municipalities to issue and sell revenue bonds to cover the
costs associated with acquiring, constructing, altering, repairing, improving, or enlarging the municipal utility.
3. FERC Order No. 888 requires all public utilities that own, operate, or control
interstate transmission to file tariffs that offer other utilities the same transmission services they provide for themselves, with comparable terms and conditions. FERC Order No. 889 requires that utilities implement a standard of conduct and an Open Access Same-time Information System (OASIS) to ensure that transmission owners do not have an unfair competitive advantage in using transmission to sell power.58
4. FERC Order No. 2000 further encourages competition in the wholesale electricity
market; it encourages utilities to voluntarily join Regional Transmission Organizations (RTOs) that have (1) independence from market participants, (2) an
56 Federal Energy Regulatory Commission (FERC), July 2008, What FERC Does: www.ferc.gov/about/ferc-does.asp (accessed December 12, 2008). 57 Southwest Power Pool (SPP), 2008, What We Do: www.spp.org/section.asp?pageID=23 (accessed December 12, 2008); see also Federal Energy Regulatory Commission, November 2008, RTO/ISO: http://www.ferc.gov/industries/electric/indus-act/rto.asp (accessed December 15, 2008). 58 Convergence Research, 1996, Commission Orders Sweeping Changes for Electric Utility Industry: http://www.converger.com/fercnopr/888_889.htm (accessed December 15, 2008).
24
Kansas Energy Report 2009 Chapter 8: Electricity
appropriate scope and configuration, (3) operational authority over transmission facilities within the region, and (4) exclusive authority to maintain short-term reliability. On June 23, 2006, Southwest Power Pool, which serves Kansas, was granted RTO status by FERC.59
59 See Energy Information Agency, 2000, Status of Bulk Power Transmission Systems: http://www.eia.doe.gov/cneaf/electricity/epav1/bulkpower.html (accessed December 15, 2008); see also, Federal Energy Regulatory Council, 2008, 124 FERC ¶ 61,220 Background: http://www.ferc.gov/EventCalendar/Files/20080903174851-RT04-1-023.pdf (accessed December 15, 2008).
25

Kansas Energy Report 2009 Chapter 8: Electricity
Section 8.2: Electricity Generation: Demand, Capacity
Topic / Issue Description According to the most recent data, Kansas consumed 39.8 million megawatt-hours (MWh) of electricity in 2006. Commercial consumers accounted for 37.2% of this demand, with residential and industrial consumers accounting for 34% and 28.8%, respectively. Based on historical trends, demand for electricity within Kansas is expected to grow at a rate of 1.0% to 1.5% per year.60 Electricity consumption (also called “load”) is divided into three categories: base, peak, and intermediate load. Base load refers to demand that occurs continuously, day and night, seven days a week. Peak load, on the other hand, refers to maximum demand that occurs within a given period of time. Intermediate load is a more generic term applied to demand that occurs between base and peak load. Electricity peak loads in Kansas are the greatest during the summer months, primarily due to the electricity needs of air-conditioning systems. In 2006 (the most recent data available), the utilities in the Southwest Power Pool (SPP) had a total summer peak load of 42,266 megawatts (MW). SPP members had a combined capacity resources of 46,564 MW, resulting in a capacity margin (percentage generation capacity in excess of demand) of 9.2%. Kansas’ utilities account for approximately 24% of SPP resources.61 Electricity differs from other commodities in that it can not be stored on a commercial scale: in other words, electricity stored through currently available mechanical and chemical means encounters very large losses in efficiency. Therefore, in order to provide reliable service, utilities must have enough capacity—defined as instantaneous electrical production—to meet the greatest peak loads experienced.62 This capacity can be provided either from their own generation assets; long-term power purchase agreements; or “real-time” purchases in the spot market. In order to cost-effectively meet the varying demand of their customers at different times of the year and even different times of the day, most utilities maintain a diverse portfolio of electric power plants (e.g., generating units) that use a variety of fuels. These generating units can be distinguished according to the type of power they produce (firm vs. intermittent) as well as the type of load they are designed to meet (base, peak, or intermediate). Generating units that rely on fuel sources whose availability can be controlled by the operators of the plant are said to provide firm power. Power plants that generate 60 Based on preliminary data compiled by KEC staff for forecast load and capacity summaries. According to the EIA, overall U.S. demand is expected to increase 1.1% annually: Annual Energy Outlook with Projections to 2030: http://www.eia.doe.gov/oiaf/aeo/electricity.html (accessed September 2008). 61 EIA, 2007, Net Internal Demand, Capacity Resources, and Capacity Margins by North American Electric Reliability Council Region: http://www.eia.doe.gov/cneaf/electricity/epa/epat3p2.html (accessed September 2008). 62 In practice utilities are required to maintain capacity well in excess of forecasted peak loads. Southwest Power Pool (SPP) requires (with few exceptions) that all members maintain capacity margins 12% greater than forecasted peak load.
26

Kansas Energy Report 2009 Chapter 8: Electricity
electricity from most conventional sources of electricity (e.g., fossil fuels, nuclear, and hydro), as well as some non-conventional sources such as geothermal and landfill wastes, are considered firm power. On the other hand, generating units that rely on fuel sources, such as wind and solar energy, whose availability can not be controlled by the operators of the unit are said to provide intermittent power. Because intermittent resources cannot be depended on to supply electricity at any given moment, units relying on these resources must be accompanied by power plants that provide firm power. For example, dedicated (load-following) units, which operate on standby, can be used to meet demand during periods when the intermittent resource is unavailable, as when the wind is not blowing or the sun is not shining. Power plants are also differentiated based on whether they are designed and built to meet base-load or peaking demand. Power plants that are used to meet the minimum or “base load” of the system are referred to as base-load generating units; they are run continuously and operated, in general, so as to produce electricity at a constant rate. Base-load units are operated to maximize system mechanical and thermal efficiency and minimize system operating costs. Costs are minimized by operating units with the lowest fuel costs for the most hours in the year (i.e., at a high capacity factor). Generally, base-load units include nuclear, coal-fired, geothermal, hydropower, and waste-to-energy plants.63 Peaking units are normally reserved for operation during the hours of highest daily, weekly, or seasonal loads—that is, they are turned on or “dispatched” as demand increases above the base load. Peaking plants are expensive to operate, typically fueled by refined oil products or natural gas, because they have a higher per-kilowatthour (KWh) fuel cost than base-load units. On the other hand, peaking plants are generally less expensive to build (see Table 1, Chapter 8 Overview). In order to maintain reliability, utilities must plan to increase capacity to meet future demand, which historically has increased over time. Utilities can accomplish this by investing in new generating units, by increasing operating efficiency, or by purchasing capacity from surrounding utilities through wholesale power contracts. Wholesale power contracts come in many forms, but in general wholesale power contracts between utilities can be looked at as a promise one utility makes to another to provide an agreed-upon amount of capacity whenever it is needed by the second utility to satisfy loads within its control area. Depending on a utility’s needs, there may be no electricity transferred within a given year, even though there exists a contract negotiated for that very purpose. Existing Policies and Programs 1. Chapter 66 of the Kansas Statutes deals with the state’s public utilities, including but
not limited to electric utilities. Chapter 66, Article 1 includes the statutes delineating the powers of the Kansas Corporation Commission (KCC).
63 Hydroelectric dams can be operated in either base or peaking mode by increasing water flow through the dam during periods of peak demand, and reducing the flow during off-peak periods.
27

Kansas Energy Report 2009 Chapter 8: Electricity
2. K.S.A. 10-1202 allows municipalities to issue and sell revenue bonds to cover the costs associated with acquiring, constructing, altering, repairing, improving, or enlarging the municipal utility.
3. FERC Order No. 888 requires all public utilities that own, operate, or control
interstate transmission to file tariffs that offer other utilities the same transmission services they provide for themselves, with comparable terms and conditions. FERC Order No. 889 requires that utilities implement a standard of conduct and an Open Access Same-time Information System (OASIS) to ensure that transmission owners do not have an unfair competitive advantage in using transmission to sell power.64
4. FERC Order No. 2000 further encourages competition in the wholesale electricity
market; it encourages utilities to voluntarily join Regional Transmission Organizations (RTOs) that have (1) independence from market participants, (2) an appropriate scope and configuration, (3) operational authority over transmission facilities within the region, and (4) exclusive authority to maintain short-term reliability. On June 23, 2006, Southwest Power Pool, which serves Kansas, was granted RTO status by FERC.65
64 Convergence Research, 1996, Commission Orders Sweeping Changes for Electric Utility Industry: http://www.converger.com/fercnopr/888_889.htm (accessed December 15, 2008). 65 See Energy Information Agency, 2000, Status of Bulk Power Transmission Systems: http://www.eia.doe.gov/cneaf/electricity/epav1/bulkpower.html (accessed December 15, 2008); see also, Federal Energy Regulatory Council, 2008, 124 FERC ¶ 61,220 Background: http://www.ferc.gov/EventCalendar/Files/20080903174851-RT04-1-023.pdf (accessed December 15, 2008).
28

Kansas Energy Report 2009 Chapter 8: Electricity
Section 8.4: Electricity Generation and Carbon Dioxide Emissions Topic / Issue Description The U.S. electricity sector accounts for about 42% of U.S. primary energy consumption, 34% of fossil fuel consumption, and about 40% of carbon dioxide (CO2) emissions. With end-use consumption of electricity growing faster than that of both petroleum and natural gas, it is not surprising that policy discussions related to energy and climate change focus on the electricity sector.66 In Kansas, according to the most recent data, electric utilities generated 45.5 million megawatthours (MWh) of electricity in 2006, in response to total annual retail demand of 39.7 million MWh.67 Seventy-five percent of the electricity generated between July 2006 and July 2007 came from coal-fired power plants (of course, generating units using other fossil fuels such as natural gas or diesel also released CO2 into the atmosphere).68 The total greenhouse gas emissions associated with electricity generation in 2007 was 43,250,899 tons of carbon dioxide equivalent.69 Despite widespread agreement that the best way—that is, most environmentally effective and economically efficient way—to reduce greenhouse gas emissions is a national-level, economy-wide, market-based system,70 the federal government has yet to implement such a policy. Various proposals are currently under consideration in the U.S. Congress (see Section 2.3, Recommendation 1), most of which call for some sort of a cap-and-trsystem and all of which include provisions to reduce emissions from electric generation.
ade
It is almost a certainty that any federal policy to limit emissions of carbon dioxide and other greenhouse gases will target the electricity sector. In addition, the EPA (in the wake of the April 2007 Supreme Court ruling) is expected to issue its decision about CO2 and other greenhouse gas emissions early in 2009 (see Section 2.3, Existing Policies and Programs). In addition to implementing policies that increase the price of emitting CO2 and other greenhouse gases, the federal government also has an important role to play in supporting basic scientific research and technological development of a low-cost alternative (or backstop) technology. Economic policy analysts generally agree that it is economically appropriate to subsidize activities such as invention, innovation, and education through government funding or tax credits (but to avoid subsidizing specific technologies or
66 Paul L. Joskow, 2008, Challenges for Creating a Comprehensive National Electricity Policy, September 26, 2008 presentation to the Technology Policy Institute, available on Harvard Electric Policy Group web site: http://www.hks.harvard.edu/hepg/Papers/Joskow_Natl_Energy_Policy.pdf 67 Energy Information Administration (EIA), 2007, Kansas Electricity Profile: Table 1, 2006 Summary Statistics (Kansas): http://www.eia.doe.gov/cneaf/electricity/st_profiles/kansas.html 68 KEC, 2008, Kansas Net Electrical Generation, Kansas Energy Chart Book: http://www.kec.kansas.gov/chart_book/ (accessed September 2008). 69 Will Stone, KDHE Bureau of Air and Radiation, personal communication, December 8, 2008; based on KDHE’s voluntary survey of electric generating utilities. 70 See, for example, KEC staff report, Greenhouse Gas Emissions: Policy and Economics: http://www.kec.kansas.gov/reports/GHG_Review_FINAL.pdf.
29

Kansas Energy Report 2009 Chapter 8: Electricity
activities in combating global warming).71 Given the potential enormity of the problems associated with climate change, low-cost technological breakthroughs are extremely valuable.72
Existing Policies and Programs 1. The April 2007 Supreme Court ruling stated that carbon dioxide and other greenhouse
gas emissions fall unambiguously under the definition of air pollutants set out in the 1990 Clean Air Act. The Court directed the EPA to review its response to petitions from state and local governments asking for EPA regulation of carbon dioxide emissions—the EPA had previously held that they did not have jurisdiction to regulate such emissions. If the EPA finds that greenhouse gas emissions such as carbon dioxide lead to climate change, it is obligated by the Clean Air Act to regulate such emissions.73 Although the EPA has not released its decision regarding carbon dioxide emissions (as of December 2008), EPA’s Environmental Appeals Board recently blocked the Agency from issuing a permit for a proposed coal plant in Utah, based on the EPA’s Denver office failing to require controls for carbon dioxide emissions. This ruling stops the permitting process of perhaps 100 proposed coal plants. Because of this, the EPA is expected to make its decision regarding carbon dioxide and other greenhouse gases in early 2009.74
2. The Federal Production Tax Credit (PTC), recently extended through 2009, provides
a subsidy for electricity produced from renewable sources. The PTC was originally introduced in the Energy Policy Act of 1992 at a rate of $0.015/kWh and has since been automatically adjusted for inflation to a current rate of $0.022/kWh. Use of the tax credit requires significant eligible tax liability, tending to make it attractive to large corporate developers.
3. The U.S. Department of Agriculture provides competitive grants up to $250,000 for
energy efficiency improvements or $500,000 for renewable energy systems (not to exceed 25% of the total project cost). Loan guarantees are also available to a maximum of $10 million.
71 See William Nordhaus, 2008, A Question of Balance: Weighing the Options on Global Warming Policies, Yale University Press, p. 21–22. 72 As Yale economist William Nordhaus points out, “the economic benefits of a low-cost and environmentally benign backstop technology are huge in terms of net impacts, averted costs, averted damages, and benefit-cost ration. We estimate that a low-cost technological solution would have a net present value of around $17 trillion.” See Nordhaus, 2008, p. 199. 73 It should be noted that the EPA did not dispute that man-made greenhouse gases causes climate change while the case was being heard; see Massachusetts et al. v. Environmental Protection Agency et al., 549 U.S. 497 no. 05-1120: http://laws.findlaw.com/us/000/05-1120.html (accessed December 2008). 74 See Josef Hebert, November 2008, Utah coal plant permit blocked by EPA panel, Associated Press story: http://www.google.com/hostednews/ap/article/ALeqM5gSt_gge-bueZU2rGVTx1SPZzbkAwD94ECPU04 (accessed December 2008).
30

Kansas Energy Report 2009 Chapter 8: Electricity
4. The Energy Independence and Security Act of 2007 includes provisions directing the Department of Energy to fund research and development of renewable and advanced generation technologies (including advanced energy storage and carbon capture and storage). These include the Solar Energy Research and Advancement Act of 2007, the Advanced Geothermal Energy Research and Development Act of 2007, and the Marine and Hydrokinetic Renewable Energy Research and Development Act.75
5. Kansas, in 2001, adopted the Kansas Parallel Electric Generation Services Act
(K.S.A. 66-1,184), a form of net metering that requires an electric utility to pay no less than 150% of the monthly average avoided cost of energy per kWh—essentially the fuel cost associated with producing the equivalent kWh’s—to customers with excess energy to sell. The Kansas Corporation Commission has reviewed net metering and related metering issues in the following dockets: 04-GIME-080-GIE, 07-GIME-116-GIV, 07-GIME-104-GIV, 07-GIME-578-GIE.
6. Under K.S.A. 79-32 and K.S.A. 79-233 to 79-237, expenditures related to new
construction or expansion of capacity in an existing biomass-to-energy plant receive an income tax credit. The credit is 10% of the taxpayer’s qualified investment on the first $250 million invested, and 5% of the taxpayer’s qualified investment that exceeds $250 million. In addition to the income tax credit, a taxpayer shall be entitled to a deduction from Kansas adjusted gross income of the amortizable costs of a new facility. Such deduction shall be equal to 55% of the amortizable costs of the facility for the first taxable year, and 5% for the next nine taxable years.
7. The Carbon Dioxide Reduction Act—K.S.A. 55-1636 to 55-1640, 79-233 and 79-
32,256—provides incentives for sequestration of carbon dioxide through underground storage by allowing any carbon dioxide capture, sequestration, and utilization property and any electric generation unit which captures and sequesters all carbon dioxide and other emissions to be exempt from all property taxes for five years. It also provides for accelerated depreciation on carbon dioxide capture, sequestration, or utilization machinery and equipment. The Kansas Corporation Commission is responsible for developing the associated rules and regulations.
8. The Renewable Electric Cogeneration Facility income tax credit—K.S.A. 79-32,245
through 79-32,249—provides incentives for renewable cogeneration that are equal to 10% of taxpayer’s qualified investment for the first $50 million and an amount equal to 5% of the amount that exceeds $50 million. The program applies to investments between January 1, 2007, and January 1, 2012. In addition to the income tax credit, a taxpayer shall be entitled to a deduction from Kansas adjusted gross income of the amortizable costs of a new facility, the deduction of which shall be equal to 55% of the amortizable costs of the facility for the first taxable year, and 5% for the next nine taxable years.
75 See Edison Electric Institute, December 2007, Summary of Electricity-Related Provisions in H.R. 6: The Energy Independence and Security Act of 2007: http://www.eei.org/industry_issues/electricity_policy/federal_legislation/nonav_timeline_hr6/HR6_EEIsummary.pdf (accessed December 15, 2008).
31
Kansas Energy Report 2009 Chapter 8: Electricity
Section 8.4 Policy and Program Recommendations 1. Encourage federal funding of research and development of all technologies that
can provide base-load power while achieving reduced CO2 emissions.
Description Base-load units produce electricity at an essentially constant rate and run continuously; they are operated to maximize system mechanical and thermal efficiency and minimize system operating costs. A recent report—prepared by the Electric Power Research Institute (EPRI), Energy Technology Assessment Center—suggests that the U.S. electrical power industry has the potential to reduce annual CO2 emissions by roughly 45% by the year 2030 (relative to projection in the Energy Information Administration’s 2007 Annual Energy Outlook). According to this report, achieving these reductions will require an aggressive implementation of a diverse portfolio of advanced technologies, which include end-use energy efficiency, renewable energy sources, advanced nuclear technologies, advanced coal (including pulverized and gasification technologies), CO2 capture and sequestration, plug-in hybrids and utilization of distributed energy resources. According to the EPRI report, development of this group of technologies will require significantly expanded research and development (R&D) efforts. The report estimates funding to be on the order of $1.4 to $2 billion annually through 2030.76 Currently, the federal government spends roughly $6.7 billion annually (41% of total energy subsidies) on electricity production. Electricity production subsidies and support per unit of production vary widely by fuel type; refined coal, solar, and wind power receive by far the highest amount of subsides, ranging from $23 to $30 per megawatt hour (MWh).77 In addition to implementing a federal cap-and-trade policy or carbon tax, the federal government can play a role in reducing emissions of CO2 and other greenhouse gas by subsidizing invention, innovation, and education. Given the value of developing low-cost technological breakthroughs, federal funding of research and development is appropriate.78
76 EPRI Energy Technology Assessment Center, 2007, The Power to Reduce CO2 Emissions: The Full Portfolio: www.epri.com (under product number 1015461). 77 EIA, 2007, Federal Financial Interventions and Subsidies in Energy Markets: Executive Summary: http://www.eia.doe.gov/oiaf/servicerpt/subsidy2/index.html (accessed July 2008). 78 As Yale economist William Nordhaus points out, “the economic benefits of a low-cost and environmentally benign backstop technology are huge in terms of net impacts, averted costs, averted damages, and benefit-cost ration. We estimate that a low-cost technological solution would have a net present value of around $17 trillion.” See Nordhaus, 2008, p. 199.
32

Kansas Energy Report 2009 Chapter 8: Electricity
Recommended Actions
a. Responsible parties The Governor and Legislative leaders should send letters to the Kansas Congressional delegation and other key federal policymakers.
b. Legislative action
Legislators should consider adoption of a resolution in support of this recommendation.
c. Budget requirements
No additional funding required. d. Implementation timeline
Letters to the Congressional delegation should be delivered on or before January 31, 2009.
Implications of Proposal
a. Pros i. May result in development of low-cost alternative technologies that will
have a great benefit to society.
ii. May spur innovation and invention.
b. Cons i. Will likely require additional taxpayer funding (or reduce tax revenues).
ii. May divert resources from other types of research and development.
ii. May promote inefficient subsidies of specific technologies.
33
Kansas Energy Report 2009 Chapter 8: Electricity
[Section 8.4 Policy and Program Recommendations, continued] 2. Encourage the Kansas Bioscience Authority to allocate some of their funds to
research and development related to biomass-fueled electric generation, including the analysis of carbon footprint.
Description In Kansas, seventy-five percent of the electricity generated between July 2006 and July 2007 came from coal-fired power plants (though, of course, generating units using other fossil fuels, gas or diesel, also release CO2 into the atmosphere).79 In 2007, the total greenhouse gas emissions in Kansas associated with electricity generation was 43,250,899 tons of carbon dioxide equivalent.80 Co-firing of electric power plants with biomass waste materials may be a cost-effective state-level strategy to reduce emissions of CO2. Biomass waste, as defined by the U.S. Department of Energy, Energy Information Administration (EIA), is organic non-fossil material of biological origin that is a byproduct or a discarded product. This includes municipal solid waste from biogenic sources, landfill gas, sludge waste, agricultural crop byproducts, straw, and other biomass solids, liquids, and gases. This does not include wood and wood-derived fuels (including black liquor), biofuels feedstock, biodiesel, and fuel ethanol. According to EIA, energy crops grown specifically for energy production are also included in their “biomass waste” data.81 The use of biomass as a fuel in electric generation is considered “carbon neutral” so long as the same quantity of fuel consumed is replanted. The Kansas Bioscience Authority (KBA), created by the Kansas Economic Growth Act (KEGA) in 2004, provides research and development funding to government and private organizations investing in Kansas bioscience.82 With funding of $580 million over fifteen years, the KBA administers programs providing funding for researchers at research institutions as well as programs giving tax incentives and other help to bioscience companies in Kansas.83
79 KEC, 2008, Kansas Net Electrical Generation, Kansas Energy Chart Book: http://www.kec.kansas.gov/chart_book/ (accessed September 2008). 80 Will Stone, KDHE Bureau of Air and Radiation, personal communication, December 8, 2008; based on KDHE’s voluntary survey of electric generating utilities. 81 EIA, 2008, Glossary: http://www.eia.doe.gov/glossary/glossary_b.htm. 82 Kansas Bioscience Authority, 2008, KBA web site (http://www.kansasbioauthority.org/). 83 KBA currently administers four programs relevant to electrical generation: (1) Heartland BioVentures, which facilitates risk capital investment in Kansas bioscience companies; (2) Kansas R&D Voucher Program, which provides funding of research and development programs within Kansas bioscience companies; (3) Kansas Bioscience Attraction and Retention Program, which helps bioscience companies retain and expand bioscience job opportunities within Kansas; and (4) Bioscience Tax Investment Incentive Program, which helps reduce start-up costs by giving direct payments in the amount of 50 percent of a bioscience company’s net operating loss within the state, up to $1 million annually.
34
Kansas Energy Report 2009 Chapter 8: Electricity
Recommended Actions
a. Responsible parties The Governor and Legislative leaders should send letters to the KBA.
b. Legislative action
Legislators may consider whether additional legislation is needed. c. Budget requirements
No additional funding required. d. Implementation timeline
Letters to the KBA should be delivered on or before January 31, 2009.
Implications of Proposal
a. Pros i. May result in development of low-cost biomass co-firing technologies
resulting in reduced emissions of CO2.
ii. May spur innovation and invention in general. b. Cons
i. May divert research and development from other KBA programs and priorities.
ii. May promote inefficient subsidies of specific technologies.
iii. May be resisted by KBA.
35

Kansas Energy Report 2009 Chapter 8: Electricity
[Section 8.4 Policy and Program Recommendations, continued] 3. Endorse collaborative development of advanced generation technologies in
Kansas that can provide base-load power while reducing greenhouse gas emissions. Such collaboration could be between Kansas utilities, between Kansas utilities and regional utilities, or between Kansas utilities and other stakeholders.
Description In Kansas, electrical demand is projected to grow at an average rate of roughly 1.5% to 2% annually for the next 20 years.84 To meet expected demand, Kansas utilities will have to build new base-load power plants or purchase capacity. Moreover, some of the state’s existing generation capacity will be need to be replaced by 2028. Although base-load power plants generally are less expensive to operate than peaking and intermediate plants (see Chapter 8, Overview), they cost more to build and require years of planning and construction.85 Given the state’s current dependence on coal-based generation (roughly 75% of current production), it is likely that Kansas will need to transition to lower-carbon technologies in the coming decades. Nationally, the electricity sector accounts for roughly 40% of U.S. CO2 emissions.86
Kansas utilities, like utilities across the nation, may have difficulty building new base-load generation on their own. They may not be able to mobilize the necessary capital to support such a large project. Moreover, since it has been a long time since major generation projects were undertaken, many utilities may have lost expertise managing such projects.87 Utility collaboration with other utilities or stakeholders may overcome some of the obstacles to building new base-load capacity.
84 Based on preliminary data compiled by KEC staff for forecast load and capacity summaries. Finalized versions will be posted on the web site in coming months. According to the EIA, overall U.S. demand is expected to increase 1.1% annually: Annual Energy Outlook with Projections to 2030: http://www.eia.doe.gov/oiaf/aeo/electricity.html (accessed September 2008). 85 Base-load units produce electricity at an essentially constant rate and run continuously; they are operated to maximize system mechanical and thermal efficiency and minimize system operating costs. Peaking units are normally reserved for operation during the hours of highest daily, weekly, or seasonal loads. Intermediate units, another type of power plant, serve the load in between base load and peak load. Definitions from EIA’s Energy Glossary: http://www.eia.doe.gov/glossary/glossary_i.htm; accessed May 2008. 86 Joskow, 2008. 87 “This increases the likelihood that absent appropriate incentives to control costs, regulated generation projects will be excessively costly and that the cost overruns will be largely borne by consumers.” See Joskow, 2008, p. 16.
36
Kansas Energy Report 2009 Chapter 8: Electricity
Recommended Actions
a. Responsible parties The Governor is encouraged to use the “bully pulpit” to endorse this recommendation. In addition, the KCC should consider whether a docket should be opened in this matter.
b. Legislative action
The Legislature should consider whether legislative action is required. c. Budget requirements
No additional funding required. d. Implementation timeline
Recommended actions should be undertaken during the first half of 2009.
Implications of Proposal
a. Pros i. May spur development of new base-load capacity for Kansas customers.
ii. May result in more cost-effective construction.
iii. May result in smaller increases in customer rates.
b. Cons i. May encounter regulatory complications, if built by regulated utilities.
ii. May encounter opposition from regulated utilities in Kansas, if generation is built by someone else.
37
Kansas Energy Report 2009 Chapter 9: Energy Conservation and Efficiency
38
Chapter 9: Energy Conservation and Efficiency
Overview U.S. energy consumption varies with changes in population, economic growth, energy prices, and technology adoption. Total energy consumption declined slightly from 2005 to 2006 (the most recent year for which data are available).88 Although overall energy consumption is expected to increase, the rate of growth is projected to be much slower through 2030 than in past decades, due to higher prices and increased efforts to improve efficiency89—and, in the near term, as a result of the global economic slowdown. Nationwide, total retail sales of electricity in 2006 (the most recent year for which historical data are available) were 3,670 million MWh, up 0.2 percent from 2005, compared with the 1.8 percent average annual growth since 1995. Sales to the residential sector decreased by 0.6 percent from 2005 to 2006, marking only the second such decrease since 1974. Sales to the commercial sector increased by 1.9 percent, and sales to the industrial sector decreased 0.8 percent.90 U.S. natural gas consumption in 2007 was 23,054,056 million cubic feet, an increase of 4.7 percent from 2005.91 Although natural gas usage per customer has declined for more than twenty years, total consumption is expected to grow. The average U.S. residential natural gas consumption on a weather-adjusted basis declined by 1 percent annually from 1980 to 2000 and by 2.2 percent annually from 2000 to 2006, according to the American Gas Association (AGA).92 In Kansas, electric utility customers used 39,751,000 megawatthours in 2006,93 a 1.9 percent increase over 2005. Natural gas consumption by consumers in 2007 was 230,716 million cubic feet (Mcf), compared to 211,662 Mcf in 2006—nonetheless, statewide consumption of natural gas in 2006 is still significantly lower than it was a decade ago.94
88 U.S. Dept. of Energy, Energy Information Administration (EIA), 2008, Table 1.3, Primary Energy Consumption by Source, Selected Years, 1949-2007, linked to Annual Energy Review: http://www.eia.doe.gov/emeu/aer/overview.html (accessed December 18, 2008). 89 EIA, 2008, New EIA Energy Outlook projects flat oil consumption to 2030, slower growth in energy use and carbon dioxide emissions, and reduced import dependence: EIA press release, December 17, 2008: http://www.eia.doe.gov/neic/press/press312.html (accessed December 18, 2008). 90 EIA, 2008, Electric Sales, Revenue, and Price: http://www.eia.doe.gov/cneaf/electricity/esr/esr_sum.html (accessed December 18, 2008). 91 EIA, 2008, Natural Gas Consumption by End Use: http://tonto.eia.doe.gov/dnav/ng/ng_cons_sum_dcu_nus_a.htm (accessed December 18, 2008). 92 The total reduction from 2000 to 2006 was 13.1 percent; see American Gas Association, 2007, Response of the American Gas Association to the U.S. House of Representatives, Committee on Energy and Commerce, on Questions Regarding Climate Change, March 19, 2007: http://energycommerce.house.gov/Climate_Change/Solicited%20Responses/AGA.031907.resp.pdf (accessed November 2007). 93 EIA, 2008, Table 2. Sales to Bundled and Unbundled Consumers by Sector, Census Division, and State 2006: spreadsheet linked to http://www.eia.doe.gov/cneaf/electricity/esr/esr_sum.html (accessed December 18, 2008). 94 EIA, 2008, Natural Gas Consumption by End Use: http://tonto.eia.doe.gov/dnav/ng/ng_cons_sum_dcu_SKS_a.htm (accessed December 18, 2008).

Kansas Energy Report 2009 Chapter 9: Energy Conservation and Efficiency
U.S. policymakers and others continue to discuss the potential for reduced usage through greater efficiency and conservation in the residential, commercial, industrial, and public sectors.95 A November 2008 report from the National Action Plan for Energy Efficiency sets a goal of achieving all cost-effective energy efficiency by 2025—this aggressive pursuit of energy efficiency “may be able to meet 50 percent or more of the expected load growth over this time frame, similar to meeting 20 percent of electricity consumption and 10 percent of natural gas consumption.”96
Worldwide, businesses and industries are looking for ways to increase efficiency and reduce energy usage, with varying estimates of the potential to be achieved. A recent study by the International Energy Agency estimates that heavy industry could reduce its energy use by 18 percent to 26 percent. Light industries, such as retailing and the food sector, which haven’t invested as much to date in efficiency, could reduce energy use even more.97
Here in Kansas, no one doubts that there are opportunities for cost-effective energy conservation and efficiency improvements. Many existing buildings are poorly insulated or have inefficient heating and cooling systems, resulting in excessive energy use and, consequently, excessive energy bills year round. Cost-effective energy conservation measures—such as upgrading attic insulation to at least R-38 or installing an Energy Star qualified furnace—may reduce energy usage by as much as 20 percent,98 while providing dollar savings as well. Increased adoption of these measures statewide can have a significant impact on energy consumption in Kansas. Reduced energy consumption through conservation may provide a range of benefits, including downward pressure on all energy-related prices, deferral of energy-related costs such as investment in new power plants and extraction equipment, and reduction in health and environmental costs related to the energy-related emission of pollutants and greenhouse gases. And, last but not least, energy conservation efforts by individual consumers can result in lower monthly utility bills.
95 See Energy Efficiency Potential Study for the State of Kansas: Final Report, prepared by Summit Blue Consulting, submitted to the Kansas Energy Council, August 11, 2008: http://www.kec.kansas.gov/reports/KEC_DSM_Final_081108.pdf. 96 See National Action Plan for Energy Efficiency Vision for 2025: A Framework for Change, Executive Summary, November 2008: http://www.epa.gov/cleanenergy/documents/vision_execsumm.pdf (accessed December 19, 2008). 97 Leila Abboud and John Biers, 2007, Business Goes on an Energy Diet: Wall Street Journal, August 27, 2007. 98 U.S. Environmental Protection Agency and U.S. Dept. of Energy, 2007, Energy Star web site: http://www.energystar.gov/index.cfm?c=heat_cool.pr_hvac and http://www.energystar.gov/index.cfm?c=home_sealing.hm_improvement_sealing (accessed October 23, 2006).
39
Kansas Energy Report 2009 Chapter 9: Energy Conservation and Efficiency
Section 9.4: Public Sector Topic/Issue Description Many publicly owned buildings, from State government buildings to municipal fire stations, require large amounts of energy to power lighting and run heating, ventilation, and cooling systems, the costs of which are ultimately borne by Kansas taxpayers. As Governor Sebelius noted in her January 2007 Executive Directive on Energy Conservation and Management, the State of Kansas should be “at the forefront of appropriate and effective energy and environmental practices.” During the 2008 session, the Kansas Legislature considered adopting standards for new state-funded construction (Senate Bill 452), including that all new construction projects by state agencies achieve energy consumption levels at least 25% below those set out by the International Energy Conservation Code (IECC) 2006.99 In 2007, the Kansas Legislature adopted IECC 2006 as the statewide standard for commercial and industrial structures. Adoption and implementation of state-level standards is consistent with the goals of the National Action Plan for Energy Efficiency, which encourage states to develop policies to ensure robust energy efficiency practices, including establishment and enforcement of energy efficiency building codes.100
Existing Policies and Programs
1. In Executive Directive 07-373, Governor Sebelius targeted energy conservation and efficiency throughout State government. The directive requires state agencies—primarily the Department of Administration, Kansas Corporation Commission, and Kansas Department of Health and Environment—to (1) survey state employees for energy saving suggestions; (2) require energy audits on any facility being considered as leased space and require landlords to make necessary improvements; (3) collect energy data associated with state-owned and leased space and identify locations using excessive energy; (4) ensure that the average EPA mileage rating for auto purchases and leases in 2010 is at least 10% higher than the 2007 average; (5) review purchasing practices to assure 100% compliance with existing energy conservation requirements and develop or increase standards for such products as appliances, light bulbs, and computers using Energy Star as a minimum; (6) turn off all computers not having a technical or operational need when not in use for four or more hours; (7) expand state recycling program to every state office by December 2007; (8) include information on fuel efficiency and driver behavior in driver’s handbook and exam; (9) use the Facility Conservation Improvement Program (FCIP) to implement cost-
99 Senate Bill 452: http://www.kslegislature.org/bills/2008/452.pdf (accessed September 8, 2008) 100 See Goal Six in the National Action Plan for Energy Efficiency Vision for 2025: A Framework for Change, Executive Summary, November 2008: http://www.epa.gov/cleanenergy/documents/vision_execsumm.pdf (accessed December 19, 2008).
40
Kansas Energy Report 2009 Chapter 9: Energy Conservation and Efficiency
effective conservation and efficiency measures in all state-owned buildings by 2010; (10) accelerate efforts to market FCIP to school districts and local governments; and (11) review all state construction projects, both new and remodeling, that exceed $100,000 for possible inclusion in FCIP, including Regents facilities. The Governor’s directive also established a new Energy Auditor position at the Department of Administration, responsible for oversight of these initiatives.
2. The Facilities Conservation Improvement Program (FCIP), administered by the
Energy Programs Division at the Kansas Corporation Commission, works to promote and facilitate energy conservation in state, municipal, county, and educational facilities. The FCIP connects public agencies with qualified private energy service companies (ESCOs) that identify and evaluate energy-saving opportunities and recommend improvements. The money saved from reduced energy usage are then used to pay for the cost of the improvement project. The ESCOs guarantee that energy savings will cover the annual payments for all project costs. If actual savings are less than the annual payments, the ESCO pays the difference. To date, the FCIP has overseen over 60 projects with a collective annual energy savings estimated at $12 million.
3. K.S.A. 75-3783 specifies the powers and duties delegated to the Secretary of
Administration in overseeing the construction or renovation of state buildings and provides, in subsection (b), that the Secretary may adopt rules and regulations establishing standards for the planning, design and construction of buildings, and major repairs and improvements to buildings. These standards must include energy conservation standards. To date, the Secretary has not promulgated any regulations concerning energy conservation standards. However, the Division of Facilities Management in the Kansas Department of Administration has adopted a policy to use the 2003 International Energy Conservation Code (IECC) as its conservation standard for all new state-financed construction, though there are no formal design review or enforcement procedures. However, because industry standards generally exceed IECC 2003, there is an expectation that the standard is met.
4. Following the May 2007 tornado that destroyed much of the city, the Greensburg City
Council passed an ordinance requiring all new and renovated municipally owned facilities (over 4,000 square feet) achieve a USGBC LEED rating of platinum. Additionally, all buildings are required to receive all 10 credits possible under the “Optimize Energy Performance” section of the LEED new construction standard (equivalent to achieving energy reductions of 42% below IECC 2006).
5. The U.S. Department of Energy (DOE), through its Building Technologies Program,
funds several initiatives to advance research and development of energy efficient buildings, improve building codes and appliance standards, and promote education. Energy Star, a joint program of the U.S. Environmental Protection Agency (EPA), is a voluntary labeling program designed to identify and promote energy-efficient products; the Energy Star label is now on major appliances, office equipment, lighting, and home electronics, and EPA has extended the label to cover new homes
41

Kansas Energy Report 2009 Chapter 9: Energy Conservation and Efficiency
and commercial and industrial buildings. The Building Technologies Program also includes Rebuild America, and Zero Energy Buildings.
6. The Federal Energy Management Program, administered by DOE, targets the federal
government for energy efficiency improvements, encouraging energy efficient equipment purchases, construction, retrofitting, and operations.
7. The Energy Policy Act of 2005 (EPAct 2005) directs federal agencies to purchase
only items approved by the Energy Star or Federal Energy Management program. In addition, all new federal buildings are required to be built 30% below the American Society of Heating, Refrigerating and Air-Conditioning Engineers (ASHRAE) 2004 standards—equivalent to 30% below IECC 2006 standards.101
8. On December 19, 2007, President Bush signed into law the Energy Independence and
Security Act of 2007. Under this statue, the federal goal of reducing energy consumption is increased from 2% to 3% per year. The law also requires that 30% of hot water demand for new or renovated federal buildings be met through the use of solar hot water heating, provided the measures are cost-effective for the life-cycle of the building.
9. The National Action Plan for Energy Efficiency is a private-public initiative, which
began in 2005 with the goal of promoting a “sustainable, aggressive national commitment to energy efficiency through the collaborative efforts of gas and electric utilities, utility regulators, and other partner organizations.”102
10. The Leadership in Energy and Environmental Design (LEED) rating system evaluates
the energy efficiency and overall “environmental friendliness” of buildings on a four-tier scale: certified, silver, gold, and platinum. LEED is maintained by the U.S. Green Building Council (USGBC). In order to receive a LEED rating, a building project must register with the USGBC and undergo an audit; achieving any of the four certification levels requires a minimum number of points and the inclusion of points from certain categories. The USGBC now delegates certification to the Green Building Certification Institute (GBCI). Currently, LEED-based standards and incentives have been adopted by 90 U.S. municipalities and 24 states. Almost all standards are aimed at public buildings.103
11. Green Globes is another green rating system developed by the Building Research
Environmental Assessment Method (BREEAM). Green Globes are awarded to buildings based on assessments provided in seven categories: energy, indoor environment, site, resources, water, emissions and effluents, and project management.
101 Database of State Incentives for Renewables & Efficiency (DSIRE), January 2008, Feder – Energy Goals and Standards for Federal Buildings: http://www.dsireusa.org/library/includes/summtabsrch.cfm?Incentive_Code=US02R&Back=regeetab&state=US&type=Public&CurrentPageID=7&EE=1&RE=1 (accessed December 5, 2008). 102 U.S. Environmental Protection Agency (EPA), 2008, National Action Plan for Energy Efficiency: http://www.epa.gov/cleanenergy/energy-programs/nape/index.html (accessed December 2008). 103 U.S. Green Building Council (USBC), 2007: http://www.usgbc.org/ (accessed November 28, 2007)
42

Kansas Energy Report 2009 Chapter 9: Energy Conservation and Efficiency
Scoring of these seven categories is based on a simple online questionnaire through the GBI’s website.
43
Kansas Energy Report 2009 Chapter 9: Energy Conservation and Efficiency
Section 9.4 Policy and Program Recommendations 1. The State of Kansas should adopt a goal of increasing energy efficiency such that
the rate of growth in electricity peak demand and total energy is 50% less than it would have been absent the energy efficiency initiative.
Note: This recommendation is also listed in Sections 9.1, 9.2, and 9.3.
Description According to projections released in December 2008 by the Energy Information Administration, U.S. electricity consumption is projected to grow at an average rate of 1.0 percent annually. This demand growth is much slower than the 2.4 percent annual growth seen in the 1990’s and consistent with the trend since 2000, likely reflecting responses to higher prices, increased efficiency standards, and improved efficiency.104
In 2006, Kansas utilities generated 45.5 million megawatthours (MWh) of electricity, in response to total annual retail demand of 39.7 million MWh.105 Demand for electricity in Kansas is projected to grow at an average rate of roughly 1.5% to 2% annually for the next 20 years,106 although these numbers are likely to be revised downward due to the current national (and global) economic downturn.107 Reducing energy consumption through conservation and improved efficiency could result in downward pressure on all energy-related prices, deferral of energy-related investments in new power plants and extraction equipment, reduction in health and environmental costs related to the energy-related emission of pollutants and greenhouse gases. Moreover, energy conservation efforts by individual consumers can result in lower monthly utility bills. There is little doubt that Kansans have opportunities for cost-effective energy conservation and efficiency improvements that will reduce their electricity usage (as well as natural gas consumption). Many existing buildings are poorly insulated or have inefficient heating and cooling systems, resulting in excessive energy use and, consequently, excessive energy bills year round. Cost-effective energy conservation measures—such as upgrading attic insulation to at least R-38 or installing an Energy
104 EIA, 2008, Annual Energy Outlook 2009, Early Release Summary Presentation, Slide 13, linked to: http://www.eia.doe.gov/oiaf/aeo/index.html (accessed December 19, 2008). 105 EIA, 2007, Kansas Electricity Profile: Table 1, 2006 Summary Statistics (Kansas): http://www.eia.doe.gov/cneaf/electricity/st_profiles/kansas.html 106 Based on preliminary data compiled by KEC staff for forecast load and capacity summaries. Finalized versions will be posted on the web site in coming months. According to the EIA, overall U.S. demand is expected to increase 1.1% annually: Annual Energy Outlook with Projections to 2030: http://www.eia.doe.gov/oiaf/aeo/electricity.html (accessed September 2008). 107 According to the National Bureau of Economic Research, the U.S. economy has been in recession since December 2007; this official announcement came on December 1, 2008.
44

Kansas Energy Report 2009 Chapter 9: Energy Conservation and Efficiency
Star qualified furnace—may reduce energy usage by as much as 20 percent,108 while providing dollar savings as well. An oft-cited approach to increasing the adoption of energy conservation and efficiency measures is through utility-sponsored programs—commonly referred to as energy efficiency (EE) programs or demand-side management (DSM) programs. Such programs first appeared in the late 1970s and saw increasing popularity through the 1980s. Utility and ratepayer spending on EE programs peaked at $2.74 billion in 1993 and then declined,109 coinciding with a decline in political popularity of these programs. Recommended Actions
a. Responsible parties Governor, Legislature, KCC. The Governor and Legislature should reference goal as part of State initiatives to reduce electricity usage.
b. Legislative action
Legislature should reference goal in bills aimed to improve conservation and efficiency in the electricity sector.
c. Budget requirements
No additional funding required. d. Implementation timeline
Goal should be referenced following the delivery of the Kansas Energy Report 2009 in January 2009.
Implications of Proposal
a. Pros i. May increase public and private sector initiatives to reduce usage of
electricity during times of peak demand.
ii. May increase public and private sector efforts to reduce overall electricity consumption.
108 U.S. Environmental Protection Agency and U.S. Dept. of Energy, 2007, Energy Star web site: http://www.energystar.gov/index.cfm?c=heat_cool.pr_hvac and http://www.energystar.gov/index.cfm?c=home_sealing.hm_improvement_sealing (accessed October 23, 2006). 109 American Council for an Energy Efficiency Economy (ACEEE), 2000, State Scorecard on Utility Energy Efficiency Programs, by Steven Nadel, Tor Kubo, and Howard Geller: http://www.aceee.org/pubs/u004.htm (accessed November 2007).
45

Kansas Energy Report 2009 Chapter 9: Energy Conservation and Efficiency
iii. Provides consistent statewide goal, against which electricity growth rates can be measured.
b. Cons
i. Goal may be viewed as not sufficiently ambitious (or as overly ambitious).
46

Kansas Energy Report 2009 Chapter 9: Energy Conservation and Efficiency
[Section 9.4 Policy and Program Recommendations, continued] 2. Establish minimum building design standard for all new and renovated,
occupied, majority State-funded construction in accordance with LEED Platinum or design equivalent.
Description Many publicly owned buildings require large amounts of energy to power lighting and run heating, ventilation, and cooling systems, the costs of which are ultimately borne by Kansas taxpayers. Clearly, increasing the energy efficiency of these structures makes economic sense, and the State should ensure that any new buildings constructed with State funds meet reasonable energy efficiency standards. As Governor Sebelius noted in her Executive Directive 07-373, the State of Kansas should be “at the forefront of appropriate and effective energy and environmental practices.”110 Establishing a minimum energy efficiency standard for all majority State-funded (excludes public schools) new construction and renovations is clearly in keeping with this objective. Moreover, the Kansas Legislature introduced Senate Bill 452111 during the 2008 session, which required (among other things) that all new construction projects by state agencies achieve energy consumption levels at least 25% below those set out by the International Energy Conservation Code (IECC) 2006.112 Adoption and implementation of state-level standards is consistent with the goals of the National Action Plan for Energy Efficiency, which encourage states to develop policies to ensure robust energy efficiency practices, including establishment and enforcement of energy efficiency building codes.113
The Leadership in Energy and Environmental Design (LEED) standard, promulgated by the U.S. Green Building Council (USGBC), would require new construction and renovations to receive an audit, in which energy efficiency and overall “environmental friendliness” is evaluated. The USGBC then gives the building a rating—certified, silver, gold, and platinum—based on the score it receives in
110 Executive Directive on Energy Conservation and Management (07-373): http://www.da.ks.gov/ps/subject/arc/executivedirectives/2007/ExeDir%2007%20373.pdf (accessed September 8, 2008) 111 Senate Bill 452: http://www.kslegislature.org/bills/2008/452.pdf (accessed September 8, 2008) 112 IECC 2006 is a comprehensive energy conservation code regulating most aspects of energy loss within commercial and residential buildings. These regulations differ by climate region within the United States, and include minimum insulation levels, solar heat gain coefficients on windows, and regulation of lighting, heating, air-conditioning and ductwork.112 Because the measures within IECC 2006 reduce energy consumption, renovations pay for themselves over time. A Nevada study estimated that the average cost to renovate a commercial building to comply with IECC 2006 was $1.60 per square foot and resulted in annual energy savings of $0.68 per square foot; in other words, the renovations were estimated to pay for themselves in as little as two and a half years.112 113 See Goal Six in the National Action Plan for Energy Efficiency Vision for 2025: A Framework for Change, Executive Summary, November 2008: http://www.epa.gov/cleanenergy/documents/vision_execsumm.pdf (accessed December 19, 2008).
47

Kansas Energy Report 2009 Chapter 9: Energy Conservation and Efficiency
categories related to sustainable sites, water efficiency, energy and atmosphere, materials and resources, and indoor environmental quality.114 Many states across the U.S. have energy efficiency standards for state buildings. Eight states—Arizona, Connecticut, Massachusetts, Michigan, New Mexico, Rhode Island, Washington, and Wisconsin—currently require newly constructed state buildings meet LEED standard (most require LEED silver certification, though Michigan and Massachusetts only requires new construction to meet LEED certification). Eleven other states—California, Colorado, Florida, Hawaii, Illinois, Indiana, Maryland, New Jersey, Nevada, Oklahoma, South Carolina, and South Dakota—require that publicly funded buildings meet LEED Silver certification or a comparable standard, such as two Globes under the Green Globes rating system, or the an EPA Energy Star rating. California and a handful of other states additionally require existing state buildings operate under sustainability guidelines. In California’s case this requirement is a certification under LEED’s Existing Buildings standard.
As might be expected, the costs of building to LEED standard vary, depending on the project. Depending on the study’s methodology, additional costs are estimated to be negligible to perhaps 6% to obtain a level of energy efficiency and “environmental friendliness” equivalent to standards such as LEED silver. Although meeting higher LEED standards is often associated with higher costs, it’s currently difficult to evaluate due to small number of buildings currently built to those levels.115 The costs associated with the certification process through the USGBC are often considered expensive, requiring rigorous documentation and studies. This has led many jurisdictions to simply require buildings to be “certifiable” under a particular LEED level of Certification, without being actually certified.116
Recommended Actions
a. Responsible parties Kansas Legislature.
b. Legislative action Adopt minimum energy efficiency standard for all majority State-funded new construction, as described above.
c. Budget requirements Depending on the monitoring and enforcement provisions of the legislation, some additional funding may be required.
114 U.S. Green Building Council, October 2005, LEED for New Construction & Major Renovations: http://www.usgbc.org/ShowFile.aspx?DocumentID=1095 (accessed July 23, 2008) 115 Peter Morris and Davis Langdon, Summer 2007, What Does Green Really Cost?, PREA Quarterly 116 Allyson Wendt, April 2008, Navigating Incentives and Regulations for Green Buildings, Environmental Building News, vol. 17, no. 4, p.1-19
48

Kansas Energy Report 2009 Chapter 9: Energy Conservation and Efficiency
d. Implementation timeline Initiated on the effective date of enabling legislation.
Implications of Proposal
a. Pros i. Establishes leadership for the private sector on the importance of energy
efficiency in newly constructed buildings.
ii. Reduces long-term energy costs in public buildings, saving Kansas taxpayers money.
iii. Reduces energy consumption in Kansas public buildings.
b. Cons i. May require additional funding in order to insure compliance.
ii. May require additional time and training for Department of Administration employees to implement new EE standards in their practices.
iii. May increase the initial, up-front cost of construction.
49

Kansas Energy Report 2009 Chapter 10: Energy Use in the Transportation Sector
50
Chapter 10: Energy Use in the Transportation Sector
Overview Given the estimated 239 million vehicles owned by U.S. residents in 2005, it is no surprise that the transportation sector consumes 28 percent of the nations’ energy, coming in a close third behind the electricity and industrial sectors.117 Although the sector includes the aviation, marine, pipeline, and the railroad industry; the majority of the energy used in transportation is associated with highway vehicles: 61 percent for personal vehicles, and 19 percent for the commercial trucking industry.118 Within the last decade the percentage growth in energy consumption by the transportation sector outpaced all other sectors except the commercial sector, with which it was tied.119 For over a hundred years, vehicles have been predominately powered by internal combustion engines, using petroleum-based fuels derived from crude oil—commonly diesel fuel and gasoline. Many believe that the transportation industry will transition from petroleum-based fuels derived from traditional crude oil to entirely new fuels or petroleum-based fuels derived from non-conventional sources such as coal, tar sands, or shale. In 2007, petroleum-based fuels accounted for over 95 percent of the total energy used in the transportation sector.120 The combustion of petroleum-based fuels in vehicles releases large amounts of pollutants such as carbon monoxide, nitrogen oxides, and various hydrocarbons that produce ozone in the atmosphere. Fossil fuel combustion also produces large amounts of carbon dioxide, one of the greenhouse gases that the Intergovernmental Panel on Climate Change (IPCC) concludes is “very likely” to be causing global climate change (see Section 2.3). In fact, the transportation sector accounts for 33 percent of the carbon dioxide emitted in the U.S.121
117 Energy Information Agency (EIA), October 2007, Energy Kid’s Page: Transportation Energy Use: http://www.eia.doe.gov/kids/energyfacts/uses/transportation.html (accessed December 19, 2008). 118 EIA, 2008, Transportation Energy Data Book: Table 2.7: spreadsheet link from http://cta.ornl.gov/data/chapter2.shtml (accessed December 22, 2008). 119 EIA, June 2008, Annual Energy Review: Energy Consumption by Sector: http://www.eia.doe.gov/emeu/aer/pdf/pages/sec2_4.pdf (accessed December 19, 2008). 120 Petroleum fuels that are blended with biomass fuels, such as E85 ethanol and biodiesel, are only counted for the percentage of petroleum contained in the fuel; see EIA, June 2008, Annual Energy Review: Energy Consumption by Sector: http://www.eia.doe.gov/emeu/aer/pdf/pages/sec2_4.pdf (accessed December 19, 2008). 121 Pew Center on Global Climate Change, May 2003, Reducing Greenhouse Gas Emissions from U.S. Transportation: http://www.ethanolrfa.org/objects/documents/75/pewclimate.pdf (accessed December 19, 2008).

Kansas Energy Report 2009 Chapter 10: Energy Use in the Transportation Sector
Section 10.1: Cars, Light Trucks Topic/Issue Description In 2006, personal vehicles, defined as cars and light trucks, consumed 16,796 trillion British thermal units (BTUs) worth of energy and accounted for 61 percent of energy consumption in the transportation sector.122 Although average vehicle fuel economy standards have improved significantly since the early 1970’s, energy consumption in the U.S. associated with personal vehicles has continued to grow because people are driving their vehicles more miles.123 Between 1980 and 1997, U.S. total Vehicle Miles Traveled (VMT) increased 63 percent, and was more than double what it was in 1970. Moreover, VMT growth has exceeded population growth and, between 1980 and 1997, was greater than the rate of U.S. economic growth.124 In the last decade, the rate of growth in VMT has slowed to 1.5 percent.125 In 2008, with the weakened global economy and higher gasoline prices during much of the year, VMT declined 4 percent from 2007.126 Nonetheless, according to the U.S. Department of Transportation, total VMT is expected to grow 60 percent by
1272030.
e s greater work commutes and urban
rawl contribute to the state’s VMT growth.128
rogen d hydrocarbons that produce ozone in the atmosphere, as well as carbon
ioxide.
Total VMT in Kansas has increased consistent with the national average: every year thrate of VMT continues to increase. Factors such asp This steady growth in VMT strains the existing roadway network and increases vehicle emissions and congestion, particularly in the urban areas. Strategies to reduce VMT are key to reducing the environmental impacts from emissions of carbon monoxide, nitoxides, and
122 EIA, 2008, Transportation Energy Data Book: Table 2.7: spreadsheet link from http://cta.ornl.gov/data/chapter2.shtml (accessed December 22, 2008). 123 Energy Information Agency, June 2008, Annual Energy Review: Motor Vehicle Mileage, Fuel Consumption, and Fuel Rates: http://www.eia.doe.gov/emeu/aer/txt/stb0208.xls (accessed December 22, 2008). 124 U.S. Department of Transportation, March 2006, Federal Highway Administration, Highway Statistics (Summary to 1995, and annual editions 1996 and 1997); linked to individual pages from http://www.fhwa.dot.gov/policy/ohpi/hss/hsspubs.cfm. 125 Bureau of Transportation Statistics (BTS), May 2008, U.S. Highway Vehicle Miles Traveled: http://www.bts.gov/publications/white_house_economic_statistics_briefing_room/may_2008/html/highway_vehicle_miles_traveled_table.html (accessed December 19, 2008). 126 4% is the average decline in monthly 2008 VMT totals compared to like-month 2007 VMT totals for the first 10 months of 2008; see Federal Highway Administration, December 2008, Traffic Volume Trends: http://www.fhwa.dot.gov/ohim/tvtw/tvtpage.cfm (accessed December 19, 2008). 127 U.S. Department of Transportation, January 2008, Transportation Vision for 2030: U.S. Population and Highway Vehicle Miles Traveled 2000-2030: http://www.rita.dot.gov/publications/transportation_vision_2030/html/figure_01.html (accessed December 19, 2008). 128 See Victoria Transport Policy Institute, December 2008, Generated Traffic and Induced Travel: http://www.vtpi.org/gentraf.pdf (accessed December 22, 2008).
51
Kansas Energy Report 2009 Chapter 10: Energy Use in the Transportation Sector
Existing Policies and Programs
The Energy Policy Act of 2005 established federal income tax credits for the purchase of hybrid electric vehicles. The tax credit applies to vehicles purchased orplaced in service on or after January 1, 2006. The amount of the credit for a given model varies, and the full credit diminishes once the manufacturer has sold 60,000 hybrid vehicles. According to the IRS, “consumers seeking the credit
1.
may want to buy early since the full credit is only available for a limited time.”129
2. 9
y
(CAFE) standard of 35 miles per gallon by model year 2020.
3. ation
ars and light duty trucks by setting standards for the average fleet fuel economy.130
4. nd
ve
and information about tax credits for hybrids and other high fuel efficient vehicles.
5. r nd
f .
owned and registered by the state, transporting approximately 250 people daily.
The Energy Independence Act of 2007 sets a Renewable Fuel Standard (RFS) of billion gallons in 2008, which increases to 36 billion gallons by 2022. Of the 36 billion gallons required by 2022, 21 billion must come from advanced biofuels, suchas cellulosic ethanol. The Act also increases the Corporate Average Fuel Econom
CAFE standards are regulated by the National Highway Traffic Safety Administr(NHTSA) and the Environmental Protection Agency (EPA), and aims to reduce energy consumption by increasing the fuel economy of c
The U.S. Department of Energy (DOE) has a number of programs designed to increase energy efficiency within the transportation sector. The FreedomCAR aFuel Initiative program works with the energy industry to develop and deploy advanced transportation technologies to reduce U.S. dependence on foreign oil reserves. The Clean Cities Program facilitates public-private partnerships to developalternative-fueled vehicles and infrastructure in local communities. The AlternatiFuels Data Center website contains information on alternatively fueled vehicles locations for alternative-fuel fueling stations, and the Fueleconomy.gov web site provides tips and suggestions on reducing vehicle fuel consumption
The Kansas State Vanpool Program (K.S.A. 75-46a03) is a transportation program fostate employees “to promote conservation of petroleum resources, reduce traffic aparking congestion, and diminish air pollution by facilitation the creation of self-supporting commuter vanpools in which state employees living and working in similar locations may ride to and from their places of employment.” The Secretary oAdministration sets the passenger fee for each vanpool so that it is self-supportingCurrently, the program consists of 21 vehicles
129 Internal Revenue Service, Hybrid Cars and Alternative Motor Vehicles: http://www.irs.gov/newsroom/article/0,,id=157632,00.html (updated November 22, 2006). 130 Congressional Research Service, December 2007, Energy Independence Act of 2007: A Summary of Major Provisions: http://energy.senate.gov/public/_files/RL342941.pdf (accessed December 19, 2008).
52
Kansas Energy Report 2009 Chapter 10: Energy Use in the Transportation Sector
6. Executive Directive 07-373, Energy Conservation and Management, directs the sed in 2010
. On August 18, 2008, Governor Sebelius announced the formation of the
8. y
nd ty. The
l Vehicles Transports (ASVTs) to ease congestion near the Kansas Speedway in Wyandotte County. A
The Kansas State Department of Education (KSDE), and the Kansas Department of
in
10.
nsas operates a park-and-ride facility at the edge of campus in Lawrence to provide for connection to a campus circulator service and potentially as
ty
11.
ting General Motors, Toyota, Ford, and seven other automakers—to create the EcoDriving campaign. The campaign seeks to educate both individuals and state/local lawmakers on simple steps to reduce fuel consumption and carbon dioxide emissions.131
Kansas Department of Administration to ensure that state vehicles purchaand beyond are at least 10% more efficient than 2007 average.
7Transportation-Leveraging Investments in Kansas (T-LINK) task force to develop recommendations for a new strategic transportation approach in Kansas.
The Kansas Department of Transportation (KDOT) is funding a research venture bAmtrak into the possibility of connecting Amtrak’s Southwest Chief and HeartlaFlyer routes, providing Amtrak service between Kansas City and Oklahoma Cistudy began in the summer of 2008 and is expected to be completed by the end of 2009. Additionally, KDOT has partnered with public and private researchers to investigate the potential of a system of Automated Smal
similar system is currently being developed for England’s Heathrow International Airport and scheduled to become operational in 2009.
9. Revenue (KDOR) established internal policies for telecommuting/teleworking2006.
The Kansas City Area Transit Authority (KCATA) operates 37 park-and-ride locations along various bus routes throughout Kansas City. Additionally, the University of Ka
a transfer point for regular city service and for bus service between Johnson Counand Lawrence.
California Governor Arnold Schwarzenegger and Colorado Governor Bill Ritter teamed up with The Alliance of Automobile Manufacturers—an automotive trade group represen
131 The Alliance of Automobile Manufacturers, 2008, EcoDriving: www.ecodrivingusa.com
53
Kansas Energy Report 2009 Chapter 10: Energy Use in the Transportation Sector
Section 10.1 Policy and Program Recommendations
1. Encourage State agencies to develop guidelines for telecommuting for appropriate state employees, giving broad discretion to State agencies on how such an option would be applied. Description In 2007, about 12 million U.S. employees “telecommuted” at least 8 hours weekly, double the 6 million employees who telecommuted in 2000.132 Some employers view telecommuting as a way to reduce their costs associated with office rental and information technology. By eliminating or decreasing the vehicle miles traveled (VMT) by employees, telecommuting reduces emissions of CO2 and other pollutants. The Open Work program at Sun Microsystems provides a private-sector example of the benefits of telecommuting. This program, which has been in place for over a decade, allows workers to utilize a range of flexible work environments, including telecommuting. Sun estimates the Open Work program has allowed them to reduce their real estate holdings by more that 15% (2.6 million square feet), maintain productivity during the 2007 California wild-fires, and reduce the company’s carbon dioxide emissions by 31,000 tons per year. Additionally, working from home an average of 2.1 days per week was estimated to save more than $1,700 per year in gasoline and vehicle wear.133 The State of Kansas currently employs approximately 40,000 full time employees and 25,000 part-time employees across the state in various state agencies. Of these employees, 40% live a city different from the one in which they work.134 State agencies have complete discretion in determining whether or not to provided telecommuting opportunities for their individual employees.135 Allowing State government employees to telecommute would not only reduce VMT could help to reduce the state’s carbon footprint. also reducing employee’s costs associated with gasoline purchases and vehicle wear. It may also improve employee productivity and provide supervisors an additional, no-cost incentive to offer employees they wish to retain. In the case of a natural disaster or emergency, telecommuting could provide for continuity of operations. As with any management policies, telecommuting policies should take into consideration the suitability of particular jobs for telecommuting, supervisor’s management style, and the personal characteristics and work habits of the employee.
132 Eve Tahminciogul, The quiet revolution: telecommuting, MSNBC.com, October 5, 2007: http://www.msnbc.msn.com/id/20281475 (accessed July 2008) 133 Sun Microsystems, October 2008, Overview Brochure; PDF can be linked from: http://www.sun.com/aboutsun/openwork/index.jsp (accessed December 5, 2008). 134 Kristine Scott, Department of Administration, personal communication, September 3, 2008. 135 Department of Administration Division of Personnel Services, August 2008, Bulletin 08-04 State Telecommuting Policy: http://da.ks.gov/ps/documents/bulletins/0804.htm.
54
Kansas Energy Report 2009 Chapter 10: Energy Use in the Transportation Sector
Recommended Actions
a. Responsible parties The Governor should send letters to the leadership of the various state agencies.
b. Legislative action Legislators should consider adoption of a resolution in support of this recommendation.
c. Budget requirements No additional funding is requested.
d. Implementation timeline Letters should be delivered on or before January 31, 2009.
Implications of Proposal
a. Pros i. May decrease CO2 and other tailpipe emissions.
ii. May reduce traffic congestion.
iii. Allows State to demonstrate leadership and may encourage private businesses to implement telecommuting options.
iv. May reduce State government operating costs in some instances.
iv. Provides incentives to recruit or retain productive employees.
v. May increase employee productivity.
vi. May provide continuity of operations in the event of a weather events or natural disasters.
b. Cons
i. May be resisted by some managers, agency directors.
ii. Requires supervisors and managers to determine suitability of telecommuting for individual employees.
55
Kansas Energy Report 2009 Chapter 11: Energy Use in the Agricultural Sector
56
Chapter 11: Energy Use in the Agricultural Sector Overview Energy is a significant component of agricultural production costs. Nationwide, rising energy prices—and increased prices for fertilizer and feed—have substantially affected agricultural producers. Agriculture uses energy directly (as fuel or electricity) to operate machinery and equipment, to heat or cool buildings, and for lighting on the farm or indirectly in the fertilizers and chemicals produced off the farm.136 In recent years (2000 to 2003), energy expenses accounted for nearly 15 percent of total agricultural production expenses; about 5.2 percent of these were direct expenses and 9.3 percent indirect. Not surprisingly, energy costs affect some agricultural activities more dramatically than others: crop agriculture’s energy costs are about 23 percent of overall crop production expenses, whereas energy costs are only about 6 percent of livestock production expenses (though higher energy costs indirectly affect feed costs, which account for roughly 60 percent of total livestock production costs).137 As in other sectors, the agricultural sector has increased the efficiency with which it uses energy in recent decades: total energy usage in agriculture has fallen about 28 percent since the late 1970’s. In 1999, agriculture was about 10 percent more efficient in terms of indirect energy usage and about 40 percent more efficient in terms of direct energy usage than in 1965.Although both direct and indirect energy consumption has been increasing in recent years, output has increased even more rapidly, indicating increasing growth in energy efficiency. Over time, the type of energy used in the agricultural sector has also changed, with the direct use of natural gas and gasoline declining significantly and consumption of diesel fuel and electricity increasing. Aside from the indirect energy usage associated with fertilizer, the largest on-farm energy usage is associated with motors (with irrigation being the largest motor application), lighting, and onsite transportation. As with any other business, sharp increases in input costs affect profitability. Farmers and ranchers will continue to make adjustments to reduce the negative impact of rising energy costs.
136 Library of Congress, Congressional Research Service, 2004, Energy Use in Agriculture: Background and Issues, Abstract: https://www.policyarchive.org/handle/10207/171 (accessed December 19, 2008). 137 Kasten et al., 2006, Energy Use in the Kansas Agricultural Sector, Report Submitted to the Kansas Energy Council, June 15, 2006: http://www.kec.kansas.gov/reports/FinalReport_EnergyInAg_6_15_06.pdf. Unless noted otherwise, background information in this section comes from this report.
Kansas Energy Report 2009 Chapter 11: Energy Use in the Agricultural Sector
Section 11.1: Crop Agriculture Topic / Issue Description Energy costs made up about 23 percent of U.S. crop production expenses from 2000 to 2003, compared with just 6 percent for livestock production.138 Although energy cost is a significant component of total production costs for agricultural producers, agriculture direct energy usage represents roughly 1 percent of the nation’s total consumption. Thus, reducing energy use in agricultural activities will have minimal impact on overall energy consumption in Kansas. About 95% of Kansas land is used for agricultural production and wildlife habitat. Although agriculture plays a significant role in the state’s economy, in 2003 it accounted for 2.7 percent of value-added income and 5.2 percent of jobs (or 9.6 percent and 11.7 percent, respectively, if the meat packing industry is included). Rising energy prices—including dramatically higher gasoline and diesel fuel prices through the fall of 2008 and rising prices for fertilizer and feed—have had a substantial impact on agricultural producers nationwide. In Kansas, rising energy prices have hit Kansas irrigated crop producers especially hard, prompting many to convert irrigation pumps from natural gas or diesel to electricity.139 Kansas agricultural producers already tend to use energy efficiently, because fuel and other energy-related costs significantly affect net profits. In central Kansas, no-till farms have lower total expense ratios—indicating greater cost efficiency—as well as higher profit margins and assets turnover ratios.140 Like their counterparts nationwide, Kansas farmers routinely consider ways to increase profits is by increasing crop yields or reducing per-bushel costs, including the adoption of reduced-tillage practices—in particular, no-till agriculture. These reduced-tillage practices, sometimes called conservation tillage, use herbicides as a substitute for tillage to control weeds. Typically, farmers have adopted no-till because it enables them to farm more land with less labor and may allow for increased cropping intensity. No-till also reduces the usage
138 However, livestock operations experience higher energy costs indirectly through higher feed costs, which make up about 60% of all production costs. 139 Kasten et al., 2006, Energy Use in the Kansas Agricultural Sector, Report Submitted to the Kansas Energy Council, June 15, 2006: http://www.kec.kansas.gov/reports/FinalReport_EnergyInAg_6_15_06.pdf. Unless noted otherwise, background information in this section comes from this report. 140 Agmanager.info, 2008, Michael Langemeier, The Relative Cost Efficiency of No-Till Farms in Central Kansas, July 25, 2008: http://www.agmanager.info/crops/prodecon/production/CostEfficiency_NoTillFarms_CentralKS.pdf (accessed July 2008)
57

Kansas Energy Report 2009 Chapter 11: Energy Use in the Agricultural Sector
of heavy machinery, resulting in a savings of approximately two gallons of diesel fuel per acre,141 a significant savings with the high diesel prices seen through fall of 2008. In addition to the soil conservation benefits, no-till increases rainwater retention, thus reducing costly irrigation expenses, which is especially important in the more arid parts of the state. No-till also reduces emissions of carbon dioxide and other pollutants associated with diesel fuel combustion. Existing Policies and Programs 1. Numerous federal and state programs promote soil conservation, protection of water
quality, flood management, habitat enhancement, and other objectives. State and federal cost-share dollars are available for many practices that contribute to energy reduction and carbon sequestration, in addition to addressing the natural resource concerns for which they were originally developed.
2. In 2004, Kansas initiated a watershed-based management strategy, the Kansas Watershed Restoration and Protection Strategy (WRAPS). WRAPS integrates existing conservation programs and practices based on watershed plans. With this program, local entities develop plans to address watershed conditions and concerns, which in turn guide establishment of goals and objectives to restore watersheds to a more properly functioning condition. Implementation of these goals and objectives is largely accomplished through programs and practices administered under the conservation programs just mentioned. A major focus of the WRAPS program is to develop watershed plans that will reduce the amount of sedimentation occurring in public water supply reservoirs. The majority of these watersheds are primarily rural, and land use is predominately agricultural.
3. The Chicago Climate Exchange (CCX) issues Carbon Financial Instruments (CFI) contracts to farmers who convert agricultural land to grassland or adopt conservation tillage practices. The amount of the offset offer varies based on the region. To help individual Kansas farmers looking to participate in the CCX offset program, financial institutions—such as ArgaGate which is promoted by the Kansas Farm Bureau—offer funds which buy and sell credits on behalf of multiple farmers.
4. No-Till on the Plains is a non-profit organization, based out of Wamego, Kansas, that provides farmers with information on adopting no-till agriculture and other sustainable production methods. No-Till on the Plains sponsors conferences that provide education to the public and serve as a trade show for industry representatives.
141 Kansas State University Agricultural Extension, 2006, Terry Kastens et. al., Energy Use in the Kansas Agricultural Sector: http://kec.kansas.gov/reports/FinalReport_EnergyInAg_6_15_06.pdf (accessed July 2008)
58
Kansas Energy Report 2009 Chapter 11: Energy Use in the Agricultural Sector
Section 11.1 Policy and Program Recommendations 1. Increase state agency and private sector efforts to educate farmers (and
agricultural landowners) about the benefits—reduced CO2 emissions, energy and dollar savings—associated with no-till agriculture and existing state and federal conservation programs.
Description Agricultural tillage is a centuries-old practice, which allows farmers to aerate the soil, remove moisture-robbing weeds, and bury crop residue for fertilization purposes. Tillage also increases soil erosion, removing topsoil and increasing runoff of sediment, fertilizers, and pesticides in waterways. No-till agriculture, as its name suggests, is an agricultural practice that minimizes soil disruption, leaving crop residue on the surface to act as a mulch. In addition to decreasing soil erosion,142 no-till increases soil fertility and its ability to retain moisture and nutrients and decreases runoff of most fertilizers and pesticides which often leach into ground water supplies. No-till requires greater uses of herbicides, necessitating proper herbicide management to avoid groundwater leaching of poorly absorbed herbicides. Moreover, under no-till crop-rotation becomes even more important, as crop-specific diseases may remain within the past crop’s debris.143 During the first four to six years after switching to no-till, increased organic matter at the surface immobilizes nutrients and, therefore, requires application of more nitrogen fertilizer—up to 20 percent more.144 Some Kansas farmers have adopted no-till (or other reduced tillage practices) as a way to improve their overall profitability. One of the advantages of no-till is increased crop intensity (shortening the time a field is left fallow). Double cropping, harvesting two crops on the same acre in a year, results in a more diversified crop portfolio, which, in turn, mitigates the risks associated with price fluctuations and crop failure and spreads fixed costs over more crop acres.145 No-till also reduces the usage of heavy machinery, resulting in a savings of approximately two gallons of diesel fuel
142 Annual soil erosion of U.S. cropland decreased 43% from 1982 to 2003, with much of this reduction coming from conservation tillage practices such as no-till. John P. Reganold and David R. Huggins, 2008, No-Till: How Farmers Are Saving the Soil by Parking Their Plows, Scientific American, June 30, 2008: http://www.scjam.com/article.cfm?id=no-till (accessed July 2008) 143 Kansas State University Agricultural Extension, 1999, Kansas No-Till Handbook: http://www.oznet.ksu.edu/library/crpsl2/sections/No-Till.pdf (accessed July 2008) 144 John P. Reganold and David R. Huggins, 2008, No-Till: How Farmers Are Saving the Soil by Parking Their Plows, Scientific American, June 30, 2008: http://www.scjam.com/article.cfm?id=no-till (accessed July 2008) 145 Kansas State University Agricultural Extension, 1999, Kansas No-Till Handbook: http://www.oznet.ksu.edu/library/crpsl2/sections/No-Till.pdf (accessed July 2008)
59

Kansas Energy Report 2009 Chapter 11: Energy Use in the Agricultural Sector
per acre,146 a significant savings with the high diesel prices seen through fall of 2008. Soil conservation and increased rainwater retention are other benefits, as well as reduced emissions of carbon dioxide and other pollutants associated with diesel fuel combustion. No-till may also increase the ability of the soil to sequester carbon dioxide, the best known of the greenhouse gases associated with human activities. Only 40% of annual carbon dioxide emissions remains in the atmosphere; the rest is absorbed by vegetation in photosynthesis and then stored underground in what are known as terrestrial sinks. Because soil tillage disrupts these natural carbon dioxide sinks, cultivated soils are estimated to contain 25% to 50% less carbon dioxide than undisturbed soil, though actual rates of sequestration depend on soil type and regional climate.147 Some estimate that converting the world’s cropland to no-till could sequester 5 to 15 percent of annual global carbon dioxide emissions for the next 40 to 60 years.148 In the U.S., terrestrial sequestration may have the potential to reduce annual emissions by 15 percent to 20 percent.149 In most cases, no-till sequesters carbon only within the first few centimeters. A recent study of no-till’s effects on soils in Kentucky, Ohio, and Pennsylvania found that in most instances the amount of carbon sequestered was no different than under regular tillage when deeper soil cores were taken.150
Despite these benefits, since 1990 the rate of conversion to no-till has been relatively slow in Kansas and in the rest of the surrounding states. In addition to a reluctance to change from traditional farming practices, adoption of no-till has also been hindered by the need for equipment modifications and for more information on crop rotations to maximize production. Given the range of benefits associated with no-till agriculture, increasing education and outreach efforts may benefit Kansas farmers as well as the environment. Such public-private efforts could build on the existing efforts of Kansas State University’s Agricultural Extension,151 No-Till on the Plains, and the Kansas Farm Bureau.
146 Kansas State University Agricultural Extension, 2006, Terry Kastens et. al., Energy Use in the Kansas Agricultural Sector: http://kec.kansas.gov/reports/FinalReport_EnergyInAg_6_15_06.pdf (accessed July 2008) 147 Rattan Lal, 2008, Carbon sequestration, Philosophical Transactions of the Royal Society B, v. 363, p. 815– 830. 148 Rattan Lal, 2008. Carbon sequestration rates range from negative to zero in arid and hot climates to 1.1 tons of carbon per hectare in humid and temperate climates. Normal rates of carbon sequestration are estimated to be 0.3 ton to 0.5 ton of carbon per hectare. 149 Charles W. Rice and Debbie Reed, 2007, Soil Carbon Sequestration and Greenhouse Gas Mitigation: A Role for American Agriculture, Kansas State University Department of Agronomy. 15 Humberto Blanco-Canqui and Rattan Lal, 2008, No-Tillage and Soil-Profile Carbon Sequestration: An On-Farm Assessment, Soil Science Society of America Journal, v ol. 72, no. 3, p. 693–701. 151 See Kansas State University Agricultural Extension, 1999, Kansas No-Till Handbook, page 3: http://www.oznet.ksu.edu/library/crpsl2/sections/No-Till.pdf (accessed July 2008).
60

Kansas Energy Report 2009 Chapter 11: Energy Use in the Agricultural Sector
Recommended Actions
a. Responsible parties The Governor’s Natural Resources Cabinet team.
b. Legislative action
No legislative action required. c. Budget requirements
No additional funding required at this time. d. Implementation timeline
Natural Resources Cabinet should set up an advisory group—consisting of relevant state and federal soil and water conservation staff, and private sector representatives, KSU faculty—to develop strategy for public education campaign.
Implications of Proposal
a. Pros i. Decreased soil erosion.
ii. Improved surface water quality.
iii. Decreased energy costs.
iv. May lead to greater coordination and efficiency of existing government programs.
b. Cons i. Increased herbicide costs.
ii. Requires farmers to modify or replace existing equipment.
61

Kansas Energy Report 2009
62

Kansas Energy Report 2009 Appendix 1
Appendix 1: Energy Consumption Forecasts
The following tables provide summary information related to energy consumption by Kansas residents, as required by the Governor’s Executive Order.152 Specifically, the tables provide historical data as well as estimates of the statewide consumption of petroleum products, natural gas, and electricity. These data were compiled by staff economists at the Kansas Corporation Commission. Historical production data (through 2006) was obtained from the U.S. Department of Energy, Energy Information Agency.153 The consumption forecasts were then developed in a three-step process. First, the historical annual growth rate was calculated, with outliers deleted throughout the data-filtering process to ensure stability. Second, the historical data were divided into a full (incorporating all available historical data) and truncated (using only recent consumption data) sample. More recent history is considered a better barometer for the future, especially considering some of the structural changes that have occurred recently in energy markets. Finally, the historical data were modeled and projected into the future using a robust forecasting approach utilizing many separate models. The final projected value for any year is the average projections of the best three models.
152 See Executive Order 08-03: http://www.governor.ks.gov/executive/Orders/exec_order0803.htm. 153 See EIA, 2008, State Energy Profiles-Kansas: http://www.eia.doe.gov/emeu/states/sep_use/total/csv/use_ks.csv, for an explanation of the various codes used in the file, see http://www.eia.doe.gov/states/sep_use/notes/use_datacodes.xls.
63

Kansas Energy Report 2009 Appendix 1
Table A1—Summary of Kansas petroleum products consumption, 1997 to 2006, with projections to 2020 (in thousands of barrels of oil equivalent).
Year
Total Petroleum Products
Consump-tion
Forecast
Percent Change
LPG Consump-
tion Forecast
Percent Change
Kerosene Consump-
tion Forecast
Percent Change
Distillate Consump-
tion Forecast
Percent Change
Gasoline Consump-
tion Forecast
Percent Change
Aviation Gasoline
Consump-tion
Forecast
Percent Change
1997 75,561 14,557 58 16,375 30,695 247
1998 75,831 0.36% 14,121 -2.99% 50 -14.12% 15,930 -2.72% 32,001 4.25% 199 -19.49%
1999 86,289 13.79% 21,741 53.96% 36 -27.71% 15,660 -1.70% 33,550 4.84% 240 20.48%
2000 79,323 -8.07% 17,401 -19.96% 36 0.34% 14,849 -5.18% 31,894 -4.94% 215 -10.63%
2001 73,689 -7.10% 11,122 -36.08% 41 13.44% 15,550 4.72% 30,297 -5.01% 196 -8.56%
2002 71,129 -3.47% 10,659 -4.16% 31 -24.80% 16,359 5.20% 28,571 -5.70% 127 -35.07%
2003 83,781 17.79% 16,944 58.96% 20 -36.46% 16,600 1.48% 32,721 14.52% 102 -19.65%
His
tori
cal
2004 81,806 -2.36% 14,808 -12.60% 22 11.37% 17,155 3.34% 31,815 -2.77% 115 12.70%
2005 64,658 -20.96% 2,768 -81.31% 12 -45.61% 18,147 5.78% 28,162 -11.48% 214 85.56%
2006 66,703 3.16% 1,875 -32.26% 15 28.63% 18,969 4.53% 31,603 12.22% 218 1.88%
2007 68,329 2.44% 6,376 240.02% 22 46.94% 19,084 0.61% 28,153 -10.92% 198 -9.02%
2008 73,182 7.10% 7,987 25.28% 22 -0.26% 18,237 -4.44% 31,326 11.27% 189 -4.61%
2009 74,488 1.79% 8,964 12.23% 22 -0.20% 18,402 0.90% 31,167 -0.51% 193 2.00%
2010 75,411 1.24% 9,546 6.49% 22 -0.15% 18,558 0.85% 31,136 -0.10% 196 1.80%
2011 76,013 0.80% 9,883 3.53% 22 -0.11% 18,702 0.77% 31,102 -0.11% 200 1.60%
2012 76,416 0.53% 10,069 1.89% 22 -0.08% 18,829 0.68% 31,064 -0.12% 202 1.40%
2013 76,687 0.35% 10,165 0.95% 22 -1.97% 18,933 0.56% 31,024 -0.13% 205 1.20%
2014 76,845 0.21% 10,206 0.40% 21 -2.86% 19,008 0.39% 30,981 -0.14% 207 1.00%
2015 76,907 0.08% 10,215 0.09% 21 -2.56% 19,042 0.18% 30,934 -0.15% 209 0.80%
Proj
ecte
d
2016 76,873 -0.04% 10,207 -0.08% 20 -2.30% 19,024 -0.10% 30,885 -0.16% 210 0.60%
2017 76,734 -0.18% 10,190 -0.17% 20 -2.07% 18,935 -0.47% 30,832 -0.17% 211 0.40%
2018 76,471 -0.34% 10,169 -0.21% 19 -1.86% 18,754 -0.95% 30,777 -0.18% 211 0.20%
2019 76,053 -0.55% 10,147 -0.22% 19 -1.68% 18,453 -1.61% 30,718 -0.19% 211 0.00%
2020 75,439 -0.81% 10,125 -0.21% 19 -1.52% 17,994 -2.49% 30,657 -0.20% 211 -0.20%
64
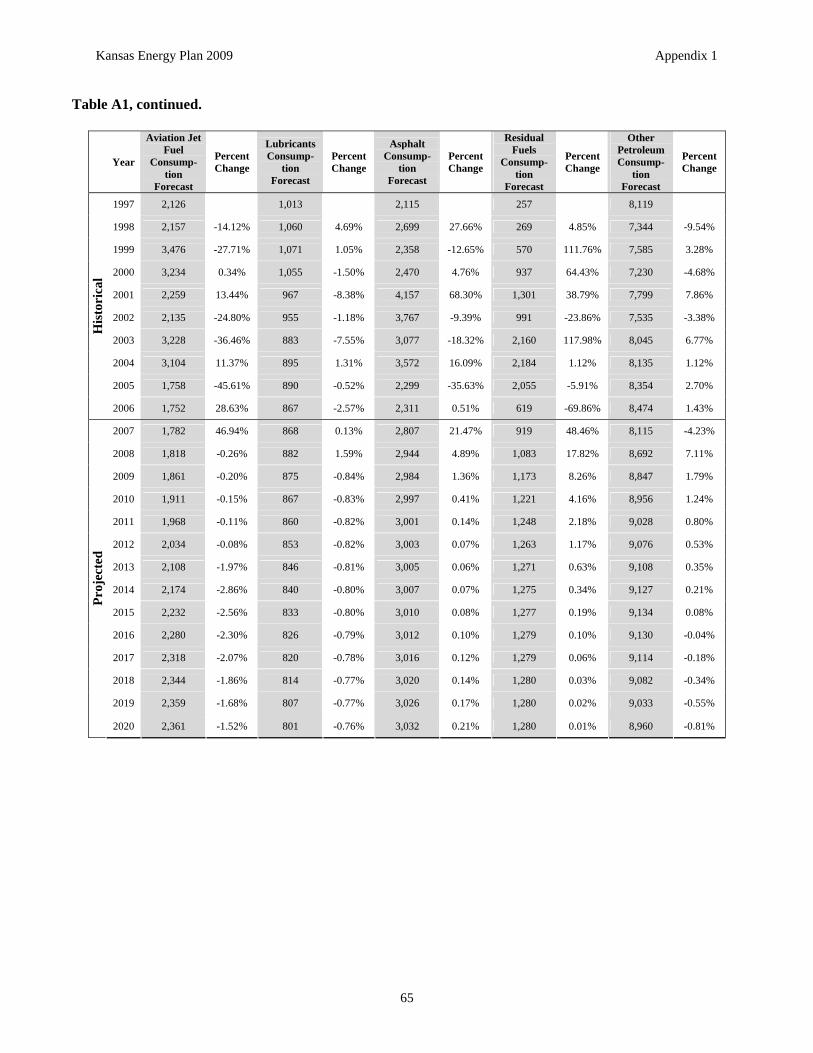
Kansas Energy Plan 2009 Appendix 1
65
Table A1, continued.
Year
Aviation Jet Fuel
Consump- tion
Forecast
Percent Change
Lubricants Consump-
tion Forecast
Percent Change
Asphalt Consump-
tion Forecast
Percent Change
Residual Fuels
Consump- tion
Forecast
Percent Change
Other Petroleum Consump-
tion Forecast
Percent Change
1997 2,126 1,013 2,115 257 8,119
1998 2,157 -14.12% 1,060 4.69% 2,699 27.66% 269 4.85% 7,344 -9.54%
1999 3,476 -27.71% 1,071 1.05% 2,358 -12.65% 570 111.76% 7,585 3.28%
2000 3,234 0.34% 1,055 -1.50% 2,470 4.76% 937 64.43% 7,230 -4.68%
2001 2,259 13.44% 967 -8.38% 4,157 68.30% 1,301 38.79% 7,799 7.86%
2002 2,135 -24.80% 955 -1.18% 3,767 -9.39% 991 -23.86% 7,535 -3.38%
2003 3,228 -36.46% 883 -7.55% 3,077 -18.32% 2,160 117.98% 8,045 6.77%
2004 3,104 11.37% 895 1.31% 3,572 16.09% 2,184 1.12% 8,135 1.12%
2005 1,758 -45.61% 890 -0.52% 2,299 -35.63% 2,055 -5.91% 8,354 2.70%
His
tori
cal
2006 1,752 28.63% 867 -2.57% 2,311 0.51% 619 -69.86% 8,474 1.43%
2007 1,782 46.94% 868 0.13% 2,807 21.47% 919 48.46% 8,115 -4.23%
2008 1,818 -0.26% 882 1.59% 2,944 4.89% 1,083 17.82% 8,692 7.11%
2009 1,861 -0.20% 875 -0.84% 2,984 1.36% 1,173 8.26% 8,847 1.79%
2010 1,911 -0.15% 867 -0.83% 2,997 0.41% 1,221 4.16% 8,956 1.24%
2011 1,968 -0.11% 860 -0.82% 3,001 0.14% 1,248 2.18% 9,028 0.80%
2012 2,034 -0.08% 853 -0.82% 3,003 0.07% 1,263 1.17% 9,076 0.53%
2013 2,108 -1.97% 846 -0.81% 3,005 0.06% 1,271 0.63% 9,108 0.35%
2014 2,174 -2.86% 840 -0.80% 3,007 0.07% 1,275 0.34% 9,127 0.21%
2015 2,232 -2.56% 833 -0.80% 3,010 0.08% 1,277 0.19% 9,134 0.08%
2016 2,280 -2.30% 826 -0.79% 3,012 0.10% 1,279 0.10% 9,130 -0.04%
2017 2,318 -2.07% 820 -0.78% 3,016 0.12% 1,279 0.06% 9,114 -0.18%
2018 2,344 -1.86% 814 -0.77% 3,020 0.14% 1,280 0.03% 9,082 -0.34%
2019 2,359 -1.68% 807 -0.77% 3,026 0.17% 1,280 0.02% 9,033 -0.55%
Proj
ecte
d
2020 2,361 -1.52% 801 -0.76% 3,032 0.21% 1,280 0.01% 8,960 -0.81%

Kansas Energy Plan 2009 Appendix 1
Table A2—Summary of Kansas natural gas consumption, 1997 to 2006, with projections to 2020 (in thousands of Mcf).
Year
Total Consump-
tion Forecast
Percent Change
Residential Consump-
tion Forecast
Percent Change
Commercial Consump-
tion Forecast
Percent Change
Industry Consump-
tion Forecast
Percent Change
Utility Consump-
tion Forecast
Percent Change
Fuel Consump-
tion Forecast154
Percent Change
1997 339,193 69,415 41,483 115,552 25,822 86,921
1998 326,674 -3.69% 70,217 1.16% 41,788 0.74% 110,881 -4.04% 36,894 42.88% 66,894 -23.04%
1999 302,932 -7.27% 68,146 -2.95% 38,952 -6.79% 97,254 -12.29% 35,890 -2.72% 62,690 -6.28%
2000 312,369 3.12% 70,601 3.60% 40,297 3.45% 108,625 11.69% 33,509 -6.64% 59,338 -5.35%
2001 272,499 -12.76% 70,182 -0.59% 37,560 -6.79% 93,351 -14.06% 23,267 -30.56% 48,141 -18.87%
2002 304,993 11.92% 70,858 0.96% 38,752 3.17% 108,038 15.73% 21,389 -8.07% 65,956 37.01%
2003 281,346 -7.75% 70,540 -0.45% 37,875 -2.26% 103,998 -3.74% 15,711 -26.55% 53,223 -19.31%
2004 256,463 -8.84% 64,116 -9.11% 35,888 -5.24% 90,154 -13.31% 20,142 28.20% 46,163 -13.26%
2005 251,334 -2.00% 62,834 -2.00% 34,772 -3.11% 88,712 -1.60% 19,776 -1.82% 45,240 -2.00%
His
tori
cal
2006 258,400 2.81% 64,600 2.81% 35,734 2.77% 91,569 3.22% 19,985 1.06% 46,512 2.81%
2007 260,166 0.68% 64,600 0.00% 35,427 -0.86% 91,391 -0.19% 20,529 2.72% 48,218 3.67%
2008 257,121 -1.17% 62,681 -2.97% 34,838 -1.66% 91,215 -0.19% 20,735 1.00% 47,654 -1.17%
2009 257,775 0.25% 63,397 1.14% 34,622 -0.62% 91,038 -0.19% 20,942 1.00% 47,775 0.25%
2010 258,145 0.14% 63,900 0.79% 34,388 -0.68% 90,862 -0.19% 21,151 1.00% 47,844 0.14%
2011 258,268 0.05% 64,218 0.50% 34,134 -0.74% 90,686 -0.19% 21,363 1.00% 47,866 0.05%
2012 258,172 -0.04% 64,377 0.25% 33,859 -0.80% 90,511 -0.19% 21,577 1.00% 47,849 -0.04%
2013 257,884 -0.11% 64,397 0.03% 33,564 -0.87% 90,336 -0.19% 21,792 1.00% 47,795 -0.11%
2014 257,424 -0.18% 64,297 -0.16% 33,246 -0.95% 90,161 -0.19% 22,010 1.00% 47,710 -0.18%
2015 256,810 -0.24% 64,091 -0.32% 32,905 -1.02% 89,987 -0.19% 22,230 1.00% 47,596 -0.24%
2016 256,056 -0.29% 63,793 -0.47% 32,541 -1.11% 89,813 -0.19% 22,453 1.00% 47,456 -0.29%
2017 253,627 -0.95% 62,328 -2.30% 31,977 -1.73% 89,639 -0.19% 22,677 1.00% 47,006 -0.95%
2018 251,235 -0.94% 60,923 -2.25% 31,380 -1.87% 89,466 -0.19% 22,904 1.00% 46,563 -0.94%
2019 248,863 -0.94% 59,564 -2.23% 30,750 -2.01% 89,293 -0.19% 23,133 1.00% 46,123 -0.94%
Proj
ecte
d
2020 246,492 -0.95% 58,239 -2.22% 30,085 -2.16% 89,120 -0.19% 23,364 1.00% 45,684 -0.95%
154 Fuel Consumption includes natural gas used in the production and processing of natural gas, as well as natural gas consumed in the operation of pipelines.
66
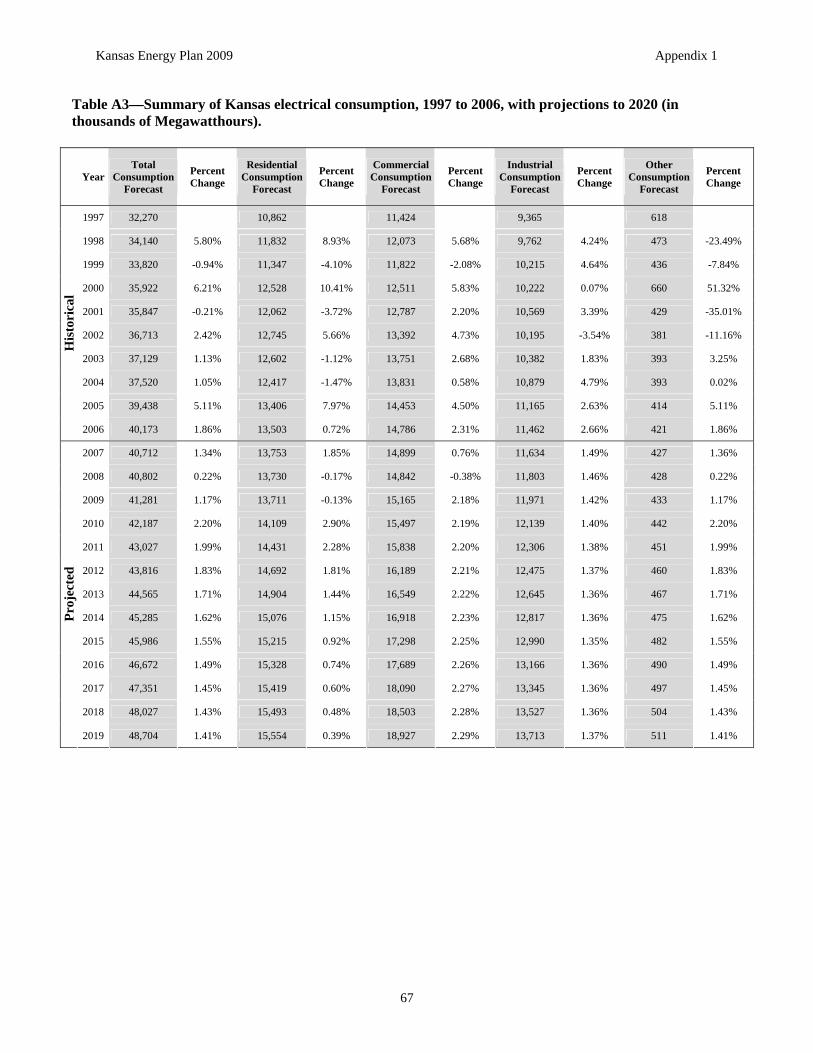
Kansas Energy Plan 2009 Appendix 1
Table A3—Summary of Kansas electrical consumption, 1997 to 2006, with projections to 2020 (in thousands of Megawatthours).
Year Total
Consumption Forecast
Percent Change
Residential Consumption
Forecast
Percent Change
Commercial Consumption
Forecast
Percent Change
Industrial Consumption
Forecast
Percent Change
Other Consumption
Forecast
Percent Change
1997 32,270 10,862 11,424 9,365 618
1998 34,140 5.80% 11,832 8.93% 12,073 5.68% 9,762 4.24% 473 -23.49%
1999 33,820 -0.94% 11,347 -4.10% 11,822 -2.08% 10,215 4.64% 436 -7.84%
2000 35,922 6.21% 12,528 10.41% 12,511 5.83% 10,222 0.07% 660 51.32%
2001 35,847 -0.21% 12,062 -3.72% 12,787 2.20% 10,569 3.39% 429 -35.01%
2002 36,713 2.42% 12,745 5.66% 13,392 4.73% 10,195 -3.54% 381 -11.16%
2003 37,129 1.13% 12,602 -1.12% 13,751 2.68% 10,382 1.83% 393 3.25%
His
tori
cal
2004 37,520 1.05% 12,417 -1.47% 13,831 0.58% 10,879 4.79% 393 0.02%
2005 39,438 5.11% 13,406 7.97% 14,453 4.50% 11,165 2.63% 414 5.11%
2006 40,173 1.86% 13,503 0.72% 14,786 2.31% 11,462 2.66% 421 1.86%
2007 40,712 1.34% 13,753 1.85% 14,899 0.76% 11,634 1.49% 427 1.36%
2008 40,802 0.22% 13,730 -0.17% 14,842 -0.38% 11,803 1.46% 428 0.22%
2009 41,281 1.17% 13,711 -0.13% 15,165 2.18% 11,971 1.42% 433 1.17%
2010 42,187 2.20% 14,109 2.90% 15,497 2.19% 12,139 1.40% 442 2.20%
2011 43,027 1.99% 14,431 2.28% 15,838 2.20% 12,306 1.38% 451 1.99%
2012 43,816 1.83% 14,692 1.81% 16,189 2.21% 12,475 1.37% 460 1.83%
2013 44,565 1.71% 14,904 1.44% 16,549 2.22% 12,645 1.36% 467 1.71%
2014 45,285 1.62% 15,076 1.15% 16,918 2.23% 12,817 1.36% 475 1.62% Proj
ecte
d
2015 45,986 1.55% 15,215 0.92% 17,298 2.25% 12,990 1.35% 482 1.55%
2016 46,672 1.49% 15,328 0.74% 17,689 2.26% 13,166 1.36% 490 1.49%
2017 47,351 1.45% 15,419 0.60% 18,090 2.27% 13,345 1.36% 497 1.45%
2018 48,027 1.43% 15,493 0.48% 18,503 2.28% 13,527 1.36% 504 1.43%
2019 48,704 1.41% 15,554 0.39% 18,927 2.29% 13,713 1.37% 511 1.41%
67