kaliningrad - evgeny vinokurov
TRANSCRIPT
Kaliningrad Enclaves and Economic Integration
Evgeny Vinokurov
Special Report
March 2007
In writing this report, the author is most indebted to Ivan Sergeevich Korolev and Ivan Samson, who were mentors through several years of studying the Kaliningrad economy. The author is grateful to all those, both in Russia and the EU, who commented on the manuscript or on separate chapters at various stages of its progress, namely Michael Emerson, Timur Gareev, Alexey Ignatyev, David Kernohan, Vladimir Kuzin and Artur Usanov.
The views expressed are attributable only to the author in a personal capacity and do not necessarily reflect those of CEPS or any other institution with which the author is associated.
ISBN-13: 978-92-9079-698-5
Available for free downloading from the CEPS website (http://www.ceps.be)
© Copyright 2007, Evgeny Vinokurov
Kaliningrad Enclaves and Economic Integration
Evgeny Vinokurov*
Abstract
When the Soviet Union broke up, Kaliningrad suddenly found itself separated from mainland Russia by new frontiers. Hardly any other Russian region has been hit as hard by the economic disruption as Kaliningrad. The geographical situation of the region meant that it was more highly exposed to the destabilising effects of post-communist economic transformation. Since then, a dramatic trade opening has occurred, and regional trade and production have undergone profound changes. Kaliningrad has experienced a major shift in its economic orientation towards the tertiary sector and a new industrial orientation based on its position as an intermediary in EU–Russian trade. In short, that is what this report is about: the present and future economic development of this Russian enclave during its integration into the world economy, its place in the international division of labour and in the Russian–EU economic interface.
The major phenomenon relative to the economic development of the region is its enclave status. The report explores the specific features of enclave economies and specifically those of Kaliningrad. It argues that economic openness is a prerequisite for an enclave’s prosperity and the enclave should develop a multi-vectored orientation towards both the Russian market and the EU market, complementing industrial specialisation targeting the mainland with new features. Moreover, as economic integration – with the surrounding state or on a non-discriminatory basis with the rest of the world – has significant positive effects on enclaves, the future of Kaliningrad’s regional economy and its specialisation is profoundly connected to Russian–EU relations and the prospects for their economic cooperation.
∗ Evgeny Vinokurov is a Senior Analyst, Strategy and Research Department, Eurasian Development Bank, Almaty, Kazakhstan.
Contents
Introduction: Kaliningrad in the conditions of enclavity ........................................................1
Chapter 1. The limitations and opportunities for an enclave’s economy...............................7
1.1 The conceptual framework for a theory of enclaves: Definitions, typology and the mainland–enclave–surrounding state triangle...............................................................7
1.2 Economic features of enclaves......................................................................................9 1.3 Openness as a condition of an enclave’s economic development...............................14 1.4 East Prussia as a German exclave (1920-39) and as a predecessor of Kaliningrad ....22 1.5 The theory of enclaves and Kaliningrad .....................................................................25 1.6 Kaliningrad’s society today ........................................................................................29
Chapter 2. Structural characteristics of economic transition ...............................................31
2.1 Structural shifts in the distribution of GRP.................................................................31 2.2 Shifts in employment ..................................................................................................33 2.3 Transformation of industry .........................................................................................34 2.4 Common misunderstandings about investment dynamics ..........................................37 2.5 The 1998 monetary crisis and Kaliningrad’s dependence on Russian economic
trends...........................................................................................................................41 2.6 The high share of the shadow economy......................................................................44 2.7 Kaliningrad in comparison..........................................................................................47
Chapter 3. Foreign trade and trade with mainland Russia: An intermediate position between Russia and the EU...................................................................................50
3.1 Commodities and the geographical structure of foreign trade ....................................50 3.2 Strong ties to the Russian mainland............................................................................56 3.3 An undeveloped trade in services ...............................................................................58 3.4 Trade forecasts ............................................................................................................59 3.5 A high degree of trade openness as a consequence of trade intermediation ...............61
Chapter 4. Factors of regional competitiveness......................................................................64
4.1 Introduction.................................................................................................................64 4.2 Measurement of comparative advantages, international specialisation and intra-
industry trade ..............................................................................................................65 4.3 Kaliningrad’s factors of production ............................................................................72 4.4 Domestic policy: The SEZ of Kaliningrad as a springboard to the Russian market...79 4.5 Exclave costs...............................................................................................................83 4.6 Cargo transit, passenger transit and border trading.....................................................85 4.7 A typology of the competitive factors of regions: From generic resources to specific
assets ...........................................................................................................................87 4.8 Conclusions.................................................................................................................92
Chapter 5. Regional specialisation, optimal development trajectory and distribution of GRP: A synthesis ...................................................................................................95
5.1 A review of development strategies............................................................................95 5.2 An optimal development strategy ...............................................................................98 5.3 Selected branches of the regional economy: What is their place in regional
specialisation in the long run?...................................................................................108
Chapter 6. Main findings and policy consequences .............................................................122
6.1 Main findings ............................................................................................................122 6.2 Policy issues: A liberal and positive approach..........................................................125
Glossary of Abbreviations ......................................................................................................131
Bibliography ............................................................................................................................132
Appendix I. Statistics ..............................................................................................................142
Appendix II. Principal typology of enclaves and exclaves..................................................148
List of Figures
Figure 1.1 The MES triangle......................................................................................................... 9
Figure 1.2 East Prussia and the Polish Corridor, 1920–39.......................................................... 23
Figure 1.3 Main actors and mechanisms in Kaliningrad’s foreign trade regime ........................ 28
Figure 2.1 Russia’s GDP and Kaliningrad’s GRP in 1995–2006, annual changes (in %).......... 31
Figure 2.2 Share of industries in the total industrial output, 1990–2003 .................................... 34
Figure 2.3 Industrial production: The 1990s crisis and post-1999 rebound (in % to the 1990s, i.e. 1990=100%)................................................................................................................... 35
Figure 2.4 Consumption figures in Russia and the volume of goods delivered from Kaliningrad to mainland Russia, growth (in %)................................................................... 43
Figure 2.5 Correlation of Kaliningrad’s outflows to mainland Russia and total Russian imports, 2000–04 ................................................................................................................. 43
Figure 3.1 Kaliningrad oblast foreign trade flows, 1992–2005 (KRCS methodology) ($ mn)... 51
Figure 3.2 Interregional trade of the Kaliningrad oblast, per federal district, 2000.................... 56
Figure 3.3 Outflows of SEZ goods to mainland Russia in 2000–05........................................... 57
Figure 3.4 Total foreign trade turnover, 2000–07 actual (up to 2005) and forecast ................... 60
Figure 3.5 SEZ outflows to mainland Russia, actual (up to 2005) data and the trend line ......... 61
Figure 4.1 Comparison of labour costs per worker in four EU member states (2002), Lithuania (2002) and the Kaliningrad region (2003), Germany = 100%............................. 73
Figure 4.2 Labour productivity (in $ thousand per employee).................................................... 73
Figure 4.3 Composition of production costs of some industries in the Kaliningrad region in 2003 ................................................................................................................................. 78
Figure 4.4 Typology of the competitive factors of regions ......................................................... 88
Figure 4.5 Typology of the factors based on geographical location ........................................... 90
Figure 4.6 Summary of the three development paths (1 = low development path, 2 = high development path, 3 = creating new competitive advantages) ............................................ 90
Figure 4.7 Nine-cell matrix: Correlation between the three development paths and the export promotion–import substitution–export substitution choice ................................................. 91
Figure 5.1 Moving towards an optimal specialisation in Kaliningrad ...................................... 102
Figure 5.2 Physical volume of agricultural production............................................................. 114
Figure 5.3 Production of milk, grain and meat (thousand tonnes) ............................................ 115
Figure 5.4 Typology of the competitive factors in transport..................................................... 119
Figure 5.5 Typology of the competitive factors in tourism....................................................... 121
Figure 6.1 Analysis cells: Correlation between the three development paths and the export promotion–import substitution–export substitution choice under the new SEZ regime.... 126
Figure A2.1 The main typology of territorial enclaves, exclaves and enclave states................ 148
Figure A2.2 Enclave state: Type 1-1 (ES – enclave state, S – surrounding state) .................... 149
Figure A2.3 Lesotho and South Africa ..................................................................................... 149
Figure A2.4 Sovereign semi-enclave state: Type 1-2 (ES – enclave state, S – surrounding state)................................................................................................................................... 150
Figure A2.5 Gambia and Senegal ............................................................................................. 150
Figure A2.6 True enclave: Type 2-1 (E – enclave, M – mainland, S – surrounding state)....... 153
Figure A2 7 Llivia, Spain and France ....................................................................................... 153
Figure A2.8 Non-sovereign semi-enclave/exclave (coastal enclave): Type 2-2 ....................... 154
Figure A2.9 Oecussi Ambeno, East Timor and Indonesia ........................................................ 154
Figure A2.10 Mere exclave: Type 2-3, case 1, mere exclave on land ...................................... 156
Figure A2.11 Nakhichevan (E), Azerbaijan (M), Armenia, Iran and Turkey (S) ..................... 156
Figure A2.12 Mere exclave: Type 2-3, case 2 mere exclave with sea connection to the mainland....................................................................................................................... 156
Figure A2.13 Kaliningrad region (E), Poland and Lithuania (S) .............................................. 156
List of Tables
Table 1.1 Total number and total population of enclaves and exclaves in 2003........................... 8
Table 1.2 Incomes per capita in nominal terms in the enclave in comparison with the mainland’s average and correlation with the economic regime........................................... 14
Table 1.3 Enclave incomes relative to M and S (per capita)....................................................... 15
Table 1.4 Exclusion from the mainland’s customs territory (CT)/inclusion in the surrounding state’s CT......................................................................................................... 18
Table 1.5 Currency regime.......................................................................................................... 18
Table 1.6 Special economic regime, economic incentives and assistance .................................. 18
Table 1.7 Incomes per capita in German regions, as a percentage of the German average ........ 24
Table 1.8 Comparative structure of identities (in %) .................................................................. 29
Table 1.9 Public opinion in the Kaliningrad region on the presence of the Russian military forces (in %)......................................................................................................................... 30
Table 2.1 Active workforce and unemployment levels according to ILO methodology ............ 34
Table 2.2 Consumption of fuel and energy resources ................................................................. 37
Table 2.3 Investment dynamics, 1995–2003 (in % to previous year) ......................................... 38
Table 2.4 Main performance indicators of companies with the participation of foreign direct investment ............................................................................................................................ 38
Table 2.5 Foreign investment (in $ mn) ...................................................................................... 39
Table 2.6 Impact of the 1998 crisis on foreign trade................................................................... 41
Table 2.7 Russia’s GDP and Kaliningrad region’s GRP in 1995–2004, annual changes (in %) 42
Table 2.8 Composition of the shadow economy ......................................................................... 45
Table 2.9 Official data on the GDP/GRP per capita ................................................................... 46
Table 2.10 An international comparison of GDP growth (in %) ................................................ 48
Table 3.1 Foreign trade dynamics 1992–2005 (KRCS methodology) ........................................ 51
Table B3.1. KRCS and the NWCO: Trade data differences, 1999–2001 (in $ mn) ................... 52
Table 3.2 Exports of SEZ production in 2004............................................................................. 53
Table 3.3 Concentration level of exports from Kaliningrad, Russia and Lithuania, 2001 and 2004 ..................................................................................................................................... 53
Table 3.4 Outflows to mainland Russia under the SEZ regime, 2004 ........................................ 58
Table 3.5 Foreign trade in services, 1995–2005 (in $ mn).......................................................... 59
Table 3.6 Total foreign trade turnover, actual (up to 2005) and forecast values (in $ mn)......... 59
Table 3.7 Outflows to mainland Russia under the SEZ regime, actual (up to 2005) and forecast values (in $ mn)...................................................................................................... 60
Table 3.8 Kaliningrad oblast total trade flows, 1999–2004 (in $ mn) ........................................ 62
Table 3.9 Trade flows as a percentage share of GRP (in %, GRP = 100%) ............................... 62
Table 3.10 Trade openness, 2000 and 2003 ................................................................................ 63
Table 4.1 Revealed comparative advantage of the Kaliningrad region*..................................... 66
Table 4.2 Share of the Kaliningrad region in Russia’s national production, 2002–04................ 68
Table 4.3 IIT indices of Kaliningrad’s foreign trade................................................................... 70
Table 4.4 IIT, including both foreign trade and trade with mainland Russia, 2000.................... 71
Table 4.5 Labour productivity (in $ thousand per employee) ..................................................... 74
Table 4.6 Unit labour costs (ULC) in various industries ............................................................ 74
Table 4.7 Capital/labour ratio in industrial enterprises (in $ thousand per person) .................... 75
Table 4.8 Index of the share of costs in the output of major industries in the Kaliningrad region in 2003 ...................................................................................................................... 77
Table 4.9 The customs duties for some critical products, 2003 .................................................. 80
Table 4.10 Tourism and border crossings, 2004 ......................................................................... 87
Table 5.1 Comparison of regional development concepts on the matters of economic specialisation........................................................................................................................ 96
Table 5.2 Enclave-specific negative factors, opportunities and responses applied to Kaliningrad’s economic specialisation ................................................................................ 98
Table 5.3 Main factors pertaining to the changing conditions for external economic activities in the Kaliningrad region (status at the beginning of 2006)............................................... 103
Table 5.4 Fuel industry ............................................................................................................. 109
Table 5.5 Physical volumes of agricultural production (in % to previous year) ....................... 114
Table 5.6 Production of milk, grain and meat (in thousand tonnes) ......................................... 115
Table 5.7 Production and import of meat (excluding poultry) (in thousand tonnes) ................ 116
Table 5.8 Cargo handling in Kaliningrad’s ports, 2005 (in thousand tonnes) .......................... 117
Table 5.9 Number of tourists, 1997–2004 (in thousands) ......................................................... 120
Table A1.1 Structure of gross value-added (current prices; in %) ............................................ 142
Table A1.2 Structure of employment by sector, 1990–2004..................................................... 143
Table A1.3 Foreign investment by country (in $ thousand)...................................................... 143
Table A1.4 Foreign trade dynamics 1998–2005 (Customs Office methodology) .................... 144
Table A1.5 Key export goods, 1996–2003 (physical volumes) ................................................ 144
Table A1.6 Import commodity structure according to three indicators (net weight, price/weight ratio and price) .............................................................................................. 145
Table A1.7 Trade partners with a total turnover over $20 mn, 2004 (in $ thousand) ............... 146
Table A1.8 Foreign trade turnover with Germany, Poland and Lithuania, 1997–2005 (in $ mn), Customs Office data.......................................................................................... 147
Table A1.9 Kaliningrad regional trade with mainland Russia, 2000 (in $ mn) ........................ 147
Table A2.1 Enclave states: Type 1-1 ........................................................................................ 149
Table A2.2 Semi-enclave states: Type 1-2................................................................................ 149
Table A2.3 True enclaves (non-sovereign enclaves/exclaves).................................................. 150
Table A2.4 Semi-enclaves/exclaves: Type 2-2 ......................................................................... 153
Table A2.5 Mere exclaves: Type 2-3 ........................................................................................ 155
Table A2.6 Pene-enclaves ......................................................................................................... 159
KALININGRAD: ENCLAVES AND ECONOMIC INTEGRATION | 1
Finland
Норвегия
Sweden
Denmark
Germany
Estonia
Belarus
Poland
Lithuania
Latvia
KaliningradRussia
RussiaPskovPskov
MinskMinsk
StockholmStockholm
CopenhagenCopenhagen
WarsawWarsawBerlinBerlin
KaunasKaunas
TallinnTallinn
KlaipedaKlaipeda
HelsinkiHelsinki
RigaRiga
VilniusVilnius
GomelGomel
OrshaOrsha
St.PetersburgSt.Petersburg
GdanskGdansk
VyborgVyborg
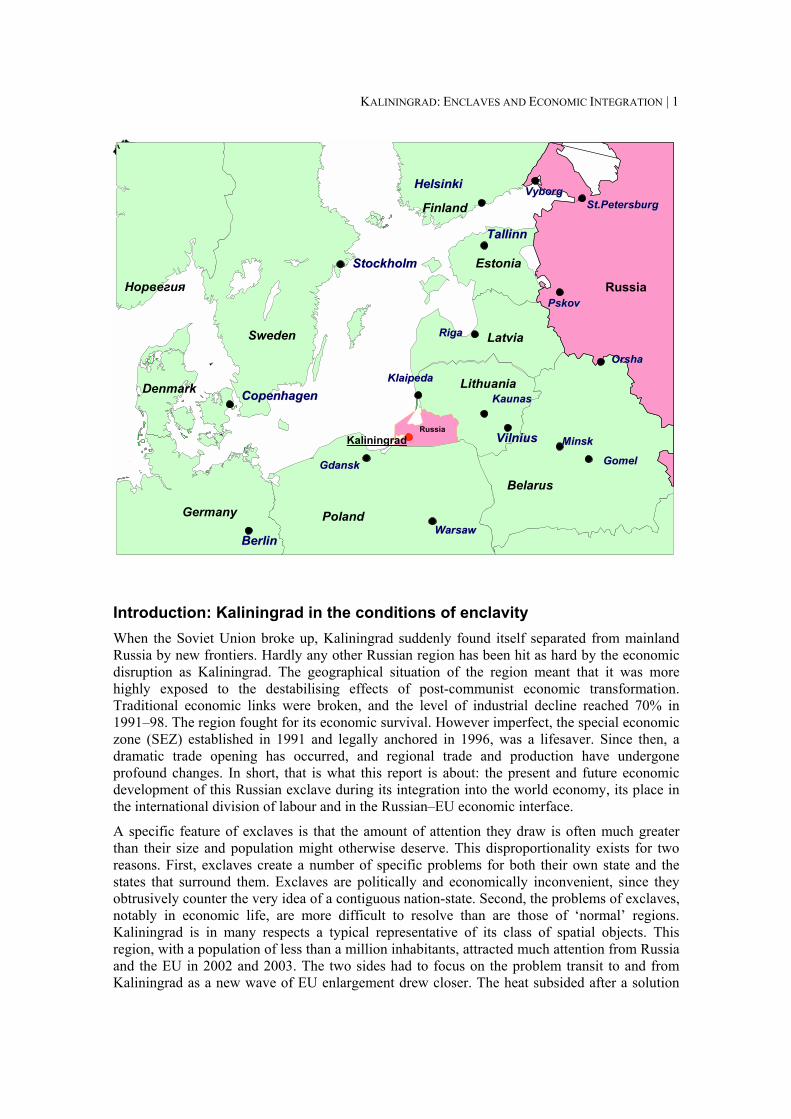
Introduction: Kaliningrad in the conditions of enclavity When the Soviet Union broke up, Kaliningrad suddenly found itself separated from mainland Russia by new frontiers. Hardly any other Russian region has been hit as hard by the economic disruption as Kaliningrad. The geographical situation of the region meant that it was more highly exposed to the destabilising effects of post-communist economic transformation. Traditional economic links were broken, and the level of industrial decline reached 70% in 1991–98. The region fought for its economic survival. However imperfect, the special economic zone (SEZ) established in 1991 and legally anchored in 1996, was a lifesaver. Since then, a dramatic trade opening has occurred, and regional trade and production have undergone profound changes. In short, that is what this report is about: the present and future economic development of this Russian exclave during its integration into the world economy, its place in the international division of labour and in the Russian–EU economic interface.
A specific feature of exclaves is that the amount of attention they draw is often much greater than their size and population might otherwise deserve. This disproportionality exists for two reasons. First, exclaves create a number of specific problems for both their own state and the states that surround them. Exclaves are politically and economically inconvenient, since they obtrusively counter the very idea of a contiguous nation-state. Second, the problems of exclaves, notably in economic life, are more difficult to resolve than are those of ‘normal’ regions. Kaliningrad is in many respects a typical representative of its class of spatial objects. This region, with a population of less than a million inhabitants, attracted much attention from Russia and the EU in 2002 and 2003. The two sides had to focus on the problem transit to and from Kaliningrad as a new wave of EU enlargement drew closer. The heat subsided after a solution
2 | EVGENY VINOKUROV
was found and implemented, but each side has recognised the unique nature of the detached Russian region. Both Russia and the EU have also recognised the need to deal with the political and economic problems posed by the existence of the enclave.1
The issue of Kaliningrad’s economic development remains important not only for the region itself – it also concerns the Russian economy and policy-making on the whole, as well as the EU and its relations with Russia more generally. The decisions on passenger transit through Lithuania reached and implemented in 2002–03 represent just a fraction of the problem of exclave–mainland communication. The latter, in its turn, is just one piece in the puzzle of the exclave’s economic development. Kaliningrad’s economic and political conversion is unfinished. The transition is complicated by the conditions of enclavity and exclavity and by a number of external economic and political challenges to which the region has to adjust. Although the greatest crises of the 1990s have been overcome, the exclave-specific problems persist. Despite seven years of continuous growth (1999–2005), the economic development of Kaliningrad is still subject to debate.
How should Kaliningrad’s economy evolve? Some of the most fundamental changes have occurred recently. The meaning of the EU’s enlargement has been unique for Kaliningrad, as it has transformed the region into a semi-enclave of the European Union. Even more important, Kaliningrad’s dependence on the customs privileges provided by the SEZ regime is notorious. As the SEZ regime experiences profound changes, the question of the sustainability of the region’s conversion pops up once again. The new Law on the Special Economic Zone in Kaliningrad, adopted in January 2006, has the potential to bring about significant change to the economic orientation of the oblast.2 The next decade will see further reforms and developments that are likely to have a sizeable impact on Kaliningrad. One of them will be Russia’s accession to the World Trade Organisation (WTO). Others may stem from advances in EU–Russian relations, particularly the establishment of the Russia–EU Common Economic Space (CES).
EU–Russian relations are particularly important for Kaliningrad. The issues related to ties between the EU and Russia, such as the CES, are therefore treated in the text as well. In 2002, when Kaliningrad found itself at the forefront of EU–Russian negotiations, both the EU and Russia recognised the unique nature of the Kaliningrad region, the existence of its special problems and the necessity to apply a special approach towards solving them. Until now, however, the main efforts have focused on tackling visa regime issues. A number of more substantial and complicated problems that prevent the authorities from forming the proper conditions for foreign investment and cross-border trade in the Kaliningrad region, which will 1 An enclave is a part of the territory of a state that is enclosed within the territory of another state. This term is commonly used so it is possible to question whether the term ‘exclave’ is necessary at all. Nevertheless, it is useful for several reasons, which we identify in the report. One of them is that there are regions that represent ‘mere exclaves’. Mere exclaves are regions that, while being isolated from their mainland, are surrounded by more than one state. Thus, they are not enclaves in relation to other states but merely exclaves in relation to the mainland. The enclave-specific problems stemming from being surrounded by a single state can be lacking in such cases (although not necessarily) but the exclave issues caused by isolation from the respective mainland remain. Kaliningrad is an interesting case in this respect. Because of the specific nature of the EU, Kaliningrad can be technically described as a mere exclave since it borders two states, Poland and Lithuania. On the other hand, both states are members of the EU, so it is quite possible to say that Kaliningrad is a semi-enclave of the EU. This view is reinforced by the fact that the enclave-specific issues concerning the movement of goods and people lie within the competence of the EU. More on definitions and typologies can be found in section 1.1 and Annex II. 2 Here and elsewhere in the text Kaliningrad is used to refer to the Kaliningrad region. The terms ‘Kaliningrad region’ and ‘Kaliningrad oblast’ are used intermittently as well. References made specifically to the city of Kaliningrad are identified as such, unless they unambiguously follow from the context.
KALININGRAD: ENCLAVES AND ECONOMIC INTEGRATION | 3
determine the competitiveness of local enterprises on the regional, Russian and foreign markets, are still to be resolved.
Since Kaliningrad’s population is less than a million, the region has a limited domestic market, which does not allow most local industries to make the kinds of savings available in an economy of scale. Nor does the region possess a sufficient resource base. The limits of the local market and resource base create a significant asymmetry between domestic production and consumption, similar to what happens in small states (Armstrong & Read, 1998). For a small non-contiguous region like Kaliningrad, foreign economic connections with neighbouring countries are vital in terms of economic functioning. A favourable trade regime can become the determinant of successful economic development. External factors acquire an exceptionally high importance. Trade plays a vital role in such an economy, since it supports the functioning of the economic system more generally. Foreign trade, as well as trade with Russian regions on the mainland, plays an extremely important role in the Kaliningrad economy too. Nevertheless, as an integral part of the Russian Federation, the Kaliningrad oblast maintains close economic ties with mainland Russia. These ties have become even stronger at the beginning of the 21st century owing to the strong rise of import substitution as well as Russian state and private investments in the region. The other side of the coin is that exogenous processes, such as EU enlargement or Russia’s WTO accession, can translate into economic shocks and have a sizeable impact on this small and vulnerable economy.
The specific nature of the Kaliningrad region requires original and innovative approaches to the problems of regional economic specialisation. The factors that determine the region’s economic and political environment only partially coincide with those of other Russian regions. Nor do they coincide with those of the adjacent countries and regions.
The major phenomenon relative to the economic development of the region is its enclave/exclave status. This feature is evident given the geographical position of Kaliningrad. On the one hand, it is a Russian exclave, separated from the mainland by several hundred kilometres of foreign territory and multiple borders. On the other hand, it is a semi-enclave of the enlarged EU. A number of specific problems are intrinsically connected to the region’s enclave and exclave status.
The first of these is exclave costs. The region’s exclavity increases transaction costs for the regional economy in terms of losses and additional expenses. Direct exclave costs largely come from additional expenses in transit. There are also indirect exclave costs, which are much harder to measure.
The second is an exclave-specific vulnerability. Kaliningrad is exposed to the impact of shocks and other exogenous processes to a larger degree than a ‘typical’ region on the mainland. Examples include the 1998 Russian financial crisis, EU enlargement and Russia’s WTO accession.
Third, current development is largely based on the 1996 version of the SEZ regime, that is, on the customs privileges for the oblast. It became clear, however, that this federal economic policy was unsustainable in the long run. A new legal framework in the form of a new federal law on the SEZ of Kaliningrad was adopted in January 2006. According to the law, the customs privileges are to be replaced with tax incentives for large investors. As the law envisages a transition period of 10 years, within which the old regime will remain in force, the major threshold will be around 2015 or 2016. It means the inevitable shake-up of the regional economy. It will lead to what is labelled in the report as the ‘2016 problem’. Moreover, since Russia is likely to enter the WTO in 2007, the transition period according to the accession protocol will probably end around the mid-2010s as well. Of course, both processes of adaptation, to WTO membership and to the new SEZ regime, will be continuous and will spread
4 | EVGENY VINOKUROV
over a decade. Nevertheless, referring to 2016 as an approximate threshold for Kaliningrad’s adaptation to the new external economic framework seems suitable.
There is also a problem of double peripherality. Double peripherality is a natural consequence of an enclave’s geographical location relative to the economic geography of both the mainland and the surrounding state. Kaliningrad is rightly identified as having the characteristic of ‘double periphery’ (Joenniemi, Dewar & Fairlie, 2000) or ‘overlapping periphery’ (Emerson et al., 2001, pp. 31-32) in relation to Russia and to the EU. Besides its peripherality to mainland Russia (a distance of 1,000 km to the heavyweight Central region), it is also located on the periphery of the European Union. The immediate neighbours of the region are underdeveloped and suffer from acute economic problems. The Warminsko–Mazurskie Voivodship of Poland, on Kaliningrad’s southern border, is the least-developed region in Poland with 20% unemployment. In addition, the developed areas of Lithuania (centring in Vilnius and Kaunas) are distant from the Kaliningrad border.
Finally, in a wider context, the Kaliningrad region, being part of the Russian Federation, finds itself between Russia and the EU. As such, the oblast is vulnerable to changes in the economic environment on two fronts. On the one hand, EU enlargement and changes in Russian–EU relations play an enormous role in the economic and political life of the region. On the other hand, Russia’s striving for integration into the world economy, illustrated by such examples as WTO accession, is extremely important. These processes could represent serious dangers to Kaliningrad’s regional economy. At the same time, they might provide the oblast with new opportunities for economic development. The issue of Kaliningrad’s specialisation has to be viewed in the framework of Russia’s integration into the world economy.
The leading questions this report attempts to answer and the corresponding research methodology used are as follows:
1) What is the relation between the enclave’s costs and its benefits? Under what conditions can the positive aspects of the special status an enclave enjoys outweigh the costs? In other words, under what conditions and how is it possible to make enclave status an advantage rather than a disadvantage? A major theoretical tool used here is the economic theory of enclaves (employing the mainland–enclave–surrounding state triangle as a conceptual framework, enclaves’ economic features, case studies, correlations of economic regimes, development and integration). Within the framework of the mainland–enclave–surrounding state triangle, we analyse the opposition of the negative enclave-specific factors (disruption, transaction costs and vulnerability) and the opportunities arising from economic gravity forces (market proximity). Subsequently, bench-marking for Kaliningrad is presented. Then we use a typology of the competitive aspects of the region to arrive at an optimal development strategy in terms of generic and specific resources and assets.
2) What are the structural characteristics of Kaliningrad’s economy? How did its specialisation develop over 15 years of transition? A comprehensive statistical inventory and a macro- and microeconomic analysis of comparative, competitive and territorial factors underlying the region’s present and potential specialisation serve as tools to answer these questions. The analysis includes the use of Lafay’s index of international specialisation and the Lloyd-Grubel index for intra-industry trade, as well as the measurement of factor productivity.
3) What is an optimal development strategy for Kaliningrad in light of its enclave/exclave status, comparative/competitive advantages, current economic activities and the impact of exogenous actors and processes? This is the central question of the report. To arrive at a complex answer, a synthesis of the findings on the issues of enclaves, the structural
KALININGRAD: ENCLAVES AND ECONOMIC INTEGRATION | 5
characteristics of regional specialisation and the impact of exogenous actors and processes is provided.
4) Is such a strategy possible in the context of EU–Russian relations? Does the actual state of relations make it possible or does it demand the further development of EU–Russian integration? To answer these questions we rely heavily on the conceptual framework and benchmarking based on the theory of enclaves. Findings related to responses to the previous questions provide necessary input for this purpose.
Literature on Kaliningrad has mushroomed in recent years. Nevertheless, there are numerous gaps, in particular on economic issues (since political issues have attracted more attention). A very short introduction to the existing literature is provided at this point. Further reviews are given as the argument unfolds, e.g. on enclaves in chapter 1, on comparative and competitive advantages as well as on the SEZ in chapter 4, and on regional development strategies in chapter 5.
Discussion of the issues related to the economic future of the Kaliningrad region commenced simultaneously with the region emerging as an enclave. The discourse greatly intensified at the end of the 1990s and the beginning of the 2000s. From the Russian side we note publications by Fedorov as well as Klemeshev (e.g. Khlopeckiy & Fedorov, 2000; Klemeshev, Kozlov & Fedorov, 2002; Klemeshev & Fedorov, 2004; Gareev, Zhdanov & Fedorov, 2005), Bilchak (Bilchak, Samson & Fedorov, 2000), Smorodinskaya (2001a and 2001b; Smorodinskaya & Zhukov, 2003), Ignatyev (e.g. Medvedev & Ignatyev, 2005), Usanov (e.g. 2005) and Zhdanov (2005). On the EU side, it is necessary to mention the publications of Baxendale, Dewar & Gowan (2000), Joenniemi, Dewar & Fairlie (2000), Fairlie & Sergounin (2001), the Kiel Ad-hoc Group of International Experts on Kaliningrad (2002) and Birckenbach & Wellmann (2003). Most of the publications by European authors focus on the political side of the process and mainly discuss political aspects of the visa regime, transport issues and transit problems, as well as issues of raw materials and energy supply. A contribution in the quantification of the economic discussion was provided by research under the leadership of Samson (Bilchak, Samson & Fedorov, 2000; Samson, 2000a and 2000b; TACIS, 2002a; Lamande & Vinokurov, 2003; Samson, Lamande & Vinokurov, 2004).
Despite the proliferation of papers on Kaliningrad, literature on the impact of external actors, processes and shocks on the Kaliningrad economy is scarce. Along with other papers published by the author (Vinokurov, 2003a, 2004b and 2004c), those by Liuhto (2005) and TACIS (2000a and 2000b) are notable. Also, the authors of a series of bulletins published by the EU–Russian cooperation programme in 2003–05 have contributed to the understanding of the impact of the EU’s enlargement and WTO accession on Kaliningrad’s production and trade patterns.
The report has the following outline. Chapter 1 is devoted to the economics of enclaves and exclaves. It contains a conceptual framework and a discussion of enclaves’ economic features. The output of the chapter is a set of qualitative benchmarks for Kaliningrad. Chapter 2 provides an extended analysis of the structural characteristics of economic transition in the Kaliningrad region from 1991 onwards. Matters concerning the gross regional product (GRP) structure, including the shadow economy, structural shifts and industrial transformation, are considered. Trade issues, entailing both foreign trade and trade with the Russian mainland, are given close attention in chapter 3. Chapter 4 proceeds by focusing on the comparative and competitive advantages of the region from both macro- and microeconomic vantage points. Indicators of comparative advantages and intra-industry trade are constructed. Factors of production and factor costs are quantified. Further along the road, the external framework of Kaliningrad’s economic development is put under the microscope. In addition, this chapter looks into the SEZ regime as a defining factor of Kaliningrad’s current competitiveness as well as the quantification of exclave costs and respective issues of cargo and passenger transit along with

6 | EVGENY VINOKUROV
border trade. Chapter 5 provides a synthesis of the issues of regional specialisation, optimal development trajectory and the distribution of GRP. It goes on to analyse several branches of the regional economy from the viewpoint of competitiveness in the long run. Finally, chapter 6 summarises the main findings and contains a discussion of policy-relevant issues.
| 7
Chapter 1
The limitations and opportunities for an enclave’s economy
1.1 The conceptual framework for a theory of enclaves: Definitions, typology and the mainland–enclave–surrounding state triangle
Detached from its mainland, an enclave finds itself in a specific position as regards its economic regime, specialisation and trade. In such conditions, some enclaves manage to prosper while others decay. Hong Kong was the showcase of free trade and internationalism. Small Western European enclaves, such as the Belgian Baarle-Hertog, the Spanish Llivia, the Italian Campione or the Austrian Jungholz, as well as US enclaves such as Point Roberts and the Northwest Angle, prosper through tourism and cross-border shopping. On the other hand, almost 200 Indo-Bangladeshi Cooch Behar enclaves do not even have electricity and are stricken with poverty and disease. The populous Fergana Valley enclaves, in possession of fertile lands and wonderful landscapes, are doing worse than their immediate neighbours are. Somewhere in the middle, Spanish Ceuta and Melilla and Russian Kaliningrad struggle their way through with the help of federal subsidies and preferences. These and many other enclaves show a number of trends in common, both positive and negative. Yet, despite many similarities, some of them manage to do well and others do not.
We begin with the principal definitions of an enclave, a semi-enclave, a pene-enclave and an exclave, as well as further definitions of an enclave state, a semi-enclave state, a mainland state and a surrounding state. An enclave is a part of the territory of a state that is enclosed within the territory of another state. This definition corresponds to the standard legal and geographical definition. To distinguish the parts of a state entirely enclosed in another state from other entities treated below, to which the term ‘enclave’ is applied with some modifications, they are also called ‘true enclaves’.
Two additional terms are introduced. A mainland state is the state to which an enclave belongs and of which it is part. In contrast, a surrounding state, as is obvious from the wording of term, is the state that surrounds an enclave but to which an enclave does not belong.
A semi-enclave is a part of a state enclosed within the land territory of another state, yet in possession of a sea border (that is, not fully surrounded). The enclaves of this type are also called ‘coastal enclaves’; both terms distinguish them from true enclaves and incorporate the availability of sea access. Pene-enclaves are territories that, although not separated from the mainland, are practically accessible only through the territory of another state.
The enclave, semi-enclaves and exclaves that are discussed above represent parts of a territory of a sovereign state. There are also sovereign states that are entirely surrounded by another single state. In such cases, the application of the term ‘enclave’ is justified as well. In order to distinguish them from their non-sovereign counterparts, they are called ‘enclave states’ and ‘semi-enclave states’. Enclave states in the understanding of international law are sovereign states land-locked within another state. There are currently three such states, Lesotho, San Marino and the Vatican. A semi-enclave state is a state enclosed within the land territory of another state, yet in possession of a sea border (that is, not fully surrounded).
Furthermore, a mere exclave is a region that, while being isolated from its mainland, is surrounded by more than one state. Thus, it is not an enclave in relation to other states but merely an exclave in relation to the mainland.
8 | EVGENY VINOKUROV
A more comprehensive presentation of all enclave types and further analysis of such types as maritime enclaves, paired enclaves and enclave complexes, along with typologies and a comprehensive literature review can be found in Vinokurov (2006b and 2007). Appendix II also contains a typology as well as the list of enclaves according to type.
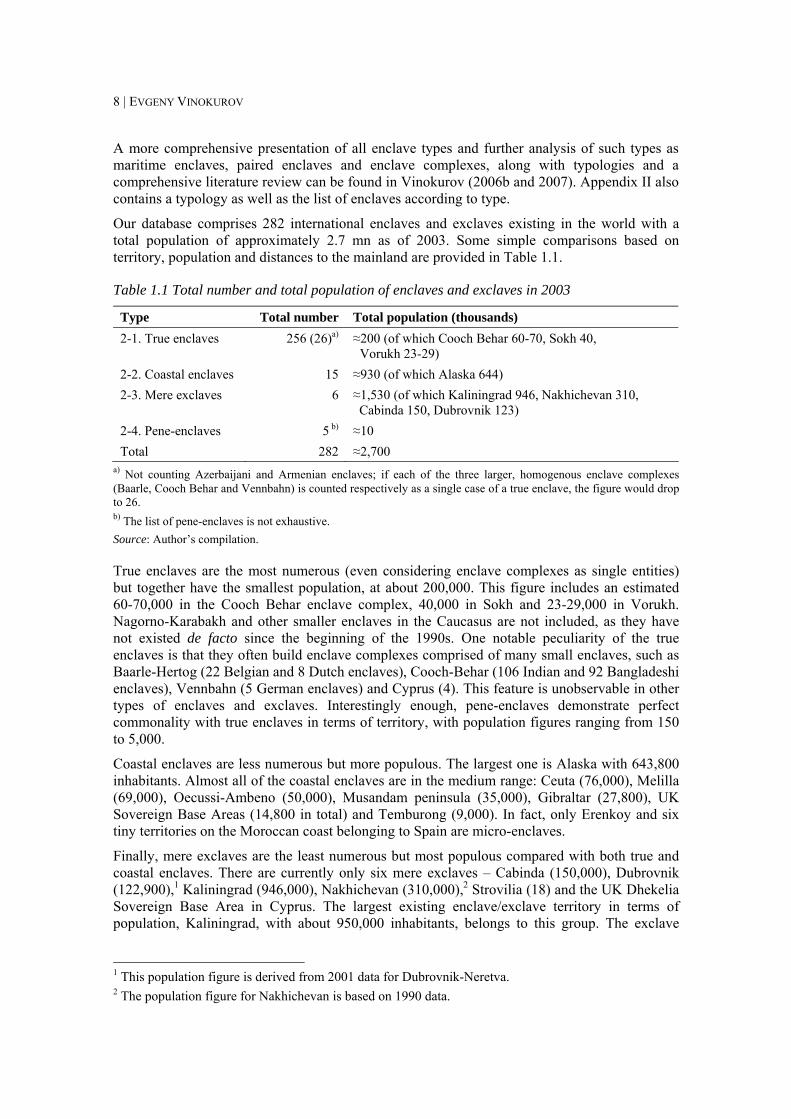
Our database comprises 282 international enclaves and exclaves existing in the world with a total population of approximately 2.7 mn as of 2003. Some simple comparisons based on territory, population and distances to the mainland are provided in Table 1.1.
Table 1.1 Total number and total population of enclaves and exclaves in 2003
Type Total number Total population (thousands) 2-1. True enclaves 256 (26)a) ≈200 (of which Cooch Behar 60-70, Sokh 40,
Vorukh 23-29) 2-2. Coastal enclaves 15 ≈930 (of which Alaska 644) 2-3. Mere exclaves 6 ≈1,530 (of which Kaliningrad 946, Nakhichevan 310,
Cabinda 150, Dubrovnik 123) 2-4. Pene-enclaves 5 b) ≈10 Total 282 ≈2,700
a) Not counting Azerbaijani and Armenian enclaves; if each of the three larger, homogenous enclave complexes (Baarle, Cooch Behar and Vennbahn) is counted respectively as a single case of a true enclave, the figure would drop to 26. b) The list of pene-enclaves is not exhaustive. Source: Author’s compilation.
True enclaves are the most numerous (even considering enclave complexes as single entities) but together have the smallest population, at about 200,000. This figure includes an estimated 60-70,000 in the Cooch Behar enclave complex, 40,000 in Sokh and 23-29,000 in Vorukh. Nagorno-Karabakh and other smaller enclaves in the Caucasus are not included, as they have not existed de facto since the beginning of the 1990s. One notable peculiarity of the true enclaves is that they often build enclave complexes comprised of many small enclaves, such as Baarle-Hertog (22 Belgian and 8 Dutch enclaves), Cooch-Behar (106 Indian and 92 Bangladeshi enclaves), Vennbahn (5 German enclaves) and Cyprus (4). This feature is unobservable in other types of enclaves and exclaves. Interestingly enough, pene-enclaves demonstrate perfect commonality with true enclaves in terms of territory, with population figures ranging from 150 to 5,000.
Coastal enclaves are less numerous but more populous. The largest one is Alaska with 643,800 inhabitants. Almost all of the coastal enclaves are in the medium range: Ceuta (76,000), Melilla (69,000), Oecussi-Ambeno (50,000), Musandam peninsula (35,000), Gibraltar (27,800), UK Sovereign Base Areas (14,800 in total) and Temburong (9,000). In fact, only Erenkoy and six tiny territories on the Moroccan coast belonging to Spain are micro-enclaves.
Finally, mere exclaves are the least numerous but most populous compared with both true and coastal enclaves. There are currently only six mere exclaves – Cabinda (150,000), Dubrovnik (122,900),1 Kaliningrad (946,000), Nakhichevan (310,000),2 Strovilia (18) and the UK Dhekelia Sovereign Base Area in Cyprus. The largest existing enclave/exclave territory in terms of population, Kaliningrad, with about 950,000 inhabitants, belongs to this group. The exclave
1 This population figure is derived from 2001 data for Dubrovnik-Neretva. 2 The population figure for Nakhichevan is based on 1990 data.

KALININGRAD: ENCLAVES AND ECONOMIC INTEGRATION | 9
with the largest population ever was East Pakistan, which in 1970 comprised 67.4 mn citizens, more than half (54%) of the total population of Pakistan.
Enclaves do not exist in a vacuum. They exist in a world full of global players and powers with often contradictory interests. The two powers that have most to do with an enclave are the mainland state and the surrounding state. These two sides and an enclave itself compose the mainland–enclave (or exclave)–surrounding state triangle, which is referred to as the MES triangle (diagrammed in the figure below). It serves as the main conceptual framework for our exploration of enclaves.
Figure 1.1 The MES triangle
The MES triangle is composed of four vectors. These are i) mainland–enclave relations, ii) enclave–surrounding state relations, iii) mainland–surrounding state relations on general issues and iv) mainland–surrounding state relations on the enclave issue. The arrows comprising the triangle are double-sided. This reflects the mutual impact rendered by the parties. The impact is not necessarily of equal strength. It is natural that the mainland exerts a decisive impact upon enclaves’ fate and fortune. Likewise, the general context of the mainland–surrounding state relations is that in which an enclave must find its place and to which it should adapt its vital activities. Furthermore, the impact of the surrounding state’s economy and politics is immeasurably larger than the reverse. Nevertheless, it is remarkable that, however small and insignificant an enclave is, it exerts a certain impact on both its mainland and the surrounding state and even on their bilateral relations in a variety of ways.
1.2 Economic features of enclaves Small size In this section we mention some vital characteristics of enclaves as regards their economic development: the small size of their economies, economic vulnerability and double peripherality. One of the basic facts about enclaves is that they are normally small. While not being among the decisive factors of enclavity and exclavity (the territory’s geographic inclusion in the surrounding state and detachment from the mainland state, respectively), it is a typical characteristic that has an enormous impact on the enclaves’ economic development. As a rule, enclaves represent relatively small and compact territories with a small population. Enclave-based enterprises have to deal with the fact that the capacity of the internal market is insufficient to serve as a viable home base. Local markets are inadequate for the effective large-scale production of many types of goods and services, especially those in high-tech industries. The specificity of enclaves as small countries in connection with other factors can lead to some very important consequences for their economic policies, in particular to an aversion towards import substitution policies, and conversely, to the acceptance and a preference for a distinctive export orientation.
Small size determines the need for a narrow specialisation. Successful cases of enclaves demonstrate an advanced and a relatively narrow degree of specialisation, for example, Hong
E
M S
10 | EVGENY VINOKUROV
Kong specialised in finance, trade/transport and electronics, and Macau specialised in gambling/tourism, textiles and electronics. Gibraltar’s GDP is made up of three leading economic activities: shipping, banking and tourism. Each comprises 25-30% of the British dependency’s economy.
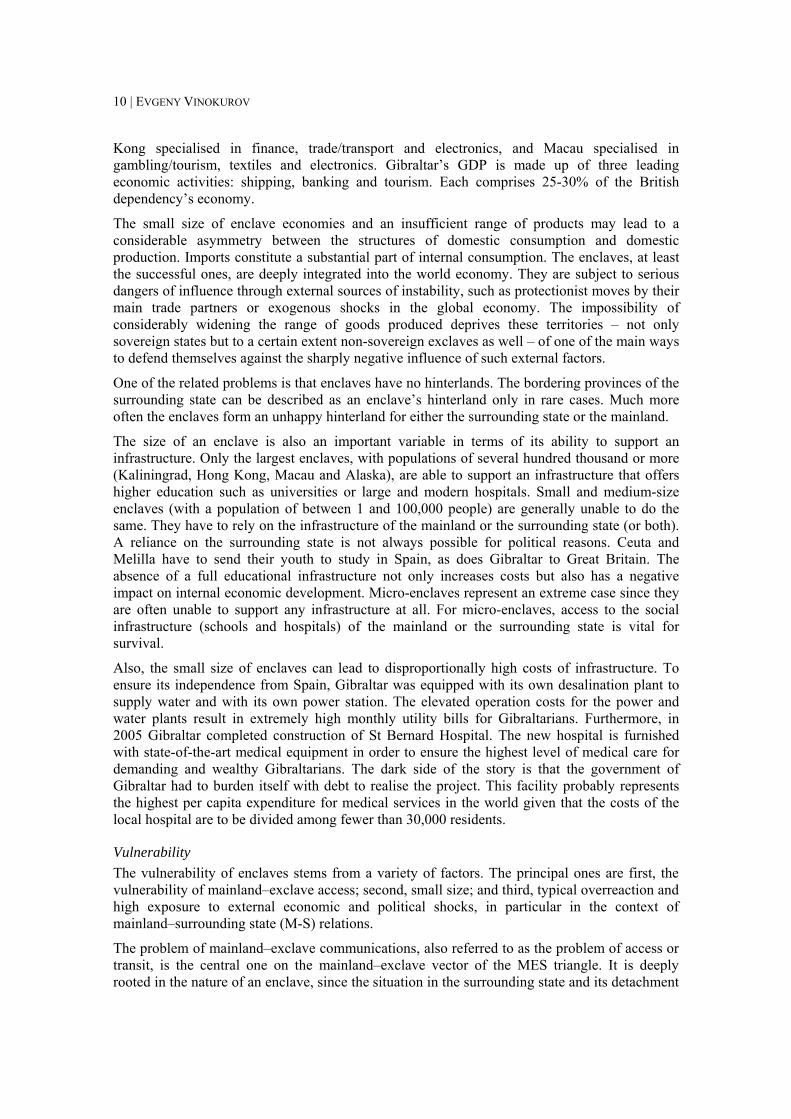
The small size of enclave economies and an insufficient range of products may lead to a considerable asymmetry between the structures of domestic consumption and domestic production. Imports constitute a substantial part of internal consumption. The enclaves, at least the successful ones, are deeply integrated into the world economy. They are subject to serious dangers of influence through external sources of instability, such as protectionist moves by their main trade partners or exogenous shocks in the global economy. The impossibility of considerably widening the range of goods produced deprives these territories – not only sovereign states but to a certain extent non-sovereign exclaves as well – of one of the main ways to defend themselves against the sharply negative influence of such external factors.
One of the related problems is that enclaves have no hinterlands. The bordering provinces of the surrounding state can be described as an enclave’s hinterland only in rare cases. Much more often the enclaves form an unhappy hinterland for either the surrounding state or the mainland.
The size of an enclave is also an important variable in terms of its ability to support an infrastructure. Only the largest enclaves, with populations of several hundred thousand or more (Kaliningrad, Hong Kong, Macau and Alaska), are able to support an infrastructure that offers higher education such as universities or large and modern hospitals. Small and medium-size enclaves (with a population of between 1 and 100,000 people) are generally unable to do the same. They have to rely on the infrastructure of the mainland or the surrounding state (or both). A reliance on the surrounding state is not always possible for political reasons. Ceuta and Melilla have to send their youth to study in Spain, as does Gibraltar to Great Britain. The absence of a full educational infrastructure not only increases costs but also has a negative impact on internal economic development. Micro-enclaves represent an extreme case since they are often unable to support any infrastructure at all. For micro-enclaves, access to the social infrastructure (schools and hospitals) of the mainland or the surrounding state is vital for survival.
Also, the small size of enclaves can lead to disproportionally high costs of infrastructure. To ensure its independence from Spain, Gibraltar was equipped with its own desalination plant to supply water and with its own power station. The elevated operation costs for the power and water plants result in extremely high monthly utility bills for Gibraltarians. Furthermore, in 2005 Gibraltar completed construction of St Bernard Hospital. The new hospital is furnished with state-of-the-art medical equipment in order to ensure the highest level of medical care for demanding and wealthy Gibraltarians. The dark side of the story is that the government of Gibraltar had to burden itself with debt to realise the project. This facility probably represents the highest per capita expenditure for medical services in the world given that the costs of the local hospital are to be divided among fewer than 30,000 residents.
Vulnerability The vulnerability of enclaves stems from a variety of factors. The principal ones are first, the vulnerability of mainland–exclave access; second, small size; and third, typical overreaction and high exposure to external economic and political shocks, in particular in the context of mainland–surrounding state (M-S) relations.
The problem of mainland–exclave communications, also referred to as the problem of access or transit, is the central one on the mainland–exclave vector of the MES triangle. It is deeply rooted in the nature of an enclave, since the situation in the surrounding state and its detachment

KALININGRAD: ENCLAVES AND ECONOMIC INTEGRATION | 11
from the mainland makes an enclave/exclave what it is. Communications have three vital components: i) the movement of goods and services, ii) the movement of people, and iii) the movement of military and police forces as well as state officials.
As soon as an enclave emerges, it faces the problem of communications with the mainland. If arrangements are made by the mainland and the surrounding state, the problem can be dealt with and mitigated at an early stage. But when an enclave emerges in the turmoil of international politics, tensions and military conflicts, the problem can be severe from the very beginning. It comes as an additional shock and impedes the prospects of economic and societal recovery. Just to give an example, one of the many nicknames that were used for West Berlin in 1945–90 was ‘seismograph’ (Hörning, 1992, p. viii). It had a clear connotation as to the vulnerability of West Berlin and its feature of reacting to even the minor tensions of the cold war.
Is there any difference in the scope of the problem of access among various types of enclaves? Whyte (2002) comes up with the idea that the significance of a surrounding state lies in the ability of the enclave to negotiate access and economic and political rights. If the enclave is surrounded by more than one state, it has increased leverage in such negotiations. If it has only a single, stubborn host state, it is totally at the host’s mercy (ibid., p. 2). This explanation equates to a hypothesis that can be formalised and generalised: the problem of access is more severe in true enclaves surrounded by just one state than in mere exclaves. Yet the experience of Kaliningrad and other enclaves and exclaves does not confirm this hypothesis. Kaliningrad is a mere exclave with access to convenient access to the Baltic Sea on the west and the region is sandwiched between Poland on the south and Lithuania on the north. Theoretically, there is a variety of ways to conduct communications with mainland Russia: land routes via Lithuania and Belarus, via Lithuania and Latvia, via Poland and Belarus, air transportation and the maritime route to St Petersburg. Despite the seemingly wide choice of options, economic expediency largely narrows the choice to the route of Kaliningrad–Lithuania–Belarus–mainland Russia. All major railway tracks and roads as well as pipelines and power lines were laid through Lithuania in the Soviet era, such that access through Poland is not economically justifiable at this point. The possibility of sea connections with St Petersburg is largely devalued by economic logic as well. Since 80-90% of inflows come from Central Russia, the Volga region and Siberia, while 80% of Kaliningrad’s outflows are heading for Central Russia (Vinokurov, 2002b and 2004d), St Petersburg and North-West Russia are just minor trade partners for Kaliningrad. A ferry on the Kaliningrad–St Petersburg line was opened for political considerations. So far, it is unprofitable and must be subsidised by the state. Businesses just do not use it since it is cheaper to use direct land links through Lithuania and Belarus. Therefore, in spite of the theoretically greatest possible latitude for choosing ways and routes to communicate with Russia proper, Russia was compelled to fight hard for a special transit regime through Lithuania (Box 1.1). The economic reasoning makes Kaliningrad a quasi/true enclave as regards communication with the mainland.
12 | EVGENY VINOKUROV
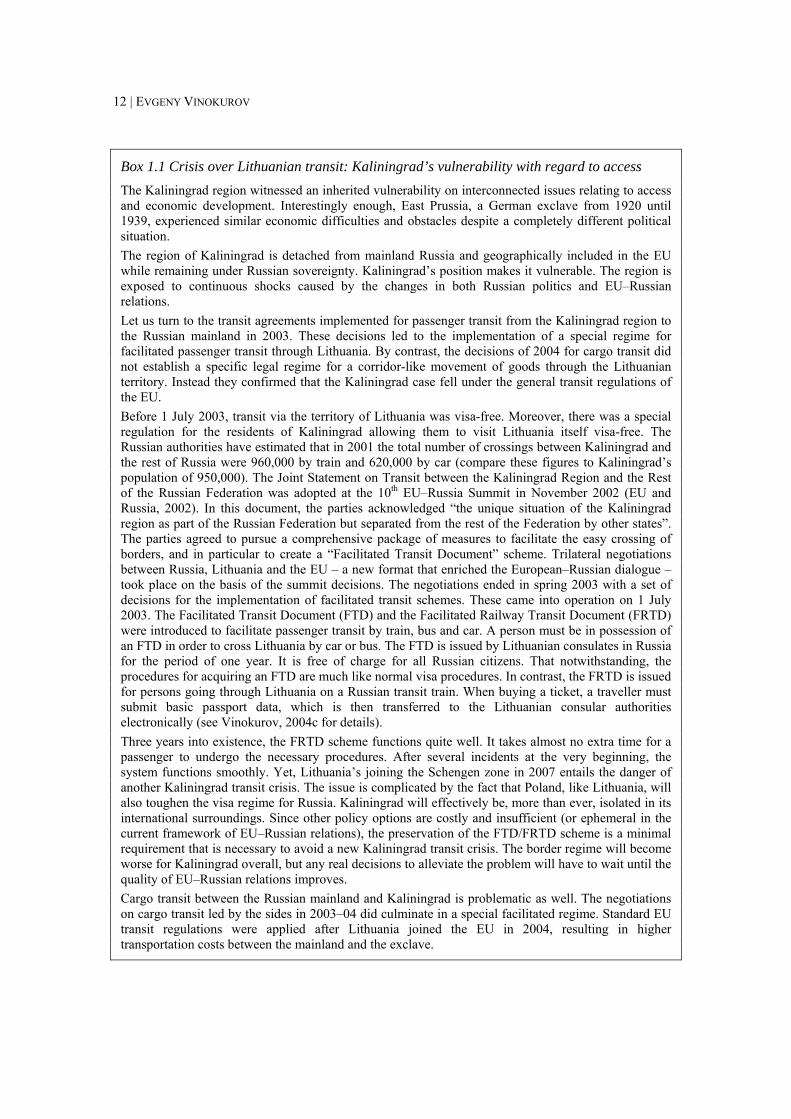
Box 1.1 Crisis over Lithuanian transit: Kaliningrad’s vulnerability with regard to access The Kaliningrad region witnessed an inherited vulnerability on interconnected issues relating to access and economic development. Interestingly enough, East Prussia, a German exclave from 1920 until 1939, experienced similar economic difficulties and obstacles despite a completely different political situation. The region of Kaliningrad is detached from mainland Russia and geographically included in the EU while remaining under Russian sovereignty. Kaliningrad’s position makes it vulnerable. The region is exposed to continuous shocks caused by the changes in both Russian politics and EU–Russian relations. Let us turn to the transit agreements implemented for passenger transit from the Kaliningrad region to the Russian mainland in 2003. These decisions led to the implementation of a special regime for facilitated passenger transit through Lithuania. By contrast, the decisions of 2004 for cargo transit did not establish a specific legal regime for a corridor-like movement of goods through the Lithuanian territory. Instead they confirmed that the Kaliningrad case fell under the general transit regulations of the EU. Before 1 July 2003, transit via the territory of Lithuania was visa-free. Moreover, there was a special regulation for the residents of Kaliningrad allowing them to visit Lithuania itself visa-free. The Russian authorities have estimated that in 2001 the total number of crossings between Kaliningrad and the rest of Russia were 960,000 by train and 620,000 by car (compare these figures to Kaliningrad’s population of 950,000). The Joint Statement on Transit between the Kaliningrad Region and the Rest of the Russian Federation was adopted at the 10th EU–Russia Summit in November 2002 (EU and Russia, 2002). In this document, the parties acknowledged “the unique situation of the Kaliningrad region as part of the Russian Federation but separated from the rest of the Federation by other states”. The parties agreed to pursue a comprehensive package of measures to facilitate the easy crossing of borders, and in particular to create a “Facilitated Transit Document” scheme. Trilateral negotiations between Russia, Lithuania and the EU – a new format that enriched the European–Russian dialogue – took place on the basis of the summit decisions. The negotiations ended in spring 2003 with a set of decisions for the implementation of facilitated transit schemes. These came into operation on 1 July 2003. The Facilitated Transit Document (FTD) and the Facilitated Railway Transit Document (FRTD) were introduced to facilitate passenger transit by train, bus and car. A person must be in possession of an FTD in order to cross Lithuania by car or bus. The FTD is issued by Lithuanian consulates in Russia for the period of one year. It is free of charge for all Russian citizens. That notwithstanding, the procedures for acquiring an FTD are much like normal visa procedures. In contrast, the FRTD is issued for persons going through Lithuania on a Russian transit train. When buying a ticket, a traveller must submit basic passport data, which is then transferred to the Lithuanian consular authorities electronically (see Vinokurov, 2004c for details). Three years into existence, the FRTD scheme functions quite well. It takes almost no extra time for a passenger to undergo the necessary procedures. After several incidents at the very beginning, the system functions smoothly. Yet, Lithuania’s joining the Schengen zone in 2007 entails the danger of another Kaliningrad transit crisis. The issue is complicated by the fact that Poland, like Lithuania, will also toughen the visa regime for Russia. Kaliningrad will effectively be, more than ever, isolated in its international surroundings. Since other policy options are costly and insufficient (or ephemeral in the current framework of EU–Russian relations), the preservation of the FTD/FRTD scheme is a minimal requirement that is necessary to avoid a new Kaliningrad transit crisis. The border regime will become worse for Kaliningrad overall, but any real decisions to alleviate the problem will have to wait until the quality of EU–Russian relations improves. Cargo transit between the Russian mainland and Kaliningrad is problematic as well. The negotiations on cargo transit led by the sides in 2003–04 did culminate in a special facilitated regime. Standard EU transit regulations were applied after Lithuania joined the EU in 2004, resulting in higher transportation costs between the mainland and the exclave.
KALININGRAD: ENCLAVES AND ECONOMIC INTEGRATION | 13
The problem of access is enclave-specific – it just would not exist in the case of a typical region on the mainland. It consists of two parts: first, an exclave is separated by mere distance; second, it is separated by the territory of a foreign state or states. While the first element is also present for islands, the second element is unique to exclaves. The complexity of the issue of mainland–exclave access stems primarily from the latter element, that is, its detachment from the mainland and situation in the surrounding state. It makes an exclave increasingly vulnerable to even minor changes in policies by the surrounding state but also to the overall state of the mainland–surrounding state relations. The solution reached so far for the problem of Kaliningrad passenger and cargo transit is only partial. It illustrates Kaliningrad’s vulnerability through its detachment from the mainland and location amongst EU member states, and its ensuing dependence on the arrangements made between the EU and Russia.
Apart from the vulnerability of access, enclaves’ economies are highly vulnerable to various kinds of external shocks. Their vulnerability stems not only from their small size, but also largely from their enclavity/exclavity. Let us go through several crucial enclave-specific factors:
• The small size of enclave economies and limited nomenclature of produced goods lead to considerable asymmetry between the structure of internal consumption and production. Imports represent a very large share of consumption. Taking into account this fact, as well as a higher degree of dependency on earnings from trade outflows, we can see that enclaves are deeply integrated into the world economy. Thus, the enclaves become exposed to external sources of instability, such as protectionist moves by the main trade partners or exogenous shocks.
• Another aspect connected to size is that an enclave has to specialise in a very few industries or sectors. As companies can relocate, an enclave must find ways to keep them on its soil. Thus, an enclave can only support a very few sustainable and competitive industries. On the other hand, there is a vicious circle since narrow specialisation makes enclaves even more vulnerable to economic shocks and cycles.
• Enclavity impedes both exports and outflows to the mainland. From the point of view of economic geography, the surrounding state could form a convenient proximity market. Yet, numerous tariff and non-tariff barriers make the enclave’s products uncompetitive against the surrounding state’s own producers, thus protecting this market. Furthermore, the sheer distance and costs of transit complicate access to the potential market of the mainland state. If an enclave does not possess a unique competitive advantage, it becomes economically incapable in view of its isolation.
• Economic incapability combined with increased vulnerability explains why various kinds of special economic regimes are established so often in the enclaves. Such a regime can make an enclave economically viable in the situation wherein its natural assets do not suffice to enable it to survive.
Double peripherality The notion of double peripherality is not uncommon for enclaves. For instance, it is widely applied to Kaliningrad. In addition to its peripherality to mainland Russia (1,000 km distance to the economically developed Central region), it is also located on the periphery of the EU. The immediate neighbours of the region are hugely underdeveloped and suffer from acute economic problems. The Warminsko-Mazurskie Voivodship of Poland, to which Kaliningrad borders on the south, is the least developed region in Poland with more than 20% unemployment. In addition, the developed industrial areas of Lithuania (centred on Vilnius and Kaunas) are distant from the Kaliningrad border. Therefore, Kaliningrad is justly characterised as having the quality of ‘double periphery’ (Joenniemi, Dewar & Fairlie, 2000) or ‘overlapping periphery’ (Emerson
14 | EVGENY VINOKUROV
et al., 2001, pp. 31-32) in relation to Russia and the EU. Enclaves are typically located in remote areas, at a distance from industrial and commercial centres. Double peripherality is a natural consequence of an enclave’s geographical location relative to the economic geography of both the mainland and the surrounding state.
1.3 Openness as a condition of an enclave’s economic development Correlation between enclaves’ economic regimes and well-being This section considers data related to two questions: whether economic success depends on openness and whether success depends on the economic orientation. The first approach in line with regional economics would be to compare an enclave against its mainland (M). The results reveal a gloomy picture (Table 1.2).
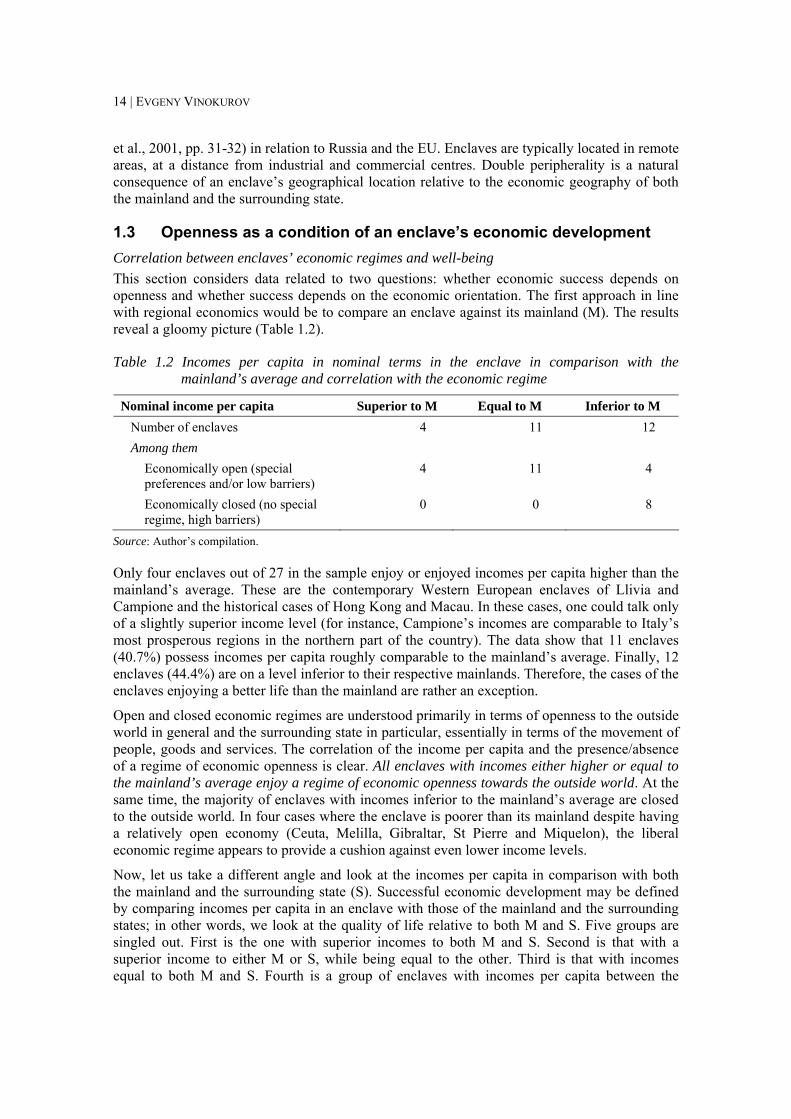
Table 1.2 Incomes per capita in nominal terms in the enclave in comparison with the mainland’s average and correlation with the economic regime
Nominal income per capita Superior to M Equal to M Inferior to M Number of enclaves 4 11 12 Among them
Economically open (special preferences and/or low barriers)
4 11 4
Economically closed (no special regime, high barriers)
0 0 8
Source: Author’s compilation.
Only four enclaves out of 27 in the sample enjoy or enjoyed incomes per capita higher than the mainland’s average. These are the contemporary Western European enclaves of Llivia and Campione and the historical cases of Hong Kong and Macau. In these cases, one could talk only of a slightly superior income level (for instance, Campione’s incomes are comparable to Italy’s most prosperous regions in the northern part of the country). The data show that 11 enclaves (40.7%) possess incomes per capita roughly comparable to the mainland’s average. Finally, 12 enclaves (44.4%) are on a level inferior to their respective mainlands. Therefore, the cases of the enclaves enjoying a better life than the mainland are rather an exception.
Open and closed economic regimes are understood primarily in terms of openness to the outside world in general and the surrounding state in particular, essentially in terms of the movement of people, goods and services. The correlation of the income per capita and the presence/absence of a regime of economic openness is clear. All enclaves with incomes either higher or equal to the mainland’s average enjoy a regime of economic openness towards the outside world. At the same time, the majority of enclaves with incomes inferior to the mainland’s average are closed to the outside world. In four cases where the enclave is poorer than its mainland despite having a relatively open economy (Ceuta, Melilla, Gibraltar, St Pierre and Miquelon), the liberal economic regime appears to provide a cushion against even lower income levels.
Now, let us take a different angle and look at the incomes per capita in comparison with both the mainland and the surrounding state (S). Successful economic development may be defined by comparing incomes per capita in an enclave with those of the mainland and the surrounding states; in other words, we look at the quality of life relative to both M and S. Five groups are singled out. First is the one with superior incomes to both M and S. Second is that with a superior income to either M or S, while being equal to the other. Third is that with incomes equal to both M and S. Fourth is a group of enclaves with incomes per capita between the
KALININGRAD: ENCLAVES AND ECONOMIC INTEGRATION | 15
figures for M and S. Fifth is a group of enclaves with incomes inferior to both M and S, that is, apparent economic failures (Table 1.3).
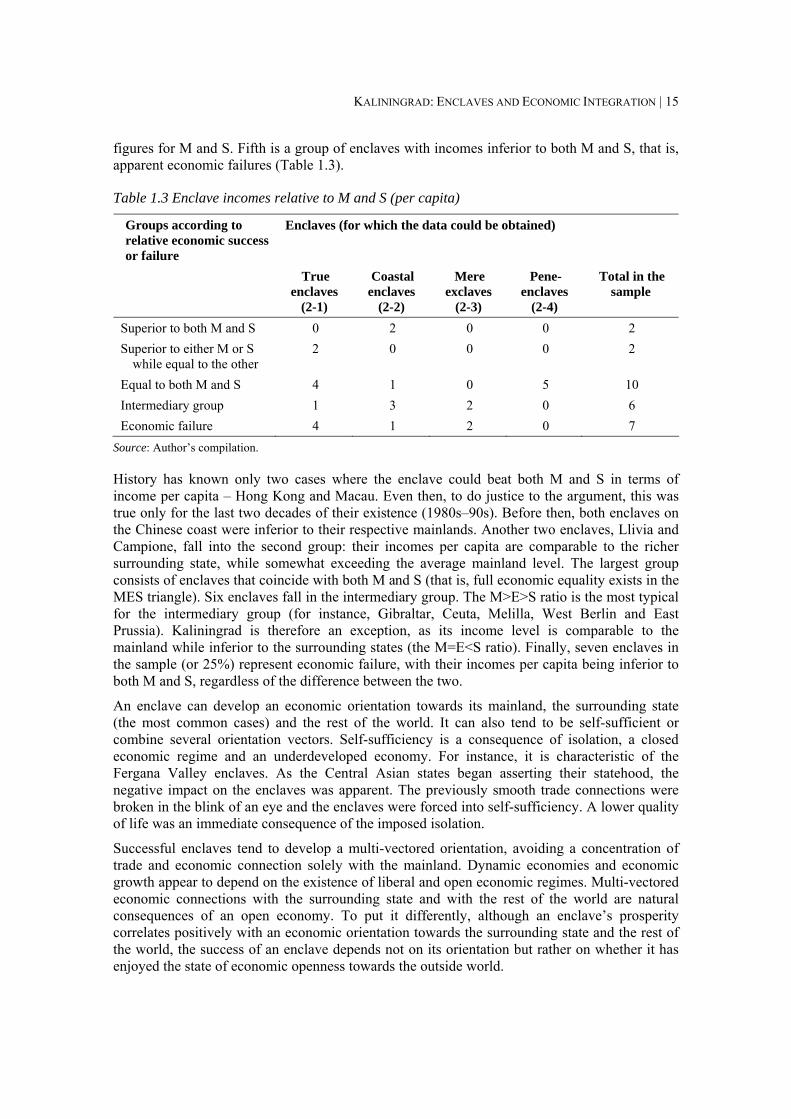
Table 1.3 Enclave incomes relative to M and S (per capita)
Groups according to relative economic success or failure
Enclaves (for which the data could be obtained)
True enclaves
(2-1)
Coastal enclaves
(2-2)
Mere exclaves
(2-3)
Pene-enclaves
(2-4)
Total in the sample
Superior to both M and S 0 2 0 0 2 Superior to either M or S
while equal to the other 2 0 0 0 2
Equal to both M and S 4 1 0 5 10 Intermediary group 1 3 2 0 6 Economic failure 4 1 2 0 7
Source: Author’s compilation.
History has known only two cases where the enclave could beat both M and S in terms of income per capita – Hong Kong and Macau. Even then, to do justice to the argument, this was true only for the last two decades of their existence (1980s–90s). Before then, both enclaves on the Chinese coast were inferior to their respective mainlands. Another two enclaves, Llivia and Campione, fall into the second group: their incomes per capita are comparable to the richer surrounding state, while somewhat exceeding the average mainland level. The largest group consists of enclaves that coincide with both M and S (that is, full economic equality exists in the MES triangle). Six enclaves fall in the intermediary group. The M>E>S ratio is the most typical for the intermediary group (for instance, Gibraltar, Ceuta, Melilla, West Berlin and East Prussia). Kaliningrad is therefore an exception, as its income level is comparable to the mainland while inferior to the surrounding states (the M=E<S ratio). Finally, seven enclaves in the sample (or 25%) represent economic failure, with their incomes per capita being inferior to both M and S, regardless of the difference between the two.
An enclave can develop an economic orientation towards its mainland, the surrounding state (the most common cases) and the rest of the world. It can also tend to be self-sufficient or combine several orientation vectors. Self-sufficiency is a consequence of isolation, a closed economic regime and an underdeveloped economy. For instance, it is characteristic of the Fergana Valley enclaves. As the Central Asian states began asserting their statehood, the negative impact on the enclaves was apparent. The previously smooth trade connections were broken in the blink of an eye and the enclaves were forced into self-sufficiency. A lower quality of life was an immediate consequence of the imposed isolation.
Successful enclaves tend to develop a multi-vectored orientation, avoiding a concentration of trade and economic connection solely with the mainland. Dynamic economies and economic growth appear to depend on the existence of liberal and open economic regimes. Multi-vectored economic connections with the surrounding state and with the rest of the world are natural consequences of an open economy. To put it differently, although an enclave’s prosperity correlates positively with an economic orientation towards the surrounding state and the rest of the world, the success of an enclave depends not on its orientation but rather on whether it has enjoyed the state of economic openness towards the outside world.
16 | EVGENY VINOKUROV
Dilution of enclavity as a result of integration While discussing the issue of access it was noted that a corridor is an inferior solution compared with reaching a level of integration between the mainland state and the surrounding state sufficient to provide a smooth passage of people and goods between the mainland and the exclave. In other words, a deep and comprehensive integration between the mainland and the surrounding state is able to remove the problem of exclave–mainland transit altogether. In this respect the most important factor is probably the level of integration reached between the surrounding state and the mainland. If they were integrated closely enough (in the movement of goods and people) then communication between the mainland and their exclaves would not represent an aggravating problem.
In fact, transit is not the only difficulty that can be substantially eased by the M-S integration. M-S integration is able to solve many other problems stemming from enclavity/exclavity. Integration dampens, sometimes eradicating altogether, the enclave-specific conflict potential based on contradictory interests and an enclave being a trouble spot in bilateral relations. Deep economic integration can greatly diminish the economic problems of an enclave. Moreover, it encourages interaction between two peoples and reduces potential for opposition.
The best examples of the most positive impact of M-S integration are the small enclaves inside the EU: Baarle, Llivia and Jungholz. It is not necessary, however, for the mainland and the surrounding state to reach the integration level of the EU. Campione and Büsingen profit from EU–Swiss integration based on sectoral agreements despite the fact that the integration between these two is limited. In North America, Alaska as well as the small pene-enclaves on the US–Canadian border benefit from the historically close relationship of the mainland state with Canada (with a visa-free regime and so forth). The launch of NAFTA in 1994 had further positive effects on the flow of goods, including transit.
Experience of these enclaves shows that profound integration reaching EU depths is not really necessary. There are certain important elements of political and economic integration, the presence of which is pivotal for the enclaves. It is enough when the surrounding state and the mainland states possess:
1) a visa-free regime making possible the free movement of people;
2) a certain degree of free trade in goods, preferably supplemented by the free flows of services and capital; and finally
3) the free movement of labour (which is a necessity only for smaller enclaves).
These three components are supplemented by generally friendly relations between the states, which is usually the case between states that have been able to reach such a level of integration.
Although the attainment of all three elements leads to the most relaxed and beneficial regime, even partial progress in one of the fields can greatly benefit the enclave, surpassing by far the positive impact of integration on the other regions of the same state. Enclaves are made by their borders. A border in this context does not mean a physical phenomenon but rather the obstacles to communication and the flow of people, goods, services and capital. When borders become more penetrable, some of its enclavity/exclavity quality disappears, since the territory is now effectively less isolated. This situation can be termed a ‘dilution of enclavity’ by integration between the mainland and the surrounding state. M-S integration may thus lead to a diminishing of enclavity de facto through the relativisation of the borders.
In the case of Kaliningrad, the problems of both passenger and cargo transit arise precisely because the relations between Russia and the EU (or its member states, Poland and Lithuania) have not reached any of these conditions. If and when they are reached, the problem of Kaliningrad’s enclavity and exclavity would greatly reduce.
KALININGRAD: ENCLAVES AND ECONOMIC INTEGRATION | 17
The superiority of the liberal approach in the mainland’s enclave policy It is normal for an exclave to be tied to the home country not only politically but economically as well. This calls for efficient communication between the two, whether by a corridor or by agreement. Robinson (1959) noticed that several enclaves that had followed the opposite line of development and become economically assimilated by their neighbours (pp. 291-92). That may mean inclusion of the exclave into the customs territory of the surrounding state as well as the use of the neighbour’s currency. Direct taxes continue to go to the mainland while indirect taxes are paid to the surrounding state. Both Kleines Walsertal and Jungholz are each subject to a 19th century convention, handling customs and currency to German control (made to a large extent superfluous by European integration, notably the Single Market in 1992 and the introduction of the euro in 2002). Yet the list of possible options for an enclave’s economic regime is not exhausted by being tied to the mainland or being assimilated by the surrounding state. Nor are these options necessarily superior to others.
There are four basic possibilities: • the strengthening of M-E economic ties as a means of binding an enclave to its mainland
and ensuring comparable levels of economic development;
• M-S integration as an overarching scenario that may effectively ‘wash out’ the enclavity and solve most of the enclave-specific problems;
• the economic inclusion of an enclave in the surrounding state; and
• the economic opening of the enclave to the outside world.
Strengthening economic ties with the mainland appears a natural option that can be justified primarily by political reasoning. By ensuring smooth M-E communication and by promoting M-E economic ties, the task of making the enclave increasingly dependent on the mainland for economic survival is fulfilled. Therefore, the enclave is firmly tied to the mainland and any attempts at separatism are nipped in the bud.
Another possibility is the one of M-S integration, as can be observed for many enclaves inside the EU. Enclave-specific problems are solved automatically as a by-product of integration. We have already elaborated the phenomenon of the dilution of enclavity in the respective section above. In the absence of M-S integration, two options could be available – the economic inclusion of an enclave in the surrounding state (without a transfer of sovereignty) or the economic opening of an enclave to the outside world in general.
On the level of the mainland’s policy towards the enclave, these options are materialised in two choices. The first is whether to strengthen the ties with the mainland or to liberalise the enclave towards the outside world. If the mainland chooses the policy of economic openness for the enclave, a further choice is whether to allow for integration specifically with the surrounding state or to liberalise the enclave towards the whole world without making any explicit preferences for the surrounding state.
Tables 1.4-1.6 provide a short overview of special measures and economic regimes applied to various enclaves.
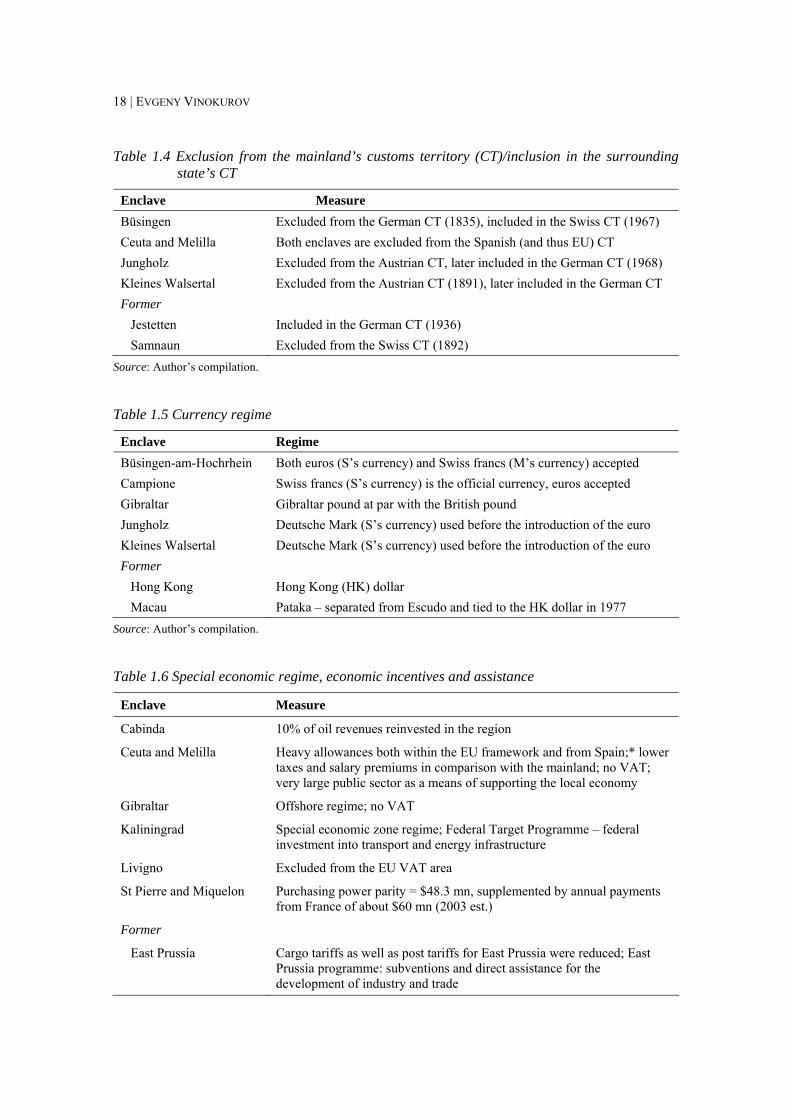
18 | EVGENY VINOKUROV
Table 1.4 Exclusion from the mainland’s customs territory (CT)/inclusion in the surrounding state’s CT
Enclave Measure Büsingen Excluded from the German CT (1835), included in the Swiss CT (1967) Ceuta and Melilla Both enclaves are excluded from the Spanish (and thus EU) CT Jungholz Excluded from the Austrian CT, later included in the German CT (1968) Kleines Walsertal Excluded from the Austrian CT (1891), later included in the German CT Former Jestetten Included in the German CT (1936) Samnaun Excluded from the Swiss CT (1892)
Source: Author’s compilation.
Table 1.5 Currency regime
Enclave Regime Büsingen-am-Hochrhein Both euros (S’s currency) and Swiss francs (M’s currency) accepted Campione Swiss francs (S’s currency) is the official currency, euros accepted Gibraltar Gibraltar pound at par with the British pound Jungholz Deutsche Mark (S’s currency) used before the introduction of the euro Kleines Walsertal Deutsche Mark (S’s currency) used before the introduction of the euro Former Hong Kong Hong Kong (HK) dollar Macau Pataka – separated from Escudo and tied to the HK dollar in 1977
Source: Author’s compilation.
Table 1.6 Special economic regime, economic incentives and assistance
Enclave Measure
Cabinda 10% of oil revenues reinvested in the region
Ceuta and Melilla Heavy allowances both within the EU framework and from Spain;* lower taxes and salary premiums in comparison with the mainland; no VAT; very large public sector as a means of supporting the local economy
Gibraltar Offshore regime; no VAT
Kaliningrad Special economic zone regime; Federal Target Programme – federal investment into transport and energy infrastructure
Livigno Excluded from the EU VAT area
St Pierre and Miquelon Purchasing power parity = $48.3 mn, supplemented by annual payments from France of about $60 mn (2003 est.)
Former
East Prussia Cargo tariffs as well as post tariffs for East Prussia were reduced; East Prussia programme: subventions and direct assistance for the development of industry and trade
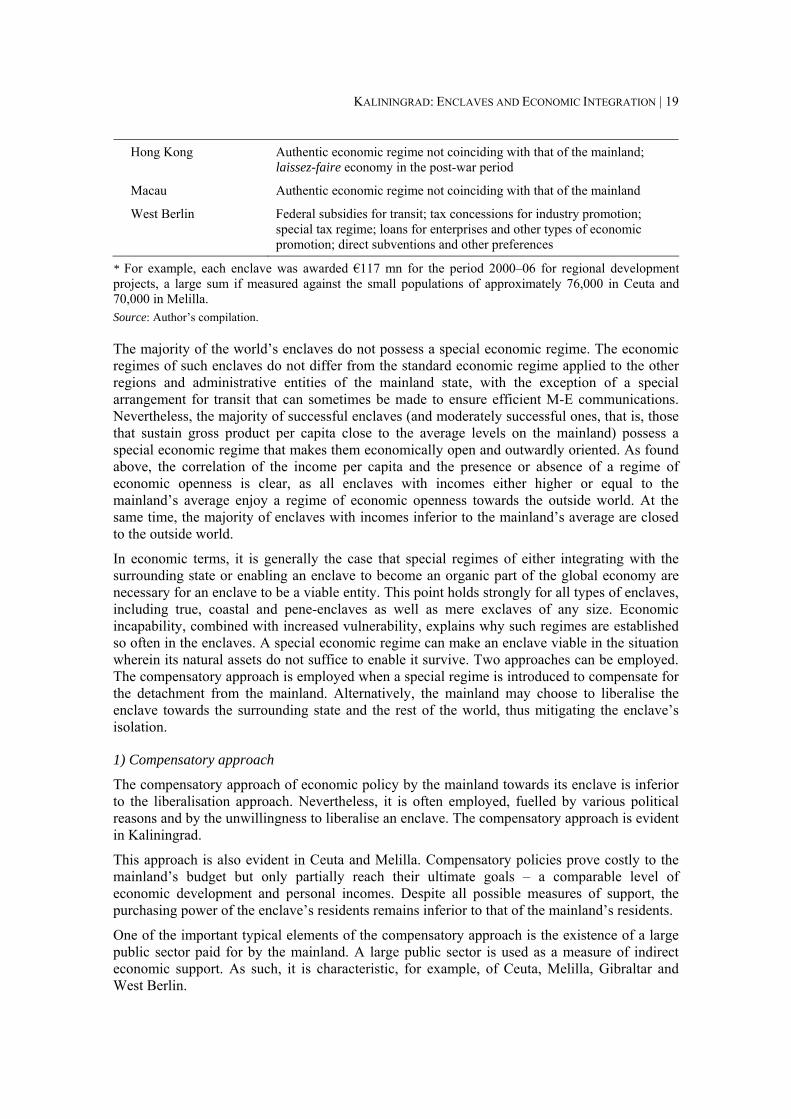
KALININGRAD: ENCLAVES AND ECONOMIC INTEGRATION | 19
Hong Kong Authentic economic regime not coinciding with that of the mainland; laissez-faire economy in the post-war period
Macau Authentic economic regime not coinciding with that of the mainland
West Berlin Federal subsidies for transit; tax concessions for industry promotion; special tax regime; loans for enterprises and other types of economic promotion; direct subventions and other preferences
* For example, each enclave was awarded €117 mn for the period 2000–06 for regional development projects, a large sum if measured against the small populations of approximately 76,000 in Ceuta and 70,000 in Melilla. Source: Author’s compilation.
The majority of the world’s enclaves do not possess a special economic regime. The economic regimes of such enclaves do not differ from the standard economic regime applied to the other regions and administrative entities of the mainland state, with the exception of a special arrangement for transit that can sometimes be made to ensure efficient M-E communications. Nevertheless, the majority of successful enclaves (and moderately successful ones, that is, those that sustain gross product per capita close to the average levels on the mainland) possess a special economic regime that makes them economically open and outwardly oriented. As found above, the correlation of the income per capita and the presence or absence of a regime of economic openness is clear, as all enclaves with incomes either higher or equal to the mainland’s average enjoy a regime of economic openness towards the outside world. At the same time, the majority of enclaves with incomes inferior to the mainland’s average are closed to the outside world.
In economic terms, it is generally the case that special regimes of either integrating with the surrounding state or enabling an enclave to become an organic part of the global economy are necessary for an enclave to be a viable entity. This point holds strongly for all types of enclaves, including true, coastal and pene-enclaves as well as mere exclaves of any size. Economic incapability, combined with increased vulnerability, explains why such regimes are established so often in the enclaves. A special economic regime can make an enclave viable in the situation wherein its natural assets do not suffice to enable it survive. Two approaches can be employed. The compensatory approach is employed when a special regime is introduced to compensate for the detachment from the mainland. Alternatively, the mainland may choose to liberalise the enclave towards the surrounding state and the rest of the world, thus mitigating the enclave’s isolation.
1) Compensatory approach
The compensatory approach of economic policy by the mainland towards its enclave is inferior to the liberalisation approach. Nevertheless, it is often employed, fuelled by various political reasons and by the unwillingness to liberalise an enclave. The compensatory approach is evident in Kaliningrad.
This approach is also evident in Ceuta and Melilla. Compensatory policies prove costly to the mainland’s budget but only partially reach their ultimate goals – a comparable level of economic development and personal incomes. Despite all possible measures of support, the purchasing power of the enclave’s residents remains inferior to that of the mainland’s residents.
One of the important typical elements of the compensatory approach is the existence of a large public sector paid for by the mainland. A large public sector is used as a measure of indirect economic support. As such, it is characteristic, for example, of Ceuta, Melilla, Gibraltar and West Berlin.
20 | EVGENY VINOKUROV
2) Liberalisation approach
As noted above, two policies of liberalisation can be applied: first, an enclave can be economically integrated with the surrounding state; second, a policy of economic openness towards the outside world can be pursued.
a) Integration with the surrounding state
The way of economically integrating an enclave into the surrounding state by excluding it from the mainland’s customs territory and – although not always – including it in the customs territory of the surrounding state was utilised in several cases in Western Europe (see Table 1.4 above). Often, the inclusion in the customs territory of the surrounding state is accompanied by changes in the currency regime whereby the surrounding state’s currency becomes a legal tender in the enclave (see Table 1.5 above). Thus, the European small and pene-enclaves have proven to be the most advanced on the matter of economic integration with the surrounding state. Büsingen, the German exclave in Switzerland, represents a model case (Box 1.2). Briefly, the Büsingen integration model is composed of the inclusion of an enclave in the surrounding state’s customs territory and partial application of the surrounding state’s legislation, supplemented by the regime of free movement of people. Economic inclusion of an enclave in the surrounding state supposedly works only with small entities. It is not readily applicable to the larger enclaves. Furthermore, such inclusion is only possible if the S-M relations are characterised by trust and confidence.
Box 1.2 The Büsingen model: Integration of a small enclave Büsingen is situated within the Swiss canton of Schaffhausen, just some 700-1,500 metres away from the German border. Its total area is 7.63 km2. It has 12.2 km of borders with the canton of Schaffhausen and has 4.8 km of Rhine coastline. Schaffhausen is just nearby, less than 5 km away; German Singen and Konstanz are more remote, 14.8 and 46.7 km, respectively. The population of the enclave reached about 1,500 after World War II before stabilising at this point.
Germany and Switzerland managed to create a legal framework to solve a major enclave puzzle: keeping an enclave under the mainland’s sovereignty while responding to the challenge of economic development. This specific answer was excluding Büsingen from the German customs zone, including it in the Swiss customs zone and extending the implementation of some Swiss laws in the enclave. The Büsingen model implies in effect a partial renunciation of sovereign rights by the mainland to the surrounding state. The history of the formation of the current model of economic management of the enclave counts several stages. It took about 130 years for the Büsingen model to develop. The result is remarkable: the century-long problem of Büsingen has been solved.
Phase I. Exclusion from the German customs zone in 1835
In 1835, Büsingen was excluded from the German customs zone. Consequently, goods from Büsingen became subject to German import customs duties. In order to avoid economic alienation between the mainland and the enclave, some preferences (for wine and other agricultural products) for Büsingen’s outflows to the German mainland were introduced.
Phase II. Rules for free transit in 1844–52
The Agreement of 1852 between Switzerland and the Earldom of Baden about mutual preferences for small border trade foresaw free transit from Swiss territory through Büsingen to the Swiss territory. Swiss transit duties had been removed eight years earlier, in 1844.
Phase III. German–Swiss Agreement of 1895 on Büsingen
Switzerland raised its import tariffs in 1886 and 1891. Büsingen authorities began to worry, as economic interaction had become disrupted. It led to the conclusion of the Büsingen Agreement in 1895. According to the Agreement, the Swiss side guaranteed substantially reduced import tariffs for
KALININGRAD: ENCLAVES AND ECONOMIC INTEGRATION | 21
Büsingen’s agricultural exports (timber, butter, meat, grapes, cows, calves and pigs). Certificates of origin had to be presented at the customs border.
Phase IV. Removal of Swiss customs controls in 1947
This measure had some positive implications on the Swiss side. Again, as in the 19th century with Baden, the costs of customs controls on the Swiss side exceeded the duties paid, as the latter had been greatly reduced since 1895. Swiss customs controls were effectively removed in 1947.
Phase V. The 1964 German–Swiss Treaty on Büsingen and the enclave’s inclusion in Swiss customs territory
The removal of Swiss customs controls in 1947 had shaped the orientation of Büsingen’s economy towards Switzerland once and for all. Its inclusion in the Swiss customs territory was seen as beneficial for all sides (on balance): the fiscal interests of both the mainland and the surrounding state were taken into account; close economic ties of the enclave with Switzerland were preserved; finally, the decision led to stabilisation and legal certainty for all sides. On this basis, a Swiss–German Treaty on Büsingen was signed in 1964, which came into force in 1967 (Switzerland and FRG, 1964).
Despite the necessity to implement some aspects of Swiss law in the enclave, Büsingen remained under the full and unrestricted sovereignty of Germany.
22 | EVGENY VINOKUROV
b) General economic openness to the outside world
While the first policy is more readily applicable to micro- and small enclaves land-locked within the surrounding state, the second policy suits larger coastal enclaves and exclaves. Just as the Büsingen model is exemplary for the first policy, the Hong Kong model can be cited as the textbook example for the policy of general economic openness of the second type. In such a model, an enclave is oriented outwards. It is supplied with a form of self-government that lets it determine its economic policy and react to changes in the external environment with a high degree of independence from the mainland state.
By economic logic (higher conventional and non-conventional trade costs with the mainland), enclaves are bound to pursue an outward orientation. In fact, it would remain the only sound option for an enclave in the absence of special regulations explicitly supporting the economic connection of an enclave with its mainland. (The latter policies are not supported by economic logic; rather they are caused by non-economic considerations.)
Enclaves, just like small states, cannot attain high levels of development and economies of scale without accepting profound integration into the international economy. An export orientation is the only viable policy in the long term, the only alternative being costly paternalistic policies of economic assistance, which makes an enclave dependant on the mainland. The geographical position of an enclave, its detachment from the mainland and proximity to foreign markets, especially the market of the surrounding state, dictates the necessity of an outward economic orientation. Outward orientation actually makes the economic development of an enclave more stable in the long run. On the one hand, economic openness increases vulnerability by exposing an enclave to the outside world. But on the whole, enclave-specific vulnerability actually decreases since i) an enclave becomes less dependent on the mainland for market and economic assistance; ii) the issues of mainland-enclave communication and transit through the surrounding state cease to be critical for the enclave’s life subsistence and economic survival; and iii) overall, an enclave gains an opportunity for dynamic economic growth.
Economic theory does not give a definite answer on the effects of integration on border regions. It allows only vague conclusions about the spatial effects of integration. Depending on specific circumstances, border regions might benefit, lose or not be affected by integration (Niebuhr & Stiller, 2002). Our conclusion for enclaves is different, however. Economic integration – regardless of whether it is with the surrounding state or on a non-discriminating basis – has significant positive effects on enclaves. This result can be explained by the notion of exclavity. Despite being located at the periphery, a typical border region is nevertheless well-connected to the other regions of the same state. It can profit from the economies of scale of the internal market. An enclave, unlike a typical border region, faces the problems of detachment, isolation, higher transportation costs and enclave-specific vulnerability caused by its detachment from the mainland and inclusion in the territory of the surrounding state. Integration causes enclavity and exclavity to be diluted, thus effectively removing or at least mitigating the enclave-specific problems of economic development.
1.4 East Prussia as a German exclave (1920-39) and as a predecessor of Kaliningrad
Kaliningrad, a Russian exclave from 1991 onwards, is the inheritor of East Prussia, a German exclave from 1920 until 1939, its predecessor on the same territory (Figure 1.2). In spite of belonging to different states and being separated by more than 50 years, both exclaves show a remarkable number of similarities in the issues related to economic development and relations with the mainland. The East Prussian example demonstrates the inherent disadvantages of exclave status regardless of time or the mainland to which it belongs.
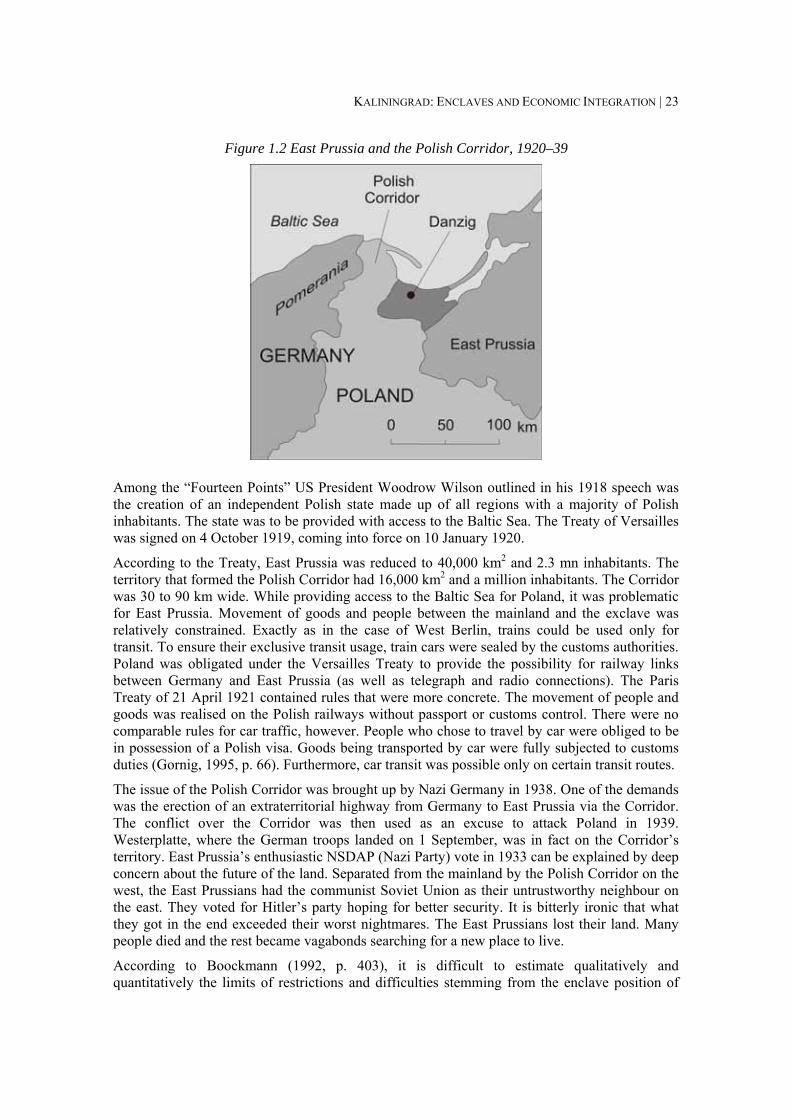
KALININGRAD: ENCLAVES AND ECONOMIC INTEGRATION | 23
Figure 1.2 East Prussia and the Polish Corridor, 1920–39
Among the “Fourteen Points” US President Woodrow Wilson outlined in his 1918 speech was the creation of an independent Polish state made up of all regions with a majority of Polish inhabitants. The state was to be provided with access to the Baltic Sea. The Treaty of Versailles was signed on 4 October 1919, coming into force on 10 January 1920.
According to the Treaty, East Prussia was reduced to 40,000 km2 and 2.3 mn inhabitants. The territory that formed the Polish Corridor had 16,000 km2 and a million inhabitants. The Corridor was 30 to 90 km wide. While providing access to the Baltic Sea for Poland, it was problematic for East Prussia. Movement of goods and people between the mainland and the exclave was relatively constrained. Exactly as in the case of West Berlin, trains could be used only for transit. To ensure their exclusive transit usage, train cars were sealed by the customs authorities. Poland was obligated under the Versailles Treaty to provide the possibility for railway links between Germany and East Prussia (as well as telegraph and radio connections). The Paris Treaty of 21 April 1921 contained rules that were more concrete. The movement of people and goods was realised on the Polish railways without passport or customs control. There were no comparable rules for car traffic, however. People who chose to travel by car were obliged to be in possession of a Polish visa. Goods being transported by car were fully subjected to customs duties (Gornig, 1995, p. 66). Furthermore, car transit was possible only on certain transit routes.
The issue of the Polish Corridor was brought up by Nazi Germany in 1938. One of the demands was the erection of an extraterritorial highway from Germany to East Prussia via the Corridor. The conflict over the Corridor was then used as an excuse to attack Poland in 1939. Westerplatte, where the German troops landed on 1 September, was in fact on the Corridor’s territory. East Prussia’s enthusiastic NSDAP (Nazi Party) vote in 1933 can be explained by deep concern about the future of the land. Separated from the mainland by the Polish Corridor on the west, the East Prussians had the communist Soviet Union as their untrustworthy neighbour on the east. They voted for Hitler’s party hoping for better security. It is bitterly ironic that what they got in the end exceeded their worst nightmares. The East Prussians lost their land. Many people died and the rest became vagabonds searching for a new place to live.
According to Boockmann (1992, p. 403), it is difficult to estimate qualitatively and quantitatively the limits of restrictions and difficulties stemming from the enclave position of
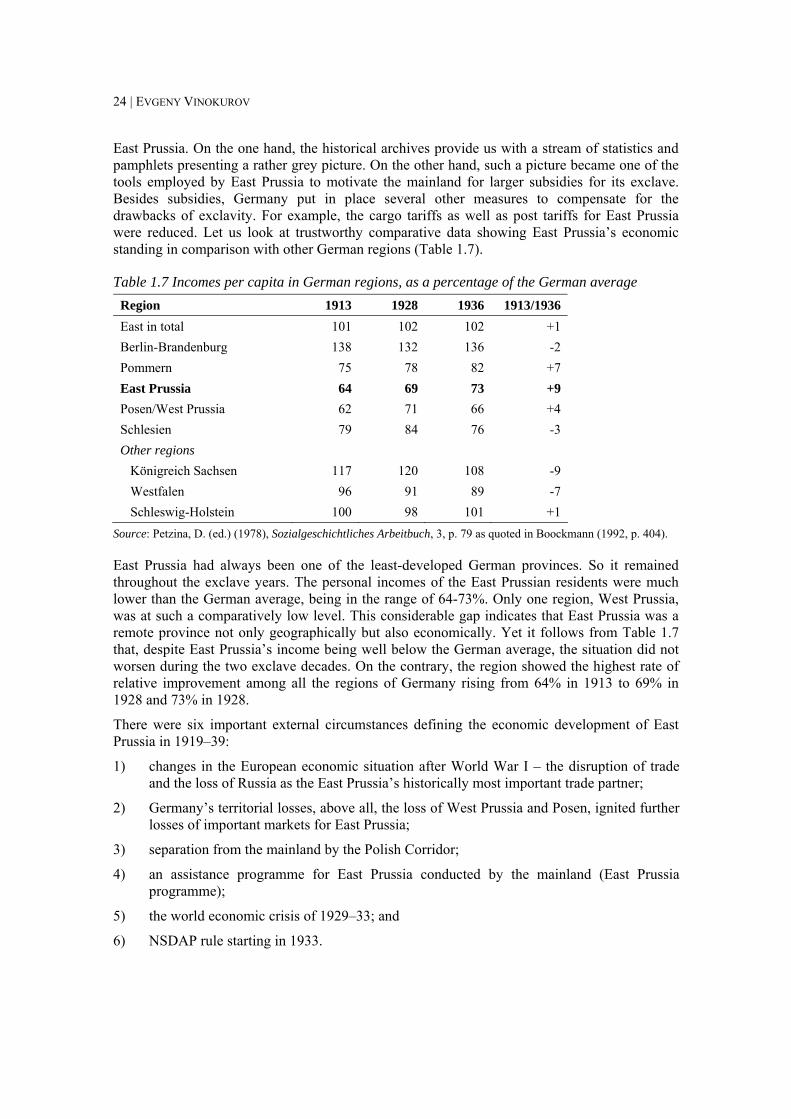
24 | EVGENY VINOKUROV
East Prussia. On the one hand, the historical archives provide us with a stream of statistics and pamphlets presenting a rather grey picture. On the other hand, such a picture became one of the tools employed by East Prussia to motivate the mainland for larger subsidies for its exclave. Besides subsidies, Germany put in place several other measures to compensate for the drawbacks of exclavity. For example, the cargo tariffs as well as post tariffs for East Prussia were reduced. Let us look at trustworthy comparative data showing East Prussia’s economic standing in comparison with other German regions (Table 1.7).
Table 1.7 Incomes per capita in German regions, as a percentage of the German average Region 1913 1928 1936 1913/1936 East in total 101 102 102 +1 Berlin-Brandenburg 138 132 136 -2 Pommern 75 78 82 +7 East Prussia 64 69 73 +9 Posen/West Prussia 62 71 66 +4 Schlesien 79 84 76 -3 Other regions Königreich Sachsen 117 120 108 -9 Westfalen 96 91 89 -7 Schleswig-Holstein 100 98 101 +1
Source: Petzina, D. (ed.) (1978), Sozialgeschichtliches Arbeitbuch, 3, p. 79 as quoted in Boockmann (1992, p. 404).
East Prussia had always been one of the least-developed German provinces. So it remained throughout the exclave years. The personal incomes of the East Prussian residents were much lower than the German average, being in the range of 64-73%. Only one region, West Prussia, was at such a comparatively low level. This considerable gap indicates that East Prussia was a remote province not only geographically but also economically. Yet it follows from Table 1.7 that, despite East Prussia’s income being well below the German average, the situation did not worsen during the two exclave decades. On the contrary, the region showed the highest rate of relative improvement among all the regions of Germany rising from 64% in 1913 to 69% in 1928 and 73% in 1928.
There were six important external circumstances defining the economic development of East Prussia in 1919–39:
1) changes in the European economic situation after World War I – the disruption of trade and the loss of Russia as the East Prussia’s historically most important trade partner;
2) Germany’s territorial losses, above all, the loss of West Prussia and Posen, ignited further losses of important markets for East Prussia;
3) separation from the mainland by the Polish Corridor;
4) an assistance programme for East Prussia conducted by the mainland (East Prussia programme);
5) the world economic crisis of 1929–33; and
6) NSDAP rule starting in 1933.
KALININGRAD: ENCLAVES AND ECONOMIC INTEGRATION | 25
Only two out of these six factors, separation from the mainland and the assistance programme, are exclave-related ones. More specifically, the separation from the German mainland by the Polish Corridor complicated economic interaction with the rest of Germany and raised the transport and communication costs. The assistance programme, launched as early as 1922, was partly attributable to the exclave location of East Prussia and partly to the fact that the region generally lagged behind the German average.
In the decade that followed, the programme focussed on establishing industries and promoting trade. The main problem, however, was agriculture. Up to World War I, East Prussia has predominantly an agrarian province, although industry had risen quickly in the decades preceding 1914, much owing to the rapid development of the transport infrastructure and East–West trade. East Prussia was considered the breadbasket of Germany. The state and efficiency of the agricultural sector was exemplary. (Even after damages incurred by the war, the Soviet resettlers coming over to Königsberg/Kaliningrad from 1945 onwards were hugely impressed by the sophisticated and highly efficient drainage systems.) Nevertheless, the province’s detachment from the mainland as well as the loss of its principal markets (notably West Prussia) made regional agriculture uncompetitive.
The economic weight of East Prussia within the German Reich remained modest. In 1936, the net production value made up DM 350.2 mn, or about 1.2% of total production. The East Prussian economy was not export-oriented. Exports in the same period were just DM 16.9 mn, or 0.4% of total German exports. Furthermore, these insignificant exports were clearly dominated by one single industry: the production of paper, paperboard, cellulose and wood. This industry exported goods valued at DM 12.1 mn, making up 71.9% of East Prussia’s exports. What were the reasons for the strong orientation towards the German internal market despite longer transport routes? Externally, rising protectionism in the world economy in the 1920s–30s did not encourage exports. In addition, Russia, formerly the most important trade partner for East Prussia, was undergoing the period of economic and trade autarky. Moreover, West Prussia and Posen, another important market, had become the part of Polish territory, which naturally caused the deterioration of the trade regime. Internally, state economic policy with its comprehensive assistance programme and subsidies promoted economic connections with the mainland. Such measures as reduced cargo and post tariffs weakened the negative impact of the exclave’s detachment.
To conclude, it seems that the exclavity of East Prussia in 1919–39 was an important factor in its economic development. East Prussian exclavity, together with the German and international political and economic background, shaped the provincial economy during the two inter-war decades. By and large, East Prussia featured the same qualities as the Kaliningrad region does: economic incapability in the absence of special treatment, assistance from the mainland based on the compensatory principle, and finally, a resulting economic orientation towards the respective mainland.
1.5 The theory of enclaves and Kaliningrad Kaliningrad shares most of the typical economic features of an enclave with varying degrees of intensity. First, it is small. Although Kaliningrad is not a micro-enclave, its size does not represent a large domestic market that could provide a sufficient domestic consumption and production base. But its size allows Kaliningrad to develop industry. Second, the exclave is extremely vulnerable to shocks and other changes in the external economic environment owing to the phenomena of enclavity and exclavity (Vinokurov, 2005a). Third, it is exposed to the danger of double peripherality in relation to both Russia and the EU.
What is the relation between the enclave costs and proximity to the EU market? Generally, enclavity/exclavity represents a drawback rather than an advantage in terms of economic

26 | EVGENY VINOKUROV
development. As found above, most of the enclaves fall behind the respective mainland in terms of incomes per capita. Only four enclaves out of 27 in the sample enjoy or enjoyed higher incomes per capita than the mainland’s average. Special conditions and measures are required for the potential proximity benefits to prevail. Kaliningrad forms no exclusion, since its enclave status impedes a valorisation of the potential benefits of its geographical proximity to the EU market.
Under what conditions can the positive aspects of enclavity outweigh the enclave costs (i.e. negative consequences of enclavity)? Which of these conditions can Kaliningrad use? Within the framework of the MES triangle, the opposition of the negative enclave-specific factors (disruption, transaction costs and vulnerability) and the opportunities stemming from economic gravity (market proximity) is analysed. As shown above through bench-marking, the correlation of income per capita and the presence or absence of a regime of economic openness is clear. All enclaves with incomes either higher than or equal to the mainland’s average enjoy a regime of economic openness towards the outside world. At the same time, the majority of enclaves with incomes inferior to the mainland’s average are closed to the outside world. In four cases where enclaves are poorer than their mainlands despite having relatively open economies (Ceuta, Melilla, Gibraltar, St Pierre and Miquelon) their liberal economic regimes appear to provide a cushion against even lower income levels.
An enclave’s economic and political openness towards both the mainland and the surrounding state is the precondition for the achievement of political stability and economic prosperity. Openness is a normal situation in relations with the mainland, as the enclave represents an integral part of the state. So, when talking about openness on the exclave–mainland vector, we mostly discuss whether the smooth flow of people, goods, services, capital, political participation and ideas exist. Issues of transit are brought into the foreground. Despite geographical proximity, openness is much more difficult to reach in relations with the surrounding state. Here, the issues of a visa-free regime, facilitated trade in goods and services, and border regimes come to the fore.
Kaliningrad’s openness and integration may be reached by several qualitatively different routes. The basic divide lies between, first, the economic integration of Kaliningrad with the EU, second, the framework of EU–Russian economic integration (which would dilute Kaliningrad’s enclavity), and third, the special economic regime anchored in Russia’s national legislation.
Theoretically, an enclave can be economically integrated into the surrounding state by excluding it from the mainland’s customs territory and – although not always – including it in the customs territory of the surrounding state. Yet this approach does not appear to be applicable to larger enclaves for a variety of political and economic reasons. While it might represent a nice solution for micro- and, sometimes, small enclaves, Kaliningrad is simply too large and important for Russia and the EU to follow this route.
It is logical to assume that, just as the enclave-specific factors contribute to higher political and economic vulnerability, a dilution of enclavity might make an enclave less vulnerable to external shocks. Enclaves are defined by their borders. A border in this context does not refer to a physical phenomenon but rather an obstacle to communications and the flow of people, goods, services, capital and labour. When borders become more penetrable, some extent of the enclavity/exclavity diminishes. This situation can be attained by reaching a level of integration between the mainland state and the surrounding state sufficient to provide a smooth passage of people and goods between the mainland and the exclave. In other words, deep and comprehensive integration between the mainland and the surrounding state is able to remove the problem of exclave–mainland transit altogether. On the whole, economic integration can greatly reduce the economic problems of an enclave. In addition, it builds ties between peoples and thus decreases the potential for opposition.
KALININGRAD: ENCLAVES AND ECONOMIC INTEGRATION | 27
Does the actual state of EU–Russian relations make it possible to achieve the level of integration that would suffice for Kaliningrad’s enclavity to be diluted and for the positive aspects of proximity to be valorised? Although Russia and the EU formulated the idea of a Common Economic Space (CES) in 2001 and came up with the CES Road Map in 2005, movement towards a sufficient level of economic integration is a long-term prospect, which is measured in decades rather than years. At the present stage, the state of EU–Russian relations weighs heavily on Kaliningrad’s economic performance, since the negative aspects of enclavity are stressed by factors both political (e.g. the introduction of visa regimes by Poland and Lithuania in 2003 or the Lithuanian transit issue) and economic (e.g. non-tariff barriers to the EU market). Nevertheless, in the long term further development of EU–Russian relations along the lines of the CES carries substantial positive potential for the Kaliningrad region as an enclave.
Since economic integration into the EU is a non-starter and the EU–Russia CES is feasible only in the long run, the issue of a special economic regime designed by Russia and anchored in the Russian national legislation appears to be central. The argumentation underlying the Kaliningrad Special Economic Zone (SEZ), created in the 1990s, followed the compensatory approach discussed in section 1.3. The idea was to compensate the region for its detachment, for longer and more expensive transport routes, and for the comprehensive de-militarisation of the 1990s when the number of military personnel stationed in the region was reduced from 100,000 to 25-30,000 over a few years. The Russian economic crisis of the 1990s had severe consequences for Kaliningrad. By the end of 1999, industrial production fell by two-thirds compared with 1990, as old patterns of production and trade eroded. In the period 1999–2005, however, the economy grew at an impressive speed. New trade and production specialisations have evolved over time. Much of the region’s economic development is attributed to the existence of the SEZ, which forms the backbone of the regional economy. The SEZ regime encouraged those industries that re-worked imports targeting the Russian internal market. Several new industries arose, such as food processing, assembly lines for household appliances and consumer electronics, and furniture. All of them target the Russian market. The market structure for the furniture industry is typical: only 7% of production is sold within the region and 10% is exported, while 83% is shipped to the mainland. The SEZ regime, working at the expense of the federal budget and competitors in other Russian regions, has become vital for the regional economy.
The Kaliningrad regional economy has replicated the national economic trends since the beginning of the 1990s. When the Russian economy was declining, so was the region’s economy. As national growth resumed in 1999, Kaliningrad began to grow too. There is one important distinction, though. Kaliningrad’s economy reacts to external economic factors with much greater amplitude than the Russian economy as a whole. The higher rate of economic development is the direct consequence of Kaliningrad’s dependence on external factors and the SEZ regime. The compensatory politics of the special economic regime provided for the revival of the badly hurt regional economy but the growth rests on the shaky foundations of the preferences granted by the SEZ, which cannot be sustained in the long run.
The issue of Kaliningrad’s specialisation has to be viewed in the framework of Russia’s integration into the world economy and more specifically in the structure of the Russia’s trade and economic interface with the EU. Most important, Kaliningrad is becoming more and more integrated into the European economy through its geographical position and the enclavity factor. Kaliningrad-related integration processes are thus specific and differ in many respects from both its immediate EU neighbours, Poland and Lithuania, and from the ‘typical’ Russian regions.
Several processes, engaging a variety of actors, are crucial for Kaliningrad. The pivotal actors exercising decisive influence on Kaliningrad’s economy are Russia (more exactly, the Russian
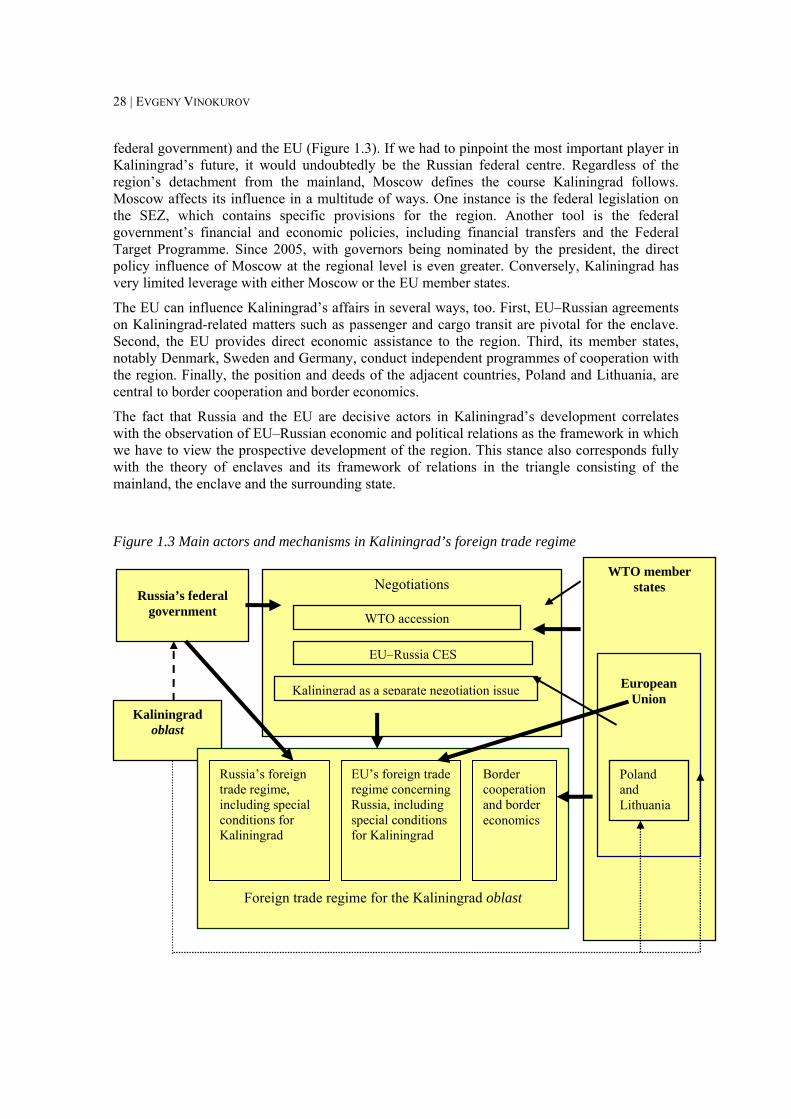
28 | EVGENY VINOKUROV
federal government) and the EU (Figure 1.3). If we had to pinpoint the most important player in Kaliningrad’s future, it would undoubtedly be the Russian federal centre. Regardless of the region’s detachment from the mainland, Moscow defines the course Kaliningrad follows. Moscow affects its influence in a multitude of ways. One instance is the federal legislation on the SEZ, which contains specific provisions for the region. Another tool is the federal government’s financial and economic policies, including financial transfers and the Federal Target Programme. Since 2005, with governors being nominated by the president, the direct policy influence of Moscow at the regional level is even greater. Conversely, Kaliningrad has very limited leverage with either Moscow or the EU member states.
The EU can influence Kaliningrad’s affairs in several ways, too. First, EU–Russian agreements on Kaliningrad-related matters such as passenger and cargo transit are pivotal for the enclave. Second, the EU provides direct economic assistance to the region. Third, its member states, notably Denmark, Sweden and Germany, conduct independent programmes of cooperation with the region. Finally, the position and deeds of the adjacent countries, Poland and Lithuania, are central to border cooperation and border economics.
The fact that Russia and the EU are decisive actors in Kaliningrad’s development correlates with the observation of EU–Russian economic and political relations as the framework in which we have to view the prospective development of the region. This stance also corresponds fully with the theory of enclaves and its framework of relations in the triangle consisting of the mainland, the enclave and the surrounding state.
Figure 1.3 Main actors and mechanisms in Kaliningrad’s foreign trade regime
Russia’s federal
government
WTO member states
European
Union Kaliningrad
oblast
Foreign trade regime for the Kaliningrad oblast
Russia’s foreign trade regime, including special conditions for Kaliningrad
EU’s foreign trade regime concerning Russia, including special conditions for Kaliningrad
Negotiations
WTO accession
EU–Russia CES
Kaliningrad as a separate negotiation issue
Border cooperation and border economics
Poland and Lithuania
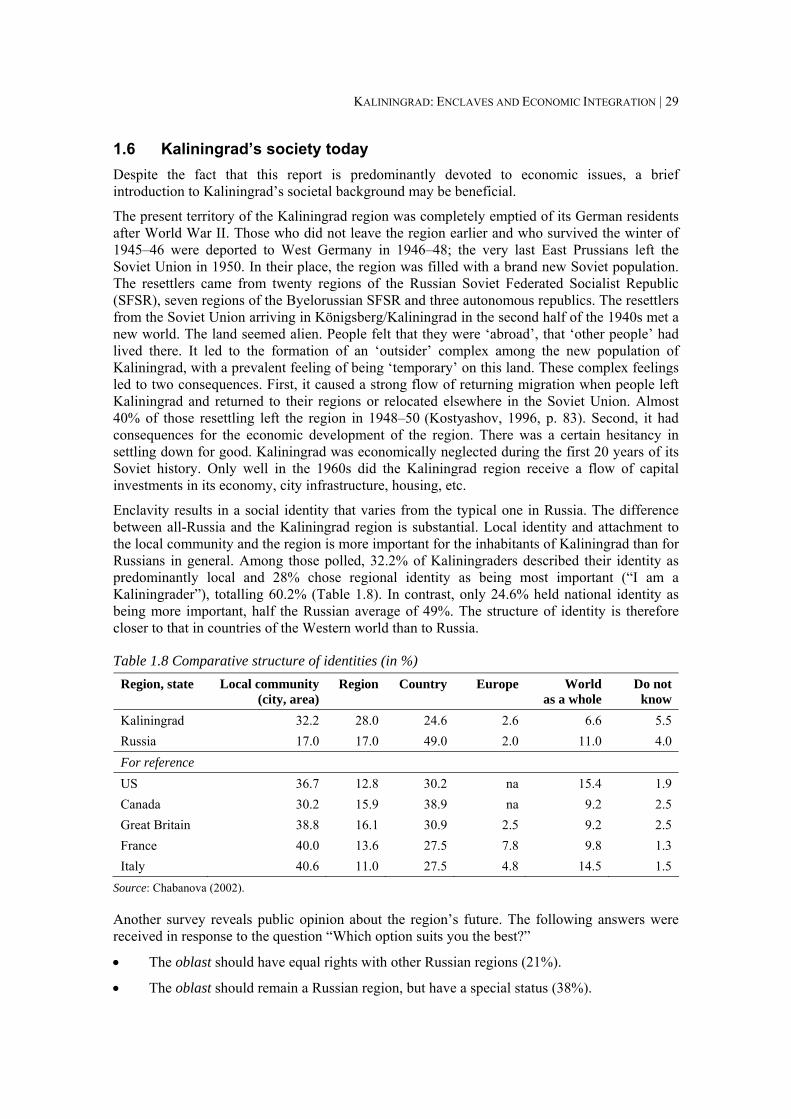
KALININGRAD: ENCLAVES AND ECONOMIC INTEGRATION | 29
1.6 Kaliningrad’s society today Despite the fact that this report is predominantly devoted to economic issues, a brief introduction to Kaliningrad’s societal background may be beneficial.
The present territory of the Kaliningrad region was completely emptied of its German residents after World War II. Those who did not leave the region earlier and who survived the winter of 1945–46 were deported to West Germany in 1946–48; the very last East Prussians left the Soviet Union in 1950. In their place, the region was filled with a brand new Soviet population. The resettlers came from twenty regions of the Russian Soviet Federated Socialist Republic (SFSR), seven regions of the Byelorussian SFSR and three autonomous republics. The resettlers from the Soviet Union arriving in Königsberg/Kaliningrad in the second half of the 1940s met a new world. The land seemed alien. People felt that they were ‘abroad’, that ‘other people’ had lived there. It led to the formation of an ‘outsider’ complex among the new population of Kaliningrad, with a prevalent feeling of being ‘temporary’ on this land. These complex feelings led to two consequences. First, it caused a strong flow of returning migration when people left Kaliningrad and returned to their regions or relocated elsewhere in the Soviet Union. Almost 40% of those resettling left the region in 1948–50 (Kostyashov, 1996, p. 83). Second, it had consequences for the economic development of the region. There was a certain hesitancy in settling down for good. Kaliningrad was economically neglected during the first 20 years of its Soviet history. Only well in the 1960s did the Kaliningrad region receive a flow of capital investments in its economy, city infrastructure, housing, etc.
Enclavity results in a social identity that varies from the typical one in Russia. The difference between all-Russia and the Kaliningrad region is substantial. Local identity and attachment to the local community and the region is more important for the inhabitants of Kaliningrad than for Russians in general. Among those polled, 32.2% of Kaliningraders described their identity as predominantly local and 28% chose regional identity as being most important (“I am a Kaliningrader”), totalling 60.2% (Table 1.8). In contrast, only 24.6% held national identity as being more important, half the Russian average of 49%. The structure of identity is therefore closer to that in countries of the Western world than to Russia.
Table 1.8 Comparative structure of identities (in %) Region, state Local community
(city, area) Region Country Europe World
as a whole Do not
know Kaliningrad 32.2 28.0 24.6 2.6 6.6 5.5 Russia 17.0 17.0 49.0 2.0 11.0 4.0 For reference US 36.7 12.8 30.2 na 15.4 1.9 Canada 30.2 15.9 38.9 na 9.2 2.5 Great Britain 38.8 16.1 30.9 2.5 9.2 2.5 France 40.0 13.6 27.5 7.8 9.8 1.3 Italy 40.6 11.0 27.5 4.8 14.5 1.5
Source: Chabanova (2002).
Another survey reveals public opinion about the region’s future. The following answers were received in response to the question “Which option suits you the best?”
• The oblast should have equal rights with other Russian regions (21%).
• The oblast should remain a Russian region, but have a special status (38%).
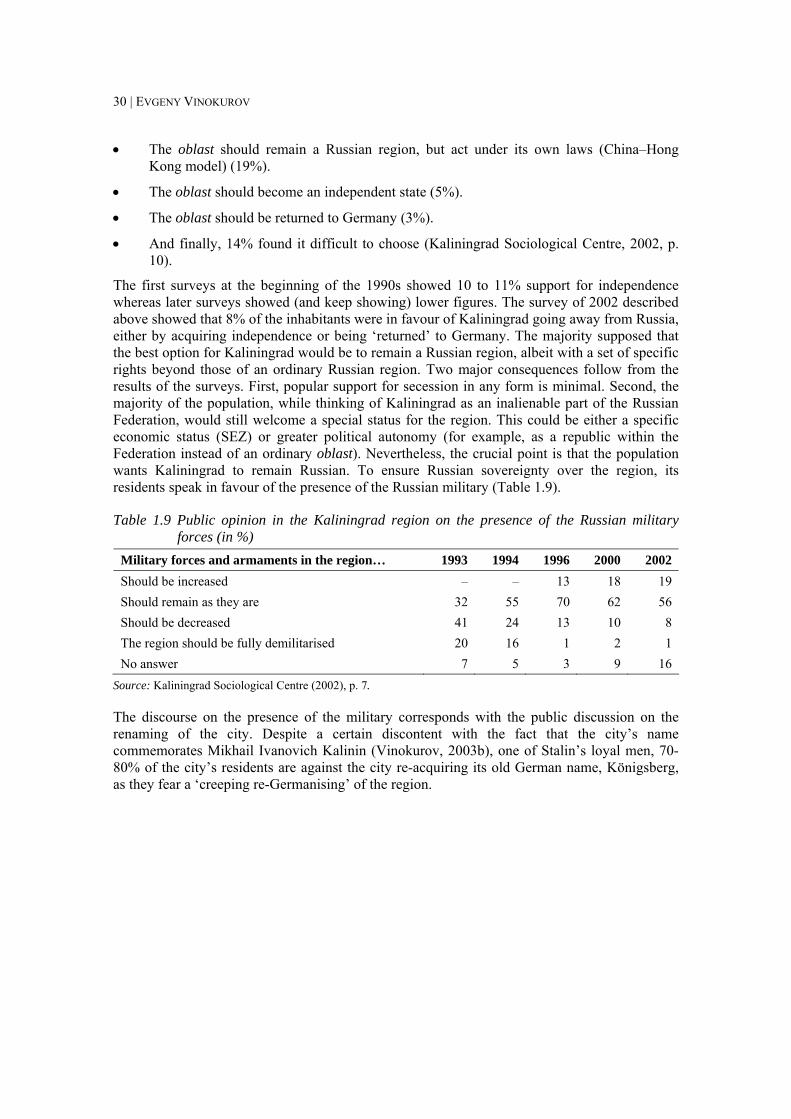
30 | EVGENY VINOKUROV
• The oblast should remain a Russian region, but act under its own laws (China–Hong Kong model) (19%).
• The oblast should become an independent state (5%).
• The oblast should be returned to Germany (3%).
• And finally, 14% found it difficult to choose (Kaliningrad Sociological Centre, 2002, p. 10).
The first surveys at the beginning of the 1990s showed 10 to 11% support for independence whereas later surveys showed (and keep showing) lower figures. The survey of 2002 described above showed that 8% of the inhabitants were in favour of Kaliningrad going away from Russia, either by acquiring independence or being ‘returned’ to Germany. The majority supposed that the best option for Kaliningrad would be to remain a Russian region, albeit with a set of specific rights beyond those of an ordinary Russian region. Two major consequences follow from the results of the surveys. First, popular support for secession in any form is minimal. Second, the majority of the population, while thinking of Kaliningrad as an inalienable part of the Russian Federation, would still welcome a special status for the region. This could be either a specific economic status (SEZ) or greater political autonomy (for example, as a republic within the Federation instead of an ordinary oblast). Nevertheless, the crucial point is that the population wants Kaliningrad to remain Russian. To ensure Russian sovereignty over the region, its residents speak in favour of the presence of the Russian military (Table 1.9).
Table 1.9 Public opinion in the Kaliningrad region on the presence of the Russian military forces (in %)
Military forces and armaments in the region… 1993 1994 1996 2000 2002 Should be increased – – 13 18 19 Should remain as they are 32 55 70 62 56 Should be decreased 41 24 13 10 8 The region should be fully demilitarised 20 16 1 2 1 No answer 7 5 3 9 16
Source: Kaliningrad Sociological Centre (2002), p. 7.
The discourse on the presence of the military corresponds with the public discussion on the renaming of the city. Despite a certain discontent with the fact that the city’s name commemorates Mikhail Ivanovich Kalinin (Vinokurov, 2003b), one of Stalin’s loyal men, 70-80% of the city’s residents are against the city re-acquiring its old German name, Königsberg, as they fear a ‘creeping re-Germanising’ of the region.
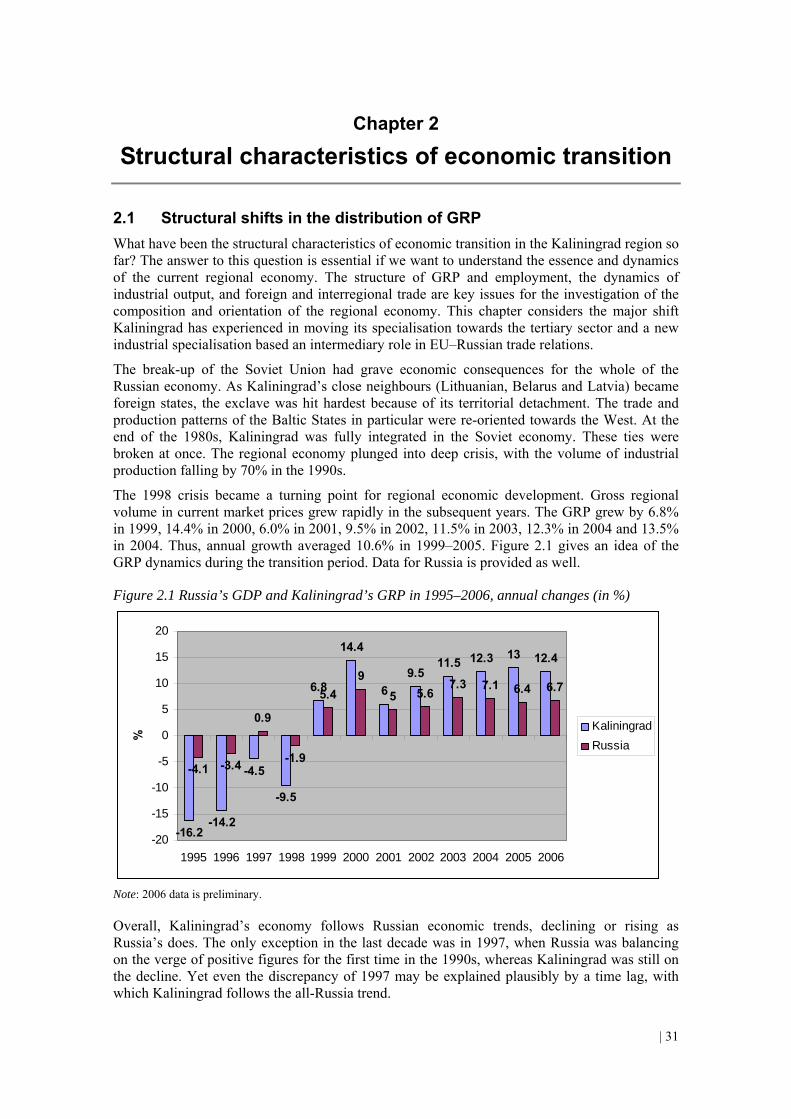
| 31
Chapter 2
Structural characteristics of economic transition
2.1 Structural shifts in the distribution of GRP What have been the structural characteristics of economic transition in the Kaliningrad region so far? The answer to this question is essential if we want to understand the essence and dynamics of the current regional economy. The structure of GRP and employment, the dynamics of industrial output, and foreign and interregional trade are key issues for the investigation of the composition and orientation of the regional economy. This chapter considers the major shift Kaliningrad has experienced in moving its specialisation towards the tertiary sector and a new industrial specialisation based an intermediary role in EU–Russian trade relations.
The break-up of the Soviet Union had grave economic consequences for the whole of the Russian economy. As Kaliningrad’s close neighbours (Lithuanian, Belarus and Latvia) became foreign states, the exclave was hit hardest because of its territorial detachment. The trade and production patterns of the Baltic States in particular were re-oriented towards the West. At the end of the 1980s, Kaliningrad was fully integrated in the Soviet economy. These ties were broken at once. The regional economy plunged into deep crisis, with the volume of industrial production falling by 70% in the 1990s.
The 1998 crisis became a turning point for regional economic development. Gross regional volume in current market prices grew rapidly in the subsequent years. The GRP grew by 6.8% in 1999, 14.4% in 2000, 6.0% in 2001, 9.5% in 2002, 11.5% in 2003, 12.3% in 2004 and 13.5% in 2004. Thus, annual growth averaged 10.6% in 1999–2005. Figure 2.1 gives an idea of the GRP dynamics during the transition period. Data for Russia is provided as well.
Figure 2.1 Russia’s GDP and Kaliningrad’s GRP in 1995–2006, annual changes (in %)
-16.2-14.2
-4.5
-9.5
6.8
14.4
69.5
11.5 12.3 13 12.4
-3.4
0.9
-1.9
5.49
5 5.67.3 7.1 6.4 6.7
-4.1
-20
-15
-10
-5
0
5
10
15
20
1995 1996 1997 1998 1999 2000 2001 2002 2003 2004 2005 2006
%
KaliningradRussia
Note: 2006 data is preliminary.
Overall, Kaliningrad’s economy follows Russian economic trends, declining or rising as Russia’s does. The only exception in the last decade was in 1997, when Russia was balancing on the verge of positive figures for the first time in the 1990s, whereas Kaliningrad was still on the decline. Yet even the discrepancy of 1997 may be explained plausibly by a time lag, with which Kaliningrad follows the all-Russia trend.
32 | EVGENY VINOKUROV
The comparison of the economic trends in Russia and Kaliningrad reveals an important feature. While following the all-Russia economic trend, the fluctuations of Kaliningrad’s GRP are more intense. They repeat the Russian ‘sign’, i.e. plus or minus, but with greater amplitude. For example, while in 1995–96 the Russian economy declined by 3-4% per year, Kaliningrad was still in full collapse, with the regional economy contracting annually by 15% on average. In fact, Kaliningrad’s industrial production had fallen to 29% of its 1990 level by 1999; the industrial production of the country had fallen to 51% of the 1990 level by the same year. Yet when the Russian economy began growing in the aftermath of the 1998 crisis, the Baltic enclave grew on average one and a half times faster than the mainland (10.1% against 6.8% in 1999–2004).
The economic crisis of the 1990s was characterised on the one hand by the sharp decline of the relative share of commodity production (manufacturing and mining, agriculture, construction and forestry). On the other hand, the relative share of services in the GRP structure grew continuously. As a result, Kaliningrad’s GRP structure was transformed within the decade and it began to resemble the typical structures of more developed states. This resemblance should not mislead observers, because it was reached by a more rapid decline of the industrial component combined with a slower decline of the service component rather than by a natural post-industrial growth of services. In terms of transition economics, the transformation processes in the Kaliningrad oblast in the 1990s were more a collapse of industry than a growth of the services sector. Smorodinskaya & Zhukov (2003) take a realistically critical view towards the structural shift of the 1990s:
[B]y the second half of the 1990’s, Kaliningrad’s economy acquired industrial proportions closer to those of advanced economies where the tertiary sector prevails. However, a more detailed examination reveals that this rapprochement is merely formal and that in Kaliningrad, a shift towards [a] service-based economy had nothing in common with progressive post-industrial changes in developed economies. First, this relative expansion of services was accompanied by a contraction of electric power, mining and manufacturing, and construction, in other words, by the de-industrialisation of the local economy in its post-soviet version. Secondly, the comparative growth of the services sector took place under a continuing decline in the GRP, as well as in the output of every sector of the economy. This means that it was based not on accelerated growth in services, but rather on a slower decline in the tertiary sector than in the primary and secondary sectors. Thirdly, there was a shift towards trade and other services within the tertiary sector, while the share of transport and communication in the GRP changed within the limits of statistical discrepancy. In short, the shift towards [the] tertiary sector was related to an overall industrial decline and to the hyper-growth of import intermediation services under this period of decline (ibid., pp. 24-25).
By and large, the economic transition of the local economy can be split into two clearly distinguishable periods, 1991–98 and 1999 onwards. According to Smorodinskaya & Zhukov’s view based on the 1999–2001 data, the first period of de-industrialisation and services growth was replaced by a partial re-industrialisation trend in 1999 (2003, pp. 23-25). While true for the starting years of the second period, this observation does not hold for the whole of the six post-1998 years. The annual industrial growth rate in the five years after the 1998 crisis averaged 14.8%. Industrial growth as the engine of regional economic development was accompanied by 12.4% of average annual growth in construction and 9.0% in transportation. Despite rapid industrial growth pushing regional growth, it did not result in a relative re-industrialisation. It could rather be said that Kaliningrad’s GRP preserved, overall, the proportions reached by the end of the 1990s. Industrial growth triggered a subsequent expansion in transportation, which managed to retain its traditional 9% share in the GRP. Trade, riding on the wave of overall growth and accelerating domestic demand, managed to re-acquire the share that had been partially lost in 1999–2001. Furthermore, the combined power of industrial growth and
KALININGRAD: ENCLAVES AND ECONOMIC INTEGRATION | 33
domestic demand was responsible for a true construction boom. The share of construction rose from 4.9% in 1999 to 9% in 2003, a trend that is unlikely to subside (see appendix I).
The weight of goods in the GRP structure in 2003 made up 42%, whereas services accounted for 58%. Industry had the largest relative weight in the GRP structure (26.1% in basis prices in 2003). Industry was also the most productive economic sector (26.1% of output and 18.9% of employment). Construction (9% and 7.8%, respectively) and transportation (9.2% and 8%, respectively) enjoyed productivity among average levels, too. On the other hand, agriculture was stricken not only by low absolute but also low relative productivity, as it produced 6% of GRP while employing 10.2% of the workforce in 2004. The productivity of the catering business, the largest service sector, was slightly above average (18.8% and 17.3%, respectively).
2.2 Shifts in employment Manufacturing and mining is the leading sector for employment despite the fall of its share through the years of transition (employing 18.9% of the workforce in 2003). The rapid rise of industrial output is not accompanied by a comparatively rapid rise of employment. It is rather the consequence of increasing labour productivity in the industry. Trade and catering are still the major sources of employment with 17.3% of the total. Agriculture, which employed more than 50,000 workers in 1990, saw declines to 45,000 in 1995 and 40,000 by 2000. The drop finally halted in 2003, in which employment was at 42,500 persons (10.2% of the workforce). This change signals both the end of the deep crisis in agriculture and the insufficiency of productivity gains in the sector. Education employs 8.8% of workforce. The significant level of employment in education is judged an indication of the oblast’s competitive advantage in a qualified labour force (TACIS, 2002a, p. 13); but it might also suggest low productivity in the provision of educational services, since it results in a mere 3.8% of GRP. Transport employs 8% of the active workforce. Finally, the public sector employs 7.2% of the workforce, up from 3% in 1990. There is a consensus in transition economics that the rise of employment in the public sector represents a social defence mechanism against unemployment through the years of transition. This view is confirmed by the Kaliningrad data. Having reached its peak in 2000, relative employment in the public sector stabilised at the beginning of the 2000s; yet so far, it has not begun to decline.
The unemployment figures jumped to some 15% in the 1990s. They began falling after 2000 (9.6% in 2001, 7.1% in 2002, 7.5% in 2003, 6.4% in 2004 and 5.9% in 2005). The 2004 level, 6.4%, is considered socially and economically acceptable (Table 2.1). The statistics can be misleading, however, because the shadow economy acted as an efficient social net during the crisis period. Actual unemployment in the 1990s was most likely less than the official data might suggest. Unofficial employment and self-employment was markedly higher in retail trade and border trade activities than in industry. The 2000s have been characterised not only by rapid growth and consequent job creation but also by the partial reappearance of formerly ‘grey’ jobs in the legal playing field.
For the most part, the structural transition in terms of employment seems to have been completed by 2000. The 21st century has so far brought only small changes. The one exception is trade, the relative share of which is declining owing to a rise in labour productivity. The retail trade sector has quickly become more civilised and more efficient as the share of super- and hypermarkets, malls and larger shopping centres has grown. Small trade and border trade have declined, the latter partially owing to the strengthening of border controls after the Polish and Lithuanian accessions to the EU. By 2003, 63.2% of the workforce was employed in the tertiary sector, 10.2% in agriculture and 26.7% in manufacturing and construction combined (see appendix I). Again, the redistribution of labour among primary, secondary and tertiary activities was largely completed by 2000.
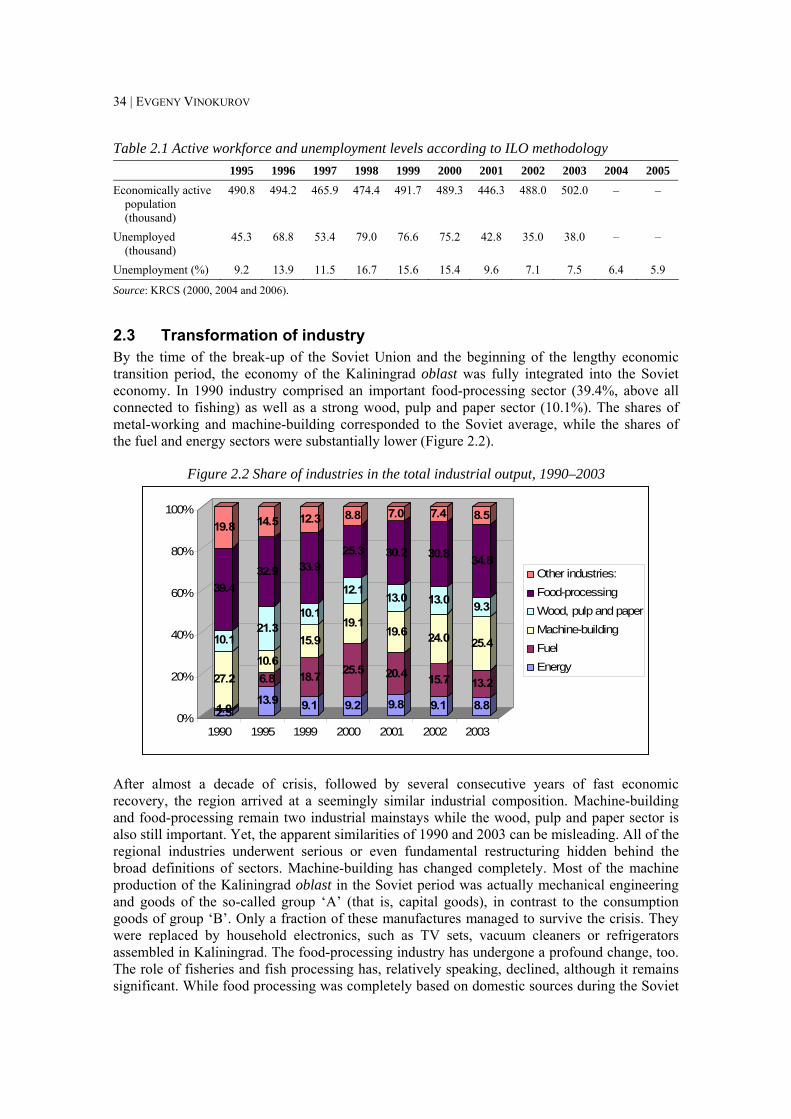
34 | EVGENY VINOKUROV
Table 2.1 Active workforce and unemployment levels according to ILO methodology 1995 1996 1997 1998 1999 2000 2001 2002 2003 2004 2005
Economically active population (thousand)
490.8 494.2 465.9 474.4 491.7 489.3 446.3 488.0 502.0 – –
Unemployed (thousand)
45.3 68.8 53.4 79.0 76.6 75.2 42.8 35.0 38.0 – –
Unemployment (%) 9.2 13.9 11.5 16.7 15.6 15.4 9.6 7.1 7.5 6.4 5.9
Source: KRCS (2000, 2004 and 2006).
2.3 Transformation of industry By the time of the break-up of the Soviet Union and the beginning of the lengthy economic transition period, the economy of the Kaliningrad oblast was fully integrated into the Soviet economy. In 1990 industry comprised an important food-processing sector (39.4%, above all connected to fishing) as well as a strong wood, pulp and paper sector (10.1%). The shares of metal-working and machine-building corresponded to the Soviet average, while the shares of the fuel and energy sectors were substantially lower (Figure 2.2).
Figure 2.2 Share of industries in the total industrial output, 1990–2003
2.51.0
27.2
10.1
39.4
19.8
13.9
6.810.6
21.3
32.9
14.5
9.1
18.7
15.9
10.1
33.9
12.3
9.2
25.5
19.1
12.1
25.3
8.8
9.8
20.4
19.6
13.0
30.2
7.0
9.1
15.7
24.0
13.0
30.8
7.4
8.8
13.2
25.4
9.3
34.8
8.5
0%
20%
40%
60%
80%
100%
1990 1995 1999 2000 2001 2002 2003
Other industries:Food-processingWood, pulp and paperMachine-buildingFuelEnergy
After almost a decade of crisis, followed by several consecutive years of fast economic recovery, the region arrived at a seemingly similar industrial composition. Machine-building and food-processing remain two industrial mainstays while the wood, pulp and paper sector is also still important. Yet, the apparent similarities of 1990 and 2003 can be misleading. All of the regional industries underwent serious or even fundamental restructuring hidden behind the broad definitions of sectors. Machine-building has changed completely. Most of the machine production of the Kaliningrad oblast in the Soviet period was actually mechanical engineering and goods of the so-called group ‘A’ (that is, capital goods), in contrast to the consumption goods of group ‘B’. Only a fraction of these manufactures managed to survive the crisis. They were replaced by household electronics, such as TV sets, vacuum cleaners or refrigerators assembled in Kaliningrad. The food-processing industry has undergone a profound change, too. The role of fisheries and fish processing has, relatively speaking, declined, although it remains significant. While food processing was completely based on domestic sources during the Soviet
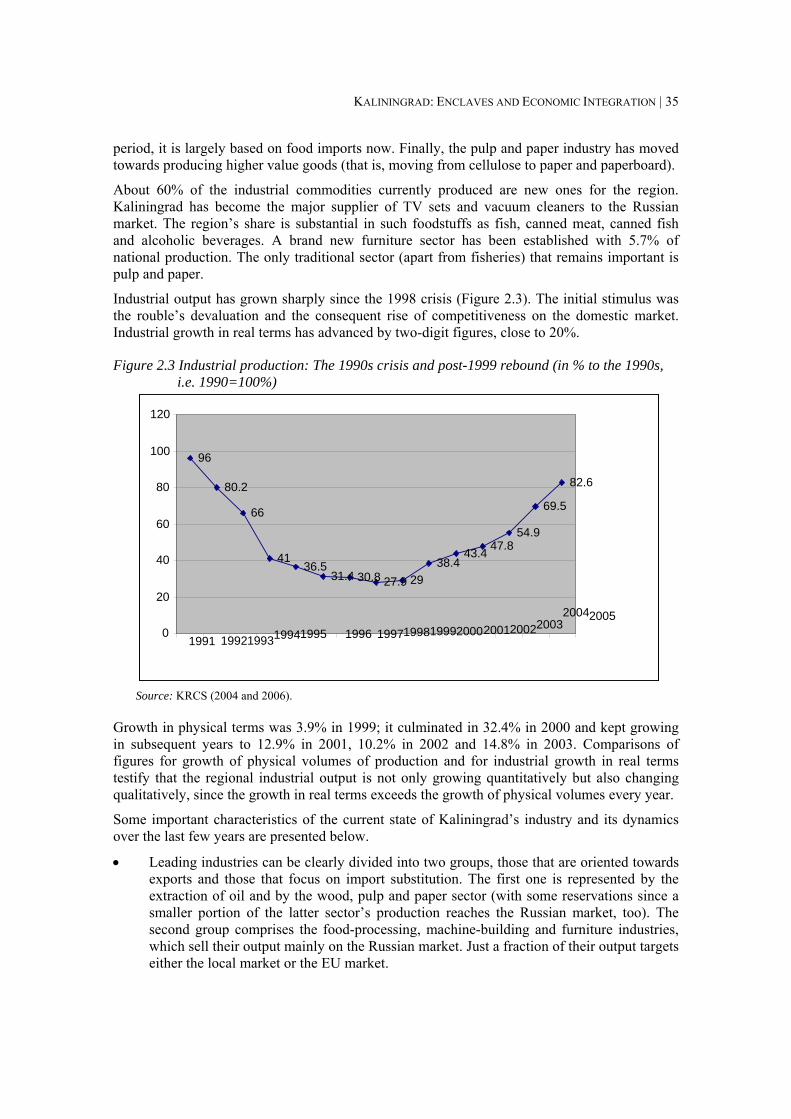
KALININGRAD: ENCLAVES AND ECONOMIC INTEGRATION | 35
period, it is largely based on food imports now. Finally, the pulp and paper industry has moved towards producing higher value goods (that is, moving from cellulose to paper and paperboard).
About 60% of the industrial commodities currently produced are new ones for the region. Kaliningrad has become the major supplier of TV sets and vacuum cleaners to the Russian market. The region’s share is substantial in such foodstuffs as fish, canned meat, canned fish and alcoholic beverages. A brand new furniture sector has been established with 5.7% of national production. The only traditional sector (apart from fisheries) that remains important is pulp and paper.
Industrial output has grown sharply since the 1998 crisis (Figure 2.3). The initial stimulus was the rouble’s devaluation and the consequent rise of competitiveness on the domestic market. Industrial growth in real terms has advanced by two-digit figures, close to 20%.
Figure 2.3 Industrial production: The 1990s crisis and post-1999 rebound (in % to the 1990s, i.e. 1990=100%)
Source: KRCS (2004 and 2006).
Growth in physical terms was 3.9% in 1999; it culminated in 32.4% in 2000 and kept growing in subsequent years to 12.9% in 2001, 10.2% in 2002 and 14.8% in 2003. Comparisons of figures for growth of physical volumes of production and for industrial growth in real terms testify that the regional industrial output is not only growing quantitatively but also changing qualitatively, since the growth in real terms exceeds the growth of physical volumes every year.
Some important characteristics of the current state of Kaliningrad’s industry and its dynamics over the last few years are presented below.
• Leading industries can be clearly divided into two groups, those that are oriented towards exports and those that focus on import substitution. The first one is represented by the extraction of oil and by the wood, pulp and paper sector (with some reservations since a smaller portion of the latter sector’s production reaches the Russian market, too). The second group comprises the food-processing, machine-building and furniture industries, which sell their output mainly on the Russian market. Just a fraction of their output targets either the local market or the EU market.
96
80.2
66
41 36.5
31.4 30.8 27.9 2938.4
43.4 47.854.9
69.5
82.6
0
20
40
60
80
100
120
1991 1992 1993 1994 1995 1996 1997199819992000200120022003 2004 2005

36 | EVGENY VINOKUROV
• Another way to approach the current industrial strongholds of the region would be to distinguish the old sector, inherited from the Soviet era, and the new sector. The old sector includes both export-oriented firms (fuel, alcoholic beverages, pulp and paper) and firms that produce for the Russian market and manage to prove their competitiveness. Yet many enterprises of the old sector have curtailed their activities and now simply serve as production spaces for new manufacturers. The companies that were established in the transition period work mostly for the domestic Russian market. They have, on average, very high growth rates. For example, growth in machine-building averaged 41.3% in 1999–2004, which allowed the industry to exceed the initial level of 1990. Growth in another dynamic industry, meat-processing, averaged 28.7% in the same period, while regional industry grew by 16.3% on average (Usanov & Kharin, 2005).
• Import-substitution industries have grown dynamically whereas the export-oriented ones have stagnated or grown only slowly. Overall, traditional exports possess little potential for growth. Two branches – pulp and paper, and fishing – have reduced their production. Pulp and paper firms have few capacities for increasing their production owing to a lack of raw materials, compared with the capacities in other regions of the Russian North-West. The Atlantic fishing industry also has poor prospects. In the 1990s, two-thirds of fishing vessels were sold to foreign corporations or re-registered in foreign ports with a more favourable taxation regime (about 70 large and middle tonnage boats were assigned to the Kaliningrad ports in 2001, vs. 200 in 1990). Oil production dwindled in the 1990s but managed to rebound to its 1980s level following the beginning of sea-bed oil extraction. Finally, the mining of amber has reduced from 800 tonnes to 300-400 tonnes per year (Samson, 2000b, p. 153).
• The structure of industrial production in the Kaliningrad oblast is relatively undiversified. Indeed, the current industrial structure features even more specialisation and less diversification than the Soviet one. Two leading sectors, food processing and machine-building, produce 60% of industrial output. Four leading sectors (the two above plus pulp and paper and fuel) are responsible for 82.7% of industrial output.
• An analysis of the industrial structure leads to the conclusion that the region managed to develop industries in which it had already specialised in the Soviet era. At the same time, the traditional sectors have experienced profound qualitative changes internally and switched to new products.
• Moreover, one can trace the continuity of industrial specialisation from the East Prussian economy. In fact, the food-processing, wood and pulp and paper as well as the machine-building sectors were all established at the beginning of the 20th century. They characterise the exclave economy of East Prussia during the time of the Weimar Republic as well as the exclave economy of Kaliningrad in the 2000s.
• A relatively large share of industrial output is still in the black market. The size of the shadow economy in regional industry was estimated by experts at 28.5% in 2002 (Samson, 2002).
• The total consumption of fuel and energy resources grew 12.3% in 1999–2003 and consumption of electricity grew by 26.7% (Table 2.2). Energy needs were satisfied by energy supplies from Leningrad Nuclear Power Plant. Although total energy consumption has grown because of the rapid industrial growth of the regional economy, the energy intensity of the industries actually declined over 1999–2003, although not as sharply as it might appear. After inflation adjustment based on the KRCS index of prices for industrial production (77.8% over 1999–2003), it seems that the rate of fuel and energy use by GRP unit fell by 21.5% in comparable prices over four years. The rate of electric energy use
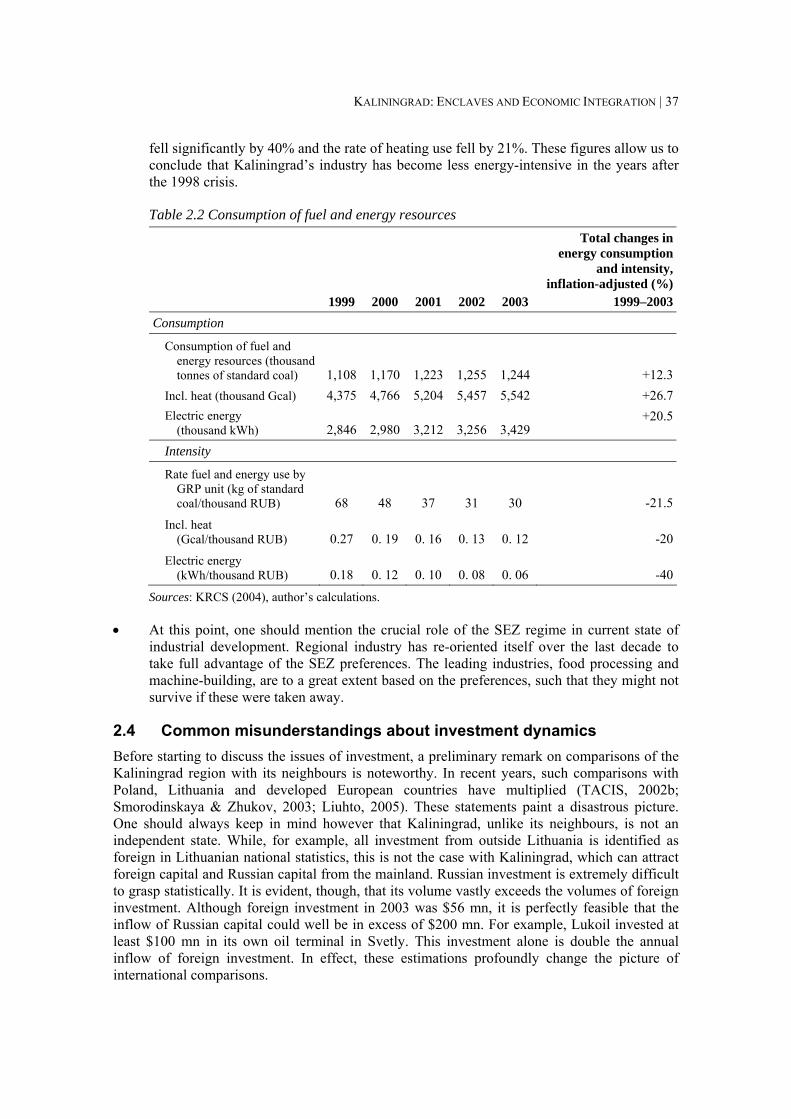
KALININGRAD: ENCLAVES AND ECONOMIC INTEGRATION | 37
fell significantly by 40% and the rate of heating use fell by 21%. These figures allow us to conclude that Kaliningrad’s industry has become less energy-intensive in the years after the 1998 crisis.
Table 2.2 Consumption of fuel and energy resources
1999 2000 2001 2002 2003
Total changes in energy consumption
and intensity, inflation-adjusted (%)
1999–2003 Consumption
Consumption of fuel and energy resources (thousand tonnes of standard coal) 1,108 1,170 1,223 1,255 1,244 +12.3
Incl. heat (thousand Gcal) 4,375 4,766 5,204 5,457 5,542 +26.7Electric energy
(thousand kWh) 2,846 2,980 3,212 3,256 3,429 +20.5
Intensity
Rate fuel and energy use by GRP unit (kg of standard coal/thousand RUB) 68 48 37 31 30 -21.5
Incl. heat (Gcal/thousand RUB) 0.27 0. 19 0. 16 0. 13 0. 12 -20
Electric energy (kWh/thousand RUB) 0.18 0. 12 0. 10 0. 08 0. 06 -40
Sources: KRCS (2004), author’s calculations.
• At this point, one should mention the crucial role of the SEZ regime in current state of industrial development. Regional industry has re-oriented itself over the last decade to take full advantage of the SEZ preferences. The leading industries, food processing and machine-building, are to a great extent based on the preferences, such that they might not survive if these were taken away.
2.4 Common misunderstandings about investment dynamics Before starting to discuss the issues of investment, a preliminary remark on comparisons of the Kaliningrad region with its neighbours is noteworthy. In recent years, such comparisons with Poland, Lithuania and developed European countries have multiplied (TACIS, 2002b; Smorodinskaya & Zhukov, 2003; Liuhto, 2005). These statements paint a disastrous picture. One should always keep in mind however that Kaliningrad, unlike its neighbours, is not an independent state. While, for example, all investment from outside Lithuania is identified as foreign in Lithuanian national statistics, this is not the case with Kaliningrad, which can attract foreign capital and Russian capital from the mainland. Russian investment is extremely difficult to grasp statistically. It is evident, though, that its volume vastly exceeds the volumes of foreign investment. Although foreign investment in 2003 was $56 mn, it is perfectly feasible that the inflow of Russian capital could well be in excess of $200 mn. For example, Lukoil invested at least $100 mn in its own oil terminal in Svetly. This investment alone is double the annual inflow of foreign investment. In effect, these estimations profoundly change the picture of international comparisons.
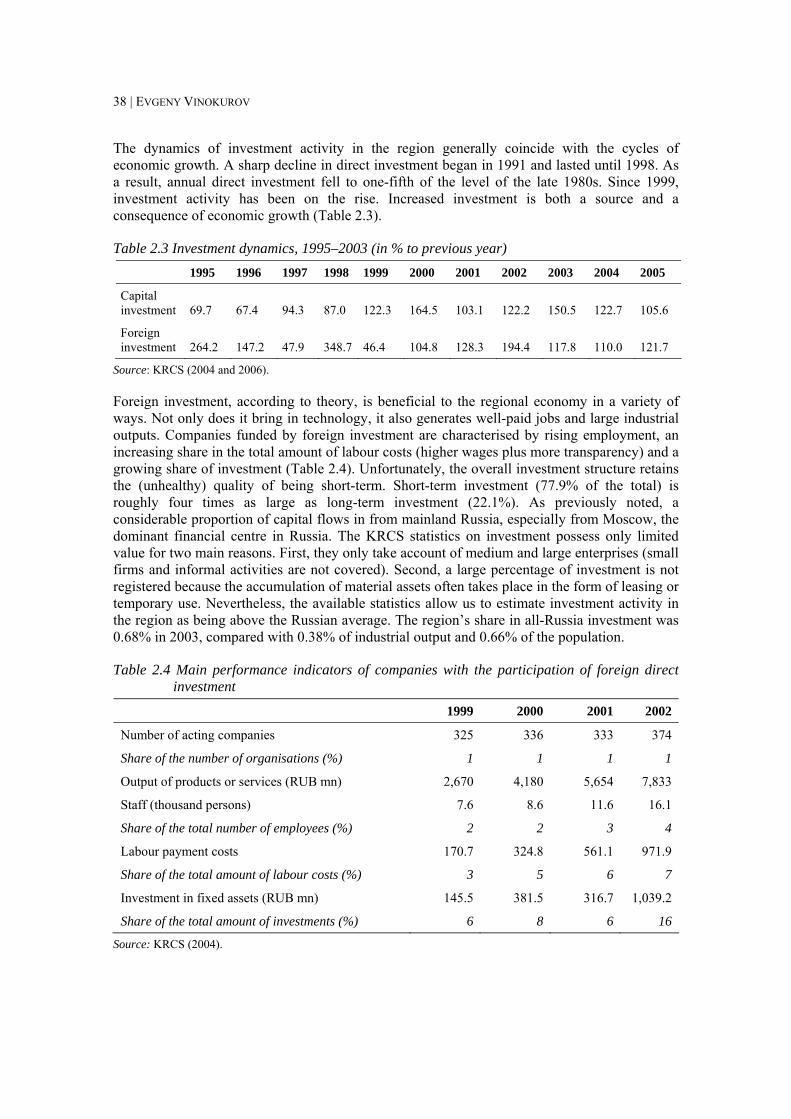
38 | EVGENY VINOKUROV
The dynamics of investment activity in the region generally coincide with the cycles of economic growth. A sharp decline in direct investment began in 1991 and lasted until 1998. As a result, annual direct investment fell to one-fifth of the level of the late 1980s. Since 1999, investment activity has been on the rise. Increased investment is both a source and a consequence of economic growth (Table 2.3).
Table 2.3 Investment dynamics, 1995–2003 (in % to previous year) 1995 1996 1997 1998 1999 2000 2001 2002 2003 2004 2005
Capital investment
69.7
67.4
94.3
87.0 122.3 164.5 103.1 122.2 150.5
122.7
105.6
Foreign investment
264.2
147.2
47.9
348.7
46.4
104.8
128.3 194.4 117.8
110.0
121.7
Source: KRCS (2004 and 2006).
Foreign investment, according to theory, is beneficial to the regional economy in a variety of ways. Not only does it bring in technology, it also generates well-paid jobs and large industrial outputs. Companies funded by foreign investment are characterised by rising employment, an increasing share in the total amount of labour costs (higher wages plus more transparency) and a growing share of investment (Table 2.4). Unfortunately, the overall investment structure retains the (unhealthy) quality of being short-term. Short-term investment (77.9% of the total) is roughly four times as large as long-term investment (22.1%). As previously noted, a considerable proportion of capital flows in from mainland Russia, especially from Moscow, the dominant financial centre in Russia. The KRCS statistics on investment possess only limited value for two main reasons. First, they only take account of medium and large enterprises (small firms and informal activities are not covered). Second, a large percentage of investment is not registered because the accumulation of material assets often takes place in the form of leasing or temporary use. Nevertheless, the available statistics allow us to estimate investment activity in the region as being above the Russian average. The region’s share in all-Russia investment was 0.68% in 2003, compared with 0.38% of industrial output and 0.66% of the population.
Table 2.4 Main performance indicators of companies with the participation of foreign direct investment
1999 2000 2001 2002
Number of acting companies 325 336 333 374
Share of the number of organisations (%) 1 1 1 1
Output of products or services (RUB mn) 2,670 4,180 5,654 7,833
Staff (thousand persons) 7.6 8.6 11.6 16.1
Share of the total number of employees (%) 2 2 3 4
Labour payment costs 170.7 324.8 561.1 971.9
Share of the total amount of labour costs (%) 3 5 6 7
Investment in fixed assets (RUB mn) 145.5 381.5 316.7 1,039.2
Share of the total amount of investments (%) 6 8 6 16
Source: KRCS (2004).
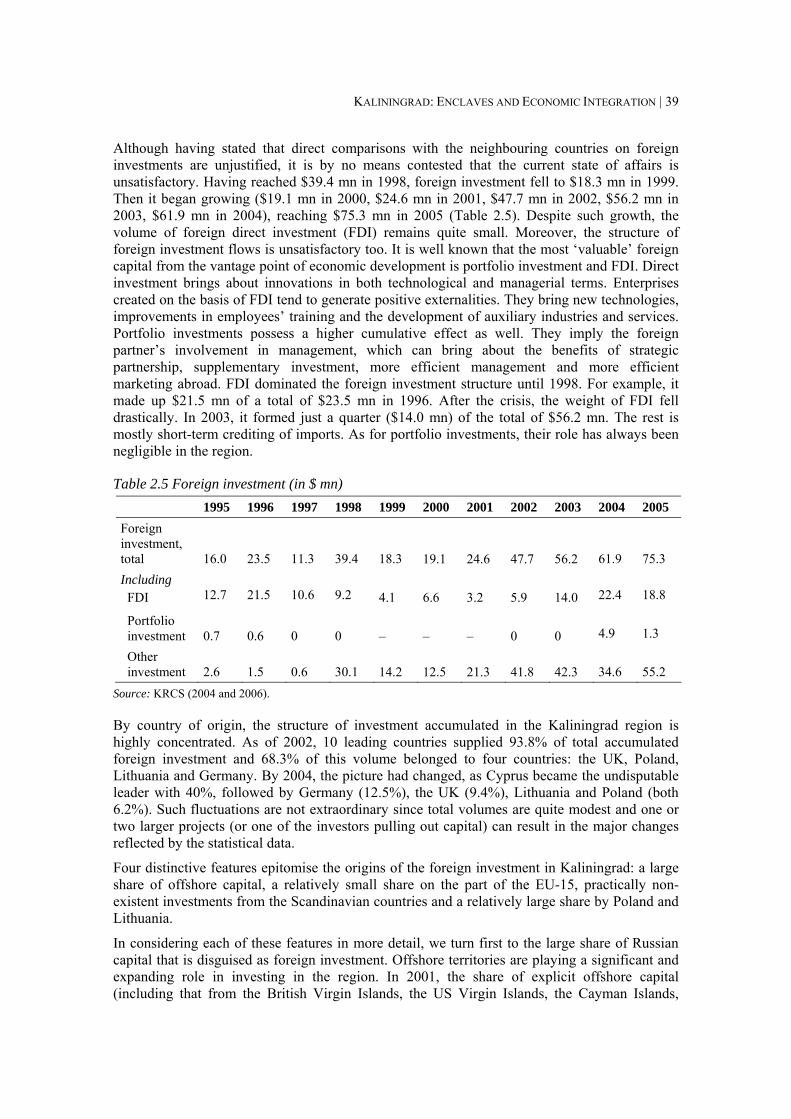
KALININGRAD: ENCLAVES AND ECONOMIC INTEGRATION | 39
Although having stated that direct comparisons with the neighbouring countries on foreign investments are unjustified, it is by no means contested that the current state of affairs is unsatisfactory. Having reached $39.4 mn in 1998, foreign investment fell to $18.3 mn in 1999. Then it began growing ($19.1 mn in 2000, $24.6 mn in 2001, $47.7 mn in 2002, $56.2 mn in 2003, $61.9 mn in 2004), reaching $75.3 mn in 2005 (Table 2.5). Despite such growth, the volume of foreign direct investment (FDI) remains quite small. Moreover, the structure of foreign investment flows is unsatisfactory too. It is well known that the most ‘valuable’ foreign capital from the vantage point of economic development is portfolio investment and FDI. Direct investment brings about innovations in both technological and managerial terms. Enterprises created on the basis of FDI tend to generate positive externalities. They bring new technologies, improvements in employees’ training and the development of auxiliary industries and services. Portfolio investments possess a higher cumulative effect as well. They imply the foreign partner’s involvement in management, which can bring about the benefits of strategic partnership, supplementary investment, more efficient management and more efficient marketing abroad. FDI dominated the foreign investment structure until 1998. For example, it made up $21.5 mn of a total of $23.5 mn in 1996. After the crisis, the weight of FDI fell drastically. In 2003, it formed just a quarter ($14.0 mn) of the total of $56.2 mn. The rest is mostly short-term crediting of imports. As for portfolio investments, their role has always been negligible in the region.
Table 2.5 Foreign investment (in $ mn) 1995 1996 1997 1998 1999 2000 2001 2002 2003 2004 2005 Foreign investment, total
16.0
23.5
11.3
39.4
18.3 19.1 24.6 47.7 56.2
61.9
75.3
Including FDI
12.7
21.5
10.6
9.2 4.1 6.6 3.2 5.9 14.0
22.4
18.8
Portfolio investment
0.7
0.6
0
0 – – – 0 0
4.9
1.3
Other investment
2.6
1.5
0.6
30.1 14.2 12.5 21.3 41.8 42.3
34.6
55.2
Source: KRCS (2004 and 2006).
By country of origin, the structure of investment accumulated in the Kaliningrad region is highly concentrated. As of 2002, 10 leading countries supplied 93.8% of total accumulated foreign investment and 68.3% of this volume belonged to four countries: the UK, Poland, Lithuania and Germany. By 2004, the picture had changed, as Cyprus became the undisputable leader with 40%, followed by Germany (12.5%), the UK (9.4%), Lithuania and Poland (both 6.2%). Such fluctuations are not extraordinary since total volumes are quite modest and one or two larger projects (or one of the investors pulling out capital) can result in the major changes reflected by the statistical data.
Four distinctive features epitomise the origins of the foreign investment in Kaliningrad: a large share of offshore capital, a relatively small share on the part of the EU-15, practically non-existent investments from the Scandinavian countries and a relatively large share by Poland and Lithuania.
In considering each of these features in more detail, we turn first to the large share of Russian capital that is disguised as foreign investment. Offshore territories are playing a significant and expanding role in investing in the region. In 2001, the share of explicit offshore capital (including that from the British Virgin Islands, the US Virgin Islands, the Cayman Islands,
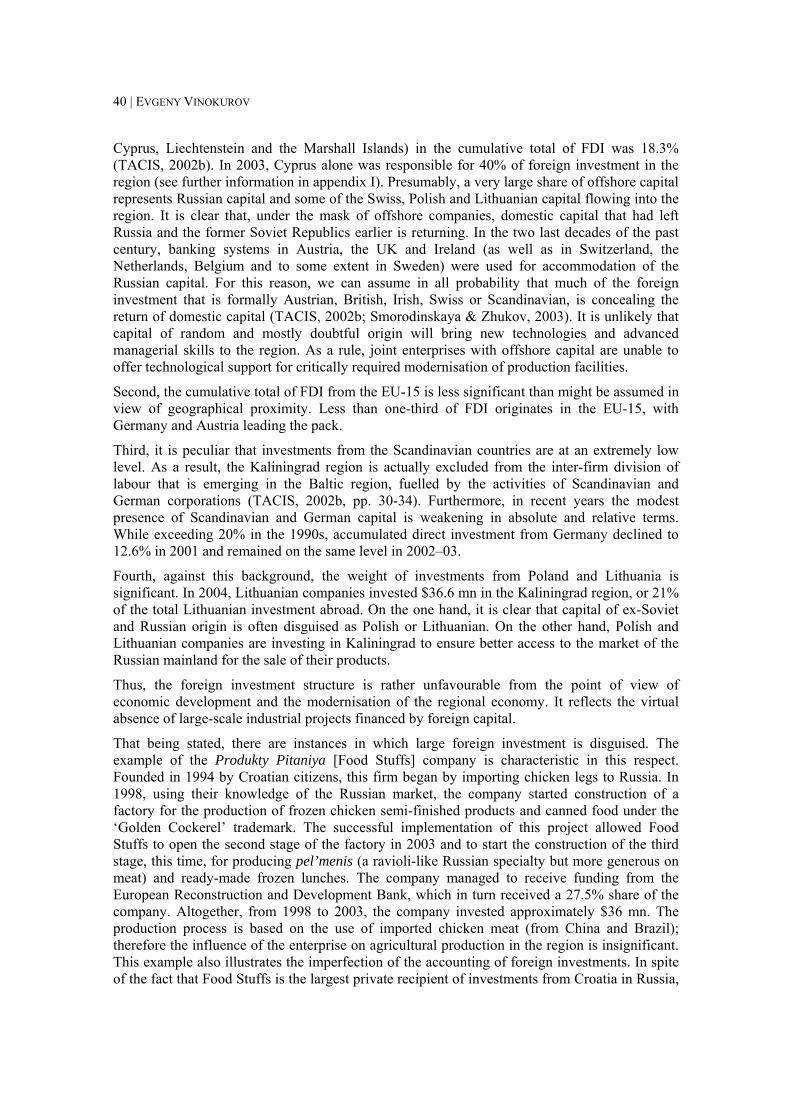
40 | EVGENY VINOKUROV
Cyprus, Liechtenstein and the Marshall Islands) in the cumulative total of FDI was 18.3% (TACIS, 2002b). In 2003, Cyprus alone was responsible for 40% of foreign investment in the region (see further information in appendix I). Presumably, a very large share of offshore capital represents Russian capital and some of the Swiss, Polish and Lithuanian capital flowing into the region. It is clear that, under the mask of offshore companies, domestic capital that had left Russia and the former Soviet Republics earlier is returning. In the two last decades of the past century, banking systems in Austria, the UK and Ireland (as well as in Switzerland, the Netherlands, Belgium and to some extent in Sweden) were used for accommodation of the Russian capital. For this reason, we can assume in all probability that much of the foreign investment that is formally Austrian, British, Irish, Swiss or Scandinavian, is concealing the return of domestic capital (TACIS, 2002b; Smorodinskaya & Zhukov, 2003). It is unlikely that capital of random and mostly doubtful origin will bring new technologies and advanced managerial skills to the region. As a rule, joint enterprises with offshore capital are unable to offer technological support for critically required modernisation of production facilities.
Second, the cumulative total of FDI from the EU-15 is less significant than might be assumed in view of geographical proximity. Less than one-third of FDI originates in the EU-15, with Germany and Austria leading the pack.
Third, it is peculiar that investments from the Scandinavian countries are at an extremely low level. As a result, the Kaliningrad region is actually excluded from the inter-firm division of labour that is emerging in the Baltic region, fuelled by the activities of Scandinavian and German corporations (TACIS, 2002b, pp. 30-34). Furthermore, in recent years the modest presence of Scandinavian and German capital is weakening in absolute and relative terms. While exceeding 20% in the 1990s, accumulated direct investment from Germany declined to 12.6% in 2001 and remained on the same level in 2002–03.
Fourth, against this background, the weight of investments from Poland and Lithuania is significant. In 2004, Lithuanian companies invested $36.6 mn in the Kaliningrad region, or 21% of the total Lithuanian investment abroad. On the one hand, it is clear that capital of ex-Soviet and Russian origin is often disguised as Polish or Lithuanian. On the other hand, Polish and Lithuanian companies are investing in Kaliningrad to ensure better access to the market of the Russian mainland for the sale of their products.
Thus, the foreign investment structure is rather unfavourable from the point of view of economic development and the modernisation of the regional economy. It reflects the virtual absence of large-scale industrial projects financed by foreign capital.
That being stated, there are instances in which large foreign investment is disguised. The example of the Produkty Pitaniya [Food Stuffs] company is characteristic in this respect. Founded in 1994 by Croatian citizens, this firm began by importing chicken legs to Russia. In 1998, using their knowledge of the Russian market, the company started construction of a factory for the production of frozen chicken semi-finished products and canned food under the ‘Golden Cockerel’ trademark. The successful implementation of this project allowed Food Stuffs to open the second stage of the factory in 2003 and to start the construction of the third stage, this time, for producing pel’menis (a ravioli-like Russian specialty but more generous on meat) and ready-made frozen lunches. The company managed to receive funding from the European Reconstruction and Development Bank, which in turn received a 27.5% share of the company. Altogether, from 1998 to 2003, the company invested approximately $36 mn. The production process is based on the use of imported chicken meat (from China and Brazil); therefore the influence of the enterprise on agricultural production in the region is insignificant. This example also illustrates the imperfection of the accounting of foreign investments. In spite of the fact that Food Stuffs is the largest private recipient of investments from Croatia in Russia,
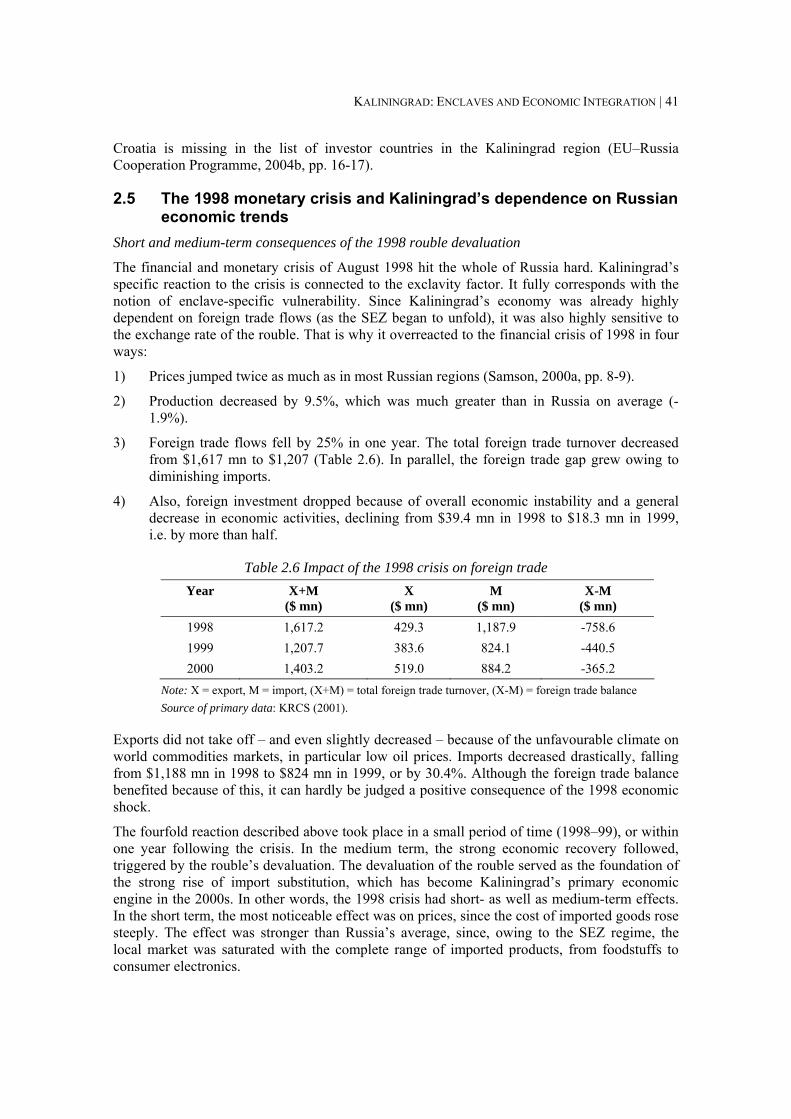
KALININGRAD: ENCLAVES AND ECONOMIC INTEGRATION | 41
Croatia is missing in the list of investor countries in the Kaliningrad region (EU–Russia Cooperation Programme, 2004b, pp. 16-17).
2.5 The 1998 monetary crisis and Kaliningrad’s dependence on Russian economic trends
Short and medium-term consequences of the 1998 rouble devaluation
The financial and monetary crisis of August 1998 hit the whole of Russia hard. Kaliningrad’s specific reaction to the crisis is connected to the exclavity factor. It fully corresponds with the notion of enclave-specific vulnerability. Since Kaliningrad’s economy was already highly dependent on foreign trade flows (as the SEZ began to unfold), it was also highly sensitive to the exchange rate of the rouble. That is why it overreacted to the financial crisis of 1998 in four ways:
1) Prices jumped twice as much as in most Russian regions (Samson, 2000a, pp. 8-9).
2) Production decreased by 9.5%, which was much greater than in Russia on average (-1.9%).
3) Foreign trade flows fell by 25% in one year. The total foreign trade turnover decreased from $1,617 mn to $1,207 (Table 2.6). In parallel, the foreign trade gap grew owing to diminishing imports.
4) Also, foreign investment dropped because of overall economic instability and a general decrease in economic activities, declining from $39.4 mn in 1998 to $18.3 mn in 1999, i.e. by more than half.
Table 2.6 Impact of the 1998 crisis on foreign trade Year
X+M
($ mn) X
($ mn) M
($ mn) X-M
($ mn) 1998 1,617.2 429.3 1,187.9 -758.6 1999 1,207.7 383.6 824.1 -440.5 2000 1,403.2 519.0 884.2 -365.2
Note: X = export, M = import, (X+M) = total foreign trade turnover, (Х-М) = foreign trade balance Source of primary data: KRCS (2001).
Exports did not take off – and even slightly decreased – because of the unfavourable climate on world commodities markets, in particular low oil prices. Imports decreased drastically, falling from $1,188 mn in 1998 to $824 mn in 1999, or by 30.4%. Although the foreign trade balance benefited because of this, it can hardly be judged a positive consequence of the 1998 economic shock.
The fourfold reaction described above took place in a small period of time (1998–99), or within one year following the crisis. In the medium term, the strong economic recovery followed, triggered by the rouble’s devaluation. The devaluation of the rouble served as the foundation of the strong rise of import substitution, which has become Kaliningrad’s primary economic engine in the 2000s. In other words, the 1998 crisis had short- as well as medium-term effects. In the short term, the most noticeable effect was on prices, since the cost of imported goods rose steeply. The effect was stronger than Russia’s average, since, owing to the SEZ regime, the local market was saturated with the complete range of imported products, from foodstuffs to consumer electronics.
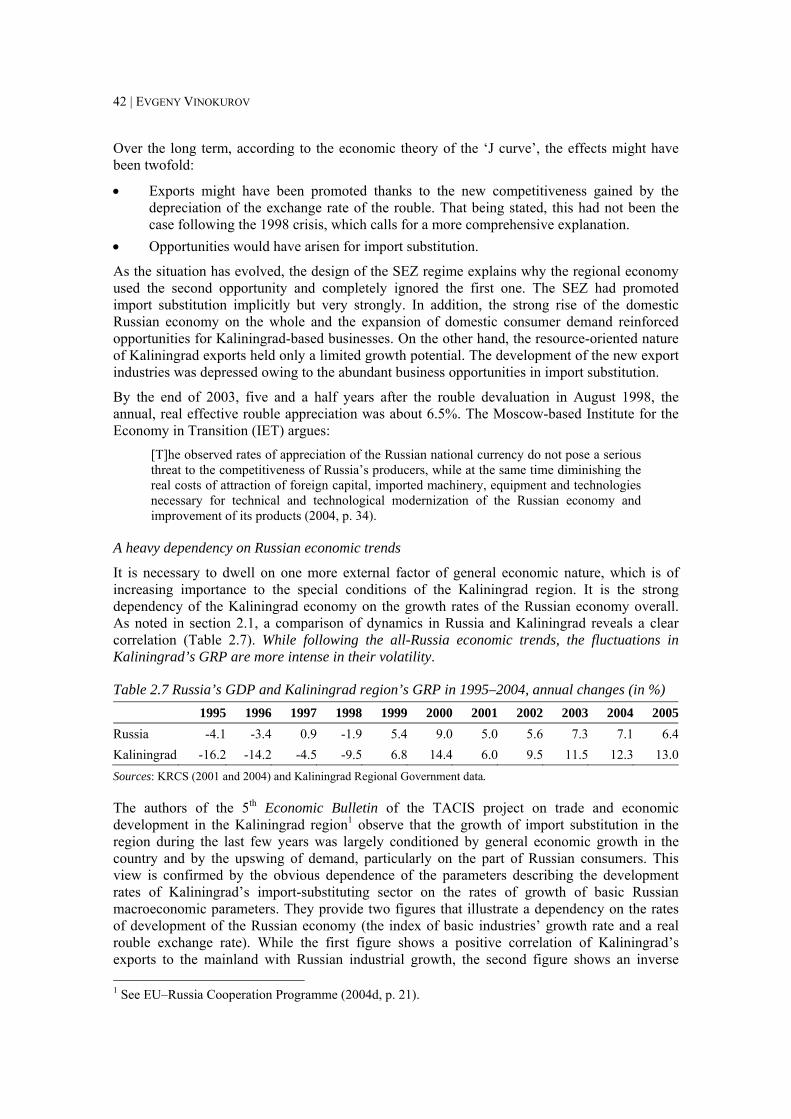
42 | EVGENY VINOKUROV
Over the long term, according to the economic theory of the ‘J curve’, the effects might have been twofold:
• Exports might have been promoted thanks to the new competitiveness gained by the depreciation of the exchange rate of the rouble. That being stated, this had not been the case following the 1998 crisis, which calls for a more comprehensive explanation.
• Opportunities would have arisen for import substitution.
As the situation has evolved, the design of the SEZ regime explains why the regional economy used the second opportunity and completely ignored the first one. The SEZ had promoted import substitution implicitly but very strongly. In addition, the strong rise of the domestic Russian economy on the whole and the expansion of domestic consumer demand reinforced opportunities for Kaliningrad-based businesses. On the other hand, the resource-oriented nature of Kaliningrad exports held only a limited growth potential. The development of the new export industries was depressed owing to the abundant business opportunities in import substitution.
By the end of 2003, five and a half years after the rouble devaluation in August 1998, the annual, real effective rouble appreciation was about 6.5%. The Moscow-based Institute for the Economy in Transition (IET) argues:
[T]he observed rates of appreciation of the Russian national currency do not pose a serious threat to the competitiveness of Russia’s producers, while at the same time diminishing the real costs of attraction of foreign capital, imported machinery, equipment and technologies necessary for technical and technological modernization of the Russian economy and improvement of its products (2004, p. 34).
A heavy dependency on Russian economic trends
It is necessary to dwell on one more external factor of general economic nature, which is of increasing importance to the special conditions of the Kaliningrad region. It is the strong dependency of the Kaliningrad economy on the growth rates of the Russian economy overall. As noted in section 2.1, a comparison of dynamics in Russia and Kaliningrad reveals a clear correlation (Table 2.7). While following the all-Russia economic trends, the fluctuations in Kaliningrad’s GRP are more intense in their volatility.
Table 2.7 Russia’s GDP and Kaliningrad region’s GRP in 1995–2004, annual changes (in %) 1995 1996 1997 1998 1999 2000 2001 2002 2003 2004 2005
Russia -4.1 -3.4 0.9 -1.9 5.4 9.0 5.0 5.6 7.3 7.1 6.4Kaliningrad -16.2 -14.2 -4.5 -9.5 6.8 14.4 6.0 9.5 11.5 12.3 13.0Sources: KRCS (2001 and 2004) and Kaliningrad Regional Government data.
The authors of the 5th Economic Bulletin of the TACIS project on trade and economic development in the Kaliningrad region1 observe that the growth of import substitution in the region during the last few years was largely conditioned by general economic growth in the country and by the upswing of demand, particularly on the part of Russian consumers. This view is confirmed by the obvious dependence of the parameters describing the development rates of Kaliningrad’s import-substituting sector on the rates of growth of basic Russian macroeconomic parameters. They provide two figures that illustrate a dependency on the rates of development of the Russian economy (the index of basic industries’ growth rate and a real rouble exchange rate). While the first figure shows a positive correlation of Kaliningrad’s exports to the mainland with Russian industrial growth, the second figure shows an inverse 1 See EU–Russia Cooperation Programme (2004d, p. 21).
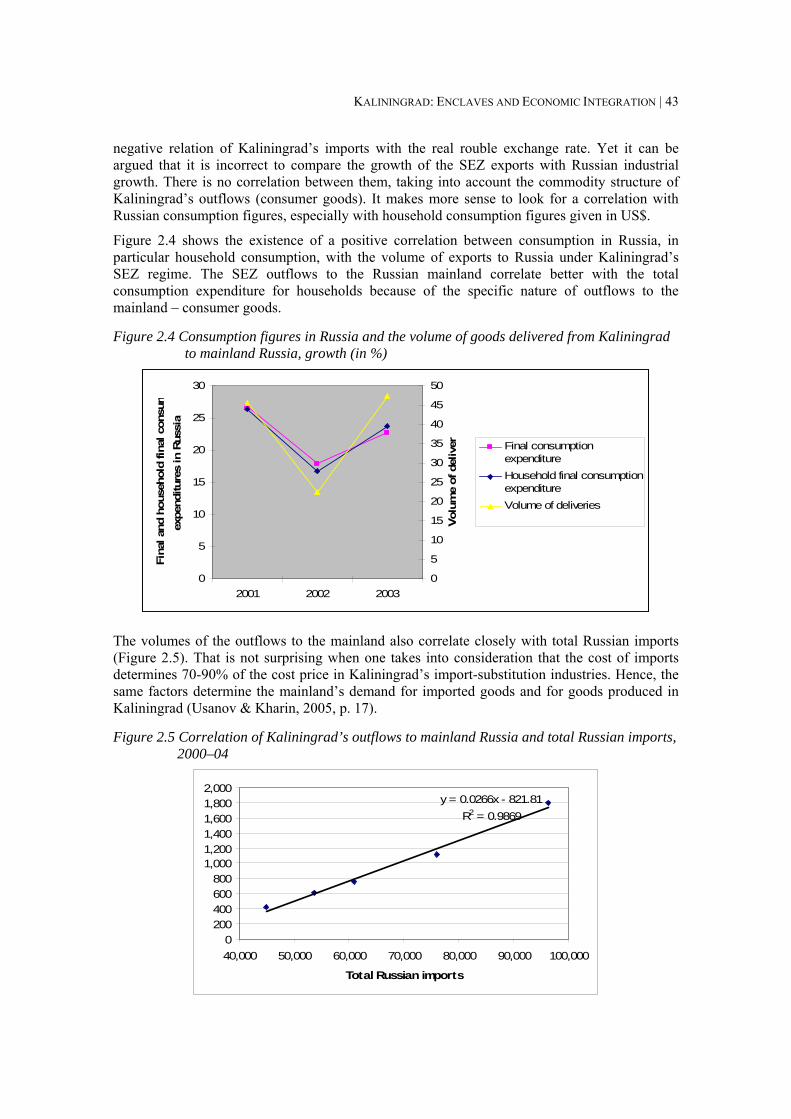
KALININGRAD: ENCLAVES AND ECONOMIC INTEGRATION | 43
negative relation of Kaliningrad’s imports with the real rouble exchange rate. Yet it can be argued that it is incorrect to compare the growth of the SEZ exports with Russian industrial growth. There is no correlation between them, taking into account the commodity structure of Kaliningrad’s outflows (consumer goods). It makes more sense to look for a correlation with Russian consumption figures, especially with household consumption figures given in US$.
Figure 2.4 shows the existence of a positive correlation between consumption in Russia, in particular household consumption, with the volume of exports to Russia under Kaliningrad’s SEZ regime. The SEZ outflows to the Russian mainland correlate better with the total consumption expenditure for households because of the specific nature of outflows to the mainland – consumer goods.
Figure 2.4 Consumption figures in Russia and the volume of goods delivered from Kaliningrad to mainland Russia, growth (in %)
0
5
10
15
20
25
30
2001 2002 2003
Fina
l and
hou
seho
ld fi
nal c
onsu
mex
pend
iture
s in
Rus
sia
0
5
10
15
20
25
30
35
40
45
50
Volu
me
of d
eliv
er Final consumptionexpenditureHousehold final consumptionexpenditureVolume of deliveries
The volumes of the outflows to the mainland also correlate closely with total Russian imports (Figure 2.5). That is not surprising when one takes into consideration that the cost of imports determines 70-90% of the cost price in Kaliningrad’s import-substitution industries. Hence, the same factors determine the mainland’s demand for imported goods and for goods produced in Kaliningrad (Usanov & Kharin, 2005, p. 17).
Figure 2.5 Correlation of Kaliningrad’s outflows to mainland Russia and total Russian imports, 2000–04
y = 0.0266x - 821.81R2 = 0.9869
0200400600800
1,0001,2001,4001,6001,8002,000
40,000 50,000 60,000 70,000 80,000 90,000 100,000
Total Russian imports
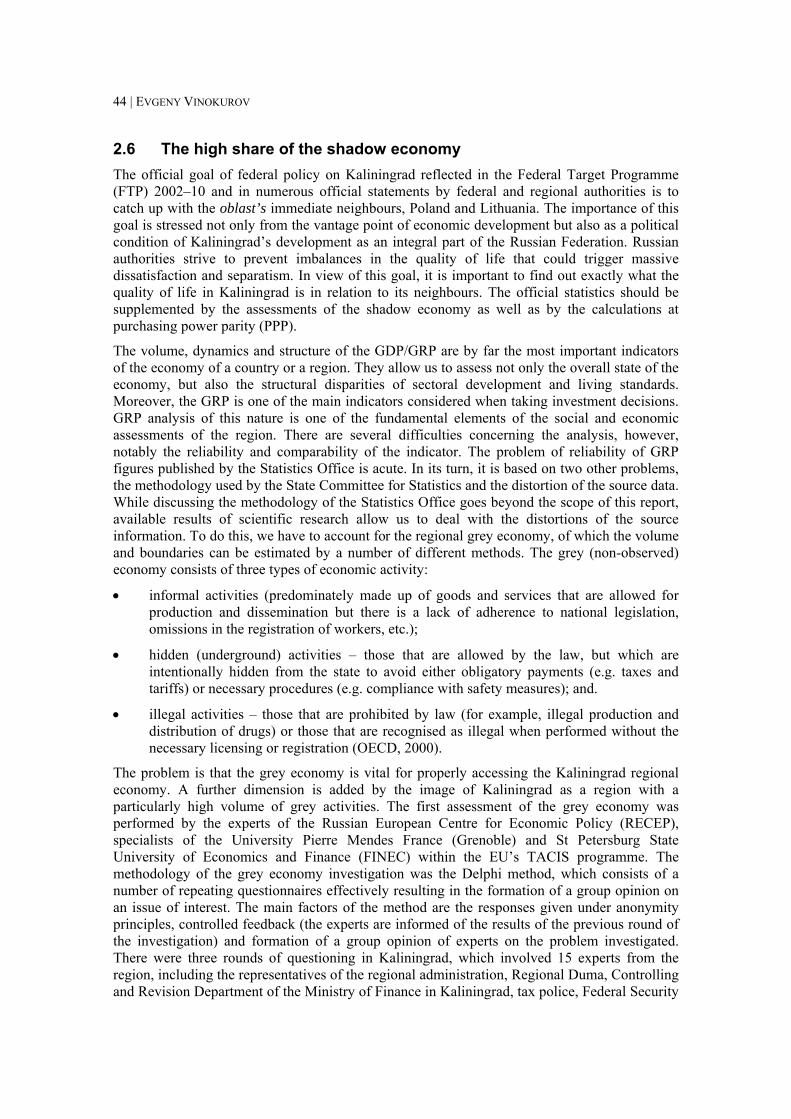
44 | EVGENY VINOKUROV
2.6 The high share of the shadow economy The official goal of federal policy on Kaliningrad reflected in the Federal Target Programme (FTP) 2002–10 and in numerous official statements by federal and regional authorities is to catch up with the oblast’s immediate neighbours, Poland and Lithuania. The importance of this goal is stressed not only from the vantage point of economic development but also as a political condition of Kaliningrad’s development as an integral part of the Russian Federation. Russian authorities strive to prevent imbalances in the quality of life that could trigger massive dissatisfaction and separatism. In view of this goal, it is important to find out exactly what the quality of life in Kaliningrad is in relation to its neighbours. The official statistics should be supplemented by the assessments of the shadow economy as well as by the calculations at purchasing power parity (PPP).
The volume, dynamics and structure of the GDP/GRP are by far the most important indicators of the economy of a country or a region. They allow us to assess not only the overall state of the economy, but also the structural disparities of sectoral development and living standards. Moreover, the GRP is one of the main indicators considered when taking investment decisions. GRP analysis of this nature is one of the fundamental elements of the social and economic assessments of the region. There are several difficulties concerning the analysis, however, notably the reliability and comparability of the indicator. The problem of reliability of GRP figures published by the Statistics Office is acute. In its turn, it is based on two other problems, the methodology used by the State Committee for Statistics and the distortion of the source data. While discussing the methodology of the Statistics Office goes beyond the scope of this report, available results of scientific research allow us to deal with the distortions of the source information. To do this, we have to account for the regional grey economy, of which the volume and boundaries can be estimated by a number of different methods. The grey (non-observed) economy consists of three types of economic activity:
• informal activities (predominately made up of goods and services that are allowed for production and dissemination but there is a lack of adherence to national legislation, omissions in the registration of workers, etc.);
• hidden (underground) activities – those that are allowed by the law, but which are intentionally hidden from the state to avoid either obligatory payments (e.g. taxes and tariffs) or necessary procedures (e.g. compliance with safety measures); and.
• illegal activities – those that are prohibited by law (for example, illegal production and distribution of drugs) or those that are recognised as illegal when performed without the necessary licensing or registration (OECD, 2000).
The problem is that the grey economy is vital for properly accessing the Kaliningrad regional economy. A further dimension is added by the image of Kaliningrad as a region with a particularly high volume of grey activities. The first assessment of the grey economy was performed by the experts of the Russian European Centre for Economic Policy (RECEP), specialists of the University Pierre Mendes France (Grenoble) and St Petersburg State University of Economics and Finance (FINEC) within the EU’s TACIS programme. The methodology of the grey economy investigation was the Delphi method, which consists of a number of repeating questionnaires effectively resulting in the formation of a group opinion on an issue of interest. The main factors of the method are the responses given under anonymity principles, controlled feedback (the experts are informed of the results of the previous round of the investigation) and formation of a group opinion of experts on the problem investigated. There were three rounds of questioning in Kaliningrad, which involved 15 experts from the region, including the representatives of the regional administration, Regional Duma, Controlling and Revision Department of the Ministry of Finance in Kaliningrad, tax police, Federal Security
KALININGRAD: ENCLAVES AND ECONOMIC INTEGRATION | 45
Service, the Ministry of Internal Affairs, the regional tax committee, the Kaliningrad city administration and economists from Kaliningrad State University. Each of the rounds featured a separate questionnaire with 30 questions on the shadow economy overall and on illegal activities in particular. According to the results of the survey, the average volume of the grey economy sector was 95% of the official one. Thus, the real volume of GRP after the correction was estimated as almost twice as large as the official GRP figure. The shadow GRP’s structure at the stage of creation and utilisation is illustrated in Table 2.8.
Table 2.8 Composition of the shadow economy
GRP elements Share of the element (%) GRP elements Share of the
element (%) Final consumption 48.0 Payments to the wage-earners 31.0 Gross savings 25.0 Net production taxes 25.5 Net exports 27.0 Gross profit and gross mixed income 43.5 Total shadow GRP 100.0 Total shadow GRP 100.0
Sources: Eliseeva & Burova (2002); Samson et al. (2002).
The share of the grey economy varies in different sectors. There is a noticeable discrepancy in the experts’ judgment, though: the share of the grey sector in any of the sectors does not reach 95%. If we calculate the volume of GRP, correcting the official figure, we would derive RUB 43,000 mn, which is 36% higher than the published figure. The difference in the volumes of the grey economy given by the experts (95%) and calculated for each of the sectors (36%) is substantial and difficult to explain. The first possible reason is that the structure of the official GRP does not take into account two important activities, people working from home and illegal activities, which are therefore not included in the calculation of GRP by sector. Moreover, psychologically, the experts assess the grey economy as a whole and by sector differently, which confirms once again that the performed investigation only provides some starting points for further research.
Further results of the Delphi survey can be summarised as follows:
• The shadow incomes of Kaliningrad citizens constitute 43% of their average per capita incomes.
• The share of illegal exports is 13%; the share of illegal imports is 15%.
• The average share of illegal activities in the total volume of the grey economy is assessed as 28%. The most common types of illegal activities are the production and distribution of drugs and weapons, smuggling and prostitution.
Two further methods were applied to estimate the level of the shadow economy in the region. Tatarinov (2002) constructed and analysed the input-output matrix and concluded that the shadow economy must form 55% of the official level in 2000 (i.e. on the top of the official economy). Despite being based on the most mathematically advanced procedure, the results of the input-output matrix analysis are substantially devalued by the use of the official data for the trade flows with the Russian regions. The estimation of household incomes based on the representative sample realised under the leadership of Fedorov in 2001 revealed an excess of 47% (Samson, 2002). Later on, Gareev, Zhdanov & Fedorov (2005) estimated the real GRP at 40% above the official level for 2003.
Although the estimation of 95% appears excessive, a wide consensus is reached around the estimation of 40-50%. In other words, the shadow economy forms about one-third of Kaliningrad’s total GRP. It can be assumed with reasonable certainty (and it also follows from
46 | EVGENY VINOKUROV
the available calculations) that the share of the shadow economy is slowly decreasing over time owing to reasons such as the strengthening of state control and more reasonable taxation, in particular a lower social tax and the 13% flat-rate personal income tax. Estimating the real GRP in 2004–05 at 40% above the official level thus seems reasonable.
The second obstacle on the way of positioning Kaliningrad in Russia and in Europe is the methodology of GRP comparisons with various states. This comparison can be done only on the basis of PPP. The PPP reflects the correlation of the world and internal prices of all the goods produced by an economy. This approach to international comparisons is especially important for Russia, which has a significant gap between the exchange rate and PPP. In 2001, this gap was 3.5 times (with the exchange rate at 29.3 RUB/US$ and the PPP at 8.3 RUB/US$). The GRP of the Kaliningrad region, calculated at PPP in 2001 was $6,900 per capita, which is 6.2 times higher than the GRP calculated at the official exchange rate (Table 2.9).
Table 2.9 Official data on the GDP/GRP per capita 1999 2000 2001 2002 2003 2004 Kaliningrad’s GRP per capita (RUB) 17,096 25,931 35,979 43,631 54,889 69,228 RF’s GDP per capita (RUB) 28,492 42,902 53,709 66,111 80,766 102,005 Place among Russian regions 53 44 39 43 44 37
Sources: KRCS (2004 and 2006) and the Russian Committee for Statistics.
Therefore, Kaliningrad’s population is more well off than it may seem from the official statistics. The official data does not accurately reflect the real situation, as is repeatedly noticed by outsiders, whether foreigners or Russians. According to the KRCS’s data, Kaliningrad is chronically lagging behind the Russian average.
A Russian citizen or a foreigner who has been in Russia (outside of Moscow) would confirm that it is completely counter-intuitive to assume that Kaliningraders live 1.5 times worse than Russians do on average. Two factors are crucial to achieve a more adequate representation of the economic reality. First, the shadow economy must be accounted for, as we have already done. Second, calculations of both purchasing power and any indirect evidence on household consumption should be taken into account. Several approaches are possible for PPP calculations. The straightforward one is to take the Russian data from the international comparisons, in which Russia has participated since 1993, and then to account for the difference between the all-Russia GDP per capita and Kaliningrad’s GRP per capita.
apitarussiaperc
dpercapitakaliningrarussiadkaliningra GDP
GRPPPPPPP ∗= (1)
The figure of $4,400 was obtained for 2000 using this procedure (e.g. Smorodinskaya, 2001a; Smorodinskaya & Zhukov, 2003). Similarly, the figure of $5,337 can be obtained for 2002.2
1.533766111436318087 =∗ (2)
2 International comparison data is available at www.gks.ru.
KALININGRAD: ENCLAVES AND ECONOMIC INTEGRATION | 47
Yet these figures do not account for a specific economic regime, detachment or the geographic location of Kaliningrad and, consequently, substantial price differences on many products. A more subtle approach would be to conduct direct GDP/GRP(PPP) per capita comparisons as was done within the project of comparing the purchasing power in the Kaliningrad region and Lithuania by the research group under the leadership of Ivan Samson in 2002. This approach, although more laborious, reveals more exact and trustworthy PPP information since it compares purchasing power directly in the regions with comparable consumption structures. The research revealed that the rouble/lit purchasing power ratio in Kaliningrad and Lithuania in the first half of 2001 equalled to 0.95. As the calculations were based solely on household consumption without calculating expenses, the final figure should be closer to 85% (Samson et al, 2002). Based on the data of the research, the GRP(PPP) per capita in Kaliningrad in 2000 should be estimated at $6,025, or 37% higher than the figure obtained by direct deduction from the Russian average according to the KRCS data.
The PPP calculations show that Kaliningrad finds itself approximately at the Russian average. It lags behind Lithuania, although less significantly than might be expected. It is roughly equal to the level of Poland’s Warminsko-Mazurskie Voivodship, Kaliningrad’s immediate neighbour with a number of severe structural problems and the highest level of unemployment in Poland. The findings are also consistent with the data on regional household consumption. For instance, Kaliningrad finds itself among the Russian regions with the highest per capita consumption of automobiles (ranking second) and meat.
2.7 Kaliningrad in comparison International comparisons. While making international comparisons of Kaliningrad with foreign states, it is necessary to account for sizeable discrepancies in statistical methodology. The GRP in Russian statistics (unlike the GDP) does not include the added value of non-market collective services (defence, public administration, non-market science, etc.), which amounts to 12-13% of the GDP of Russia. At the same time, non-market collective services in EU statistics are completely distributed across the regions. Thus, the actual GRP of the exclave should be adjusted upwards by 12-13% when being compared with the GDP of neighbouring countries.
Kaliningrad’s immediate neighbours, Poland and Lithuania, managed to cope with the transition crisis quickly and began experiencing dynamic economic growth by 1995. Meanwhile, Russia in general, and Kaliningrad in particular, were still caught in the deep economic crisis caused by badly-carried-out reforms. When Russia had finally arrived at positive figures, both of Kaliningrad’s neighbours were already above their 1990 levels (Table 2.10). While Poland coped with its transition more successfully, it slowed down somewhat in the 2000s. Its economic growth in 1999–2004 averaged 3.3%. Lithuania, on the other hand, demonstrated high economic dynamism, maintaining annual growth rates of 5.3% throughout the same period (see Yudanov, 2002, for an analysis of the transition in the Baltic countries). Russia has averaged 6.8% and Kaliningrad went as high as 10.1% of average growth in the six years following 1998. Nevertheless, the picture would be fundamentally changed if we had a look at the longer temporal series comprising the whole of the transitional period. As Poland, unlike Lithuania and Russia, had successfully employed the shock-therapy macroeconomic treatment, it managed to grow almost right away. That is why the Polish average growth rate in 1991–2004, 3.4%, is so advanced compared with the other two countries. In fact, both Lithuania and Russia had negative annual growth rates in 1991–2004, -0.4% and -1.1% respectively. Also, data for the last decade (1995–2004) is less favourable for Russia and especially for its Baltic exclave. While Poland and Lithuania grew on average by 4.4% and 5.4% respectively, Russia grew at a mere 2.8% and Kaliningrad, owing to the sharp economic decline of the 1990s and despite rapid growth in the 2000s, grew at only 1.5%.

48 | EVGENY VINOKUROV
Table 2.10 An international comparison of GDP growth (in %) GDP/GRP growth
Average weighted growth
1995 1996 1997 1998 1999 2000 2001 2002 2003 2004 1995–2004
1999–2004
Lithuania 3.3 4.7 7.0 7.3 -1.7 3.9 6.4 6.8 9.7 7.1 5.4 5.3
Poland 7.0 6.0 6.8 4.8 4.1 4.0 1.0 1.4 3.8 5.3 4.4 3.3
Russia - 4.1 - 3.4 0.9 - 4.9 6.4 10.0 5.1 4.7 7.3 7.1 2.8 6.8
Kaliningrad -16.2 -14.2 - 4.5 - 9.5 6.8 14.4 6.0 9.5 11.5 12.3 1.5 10.1
Sources: UN Statistical Division and KRCS.
Interregional comparisons with the Russian North-West. Kaliningrad makes up part of the Russian North-West District together with nine other regions, including the city of St Petersburg. The North-West is one of the most dynamic federal districts in Russia. For example, in 2003 the North-West demonstrated the highest level of industrial growth (11.1%) and the second highest level of investment growth (23.2%) in the country.
All the areas of the North-West Region can be divided into three groups according to their specialisation:
• The first group is composed of regions with a distinctive export orientation. Metallurgy provided for 63.2% of the industrial production of the Vologodskaya oblast. The timber industry is decisive for Karelia, as 46.6% of its industrial production is generated by this sector. Komi possesses a developed oil-extraction industry as well as a strong mining sector (coal and bauxites). The Murmanskaya oblast lives on mining and fishing. All of these regions are dependent on the exports of raw materials and semi-finished goods.
• The second group is composed of regions with diversified economies, which combine production for both exports and the domestic market. These are the Arkhangelskaya and Novgorodskaya oblasts. Novgorod is especially interesting in this respect, as it has managed to attract relatively large foreign investments in the industrial sector, including construction materials, the chemical industry, food processing and machine-building. A total of $212.75 mn of foreign investment flowed into the Novgorod oblast in 2003, including $101.09 mn of FDI. Despite Novgorod’s smaller population (728,700), its foreign investment is four times higher and the share of the FDI is seven times greater than that in Kaliningrad.
• The third group has mostly developed industries that satisfy Russian domestic demands. These are the St Petersburg, Leningrad, Kaliningrad and Pskov oblasts. This group has shown the most dynamic growth in recent years. The leader of the group and of the whole of the North-West region is St Petersburg. In 2004, its GRP grew by 8.5% and its industrial production rose by 14.1%. The city’s economy attracted $950 mn of foreign investments. While 36% of the total investment of $4 bn went into construction, 19% into transport and 15% into industry, foreign investors preferred the industrial sector, which accumulated 77% of foreign investment – mostly machine-building, metallurgy and food processing. According to various sources, the investors, both foreign and Russian, prefer St Petersburg because of the substantial size of its market and its location as the ‘gate to Russia’. The presence of a large pool of qualified labour is judged a positive factor as well.
There are many other advantageous locations for import-substitution industries in the North-West as well as elsewhere in Russia. Investing in St Petersburg and Leningrad oblast, Novgorod or Moskovskaya oblast provides more long-term incentives than Kaliningrad could ever provide
KALININGRAD: ENCLAVES AND ECONOMIC INTEGRATION | 49
in vast markets, large pools of labour, including a qualified workforce and plenty of sources of intermediates; in other words, the full set of backward and forward linkages. The comparison with St Petersburg is instructive – while offering the location advantages of a ‘gate to Russia’, St Petersburg and Leningrad oblast maximise opportunities and minimise investment risks by offering larger labour pools and by avoiding foreign transit and other enclave-specific vulnerability factors. In pure market conditions, with no positive discrimination for Kaliningrad, the exclave would not be able to compete on the Russian market with these and other Russian regions on the mainland.
50 |
Chapter 3 Foreign trade and trade with mainland Russia:
An intermediate position between Russia and the EU
3.1 Commodities and the geographical structure of foreign trade The liberalisation of the economy and trade, coupled with customs preferences for Kaliningrad, resulted in the rapid growth of foreign trade in the first half of the 1990s. The total foreign trade turnover peaked in 1997 before subsiding owing to the consequences of the 1998 monetary crisis. The crisis had already given impetus to industrial growth, however, which resulted in even greater foreign trade flows from 2002 onwards.
Overall, one can distinguish two periods in the development of foreign trade in Kaliningrad, 1991–98 and 1999 onwards. In the first period, total foreign trade turnover had grown by more than 10 times as a result of the liberalisation of the economy and of trade. The default of August 1998 and the rouble’s devaluation led Russia in general and Kaliningrad in particular into the second period, as the SEZ and domestic (Russian) consumption growth became the locomotives of economic growth. The region slowly built up the volume of its exports, mainly through crude oil but also through exports of cellulose, fish and machine-building production. The principal phenomenon is a spectacular increase of imports to serve the needs of import-substitution industries in Kaliningrad, which emerged virtually from scratch.
Both periods have features in common. From 1995 onwards, the foreign trade balance was negative. Peaking at $824 mn (or 47.6%) in 1997, the negative balance was low for four consecutive years, until it jumped to over $1 bn in 2002 (Table 3.1 and Figure 3.1). It was almost $2 bn in 2004. Two factors explain the negative trade balance. First, the SEZ of Kaliningrad has been continuously misused as a convenient ‘gate’ to Russia; however, the relative importance of this factor has apparently subsided over the last few years. The second part of the explanation, and the more important factor, is the growing volumes of industrial outflows to mainland Russia and a change in the industrial orientation of the regional economy.
Foreign trade analysis gains in importance in the context of EU enlargement and Russia’s WTO accession. To simplify the discussion, it is possible to regard the Kaliningrad oblast as a quasi small state and to use theoretical findings from the theory of small states. Since Kaliningrad’s population fails to reach even a million, the region possesses a limited domestic market, which prevents it from attaining economies of scale in most industries. The region does not possess a sufficient resource base either. All this is typical of small states. The limits of the local market and resource base create a significant asymmetry between domestic production and consumption (Armstrong & Read, 1998). Trade plays a vital role in such an economy, since it supports the functioning of the economic system overall. Likewise, foreign trade as well as trade with the Russian regions on the mainland plays an extremely important role in the Kaliningrad economy. It is integrated, although in a special way, into the European economy. Nevertheless, as an integral part of the Russian Federation, the oblast maintains close economic ties with mainland Russia. These ties became even stronger at the beginning of the 21st century because of import substitution and Russian public and private investments in the region. External processes, such as the EU’s enlargement or Russia’s WTO accession, transform into economic shocks and have a sizeable impact on regional trade flows. It is crucial to examine both the external framework of Kaliningrad’s regional economy and the region’s trade to understand the complex effects of the former on the latter. Accessing regional trade flows can nevertheless be a tricky business, since statistics on trade are not entirely reliable and require additional interpretation (Box 3.1).
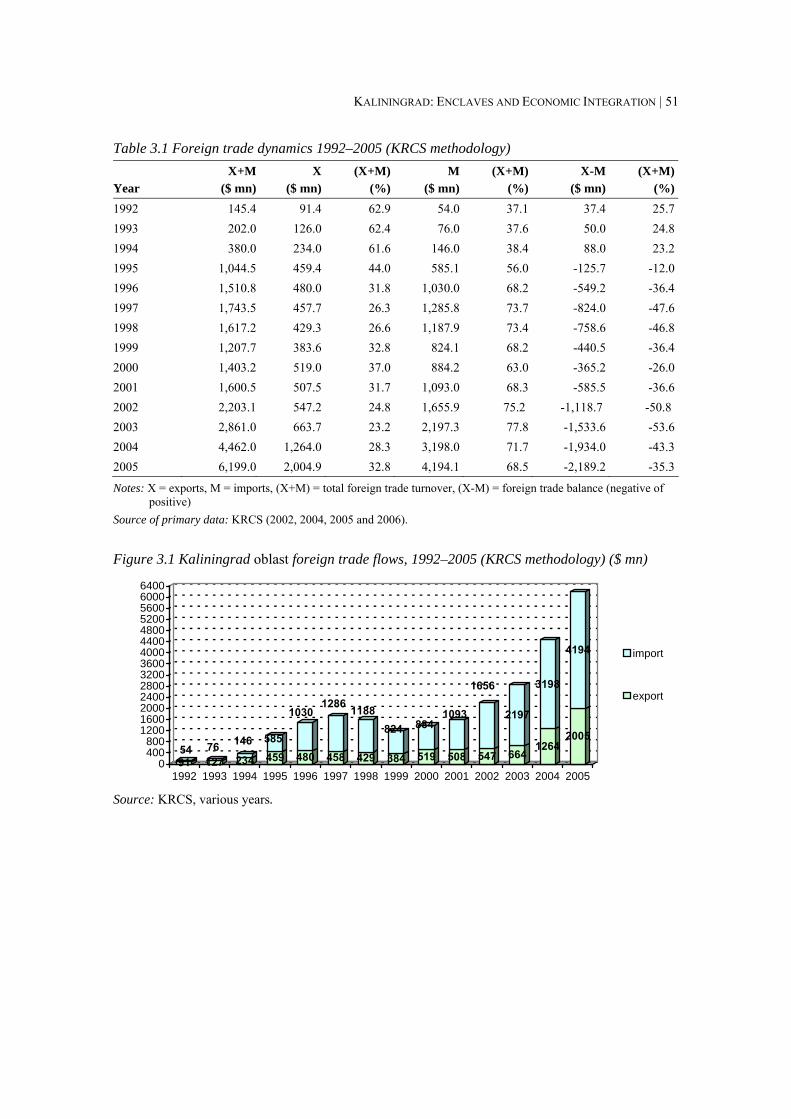
KALININGRAD: ENCLAVES AND ECONOMIC INTEGRATION | 51
Table 3.1 Foreign trade dynamics 1992–2005 (KRCS methodology)
Year X+M
($ mn) X
($ mn) (X+M)
(%)M
($ mn)(X+M)
(%)X-M
($ mn) (X+M)
(%)1992 145.4 91.4 62.9 54.0 37.1 37.4 25.71993 202.0 126.0 62.4 76.0 37.6 50.0 24.81994 380.0 234.0 61.6 146.0 38.4 88.0 23.21995 1,044.5 459.4 44.0 585.1 56.0 -125.7 -12.01996 1,510.8 480.0 31.8 1,030.0 68.2 -549.2 -36.41997 1,743.5 457.7 26.3 1,285.8 73.7 -824.0 -47.61998 1,617.2 429.3 26.6 1,187.9 73.4 -758.6 -46.81999 1,207.7 383.6 32.8 824.1 68.2 -440.5 -36.42000 1,403.2 519.0 37.0 884.2 63.0 -365.2 -26.02001 1,600.5 507.5 31.7 1,093.0 68.3 -585.5 -36.62002 2,203.1 547.2 24.8 1,655.9 75.2 -1,118.7 -50.8 2003 2,861.0 663.7 23.2 2,197.3 77.8 -1,533.6 -53.62004 4,462.0 1,264.0 28.3 3,198.0 71.7 -1,934.0 -43.32005 6,199.0 2,004.9 32.8 4,194.1 68.5 -2,189.2 -35.3
Notes: X = exports, M = imports, (X+M) = total foreign trade turnover, (Х-М) = foreign trade balance (negative of positive)
Source of primary data: KRCS (2002, 2004, 2005 and 2006).
Figure 3.1 Kaliningrad oblast foreign trade flows, 1992–2005 (KRCS methodology) ($ mn)
9154
12776
234
146459585
480
1030
458
1286
429
1188
384
824
519
884
508
1093
547
1656
664
2197
1264
3198
2005
4194
0400800
12001600200024002800320036004000440048005200560060006400
1992 1993 1994 1995 1996 1997 1998 1999 2000 2001 2002 2003 2004 2005
import
export
Source: KRCS, various years.
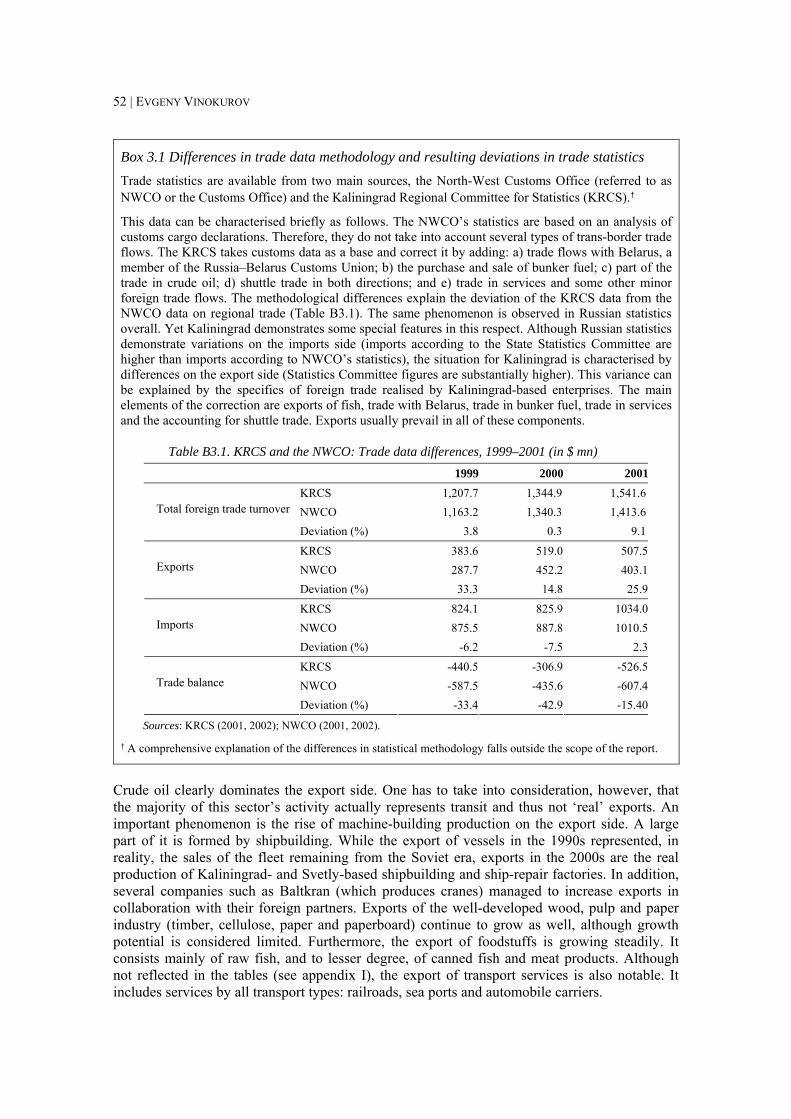
52 | EVGENY VINOKUROV
Box 3.1 Differences in trade data methodology and resulting deviations in trade statistics Trade statistics are available from two main sources, the North-West Customs Office (referred to as NWCO or the Customs Office) and the Kaliningrad Regional Committee for Statistics (KRCS).†
This data can be characterised briefly as follows. The NWCO’s statistics are based on an analysis of customs cargo declarations. Therefore, they do not take into account several types of trans-border trade flows. The KRCS takes customs data as a base and correct it by adding: a) trade flows with Belarus, a member of the Russia–Belarus Customs Union; b) the purchase and sale of bunker fuel; c) part of the trade in crude oil; d) shuttle trade in both directions; and e) trade in services and some other minor foreign trade flows. The methodological differences explain the deviation of the KRCS data from the NWCO data on regional trade (Table B3.1). The same phenomenon is observed in Russian statistics overall. Yet Kaliningrad demonstrates some special features in this respect. Although Russian statistics demonstrate variations on the imports side (imports according to the State Statistics Committee are higher than imports according to NWCO’s statistics), the situation for Kaliningrad is characterised by differences on the export side (Statistics Committee figures are substantially higher). This variance can be explained by the specifics of foreign trade realised by Kaliningrad-based enterprises. The main elements of the correction are exports of fish, trade with Belarus, trade in bunker fuel, trade in services and the accounting for shuttle trade. Exports usually prevail in all of these components.
Table B3.1. KRCS and the NWCO: Trade data differences, 1999–2001 (in $ mn) 1999 2000 2001
KRCS 1,207.7 1,344.9 1,541.6NWCO 1,163.2 1,340.3 1,413.6Total foreign trade turnover
Deviation (%) 3.8 0.3 9.1
KRCS 383.6 519.0 507.5 NWCO 287.7 452.2 403.1 Exports
Deviation (%) 33.3 14.8 25.9
KRCS 824.1 825.9 1034.0 NWCO 875.5 887.8 1010.5 Imports
Deviation (%) -6.2 -7.5 2.3
KRCS -440.5 -306.9 -526.5 NWCO -587.5 -435.6 -607.4 Trade balance
Deviation (%) -33.4 -42.9 -15.40
Sources: KRCS (2001, 2002); NWCO (2001, 2002).
† A comprehensive explanation of the differences in statistical methodology falls outside the scope of the report.
Crude oil clearly dominates the export side. One has to take into consideration, however, that the majority of this sector’s activity actually represents transit and thus not ‘real’ exports. An important phenomenon is the rise of machine-building production on the export side. A large part of it is formed by shipbuilding. While the export of vessels in the 1990s represented, in reality, the sales of the fleet remaining from the Soviet era, exports in the 2000s are the real production of Kaliningrad- and Svetly-based shipbuilding and ship-repair factories. In addition, several companies such as Baltkran (which produces cranes) managed to increase exports in collaboration with their foreign partners. Exports of the well-developed wood, pulp and paper industry (timber, cellulose, paper and paperboard) continue to grow as well, although growth potential is considered limited. Furthermore, the export of foodstuffs is growing steadily. It consists mainly of raw fish, and to lesser degree, of canned fish and meat products. Although not reflected in the tables (see appendix I), the export of transport services is also notable. It includes services by all transport types: railroads, sea ports and automobile carriers.
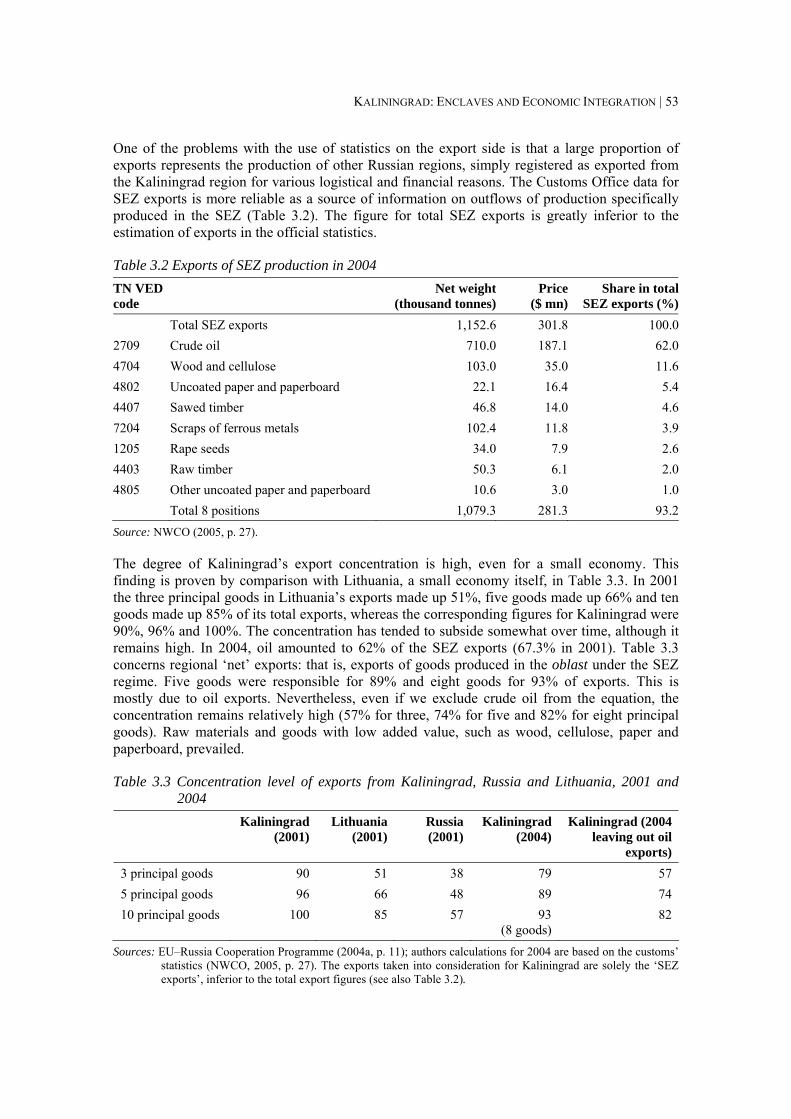
KALININGRAD: ENCLAVES AND ECONOMIC INTEGRATION | 53
One of the problems with the use of statistics on the export side is that a large proportion of exports represents the production of other Russian regions, simply registered as exported from the Kaliningrad region for various logistical and financial reasons. The Customs Office data for SEZ exports is more reliable as a source of information on outflows of production specifically produced in the SEZ (Table 3.2). The figure for total SEZ exports is greatly inferior to the estimation of exports in the official statistics.
Table 3.2 Exports of SEZ production in 2004 TN VED code
Net weight(thousand tonnes)
Price($ mn)
Share in totalSEZ exports (%)
Total SEZ exports 1,152.6 301.8 100.02709 Crude oil 710.0 187.1 62.04704 Wood and cellulose 103.0 35.0 11.64802 Uncoated paper and paperboard 22.1 16.4 5.44407 Sawed timber 46.8 14.0 4.67204 Scraps of ferrous metals 102.4 11.8 3.91205 Rape seeds 34.0 7.9 2.64403 Raw timber 50.3 6.1 2.04805 Other uncoated paper and paperboard 10.6 3.0 1.0 Total 8 positions 1,079.3 281.3 93.2Source: NWCO (2005, p. 27).
The degree of Kaliningrad’s export concentration is high, even for a small economy. This finding is proven by comparison with Lithuania, a small economy itself, in Table 3.3. In 2001 the three principal goods in Lithuania’s exports made up 51%, five goods made up 66% and ten goods made up 85% of its total exports, whereas the corresponding figures for Kaliningrad were 90%, 96% and 100%. The concentration has tended to subside somewhat over time, although it remains high. In 2004, oil amounted to 62% of the SEZ exports (67.3% in 2001). Table 3.3 concerns regional ‘net’ exports: that is, exports of goods produced in the oblast under the SEZ regime. Five goods were responsible for 89% and eight goods for 93% of exports. This is mostly due to oil exports. Nevertheless, even if we exclude crude oil from the equation, the concentration remains relatively high (57% for three, 74% for five and 82% for eight principal goods). Raw materials and goods with low added value, such as wood, cellulose, paper and paperboard, prevailed.
Table 3.3 Concentration level of exports from Kaliningrad, Russia and Lithuania, 2001 and 2004
Kaliningrad (2001)
Lithuania (2001)
Russia (2001)
Kaliningrad (2004)
Kaliningrad (2004 leaving out oil
exports) 3 principal goods 90 51 38 79 57 5 principal goods 96 66 48 89 74 10 principal goods 100 85 57 93
(8 goods) 82
Sources: EU–Russia Cooperation Programme (2004a, p. 11); authors calculations for 2004 are based on the customs’ statistics (NWCO, 2005, p. 27). The exports taken into consideration for Kaliningrad are solely the ‘SEZ exports’, inferior to the total export figures (see also Table 3.2).
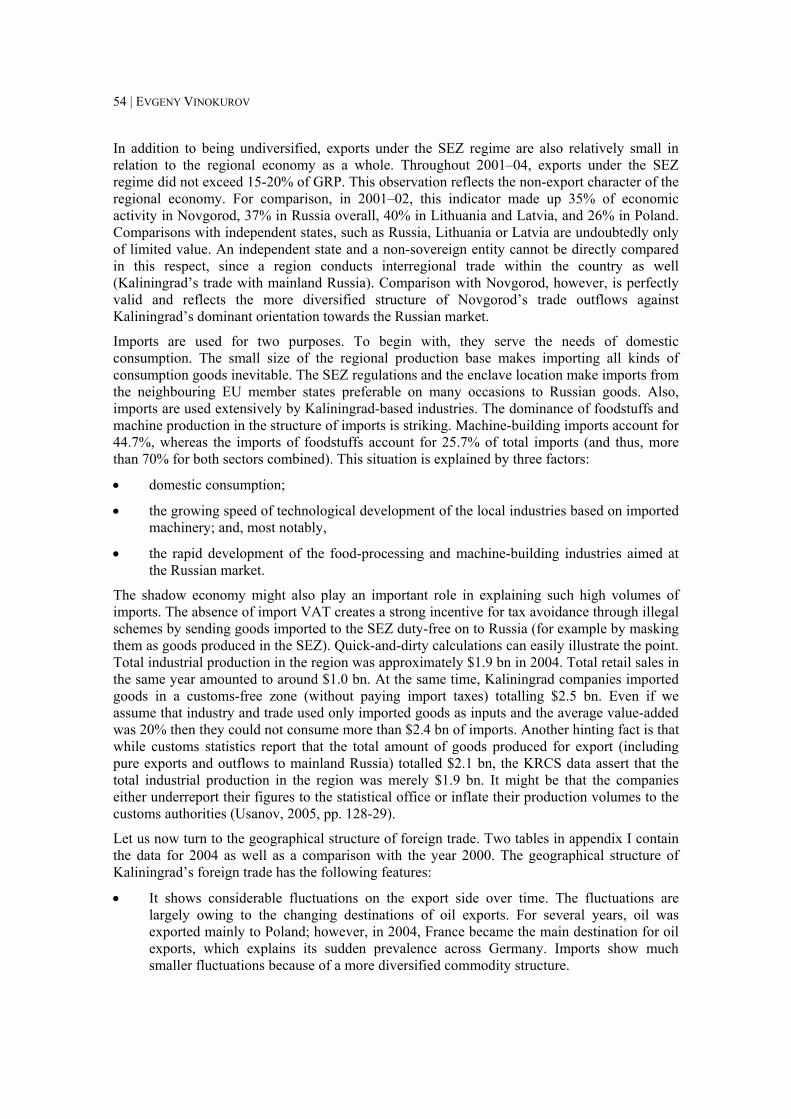
54 | EVGENY VINOKUROV
In addition to being undiversified, exports under the SEZ regime are also relatively small in relation to the regional economy as a whole. Throughout 2001–04, exports under the SEZ regime did not exceed 15-20% of GRP. This observation reflects the non-export character of the regional economy. For comparison, in 2001–02, this indicator made up 35% of economic activity in Novgorod, 37% in Russia overall, 40% in Lithuania and Latvia, and 26% in Poland. Comparisons with independent states, such as Russia, Lithuania or Latvia are undoubtedly only of limited value. An independent state and a non-sovereign entity cannot be directly compared in this respect, since a region conducts interregional trade within the country as well (Kaliningrad’s trade with mainland Russia). Comparison with Novgorod, however, is perfectly valid and reflects the more diversified structure of Novgorod’s trade outflows against Kaliningrad’s dominant orientation towards the Russian market.
Imports are used for two purposes. To begin with, they serve the needs of domestic consumption. The small size of the regional production base makes importing all kinds of consumption goods inevitable. The SEZ regulations and the enclave location make imports from the neighbouring EU member states preferable on many occasions to Russian goods. Also, imports are used extensively by Kaliningrad-based industries. The dominance of foodstuffs and machine production in the structure of imports is striking. Machine-building imports account for 44.7%, whereas the imports of foodstuffs account for 25.7% of total imports (and thus, more than 70% for both sectors combined). This situation is explained by three factors:
• domestic consumption;
• the growing speed of technological development of the local industries based on imported machinery; and, most notably,
• the rapid development of the food-processing and machine-building industries aimed at the Russian market.
The shadow economy might also play an important role in explaining such high volumes of imports. The absence of import VAT creates a strong incentive for tax avoidance through illegal schemes by sending goods imported to the SEZ duty-free on to Russia (for example by masking them as goods produced in the SEZ). Quick-and-dirty calculations can easily illustrate the point. Total industrial production in the region was approximately $1.9 bn in 2004. Total retail sales in the same year amounted to around $1.0 bn. At the same time, Kaliningrad companies imported goods in a customs-free zone (without paying import taxes) totalling $2.5 bn. Even if we assume that industry and trade used only imported goods as inputs and the average value-added was 20% then they could not consume more than $2.4 bn of imports. Another hinting fact is that while customs statistics report that the total amount of goods produced for export (including pure exports and outflows to mainland Russia) totalled $2.1 bn, the KRCS data assert that the total industrial production in the region was merely $1.9 bn. It might be that the companies either underreport their figures to the statistical office or inflate their production volumes to the customs authorities (Usanov, 2005, pp. 128-29).
Let us now turn to the geographical structure of foreign trade. Two tables in appendix I contain the data for 2004 as well as a comparison with the year 2000. The geographical structure of Kaliningrad’s foreign trade has the following features:
• It shows considerable fluctuations on the export side over time. The fluctuations are largely owing to the changing destinations of oil exports. For several years, oil was exported mainly to Poland; however, in 2004, France became the main destination for oil exports, which explains its sudden prevalence across Germany. Imports show much smaller fluctuations because of a more diversified commodity structure.
KALININGRAD: ENCLAVES AND ECONOMIC INTEGRATION | 55
• Kaliningrad’s foreign trade is rather concentrated. About 70% of both exports and imports are with the top 10 countries. The EU dominates the foreign trade flows of the region. In 2004, the EU accounted for 75.6% of exports and 65.7% of imports. These figures include 16.2% of exports to and 25.8% of imports from the 10 Central and Eastern European countries (CEEC-10, the EU accession countries of the 2004 wave).
• The main trade partners, with slight variations over the years, were Germany, Poland and Lithuania.
• On the other hand, countries from the Commonwealth of Independent States (CIS) are less important. In 2000, 5.8% of total foreign trade turnover was realised with the CIS. This figure fell to 2.9% in 2004 (4.5% of exports and 2.3% of imports). The main trade partners in the CIS are Belarus and Ukraine.
In 2001 Poland took first place in the total trade turnover with the oblast ($281.3 mn), Germany took the second position ($268.8 mn) and Lithuania was at third place ($113.4 mn). These three countries are Kaliningrad’s traditional foreign trade partners. Poland has been the main importer of production from the Kaliningrad region for a number of years (due to crude oil export), while Germany had always been the main import supplier of the region. By 2004, Germany had become the indisputable leader in Kaliningrad’s foreign trade. Its leadership on the export side is mostly related to re-directing of oil exports from Poland to the countries of Western Europe (including Germany), over recent years. Leaving out oil exports, Germany is still the number one export partner, although with a narrower margin over Lithuania. Germany is also leading on the import side, since it is the major supplier of machinery to the region. Poland (with $486.6 mn of foreign trade turnover) and Lithuania (with around $313.0 mn) are the second and the third most important trade partners. Foreign trade with these neighbouring countries is more diversified. Imports of foodstuffs for the Kaliningrad-based food-processing industry are important on the import side.
In terms of diversity, foreign trade with Germany is more concentrated, while trade flows with Poland and Lithuania are more varied (see Table A1.8 in appendix I). On the export side, crude oil dominates exports to Germany (as previously noted, the destinations of crude oil export are not stable). The second product is peat. Third, there has been a remarkably fast growth of rape exports among agricultural products. Rape has become one of the very few agricultural products (along with furs and leather) that has managed to penetrate the market of the EU-15 and the accession countries. Poland imports oil, timber, paper and paperboard from the Kaliningrad region. Raw materials for the amber industry are supplied as well. As for first-quality amber for jewellery, given that it has been smuggled in great quantities, it barely appears in the trade statistics. Exports to Lithuania are more diversified and less raw materials-oriented. The structure of exports to the northern neighbour changed significantly in 2002–04, as Kaliningrad’s regional economy developed and changed rapidly. Earlier, it was dominated by the wood sector (comprising timber, cellulose, paper and paperboard, toilet paper, tissues and wallpaper) making up about 40% of the total volume, and later by fresh, chilled and frozen fish. Qualitative changes that have occurred happened in recent years have led to the disappearance of fish from exports to Lithuania, since fish catches are now sold elsewhere or increasingly used by Kaliningrad-based fish-processing plants. The wood sector hangs on to its traditional importance. In addition, exports of machinery and consumer electronics are gaining prominence.
The commodity structure of imports from the three leading trade partners shows the importance of imported components for regional industries that target the Russian market. Of the imports from Germany, 62% are in the machine-building sector. All three trade partners are crucial
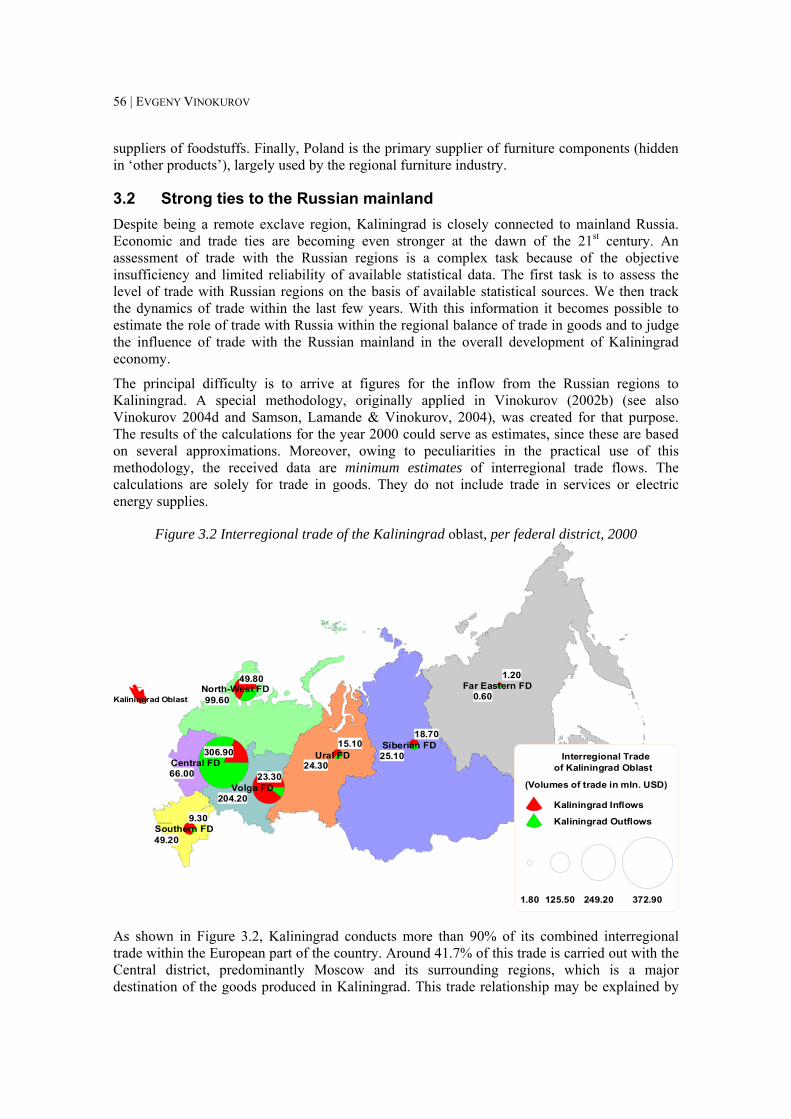
56 | EVGENY VINOKUROV
suppliers of foodstuffs. Finally, Poland is the primary supplier of furniture components (hidden in ‘other products’), largely used by the regional furniture industry.
3.2 Strong ties to the Russian mainland Despite being a remote exclave region, Kaliningrad is closely connected to mainland Russia. Economic and trade ties are becoming even stronger at the dawn of the 21st century. An assessment of trade with the Russian regions is a complex task because of the objective insufficiency and limited reliability of available statistical data. The first task is to assess the level of trade with Russian regions on the basis of available statistical sources. We then track the dynamics of trade within the last few years. With this information it becomes possible to estimate the role of trade with Russia within the regional balance of trade in goods and to judge the influence of trade with the Russian mainland in the overall development of Kaliningrad economy.
The principal difficulty is to arrive at figures for the inflow from the Russian regions to Kaliningrad. A special methodology, originally applied in Vinokurov (2002b) (see also Vinokurov 2004d and Samson, Lamande & Vinokurov, 2004), was created for that purpose. The results of the calculations for the year 2000 could serve as estimates, since these are based on several approximations. Moreover, owing to peculiarities in the practical use of this methodology, the received data are minimum estimates of interregional trade flows. The calculations are solely for trade in goods. They do not include trade in services or electric energy supplies.
Figure 3.2 Interregional trade of the Kaliningrad oblast, per federal district, 2000
Kaliningrad Oblast
Ре сп уб л ик а А д ыге я
Far Eastern FD
Siberian FDUral FD
North-West FD
Southern FD
Volga FD
Central FD
18.70
1.20
15.10
49.80
23.30
9.30
306.90 25.10
0.60
24.30
99.60
204.20
49.20
66.00
Interregional Trade of Kaliningrad Oblast
(Volumes of trade in mln. USD)
Kaliningrad Inflows
Kaliningrad Outflows
1.80 125.50 249.20 372.90
As shown in Figure 3.2, Kaliningrad conducts more than 90% of its combined interregional trade within the European part of the country. Around 41.7% of this trade is carried out with the Central district, predominantly Moscow and its surrounding regions, which is a major destination of the goods produced in Kaliningrad. This trade relationship may be explained by
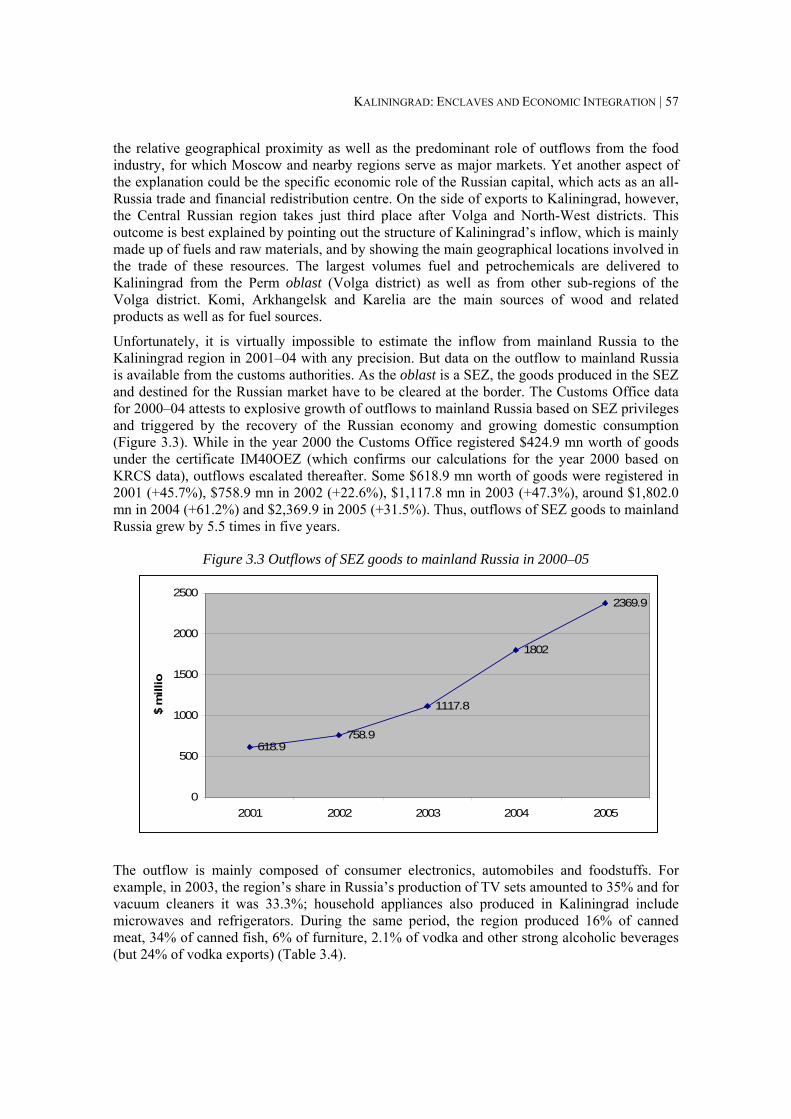
KALININGRAD: ENCLAVES AND ECONOMIC INTEGRATION | 57
the relative geographical proximity as well as the predominant role of outflows from the food industry, for which Moscow and nearby regions serve as major markets. Yet another aspect of the explanation could be the specific economic role of the Russian capital, which acts as an all-Russia trade and financial redistribution centre. On the side of exports to Kaliningrad, however, the Central Russian region takes just third place after Volga and North-West districts. This outcome is best explained by pointing out the structure of Kaliningrad’s inflow, which is mainly made up of fuels and raw materials, and by showing the main geographical locations involved in the trade of these resources. The largest volumes fuel and petrochemicals are delivered to Kaliningrad from the Perm oblast (Volga district) as well as from other sub-regions of the Volga district. Komi, Arkhangelsk and Karelia are the main sources of wood and related products as well as for fuel sources.
Unfortunately, it is virtually impossible to estimate the inflow from mainland Russia to the Kaliningrad region in 2001–04 with any precision. But data on the outflow to mainland Russia is available from the customs authorities. As the oblast is a SEZ, the goods produced in the SEZ and destined for the Russian market have to be cleared at the border. The Customs Office data for 2000–04 attests to explosive growth of outflows to mainland Russia based on SEZ privileges and triggered by the recovery of the Russian economy and growing domestic consumption (Figure 3.3). While in the year 2000 the Customs Office registered $424.9 mn worth of goods under the certificate IM40OEZ (which confirms our calculations for the year 2000 based on KRCS data), outflows escalated thereafter. Some $618.9 mn worth of goods were registered in 2001 (+45.7%), $758.9 mn in 2002 (+22.6%), $1,117.8 mn in 2003 (+47.3%), around $1,802.0 mn in 2004 (+61.2%) and $2,369.9 in 2005 (+31.5%). Thus, outflows of SEZ goods to mainland Russia grew by 5.5 times in five years.
Figure 3.3 Outflows of SEZ goods to mainland Russia in 2000–05
618.9758.9
1117.8
1802
2369.9
0
500
1000
1500
2000
2500
2001 2002 2003 2004 2005
$ m
illio
The outflow is mainly composed of consumer electronics, automobiles and foodstuffs. For example, in 2003, the region’s share in Russia’s production of TV sets amounted to 35% and for vacuum cleaners it was 33.3%; household appliances also produced in Kaliningrad include microwaves and refrigerators. During the same period, the region produced 16% of canned meat, 34% of canned fish, 6% of furniture, 2.1% of vodka and other strong alcoholic beverages (but 24% of vodka exports) (Table 3.4).
58 | EVGENY VINOKUROV
Table 3.4 Outflows to mainland Russia under the SEZ regime, 2004 TN VED code
Price($ mn)
Share in total outflows (%)
Total 1,802.0 100.08528 TV sets 376.2 20.98703 Passenger vehicles 277.4 15.41602 Other ready-to-use or canned meat products 223.1 12.41604 Ready-to-use or canned fish products; caviar 131.5 7.39403 Other furniture and parts 61.9 3.41517 Margarine 60.2 3.30210 Meat and meat sub-products (salted, corned, pickled, dried) 52.1 2.92203 Beer 45.8 2.55703 Carpets and other textile floor covers 41.7 2.38537 Control panels, consoles and other foundations for electric
apparatus 39.3 2.2
2309 Products for animal feeding 32.0 1.88418 Refrigerators, freezers 25.5 1.44418 Wooden units for construction industry 21.0 1.24802 Uncoated paper and paperboard 21.0 1.28509 Home appliances with built-in electric motors 20.9 1.28431 Parts for the 8425-8430 positions (precision machinery, such as
winches, elevators, production belts) 20.7 1.2
0303 Frozen fish, except fish filet 20.5 1.19401 Sitting furniture 19.6 1.11601 Sausages and analogous products 18.4 1.0 Total for the 19 product groups 1,509.1 83.7Source: NWCO (2005).
3.3 An undeveloped trade in services The level of foreign trade in services is small, with $89.9 mn on the export side and $55.4 mn on the import side in 2003. Yet it is important in some respects.
• While being insignificant in relative terms on the import side (2.8% in 1996, 1.2% in 2000 and 2.5% in 2003), the exports of services are strong (13.5% in 1996, 8.4% in 2000 and 13.5% again in 2003).
• Foreign trade in services has traditionally produced a strong positive balance with the exception of 1997. The positive balance in 2003 was $34.5 mn.
• The largest share of trade in services takes place with the major trade partners, especially Poland, alongside Lithuania and Germany. The weight of the CIS states is even smaller than in the trade in goods (exports of $1.1 mn and imports of $4.0 mn in 2003) (Table 3.5).
• Transportation services dominate the structure of foreign trade in services on both the export and the import sides. For example, transportation was responsible for 78.5% of imports and 96% of exports in 2000 (data for recent years is unavailable).
KALININGRAD: ENCLAVES AND ECONOMIC INTEGRATION | 59
• Consequently, exports and imports of services are strongly linked to the rise of trade in goods. There are no significant independent components that could be capable of sustaining growth. The only exception is tourism; however, tourism is still modest and owing to a variety factors, badly reflected in the statistics.
The liberalisation of services within the framework of Russia’s WTO accession will likely become a major factor of economic growth in the medium term. The second relevant issue is the one of EU standards and the ability of Kaliningrad-based businesses to become providers of services for EU consumers, notably in the spheres of transportation and tourism.
Table 3.5 Foreign trade in services, 1995–2005 (in $ mn) 1995 1996 1997 1998 1999 2000 2001 2002 2003 2004 2005
Export: 58.8 65.0 67.9 78.0 61.3 43.8 52.2 76.6 89.9 89.5 179.3 Non-CIS
states –
–
66.8
77.6
61.0
39.9
51.4
75.6
88.8
88.8
178.4
CIS states – – 0.1 0.4 0.3 3.9 0.8 1.0 1.1 0.7 0.9
Import: 29.2 28.4 76.6 39.0 13.5 9.5 46.2 45.8 55.4 65.3 117.0 Non-CIS
states –
–
72.6
38.3
13.4
9.2 – 40.8 51.4
60.3
109.8
CIS states – – 4.0 4.0 0.1 0.3 8.2 5.0 4.0 5.0 7.2
Source: KRCS (2001, p. 180; 2004, p. 265).
3.4 Trade forecasts Forecasting on the basis of exponential equations is a simple tool that, among other applications, can be applied to forecasts of trade flows. Two models for total foreign trade flows and for the SEZ outflow to mainland Russia are presented below, with the equations used to calculate them. On the basis of these models, we have produced estimations for 2005–07. The equations fit the actual data quite nicely. The continuation of the trend would produce $5,741 mn, $7,817 mn and $10,293 mn of total foreign trade flows for 2005, 2006 and 2007, respectively (Table 3.6 and Figure 3.4). Thus, the expected rise would be a multiplication by approximately 2.5 in three years. The forecast for trade with mainland Russia foresees an even steeper increase in outflows to the mainland at the rate of $2,368 mn, $3,354 mn and $4,751 mn respectively, thus a multiplication by 3 in three years (Table 3.7 and Figure 3.5).
The equation used to forecast total trade turnover in Table 3.6 is
y = 199.57x2 – 518.11x + 1664.9, R2 = 0.9968. (3)
Table 3.6 Total foreign trade turnover, actual (up to 2005) and forecast values (in $ mn) Year Actual data Forecast 2000 1,340.7 1,346.4 2001 1,411.3 1,427.0 2002 1,987.5 1,906.7 2003 2,693.5 2,785.6 2004 4,096.2 4,063.6 2005 5,684.4 5,740.8 2006 – 7,817.1 2007 – 10,292.5
Source: Author’s calculations.
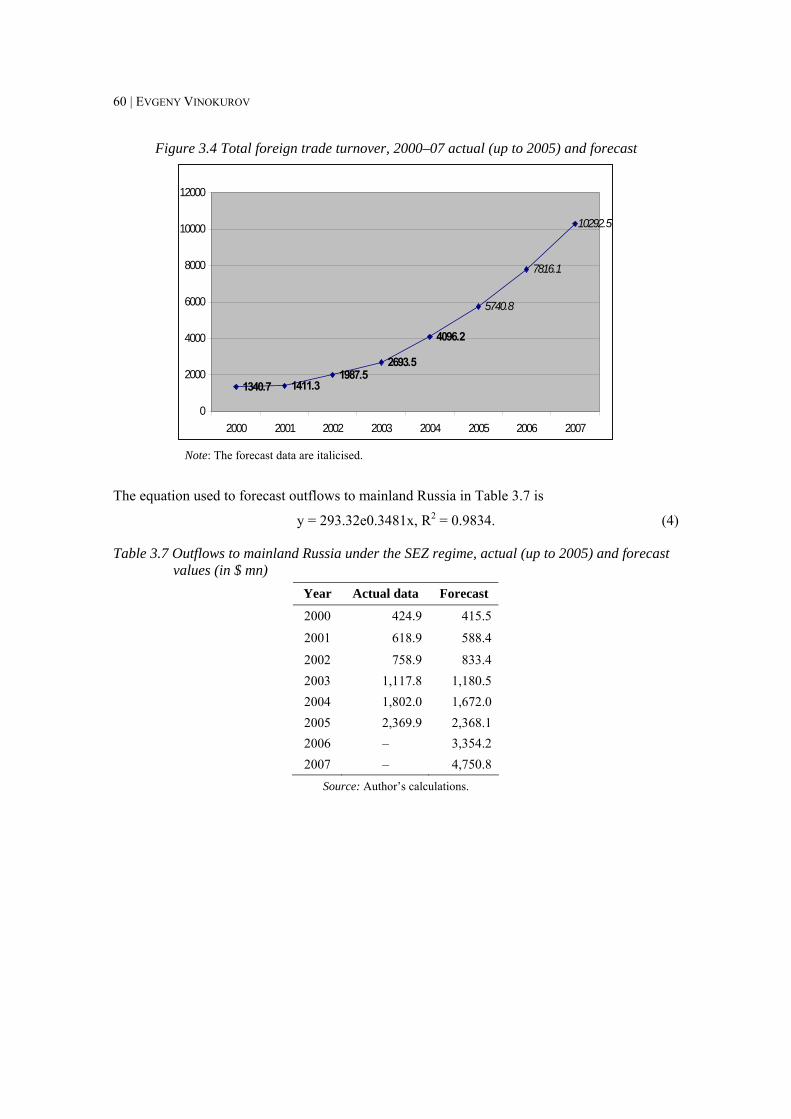
60 | EVGENY VINOKUROV
Figure 3.4 Total foreign trade turnover, 2000–07 actual (up to 2005) and forecast
1340.7 1411.31987.5
2693.5
4096.2
10292.5
7816.1
5740.8
0
2000
4000
6000
8000
10000
12000
2000 2001 2002 2003 2004 2005 2006 2007
Note: The forecast data are italicised.
The equation used to forecast outflows to mainland Russia in Table 3.7 is
y = 293.32e0.3481x, R2 = 0.9834. (4)
Table 3.7 Outflows to mainland Russia under the SEZ regime, actual (up to 2005) and forecast values (in $ mn)
Year Actual data Forecast
2000 424.9 415.5
2001 618.9 588.4
2002 758.9 833.4 2003 1,117.8 1,180.5 2004 1,802.0 1,672.0 2005 2,369.9 2,368.1 2006 – 3,354.2 2007 – 4,750.8
Source: Author’s calculations.
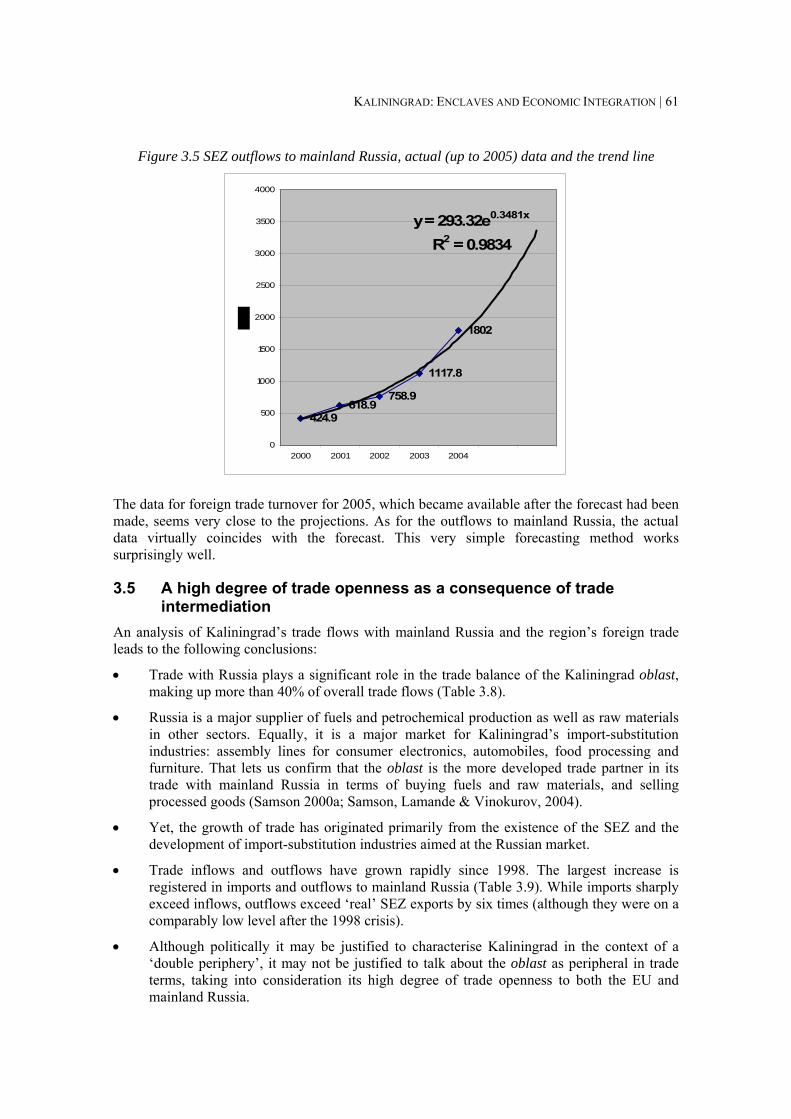
KALININGRAD: ENCLAVES AND ECONOMIC INTEGRATION | 61
Figure 3.5 SEZ outflows to mainland Russia, actual (up to 2005) data and the trend line
424.9618.9
758.9
1117.8
1802
y = 293.32e0.3481x
R2 = 0.9834
0
500
1000
1500
2000
2500
3000
3500
4000
2000 2001 2002 2003 2004
The data for foreign trade turnover for 2005, which became available after the forecast had been made, seems very close to the projections. As for the outflows to mainland Russia, the actual data virtually coincides with the forecast. This very simple forecasting method works surprisingly well.
3.5 A high degree of trade openness as a consequence of trade intermediation
An analysis of Kaliningrad’s trade flows with mainland Russia and the region’s foreign trade leads to the following conclusions:
• Trade with Russia plays a significant role in the trade balance of the Kaliningrad oblast, making up more than 40% of overall trade flows (Table 3.8).
• Russia is a major supplier of fuels and petrochemical production as well as raw materials in other sectors. Equally, it is a major market for Kaliningrad’s import-substitution industries: assembly lines for consumer electronics, automobiles, food processing and furniture. That lets us confirm that the oblast is the more developed trade partner in its trade with mainland Russia in terms of buying fuels and raw materials, and selling processed goods (Samson 2000a; Samson, Lamande & Vinokurov, 2004).
• Yet, the growth of trade has originated primarily from the existence of the SEZ and the development of import-substitution industries aimed at the Russian market.
• Trade inflows and outflows have grown rapidly since 1998. The largest increase is registered in imports and outflows to mainland Russia (Table 3.9). While imports sharply exceed inflows, outflows exceed ‘real’ SEZ exports by six times (although they were on a comparably low level after the 1998 crisis).
• Although politically it may be justified to characterise Kaliningrad in the context of a ‘double periphery’, it may not be justified to talk about the oblast as peripheral in trade terms, taking into consideration its high degree of trade openness to both the EU and mainland Russia.
62 | EVGENY VINOKUROV
Table 3.8 Kaliningrad oblast total trade flows, 1999–2004 (in $ mn) World – Kaliningrad Russia – Kaliningrad Year
X M X M 1998 297.5 1,130.1 – – 1999 281.7 800.1 – – 2000 430.7 807.3 432.2*(424.9 SEZ) 468.9a) 2001 403.1 1,010.5 618.9 (SEZ) – 2002 408.5 1,578.5 758.9 (SEZ) – 2003 555.4 2,138.1 1,117.8(SEZ) 800 b) 2004 1,089.4 3,006.8 1,802.0(SEZ) – 2005 1,710.6 3,973.8 2,369.9 (SEZ) –
a) Author’s calculations for the 2000 data for trade with mainland Russia (Vinokurov, 2002b) b) Estimation by Gareev, Zhdanov & Fedorov (2005). Source: NWCO (2001–06);
Table 3.9 Trade flows as a percentage share of GRP (in %, GRP = 100%) 1997 1998 1999 2000 2001 2002 2003 2004
Foreign trade Foreign trade turnover
118 171 177 154 140 152 158
Total exports 24 36 44 52 46 31 33 50 Total imports 92 132 125 94 94 121 126 141 Foreign trade balance
-70 -99 -89 -50 -48 -89 -93 -90
Trade with mainland Russia Deliveries of goods to Russia under the IM40 SEZ customs procedures*
–
–
– 49 56
58
66 84
For reference GRP at official exchange rate ($ mn)
1,403 898 655 874 1,100
1,309
1,702 2,137
* The IM40 SEZ certificate refers to goods “considered to be produced in the SEZ”. Sources: KRCS (2001–05) for GRP calculations; NWCO (2001–05) for trade flows; author’s calculations.
Kaliningrad’s high degree of regional trade openness is connected with the SEZ regime and with the intermediary trade orientation of the regional economy.
New calculations for trade flows with Russia allow us to re-assess Kaliningrad’s trade openness. Typically, the trade openness indicator is calculated for countries following the formula of
2∗+
=GRP
MXTO (5)
The formula needs to be adapted to the regional context to include trade flows with the rest of the same country.
KALININGRAD: ENCLAVES AND ECONOMIC INTEGRATION | 63
2∗+++
=GRP
MXMXTO rusrusregion
(6)
where Xrus and Mrus correspond to trade with other regions of the same country, Russia in our case. The trade openness of the Kaliningrad region amounted to 133.5% in the year 2000 if we take official figures for the GRP (Table 3.10). That means that the total trade flows (with both foreign states and mainland Russia) were more than double (2.67) the GRP. Trade flows with mainland Russia add significantly to regional trade openness, making the oblast the third most open region of the Russian Federation in 2000 (after Ingushetia and Kalmykia, which have obtained their highest degrees of trade openness owing to their functions as tax havens (TACIS, 2002a)).
Table 3.10 Trade openness, 2000 and 2003 GRP ($ mn) Total trade ($ mn) TO (%)
2000, current prices 837.6 2,241.7 133.5 2003, current prices 1,702.2 4,611.3 135.5 2000, PPP 6,025.0* 2,241.7 18.6
* The figure for GRP 2000 according to PPP is derived from author’s calculations based on Samson et al. (2002). Source: Author’s calculations.
By using customs data for outflows to the mainland and the estimation by Gareev, Zhdanov & Fedorov (2005) for inflows from the mainland, an estimation for the regional trade openness can be produced for 2003. Despite rapid growth and profound changes in trade, the regional trade specialisation apparently remained at the same level, amounting to 135.5%. In other words, total trade flows (both with foreign states and with mainland Russia) exceeded GRP by 2.71 times in 2003.
We cannot measure the degree of trade openness for 2001 onwards, since the data on the inflows from mainland Russian is missing, making the total trade data incomplete. Estimations assume that, despite a sharp increase of GRP measured at the official exchange rate in 2001–04, the degree of trade openness remained at the same level. In international comparisons, Kaliningrad’s trade openness exceeds those of the small open economies of the Baltic such as Estonia (at 93%, Estonia is the most open among the CEECs), Latvia (60.3%) and Lithuania (45%), although the trade openness of the ‘Baltic tigers’ markedly exceeds that of Kaliningrad in PPP terms. It is comparable to that of Hong Kong. In Hong Kong, trade in goods and non-factor services reached 277% of GDP in 2001 (WTO, 2002). The comparison of Hong Kong with Kaliningrad is justified in this case since the WTO’s calculations for the former include trade with mainland China as well as trade with the rest of the world. The comparison is not straightforward, however, because trade in non-factor services is included in Hong Kong’s figure.

64 |
Chapter 4
Factors of regional competitiveness
4.1 Introduction Chapters 2 and 3 described the major shift that Kaliningrad has experienced in its economic orientation towards the tertiary sector. A new and distinctive industrial orientation has emerged based on a role as an intermediary in EU–Russian trade. The intention of this chapter is to quantify the region’s comparative and competitive advantages as well as its production factors and resources. Based on this investigation, we can determine whether the current orientation corresponds with the factors mentioned above. Is there coherence or contradiction? Also, it is important to identify the kinds resources and competitive advantages that are currently built into the region.
In this chapter, both macroeconomic (revealed comparative advantages and intensity of intra-industry trade (IIT)) and microeconomic (factor endowment and factor costs) indicators are elaborated in order to assess the comparative and competitive advantages of the Kaliningrad region. The chapter also looks at the SEZ regime as a defining factor of Kaliningrad’s current competitiveness. Additionally, we consider the quantification of exclave costs and respective issues of cargo and passenger transit as well as border trade.
The first task is to reveal the structure of Kaliningrad’s comparative advantages, for which a measurement of IIT and comparative advantage is undertaken. The second task is to identify the basic factor endowments and their role in regional competitiveness. Furthermore, one key question is to what extent the competitiveness of the region is underpinned by the mere factor endowments. Historically, national (regional) competitiveness has been determined by the availability of raw materials. Yet with scientific and technical progress, the availability of traditional factors has become of limited value.
There exists a vast body of literature on the measurement of comparative advantages and international specialisation. Given that the Lloyd-Grubel index of IIT and the Lafay index of international specialisation are specifically calculated here, Balassa (1965), Lafay (1979), Lafay & Herzog (1989) and OECD (2002) are particularly important. There is also a body of literature on the measurement of Russia’s and Kaliningrad’s indices of international specialisation, notably Ahrend (2004) and OECD (2004) for Russia among the latest publications as well as Samson (2000a and 2000b) and TACIS (2002a) for Kaliningrad. As regards the factor endowment and factor costs, this presentation of labour productivity issues in Kaliningrad is largely based on the work done by the Kaliningrad Regional Development Agency (RDA) and the project “Support for the Regional Development of Kaliningrad, Russia” (EUROPEAID/114287/C/SV/RU). The results were summarised in the 5th Economic Bulletin published by the EU–Russia Cooperation Programme (2004d). In addition, the collective work by the Institute for Economy in Transition attempted to analyse the regional competitive advantage citing labour costs, energy tariffs and the relative weight of students among the population as important factors (IET, 2002). TACIS (2002b) experts devoted serious attention to the problem of investment attractiveness from the viewpoint of the factors of regional competitiveness. The central methodology applied below is that of the French economists Colletis & Pecqueur (1994), who elaborated an analytical framework based on the typology of regional competitive factors in terms of generic and specific resources and assets. Pecqueur’s framework was applied to the Kaliningrad case by Samson (2000a and 2000b). The high road of economic transition is seen as moving from specialisation based on generic resources to one that is based on specific assets.
KALININGRAD: ENCLAVES AND ECONOMIC INTEGRATION | 65
Measurement of the revealed comparative advantage (RCA) is a classic method for the analysis of international specialisation. A variety of indices exists. The task of assessing the comparative advantage and the economic orientation of the Kaliningrad region is complicated by the fact that it is not a country but a part of a country. It is necessary to select and adjust the index methodologies that would allow us to measure the situation in a region in view of the scope of available data. We use two indices to assess the comparative international specialisation and IIT. They are partially modified to adapt them to the measurement of the comparative advantage and international economic orientation of a region and not a country. We start by calculating the Lafay indicator for assessing trade specialisation based on the methodology by Lafay (particularly Lafay & Herzog, 1989). Then, we calculate a Lloyd-Grubel index for measuring IIT in the interpretation employed by OECD (2002).
4.2 Measurement of comparative advantages, international specialisation and intra-industry trade
Lafay index of international comparative advantage The measurement of the international specialisation of a country is based on different indicators and ratios, each possessing its own strengths and weaknesses. The measurement of the international specialisation of a region is further complicated by its inclusion in the national economics. One should also account for the multitude of economic dimensions of a country or a region. When the ratio relies solely on trade flows, it can be biased since an increase of inter-branch flows will reduce the values of the ratio without meaning a drop in competitiveness. The following procedure was designed to account for these problems. The methodology is adopted from the work of Lafay, most notably Lafay & Herzog (1989, pp. 390-92). This methodology used was initially applied to Kaliningrad in Samson et al. (1998) and TACIS (2002a) on a lower level of aggregation (mostly the two-digit tariff nomenclature (TN VED) code). It is applied on a higher level of aggregation (10 sectors) and then this measurement is introduced to the complete regional trade for 2000, i.e. including trade with mainland Russia.
We use the following symbols:
T – foreign trade turnover (X+M)
GRP – gross regional product
X – export of goods and services
M – import of goods and services
Xi – export of i-type of goods and services
Mi – import of i-type of goods and services
To account for the bias of ratios based on external trade flows, the methodology provides for the correction of the external balance of a product by the size of the GRP – thus deriving a relative balance:
yi=1000*(Xi-Mi)/GRP (7)
The yi is comparable in time and space, allowing us to describe, in a specific manner, year on year, the relative dimension of trade in a certain product or sector.
One should also eliminate the impact of external macroeconomic factors that could imbalance the foreign trade. A balanced trade situation (gi) is taken as a reference. Foreign trade is used as a weighting base:
gi=(Xi+Mi)/X+M (8)
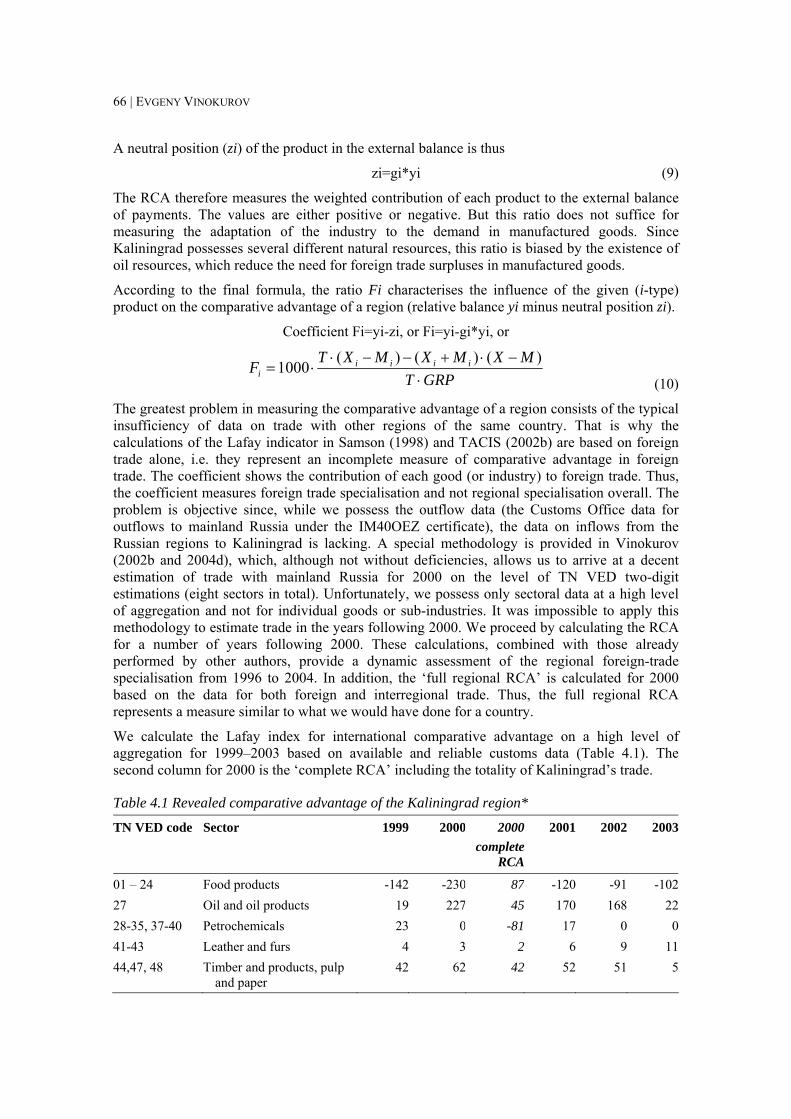
66 | EVGENY VINOKUROV
A neutral position (zi) of the product in the external balance is thus
zi=gi*yi (9)
The RCA therefore measures the weighted contribution of each product to the external balance of payments. The values are either positive or negative. But this ratio does not suffice for measuring the adaptation of the industry to the demand in manufactured goods. Since Kaliningrad possesses several different natural resources, this ratio is biased by the existence of oil resources, which reduce the need for foreign trade surpluses in manufactured goods.
According to the final formula, the ratio Fi characterises the influence of the given (i-type) product on the comparative advantage of a region (relative balance yi minus neutral position zi).
Coefficient Fi=yi-zi, or Fi=yi-gi*yi, or
GRPTMXMXMXTF iiii
i ⋅−⋅+−−⋅
⋅=)()()(1000
(10)
The greatest problem in measuring the comparative advantage of a region consists of the typical insufficiency of data on trade with other regions of the same country. That is why the calculations of the Lafay indicator in Samson (1998) and TACIS (2002b) are based on foreign trade alone, i.e. they represent an incomplete measure of comparative advantage in foreign trade. The coefficient shows the contribution of each good (or industry) to foreign trade. Thus, the coefficient measures foreign trade specialisation and not regional specialisation overall. The problem is objective since, while we possess the outflow data (the Customs Office data for outflows to mainland Russia under the IM40OEZ certificate), the data on inflows from the Russian regions to Kaliningrad is lacking. A special methodology is provided in Vinokurov (2002b and 2004d), which, although not without deficiencies, allows us to arrive at a decent estimation of trade with mainland Russia for 2000 on the level of TN VED two-digit estimations (eight sectors in total). Unfortunately, we possess only sectoral data at a high level of aggregation and not for individual goods or sub-industries. It was impossible to apply this methodology to estimate trade in the years following 2000. We proceed by calculating the RCA for a number of years following 2000. These calculations, combined with those already performed by other authors, provide a dynamic assessment of the regional foreign-trade specialisation from 1996 to 2004. In addition, the ‘full regional RCA’ is calculated for 2000 based on the data for both foreign and interregional trade. Thus, the full regional RCA represents a measure similar to what we would have done for a country.
We calculate the Lafay index for international comparative advantage on a high level of aggregation for 1999–2003 based on available and reliable customs data (Table 4.1). The second column for 2000 is the ‘complete RCA’ including the totality of Kaliningrad’s trade.
Table 4.1 Revealed comparative advantage of the Kaliningrad region* TN VED code Sector 1999 2000 2000
complete RCA
2001 2002 2003
01 – 24 Food products -142 -230 87 -120 -91 -10227 Oil and oil products 19 227 45 170 168 2228-35, 37-40 Petrochemicals 23 0 -81 17 0 041-43 Leather and furs 4 3 2 6 9 1144,47, 48 Timber and products, pulp
and paper 42 62 42 52 51 5
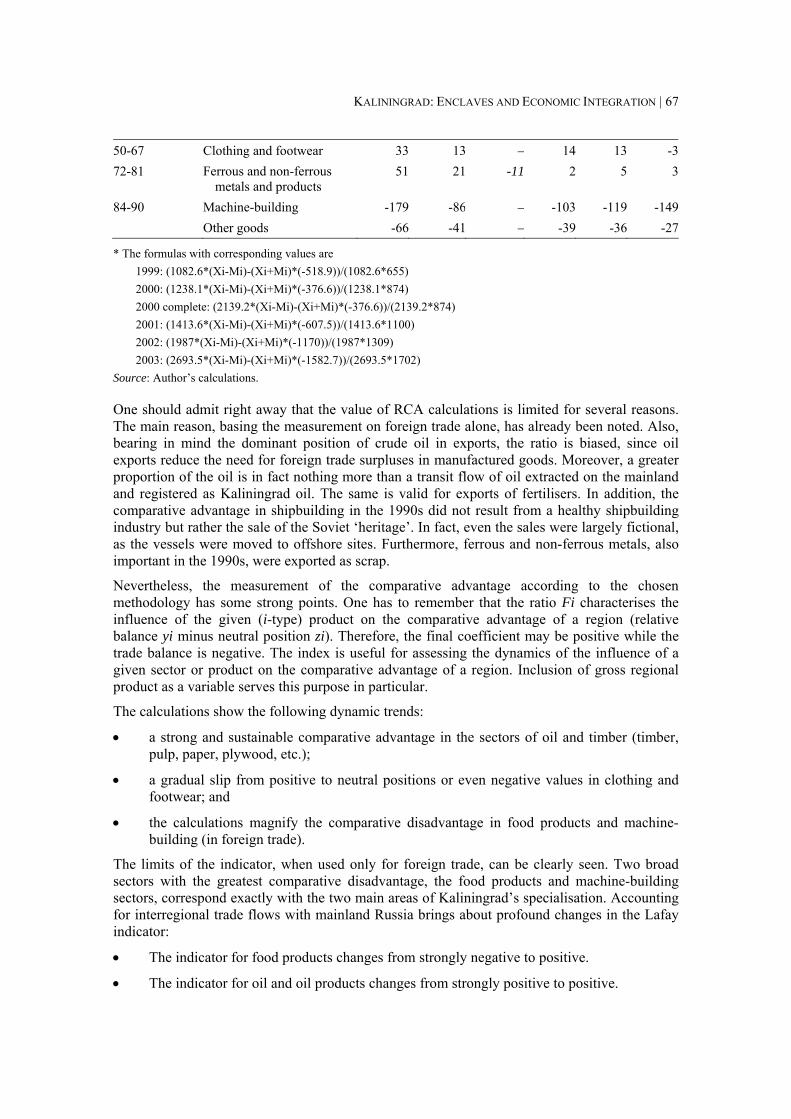
KALININGRAD: ENCLAVES AND ECONOMIC INTEGRATION | 67
50-67 Clothing and footwear 33 13 – 14 13 -372-81 Ferrous and non-ferrous
metals and products 51 21 -11 2 5 3
84-90 Machine-building -179 -86 – -103 -119 -149 Other goods -66 -41 – -39 -36 -27
* The formulas with corresponding values are 1999: (1082.6*(Xi-Mi)-(Xi+Mi)*(-518.9))/(1082.6*655) 2000: (1238.1*(Xi-Mi)-(Xi+Mi)*(-376.6))/(1238.1*874) 2000 complete: (2139.2*(Xi-Mi)-(Xi+Mi)*(-376.6))/(2139.2*874) 2001: (1413.6*(Xi-Mi)-(Xi+Mi)*(-607.5))/(1413.6*1100) 2002: (1987*(Xi-Mi)-(Xi+Mi)*(-1170))/(1987*1309) 2003: (2693.5*(Xi-Mi)-(Xi+Mi)*(-1582.7))/(2693.5*1702)
Source: Author’s calculations.
One should admit right away that the value of RCA calculations is limited for several reasons. The main reason, basing the measurement on foreign trade alone, has already been noted. Also, bearing in mind the dominant position of crude oil in exports, the ratio is biased, since oil exports reduce the need for foreign trade surpluses in manufactured goods. Moreover, a greater proportion of the oil is in fact nothing more than a transit flow of oil extracted on the mainland and registered as Kaliningrad oil. The same is valid for exports of fertilisers. In addition, the comparative advantage in shipbuilding in the 1990s did not result from a healthy shipbuilding industry but rather the sale of the Soviet ‘heritage’. In fact, even the sales were largely fictional, as the vessels were moved to offshore sites. Furthermore, ferrous and non-ferrous metals, also important in the 1990s, were exported as scrap.
Nevertheless, the measurement of the comparative advantage according to the chosen methodology has some strong points. One has to remember that the ratio Fi characterises the influence of the given (i-type) product on the comparative advantage of a region (relative balance yi minus neutral position zi). Therefore, the final coefficient may be positive while the trade balance is negative. The index is useful for assessing the dynamics of the influence of a given sector or product on the comparative advantage of a region. Inclusion of gross regional product as a variable serves this purpose in particular.
The calculations show the following dynamic trends:
• a strong and sustainable comparative advantage in the sectors of oil and timber (timber, pulp, paper, plywood, etc.);
• a gradual slip from positive to neutral positions or even negative values in clothing and footwear; and
• the calculations magnify the comparative disadvantage in food products and machine-building (in foreign trade).
The limits of the indicator, when used only for foreign trade, can be clearly seen. Two broad sectors with the greatest comparative disadvantage, the food products and machine-building sectors, correspond exactly with the two main areas of Kaliningrad’s specialisation. Accounting for interregional trade flows with mainland Russia brings about profound changes in the Lafay indicator:
• The indicator for food products changes from strongly negative to positive.
• The indicator for oil and oil products changes from strongly positive to positive.

68 | EVGENY VINOKUROV
• The indicator for petrochemical products changes from neutral to negative.
• The indicator for the wood-working sectors decreases, although remains positive; the same is true for leather and furs.
• The indicator for metals changes from positive to slightly negative.
These findings on regional comparative advantages illustrate Kaliningrad’s advantages in a number of goods through its share in Russian national production. The region’s share in a few consumer electronics specialties (such as TV sets and vacuum cleaners) is growing phenomenally. More important from the point of view of sheer volume is the growth in the production of canned fish and meat. Additionally, Kaliningrad holds significant shares of the Russian national production of furniture (5.7%), cellulose (5.1%), paper (1.7%) and alcoholic beverages (2.7).
Yet Kaliningrad’s very high shares in consumer electronics and food processing correspond with highly negative values of the Fi indicator for the international comparative advantage in the respective sectors (which is -102 for foodstuffs and -143 for machine-building). This is attributable to the fact that these two leading sectors rely heavily on imports for supplies of raw materials and components (Table 4.2).
Table 4.2 Share of the Kaliningrad region in Russia’s national production, 2002–04 Commodity Russian
Federation 2003
Kaliningrad 2003
(physical volume)
Share 2004 (%)
Share 2003 (%)
Share 2002 (%)
TV sets (thousand) 2,336 836 47.9 35.8 29.8 Vacuum cleaners (thousand) 720 240 66.3 33.3 14.4 Canned fish (mn standard cans) 471 84.8 36.8 18.0 17.1 Foodstuffs, total (thousand
tonnes) 2,698 352.5 22.8 13.1 13.7
Fish and crustaceans (thousand tonnes)
3,134 332.2 11.3 10.6 11.1
Furniture (excl. built-in) (mn RUB)
23,402 1325 – 5.7 5.7
Cellulose (thousand tonnes) 2,301 118.9 5.1 5.2 5.3 Alcoholic beverages
(mn dekalitres) 135 2.7 2.7 2.0 3.0
Paper (thousand tonnes) 3,655 67.6 1.7 1.8 2.0 Passenger vehicles (thousand) 1,011 8.4 1.3 0.8 0.6 Non-alcoholic beverages
(mn dekalitres) 350 2.3 0.7 0.7 2.1
Meat, incl. sub-products (thousand tonnes)
1,608 11.2 0.7 0.7 0.7
Beer (mn dekalitres) 757 5.5 0.8 0.7 0.5 Sausages (thousand tonnes) 1,617 5.1 0.3 0.3 0.7
Sources: KRCS (2004) and NWCO (2005).
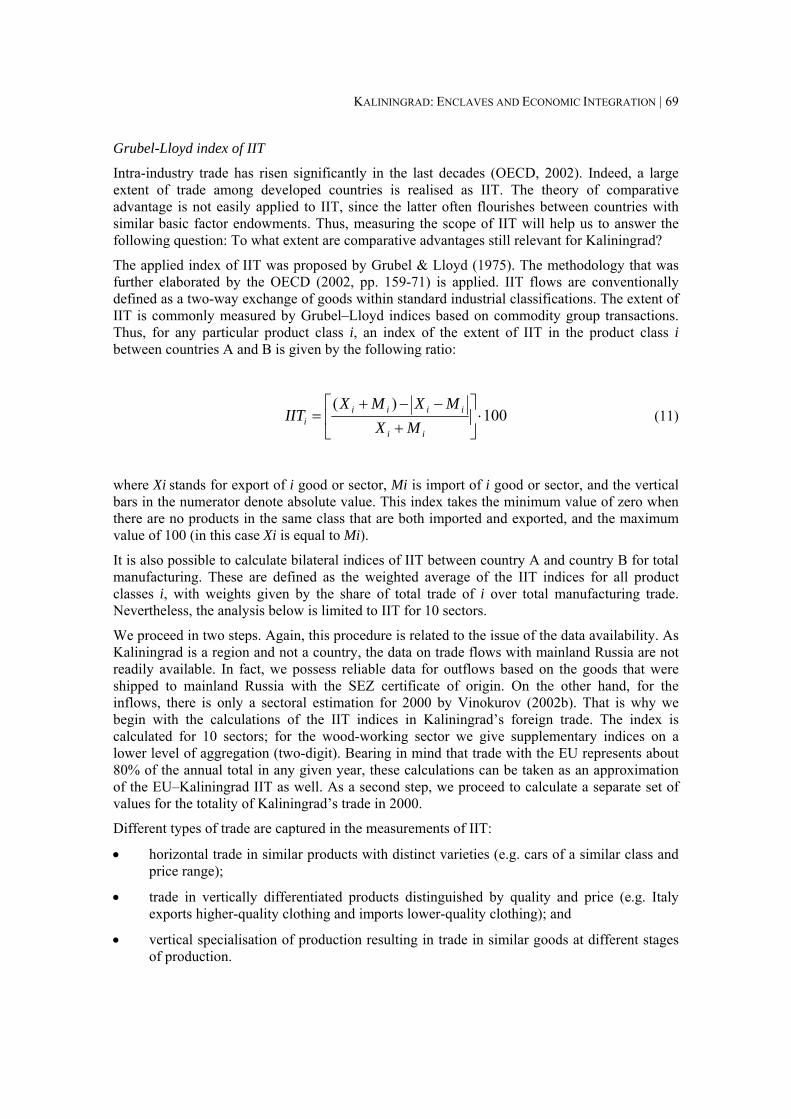
KALININGRAD: ENCLAVES AND ECONOMIC INTEGRATION | 69
Grubel-Lloyd index of IIT
Intra-industry trade has risen significantly in the last decades (OECD, 2002). Indeed, a large extent of trade among developed countries is realised as IIT. The theory of comparative advantage is not easily applied to IIT, since the latter often flourishes between countries with similar basic factor endowments. Thus, measuring the scope of IIT will help us to answer the following question: To what extent are comparative advantages still relevant for Kaliningrad?
The applied index of IIT was proposed by Grubel & Lloyd (1975). The methodology that was further elaborated by the OECD (2002, pp. 159-71) is applied. IIT flows are conventionally defined as a two-way exchange of goods within standard industrial classifications. The extent of IIT is commonly measured by Grubel–Lloyd indices based on commodity group transactions. Thus, for any particular product class i, an index of the extent of IIT in the product class i between countries A and B is given by the following ratio:
100)(
⋅⎥⎦
⎤⎢⎣
⎡
+−−+
=ii
iiiii MX
MXMXIIT (11)
where Xi stands for export of i good or sector, Mi is import of i good or sector, and the vertical bars in the numerator denote absolute value. This index takes the minimum value of zero when there are no products in the same class that are both imported and exported, and the maximum value of 100 (in this case Xi is equal to Mi).
It is also possible to calculate bilateral indices of IIT between country A and country B for total manufacturing. These are defined as the weighted average of the IIT indices for all product classes i, with weights given by the share of total trade of i over total manufacturing trade. Nevertheless, the analysis below is limited to IIT for 10 sectors.
We proceed in two steps. Again, this procedure is related to the issue of the data availability. As Kaliningrad is a region and not a country, the data on trade flows with mainland Russia are not readily available. In fact, we possess reliable data for outflows based on the goods that were shipped to mainland Russia with the SEZ certificate of origin. On the other hand, for the inflows, there is only a sectoral estimation for 2000 by Vinokurov (2002b). That is why we begin with the calculations of the IIT indices in Kaliningrad’s foreign trade. The index is calculated for 10 sectors; for the wood-working sector we give supplementary indices on a lower level of aggregation (two-digit). Bearing in mind that trade with the EU represents about 80% of the annual total in any given year, these calculations can be taken as an approximation of the EU–Kaliningrad IIT as well. As a second step, we proceed to calculate a separate set of values for the totality of Kaliningrad’s trade in 2000.
Different types of trade are captured in the measurements of IIT:
• horizontal trade in similar products with distinct varieties (e.g. cars of a similar class and price range);
• trade in vertically differentiated products distinguished by quality and price (e.g. Italy exports higher-quality clothing and imports lower-quality clothing); and
• vertical specialisation of production resulting in trade in similar goods at different stages of production.
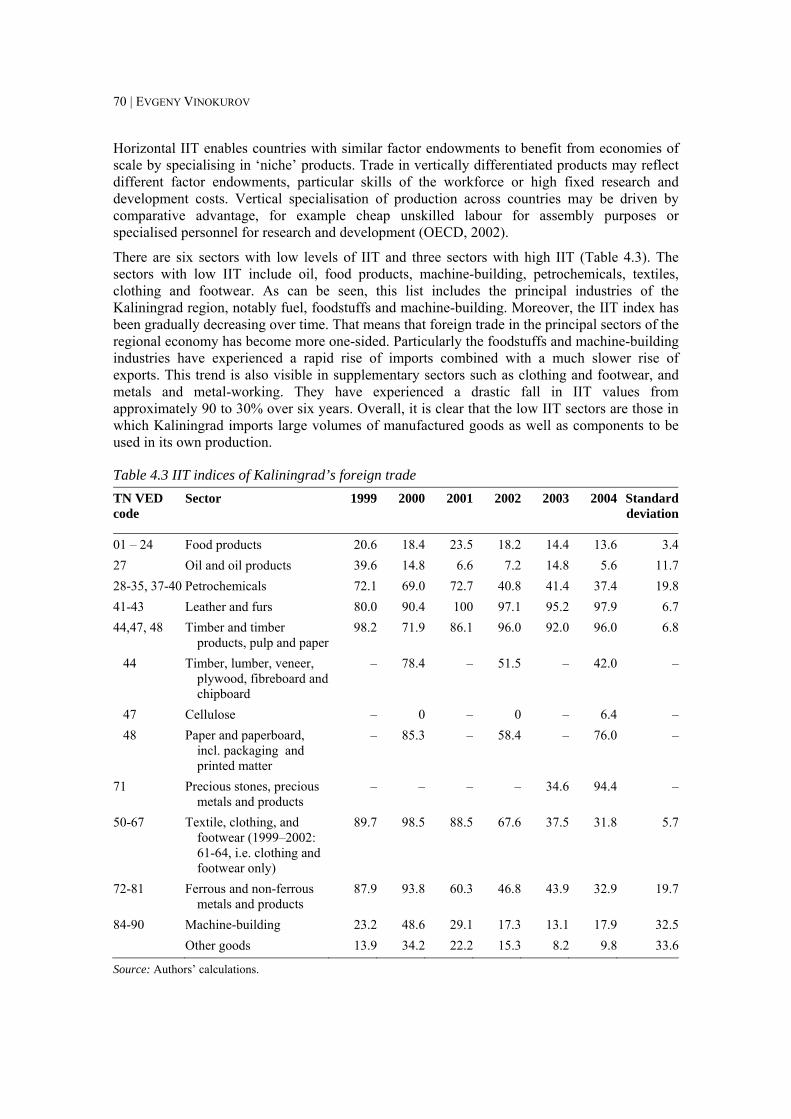
70 | EVGENY VINOKUROV
Horizontal IIT enables countries with similar factor endowments to benefit from economies of scale by specialising in ‘niche’ products. Trade in vertically differentiated products may reflect different factor endowments, particular skills of the workforce or high fixed research and development costs. Vertical specialisation of production across countries may be driven by comparative advantage, for example cheap unskilled labour for assembly purposes or specialised personnel for research and development (OECD, 2002).
There are six sectors with low levels of IIT and three sectors with high IIT (Table 4.3). The sectors with low IIT include oil, food products, machine-building, petrochemicals, textiles, clothing and footwear. As can be seen, this list includes the principal industries of the Kaliningrad region, notably fuel, foodstuffs and machine-building. Moreover, the IIT index has been gradually decreasing over time. That means that foreign trade in the principal sectors of the regional economy has become more one-sided. Particularly the foodstuffs and machine-building industries have experienced a rapid rise of imports combined with a much slower rise of exports. This trend is also visible in supplementary sectors such as clothing and footwear, and metals and metal-working. They have experienced a drastic fall in IIT values from approximately 90 to 30% over six years. Overall, it is clear that the low IIT sectors are those in which Kaliningrad imports large volumes of manufactured goods as well as components to be used in its own production.
Table 4.3 IIT indices of Kaliningrad’s foreign trade TN VED code
Sector 1999 2000 2001 2002 2003 2004 Standarddeviation
01 – 24 Food products 20.6 18.4 23.5 18.2 14.4 13.6 3.427 Oil and oil products 39.6 14.8 6.6 7.2 14.8 5.6 11.728-35, 37-40 Petrochemicals 72.1 69.0 72.7 40.8 41.4 37.4 19.841-43 Leather and furs 80.0 90.4 100 97.1 95.2 97.9 6.744,47, 48 Timber and timber
products, pulp and paper98.2 71.9 86.1 96.0 92.0 96.0 6.8
44 Timber, lumber, veneer, plywood, fibreboard and chipboard
– 78.4 – 51.5 – 42.0 –
47 Cellulose – 0 – 0 – 6.4 – 48 Paper and paperboard,
incl. packaging and printed matter
– 85.3 – 58.4 – 76.0 –
71 Precious stones, precious metals and products
– – – – 34.6 94.4 –
50-67 Textile, clothing, and footwear (1999–2002: 61-64, i.e. clothing and footwear only)
89.7 98.5 88.5 67.6 37.5 31.8 5.7
72-81 Ferrous and non-ferrous metals and products
87.9 93.8 60.3 46.8 43.9 32.9 19.7
84-90 Machine-building 23.2 48.6 29.1 17.3 13.1 17.9 32.5 Other goods 13.9 34.2 22.2 15.3 8.2 9.8 33.6
Source: Authors’ calculations.
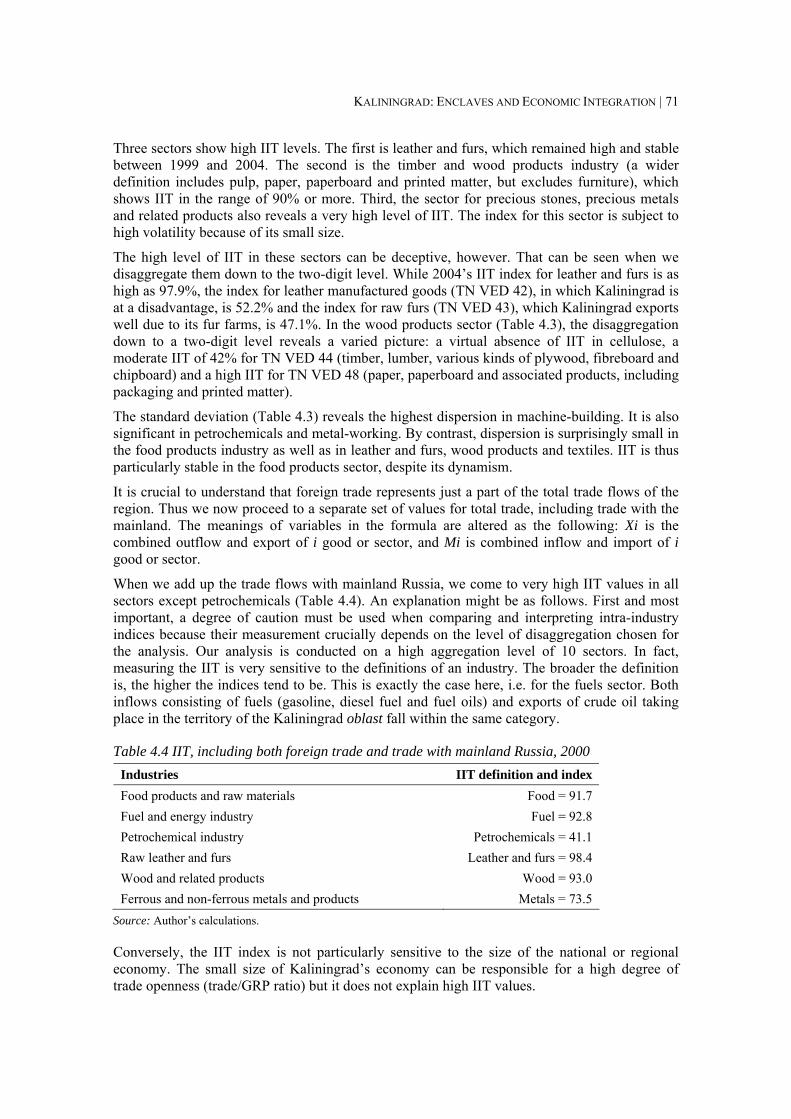
KALININGRAD: ENCLAVES AND ECONOMIC INTEGRATION | 71
Three sectors show high IIT levels. The first is leather and furs, which remained high and stable between 1999 and 2004. The second is the timber and wood products industry (a wider definition includes pulp, paper, paperboard and printed matter, but excludes furniture), which shows IIT in the range of 90% or more. Third, the sector for precious stones, precious metals and related products also reveals a very high level of IIT. The index for this sector is subject to high volatility because of its small size.
The high level of IIT in these sectors can be deceptive, however. That can be seen when we disaggregate them down to the two-digit level. While 2004’s IIT index for leather and furs is as high as 97.9%, the index for leather manufactured goods (TN VED 42), in which Kaliningrad is at a disadvantage, is 52.2% and the index for raw furs (TN VED 43), which Kaliningrad exports well due to its fur farms, is 47.1%. In the wood products sector (Table 4.3), the disaggregation down to a two-digit level reveals a varied picture: a virtual absence of IIT in cellulose, a moderate IIT of 42% for TN VED 44 (timber, lumber, various kinds of plywood, fibreboard and chipboard) and a high IIT for TN VED 48 (paper, paperboard and associated products, including packaging and printed matter).
The standard deviation (Table 4.3) reveals the highest dispersion in machine-building. It is also significant in petrochemicals and metal-working. By contrast, dispersion is surprisingly small in the food products industry as well as in leather and furs, wood products and textiles. IIT is thus particularly stable in the food products sector, despite its dynamism.
It is crucial to understand that foreign trade represents just a part of the total trade flows of the region. Thus we now proceed to a separate set of values for total trade, including trade with the mainland. The meanings of variables in the formula are altered as the following: Xi is the combined outflow and export of i good or sector, and Mi is combined inflow and import of i good or sector.
When we add up the trade flows with mainland Russia, we come to very high IIT values in all sectors except petrochemicals (Table 4.4). An explanation might be as follows. First and most important, a degree of caution must be used when comparing and interpreting intra-industry indices because their measurement crucially depends on the level of disaggregation chosen for the analysis. Our analysis is conducted on a high aggregation level of 10 sectors. In fact, measuring the IIT is very sensitive to the definitions of an industry. The broader the definition is, the higher the indices tend to be. This is exactly the case here, i.e. for the fuels sector. Both inflows consisting of fuels (gasoline, diesel fuel and fuel oils) and exports of crude oil taking place in the territory of the Kaliningrad oblast fall within the same category.
Table 4.4 IIT, including both foreign trade and trade with mainland Russia, 2000 Industries IIT definition and index Food products and raw materials Food = 91.7 Fuel and energy industry Fuel = 92.8 Petrochemical industry Petrochemicals = 41.1 Raw leather and furs Leather and furs = 98.4 Wood and related products Wood = 93.0 Ferrous and non-ferrous metals and products Metals = 73.5
Source: Author’s calculations.
Conversely, the IIT index is not particularly sensitive to the size of the national or regional economy. The small size of Kaliningrad’s economy can be responsible for a high degree of trade openness (trade/GRP ratio) but it does not explain high IIT values.
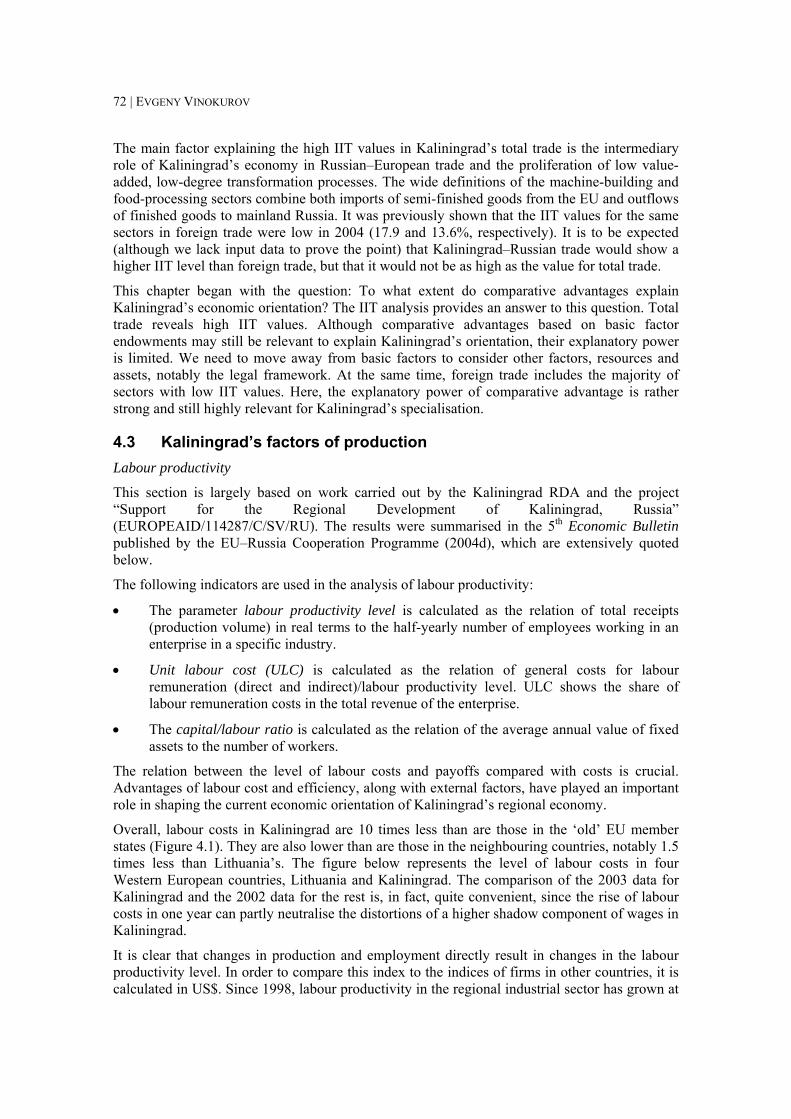
72 | EVGENY VINOKUROV
The main factor explaining the high IIT values in Kaliningrad’s total trade is the intermediary role of Kaliningrad’s economy in Russian–European trade and the proliferation of low value-added, low-degree transformation processes. The wide definitions of the machine-building and food-processing sectors combine both imports of semi-finished goods from the EU and outflows of finished goods to mainland Russia. It was previously shown that the IIT values for the same sectors in foreign trade were low in 2004 (17.9 and 13.6%, respectively). It is to be expected (although we lack input data to prove the point) that Kaliningrad–Russian trade would show a higher IIT level than foreign trade, but that it would not be as high as the value for total trade.
This chapter began with the question: To what extent do comparative advantages explain Kaliningrad’s economic orientation? The IIT analysis provides an answer to this question. Total trade reveals high IIT values. Although comparative advantages based on basic factor endowments may still be relevant to explain Kaliningrad’s orientation, their explanatory power is limited. We need to move away from basic factors to consider other factors, resources and assets, notably the legal framework. At the same time, foreign trade includes the majority of sectors with low IIT values. Here, the explanatory power of comparative advantage is rather strong and still highly relevant for Kaliningrad’s specialisation.
4.3 Kaliningrad’s factors of production Labour productivity
This section is largely based on work carried out by the Kaliningrad RDA and the project “Support for the Regional Development of Kaliningrad, Russia” (EUROPEAID/114287/C/SV/RU). The results were summarised in the 5th Economic Bulletin published by the EU–Russia Cooperation Programme (2004d), which are extensively quoted below.
The following indicators are used in the analysis of labour productivity:
• The parameter labour productivity level is calculated as the relation of total receipts (production volume) in real terms to the half-yearly number of employees working in an enterprise in a specific industry.
• Unit labour cost (ULC) is calculated as the relation of general costs for labour remuneration (direct and indirect)/labour productivity level. ULC shows the share of labour remuneration costs in the total revenue of the enterprise.
• The capital/labour ratio is calculated as the relation of the average annual value of fixed assets to the number of workers.
The relation between the level of labour costs and payoffs compared with costs is crucial. Advantages of labour cost and efficiency, along with external factors, have played an important role in shaping the current economic orientation of Kaliningrad’s regional economy.
Overall, labour costs in Kaliningrad are 10 times less than are those in the ‘old’ EU member states (Figure 4.1). They are also lower than are those in the neighbouring countries, notably 1.5 times less than Lithuania’s. The figure below represents the level of labour costs in four Western European countries, Lithuania and Kaliningrad. The comparison of the 2003 data for Kaliningrad and the 2002 data for the rest is, in fact, quite convenient, since the rise of labour costs in one year can partly neutralise the distortions of a higher shadow component of wages in Kaliningrad.
It is clear that changes in production and employment directly result in changes in the labour productivity level. In order to compare this index to the indices of firms in other countries, it is calculated in US$. Since 1998, labour productivity in the regional industrial sector has grown at
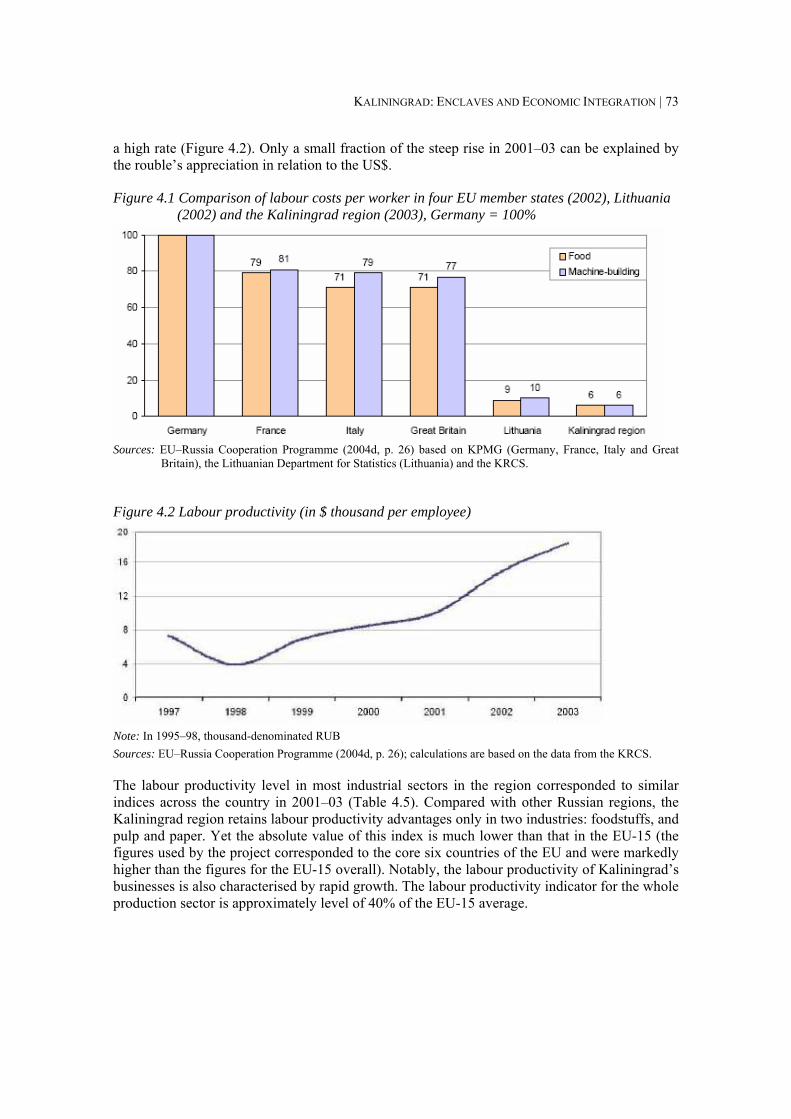
KALININGRAD: ENCLAVES AND ECONOMIC INTEGRATION | 73
a high rate (Figure 4.2). Only a small fraction of the steep rise in 2001–03 can be explained by the rouble’s appreciation in relation to the US$.
Figure 4.1 Comparison of labour costs per worker in four EU member states (2002), Lithuania (2002) and the Kaliningrad region (2003), Germany = 100%
Sources: EU–Russia Cooperation Programme (2004d, p. 26) based on KPMG (Germany, France, Italy and Great
Britain), the Lithuanian Department for Statistics (Lithuania) and the KRCS.
Figure 4.2 Labour productivity (in $ thousand per employee)
Note: In 1995–98, thousand-denominated RUB Sources: EU–Russia Cooperation Programme (2004d, p. 26); calculations are based on the data from the KRCS.
The labour productivity level in most industrial sectors in the region corresponded to similar indices across the country in 2001–03 (Table 4.5). Compared with other Russian regions, the Kaliningrad region retains labour productivity advantages only in two industries: foodstuffs, and pulp and paper. Yet the absolute value of this index is much lower than that in the EU-15 (the figures used by the project corresponded to the core six countries of the EU and were markedly higher than the figures for the EU-15 overall). Notably, the labour productivity of Kaliningrad’s businesses is also characterised by rapid growth. The labour productivity indicator for the whole production sector is approximately level of 40% of the EU-15 average.
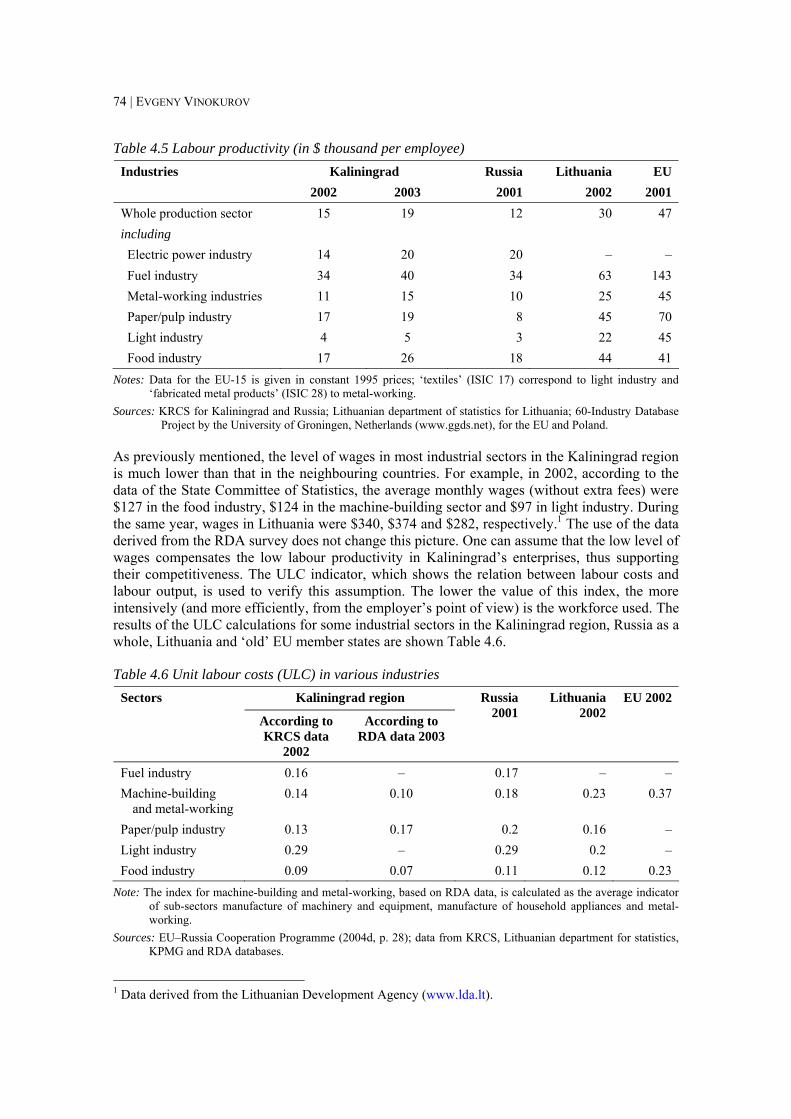
74 | EVGENY VINOKUROV
Table 4.5 Labour productivity (in $ thousand per employee) Kaliningrad Russia Lithuania EU Industries
2002 2003 2001 2002 2001 Whole production sector 15 19 12 30 47 including Electric power industry 14 20 20 – – Fuel industry 34 40 34 63 143 Metal-working industries 11 15 10 25 45 Paper/pulp industry 17 19 8 45 70 Light industry 4 5 3 22 45 Food industry 17 26 18 44 41
Notes: Data for the EU-15 is given in constant 1995 prices; ‘textiles’ (ISIC 17) correspond to light industry and ‘fabricated metal products’ (ISIC 28) to metal-working.
Sources: KRCS for Kaliningrad and Russia; Lithuanian department of statistics for Lithuania; 60-Industry Database Project by the University of Groningen, Netherlands (www.ggds.net), for the EU and Poland.
As previously mentioned, the level of wages in most industrial sectors in the Kaliningrad region is much lower than that in the neighbouring countries. For example, in 2002, according to the data of the State Committee of Statistics, the average monthly wages (without extra fees) were $127 in the food industry, $124 in the machine-building sector and $97 in light industry. During the same year, wages in Lithuania were $340, $374 and $282, respectively.1 The use of the data derived from the RDA survey does not change this picture. One can assume that the low level of wages compensates the low labour productivity in Kaliningrad’s enterprises, thus supporting their competitiveness. The ULC indicator, which shows the relation between labour costs and labour output, is used to verify this assumption. The lower the value of this index, the more intensively (and more efficiently, from the employer’s point of view) is the workforce used. The results of the ULC calculations for some industrial sectors in the Kaliningrad region, Russia as a whole, Lithuania and ‘old’ EU member states are shown Table 4.6.
Table 4.6 Unit labour costs (ULC) in various industries Kaliningrad region Sectors
According to KRCS data
2002
According to RDA data 2003
Russia 2001
Lithuania 2002
EU 2002
Fuel industry 0.16 – 0.17 – – Machine-building
and metal-working 0.14 0.10 0.18 0.23 0.37
Paper/pulp industry 0.13 0.17 0.2 0.16 – Light industry 0.29 – 0.29 0.2 – Food industry 0.09 0.07 0.11 0.12 0.23
Note: The index for machine-building and metal-working, based on RDA data, is calculated as the average indicator of sub-sectors manufacture of machinery and equipment, manufacture of household appliances and metal-working.
Sources: EU–Russia Cooperation Programme (2004d, p. 28); data from KRCS, Lithuanian department for statistics, KPMG and RDA databases.
1 Data derived from the Lithuanian Development Agency (www.lda.lt).
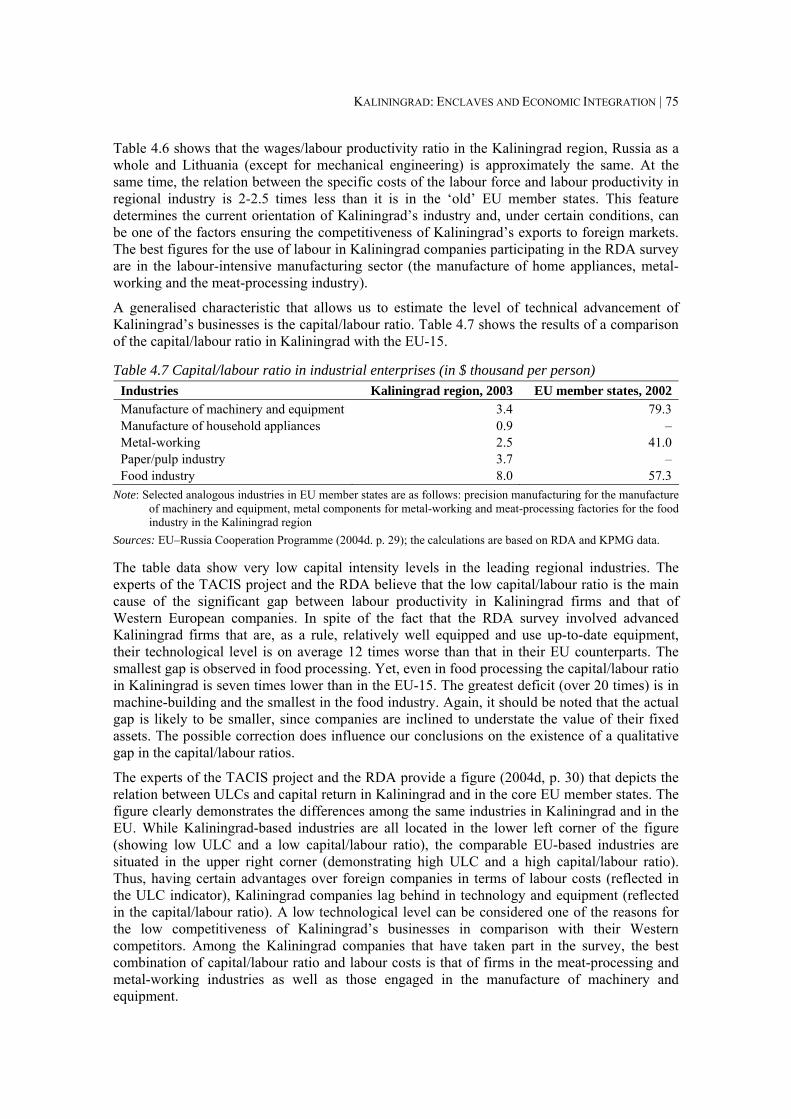
KALININGRAD: ENCLAVES AND ECONOMIC INTEGRATION | 75
Table 4.6 shows that the wages/labour productivity ratio in the Kaliningrad region, Russia as a whole and Lithuania (except for mechanical engineering) is approximately the same. At the same time, the relation between the specific costs of the labour force and labour productivity in regional industry is 2-2.5 times less than it is in the ‘old’ EU member states. This feature determines the current orientation of Kaliningrad’s industry and, under certain conditions, can be one of the factors ensuring the competitiveness of Kaliningrad’s exports to foreign markets. The best figures for the use of labour in Kaliningrad companies participating in the RDA survey are in the labour-intensive manufacturing sector (the manufacture of home appliances, metal-working and the meat-processing industry).
A generalised characteristic that allows us to estimate the level of technical advancement of Kaliningrad’s businesses is the capital/labour ratio. Table 4.7 shows the results of a comparison of the capital/labour ratio in Kaliningrad with the EU-15.
Table 4.7 Capital/labour ratio in industrial enterprises (in $ thousand per person) Industries Kaliningrad region, 2003 EU member states, 2002 Manufacture of machinery and equipment Manufacture of household appliances Metal-working Paper/pulp industry Food industry
3.4 0.9 2.5 3.7 8.0
79.3 –
41.0 –
57.3 Note: Selected analogous industries in EU member states are as follows: precision manufacturing for the manufacture
of machinery and equipment, metal components for metal-working and meat-processing factories for the food industry in the Kaliningrad region
Sources: EU–Russia Cooperation Programme (2004d. p. 29); the calculations are based on RDA and KPMG data.
The table data show very low capital intensity levels in the leading regional industries. The experts of the TACIS project and the RDA believe that the low capital/labour ratio is the main cause of the significant gap between labour productivity in Kaliningrad firms and that of Western European companies. In spite of the fact that the RDA survey involved advanced Kaliningrad firms that are, as a rule, relatively well equipped and use up-to-date equipment, their technological level is on average 12 times worse than that in their EU counterparts. The smallest gap is observed in food processing. Yet, even in food processing the capital/labour ratio in Kaliningrad is seven times lower than in the EU-15. The greatest deficit (over 20 times) is in machine-building and the smallest in the food industry. Again, it should be noted that the actual gap is likely to be smaller, since companies are inclined to understate the value of their fixed assets. The possible correction does influence our conclusions on the existence of a qualitative gap in the capital/labour ratios.
The experts of the TACIS project and the RDA provide a figure (2004d, p. 30) that depicts the relation between ULCs and capital return in Kaliningrad and in the core EU member states. The figure clearly demonstrates the differences among the same industries in Kaliningrad and in the EU. While Kaliningrad-based industries are all located in the lower left corner of the figure (showing low ULC and a low capital/labour ratio), the comparable EU-based industries are situated in the upper right corner (demonstrating high ULC and a high capital/labour ratio). Thus, having certain advantages over foreign companies in terms of labour costs (reflected in the ULC indicator), Kaliningrad companies lag behind in technology and equipment (reflected in the capital/labour ratio). A low technological level can be considered one of the reasons for the low competitiveness of Kaliningrad’s businesses in comparison with their Western competitors. Among the Kaliningrad companies that have taken part in the survey, the best combination of capital/labour ratio and labour costs is that of firms in the meat-processing and metal-working industries as well as those engaged in the manufacture of machinery and equipment.

76 | EVGENY VINOKUROV
Factor costs: Energy and fuel
Energy can be an important factor for a number of industries dubbed ‘energy-intensive’. A relevant example is the pulp and paper industry, where electricity represents 20 to 30% of the total costs of producing paper. On the other hand, energy costs are less or even negligible in other industries. The discussion of the factor costs of energy and fuel leads us to a conclusion on the intermediary position of Kaliningrad as regards the factor costs in the field. Notably, despite the rapid rise of tariffs, energy prices are still lower in Kaliningrad than in the EU. Nevertheless, it is slowly approaching the level of tariffs in Lithuania. That being stated, energy tariffs are lower in mainland Russia, particularly in the other regions of the North-West. A similar situation is observed with gas pricing. While being markedly lower than gas prices in the EU, the tariffs for Kaliningrad are higher than tariffs anywhere else in Russia, since Kaliningrad is part of the 11th price belt created by the government and Gazprom for gas tariffs in Russian territory.
Local industries used to enjoy very low energy tariffs. For example, the 2000 tariff was $.018 per kWh. But the tariff has risen rapidly, particular when calculated in foreign currencies. This rise is related to a combination of increasing nominal tariffs and the appreciation of the rouble. In 2002, local producers enjoyed a tariff of $0.03 per kWh, compared with $0.12 in Poland and $0.20-0.30 in Western European countries. The tariff went up to $0.05 in 2003. In 2005, the tariff for industrial use, which is higher than the tariff for household consumption, was set at RUB 1.89 (1.60 RUB plus 18% VAT) – $0.066 or €0.055. Thus, energy tariffs rose 3.5 times in five years if measured in US$. A 10% rise is foreseen for 2006. Combined with a likely rouble appreciation, the price will rise to €0.06-0.07.
Rapid industrial growth necessitates higher total consumption of fuel and energy resources. The total consumption of fuel and energy resources grew by 12.3% in 1999–2003, with the consumption of electric energy having expanded by 26.7%. Energy needs were satisfied by energy supplies from Leningrad Nuclear Power Station. While total energy consumption rose because of the robust industrial growth of the regional economy, the energy intensity of industries actually declined over 1999–2003, although not as sharply as it might appear. After inflation adjustment based on the KRCS’s index of prices for industrial production (77.8% over 1999–2003), it seems that the rate of fuel and energy use per GRP unit fell by 21.5% in comparable prices over four years. While the rate of electric energy use fell significantly (by 40%), the rate of heating energy use declined (by 21%). These figures allow us to conclude that Kaliningrad’s industry has become less energy-intensive in the years after the 1998 crisis.
In November 2005, the Russian United Energy Systems Company put into operation the first power-generating unit at the Kaliningrad Heat and Power Plant (HPP-2). The HPP-2 is only the second plant in Russia to use new gas-turbine technology, increasing efficiency to 51%, compared with only 38% in traditional electricity-generating plants. The operation of the 450 MW unit will cut the regional energy shortage in half, from 3.385 bn kWh to 1.427 bn kWh, while the second unit will enable the region to satisfy full demand for electrical power. Construction of the second unit will be completed in 2009. The total installed electric-power capacity in the Kaliningrad region was only 0.22 GWh in 2001. It was raised to 0.67 GWh at the end of 2005 when the first block of the HPP-2 was installed. The construction of the second block will enable it to cross the 1.0 GWh mark.
A comparison with the Russian North-West is still unfavourable to Kaliningrad, however. The Russian North-West is well-supplied with energy resources. The centre of electric power production is located in the St Petersburg and Leningrad oblast, particularly owing to the Leningrad Nuclear Power Station (which supplies Kaliningrad as well). Another nuclear power station is located in the Novgorod region and the third one is in the Murmansk region. In addition, numerous hydroelectric power plants are located in the Leningrad region, Murmansk

KALININGRAD: ENCLAVES AND ECONOMIC INTEGRATION | 77
region and Karelia. Large thermal-power plants (operating on gas and oil and producing both power and heat) are located in all other regions of the North-West, except – until the construction of the HPP-2 – Kaliningrad.
Overall, Kaliningrad possesses an intermediate competitive position between Russia and the EU. Factor costs of energy, heat and fuel are lower than in the EU, although the difference with Lithuania and Poland is not as substantial as the difference with the EU-15. On the other hand, prices are higher than in Russia in general and in the North-West region in particular. Even after power production capacities are enlarged by 450 MW from the HPP-2, Kaliningrad will still find itself at a competitive disadvantage as regards costs, availability and risk (gas transit) of energy supplies to energy-intensive industries. One of the reasons for higher energy tariffs will be higher gas prices, since the HPP-2 will operate on natural gas delivered from the mainland.
Gas prices are low compared with the EU. Nevertheless, they are also subject to a gradual rise in tariffs. For example, the Federal Tariff Service set the average rate of increase at 10.5% for industrial consumption in 2006. An 11-belt structure for wholesale energy prices exists in Russia for the sake of price-setting. According to the belt structure, regions located close to production areas will have smaller price increases than remote regions. This approach reflects the relationship between wholesale prices and the distance of gas transportation to a particular price belt. The service put the Kaliningrad region, Russia’s exclave on the Baltic Sea, into a separate price belt, taking into account the special status of the region. Despite possible special treatment of the exclave region, the detachment, transit costs and the sheer remoteness of Kaliningrad from the main production areas mean prices well above the Russian average.
Share of costs in output as an indicator of efficiency
A comparison of indices revealing the share of costs in output for Kaliningrad industries to similar indices for developed industrial countries provides important information regarding the general efficiency of Kaliningrad companies. The cost/output ratio of most industries generally corresponds to the indices of ‘old’ EU member countries (the six EU ‘core’ states). The index of food industry firms (aggregate average) in the Kaliningrad region was 0.96 in 2003, while the average for the EU member states was 0.97 (2001 data). For metal-working, the index amounted to 0.95, almost at the level of the comparison EU member states, 0.94. The share of costs in the revenues of Kaliningrad machine-building enterprises (aggregate average for the industry) is lower than that of their Western European counterparts (0.93 in the Kaliningrad region and 0.96 in the EU member states). The lowest index was attributed to the fish-processing sub-industry (Table 4.8). The data for Kaliningrad can be biased, however, since the calculations are performed only for Kaliningrad enterprises included in the RDA’s database, which are probably above average in terms of economic efficiency (EU–Russia Cooperation Programme, 2004d, p. 24).
Table 4.8 Index of the share of costs in the output of major industries in the Kaliningrad region in 2003
Industry Cost/output ratio index Food industry (fish) 0.88 Food industry (meat) 0.97 Pulp and paper 0.98 Metal-working 0.95 Machine-building (household appliances) 0.98 Machine-building (machinery and equipment) 0.90
Source: EU-Russia Cooperation Programme (2004d), based on the Kaliningrad RDA database.
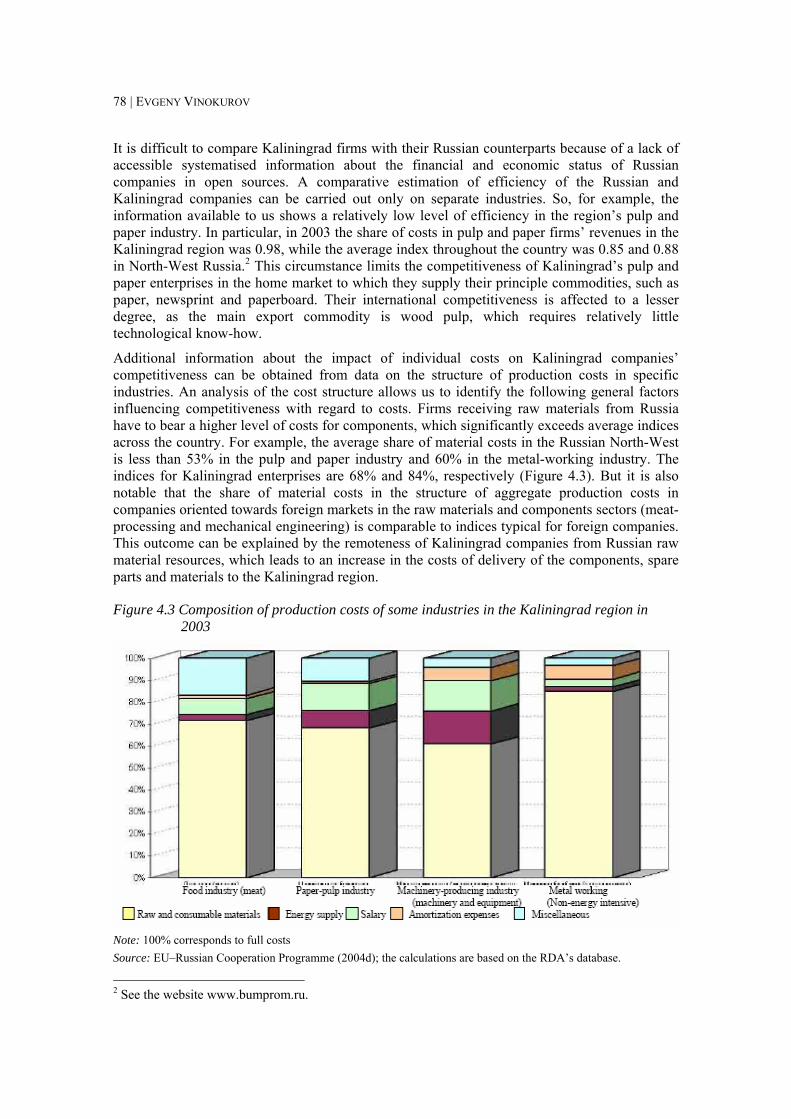
78 | EVGENY VINOKUROV
It is difficult to compare Kaliningrad firms with their Russian counterparts because of a lack of accessible systematised information about the financial and economic status of Russian companies in open sources. A comparative estimation of efficiency of the Russian and Kaliningrad companies can be carried out only on separate industries. So, for example, the information available to us shows a relatively low level of efficiency in the region’s pulp and paper industry. In particular, in 2003 the share of costs in pulp and paper firms’ revenues in the Kaliningrad region was 0.98, while the average index throughout the country was 0.85 and 0.88 in North-West Russia.2 This circumstance limits the competitiveness of Kaliningrad’s pulp and paper enterprises in the home market to which they supply their principle commodities, such as paper, newsprint and paperboard. Their international competitiveness is affected to a lesser degree, as the main export commodity is wood pulp, which requires relatively little technological know-how.
Additional information about the impact of individual costs on Kaliningrad companies’ competitiveness can be obtained from data on the structure of production costs in specific industries. An analysis of the cost structure allows us to identify the following general factors influencing competitiveness with regard to costs. Firms receiving raw materials from Russia have to bear a higher level of costs for components, which significantly exceeds average indices across the country. For example, the average share of material costs in the Russian North-West is less than 53% in the pulp and paper industry and 60% in the metal-working industry. The indices for Kaliningrad enterprises are 68% and 84%, respectively (Figure 4.3). But it is also notable that the share of material costs in the structure of aggregate production costs in companies oriented towards foreign markets in the raw materials and components sectors (meat-processing and mechanical engineering) is comparable to indices typical for foreign companies. This outcome can be explained by the remoteness of Kaliningrad companies from Russian raw material resources, which leads to an increase in the costs of delivery of the components, spare parts and materials to the Kaliningrad region.
Figure 4.3 Composition of production costs of some industries in the Kaliningrad region in 2003
Note: 100% corresponds to full costs Source: EU–Russian Cooperation Programme (2004d); the calculations are based on the RDA’s database.
2 See the website www.bumprom.ru.
KALININGRAD: ENCLAVES AND ECONOMIC INTEGRATION | 79
4.4 Domestic policy: The SEZ of Kaliningrad as a springboard to the Russian market
The FEZ Yantar (1991–96) and the SEZ Kaliningrad (1996)
The forerunner of the SEZ in Kaliningrad was initiated in 1990 and put into operation in 1991, baptised the Free Economic Zone (FEZ) Yantar [Amber]. The whole of the region, excluding military property, was to become the FEZ. The idea of promoting exports was initially at the core of the FEZ. Only gradually and, to a certain degree, unintentionally, did the focal point shift to customs privileges as the mechanism of promoting import substitution. Later the FEZ started to be perceived as a compensation tool for the drawbacks of the region’s exclave location. The Yantar zone foresaw such elements as a free trade zone, the stimulation of investment, tax privileges, an unrestricted outflow of capital, infrastructure development and simplified entry rules for foreign citizens. In practice, the envisaged scope of specific regulations has never been achieved. Despite the existence of federal legislation, the legal basis was unstable until 1996. Although the FEZ formally operated, its practical functioning was disrupted to the point of being practically zero. For example, the Federal Law on the Customs Tariff, passed on 21 May 1993, abolished all the exemptions of the FEZ Yantar. At the same time, the Federal Tax Collecting Office and the Ministry of Finance pointed out the illegality of any tax immunities for companies in the FEZ. Thus, all exemptions were de facto abolished. After the situation was somewhat normalised at the end of 1993, the story repeated itself once again in 1995. The FEZ found itself in a severe crisis. It was not until January 1996, when a new Law on the Special Economic Zone in the Kaliningrad region was adopted, that the situation began to normalise.
The economy could not take off in conditions of legal instability. This is well reflected in the history of industrial restructuring and the development of regional trade flows in the 1990s. Qualitative changes specific to the functioning of the SEZ (apart from changes induced by the crisis phenomena) began to occur only after 1996–97. Much of the credit for the struggle for a legal framework for regional economic activities goes to Yuri Matochkin, who was Kaliningrad’s Governor from 1991 until 1996. Shortly after the 1996 law was passed and the situation began to stabilise, elections took place and Mr Matochkin was replaced by a less able governor, Leonid Gorbenko.
The SEZ of Kaliningrad in 1996: A springboard to the Russian market
The SEZ of Kaliningrad is very specific and unlike most other special economic zones. The main legal document specifying its design since 1996 is the Federal Law on the Special Economic Zone in the Kaliningrad Oblast (Russian Federation, 1996). The SEZ is part of the Russian state and its customs territory. Basically, the provisions of the SEZ law were reduced to those of a customs-free zone, but one of an unusual nature. As in a typical customs-free zone, there are no import taxes in Kaliningrad, i.e. neither customs duties nor VAT on foreign trade transactions or excise taxes have to be paid. Furthermore, goods deemed to be of local manufacture and exported to the Russian Federation will be exempt from customs duties. In order to enjoy customs privileges, the goods must satisfy the following conditions:
• for electronics and household appliances, 15% value-added + changing the 5th digit of the TN VED code; and
• for other goods, 30% value-added + changing the 4th digit of the TN VED code (plus some additional criteria for automobiles, tractors, etc.).
Customs privileges constitute the core of the SEZ regime. All other preferences, including those for investments, are just mentioned in the 1996 SEZ law and not included in other federal laws.

80 | EVGENY VINOKUROV
Hence, they do not function in practice. The specific design of the existing customs privileges created an incentive to use cheaper imports for manufacturing in order to sell goods on the Russian market. On the other hand, several economic sectors, e.g. agriculture, were suppressed by the SEZ regime, as they could not compete with cheap imports. Another problem often raised in this respect is a certain discrimination against Russian producers in favour of foreign ones. This problem occurs because VAT is not taxed on foreign imports, whereas a Kaliningrad-based producer would pay VAT on goods produced in Russia.
The customs preferences fixed in the law provide a powerful impetus towards trade intermediation and the development of industries aimed at the Russian market. Kaliningrad has subsequently offered the opportunity of being a convenient ‘springboard’ to enter the Russian market. According to the Customs Office, the volume of customs preferences for Kaliningrad-based companies reached RUB 5.1 bn in 2001 ($170 mn). About 80% of industrial production is shipped to the mainland using the SEZ preferences, and only 20% is either exported or consumed in the region. In 2004, half of the TV sets produced in Russia, two-thirds of vacuum cleaners, 16% of canned meat, 37% of canned fish, 11% of fish and marine products, 6% of furniture, 5% of pulp, 2.7% of vodka and other alcoholic beverages (and 26% of vodka exports) were manufactured in Kaliningrad.
Table 4.9 cites some of the major products in Kaliningrad’s outflows to the mainland. By producing these and other goods, companies avoid paying both import tariffs and VAT.
Table 4.9 The customs duties for some critical products, 2003 Products The Russian Federation’s import tariff (%) Cattle meat, canned fish 15 Poultry 25 Canned meat, sausages 20 Furniture 20 Carpets 20 Household devices 15 TV sets 20
Source: Author’s compilation.
There are two legislative problems as regards the SEZ regime. First, the SEZ has continually been unstable. More than 20 statutory acts concerning the FEZ Yantar and then the SEZ of Kaliningrad were adopted in the 1990s. The federal government would introduce a preference only to withdraw it not long afterwards. Obviously, the instability of the framework conditions rendered a depressive impact on economic development, making all long-term investment a matter of high risk. The situation began to stabilise at the end of the 1990s, although contradictions in the SEZ law with the federal tax and customs codes on the matter of VAT levying resulted in collisions on several occasions. Most notably these occurred in January 2001, when the sudden change of interpretation of the Customs Code by the State Customs Committee stalled Kaliningrad’s industries for almost two months (by the Order of the Federal Customs Committee No. 01-99/1405 from 27 December 2000). Another attempt to impose VAT was undertaken in connection with the draft law on the federal budget in 2003.
Second, there are concerns as to whether the current SEZ regime contradicts one of the main WTO principles on equal market access. Contrary to typical economic zones in WTO member states that function as customs enclaves (i.e. their territory is exempt from the customs territory of their country such that customs duties have to paid in full when transporting goods from the
KALININGRAD: ENCLAVES AND ECONOMIC INTEGRATION | 81
zone to other regions of the same country), the SEZ of Kaliningrad is part of the Russian customs territory. This issue has not been fully clarified from a legal point of view. The persisting concerns, however, had an impact on the decision to revise the SEZ law and to replace the customs privileges with tax concessions.
The 2006 SEZ in Kaliningrad and the ‘2016 problem’
Work on a new federal law on the SEZ began in 2002, carried out by an expert policy group under the leadership of Igor Shuvalov, Deputy Head of the Presidential Administration. The underlying principles for the improvement of the SEZ regime were
1) compatibility of the SEZ regime with common international practices (in particular, the WTO rules on the threshold of Russia’s WTO accession);
2) continuity of current and new mechanisms;
3) a change of focus from customs preferences to tax preferences; and
4) the maximum removal of administrative barriers.
The new Federal Law on the SEZ Kaliningrad was adopted in January 2006 (Russian Federal Law, 2006). Its core provisions could be summarised as below.
• Kaliningrad remains a customs-free zone.
• The law envisages a temporary co-existence of two regimes, the old one and the new one.
• The old regime corresponds to the customs preferences in the 1996 law with two changes to take place. First, companies producing electronics will also have to produce 30% value-added to be able to sell their goods to the Russian mainland without taxes and duties. Second, producers will be obliged to pay export tariffs and duties. The old regime is valid for another 10 years, i.e. until 2016. Companies must choose under which of the two regimes they will operate. After the transition period, to end 10 years after the law comes into effect, only the new regime will be valid.
• The new regime provides
a) full income-tax relief for six years for new companies that invest RUB 150 mn (€4.4 mn) or more after the new SEZ law has been adopted. During years 7-12 of operation, the income tax payable will be reduced by 50%; and
b) full property-tax relief for companies within the same time frame.
To be eligible for the new regime, companies must fulfil several requirements:
a) A minimum of RUB 150 mn has to be invested within three years – if the company fails to invest the minimum limit, it has to pay the taxes in full.
b) A minimum of 70% of the remuneration of labour, 90% of fixed assets and 70% of actual production have to take place in the SEZ.
c) Investment projects cannot be aimed at oil and gas extraction, the production of vodka and liquor, tobacco and tobacco goods, wholesale and retail trade, repair services or financial services.
• The period of operation for the new SEZ law is 25 years from its adoption.
Furthermore, the law foresees a simplified entry procedure. Russian entry visas will be issued at border crossings for “representatives of SEZ resident companies, investors, and persons invited to discuss the possibilities of cooperation in the SEZ, based on the application
82 | EVGENY VINOKUROV
by the regional Government” (Art. 20). The impact of this norm will be very limited, since the scope of persons who would be able to benefit is negligible.
What are the production orientations encouraged by the incentives of the SEZ in its old and new versions? The SEZ in its old design allows producers to virtually circumvent customs duties and VAT requirements for imports. This design strongly encourages import substitution, which quickly became the core of the regional economy. As the old regime ultimately will be removed in 2016, will the tax incentives of the new regime suffice?
There are two major incentives in the new law. First, profit tax and property tax preferences are introduced to stimulate large investments. In fact, the effect of this incentive towards the orientation of production is neutral. It does not differentiate between production for export, for the local market or for the Russian market. It simply encourages large investment with a minimal threshold of RUB 150 mn. The second incentive relates to the preservation of the old regime for a period of 10 years. When the old regime is abolished, the legal change effectively will make the Kaliningrad SEZ a ‘normal’ one, like many others around the world. This measure is normally introduced to encourage the export orientation of a certain territory. It should bring about production patterns based on imported components, of which the use is greatly facilitated by the customs-free zone. The transition from customs preferences to tax privileges is generally justified by both the economic interests of the Russian Federation overall and the WTO requirements.
Nevertheless, there are several disquieting elements in the law and its potential impact on the regional economy.
1) To begin with, the law discriminates in favour of large investment. In other words, small and medium-sized enterprises (SMEs), which would be unable to cross the minimum investment threshold of the new law, would be at a disadvantage. They will have to bear all the exclave costs without any preferences whatsoever as soon as the old regime is abolished. This circumstance is worrying because, generally, SMEs are a powerful engine of innovation, growth and employment. That was exactly the case in the Kaliningrad region throughout the last decade when SMEs became active and increasingly important for the regional economy. The furniture industry, the SEZ ‘success story’, was developed from scratch exclusively by SMEs. In addition, a large share of the food-processing companies is also made up of SMEs. It is clear that the dynamic and vital component of the regional economy, its SMEs, will encounter a critical deterioration of the business environment.
2) It is questionable whether investment projects will be attracted to Kaliningrad on the conditions stipulated by the law. The estimations by Gareev, Zhdanov & Fedorov (2005) show that even full exemption from income and property taxes would not compensate exclave-specific losses and costs. Also, Gareev et al. (2005, pp. 123-24) analyse financial models of typical enterprises in four leading industries (food processing, automotive, consumer electronics and furniture) and show that the new tax preferences are not strictly inferior in value to the old customs preferences. In other words, the change in legislation will induce a change of business patterns and a transition to other industrial sectors.
3) A small labour market, a shallow home market and other modest resources as well as Kaliningrad’s exclavity will also limit the development of large industrial projects. The characteristic feature of the law is the apparently indiscriminate character of the tax privileges. Although this approach is positive and desirable theoretically, it fails to take into account the complexity of access to the EU market. Therefore, latent export potential is likely to remain unexploited and import substitution will persist. Given that tax incentives based on export performance or targets are prohibited by the WTO, it would be
KALININGRAD: ENCLAVES AND ECONOMIC INTEGRATION | 83
desirable to supplement the neutral tax incentives with indirect measures of export promotion.
4) Finally but importantly, the new regime emphasises income and property tax preferences and, therefore, supports more industrial projects and far fewer services. On the one hand, the development of services may be triggered by rising demand on behalf of large industrial projects. On the other hand, besides the fact that the promotion of services requires a different structure of incentives, services are generally less capital-intensive, so the RUB 150 mn threshold would cut off most of the potential undertakings.
Therefore, owing to a variety of factors, the new SEZ regime will promote large industrial projects targeting the Russian market if not helped by other measures, notably the intensive export promotion. Meanwhile, three other consequences are likely:
• The export vector will probably remain unexploited.
• Smaller business projects and the region’s SMEs will suffer discrimination.
• The development of services will not be supported by the law.
Thus, the new SEZ regime lies within an old industrial paradigm. It effectively promotes a traditional 20th century industrial orientation at the detriment of a 21st century services economy. In addition, the law is likely to inhibit the development of new advanced industries and, in particular, services in the Kaliningrad region.
It is assumed that the tax privileges envisaged in the new SEZ law will “stimulate establishment of new capital-intensive industries in several sectors of the regional economy previously not stimulated by the customs-free regime” (Zhdanov, 2005, pp. 86-87). The new SEZ regime will highlight the region’s long-term advantages including its identity as part of the Russian Federation, a common domestic market, an inexpensive labour force, energy, a favourable geographic location, ice-free ports, proximity to the EU market, developed transport logistics, mobile and well-educated inhabitants who mostly share a European mentality, its historical heritage, mild climate and rich nature. According to Zhdanov, the following sectors will then profit from the new SEZ regime: transport, agriculture, construction, tourism and recreation, energy and utilities. This view appears to be over-optimistic. While emphasising the positive points, it fails to account for the multiple negative factors. Nevertheless, Zhdanov’s selection of economic sectors to profit from the new SEZ regime can be justified by their high degree of capital-intensity and the leading role of large companies in these sectors.
Although the decision to set up a 10-year transition period is right, adoption of the new SEZ law unintentionally lays the foundations of the 2016 problem, which was mentioned in the introduction as one of the future milestones in the development of a regional economic orientation. The problem has two components. First, the old SEZ regime will be abolished in 2016. Second, should Russia enter the WTO in 2007, the transition period anchored in the accession protocol would end around that year as well. The 2016 problem makes the continuation of the current specialisation trends much more difficult. It underpins the need to move away from the current one-sided concentration on the Russian market and towards an export orientation. Certainly, the challenge put forward by the 2016 problem has to be addressed much earlier than 2016.
4.5 Exclave costs The exclave location of the region can conceal potential development opportunities. The drawbacks are much more evident. Exclavity entails a number of specific costs for the regional economy, which have been estimated by Gareev, Zhdanov & Fedorov (2005). Above all,

84 | EVGENY VINOKUROV
exclavity increases transactional costs for the regional economy in terms of losses and additional expenses. The costs can be divided into three categories:
1) systematic losses and costs caused by territorial detachment, including
• customs duties for Kaliningrad-based production;
• administrative costs for certificates of origin;
• capital withdrawal from circulation for the period of customs clearing;
• the costs of buying quotas for certain categories of goods;
2) additional expenses for transportation and transit, specifically
• higher costs of energy carriers (e.g. natural gas and electricity) owing to longer distances and the costs of transit through foreign territories;
• higher cargo tariffs for Lithuanian and Byelorussian transit;
• the cost of a larger truck/automobile fleet because of time losses for customs clearing and border crossing;
• added expenses for foreign transit (e.g. insurance and ecological duties);
3) additional expenses related to EU enlargement, such as
• more time and labour costs for cargo transit formalities through EU territory; and
• greater costs for cargo transit (insurance, transit declarations, delivery guarantees, veterinary and phytosanitary controls).
According to the estimate of the Kaliningrad Regional Administration, total economic losses and the costs of exclavity in 2004 reached RUB 10.5 bn (€309 mn), including RUB 2.3 bn (€68 mn) for the first category, RUB 5.5 bn (€162 mn) for the second category and RUB 2.7 bn (€79 mn) for the third category. Exclave costs were estimated at RUB 8 bn (approximately €230 mn) for 2003. The rise in the volume of exclave costs is the result of economic growth (and the subsequent rise of economic transactions) and EU enlargement.
Three conclusions should be drawn.
The systematic losses and costs can be attributed to Kaliningrad’s exclavity only in the mediate way. In fact, they are directly caused by the SEZ regime. All these elements are necessary for the functioning of the SEZ. These are the transaction costs of the duty-free imports enjoyed by Kaliningrad. They can be approached as exclave costs only insofar as we assume that the SEZ itself has nothing to do with the region’s exclavity. Yet, as the aim of the SEZ is to counteract the drawbacks of exclavity, it is not entirely correct to list these costs as exclave costs. Rather, they represent costs connected with the operation of the SEZ.
Moreover, it is possible to argue that the second and third categories of exclave costs coincide: additional expenses relating to EU enlargement are part of the overall systematic losses and costs arising from territorial detachment and exclave-specific expenses for transportation and exclave–mainland transit. Still, the separation of the costs owing to EU enlargement is well justified in order to estimate the consequences of this process. From a systematic point of view, there are two major categories – the costs stemming from territorial detachment and the additional exclave-specific transaction costs for transportation and transit.
Also, the estimation by Gareev, Zhdanov & Fedorov (2005) only accounts for direct costs. It does not consider the less visible costs of being an exclave, which are much harder to quantify. Such drawbacks include, for example, enclave-specific vulnerability, which necessarily
KALININGRAD: ENCLAVES AND ECONOMIC INTEGRATION | 85
constrains business opportunities through the uncertainty of supplies and production distribution.
Further evidence of exclave costs are the ‘unfairly’ high prices, i.e. the difference in price level cannot be explained by sheer distance. For example, according to the Kaliningrad Regional Administration, the delivery costs of energy carriers by rail on similar distances across Russia and to the exclave through territories of other states in 2004 differed by RUB 70-150 (depending on the type of energy carrier). Therefore, prices for the main types of energy, delivered by railway, were 10-15% higher for Kaliningrad consumers compared with average prices for consumers in mainland Russia. Similarly, Kaliningrad-made goods are more expensive on the Russian market. Thus, the extra costs – compared with the costs of other Russian manufacturers – resulting from the exclave position of the region directly and quite negatively influence the competitiveness of commodities manufactured in the region (EU–Russian Cooperation Programme, 2004d, p. 18).
It is worthwhile to compare exclave costs with the total tax burden. In 2003, a total of RUB 10.4 bn of taxes were collected in the region, while the GRP reached RUB 50.6 bn. That makes RUB 205.4 of tax burden for RUB 1,000 of regional added value (or 20.5%). (The Russian average is 28.9%; the 8.4% difference is explained by the SEZ regime, according to which customs duties are not levied for goods destined for either processing or consumption.) According to the Regional Administration’s estimation, exclave-specific costs totalled RUB 159.1 per RUB 1,000 of GRP (15.9%). Assuming that the tax burden remained at the same level as in 2003, the total burden on the GRP (tax plus exclave-specific costs) was as high as 36.4% (20.5% + 15.9%) (Gareev, Zhdanov & Fedorov, 2005).
4.6 Cargo transit, passenger transit and border trading Cargo transit, passenger transit and border (shuttle) trade stand out among the issues connected with exclave costs, exacerbated by the tightening of the border regime on the part of Kaliningrad’s immediate neighbours, Lithuania and Poland. Each of these three issues is problematic. Despite the fact that the focus of attention on the ‘Kaliningrad crisis’ in EU–Russian relations in 2002–03 was specifically on passenger transit, its importance is inferior to cargo transit from the point of view of regional economic development.
Cargo transit. An analysis of the current situation reveals that the increased costs of cargo transit through Lithuania primarily stem from the following key factors:
• increased fees for and the increased frequency of veterinary and phytosanitary controls;
• an obligatory financial guarantee issued by a Lithuanian insurance company; and
• increased fees for services rendered by Lithuanian customs brokers.
In response to the new transit regulations and procedures that took effect on 1 May 2004, a new business opportunity emerged around the servicing of transit cargoes with dozens of Lithuanian commercial (insurance and brokerage) companies profiting. The negotiations of 2003–04 failed to establish new efficient rules and procedures for the cargo transit and goods that would account for Kaliningrad specificities, including the fact that these cargoes, although transported through EU territory, were still domestic Russian shipping by nature. Instead, EU norms have been applied to cargoes in a straightforward manner. The resulting procedure was in contradiction of the initial decision by both sides to simplify the procedures and to replace them, where possible, with an automated electronic system. It was also initially envisaged that “due to simplified administrative procedures, administrative costs for customs transit will be lower on 1 May 2004 than before EU enlargement” (EU–Russia, 2004). Yet contrary to this statement, the procedures have grown more sophisticated and subsequently the costs have risen. The
86 | EVGENY VINOKUROV
automated system was not put into wide use for artificial reasons: Russian carriers must purchase a financial guarantee issued by an EU member-state insurance company. Doing so requires filling in the Lithuanian bill of entry, the ‘paper’ component of customs procedures, which forces Russian carriers to resort to services rendered by Lithuanian brokers (Zernov & Shopin, 2005).
The rise of transaction costs in transit has several components. To begin with, services that are provided by Lithuanian customs brokers to fill in customs declarations (necessitated by the obligatory financial guarantee by a Lithuanian insurance company) have entailed a 30% increase in costs. Furthermore, an analysis of the current approach to phytosanitary inspection fees poses questions. Actual fees (laboratory checks excluded) amount to €14 per article (code) of goods in a vehicle and €16.5 per article (code) of goods in a railway carriage. Fees for laboratory tests are €4.8 for the identification of one hazardous organism and €9.6 for the identification of two hazardous organisms. Also, veterinary control fees amount to €28 per article (code) of goods. (In the course of preparing this report, however, EU standard amounts and procedures for imposing fees were not found in available, official EU documents regulating veterinary control.) As a result, the exporter must pay $250-300 for various duties (including cargo insurance of $6-50, civil liability insurance of $48, driver’s insurance of $3, transit customs declaration of $12-$80, veterinary control of $12, obligatory parking of $3 and a fixed rate for excise goods of $90). Also, the exporter must fill out nine supplementary documents, ranging from transit permission to the various insurance forms (Perspektiva XXI, 2004, pp. 33-34). According to the estimation of the Kaliningrad Regional Administration, total economic losses and costs owing to EU enlargement (i.e. additional expenses for the cargo transit formalities) were roughly RUB 2.7 bn (slightly less than $100 mn) in 2004.
Only at the very end of 2005 did Russian and Lithuanian customs services sign an agreement on the electronic declaration of transit cargoes. The agreement stipulated that the customs declaration of cargoes delivered to the Kaliningrad region from Moscow, for example, would be e-mailed to Lithuanian customs officers, who would thus know about the amount, quality and list of goods in advance. This procedure should eliminate a substantial degree of costly customs-clearance procedures. The electronic declaration procedure fully conforms to EU regulations.
Passenger transit. Developments on the issue of Lithuanian passenger transit are described in detail in Vinokurov (2004a and 2004c). Passenger transit became the focal point of the trilateral negotiations between Russia, the EU and Lithuania in 2002–03. In Russia in particular this issue was connected to concerns of state sovereignty and integrity. The final solution represented a mix of no-cost visas and the introduction of the two types of specific transit documents, the Facilitated Transit Document (FTD) and the Facilitated Railway Transit Document (FRTD). The remarkable feature of the final solution is that it is especially costly on the Lithuanian side, but the expenses (about €40 mn for the first three years) are covered by the EU. The European Commission found it more appropriate to allocate a large amount of money to compensate Lithuania than to compromise on visa-free passenger transit for Kaliningrad residents.
The scheme for the FRTD functions quite well. The percentage of rejections is very low. So too is the number of persons jumping off the train (despite it having been a major concern of the EU side during the negotiations). The FTDs have proved unpopular, however, as drivers prefer to obtain an annual Lithuanian visa, which is issued free of charge for residents of the Kaliningrad region.
Border trade. The 2004 data for border crossings point to a negative impact of EU enlargement. The decline in border crossings on the one hand and the substantial rise of economic activity and trade in the region on the other hand can only be explained by the consequences of enlargement on border regimes.
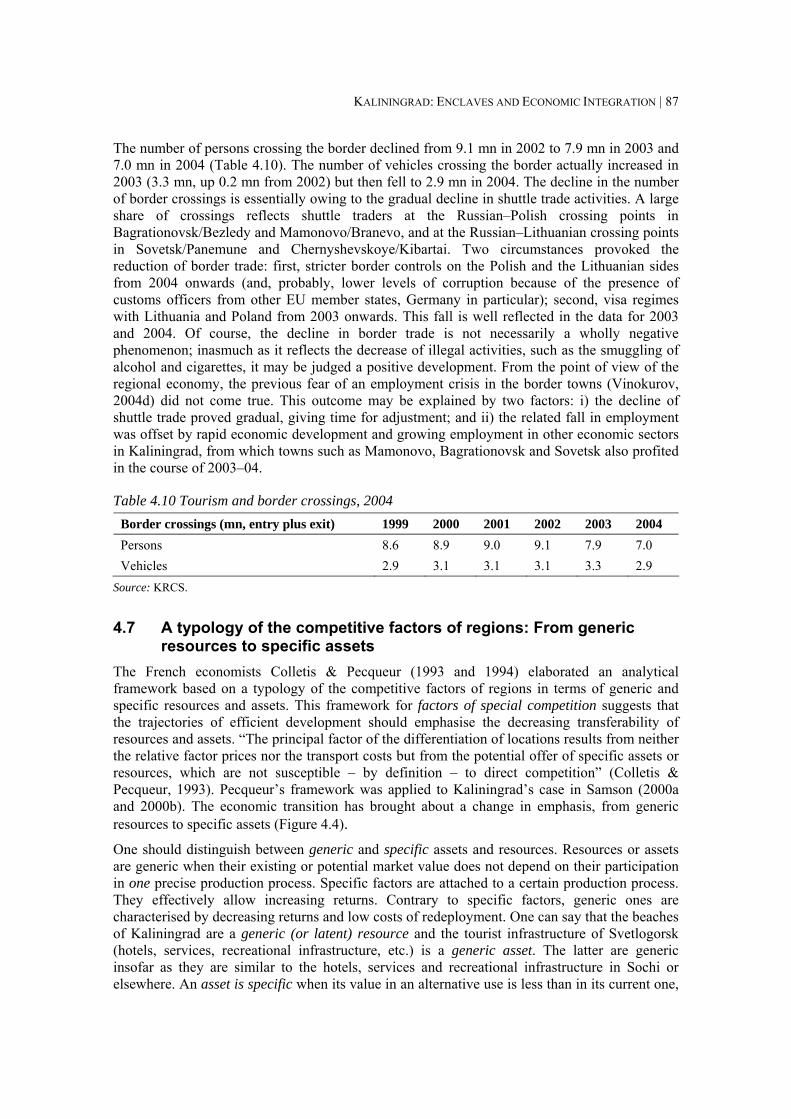
KALININGRAD: ENCLAVES AND ECONOMIC INTEGRATION | 87
The number of persons crossing the border declined from 9.1 mn in 2002 to 7.9 mn in 2003 and 7.0 mn in 2004 (Table 4.10). The number of vehicles crossing the border actually increased in 2003 (3.3 mn, up 0.2 mn from 2002) but then fell to 2.9 mn in 2004. The decline in the number of border crossings is essentially owing to the gradual decline in shuttle trade activities. A large share of crossings reflects shuttle traders at the Russian–Polish crossing points in Bagrationovsk/Bezledy and Mamonovo/Branevo, and at the Russian–Lithuanian crossing points in Sovetsk/Panemune and Chernyshevskoye/Kibartai. Two circumstances provoked the reduction of border trade: first, stricter border controls on the Polish and the Lithuanian sides from 2004 onwards (and, probably, lower levels of corruption because of the presence of customs officers from other EU member states, Germany in particular); second, visa regimes with Lithuania and Poland from 2003 onwards. This fall is well reflected in the data for 2003 and 2004. Of course, the decline in border trade is not necessarily a wholly negative phenomenon; inasmuch as it reflects the decrease of illegal activities, such as the smuggling of alcohol and cigarettes, it may be judged a positive development. From the point of view of the regional economy, the previous fear of an employment crisis in the border towns (Vinokurov, 2004d) did not come true. This outcome may be explained by two factors: i) the decline of shuttle trade proved gradual, giving time for adjustment; and ii) the related fall in employment was offset by rapid economic development and growing employment in other economic sectors in Kaliningrad, from which towns such as Mamonovo, Bagrationovsk and Sovetsk also profited in the course of 2003–04.
Table 4.10 Tourism and border crossings, 2004 Border crossings (mn, entry plus exit) 1999 2000 2001 2002 2003 2004 Persons 8.6 8.9 9.0 9.1 7.9 7.0 Vehicles 2.9 3.1 3.1 3.1 3.3 2.9
Source: KRCS.
4.7 A typology of the competitive factors of regions: From generic resources to specific assets
The French economists Colletis & Pecqueur (1993 and 1994) elaborated an analytical framework based on a typology of the competitive factors of regions in terms of generic and specific resources and assets. This framework for factors of special competition suggests that the trajectories of efficient development should emphasise the decreasing transferability of resources and assets. “The principal factor of the differentiation of locations results from neither the relative factor prices nor the transport costs but from the potential offer of specific assets or resources, which are not susceptible – by definition – to direct competition” (Colletis & Pecqueur, 1993). Pecqueur’s framework was applied to Kaliningrad’s case in Samson (2000a and 2000b). The economic transition has brought about a change in emphasis, from generic resources to specific assets (Figure 4.4). One should distinguish between generic and specific assets and resources. Resources or assets are generic when their existing or potential market value does not depend on their participation in one precise production process. Specific factors are attached to a certain production process. They effectively allow increasing returns. Contrary to specific factors, generic ones are characterised by decreasing returns and low costs of redeployment. One can say that the beaches of Kaliningrad are a generic (or latent) resource and the tourist infrastructure of Svetlogorsk (hotels, services, recreational infrastructure, etc.) is a generic asset. The latter are generic insofar as they are similar to the hotels, services and recreational infrastructure in Sochi or elsewhere. An asset is specific when its value in an alternative use is less than in its current one,
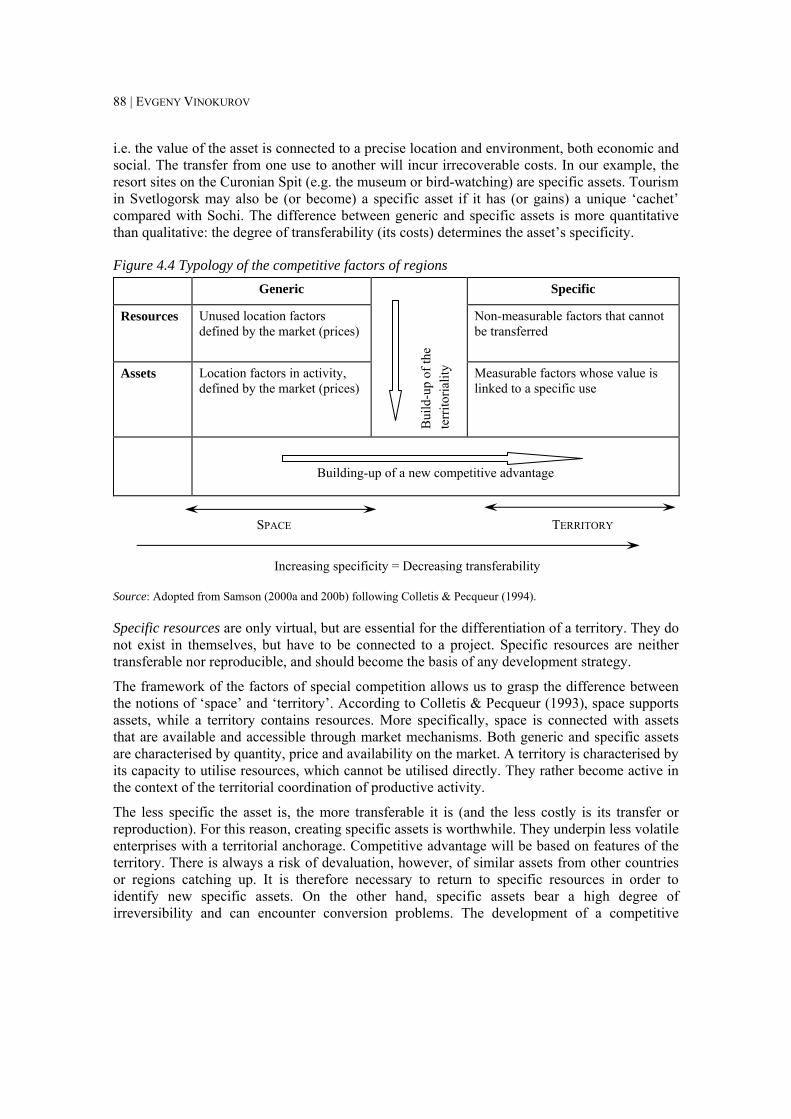
88 | EVGENY VINOKUROV
i.e. the value of the asset is connected to a precise location and environment, both economic and social. The transfer from one use to another will incur irrecoverable costs. In our example, the resort sites on the Curonian Spit (e.g. the museum or bird-watching) are specific assets. Tourism in Svetlogorsk may also be (or become) a specific asset if it has (or gains) a unique ‘cachet’ compared with Sochi. The difference between generic and specific assets is more quantitative than qualitative: the degree of transferability (its costs) determines the asset’s specificity.
Figure 4.4 Typology of the competitive factors of regions Generic Specific
Resources Unused location factors defined by the market (prices)
Non-measurable factors that cannot be transferred
Assets Location factors in activity, defined by the market (prices)
Bui
ld-u
p of
the
terr
itoria
lity Measurable factors whose value is
linked to a specific use
Building-up of a new competitive advantage
SPACE TERRITORY
Increasing specificity = Decreasing transferability
Source: Adopted from Samson (2000a and 200b) following Colletis & Pecqueur (1994).
Specific resources are only virtual, but are essential for the differentiation of a territory. They do not exist in themselves, but have to be connected to a project. Specific resources are neither transferable nor reproducible, and should become the basis of any development strategy.
The framework of the factors of special competition allows us to grasp the difference between the notions of ‘space’ and ‘territory’. According to Colletis & Pecqueur (1993), space supports assets, while a territory contains resources. More specifically, space is connected with assets that are available and accessible through market mechanisms. Both generic and specific assets are characterised by quantity, price and availability on the market. A territory is characterised by its capacity to utilise resources, which cannot be utilised directly. They rather become active in the context of the territorial coordination of productive activity.
The less specific the asset is, the more transferable it is (and the less costly is its transfer or reproduction). For this reason, creating specific assets is worthwhile. They underpin less volatile enterprises with a territorial anchorage. Competitive advantage will be based on features of the territory. There is always a risk of devaluation, however, of similar assets from other countries or regions catching up. It is therefore necessary to return to specific resources in order to identify new specific assets. On the other hand, specific assets bear a high degree of irreversibility and can encounter conversion problems. The development of a competitive
KALININGRAD: ENCLAVES AND ECONOMIC INTEGRATION | 89
advantage requires the long-term differentiation of a territory that can rely solely on specific resources and their interaction with specific assets (Samson, 2000b, pp. 75, 90).3
It is possible to deduct two types of factor transformation:
1) specification, i.e. the conversion from a generic factor to a specific factor; and
2) activation, i.e. the passage from a latent factor to an active factor (Colletis-Wahl & Perrat, 2004, p. 120).
Figure 4.5 illustrates an application of this diagnosis-audit method to Kaliningrad’s resources. The point is that a development strategy based on specific resources will
• rely on value-added activities;
• provide long-term competitive advantages; and
• prevent the departure of footloose activities.
Three development strategies are possible (see arrows in Figure 4.6).
1) The low development path is the shift from generic resources to generic assets, e.g. the valorisation of standard competitive advantages such as beaches in seaside tourism or a cheap workforce in labour-intensive industries. This approach could bring resources in the short term; it should not be neglected in relation to starting internal accumulation. Nevertheless, this path contains a major weakness insofar as the location decisions are based on looking for factors at a bargain price and, therefore, can be reversed relatively easily. Competitive advantages based mainly on price will make it possible to develop activities with general features that can be transferred elsewhere, and which cannot guarantee long-term development.
2) The high development path is the shift from generic assets to specific assets, as in the upstream movement towards value-added manufacturing or service activities. This method entails the building of territoriality, i.e. the change from a non-differentiated space with reversible effects to a differentiated territory wherein the connections among economic actors create an ‘atmosphere’ with innovative impulses and resources for competitiveness. It is possible to start with the low development path and then to shift towards the high one. This approach is close to the development patterns of emerging South-East Asian countries such as South Korea, Hong Kong and Singapore (although occurring under very specific conditions, after the resolution of agrarian issues, thanks to FDI and with strong state control).
3) The creation of new competitive advantages is the shift from generic resources towards specific resources and then to specific assets (the long arrow in Figure 4.6). This strategy relies on the long-term development of resources that will become difficult to find elsewhere. It first requires the identification of the specific resources, ways to shift from generic to specific resources and finally the identification (or creation) of the institutional actors able to valorise them.
3 Colletis & Pecqueur’s (1993) typology is in line with Porter’s (1990) argumentation on generalised and specific factors and the factor-creation mechanisms.
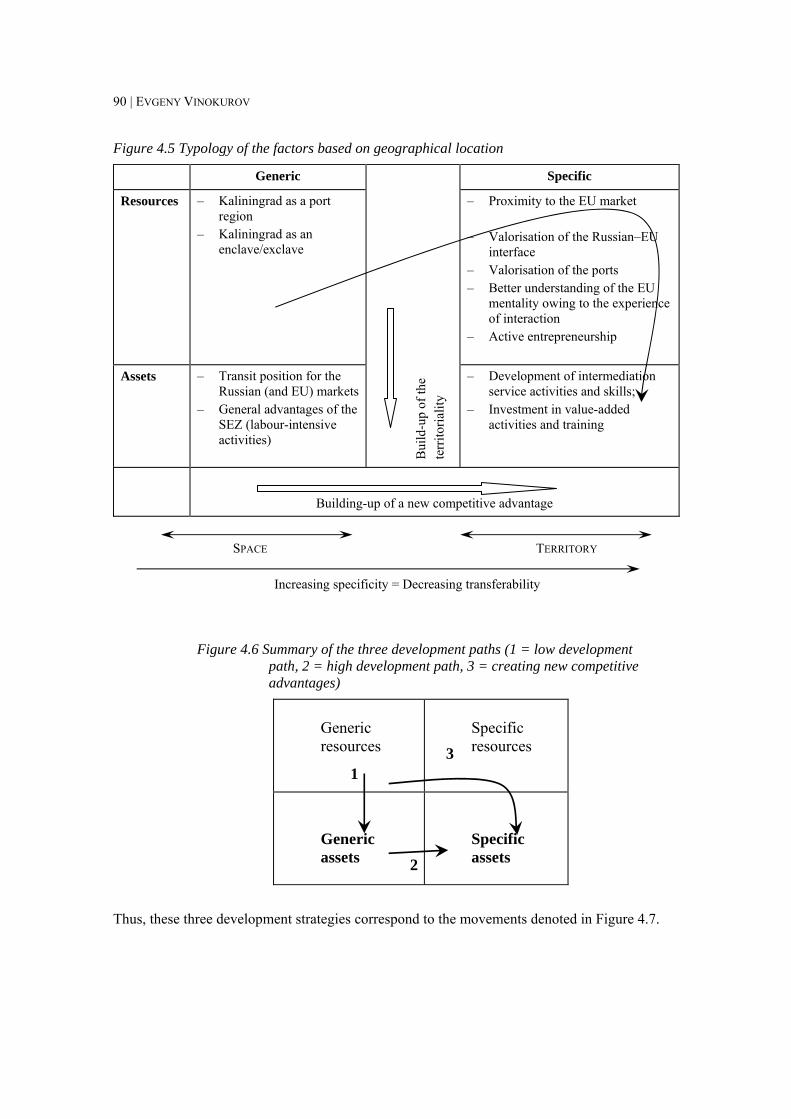
90 | EVGENY VINOKUROV
Figure 4.5 Typology of the factors based on geographical location
Generic Specific
Resources – Kaliningrad as a port region
– Kaliningrad as an enclave/exclave
– Proximity to the EU market – Valorisation of the Russian–EU
interface – Valorisation of the ports – Better understanding of the EU
mentality owing to the experience of interaction
– Active entrepreneurship
Assets – Transit position for the Russian (and EU) markets
– General advantages of the SEZ (labour-intensive activities)
Bui
ld-u
p of
the
terr
itoria
lity
– Development of intermediation service activities and skills;
– Investment in value-added activities and training
Building-up of a new competitive advantage
SPACE TERRITORY
Increasing specificity = Decreasing transferability
Figure 4.6 Summary of the three development paths (1 = low development path, 2 = high development path, 3 = creating new competitive advantages)
Generic resources
Specific resources
Generic assets
Specific assets
Thus, these three development strategies correspond to the movements denoted in Figure 4.7.
3
2
1
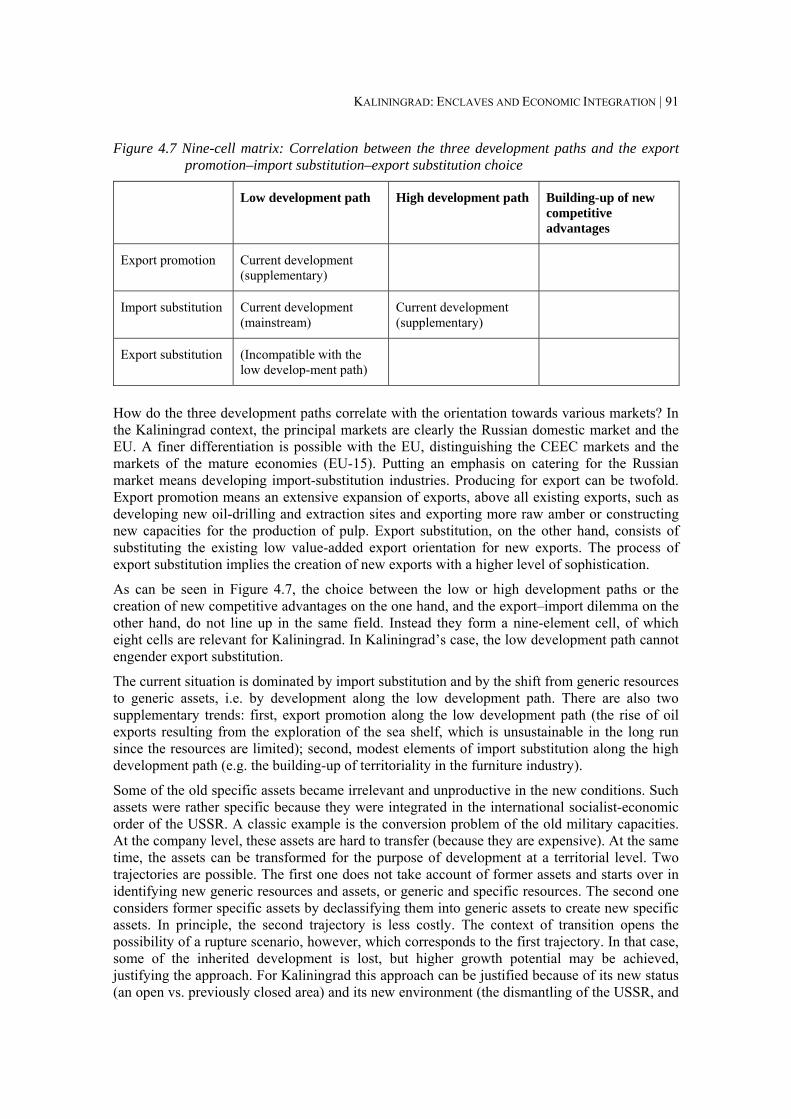
KALININGRAD: ENCLAVES AND ECONOMIC INTEGRATION | 91
Figure 4.7 Nine-cell matrix: Correlation between the three development paths and the export promotion–import substitution–export substitution choice
Low development path High development path Building-up of new competitive advantages
Export promotion Current development (supplementary)
Import substitution Current development (mainstream)
Current development (supplementary)
Export substitution (Incompatible with the low develop-ment path)
How do the three development paths correlate with the orientation towards various markets? In the Kaliningrad context, the principal markets are clearly the Russian domestic market and the EU. A finer differentiation is possible with the EU, distinguishing the CEEC markets and the markets of the mature economies (EU-15). Putting an emphasis on catering for the Russian market means developing import-substitution industries. Producing for export can be twofold. Export promotion means an extensive expansion of exports, above all existing exports, such as developing new oil-drilling and extraction sites and exporting more raw amber or constructing new capacities for the production of pulp. Export substitution, on the other hand, consists of substituting the existing low value-added export orientation for new exports. The process of export substitution implies the creation of new exports with a higher level of sophistication.
As can be seen in Figure 4.7, the choice between the low or high development paths or the creation of new competitive advantages on the one hand, and the export–import dilemma on the other hand, do not line up in the same field. Instead they form a nine-element cell, of which eight cells are relevant for Kaliningrad. In Kaliningrad’s case, the low development path cannot engender export substitution.
The current situation is dominated by import substitution and by the shift from generic resources to generic assets, i.e. by development along the low development path. There are also two supplementary trends: first, export promotion along the low development path (the rise of oil exports resulting from the exploration of the sea shelf, which is unsustainable in the long run since the resources are limited); second, modest elements of import substitution along the high development path (e.g. the building-up of territoriality in the furniture industry).
Some of the old specific assets became irrelevant and unproductive in the new conditions. Such assets were rather specific because they were integrated in the international socialist-economic order of the USSR. A classic example is the conversion problem of the old military capacities. At the company level, these assets are hard to transfer (because they are expensive). At the same time, the assets can be transformed for the purpose of development at a territorial level. Two trajectories are possible. The first one does not take account of former assets and starts over in identifying new generic resources and assets, or generic and specific resources. The second one considers former specific assets by declassifying them into generic assets to create new specific assets. In principle, the second trajectory is less costly. The context of transition opens the possibility of a rupture scenario, however, which corresponds to the first trajectory. In that case, some of the inherited development is lost, but higher growth potential may be achieved, justifying the approach. For Kaliningrad this approach can be justified because of its new status (an open vs. previously closed area) and its new environment (the dismantling of the USSR, and
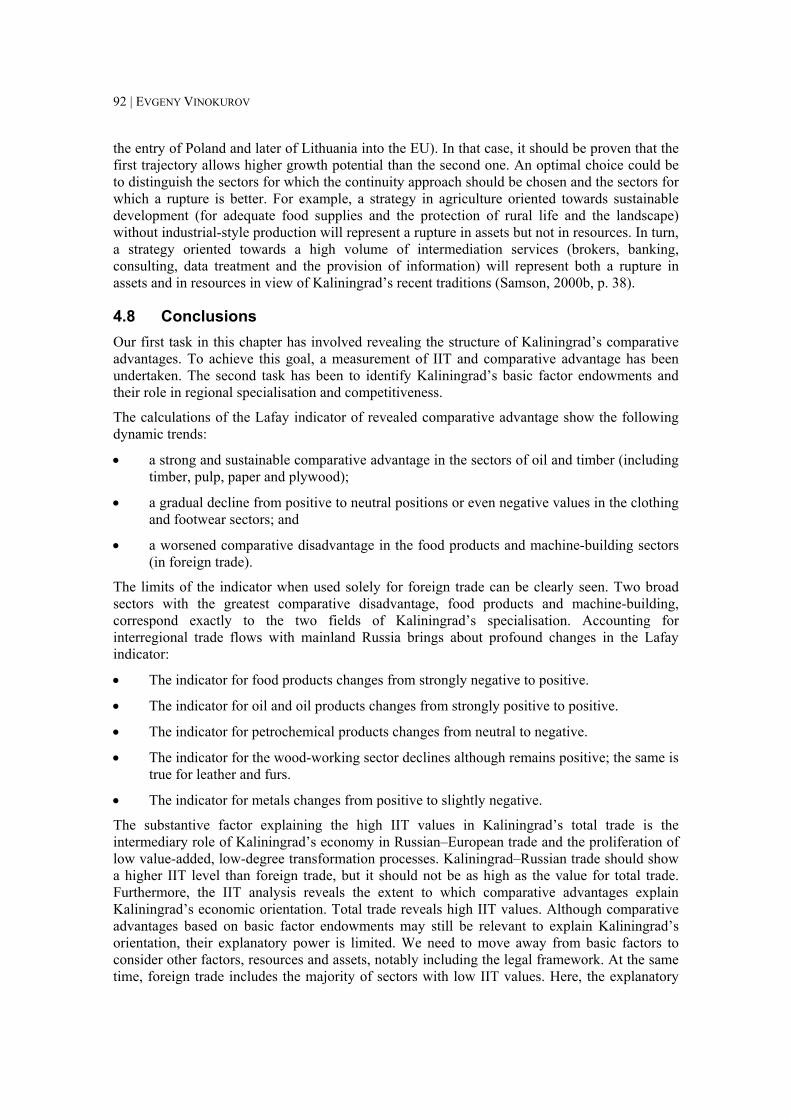
92 | EVGENY VINOKUROV
the entry of Poland and later of Lithuania into the EU). In that case, it should be proven that the first trajectory allows higher growth potential than the second one. An optimal choice could be to distinguish the sectors for which the continuity approach should be chosen and the sectors for which a rupture is better. For example, a strategy in agriculture oriented towards sustainable development (for adequate food supplies and the protection of rural life and the landscape) without industrial-style production will represent a rupture in assets but not in resources. In turn, a strategy oriented towards a high volume of intermediation services (brokers, banking, consulting, data treatment and the provision of information) will represent both a rupture in assets and in resources in view of Kaliningrad’s recent traditions (Samson, 2000b, p. 38).
4.8 Conclusions Our first task in this chapter has involved revealing the structure of Kaliningrad’s comparative advantages. To achieve this goal, a measurement of IIT and comparative advantage has been undertaken. The second task has been to identify Kaliningrad’s basic factor endowments and their role in regional specialisation and competitiveness.
The calculations of the Lafay indicator of revealed comparative advantage show the following dynamic trends:
• a strong and sustainable comparative advantage in the sectors of oil and timber (including timber, pulp, paper and plywood);
• a gradual decline from positive to neutral positions or even negative values in the clothing and footwear sectors; and
• a worsened comparative disadvantage in the food products and machine-building sectors (in foreign trade).
The limits of the indicator when used solely for foreign trade can be clearly seen. Two broad sectors with the greatest comparative disadvantage, food products and machine-building, correspond exactly to the two fields of Kaliningrad’s specialisation. Accounting for interregional trade flows with mainland Russia brings about profound changes in the Lafay indicator:
• The indicator for food products changes from strongly negative to positive.
• The indicator for oil and oil products changes from strongly positive to positive.
• The indicator for petrochemical products changes from neutral to negative.
• The indicator for the wood-working sector declines although remains positive; the same is true for leather and furs.
• The indicator for metals changes from positive to slightly negative.
The substantive factor explaining the high IIT values in Kaliningrad’s total trade is the intermediary role of Kaliningrad’s economy in Russian–European trade and the proliferation of low value-added, low-degree transformation processes. Kaliningrad–Russian trade should show a higher IIT level than foreign trade, but it should not be as high as the value for total trade. Furthermore, the IIT analysis reveals the extent to which comparative advantages explain Kaliningrad’s economic orientation. Total trade reveals high IIT values. Although comparative advantages based on basic factor endowments may still be relevant to explain Kaliningrad’s orientation, their explanatory power is limited. We need to move away from basic factors to consider other factors, resources and assets, notably including the legal framework. At the same time, foreign trade includes the majority of sectors with low IIT values. Here, the explanatory
KALININGRAD: ENCLAVES AND ECONOMIC INTEGRATION | 93
power of comparative advantage is rather strong and still highly relevant for Kaliningrad’s specialisation.
The contrast of all-Russia comparative advantages with those of Kaliningrad leads to the following observation. Kaliningrad’s comparative advantages coincide with all-Russia ones as regards exports (oil, timber, metals and metal-working and pulp). Yet the region also possesses comparative advantages in consumer electronics and food products, which are sectors with a markedly strong disadvantage in Russia. The correspondence is clear: Kaliningrad’s comparative advantages are developing in those fields of import substitution in which the conditions are best for a partial compensation of the Russian disadvantage.
The wages/labour productivity ratio in the Kaliningrad region, Russia as a whole and Lithuania (except for mechanical engineering) is approximately the same. Meanwhile, the relation between labour costs and productivity in the region’s industry is 2-2.5 times less than in ‘old’ EU member states. This feature determines the current orientation of Kaliningrad’s industry and, under certain conditions, can be one of the factors underpinning the competitiveness of Kaliningrad products exported to foreign markets. Kaliningrad holds comparative advantages in labour-intensive products compared with the old EU member states and, to a much lesser degree, the CEECs. But there is no comparative advantage based on the labour costs/labour efficiency ratio in relation to Lithuania or to mainland Russia.
Despite certain advantages over foreign companies in terms of the labour costs involved (reflected in the ULC indicator), Kaliningrad firms yield considerably to their overseas counterparts in technological advances (reflected in the capital/labour ratio). This circumstance amounts to a serious disadvantage in capital-intensive goods.
Finally, as regards energy and fuel costs as an important production factor in a number of industries, Kaliningrad holds a strong advantage compared with the EU, including the new member states. That being stated, the spread in energy prices is gradually diminishing. Also, Kaliningrad finds itself slightly at a disadvantage regarding energy tariffs in relation to mainland Russia.
Conclusions about the problems in terms of the labour-, capital- and energy-intensive nature of firms in Kaliningrad can be summed-up in the following points. Kaliningrad is markedly weak in capital-intensive industries. Its weakness in energy-intensive industries in comparison with mainland Russia, combined with its remoteness from principal raw materials, conditions its comparative disadvantage in energy-intensive manufacturing. A regional comparative advantage is only present in labour-intensive sectors.
The analysis of the cost structure allows the identification of several general factors influencing Kaliningrad companies’ competitiveness with regard to costs. Companies receiving raw materials from Russia have to bear a higher level of costs for components, significantly exceeding the average indices across the country. At the same time, the share of material costs in the structure of aggregate production costs in companies oriented to foreign markets (meat-processing and mechanical engineering) is comparable to indices typical for foreign companies. This result can be explained by the distance of Kaliningrad companies from Russian raw material sources, which leads to an increase in the costs of delivery of the components, spare parts and materials to the Kaliningrad region.
Does the current economic orientation correspond to Kaliningrad’s factor endowments? Is there a coherence or contradiction between them? Kaliningrad’s economic orientation and the major shift that has occurred in one and a half decades of transition have been described in chapters 2 and 3. In the present chapter, we have determined that the use of advantages in labour costs and efficiency, along with external factors, has played an important role in shaping of the direction taken by the regional economy. Today’s economic orientation cannot be successfully explained
94 | EVGENY VINOKUROV
by labour costs alone, however. It must be viewed in combination with other factors, particularly the SEZ regime. Within the typology of regional competitiveness factors (Colletis & Pecqueur, 1994) and the three development paths elaborated in Samson (2000b), the situation in the region is dominated by import substitution and by a shift from generic resources to generic assets, i.e. along a low development path. There are two supplementary trends: first, export promotion along the low development path (the rise of oil exports due to the exploration of the sea shelf, which is unsustainable in the long run since the resources are limited); and second, modest elements of import substitution along the high development path (e.g. the creation of territoriality in the furniture industry). The SEZ regime plays a major role in valorising the advantage in labour costs, partially to the detriment of more promising resources.
| 95
Chapter 5 Regional specialisation, optimal development trajectory
and distribution of GRP: A synthesis
5.1 A review of development strategies Four research questions were put forward in the introduction of this report:
1) What is the relation between enclave costs and benefits and how is it possible to make enclavity an advantage rather than a disadvantage?
2) What are the structural characteristics of Kaliningrad’s economy? 3) What is an optimal development strategy for Kaliningrad in view of its
enclavity/exclavity, comparative/competitive advantages, its current specialisation and various economic challenges?
4) Does the current state of Russian–EU relations make such a strategy possible or is further development of EU–Russian relations necessary?
Chapter 1 concentrated on the first question and chapters 2-4 provided an answer to the second. Overall, the current chapter aims at synthesising the previous findings to provide answers to the two remaining research questions on the theme of an optimal development strategy.
First, we review the major development strategies for the Kaliningrad region proposed by scientists and practitioners in the last decade. Some of these strategies have guided contemporary policy to a certain extent. It is clear that the strategies possess many overlapping elements and their substance may not differ as much as may be presumed by public arguments. Table 5.1 compares the major proposals, namely the economic strategy elaborated under the leadership of Ivan Samson (2000a and 2000b), the region of cooperation, the pilot region, the official Strategy of Socio-Economic Development until 2010 and the ‘unsinkable assembly shop’.
The comparison reveals a number of commonalities of major importance. All of the proposals stress the necessity of openness – there exists a consensus that autarky or one-sided orientation (‘fortress’ or ‘aircraft-carrier’ Kaliningrad) is not an option. All of the strategies presuppose the development of economic relations with the EU. The region should valorise the Russian–EU interface and find an adequate place within the framework of Russian–EU economic cooperation. The degree of proposed cooperation or integration varies, however. Also, all of the proposals stress the importance of exports for the region, but differ on the issue of whether the export orientation should be exclusive or be combined with an orientation towards the Russian market. Furthermore, there is a wide consensus on the necessity to preserve the SEZ but to revise the SEZ mechanism. But the devil is in the details, as they differ on the theme of modifications to the SEZ regime.
The principal divide is on the issue of a specific industry focus and on the question of state intervention, i.e. whether the state should conduct an active industrial policy and which industries should be supported. Samson’s proposal (2000a and 2000b) and the pilot region concept are on the liberal side of the divide, as they assume no specific industry focus. Accordingly, the state should concentrate on the creation of general incentives heading towards upper-scale functions and the valorisation of the Russian–EU interface. Yet such approaches of the region of cooperation and the Strategy of Socio-Economic Development are more proactive. They propose certain backbone and breakthrough sectors, with an accent on infrastructure (especially transport) and on issues of economic security (energy and agriculture).
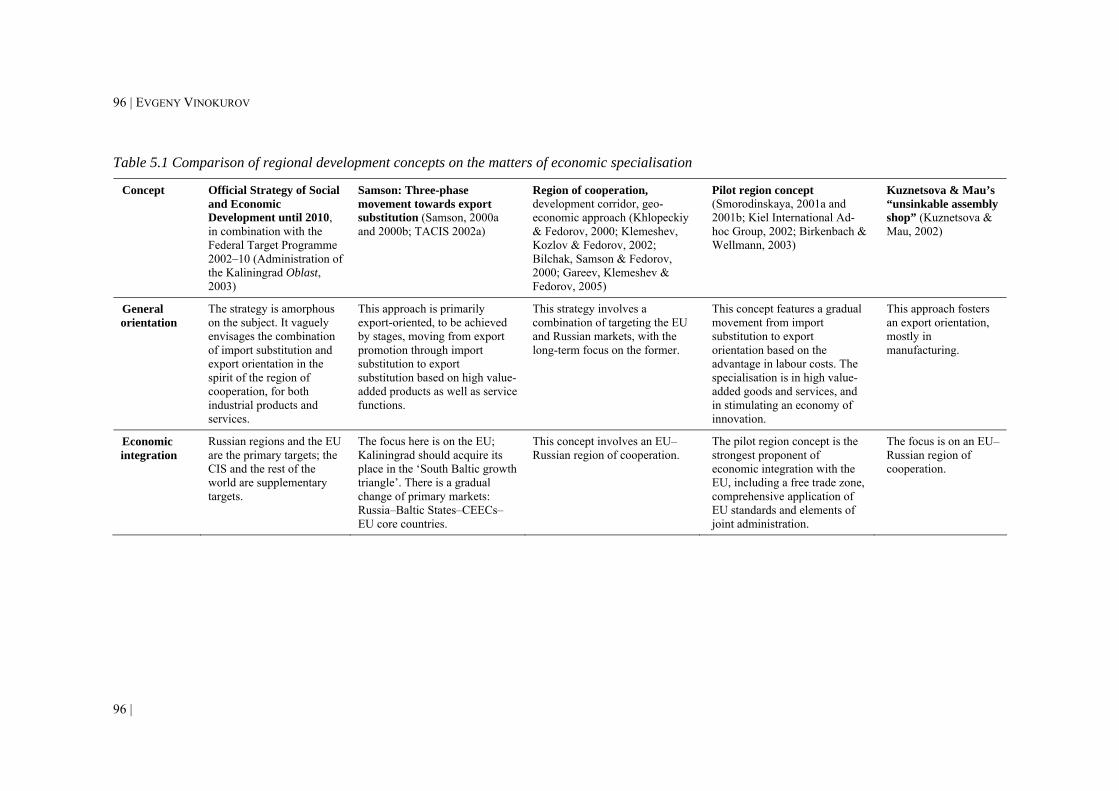
96 | EVGENY VINOKUROV
96 |
Table 5.1 Comparison of regional development concepts on the matters of economic specialisation
Concept Official Strategy of Social and Economic Development until 2010, in combination with the Federal Target Programme 2002–10 (Administration of the Kaliningrad Oblast, 2003)
Samson: Three-phase movement towards export substitution (Samson, 2000a and 2000b; TACIS 2002a)
Region of cooperation, development corridor, geo-economic approach (Khlopeckiy & Fedorov, 2000; Klemeshev, Kozlov & Fedorov, 2002; Bilchak, Samson & Fedorov, 2000; Gareev, Klemeshev & Fedorov, 2005)
Pilot region concept (Smorodinskaya, 2001a and 2001b; Kiel International Ad-hoc Group, 2002; Birkenbach & Wellmann, 2003)
Kuznetsova & Mau’s “unsinkable assembly shop” (Kuznetsova & Mau, 2002)
General orientation
The strategy is amorphous on the subject. It vaguely envisages the combination of import substitution and export orientation in the spirit of the region of cooperation, for both industrial products and services.
This approach is primarily export-oriented, to be achieved by stages, moving from export promotion through import substitution to export substitution based on high value-added products as well as service functions.
This strategy involves a combination of targeting the EU and Russian markets, with the long-term focus on the former.
This concept features a gradual movement from import substitution to export orientation based on the advantage in labour costs. The specialisation is in high value-added goods and services, and in stimulating an economy of innovation.
This approach fosters an export orientation, mostly in manufacturing.
Economic integration
Russian regions and the EU are the primary targets; the CIS and the rest of the world are supplementary targets.
The focus here is on the EU; Kaliningrad should acquire its place in the ‘South Baltic growth triangle’. There is a gradual change of primary markets: Russia–Baltic States–CEECs–EU core countries.
This concept involves an EU–Russian region of cooperation.
The pilot region concept is the strongest proponent of economic integration with the EU, including a free trade zone, comprehensive application of EU standards and elements of joint administration.
The focus is on an EU–Russian region of cooperation.
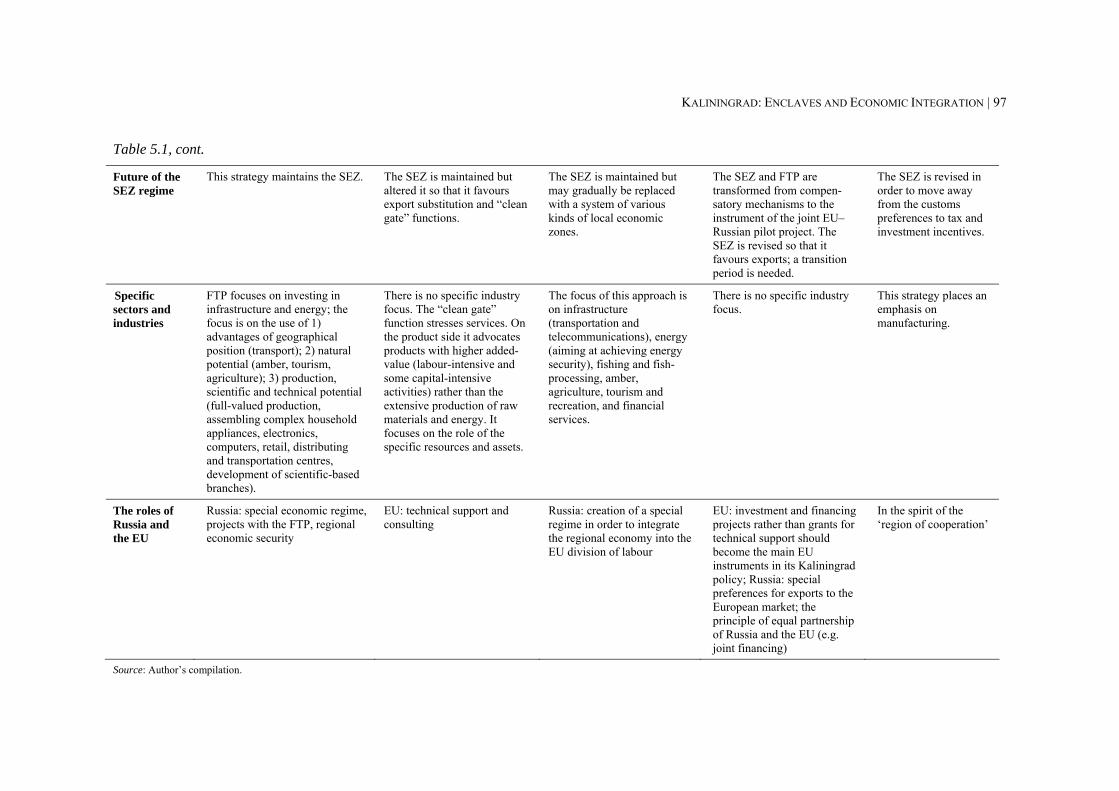
KALININGRAD: ENCLAVES AND ECONOMIC INTEGRATION | 97
Table 5.1, cont.
Future of the SEZ regime
This strategy maintains the SEZ. The SEZ is maintained but altered it so that it favours export substitution and “clean gate” functions.
The SEZ is maintained but may gradually be replaced with a system of various kinds of local economic zones.
The SEZ and FTP are transformed from compen-satory mechanisms to the instrument of the joint EU–Russian pilot project. The SEZ is revised so that it favours exports; a transition period is needed.
The SEZ is revised in order to move away from the customs preferences to tax and investment incentives.
Specific sectors and industries
FTP focuses on investing in infrastructure and energy; the focus is on the use of 1) advantages of geographical position (transport); 2) natural potential (amber, tourism, agriculture); 3) production, scientific and technical potential (full-valued production, assembling complex household appliances, electronics, computers, retail, distributing and transportation centres, development of scientific-based branches).
There is no specific industry focus. The “clean gate” function stresses services. On the product side it advocates products with higher added-value (labour-intensive and some capital-intensive activities) rather than the extensive production of raw materials and energy. It focuses on the role of the specific resources and assets.
The focus of this approach is on infrastructure (transportation and telecommunications), energy (aiming at achieving energy security), fishing and fish-processing, amber, agriculture, tourism and recreation, and financial services.
There is no specific industry focus.
This strategy places an emphasis on manufacturing.
The roles of Russia and the EU
Russia: special economic regime, projects with the FTP, regional economic security
EU: technical support and consulting
Russia: creation of a special regime in order to integrate the regional economy into the EU division of labour
EU: investment and financing projects rather than grants for technical support should become the main EU instruments in its Kaliningrad policy; Russia: special preferences for exports to the European market; the principle of equal partnership of Russia and the EU (e.g. joint financing)
In the spirit of the ‘region of cooperation’
Source: Author’s compilation.
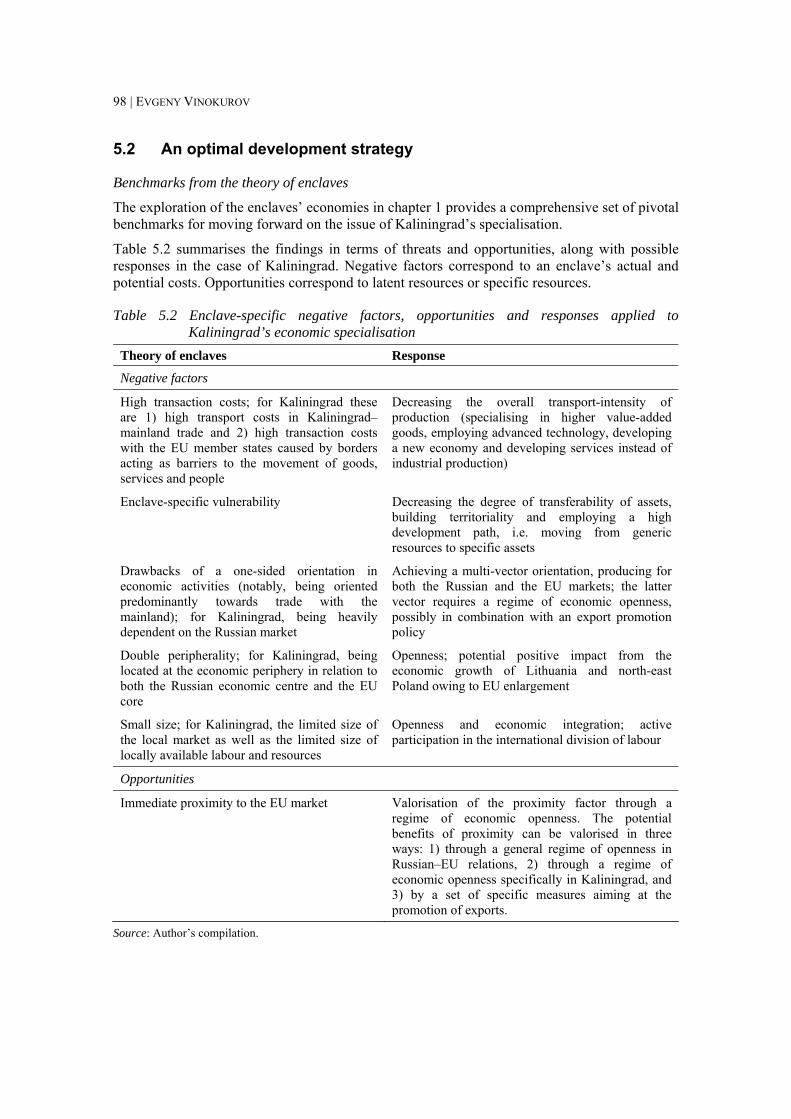
98 | EVGENY VINOKUROV
5.2 An optimal development strategy
Benchmarks from the theory of enclaves
The exploration of the enclaves’ economies in chapter 1 provides a comprehensive set of pivotal benchmarks for moving forward on the issue of Kaliningrad’s specialisation.
Table 5.2 summarises the findings in terms of threats and opportunities, along with possible responses in the case of Kaliningrad. Negative factors correspond to an enclave’s actual and potential costs. Opportunities correspond to latent resources or specific resources.
Table 5.2 Enclave-specific negative factors, opportunities and responses applied to Kaliningrad’s economic specialisation
Theory of enclaves Response
Negative factors
High transaction costs; for Kaliningrad these are 1) high transport costs in Kaliningrad–mainland trade and 2) high transaction costs with the EU member states caused by borders acting as barriers to the movement of goods, services and people
Decreasing the overall transport-intensity of production (specialising in higher value-added goods, employing advanced technology, developing a new economy and developing services instead of industrial production)
Enclave-specific vulnerability Decreasing the degree of transferability of assets, building territoriality and employing a high development path, i.e. moving from generic resources to specific assets
Drawbacks of a one-sided orientation in economic activities (notably, being oriented predominantly towards trade with the mainland); for Kaliningrad, being heavily dependent on the Russian market
Achieving a multi-vector orientation, producing for both the Russian and the EU markets; the latter vector requires a regime of economic openness, possibly in combination with an export promotion policy
Double peripherality; for Kaliningrad, being located at the economic periphery in relation to both the Russian economic centre and the EU core
Openness; potential positive impact from the economic growth of Lithuania and north-east Poland owing to EU enlargement
Small size; for Kaliningrad, the limited size of the local market as well as the limited size of locally available labour and resources
Openness and economic integration; active participation in the international division of labour
Opportunities
Immediate proximity to the EU market Valorisation of the proximity factor through a regime of economic openness. The potential benefits of proximity can be valorised in three ways: 1) through a general regime of openness in Russian–EU relations, 2) through a regime of economic openness specifically in Kaliningrad, and 3) by a set of specific measures aiming at the promotion of exports.
Source: Author’s compilation.
KALININGRAD: ENCLAVES AND ECONOMIC INTEGRATION | 99
Kaliningrad as an import–export ‘double springboard’
Currently, Kaliningrad concentrates almost exclusively on producing for the Russian domestic market. It functions as a springboard for imports to enter the Russian market by using the advantages provided by the SEZ. As shown in chapter 1, successful enclaves tend to develop a multi-vectored orientation, avoiding concentration on the mainland. Kaliningrad’s one-sided orientation is dangerous and unsustainable. The exclusive concentration on the mainland’s market is unequivocally harmful and dangerous from the point of view of sustainable economic growth and enclave-specific vulnerability. Kaliningrad should optimally arrive at a multi-vectored orientation, combining production for both the Russian market and the EU market. Instead of being a springboard towards only the Russian market, Kaliningrad would become a ‘double springboard’. Its capacity to propel trade flows in either direction would be based on the valorisation of its specific resources and the region’s competitive advantages in labour- and transport-intensive manufacturing. The tax incentives of the SEZ would only supplement the more fundamental aspects of regional economic development.
The production of vodka is an instructive, albeit specific, example of why a producer might choose Kaliningrad to manufacture a product for export. In 2003, 2.1% of Russia’s production of vodka and other strong alcoholic beverages took place in Kaliningrad. Meanwhile, Kaliningrad accounted for 24% of vodka exports, so Kaliningrad-based enterprises positioned themselves in the highly profitable segment. Vodka as a good is transport-intensive. Thus, the proximity of Kaliningrad to the principal export market, the EU, steps forward as the reason to produce for export. The remote Russian domestic market is served by other factories located on the mainland, in the vicinity of the market.
The numerous non-tariff and technical barriers to trade (TBTs) complicate access to the EU market. They determine the necessity of export promotion. A comprehensive strategy for export promotion may be required. For this purpose, foreign experience should be studied and adapted to specific circumstances. Yusupov (2000) concludes that export promotion in Russian regions is at a very low level. The nascent state of regional export promotion is related to factors such as i) the great extent to which the export interests of large producers determine the content of regional policies, ii) an obvious insufficiency of resources for comprehensive and long-term export promotion programmes, and iii) the poor coordination of activities at the regional and federal levels. At the same time, grand budgets are not always needed to attain substantial results. A list of possible measures includes information and consulting, marketing support, technical support, etc. Preference should be given to regional SMEs that produce goods with high added value (Yusupov, 2000, pp. 25-26). These proposals correspond to models used in Western and northern Europe, as shown by Borodavkina (2001).
Moving towards an optimal development trajectory
The specific nature of the Kaliningrad region requires original and innovative approaches to the problems of the regional economic specialisation. The factors that determine the region’s economic and political environment only partially coincide with those of other Russian regions. Nor do they coincide with those of adjacent countries and regions. Moreover, issues of international and interregional specialisation in the specific case of Kaliningrad should be viewed together, inseparable from one another.
Development strategies are ways to stimulate or attract and orient investment to achieve stronger growth and a better economic structure. The main variables of development strategies are the amount of investment (investment rate compared with GDP), the origin of investment, its sectoral pattern (leading sectors) and an open economic regime to the foreign environment (highly open, protected or mixed variations). The latter two variables – sectoral patterns and the economic regime – are directly relevant to our investigation of the problems of Kaliningrad’s
100 | EVGENY VINOKUROV
regional specialisation. The main strategies, already tested in the past, are the promotion of exports, import substitution and the substitution of exports. These strategies may be pursued in the framework of a variety of development paths, wherein the main choice is between low and high development trajectories. There is also a third path, which consists of a rupture with the past and the build-up of new competitive advantages in the territory.
Each trajectory represents a different form of economic integration. By following either path, Kaliningrad is fitting, in a unique manner, into the interregional and international division of labour.
As noted in chapter 4, import substitution and the shift from generic resources to generic assets, i.e. development along the low development path, epitomise the current situation in Kaliningrad. There are also two supplementary trends: i) export promotion along the low development path (the rise of oil exports due to the exploration of the sea shelf, unsustainable in the long run since the resources are limited); second, modest elements of import substitution along the high development path (e.g. the building-up of territoriality in the furniture industry).
Import substitution and the shift from generic resources to generic assets, i.e. development along the low development path, epitomise the current situation in Kaliningrad. Meanwhile, the trajectories have to be viewed from the vantage point of relations between exclave costs and latent resources. A successful economic strategy should be able to achieve two results simultaneously. First, it should allow a minimising of exclave costs, which total 15.9% of GRP (Gareev, Zhdanov & Fedorov, 2005).1 Second, a successful strategy should valorise available resources. In other words, it should be favourable to making Kaliningrad’s enclavity a resource. An optimal strategy should induce a specialisation that would be well adapted to the specific conditions of Kaliningrad as an enclave and would simultaneously minimise costs and take advantage of resources. This is certainly a difficult task and no panacea is available. Generally, enclavity/exclavity is a negative factor for economic development. Kaliningrad is no exception, since its enclave status impedes access to the potential benefits of its geographical proximity to the EU market.
For Kaliningrad, taking the low development path means the valorisation of the standard competitive advantages of relatively cheap labour in labour-intensive industries. The low trajectory does not counteract enclave-specific vulnerability, however, since it does not reduce the transferability of assets. Decreasing the degree of transferability of assets and building territoriality is an absolute must for Kaliningrad, since this small and detached region is so exposed to exogenous shocks.
Setting up assembly and manufacturing plants is an important instance of the low development path. Kuznetsova & Mau (2002) argue in favour of a radical change in the region’s specialisation by moving towards an export orientation. The movement should be twofold. The share of domestic production should increase simultaneously with the re-orientation towards the manufacturing (assembling) of export production. The authors illustrate the change by the vivid image of the move from an “unsinkable aircraft-carrier” to an “unsinkable assembly shop”. However bright the image is, it is fallacious because of the “sinkability” of an “assembly shop”. Such specialisation is based on the valorisation of generic assets, most notably advantages in labour costs. This advantage is inherently transient. Moreover, in the case of Kaliningrad, the current comparative advantage in labour-intensive manufacturing is predominantly the result of 1 See section 4.5 on the quantification of some exclave costs. The estimation by Gareev, Zhdanov & Fedorov (2005) accounts only for direct costs. It does not include the less visible costs of being an exclave, which are much harder to quantify. Such drawbacks include, for example, enclave-specific vulnerability, which necessarily constrains business opportunities by the uncertainty of supplies and production distribution.
KALININGRAD: ENCLAVES AND ECONOMIC INTEGRATION | 101
not so much the labour costs per se as the old SEZ regime, which is bound to dissolve by 2016. A gradual movement towards an export orientation is justified in this respect, as the comparative advantage in labour costs relative to the EU is more solid. Nevertheless, the difference is not critical in relation to the CEECs. It also has to be offset against the cost of penetrating the EU market and against exclave costs.
A high development trajectory represents the shift from generic assets to specific assets. An asset is specific when its value in an alternative use is lower than in its current one, i.e. the value of the asset is connected to a precise location and environment, both economic and social. The transfer from one use to another will incur irrecoverable costs. The difference between generic and specific assets is more quantitative than qualitative: the degree of transferability (its costs) determines the asset’s specificity. Creating specific assets will underpin the establishment of less volatile enterprises with a territorial anchorage. A high development trajectory can be described as an upstream movement towards value-added manufacturing or service activities (or both). Territoriality, i.e. the change from a non-differentiated space with reversible effects to a differentiated territory, is built on these foundations. Reducing the degree of transferability of assets by moving from generic to specific assets provides an efficient response to enclave-specific vulnerability.
In fact, a high development path as a route towards economic development is ubiquitous in development economics. It is even more common as a prescription for transition economies. Our point here is that a high development trajectory is especially necessary in Kaliningrad because of its specific enclave status.
The building-up of the territory’s new competitive advantages is based on the shift from generic resources towards specific resources and then to specific assets. The creation of new competitive advantages in the current context of the Kaliningrad region can be viewed as a supplementary trajectory for the development of a new economic specialisation. It is particularly valuable for the development of advanced services.
Two additional reasons to prefer a high development trajectory and the building-up of the territory’s new competitive advantages to the low development trajectory are that the former approaches are more compatible with the objective of reducing the transport- and energy-intensity of the regional economy. Exclave-specific costs for transportation and transit are estimated at €239 mn for 2004. This is a hefty burden for the regional economy, amounting to 12.3% of GRP. The extra costs of the delivery of energy sources by rail for similar distances across Russia and to the exclave through the territories of other states in 2004 led to prices that were 10-15% higher for Kaliningrad consumers in comparison with average consumer prices in mainland Russia (see chapter 4). Specialising in higher value-added goods and employing more advanced technology are means to counteract the problem and to lower the transport- and energy-intensity of industrial production, which lie in the realm of a high development trajectory. Developing an information economy and increasing the share of services in the GRP are means connected to the third development path, which stipulates a rupture in existing assets.
Overall, an optimal strategy would primarily entail switching to the high development trajectory, supplemented by the building-up of new competitive advantages in some sectors. In Figure 5.1, this approach is represented graphically by moving towards four cells in the lower right corner of the nine-cell matrix (first presented in Figure 4.7), showing the correlation between the three development paths and the export promotion–import substitution–export substitution choice.
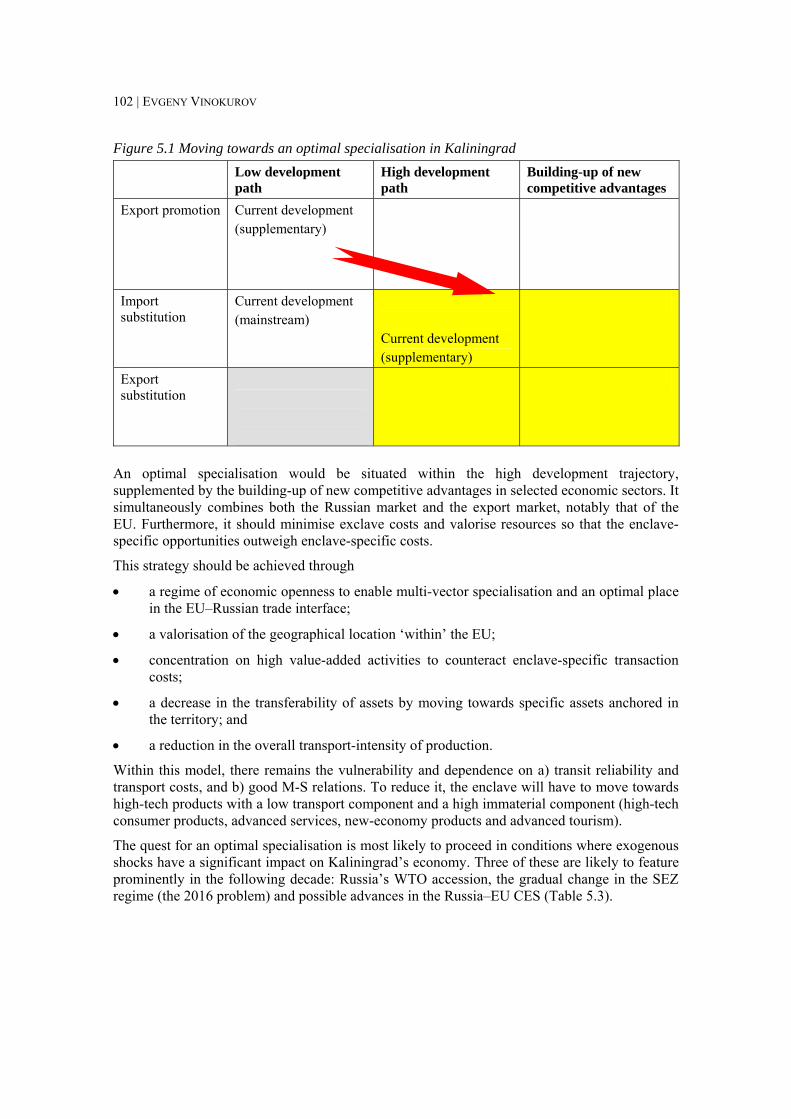
102 | EVGENY VINOKUROV
Figure 5.1 Moving towards an optimal specialisation in Kaliningrad Low development
path High development path
Building-up of new competitive advantages
Export promotion Current development (supplementary)
Import substitution
Current development (mainstream)
Current development (supplementary)
Export substitution
An optimal specialisation would be situated within the high development trajectory, supplemented by the building-up of new competitive advantages in selected economic sectors. It simultaneously combines both the Russian market and the export market, notably that of the EU. Furthermore, it should minimise exclave costs and valorise resources so that the enclave-specific opportunities outweigh enclave-specific costs.
This strategy should be achieved through
• a regime of economic openness to enable multi-vector specialisation and an optimal place in the EU–Russian trade interface;
• a valorisation of the geographical location ‘within’ the EU;
• concentration on high value-added activities to counteract enclave-specific transaction costs;
• a decrease in the transferability of assets by moving towards specific assets anchored in the territory; and
• a reduction in the overall transport-intensity of production.
Within this model, there remains the vulnerability and dependence on a) transit reliability and transport costs, and b) good M-S relations. To reduce it, the enclave will have to move towards high-tech products with a low transport component and a high immaterial component (high-tech consumer products, advanced services, new-economy products and advanced tourism).
The quest for an optimal specialisation is most likely to proceed in conditions where exogenous shocks have a significant impact on Kaliningrad’s economy. Three of these are likely to feature prominently in the following decade: Russia’s WTO accession, the gradual change in the SEZ regime (the 2016 problem) and possible advances in the Russia–EU CES (Table 5.3).
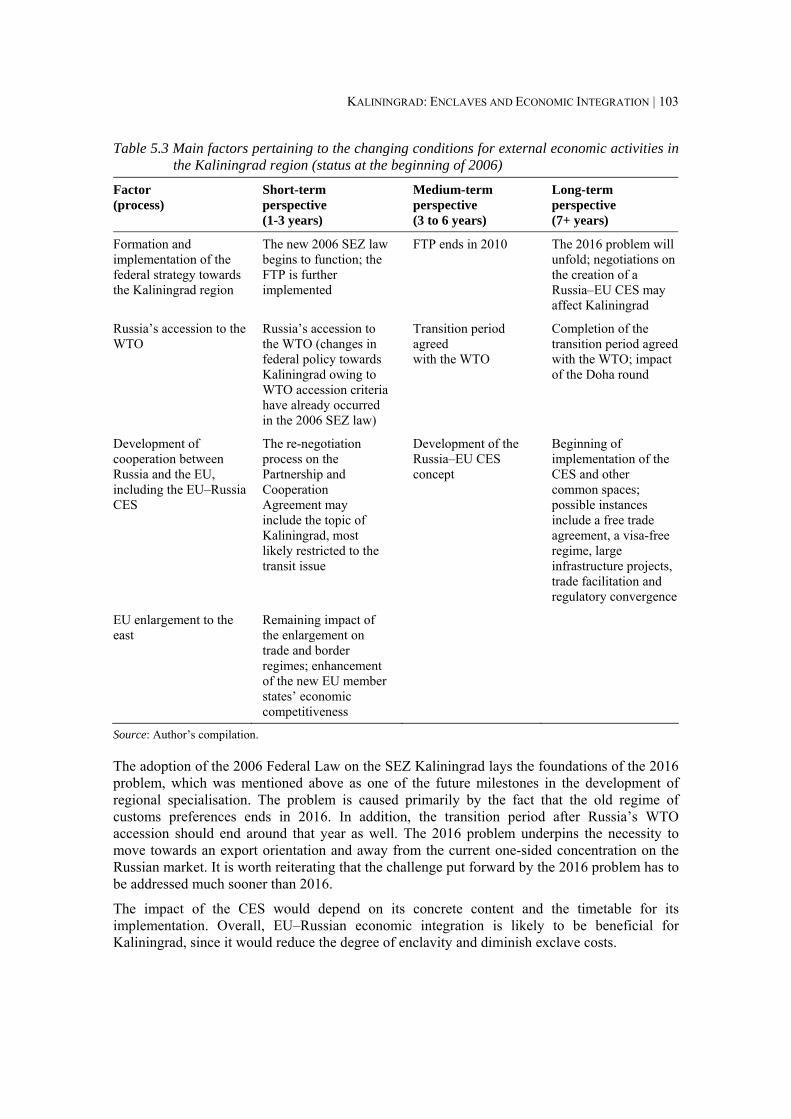
KALININGRAD: ENCLAVES AND ECONOMIC INTEGRATION | 103
Table 5.3 Main factors pertaining to the changing conditions for external economic activities in the Kaliningrad region (status at the beginning of 2006)
Factor (process)
Short-term perspective (1-3 years)
Medium-term perspective (3 to 6 years)
Long-term perspective (7+ years)
Formation and implementation of the federal strategy towards the Kaliningrad region
The new 2006 SEZ law begins to function; the FTP is further implemented
FTP ends in 2010
The 2016 problem will unfold; negotiations on the creation of a Russia–EU CES may affect Kaliningrad
Russia’s accession to the WTO
Russia’s accession to the WTO (changes in federal policy towards Kaliningrad owing to WTO accession criteria have already occurred in the 2006 SEZ law)
Transition period agreed with the WTO
Completion of the transition period agreed with the WTO; impact of the Doha round
Development of cooperation between Russia and the EU, including the EU–Russia CES
The re-negotiation process on the Partnership and Cooperation Agreement may include the topic of Kaliningrad, most likely restricted to the transit issue
Development of the Russia–EU CES concept
Beginning of implementation of the CES and other common spaces; possible instances include a free trade agreement, a visa-free regime, large infrastructure projects, trade facilitation and regulatory convergence
EU enlargement to the east
Remaining impact of the enlargement on trade and border regimes; enhancement of the new EU member states’ economic competitiveness
Source: Author’s compilation.
The adoption of the 2006 Federal Law on the SEZ Kaliningrad lays the foundations of the 2016 problem, which was mentioned above as one of the future milestones in the development of regional specialisation. The problem is caused primarily by the fact that the old regime of customs preferences ends in 2016. In addition, the transition period after Russia’s WTO accession should end around that year as well. The 2016 problem underpins the necessity to move towards an export orientation and away from the current one-sided concentration on the Russian market. It is worth reiterating that the challenge put forward by the 2016 problem has to be addressed much sooner than 2016.
The impact of the CES would depend on its concrete content and the timetable for its implementation. Overall, EU–Russian economic integration is likely to be beneficial for Kaliningrad, since it would reduce the degree of enclavity and diminish exclave costs.
104 | EVGENY VINOKUROV
Fitting into the Russian–EU interface
The issue of Kaliningrad’s specialisation necessarily has to be seen in the framework of Russian–EU economic relations. There is no viable economic alternative for Kaliningrad other than to fit into the Russian–EU interface. There are two major aspects to this issue:
1) The future of Kaliningrad’s regional economy and its specialisation has to be viewed in connection with the prospects of Russian–EU relations and their economic integration. The establishment of the CES could become the cornerstone of Kaliningrad’s economy.
2) Also, Kaliningrad’s specialisation is dependent on the contents and dynamics of trade flows between Russia and the EU.
In 2002, when Kaliningrad found itself at the centre of EU–Russian relations, both the EU and Russia recognised the fundamentally unique nature of the Kaliningrad region, the existence of its special problems and the necessity to apply a special approach to solving them. Medvedev & Ignatyev (2005) emphasise the role of Kaliningrad in EU–Russian relations:
Kaliningrad emerges as a key issue on the EU–Russia agenda. It is divisive, and a defining issue in the EU–Russian relations. Not only does it have a unique territorial format, a Russian exclave in the EU, but it also enjoys an exceptional economic regime, the SEZ. It is a peculiar hub of globalisation, and a test for the ability of Brussels and Moscow to find innovative solutions for the 21st century (2004, p. 141).
Until now, however, the main efforts have focused on solving visa-regime issues. A number of more substantial and complicated problems for forming the proper conditions for external economic activities in the Kaliningrad region, which will determine the competitiveness of local companies on the regional, Russian and foreign markets, are still to be addressed.
A deep and comprehensive integration between the mainland and the surrounding state can remove a number of enclave-specific problems, including that of exclave–mainland transit. Integration eases (or removes altogether) the transit problem and reduces enclave-specific conflict potential. Economic integration can greatly diminish the inherent economic problems of an enclave. Very deep EU-like integration is not really necessary. As discussed in section 1.3, there are certain crucial elements of political and economic integration, the presence of which is pivotal for the enclaves, most notably free trade in goods and services and a visa-free regime making possible the free movement of people. This point is well illustrated by the case of Kaliningrad where the problems of both passenger and cargo transit arise exactly because the relations between Russia and the EU (or its member states, Poland and Lithuania) have not reached any of these conditions. Even partial progress in one of the fields can greatly benefit the enclave, surpassing by far the positive impact of integration on the other regions of the same state. When borders become more penetrable, some of the enclavity/exclavity quality disappears, since the territory is now effectively less of an enclave within the surrounding state and less of an exclave in relation to its mainland. M-S integration may thus lead to a diminishing of enclavity de facto through the relativisation of the borders.
The conclusion is drawn in the previous section that an optimal strategy would entail switching to a higher development trajectory, supplemented by building new competitive advantages in some sectors. This approach is combined with turning towards the EU market while not rejecting the Russian market. In this way, Kaliningrad would arrive at an optimal combination of production aimed at both the Russian and the EU markets. Is such a strategy possible in the context of EU–Russian relations? Does the actual state of relations make it possible? Are further developments in EU–Russian relations necessary?
The current state of Russian–EU relations is not favourable to the economic development of the Kaliningrad region. A lack of economic openness, high entry barriers to the EU market and high
KALININGRAD: ENCLAVES AND ECONOMIC INTEGRATION | 105
transaction costs in trade with other Russian regions (partly caused by EU enlargement) impede the transition to an advanced and less vulnerable economy. More comprehensive economic integration would unlock the potential of the region. Regulatory convergence, the lowering of the TBTs and the facilitation of the movement of people are in this respect of no less importance than more traditional trade integration. These factors have to be supplemented by political stability and good neighbourly relations based on trust and understanding. Economic integration between the partners would entail a major positive change for the Kaliningrad enclave. It would allow Kaliningrad to achieve a multi-vectored orientation, producing for both the Russian and the EU markets, and thus avoid a heavy and unhealthy dependence on the Russian market alone. It would effectively counteract the drawbacks of the enclave’s small size, overcoming problems linked to the limited size of both the local market and the local production base. The most important consequence of prospective EU–Russian economic integration is that it would help to valorise the advantages of the Kaliningrad region, which includes its proximity to the EU market. Strained EU–Russian relations would seriously impede economic development and would make Kaliningrad more dependent on Russian federal subsidies.
In relation to this argument, an analogy with the hedgehog can be drawn from the animal world. An enclave needs to be omnivorous: while economic ties with the mainland are natural and important, an enclave should develop an economic orientation aimed at both mainland Russia and the EU. As the hedgehog crosses the roads (‘borders’ between parcels of the forest where the hedgehog searches for food), it needs to watch out with great care to avoid being crushed under the wheels of passing vehicles, since its natural defence does not help if it is overridden by either the surrounding state or the mainland state. Going further along with animal analogies, when two mighty animals, the bear and the elephant,2 are moving around the same place, the little hedgehog always has to be on the alert. The great animals can trample on it accidentally, with no malicious intent. The enclave is none the better for it.
At the present stage, the state of EU–Russian relations weighs heavily upon Kaliningrad’s economic performance, since the negative aspects of enclave status are related to factors that are both political (e.g. the introduction of the visa regimes by Poland and Lithuania in 2003 or the Lithuanian transit issue) and economic (e.g. non-tariff barriers to the EU market). Still, in the long run further development of EU–Russian relations along the lines of the common spaces carries substantial positive potential for the Kaliningrad region as an enclave.
The idea of a Russia–EU free trade zone (FTZ) in Kaliningrad was proposed by Ignatyev and developed by the EU–Russia Cooperation Programme (2003), Vinokurov (2004e) and Vinokurov et al. (2005). The core concept of a Kaliningrad FTZ would be that the EU opens its market for Kaliningrad’s goods with certain qualifications (particularly adequate controls on the rules of origin), whereas Russia would keep the Kaliningrad market as open as it is now (the only change needed is the removal of import quotas). The Kaliningrad FTZ would be put into place by a bilateral EU–Russian agreement on Kaliningrad. It may be solely devoted to an FTZ or be more complex and handle other issues relevant to Kaliningrad in the Russia–EU context. The idea is unlikely to be put into practice, however, owing to its legal and political complexity.
Since a Russia–EU FTZ in Kaliningrad is hardly feasible and the EU–Russia CES is feasible only in the long run, the dependency of Kaliningrad on the qualitative and quantitative characteristics of Russian–EU trade comes into the foreground. Kaliningrad has already taken
2 The animal analogy is adopted from Emerson et al. (2001; also available in Russian). Indeed, the bear is a long-standing image of Russia, recently taken as a party symbol by the United Russia Party. The elephant suits the European Union: “It is even bigger than the bear, but is readily domesticated and has a placid character. It moves slowly but with great weight. It sometimes unintentionally tramples on smaller objects” (ibid, p. 1).
106 | EVGENY VINOKUROV
up an intermediary role in Russian–EU trade. Kaliningrad’s high degree of trade openness, with trade flows exceeding GRP by 2.7 times, is an immediate consequence of the region’s trade role. Nevertheless, this is based on the customs privileges anchored in the old SEZ regime, which favours low-degree transformation processes, notably assembling. An optimal development would foresee moving from low- to medium- and high-degree transformation processes. More details on that are provided in the next section.
Industry, services and agriculture in the GRP
When discussing the issues of economic development and economic policy, this author situates himself in the liberal paradigm. In the long run, a state official, politician or scientist cannot be more efficient than the market. The state should not determine specialisation in a proactive way. Rather, it should determine the legal framework and the rules of the game, and let the market decide. At the same time, the state can indirectly induce the economy to opt for a shift in production by anchoring various incentives in the national legislation.
Putting together our findings from the diagnostic of the current regional specialisation, the theory of enclaves, the importance of external shocks for the regional economy and an optimal development strategy, several remarks may be made on the distribution of Kaliningrad’s GRP. The analysis of six selected branches (fuel, furniture, amber, agriculture, transport and tourism) in section 5.4 further develops the remarks below.
1) The share of agriculture in the GRP is already relatively low and is unlikely to increase in the future. Regional agriculture can concentrate on
• servicing the local market;
• producing a few export products, such as rape; and
• producing limited volumes as inputs for regional food processing.
But unlike Russia, which is properly factor-endowed to specialise in agriculture in the future, for Kaliningrad specialisation in agricultural products is not justified (Korolev, 2002, p. 16).
2) Industrial manufacturing is able to remain a stronghold of the regional economy and an engine for economic development. It has to move towards activities with higher added value and sectors with a higher degree of territoriality. There is also a need for a narrow specialisation and clustering.
The relative share of construction has almost doubled in the post-1998 years, reaching 9% by 2003. The construction boom is a consequence of the overall economic recovery and a very fast rise in personal incomes over recent years. The construction sector is thus a variable of growth in industrial production and services.
3) The share of services in the GRP has risen significantly over the transition period. It has not decreased in the post-1998 years despite rapid industrial growth. That means that the development of services accompanied industrial growth as well as the fast growth of trade flows. Despite the rise of the share of services in the GRP, their potential is underexploited. Services, ranging from transport to tourism, should take a larger share in the GRP. Tourism and ‘clean gate’-types of advanced services in the field of trade intermediation (Samson 2000a and 2000b; TACIS 2002a) are among the most profitable sectors. They are fully compatible with the high development trajectory and fit perfectly into an ideal ‘enclave’ specialisation.
Transport is a backbone of the regional economy. It both underpins the functioning of Kaliningrad’s regional economy as a whole and serves Russian–EU transit. The transport sector
KALININGRAD: ENCLAVES AND ECONOMIC INTEGRATION | 107
produces 8-9% of GRP with a slight upward trend. Even more important, the presence of a relatively powerful and well-developed transport industry facilitates the current and future specialisation of the region as a whole. While suggesting a pronounced transport specialisation is wrong from the point of view of exclave costs, regional transport will remain an asset for industrial development and trade-related services.
The weight of intermediate goods and IIT is growing in world trade. A growing trade-to-GDP ratio owes much to what Jones & Kierzkowski (1997) call an ‘intensive’ growth of international trade. New trade models, which take into account the fragmentation of production, point to the possibility for a country or region to acquire a comparative advantage in a certain product where there was no advantage previously. If a country or region has a comparative advantage in one of the production stages, it has an opportunity to enter the world market even if it does not possess a comparative advantage in the whole product. For example, country A with an advantage in labour-intensive manufacturing can efficiently produce labour-intensive components, while a capital-intensive country B would keep its comparative advantage in other important production stages and in the finished good by fragmenting the production and moving labour-intensive stages to country A.3
Kaliningrad has a chance to enter the world market, most notably the EU market, along the lines of this model. The region’s advantage in qualified/unqualified labour, combined with the proximity factor as well as the SEZ makes it possible. Proximity is vital in the fragmentation and outsourcing processes, since rises in the flows of intermediates increase the transport-intensity of the final good. This process would be accompanied by a further increase of IIT.
Econometric analysis by Baldone, Sdogati & Tajoli (2001) demonstrates that labour costs, geographical proximity and cultural closeness are the most important reasons for choosing a location. Yet, after having chosen a certain country as a location for the fragmentation of production, EU producers often prefer to stick to this location regardless of the relative dynamics of labour costs. For example, German companies that invested heavily in Hungary and the Czech Republic in the 1990s did not relocate to Romania or Bulgaria. On the other hand, producers from other EU member states that entered the realm of fragmentation in the 2000s are substantially guided by the factor of labour costs. This analysis suggests that countries such as Italy and Spain should not be underestimated as potential investors in Kaliningrad.
Transport, the intermediation of trade and industrial development intersect in the so-called ‘industrialisation of transit’ model. This model is practically employed in Rotterdam and Singapore as well as in such second-tier European ports as Rouen, Barcelona and Le Havre. The model stipulates adding value to transit goods by processing them, mostly in ports and relative to port activities. This model might be relevant to the existing generic assets in the Kaliningrad region and to moving from generic to specific assets. The idea underpinning the application of the industrialisation of transit in Kaliningrad should be the reduction of transport-intensity of both exports and imports after processing.
An application of the model stipulates the processing of goods in transit, ranging from low- to medium-degree transformation processes. Sorting, sizing, sawing and packaging are typical instances of low-degree transformation. These activities are relatively neglected in the current conditions of the SEZ requirement of adding 30% of value, but they are likely to come to light in the conditions prescribed by the new SEZ regime. Medium-degree transformation processes may include, for example, assembling.
3 Baldone, Sbogati & Tajoli (2001) elaborate a formal econometric model that incorporates fragmentation.
108 | EVGENY VINOKUROV
Nevertheless, the weakness of the model is in its concentration on low-degree transformation processes. From the point of view of an optimal specialisation, it has to be supplemented by advanced, value-added logistic (VAL) services. The main VAL activities are
• Receiving goods, and preparing and breaking-up shipments
• Storage, distribution and order-picking
• Centralising and customising, adding parts and manuals
• Assembly, repair and reverse logistics
• Quality control and product testing
• Installation and instruction
• Product training on the customer’s premises
These activities feature prominently on the list of advanced services in trade intermediation. The combination of the industrialisation of transit and VAL services would allow Kaliningrad to progress towards a more advanced transport specialisation, organically connected to industrial development and the growth of services. This vivid example illustrates the construction of a pronounced territoriality that is so greatly needed by the Kaliningrad enclave.
Throughout our investigation of Kaliningrad’s economy, we have regarded the region as a whole. Although a spatial analysis lies at the heart of our methodology, we have not delved ‘inside’ the region. Brief remarks on the internal spatial distribution of economic activities would nevertheless be justified. The process of agglomeration within the Kaliningrad region has been visible throughout the 15 years of transition. The regional capital currently accounts for a little less than half the region’s population. The economic potential, however, is much more concentrated in Kaliningrad. Smaller towns do well only when they are in possession of a specific advantage. Zelenogradsk and Svetlogorsk are resorts. Svetly and Baltiysk are ports (Baltiysk owes its relative well-being to the stationing of the Baltic Fleet). Guryevsk is developing as an extension of Kaliningrad, profiting from its immediate vicinity to the regional capital. Meanwhile, the economic capacity of other towns that were doing well during the Soviet era – Chernyakhovsk, Sovetsk, Gvardeysk, Gusev and Bargationovsk – is declining. The economies of localisation stem from the standard Marshallian trinity of labour-market pooling, the supply of international goods and knowledge spillovers. All three of these tend to develop at the level of a single city or a small cluster of cities, “an area small enough to make it possible for people to change jobs without changing houses, for hard-to-transport goods and services to be delivered, and for regular personal contacts to take place” (Krugman, 1991, p. 70). The first aspect, labour-market pooling, is decisive in shaping the area of possible economies of localisation in the Kaliningrad oblast. This area comprises the city of Kaliningrad and those small towns that are located within a maximum radius of 30-40 km. This circle effectively envelops about 70-75% of the region’s population. The network of roads and railroads is dense but too outdated to allow commuting from more remote destinations. In the long run, Svetly, the resort towns on the coast, Guryevsk and Gvardeysk are likely to become part of the agglomeration, whereas Chernyakhovsk, Sovetsk, Gusev and so on will remain outside.
5.3 Selected branches of the regional economy: What is their place in regional specialisation in the long run?
Fuel industry
Four circumstances currently make oil extraction in the Kaliningrad region profitable. First, the deposits are located close to the export market. Oil tankers can be used to ship oil to the EU,
KALININGRAD: ENCLAVES AND ECONOMIC INTEGRATION | 109
keeping shipping costs low. Second, oil extracted in the region is of high quality. Its minimal sulphur content allows it to be classified as Brent, which costs 16-19% more than typical oil (for Russia) from the Urals. Third, since Kaliningrad oil is not transported by pipelines, it is not mixed with oil of different quality, as is the case with Russian oil in general. Fourth, oil extracted in the SEZ of Kaliningrad (excluding the sea shelf, which is not part of the zone) is not subjected to custom duties.
Oil has been extracted in the region since 1975. The historical maximum of 1.5 mn tonnes was reached by 1985. After that, output declined. Since the mid-1990s, extraction has stagnated at 0.75 mn tonnes per year. The figure began growing from 2005 onwards after the exploration of the Baltic Sea shelf began. Some 1.2 mn tonnes were extracted in 2005, compared with 0.82 mn tonnes in 2004 (KRCS, 2006). The extraction of about 0.65-0.70 mn tonnes is planned, both inland and on the sea shelf (Kravtsovskoye deposit). The explored reserves (about 8.0 mn tonnes inland and 8.0-9.0 mn tonnes on the sea shelf) should allow extraction for a further 10 years. Two companies are present in the region, the Russian giant Lukoil (with 95% of the market) and Kaliningradmorneft. The latter smaller company was bought by an American investment firm in 2005.
The share of oil extraction in the industrial output of the oblast is about 9-11% depending on the year (see Figure 5.4 for shares in the GRP, 1999-2003). Yet oil receipts equalled 74% of the balanced financial results of 2004. This evidence is convincing of the high profitability of oil extraction at present. Its contribution to the regional budget is disproportionally large, too. The share of oil extraction in all business taxes collected in Kaliningrad exceeded 30% in 2000–04.4
Table 5.4 Fuel industry 1999 2000 2001 2002 2003 Share in the GRP 18.7 25.5 20.4 15.7 13.2 Growth, in % to previous year 94.1 105.6 99.1 100.4 101.3
Source: KRCS (2004).
The shipping of Russian oil is an important component of the regional economy as well (although it is not a formal part of the fuel industry). Some 90% of the oil processed in the oil terminals on the Kaliningrad coast represents the transit of Russian crude oil, in conditions of high prices and insufficient capacities of pipelines and other sea ports on the Baltic coast. Oil is delivered from mainland Russian by railway tank-wagons, since there are no pipelines. The high prices justify the elevated costs of long-distance shipping and transit through Belarus and Lithuania. There are terminals in Svetly, Baltiysk and Kaliningrad. The investments realised by Russian companies in these terminals are quite substantial for the region. For example, Lukoil invested at least $100 mn in its own terminal in Svetly with a capacity of 4 mn tonnes. This investment alone is double the annual inflow of FDI.
Nevertheless, the prospects for the oil industry with regard to Kaliningrad’s specialisation are seriously limited for the following reasons:
• The explored reserves in the territory of the oblast and on the sea shelf will be exhausted in 10-15 years.
• The economic viability of the construction of an oil refinery in the region is questionable.
4 Derived from Expert, 25 April 2005 (an authoritative Russian economic weekly journal comparable in its format to The Economist).
110 | EVGENY VINOKUROV
• The costs of shipping Russian oil through Kaliningrad are markedly higher in comparison with pipelines and other ports. Augmenting the pipelines’ capacities and further enlargement of the terminal capacities in Ust-Luga as well as the ports in the Baltic States, combined with enclave-specific risks (Lithuanian and Byelorusian transit), diminishes the attractiveness of oil shipment through Kaliningrad.
The shares of oil extraction and shipping will remain high in the regional GRP structure as well as in regional finances in the medium-term. Still, their relative weight is destined to decline in the long run.5
The furniture industry from the viewpoint of competitiveness
Arguably, there were practically no furniture producers before the transition (only one medium-sized furniture plant). The industry appeared from nowhere in the mid-1990s and grew exponentially. According to the Association of Kaliningrad Furniture-Makers, the industry counted about 40 enterprises and some 10,000 employees by 2002. The production volume grew by 40% in that year. The industry produced 5.7% of the Russian furniture output (NWCO, 2005) in 2003. The primary market is Russia. In 2002, 83% of the output was shipped to the mainland, whereas 10% was sold in Kaliningrad and 7% was exported, mostly to Belarus and Ukraine (Box 5.1).
Box 5.1 The Russian furniture market The capacity of the Russian furniture market is estimated at $2.6-2.9 bn in 2004. Russian producers occupy less than half of it. Consumer demand in the middle- and high-quality segments are almost fully served by imports. According to government estimations, furniture is produced by 5,770 companies, including more than 500 large and medium-sized enterprises. The share of small firms rose from 11% in 2000 to 20% in 2004.
Consumption volumes more than doubled in five years, from $9 per capita in 2000 to $20 per capita in 2004. Expert estimations account for various additional factors (including the shadow economy) and arrive at the more elevated figures of $14 for 2000 and $29 for 2004. Consumption was forecast to rise to $22 in 2005 ($32 according to expert assessments). The total consumption volume in Russia was expected to total $3 bn according to official data and $4.6 bn according to expert estimations. But furniture consumption in Russia remains at a very low level compared with developed countries. The world furniture market exceeds $200 bn. French and German spending per capita exceeds Russian spending by 7-10 times (the French spend up to €200 per year on furniture shopping). In addition, consumption growth is slowing in Russia. It grew by 13.7% in 2001. By comparison, the total market volume grew by 5.3% in 2004 in real terms (13% in nominal prices). It is expected to grow by a mere 2.3% in real terms in 2005.*
* See the website http://www.rbcdaily.ru/news/market/index.shtml?2005/05/14/202008.
Three main factors are named by furniture-makers as regards the competitiveness of their products. First is the SEZ regime, which provides for the duty-free import of furniture components, notably from Poland but also from Lithuania, Germany and Italy. Second is the low cost of labour relative to EU competitors, which underpins regional competitiveness. Third, the furniture-makers underline the importance of low electricity tariffs. In 2002, they enjoyed a price of $0.03 per kWh, compared with $0.12 in Poland and $0.20-0.30 in Western European countries. 5 The share of oil and related industries is likely to decline owing to limited opportunities for growth compared with the economic growth potential in other sectors. In practice, however, political will can counteract economic realities. The newly appointed Governor Georgy Boos is known as a vocal proponent of grand petrochemical projects in the region.
KALININGRAD: ENCLAVES AND ECONOMIC INTEGRATION | 111
The furniture industry is characterised by high labour-intensity and relatively low capital-intensity. It also features a medium-level demand for electric power. Thus, the Kaliningrad-based furniture industry has perfectly ‘fitted’ into the advantages offered by Kaliningrad and its SEZ. The perfect fit allowed unimpeded growth of the industry virtually from scratch, making it a success story of the Kaliningrad SEZ.
Yet several considerations might dampen the enthusiasm of economists, entrepreneurs and policy-makers.
• The most important factor for the future of the industry is the transformation of the SEZ, with import privileges (which the Kaliningrad furniture industry uses most actively) being replaced by tax preferences for big investors. To begin with, under the present regime, the Kaliningrad furniture-makers have a competitive edge over their counterparts on the mainland. Retaining at least some of their advantage is a major challenge for the regional producers. The conditions as regards basic factor costs are neutral for labour and slightly negative for energy.
• The above factor is augmented by the anticipated decline of import tariffs in the course of Russia’s WTO accession. The high import tariffs on furniture at present (20%) will inevitably fall, causing Kaliningrad’s competitive edge to erode further.
• Kaliningrad’s furniture industry consists exclusively of SMEs. In fact, this can be regarded as one of its greatest strengths. But the new SEZ regime envisages a threshold of RUB 150 mn (€4.5 mn) of investment to become eligible for tax preferences. The majority of Kaliningrad furniture firms are currently unable to invest that amount in a business project.
• An additional negative factor is that in logistical terms, furniture is one of the few industries in which the physical volume of the final production is larger than (or at least comparable to) that of the components. In other words, transporting components to a production site close to the end market can be more advantageous than to transport finished products. This circumstance can put Kaliningrad furniture-makers, who use semi-finished products from the EU, at a disadvantage in comparison with their counterparts located in the immediate vicinity of the major consumption market in Central Russia.
• While rather low now, electric power tariffs are on the rise (from $0.018 in 2000 to $0.055 or €0.066 in 2005). A 10% rise is predicted for 2006, which will take the price to €0.060-0.070.
Finally, it is not evident whether Kaliningrad will be able to achieve substantial cluster effects in the furniture industry, although current developments are encouraging. The furniture industry is considered a straightforward case for cluster-building. The impact of cluster-building in the furniture industry (or of the failure to achieve cluster effects) can be significant. Some elements of the cluster approach are already visible in the industry. It was quick to organise itself into the Association of Kaliningrad Furniture-Makers. There are certain efforts to conduct industrial lobbying and marketing by forces within the Association. Moreover, the industry is rapidly accumulating crucial competences as well as a pool of qualified labour, although it is difficult to say whether this would suffice to support competitiveness. On the other hand, one of the negative factors is that Kaliningrad-based furniture-makers still largely economise on design and simply produce copies of Western furniture. The furniture-makers themselves recognise that this strategy will become unsustainable in the medium term when Russia becomes more integrated into the global economy and its legal framework and, particularly, when Russia enters the WTO (Kuzin, 2005). Meanwhile, the Kaliningrad region has no tradition and a poorly-adapted educational base for industrial design in general.
112 | EVGENY VINOKUROV
Amber: Undervalued resource or overvalued potential?
It is often stated that more than 90-95% of the world’s amber reserves are concentrated in the oblast. This figure can be misleading, as it apparently refers to Baltic amber. Various kinds of amber can be found in other parts of the world. A more prudent estimation is probably two-thirds of the world’s amber deposits.6 Nonetheless, that is enough to enjoy a dominant position on the world market.
Kaliningrad’s amber industry has found itself in deep crisis since the beginning of the 1990s. It has been subject to exorbitant levels criminality and mismanagement. This state of affairs, combined with a lack of clear vision and policy, has led the industry into sharp decline. At the same time, it is often cited as a potential breakthrough sector with large and unexplored potential. For example, Samson (2000b, p. 253) asserts “amber deposits, along with the functioning Kaliningrad amber industry as a whole, can be viewed as a practically undiscovered potential, a specific resource to be transformed into a working asset in the near future”.7 The strategy proposed is to develop the souvenir and jewellery industries on the basis of amber extraction and processing, turning Kaliningrad into the ‘amber capital’ of the world.
Yet one should distinguish amber extraction and amber jewellery as two industries, whose interests and demands do not necessarily coincide. The development of an industry such as jewellery is hardly tied to raw material sources since it requires a set of specific skills, the presence of highly qualified labour, favourable customs-tariff legislation and a good supply of capital. Moreover, it is probably tied more closely to end markets than to raw material sources. To take the diamond industry for comparison, Botswanian, South African and Russian raw diamonds are largely cut elsewhere, i.e. in Antwerp. As regards amber jewellery, it is not by chance that the enormous growth of amber jewellery in and around Gdansk coincides not only with the opening of Russia, which provided large and cheap inflows of raw amber, but also with the signing of a free trade agreement between Poland and the EU. The extraction of raw materials is the least important factor in setting up an amber jewellery cluster.
The capacity of the wholesale market of semi-finished amber products is estimated to range from $50 mn to $120 mn. With the overall capacity of the amber jewellery market (without taking into account the value of settings made of precious metals) being $120-$220 mn, the share of Kaliningrad producers is hardly larger than 5%. According to experts’ estimates, 60% of the world’s amber polishing and amber jewellery manufacturing takes place in Poland and largely in and around the town of Gdansk. These estimations fail to take into account the Russian market, however. In view of Russia’s market for amber jewellery, about 50% of fine amber is polished in Poland, about 15% in Russia (in the Kaliningrad oblast) and 35% of all amber jewellery ornaments are produced in Korea, Germany, Lithuania and Denmark. But until 1990, over 70% of fine amber was processed in the USSR (Samson, 2000b, pp. 259-60). That means that more than half of the world’s amber jewellery market is now occupied by Polish producers. Polish competitive advantages in the industry are the availability of cheap and high-quality raw materials, the pool of qualified labour (offering excellent value for money), flexibility to adapt to new processing techniques and modern trends, a favourable legislative and political environment, access to the large amber jewellery market in the world and, more specifically, in the EU. Other producers are concentrated in Germany, Denmark and Lithuania. Additionally, Korean and Japanese jewellers are traditionally strong on their domestic markets owing to the specific cultural factors of amber jewellery in these countries.
6 See the website http://www.emporia.edu/earthsci/amber/geograph.htm. 7 Chapter 9 of Samson (2000b) contains a comprehensive survey of the amber industry in Kaliningrad and recommendations for its development. See also Samson (2000a), pp. 57-58.
KALININGRAD: ENCLAVES AND ECONOMIC INTEGRATION | 113
Let us estimate the potential of the amber industry in Kaliningrad, including raw amber extraction and the production of semi-finished goods and final jewellery products. An optimistic estimation would be that Kaliningrad could take up to 60-80% of the market for semi-finished goods and 20-30% of the retail market for amber jewellery. These two markets combined are thus capable of generating approximately $100 mn of annual sales, largely in exports. Thus, the share of the amber sector in the Kaliningrad GRP could reach about 3%.
The development of the prosperous amber jewellery industry in Kaliningrad is hardly possible merely on the basis of raw amber extraction. A number of components and measures are needed, which amount to the creation of a cluster, as is the case in northern Poland. This outcome will be very hard to achieve in the region, since the core conditions for creating such a cluster are poor. For instance, there are no local educational establishments for training jewellers, designers, technicians and so on. An overwhelming majority of local jewellers are either self-educated or have acquired skills through apprenticeship. Only very few have received vocational education in art or jewellery schools in Russia. There are no substantial art schools in the region. In general, fine art traditions are lacking in the region, given that a favourable atmosphere requires the continuity of immaterial and material assets across many generations. In Kaliningrad, the accumulation of such assets was halted and blocked by the war and the subsequent movements of people, which saw the replacement of practically the entire population in a very short time period.
Developing new models of jewellery, souvenirs and processing technologies is done by polishers themselves without the participation of any specialised organisations. Research on the qualities of amber and its history was once carried out by the Amber Museum in Kaliningrad. Yet the Museum has been stagnating throughout the last 15 years owing to a lack of state funding, traditional passive management and a total lack of private financing sources. No specialised events dedicated to amber research and marketing (such as seminars, workshops and conferences), which could have a positive impact on the industry, have been organised at the Museum.
Industrial development is still possible, but difficult. It requires dedicated support by the state in terms of favourable framework conditions (legislation, possibly a local economic zone, the establishment of specialised educational facilities, export support and other cluster-building measures). Also, it will require massive investments and at least a decade, probably longer, to establish a vivid industry with an adequate reputation in the world. While the difficulties are enormous, the potential of the industry is not to be overvalued. Even if the full potential of the industry (amber extraction and amber jewellery combined) is realised, it will be capable of generating 2-3% of GRP in the very long term. Hence, although with time the amber industry could become an export-oriented ‘gem’ in regional specialisation, the precious stone will be relatively small.
The limited potential of agriculture
Transition dynamics in regional agriculture differed somewhat from overall dynamics, notably in manufacturing and services. There are generally two distinct periods, one of sharp decline in 1991-98 (during which Kaliningrad experienced profound crisis up to 1995) and one of strong growth from 1999 onwards (Table 5.5 and Figure 5.2).
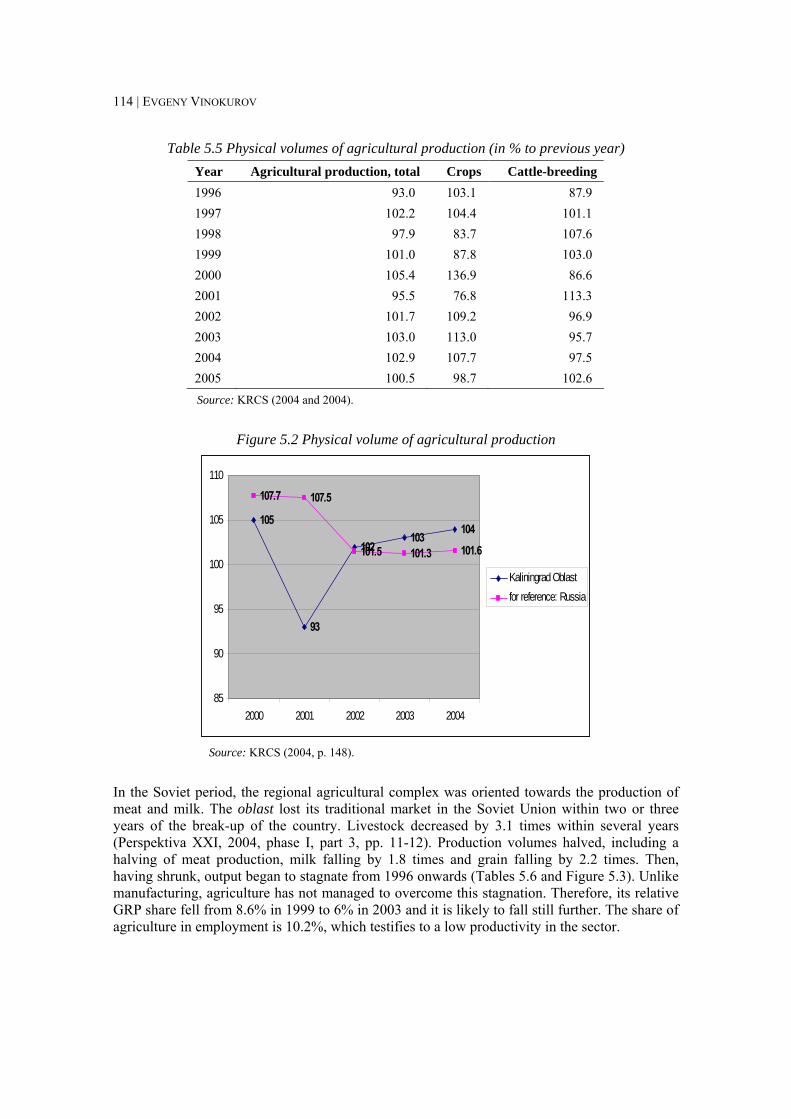
114 | EVGENY VINOKUROV
Table 5.5 Physical volumes of agricultural production (in % to previous year) Year Agricultural production, total Crops Cattle-breeding 1996 93.0 103.1 87.9 1997 102.2 104.4 101.1 1998 97.9 83.7 107.6 1999 101.0 87.8 103.0 2000 105.4 136.9 86.6 2001 95.5 76.8 113.3 2002 101.7 109.2 96.9 2003 103.0 113.0 95.7 2004 102.9 107.7 97.5 2005 100.5 98.7 102.6 Source: KRCS (2004 and 2004).
Figure 5.2 Physical volume of agricultural production
105
93
102103
104
107.7 107.5
101.5 101.3 101.6
85
90
95
100
105
110
2000 2001 2002 2003 2004
Kaliningrad Oblastfor reference: Russia
Source: KRCS (2004, p. 148).
In the Soviet period, the regional agricultural complex was oriented towards the production of meat and milk. The oblast lost its traditional market in the Soviet Union within two or three years of the break-up of the country. Livestock decreased by 3.1 times within several years (Perspektiva XXI, 2004, phase I, part 3, pp. 11-12). Production volumes halved, including a halving of meat production, milk falling by 1.8 times and grain falling by 2.2 times. Then, having shrunk, output began to stagnate from 1996 onwards (Tables 5.6 and Figure 5.3). Unlike manufacturing, agriculture has not managed to overcome this stagnation. Therefore, its relative GRP share fell from 8.6% in 1999 to 6% in 2003 and it is likely to fall still further. The share of agriculture in employment is 10.2%, which testifies to a low productivity in the sector.
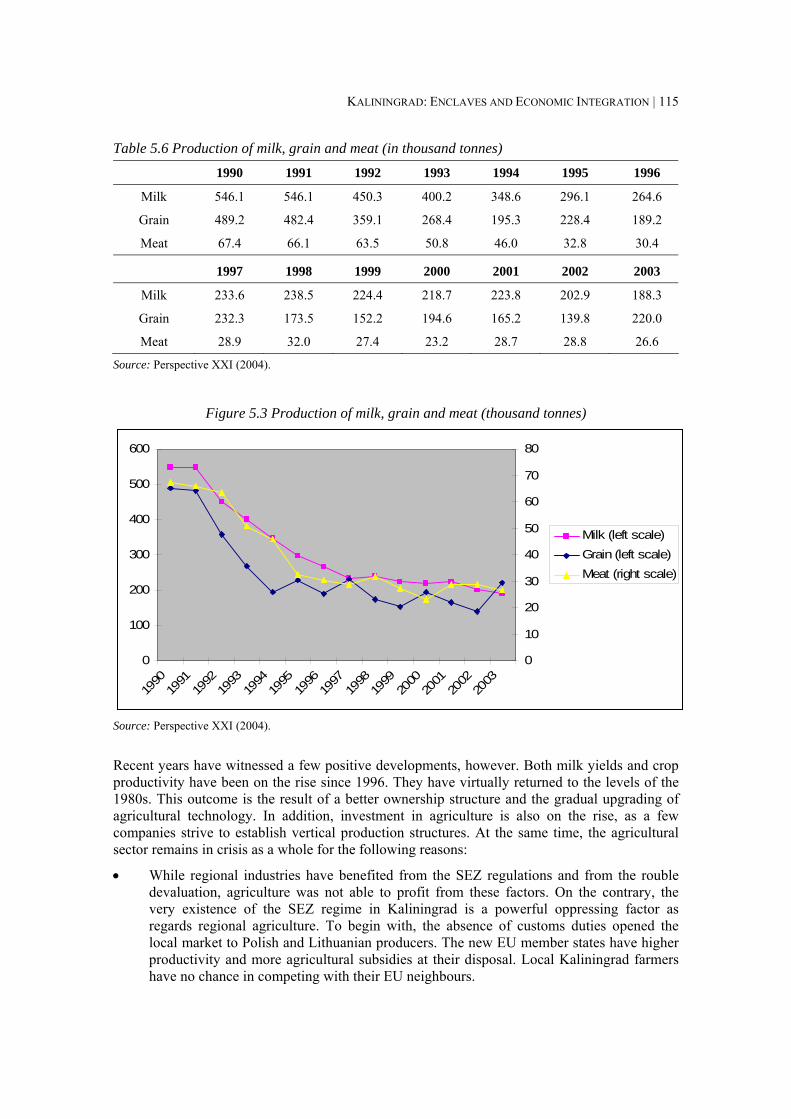
KALININGRAD: ENCLAVES AND ECONOMIC INTEGRATION | 115
Table 5.6 Production of milk, grain and meat (in thousand tonnes)
1990 1991 1992 1993 1994 1995 1996
Milk 546.1 546.1 450.3 400.2 348.6 296.1 264.6
Grain 489.2 482.4 359.1 268.4 195.3 228.4 189.2
Meat 67.4 66.1 63.5 50.8 46.0 32.8 30.4
1997 1998 1999 2000 2001 2002 2003
Milk 233.6 238.5 224.4 218.7 223.8 202.9 188.3
Grain 232.3 173.5 152.2 194.6 165.2 139.8 220.0
Meat 28.9 32.0 27.4 23.2 28.7 28.8 26.6
Source: Perspective XXI (2004).
Figure 5.3 Production of milk, grain and meat (thousand tonnes)
0
100
200
300
400
500
600
1990
1991
1992
1993
1994
1995
1996
1997
1998
1999
2000
2001
2002
2003
0
10
20
30
40
50
60
70
80
Milk (left scale)Grain (left scale)Meat (right scale)
Source: Perspective XXI (2004).
Recent years have witnessed a few positive developments, however. Both milk yields and crop productivity have been on the rise since 1996. They have virtually returned to the levels of the 1980s. This outcome is the result of a better ownership structure and the gradual upgrading of agricultural technology. In addition, investment in agriculture is also on the rise, as a few companies strive to establish vertical production structures. At the same time, the agricultural sector remains in crisis as a whole for the following reasons:
• While regional industries have benefited from the SEZ regulations and from the rouble devaluation, agriculture was not able to profit from these factors. On the contrary, the very existence of the SEZ regime in Kaliningrad is a powerful oppressing factor as regards regional agriculture. To begin with, the absence of customs duties opened the local market to Polish and Lithuanian producers. The new EU member states have higher productivity and more agricultural subsidies at their disposal. Local Kaliningrad farmers have no chance in competing with their EU neighbours.
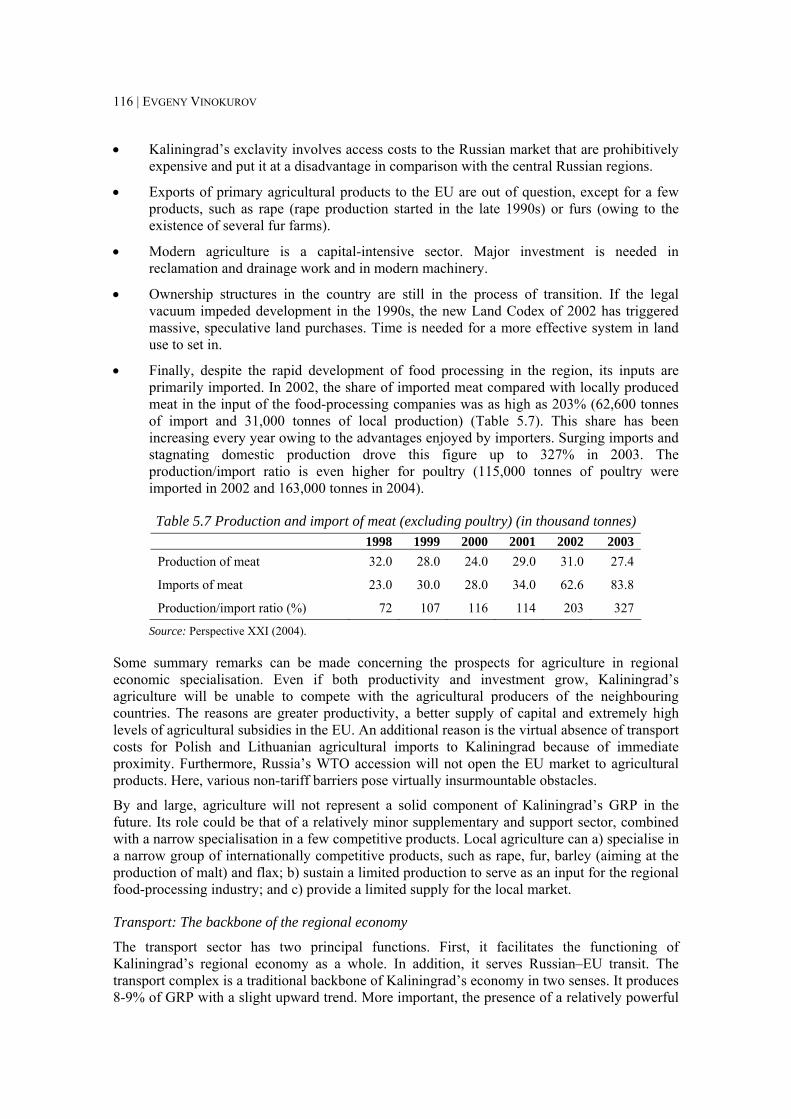
116 | EVGENY VINOKUROV
• Kaliningrad’s exclavity involves access costs to the Russian market that are prohibitively expensive and put it at a disadvantage in comparison with the central Russian regions.
• Exports of primary agricultural products to the EU are out of question, except for a few products, such as rape (rape production started in the late 1990s) or furs (owing to the existence of several fur farms).
• Modern agriculture is a capital-intensive sector. Major investment is needed in reclamation and drainage work and in modern machinery.
• Ownership structures in the country are still in the process of transition. If the legal vacuum impeded development in the 1990s, the new Land Codex of 2002 has triggered massive, speculative land purchases. Time is needed for a more effective system in land use to set in.
• Finally, despite the rapid development of food processing in the region, its inputs are primarily imported. In 2002, the share of imported meat compared with locally produced meat in the input of the food-processing companies was as high as 203% (62,600 tonnes of import and 31,000 tonnes of local production) (Table 5.7). This share has been increasing every year owing to the advantages enjoyed by importers. Surging imports and stagnating domestic production drove this figure up to 327% in 2003. The production/import ratio is even higher for poultry (115,000 tonnes of poultry were imported in 2002 and 163,000 tonnes in 2004).
Table 5.7 Production and import of meat (excluding poultry) (in thousand tonnes) 1998 1999 2000 2001 2002 2003
Production of meat 32.0 28.0 24.0 29.0 31.0 27.4
Imports of meat 23.0 30.0 28.0 34.0 62.6 83.8
Production/import ratio (%) 72 107 116 114 203 327
Source: Perspective XXI (2004).
Some summary remarks can be made concerning the prospects for agriculture in regional economic specialisation. Even if both productivity and investment grow, Kaliningrad’s agriculture will be unable to compete with the agricultural producers of the neighbouring countries. The reasons are greater productivity, a better supply of capital and extremely high levels of agricultural subsidies in the EU. An additional reason is the virtual absence of transport costs for Polish and Lithuanian agricultural imports to Kaliningrad because of immediate proximity. Furthermore, Russia’s WTO accession will not open the EU market to agricultural products. Here, various non-tariff barriers pose virtually insurmountable obstacles.
By and large, agriculture will not represent a solid component of Kaliningrad’s GRP in the future. Its role could be that of a relatively minor supplementary and support sector, combined with a narrow specialisation in a few competitive products. Local agriculture can a) specialise in a narrow group of internationally competitive products, such as rape, fur, barley (aiming at the production of malt) and flax; b) sustain a limited production to serve as an input for the regional food-processing industry; and c) provide a limited supply for the local market.
Transport: The backbone of the regional economy
The transport sector has two principal functions. First, it facilitates the functioning of Kaliningrad’s regional economy as a whole. In addition, it serves Russian–EU transit. The transport complex is a traditional backbone of Kaliningrad’s economy in two senses. It produces 8-9% of GRP with a slight upward trend. More important, the presence of a relatively powerful
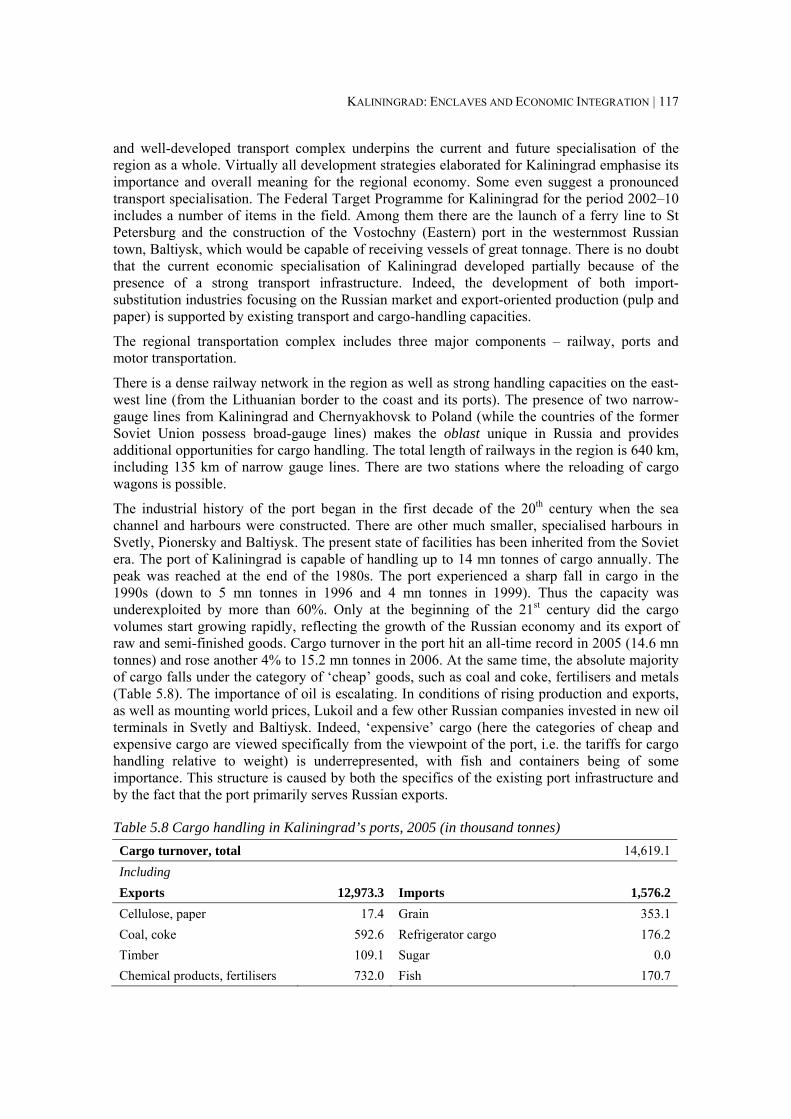
KALININGRAD: ENCLAVES AND ECONOMIC INTEGRATION | 117
and well-developed transport complex underpins the current and future specialisation of the region as a whole. Virtually all development strategies elaborated for Kaliningrad emphasise its importance and overall meaning for the regional economy. Some even suggest a pronounced transport specialisation. The Federal Target Programme for Kaliningrad for the period 2002–10 includes a number of items in the field. Among them there are the launch of a ferry line to St Petersburg and the construction of the Vostochny (Eastern) port in the westernmost Russian town, Baltiysk, which would be capable of receiving vessels of great tonnage. There is no doubt that the current economic specialisation of Kaliningrad developed partially because of the presence of a strong transport infrastructure. Indeed, the development of both import-substitution industries focusing on the Russian market and export-oriented production (pulp and paper) is supported by existing transport and cargo-handling capacities.
The regional transportation complex includes three major components – railway, ports and motor transportation.
There is a dense railway network in the region as well as strong handling capacities on the east-west line (from the Lithuanian border to the coast and its ports). The presence of two narrow-gauge lines from Kaliningrad and Chernyakhovsk to Poland (while the countries of the former Soviet Union possess broad-gauge lines) makes the oblast unique in Russia and provides additional opportunities for cargo handling. The total length of railways in the region is 640 km, including 135 km of narrow gauge lines. There are two stations where the reloading of cargo wagons is possible.
The industrial history of the port began in the first decade of the 20th century when the sea channel and harbours were constructed. There are other much smaller, specialised harbours in Svetly, Pionersky and Baltiysk. The present state of facilities has been inherited from the Soviet era. The port of Kaliningrad is capable of handling up to 14 mn tonnes of cargo annually. The peak was reached at the end of the 1980s. The port experienced a sharp fall in cargo in the 1990s (down to 5 mn tonnes in 1996 and 4 mn tonnes in 1999). Thus the capacity was underexploited by more than 60%. Only at the beginning of the 21st century did the cargo volumes start growing rapidly, reflecting the growth of the Russian economy and its export of raw and semi-finished goods. Cargo turnover in the port hit an all-time record in 2005 (14.6 mn tonnes) and rose another 4% to 15.2 mn tonnes in 2006. At the same time, the absolute majority of cargo falls under the category of ‘cheap’ goods, such as coal and coke, fertilisers and metals (Table 5.8). The importance of oil is escalating. In conditions of rising production and exports, as well as mounting world prices, Lukoil and a few other Russian companies invested in new oil terminals in Svetly and Baltiysk. Indeed, ‘expensive’ cargo (here the categories of cheap and expensive cargo are viewed specifically from the viewpoint of the port, i.e. the tariffs for cargo handling relative to weight) is underrepresented, with fish and containers being of some importance. This structure is caused by both the specifics of the existing port infrastructure and by the fact that the port primarily serves Russian exports.
Table 5.8 Cargo handling in Kaliningrad’s ports, 2005 (in thousand tonnes) Cargo turnover, total 14,619.1 Including Exports 12,973.3 Imports 1,576.2 Cellulose, paper 17.4 Grain 353.1 Coal, coke 592.6 Refrigerator cargo 176.2 Timber 109.1 Sugar 0.0 Chemical products, fertilisers 732.0 Fish 170.7
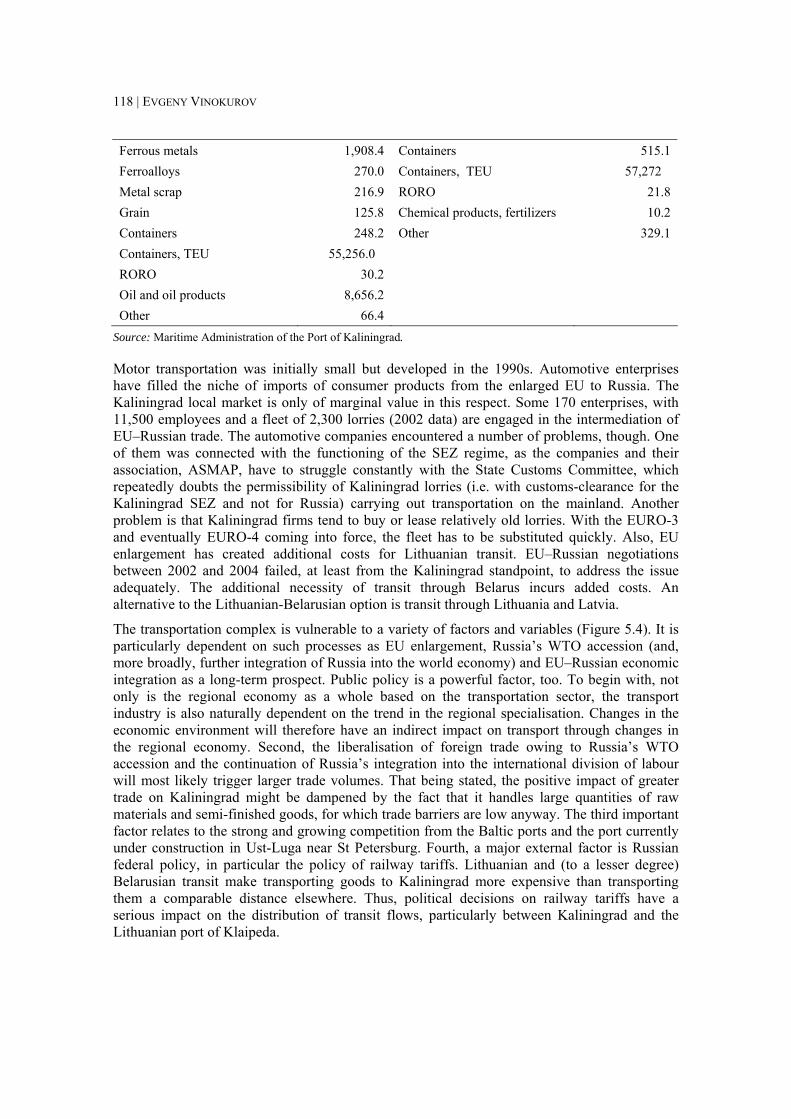
118 | EVGENY VINOKUROV
Ferrous metals 1,908.4 Containers 515.1 Ferroalloys 270.0 Containers, TEU 57,272 Metal scrap 216.9 RORO 21.8 Grain 125.8 Chemical products, fertilizers 10.2 Containers 248.2 Other 329.1 Containers, TEU 55,256.0 RORO 30.2 Oil and oil products 8,656.2 Other 66.4
Source: Maritime Administration of the Port of Kaliningrad.
Motor transportation was initially small but developed in the 1990s. Automotive enterprises have filled the niche of imports of consumer products from the enlarged EU to Russia. The Kaliningrad local market is only of marginal value in this respect. Some 170 enterprises, with 11,500 employees and a fleet of 2,300 lorries (2002 data) are engaged in the intermediation of EU–Russian trade. The automotive companies encountered a number of problems, though. One of them was connected with the functioning of the SEZ regime, as the companies and their association, ASMAP, have to struggle constantly with the State Customs Committee, which repeatedly doubts the permissibility of Kaliningrad lorries (i.e. with customs-clearance for the Kaliningrad SEZ and not for Russia) carrying out transportation on the mainland. Another problem is that Kaliningrad firms tend to buy or lease relatively old lorries. With the EURO-3 and eventually EURO-4 coming into force, the fleet has to be substituted quickly. Also, EU enlargement has created additional costs for Lithuanian transit. EU–Russian negotiations between 2002 and 2004 failed, at least from the Kaliningrad standpoint, to address the issue adequately. The additional necessity of transit through Belarus incurs added costs. An alternative to the Lithuanian-Belarusian option is transit through Lithuania and Latvia.
The transportation complex is vulnerable to a variety of factors and variables (Figure 5.4). It is particularly dependent on such processes as EU enlargement, Russia’s WTO accession (and, more broadly, further integration of Russia into the world economy) and EU–Russian economic integration as a long-term prospect. Public policy is a powerful factor, too. To begin with, not only is the regional economy as a whole based on the transportation sector, the transport industry is also naturally dependent on the trend in the regional specialisation. Changes in the economic environment will therefore have an indirect impact on transport through changes in the regional economy. Second, the liberalisation of foreign trade owing to Russia’s WTO accession and the continuation of Russia’s integration into the international division of labour will most likely trigger larger trade volumes. That being stated, the positive impact of greater trade on Kaliningrad might be dampened by the fact that it handles large quantities of raw materials and semi-finished goods, for which trade barriers are low anyway. The third important factor relates to the strong and growing competition from the Baltic ports and the port currently under construction in Ust-Luga near St Petersburg. Fourth, a major external factor is Russian federal policy, in particular the policy of railway tariffs. Lithuanian and (to a lesser degree) Belarusian transit make transporting goods to Kaliningrad more expensive than transporting them a comparable distance elsewhere. Thus, political decisions on railway tariffs have a serious impact on the distribution of transit flows, particularly between Kaliningrad and the Lithuanian port of Klaipeda.
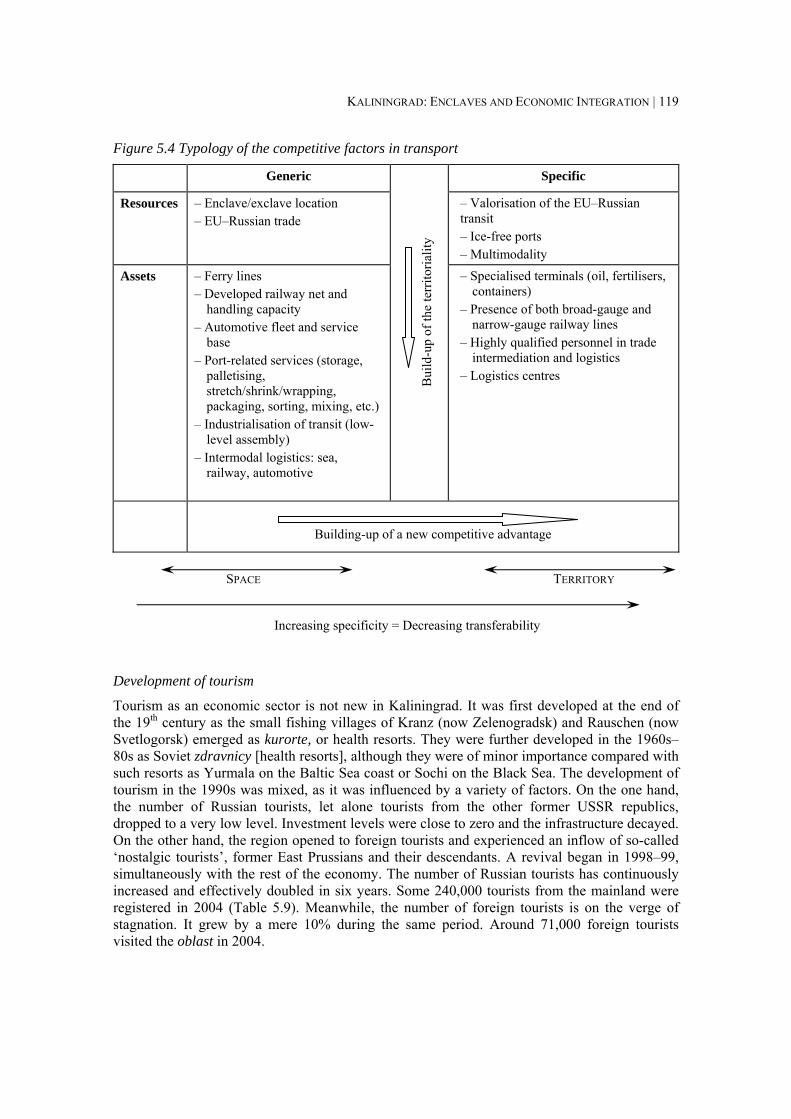
KALININGRAD: ENCLAVES AND ECONOMIC INTEGRATION | 119
Figure 5.4 Typology of the competitive factors in transport
Generic Specific
Resources – Enclave/exclave location – EU–Russian trade
– Valorisation of the EU–Russian transit – Ice-free ports – Multimodality
Assets – Ferry lines – Developed railway net and
handling capacity – Automotive fleet and service
base – Port-related services (storage,
palletising, stretch/shrink/wrapping, packaging, sorting, mixing, etc.)
– Industrialisation of transit (low-level assembly)
– Intermodal logistics: sea, railway, automotive
Bui
ld-u
p of
the
terr
itoria
lity
– Specialised terminals (oil, fertilisers, containers)
– Presence of both broad-gauge and narrow-gauge railway lines
– Highly qualified personnel in trade intermediation and logistics
– Logistics centres
Building-up of a new competitive advantage
SPACE TERRITORY
Increasing specificity = Decreasing transferability
Development of tourism
Tourism as an economic sector is not new in Kaliningrad. It was first developed at the end of the 19th century as the small fishing villages of Kranz (now Zelenogradsk) and Rauschen (now Svetlogorsk) emerged as kurorte, or health resorts. They were further developed in the 1960s–80s as Soviet zdravnicy [health resorts], although they were of minor importance compared with such resorts as Yurmala on the Baltic Sea coast or Sochi on the Black Sea. The development of tourism in the 1990s was mixed, as it was influenced by a variety of factors. On the one hand, the number of Russian tourists, let alone tourists from the other former USSR republics, dropped to a very low level. Investment levels were close to zero and the infrastructure decayed. On the other hand, the region opened to foreign tourists and experienced an inflow of so-called ‘nostalgic tourists’, former East Prussians and their descendants. A revival began in 1998–99, simultaneously with the rest of the economy. The number of Russian tourists has continuously increased and effectively doubled in six years. Some 240,000 tourists from the mainland were registered in 2004 (Table 5.9). Meanwhile, the number of foreign tourists is on the verge of stagnation. It grew by a mere 10% during the same period. Around 71,000 foreign tourists visited the oblast in 2004.
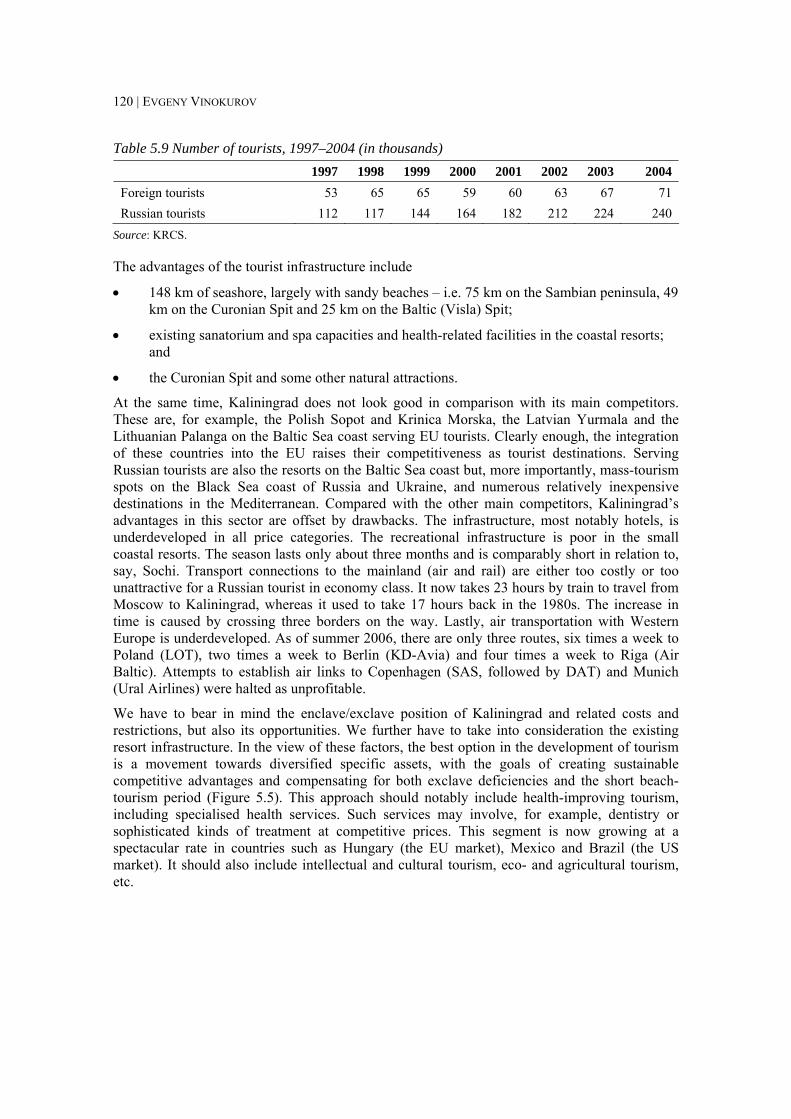
120 | EVGENY VINOKUROV
Table 5.9 Number of tourists, 1997–2004 (in thousands) 1997 1998 1999 2000 2001 2002 2003 2004 Foreign tourists 53 65 65 59 60 63 67 71 Russian tourists 112 117 144 164 182 212 224 240
Source: KRCS.
The advantages of the tourist infrastructure include
• 148 km of seashore, largely with sandy beaches – i.e. 75 km on the Sambian peninsula, 49 km on the Curonian Spit and 25 km on the Baltic (Visla) Spit;
• existing sanatorium and spa capacities and health-related facilities in the coastal resorts; and
• the Curonian Spit and some other natural attractions.
At the same time, Kaliningrad does not look good in comparison with its main competitors. These are, for example, the Polish Sopot and Krinica Morska, the Latvian Yurmala and the Lithuanian Palanga on the Baltic Sea coast serving EU tourists. Clearly enough, the integration of these countries into the EU raises their competitiveness as tourist destinations. Serving Russian tourists are also the resorts on the Baltic Sea coast but, more importantly, mass-tourism spots on the Black Sea coast of Russia and Ukraine, and numerous relatively inexpensive destinations in the Mediterranean. Compared with the other main competitors, Kaliningrad’s advantages in this sector are offset by drawbacks. The infrastructure, most notably hotels, is underdeveloped in all price categories. The recreational infrastructure is poor in the small coastal resorts. The season lasts only about three months and is comparably short in relation to, say, Sochi. Transport connections to the mainland (air and rail) are either too costly or too unattractive for a Russian tourist in economy class. It now takes 23 hours by train to travel from Moscow to Kaliningrad, whereas it used to take 17 hours back in the 1980s. The increase in time is caused by crossing three borders on the way. Lastly, air transportation with Western Europe is underdeveloped. As of summer 2006, there are only three routes, six times a week to Poland (LOT), two times a week to Berlin (KD-Avia) and four times a week to Riga (Air Baltic). Attempts to establish air links to Copenhagen (SAS, followed by DAT) and Munich (Ural Airlines) were halted as unprofitable.
We have to bear in mind the enclave/exclave position of Kaliningrad and related costs and restrictions, but also its opportunities. We further have to take into consideration the existing resort infrastructure. In the view of these factors, the best option in the development of tourism is a movement towards diversified specific assets, with the goals of creating sustainable competitive advantages and compensating for both exclave deficiencies and the short beach-tourism period (Figure 5.5). This approach should notably include health-improving tourism, including specialised health services. Such services may involve, for example, dentistry or sophisticated kinds of treatment at competitive prices. This segment is now growing at a spectacular rate in countries such as Hungary (the EU market), Mexico and Brazil (the US market). It should also include intellectual and cultural tourism, eco- and agricultural tourism, etc.
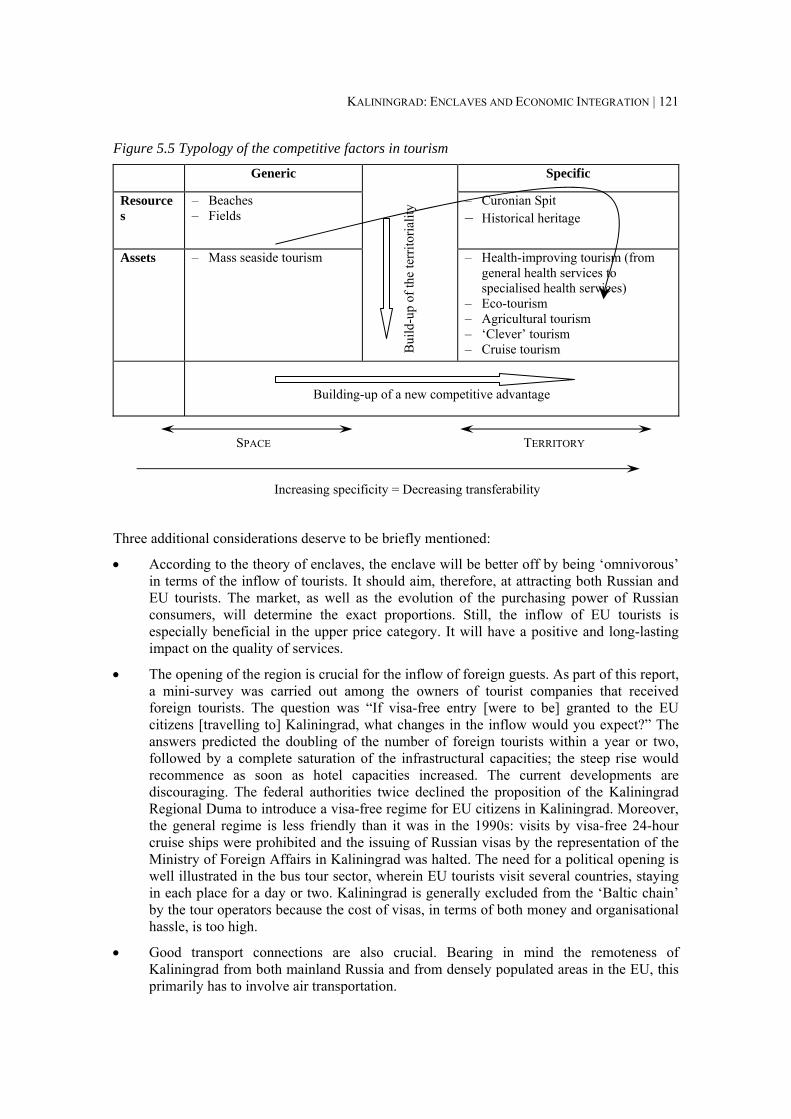
KALININGRAD: ENCLAVES AND ECONOMIC INTEGRATION | 121
Figure 5.5 Typology of the competitive factors in tourism
Generic Specific
Resources
– Beaches – Fields
– Curonian Spit – Historical heritage
Assets – Mass seaside tourism
Bui
ld-u
p of
the
terr
itoria
lity
– Health-improving tourism (from general health services to specialised health services)
– Eco-tourism – Agricultural tourism – ‘Clever’ tourism – Cruise tourism
Building-up of a new competitive advantage
SPACE TERRITORY
Increasing specificity = Decreasing transferability
Three additional considerations deserve to be briefly mentioned:
• According to the theory of enclaves, the enclave will be better off by being ‘omnivorous’ in terms of the inflow of tourists. It should aim, therefore, at attracting both Russian and EU tourists. The market, as well as the evolution of the purchasing power of Russian consumers, will determine the exact proportions. Still, the inflow of EU tourists is especially beneficial in the upper price category. It will have a positive and long-lasting impact on the quality of services.
• The opening of the region is crucial for the inflow of foreign guests. As part of this report, a mini-survey was carried out among the owners of tourist companies that received foreign tourists. The question was “If visa-free entry [were to be] granted to the EU citizens [travelling to] Kaliningrad, what changes in the inflow would you expect?” The answers predicted the doubling of the number of foreign tourists within a year or two, followed by a complete saturation of the infrastructural capacities; the steep rise would recommence as soon as hotel capacities increased. The current developments are discouraging. The federal authorities twice declined the proposition of the Kaliningrad Regional Duma to introduce a visa-free regime for EU citizens in Kaliningrad. Moreover, the general regime is less friendly than it was in the 1990s: visits by visa-free 24-hour cruise ships were prohibited and the issuing of Russian visas by the representation of the Ministry of Foreign Affairs in Kaliningrad was halted. The need for a political opening is well illustrated in the bus tour sector, wherein EU tourists visit several countries, staying in each place for a day or two. Kaliningrad is generally excluded from the ‘Baltic chain’ by the tour operators because the cost of visas, in terms of both money and organisational hassle, is too high.
• Good transport connections are also crucial. Bearing in mind the remoteness of Kaliningrad from both mainland Russia and from densely populated areas in the EU, this primarily has to involve air transportation.
122 |
Chapter 6.
Main findings and policy consequences
6.1 Main findings The conclusions are limited to a concise bullet-point summary of the main findings.
1) Kaliningrad has experienced a major shift in its economic orientation towards the tertiary sector and a new industrial orientation based on its position as an intermediary in EU–Russian trade relations. The economic crisis of the 1990s was characterised on the one hand by a sharp decline in the relative share of commodities production (manufacturing and mining, agriculture, construction and forestry) and on the other hand by continuous growth in the relative share of services in the GRP. As a result, Kaliningrad’s GRP structure transformed within a decade and began to resemble the typical structures of more developed states. Yet this resemblance should not mislead observers because it was reached by a sharp fall in industrial production. The economic transition of the local economy can be split into two clearly distinguishable periods, 1991–98 and 1999 onwards. After the first period, when industry and agriculture collapsed far below average Russian levels, the second period of rapid industrial growth began. The growth was based on the SEZ regime, combined with a strong overall rise in consumption in Russia. Despite robust industrial growth being an engine for regional growth, it did not result in a relative re-industrialisation. The shares held by various sectors in Kaliningrad’s GRP have generally remained stable. Industrial growth triggered subsequent growth in transportation, trade, construction and services.
2) The current state of Kaliningrad’s industry is characterised by a clear division into two groups, firms that are export-oriented and those that focus on import substitution. The first group is represented by the extraction of oil and by the wood, pulp and paper sector (with some reservations, as some of the latter sector’s production is aimed at the Russian market, too). The second group comprises the food-processing, machine-building and furniture industries, which sell their output mainly on the Russian market. Import-substitution industries are experiencing dynamic growth, whereas export-oriented ones are growing slowly or stagnating. Traditional exports possess little potential for growth.
An analysis of the industrial structure leads to the conclusion that the region has managed to develop industries in which it was already specialised during the Soviet era. At the same time, traditional sectors are undergoing profound qualitative changes and switching to new products.
The SEZ regime has played a crucial role in the recent industrial development of the Kaliningrad region. Regional industry reorganised itself over the last decade to take full advantage of the SEZ preferences. To a great extent the leading industries are based on these preferences, such that they might not be able to survive if the preferences were taken away.
3) An analysis of Kaliningrad’s trade flows with mainland Russia and the region’s foreign trade leads to the following conclusions: • The degree of trade openness is extremely high, with total trade volumes exceeding
GRP by a factor of 2.7. • Trade with Russia plays a significant role in the trade balance of the Kaliningrad
oblast, making up more than 40% of overall trade flows. Another 40% of trade is carried out with the enlarged EU.
KALININGRAD: ENCLAVES AND ECONOMIC INTEGRATION | 123
• The oblast is the more developed trade partner in its trade with mainland Russia, buying fuels and raw materials, and selling processed goods. Yet the growth of trade primarily stems from the SEZ and the development of import-substitution industries oriented towards the Russian market.
4) Total trade reveals high IIT values. Although comparative advantages based on basic factor endowments may still be relevant to explain Kaliningrad’s orientation, their explanatory power is limited. We need to move away from basic factors to consider other factors, resources and assets, notably the legal framework in which Kaliningrad’s trade takes place. At the same time, most of the sectors that feature prominently in the region’s foreign trade have low IIT values. Here, the explanatory power of comparative advantage is rather strong and still highly relevant for Kaliningrad’s specialisation.
5) Overall, Kaliningrad possesses a comparative advantage in labour-intensive products in relation to the EU-15 and the CEECs, but not with regard to Russia. The region is comparatively disadvantaged in capital-intensive goods. It benefits from low energy costs as a factor of production compared with the EU, but it is disadvantaged compared with mainland Russia. Use of low-cost and efficient labour, along with external factors, has played an important role in shaping the current specialisation of the regional economy.
6) Our exploration of enclave economies provides a comprehensive set of pivotal benchmarks on the issue of Kaliningrad’s specialisation: • Enclaves are usually economically disadvantaged in comparison with other regions
of the same state. • Enclaves have a high degree of economic vulnerability. Their vulnerability comes
from not only their small size and insularity (enclavity), but also their detachment (exclavity) from the mainland.
• Since enclaves are small in territory and population, their economic potential consequently tends to be limited. Although Kaliningrad is one of the largest enclaves in the world, its local market and production base are small.
• Exclavity impedes both exports to foreign countries and outflows to the mainland. From the point of view of economic geography, the surrounding state could form a convenient proximity market. Yet, numerous tariff and non-tariff barriers make the enclave’s products uncompetitive against the surrounding state’s own producers and protect this market. Furthermore, the sheer distance and cost of transit complicate access to the potential market of the mainland state.
• Double peripherality is a natural consequence of an enclave’s geographical location relative to the economic geography of the mainland and the surrounding state.
• Economic openness is a prerequisite for an enclave’s prosperity. There is a straightforward correlation between the relative incomes per capita in the MES triangle and the presence or absence of a regime of economic openness. All enclaves with incomes either higher than or equal to the mainland’s average enjoy a regime of economic openness towards the outside world. Conversely, the majority of enclaves with incomes inferior to the mainland’s average are closed to the outside world.
• Inherent economic disadvantages combined with increased vulnerability explain why various kinds of special economic regimes are so often established in enclaves. A special economic regime can make an enclave economically viable in the situation wherein its natural assets are not sufficient for its survival. Two approaches can be employed, the compensatory approach (compensation for the
124 | EVGENY VINOKUROV
detachment from the mainland) and the liberal approach (liberalisation towards the surrounding state and the rest of the world).
• Successful enclaves tend to develop a multi-vectored orientation, avoiding a concentration of trade and economic connection exclusively with the mainland.
7) A successful economic strategy should be able to achieve two results simultaneously. First, it should allow exclave costs to be minimised. Second, a successful strategy should take advantage of available resources. In other words, it should make Kaliningrad’s enclavity a resource in itself (given its proximity to the EU market). The best strategies induce an economic orientation that is well adapted to the specific conditions of the enclave, simultaneously minimising costs and valorising resources. The issues of international and interregional economic orientation in the specific case of Kaliningrad should be viewed as inseparable.
8) An optimal orientation would be situated within a high development trajectory supplemented by the building-up of new competitive advantages in selected economic sectors. It would combine both the Russian market and the export market (primarily to the EU). Furthermore, it should minimise exclave costs and valorise resources so that enclave-specific opportunities outweigh enclave-specific costs.
This should be achieved through • a regime of economic openness to enable multi-vector specialisation and an optimal
place in the EU–Russian trade interface; • a valorisation of the geographical location as a way to promote close interaction
with the EU economy; • a concentration on high added-value activities to counteract enclave-specific
transaction costs; • the decreasing transferability of assets by moving towards specific assets, anchored
in the territory; and • a reduction in the total transport-intensity of production.
9) An optimal distribution of Kaliningrad’s GRP could be outlined as below. • The share of agriculture in the GRP is already relatively low and is unlikely to
increase in the future. Overall, with a few exceptions a specialisation in agricultural products is unjustified for the Kaliningrad region.
• Industrial manufacturing is able to remain a stronghold of the regional economy and an engine for economic development. It has to move towards higher added-value activities and sectors with a greater degree of territoriality.
• Despite the rise in the share of services in the GRP, their potential is underused. Services, ranging from transport to tourism, should take a larger share in the GRP. Transport, tourism and ‘clean gate’-types of advanced services in the field of trade intermediation are fully compatible with a high development trajectory. They also fit perfectly into an ideal ‘enclave’ specialisation.
10) The issue of Kaliningrad’s specialisation necessarily has to be seen within the framework of Russian–EU economic interaction, as there is no viable economic alternative for Kaliningrad. More specifically, a) The future of Kaliningrad’s regional economy and its specialisation are profoundly
connected to Russian–EU relations and the prospects for their economic integration.
KALININGRAD: ENCLAVES AND ECONOMIC INTEGRATION | 125
b) Kaliningrad’s specialisation is dependent on the contents and dynamics of trade flows between Russia and the EU.
The current state of Russian–EU relations is not favourable to the economic development of the Kaliningrad region. The lack of economic openness, high barriers to the EU market and high transaction costs in trade with the Russian regions (partly because of EU enlargement) impede the transition to an advanced and less vulnerable economy. More comprehensive economic integration would unlock the potential of the region. Regulatory convergence, the lowering of TBTs and the facilitation of the movement of people are, in this respect, of no less importance than more traditional trade integration. These conditions have to be supplemented by political stability and good neighbourly relations based on trust and understanding. Economic integration between the partners would entail a major positive change for the Kaliningrad enclave. It would allow Kaliningrad to achieve a multi-vectored orientation, producing for both the Russian and the EU markets and thus prevent a heavy and unhealthy dependence on the Russian market alone. It would effectively counteract the drawbacks of the enclave’s small size. The most important consequence of the prospective EU–Russian economic integration is that it would help valorise the advantage of the Kaliningrad region, which consists in its proximity to the EU market. Strained EU–Russian relations would seriously obstruct economic development and make Kaliningrad more dependent on Russian federal subsidies.
6.2 Policy issues: A liberal and positive approach The 2006 SEZ law and Kaliningrad’s specialisation
It is assumed that the tax privileges envisaged in the new SEZ law “stimulate the establishment of new capital-intensive industries in several sectors of the regional economy not previously stimulated by the customs-free regime” (Zhdanov, 2005, pp. 86-87). As discussed in section 4.4, this view appears to be over-optimistic in general. The new SEZ regime favours both low and high development paths, but it fails to provide a favourable framework for creating new competitive advantages that would be able to offset or minimise the high exclave costs. Also, the new regime indirectly discriminates in favour of export substitution based on knowledge-intensive activities in two ways. First, the law puts SMEs at a disadvantage, despite their crucial role in the development of innovative businesses. Second, the law indirectly discriminates against the development of services and thus deprives the region of the modern infrastructure that should serve as the foundations of a new economy.
Overall, as described in detail in section 4.4, the new SEZ regime, if not supplemented by other measures (notably intensive export promotion) will promote large industrial projects targeting the Russian market. Meanwhile,
• the export vector will likely remain unexploited; • smaller business projects and regional SMEs will suffer discrimination; and • the development of services will not be supported by the law.
Thus, the new SEZ regime lies within the old industrial paradigm. It effectively promotes a traditional 20th century industrial orientation to the detriment of a 21st century economy. Furthermore, the law is likely to inhibit the development of new advanced industries in the Kaliningrad region, especially services.
The new SEZ regime largely contradicts the necessity to move towards a high development path and create new competitive advantages. In Figure 6.1, the only common cell with a high development path is the one of import substitution. The new SEZ regime is also hard to
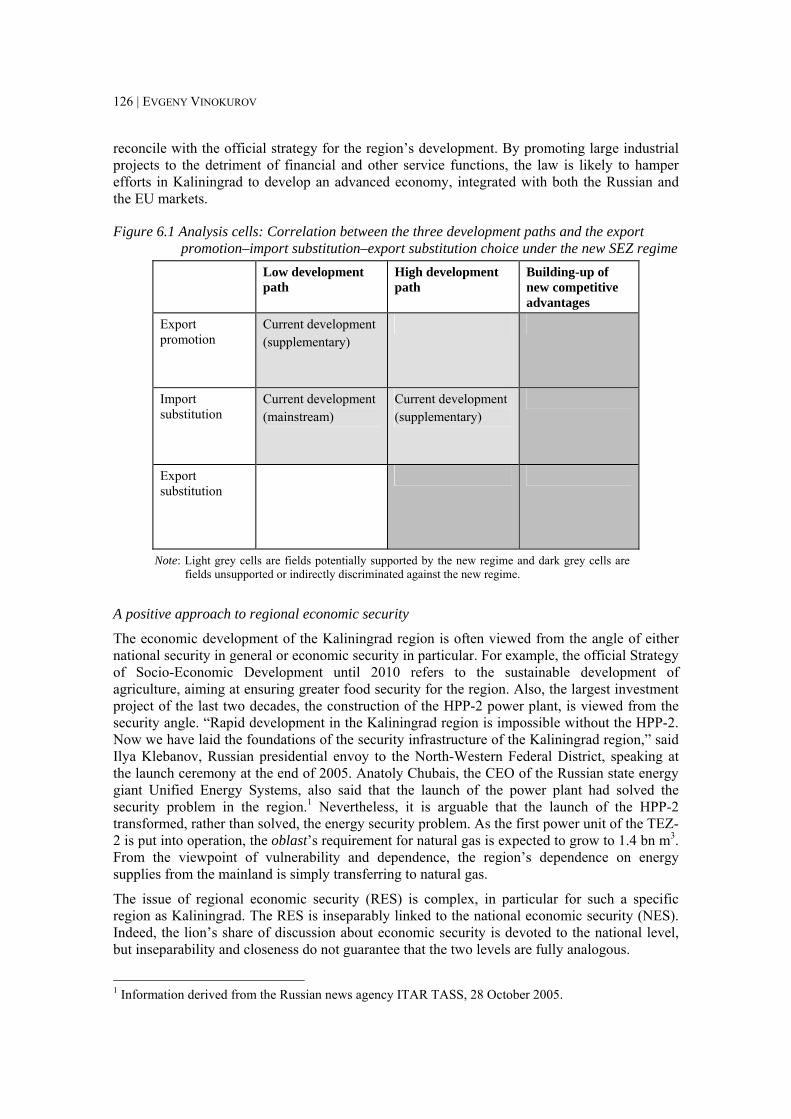
126 | EVGENY VINOKUROV
reconcile with the official strategy for the region’s development. By promoting large industrial projects to the detriment of financial and other service functions, the law is likely to hamper efforts in Kaliningrad to develop an advanced economy, integrated with both the Russian and the EU markets.
Figure 6.1 Analysis cells: Correlation between the three development paths and the export promotion–import substitution–export substitution choice under the new SEZ regime
Low development path
High development path
Building-up of new competitive advantages
Export promotion
Current development (supplementary)
Import substitution
Current development (mainstream)
Current development (supplementary)
Export substitution
Note: Light grey cells are fields potentially supported by the new regime and dark grey cells are fields unsupported or indirectly discriminated against the new regime.
A positive approach to regional economic security
The economic development of the Kaliningrad region is often viewed from the angle of either national security in general or economic security in particular. For example, the official Strategy of Socio-Economic Development until 2010 refers to the sustainable development of agriculture, aiming at ensuring greater food security for the region. Also, the largest investment project of the last two decades, the construction of the HPP-2 power plant, is viewed from the security angle. “Rapid development in the Kaliningrad region is impossible without the HPP-2. Now we have laid the foundations of the security infrastructure of the Kaliningrad region,” said Ilya Klebanov, Russian presidential envoy to the North-Western Federal District, speaking at the launch ceremony at the end of 2005. Anatoly Chubais, the CEO of the Russian state energy giant Unified Energy Systems, also said that the launch of the power plant had solved the security problem in the region.1 Nevertheless, it is arguable that the launch of the HPP-2 transformed, rather than solved, the energy security problem. As the first power unit of the TEZ-2 is put into operation, the oblast’s requirement for natural gas is expected to grow to 1.4 bn m3. From the viewpoint of vulnerability and dependence, the region’s dependence on energy supplies from the mainland is simply transferring to natural gas.
The issue of regional economic security (RES) is complex, in particular for such a specific region as Kaliningrad. The RES is inseparably linked to the national economic security (NES). Indeed, the lion’s share of discussion about economic security is devoted to the national level, but inseparability and closeness do not guarantee that the two levels are fully analogous.
1 Information derived from the Russian news agency ITAR TASS, 28 October 2005.

KALININGRAD: ENCLAVES AND ECONOMIC INTEGRATION | 127
The comprehensive monograph Economic Security of Russia by Zagashvili (1997) contains several definitions of NES. These definitions stress such aspects as independence, sustainability, development potential and competitiveness. The economic security of a region is connected to the economic security of the state. A review of the definitions allows us to observe clearly the dilemma between negative and positive approaches to economic security issues. Zagashvili promotes a positive approach to NES issues. He argues that security policy should aim at economic growth rather than mere protection from economic decline. Consequently, his NES definition is as follows: “National economic security is the state of [the] national economy that provides economic sovereignty, increases economic strength and quality of life in conditions of participation in international economic interdependency in the geo-economic structure understood as a spatial-power structure of global economy” (ibid, p. 50).
There are several publications partly or completely devoted to Kaliningrad’s economic security. The most exhaustive one is Asharin’s (2001) doctoral thesis on the “Foreign economic security of the Russian Federation in the Baltic region (on the example of the Kaliningrad oblast)”. We confront the reference point, namely the security of the Russian Federation, in the title. The main thesis is that there is an imminent danger of the region being re-Germanised, at which point Moscow would gradually lose control over its westernmost region and Kaliningrad would be torn away from Russia. The author argues that, while developing economic contacts with Kaliningrad, European countries, Germany in particular, are not guided by purely economic reasons but by non-economic considerations as well. In his view, Germany’s policy in the long term is to create economic beachheads and leading economic positions for ethnic Germans in the Kaliningrad oblast. The German goal in this context is to strengthen Kaliningrad’s dependence on Germany and to create the prerequisites for returning East Prussia to Germany’s bosom.
This thesis is not justifiable.
Throughout the 1990s and the first half of the 2000s, Germany has been among Kaliningrad’s major trade partners. After having been in second place behind Poland for a number of years, it became the top trading partner in 2004 (mainly because oil exports switched from Poland to Western European countries, including Germany). Foreign trade with Germany accounted for $637.6 mn out of $3,006.0 mn of total trade turnover in 2004, i.e. slightly over 20%. The share of trade with Germany is easily explained by the force of natural gravity, given the size of Germany’s economy and its proximity to the Kaliningrad region. Conspiracy theories do not hold up in front of the empirical evidence.
German investments are insignificant in the region. They totalled $5.9 mn in 2003. Before that, they made up around $2.0-$4.0 mn per year during the 1990s, with an exceptional spike to $20.3 mn in 1998. By the end of 2003, Germany accounted for 12.5% of accumulated FDI (i.e. less than $40.0 mn). These figures are minor in comparison with the annual volumes of investment from the Russian mainland, which, according to experts’ estimates, exceed all foreign investment by about 5-10 times. Actual economic data, therefore, contradicts the hypothesis of a creeping return of German influence and power in the region. In fact, the limited investment from Germany can be partially explained by existing concerns about the politicisation of economic issues.
Also, the number of ethnic Germans in the region is limited to 8,340 (according to 2002 all-Russia census data), i.e. less than 0.9% of the total population of 955,300. It is out of the question that this minority, primarily residing in the countryside, is about to secure a leading position in the regional economy. Moreover, Asharin’s arguments do not seem acquainted with regular public opinion polls, which fail to demonstrate any base for separatism.
128 | EVGENY VINOKUROV
On the basis of his analysis of the situation (which, it can be asserted, is founded on incomplete or false information), Asharin has formulated a definition of the Russian Federation’s foreign economic security in relation to the Kaliningrad region. The definition concentrates on protecting Kaliningrad from “aspects of external economic and political impact that could undermine political stability in the region and the loyalty of local authorities towards the federal centre and thus stimulate a possible exit of Kaliningrad from the Russian Federation” (Asharin, 2001, p. 20). Asharin’s definition probably provides an extreme example of the negative approach to problems of regional economic security. The emphasis is put on protection, stability and prevention of unfavourable developments.
Meanwhile, there are a number of other Russian publications that specifically focus on the dangers Kaliningrad supposedly may bring to Russian sovereignty. For example, Voronov (2005) emphasises the “existential problem”: in order to become economically efficient, the region must become “more European”, which in turn can stimulate centrifugal forces. A Kaliningrad professor, V.V. Ivchenko, also analyses Kaliningrad-related economic security issues from the vantage point of mainland Russia. His argumentation is crystal clear.
Kaliningrad has an extremely important economic role for the Russian North-West and the country as a whole. In the case of unfavourable developments connected to an increase in Russia–NATO confrontation, the oblast will acquire a strategic role as a factor of military containment. It follows that the Kaliningrad oblast should be kept in the unified Russian political, economic, and military space in the historical perspective of the 21st century by any means necessary (2001, p. 4).
This main objective conditions the strategic goals of Russia in the region: keeping the region in the Russian economic and political space, providing for a sustainable economic development according to national goals and preserving the military presence in the region (ibid, p. 5).
Another approach is employed in Klemeshev, Kozlov & Fedorov (2002). The region itself (and not the country) becomes the reference point. Three components determine economic security, namely an efficient economic specialisation, the greater reliability and lower costs of communication with mainland Russia and mutually beneficial relations with neighbouring countries (ibid, p. 182). It is then argued that the strategy, which would provide all three components, would effectively increase regional economic security. Complementing this vision, Kuznetsova & Mau (2002) argue that sustainable socio-economic development, which would allow a bridging of the gap in living standards with neighbouring countries, should be the state policy goal. Such a policy would ensure stability and thus contribute to security.
Both positive and negative approaches are important, but concentration on the negative approach is counter-productive. Security can never be fully ensured in this way. In contemporary conditions, while a combination of the negative and the positive approaches should be employed, an emphasis must be put on the latter. It is particularly true in the conditions of the Kaliningrad region, a Russian exclave and an EU enclave. As the region is located on the Russian–EU interface, its economic security – and of course military security as well – depends directly on the state of EU–Russian relations and on advances in EU–Russian economic integration. A positive approach recognises that the key to security is proper integration into the world economy and good neighbourly relations with the EU. By contrast, the functioning of the enclave as a ‘fortress’ or ‘aircraft-carrier’ corresponds neither to the oblast’s needs nor to Russian national interests.
A number of threats to regional economic security appear to result from Russian federal politics. First, one of the principal instruments of the NES is the foreign economic policy. It may have a strong impact on the regional level as well. As a rule, its impact is strongest on the most open regions, many of which are, in fact, located directly on the borders. The effects of the foreign economic policy are understandably extremely strong in such an open and sensitive region as
KALININGRAD: ENCLAVES AND ECONOMIC INTEGRATION | 129
Kaliningrad. Its exclavity is an additional factor in this respect. Even a minor change may result in an asymmetric shock for the detached region. At the same time, the feedback mechanisms are rather circumscribed, since the region has only limited possibilities for influencing federal policy-making. Thus, not only the policies of foreign states, but also changes in Russian foreign policy represent an imminent potential danger for regional economic security, as they are likely to result in severe asymmetric shocks. The way to reduce this vulnerability and to achieve sustainable growth is to create an open economy. Economic openness can therefore be the best way to ensure both national and regional economic security.
Second, the instability of the framework conditions for regional economic development has proven to be a strong destabilising factor. The 1990s and the beginning of the 21st century were marked by periodically repeating worries that the SEZ regime would be disrupted by federal legislation or by the actions of federal ministries and committees. For example, such a disruption occurred at the beginning of 2001, caused by the way the Customs Committee interpreted federal legislation. It almost froze the regional economy for several weeks. Fortunately, these concerns were taken into account in the 2006 SEZ law, in which the existence of the SEZ is guaranteed for 25 years.
Finally, yet another threat to regional economic security stems from attempts to instrumentalise the Kaliningrad factor in Russian–EU relations, namely by using it as a tool in negotiations on other issues that are not directly related to Kaliningrad.
At present, Kaliningrad’s influence on the formation of conditions for successful, external economic activities in the region is weak and indirect; however, this influence might grow through the efforts of regional authorities, political and business interests, and society. Owing to its specific nature, the region has to work hard to find feedback channels and to lobby aggressively for its interests through all possible means.
The liberal approach in Russia’s policy towards the exclave
In a mainland state’s policy towards its exclave in general and in Russia’s policy towards its Baltic exclave in particular, there is a choice between a liberal approach and a proactive state paternalism to counteract exclave costs and the general economic incapability of an exclave region. The compensatory approach is employed when a special regime is introduced to compensate for the detachment from the mainland. Alternatively, the mainland may choose to liberalise the exclave towards the surrounding state and the rest of the world, thus mitigating the exclave’s isolation.
By and large, special economic regimes of either economic integration with the surrounding state or those that make an enclave an organic part of the global economy are necessary for an enclave to be an economically viable entity. As shown in chapter 1, a compensatory approach to the economic policy of the mainland towards its enclave is generally inferior to the liberalisation approach. Nevertheless, it is often employed, fuelled by various political considerations and by the unwillingness to liberalise an enclave. The compensatory approach is evident in Kaliningrad. It is highly visible in Ceuta and Melilla as well. In the case of the Spanish exclaves, compensatory policies prove costly to the mainland’s budget but only partially reach their ultimate goals – a level of economic development and personal incomes comparable with those of the mainland.
In addition, a large public sector is another typical element of indirect economic support. As such, it was and is indicative of, for example, West Berlin, Ceuta, Melilla, Gibraltar and Kaliningrad. In the Russian exclave, the number of employees in public administration more than doubled in the 1990s (going up from 13,100 to 30,000), reaching 34 public servants per 1,000 inhabitants, compared with 20 in Russia as a whole. Their total number (some 32,000)
130 | EVGENY VINOKUROV
was just a little short of that of Estonia (34,100), where the population is 40% larger than in the Kaliningrad region. Russia supports a military garrison of 25-30,000 troops, including the stationing of the Baltic Fleet in Baltiysk.
The embeddedness of the compensatory attitude is well illustrated by the proposal of Solomon Ginsburg, a liberal deputy at the Regional Duma, to enact a so-called ‘Western factor’, which should compensate for the inconveniences caused to the oblast’s population by its remoteness from the Russian mainland. The essence of the bill is that cash compensation should aim at equalising the difference in living standards between the exclave and the mainland.2
A liberalisation approach can be employed by a mainland in a variety of policies. One of them is pursuing an economic integration of the exclave with the surrounding state along the lines of the Büsingen model. It was argued in chapter 1 that this approach was more readily applicable to small and politically insignificant exclaves. For Kaliningrad, an appropriate policy would be to pursue a regime of general economic openness with the outside world. The Hong Kong model can be cited as the textbook example of a policy of general economic openness of the second kind. In such a model, the orientation of an enclave is focused outwards. Enclaves, just like small states, cannot attain high levels of economic development and economies of scale without accepting profound levels of integration into the international economic order. Export orientation is the only viable policy in the long term, with the sole alternative being costly paternalistic policies of economic assistance, which makes an enclave dependent on the mainland. The geographical position of an enclave, its detachment from the mainland and its proximity to foreign markets, especially the market of the surrounding state, dictate the necessity of an outward economic orientation. An outward orientation actually makes the economic development of an enclave more stable in the long run. On the one hand, economic openness increases vulnerability by exposing the enclave to the outside world. Yet overall, enclave-specific vulnerability actually decreases since the enclave becomes less dependent on the mainland for economic assistance. Moreover, issues of mainland–enclave communications and transit through the surrounding state cease to be critical for the enclave’s subsistence and economic survival. Thus in general, the enclave has much better chances for dynamic economic growth.
Economic theory does not give a definite answer about the impact of integration on border regions; it allows only vague conclusions to be drawn about the spatial effects of integration. Depending on specific circumstances, border regions might benefit, lose or not be affected by integration (Niebuhr & Stiller, 2002). Our conclusion for enclaves is different, however. Economic integration – with the surrounding state or on a non-discriminatory basis – has significant positive effects on all enclaves. This outcome can be explained by the notion of exclavity. Despite being located at the periphery, a typical border region is nevertheless well-connected to other regions of the same state. It can profit from the economies of scale of the internal market. An enclave, unlike a typical border region, faces the problems of detachment, isolation, higher transportation costs and enclave-specific vulnerability. There is a clear necessity for an outward economic orientation. Overall, despite any increase in vulnerability to market forces, overall enclave-specific vulnerability actually decreases. A reduced dependency on the mainland and an end to communication and transport problems bring about growth and improvements in living conditions.
Creating a dynamic, open economy in Kaliningrad in the stable framework of EU–Russian relations is clearly the main challenge confronting Russia today in its policy towards Kaliningrad. In all, bench-marking against other large enclaves and exclaves suggests that Russia’s economic policy towards Kaliningrad should follow a more liberal approach. 2 Derived from Public Kaliningrad Radio (www.news.okradio.ru), December 2005.
| 131
Glossary of Abbreviations
APEC Asia–Pacific Economic Cooperation (21 participating countries) bn billion CEECs Central and Eastern European countries CES Common Economic Space CIS Commonwealth of Independent States CT customs territory EFTA European Free Trade Area EU European Union FDI foreign direct investment FEZ free economic zone FRG Federal Republic of Germany FTD Facilitated Transit Document FTP Federal Target Programme FTZ free trade zone GDP gross domestic product GDR German Democratic Republic GRP gross regional product HPP-2 (Kaliningrad) Heat and Power Plant (HPP-2); the HPP-2 is the second plant in
Russia to use new gas-turbine technology IIT intra-industry trade KRCS Kaliningrad Regional Committee for Statistics MES mainland–enclave/exclave–surrounding state mn million M-S mainland–surrounding state n.e.s. not elsewhere specified NAFTA North American Free Trade Agreement NES national economic security NSDAP National Socialist German Workers’ Party (Nazi Party) NWCO North-West Customs Office OECD Organisation for Economic Cooperation and Development PPP purchasing power parity RCA real competitive advantage RDA Regional Development Administration RES regional economic security SEZ special economic zone SFSR Soviet Federative Socialist Republic SMEs small and medium-sized enterprises TBTs technical barriers to trade TCM thousand cubic metres (1,000 m3) TN VED tariff nomenclature of foreign economic activities ULC unit labour cost VAL value-added logistics WTO World Trade Organisation
132 |
Bibliography
Administration of the Kaliningrad Oblast (2003), Strategiya social’no-ekonomicheskogo razvitiya Kaliningradskoy oblast kak regiona sotrudnichestva na period do 2010 goda [The Strategy of the Social-Economic Development of the Kaliningrad oblast as a Region of Cooperation until 2010], Kaliningrad (available at www.gov.kaliningrad.ru).
Ahrend, R. (2004), Russian Industrial Restructuring: Trends in Productivity, Competitiveness and Comparative Advantage, OECD Economics Department Working Papers 408, OECD, Paris.
Armstrong, H.W. and R. Read (1998), “Trade and Growth in Small States: The Impact of Global Trade Liberalisation”, World Economy, Vol. 21, No. 4, pp. 563-85.
Asharin, M. (2001), “Vneshneekonomicheskaya besopasnost’ Rossiyskoy Federacii v Baltiyskom regione (na primere Kaliningradskoy oblasti)” [The foreign economic security of the Russian Federation in the Baltic region (on the example of the Kaliningrad oblast)], Executive summary of a doctoral thesis, Academy of Diplomacy MID RF, Moscow.
Balassa, B. (1965), “Trade Liberalization and ‘Revealed’ Comparative Advantage”, Manchester School of Economic and Social Studies, 33 (May), pp. 90-123 (also reprinted as ch. 4 in Balassa, 1989).
––––––––– (1989), Comparative Advantage, Trade Policy, and Economic Development, New York: New York University Press.
Balassa, B. and L. Bauwens (1988), Changing Trade Patterns in Manufactured Goods: An Econometric Investigation, Contributions to Economic Analysis No. 176, Amsterdam: North Holland.
Baldone, S., F. Sdogati and L. Tajoli (2001), “Patterns and Determinants of International Fragmentation of Production: Evidence from Outward Processing Trade between the EU and Central Eastern European Countries”, Weltwirtschaftliches Archiv, Vol. 137, No. 1, pp. 80-104.
Baxendale, J., S. Dewar and D. Gowan (eds) (2000), The EU and Kaliningrad: Kaliningrad and the Impact of EU Enlargement, Federal Trust, London.
Benedictis, L. de and M. Tamberi (2001), A Note on the Balassa Index of Revealed Comparative Advantage, Working Paper No 158, Universita Politecnica delle Marche (I), Dipartimento di Economia (retrieved from http://ssrn.com/abstract=289602).
Bhagwati, J. (1995), “U.S. Trade Policy: The Infatuation with Free Trade Areas”, in J. Bhagwati and A. Krueger, The Dangerous Drift to Preferential Trade Agreements, American Enterprise Institute, Washington, D.C.
Bilchak, V. and A. Telyatnikov (1995), Centr i anklavny region: problemy vzaimootnosheniy [The Centre and the Enclave Region: The Problems of the Relationship], Vestnik Baltiyskogo nauchnogo centra, 3 (January-March), pp. 12-18.
Bilchak, V., I. Samson and G. Fedorov (2000), Kaliningradsky polyus integracii [The Kaliningrad Pole of Integration], Grenoble, Kaliningrad.
Birkenbach, H.-M. and C. Wellmann (eds) (2003), The Kaliningrad Challenge: Options and Recommendations, LIT: Münster, Hamburg and London.
KALININGRAD: ENCLAVES AND ECONOMIC INTEGRATION | 133
Boockmann, H. (1992), Ostpreussen und Westpreussen [East Prussia and West Prussia], Berlin: Siegler Verlag.
Borodavkina, N. (2001), “Sozdaniye gosudarstvennoy sistemy sodeystvia eksportu” [Establishment of the State System of Export Promotion], Vestnik Baltiyskogo nauchnogo centra, Vol. 2, No. 15, pp. 125-32.
Brenton, P. and S. Manzocchi (2002), “Enlargement, trade and investment: A review of economic impacts”, in P. Brenton and S. Manzocchi (eds), Enlargement, Trade and Investment: The Impact of Barriers to Trade in Europe, CEPS, Brussels and Cheltenham: Edward Elgar.
Brenton, P. and M. Manchin (2002), “Trade Policies in Russia and the EU with Implications for the Economic Impact of a Free Trade Agreement”, mimeo, CEPS, Brussels.
Brenton, P., N. Tourdyeva and J. Whalley (1997), “The Potential Trade Effects of an FTA between the EU and Russia”, Weltwirtschaftliches Archiv, 133, pp. 205-25
––––––––– (2002), “The Economic Impact of a Free Trade Agreement between Russia and the EU: Numerical Simulations using a General Equilibrium Trade Model”, Report prepared for a TACIS project, CEPS, Brussels.
Carluer, F. (2004), Pouvoir économique et espace : Analyses de la divergence régionale, Paris: L’Harmattan.
Chabanova, A.V. (2002), “Razlichiya v kaliningradskom soziume: rezultaty sociologicheskogo issledovaniya” [Differentiality of the Kaliningrad Sozium: The Results of the Sociological Research], in A.P. Klemeshev (ed.), Kaliningradsky sozium v evropeyskom kontekste [Kaliningrad sozium in European context], Kaliningrad: Kaliningrad State University Press.
Colletis, G. and B. Pecqueur (1993), « Intégration des espaces and quasi-intégration des firmes: vers de nouvelles rencontres productives? » Revue d’économie régionale et urbaine, 3.
––––––––– (1994), Les facteurs de la concurrence spatiale et la construction des territoires [Organisation of production and territory: Local models of development], Pavie: Ginni Luculano Editore.
Colletis-Wahl, K. and J. Perrat (2004), « Proximités et dynamiques spatiales », in B. Pecqueur and J.-B. Zimmermann, Economie de proximités; Paris: Lavoisier, Hermes Sciences, pp. 115-33.
Delius, F.C. and P.J. Lapp (1999), Transit Westberlin. Erlebnisse im Zwischenraum [Westberlin Transit: Experience in No Man’s Land], Berlin: Christoph Links Verlag.
Dewar, S. (2000), “What is to be done?”, in J. Baxendale, S. and D. Gowan (eds), The EU and Kaliningrad: Kaliningrad and the Impact of EU Enlargement, Federal Trust, London, pp. 231-64.
Eliseeva, I. and N. Burova (2002), “The measurement of the shadow economy in St Petersburg and Kaliningrad”, paper presented to RECEP Conference “Russia’s Opening to the World Economy and the Building of a Common European Economic Space”, 20-21 September 2002 in Moscow (retrieved in 2003 from www.recep.ru).
Emerson, M., N. Tocci, M. Vahl and N. Whyte (2001), The Elephant and the Bear: The European Union, Russia and Their Near Abroads, CEPS, Brussels.
Emerson, M. (2005), EU–Russia: Four Common Spaces and the Proliferation of the Fuzzy, CEPS Policy Brief No. 71, CEPS, Brussels, May.

134 | EVGENY VINOKUROV
European Commission (2001), Communication on the EU and Kaliningrad, COM(2001) 26 final, 17.01.2001, Brussels (retrieved from http://europa.eu.int/comm/external_relations/ north_dim/doc/com2001_0026en01.pdf).
––––––––– (2002), Communication on Kaliningrad: Transit, Brussels, COM(2002), 510 final, 18.09.2002, Brussels (retrieved from http://europa.eu.int/comm/external_relations/ north_dim/doc/com02_510.pdf).
EU and Russia (2002), Joint Statement on Transit between the Kaliningrad Region and the Rest of the Russian Federation, signed in Brussels on 11 November 2002, Directorate-General External Relations, European Commission, Brussels (retrieved from http://europa.eu.int/comm/external_relations/russia/summit_11_02/js_kalin.htm).
––––––––– (2003), The Common European Economic Space (CEES) Concept Paper, Annex I to the Joint Statement of the 12th EU–Russia Summit held in Rome on 5-6 November.
––––––––– (2004), Joint Statement on EU Enlargement and EU–Russian relations, signed in Brussels on 27 April 2004, Directorate-General External Relations, European Commission, Brussels (retrieved from http://europa.eu.int/comm/external_relations/ russia/russia_docs/js_elarg_270404.htm).
––––––––– (2005), Road Map for the Common Economic Space – Building Blocks for Sustained Economic Growth, Directorate-General External Relations, European Commission, Brussels (retrieved from http://europa.eu.int/comm/external_relations/ russia/summit_05_05/finalroadmaps.pdf#ces#).
EU–Russia Cooperation Programme (2003), “Kaliningrad Region External Trade: Present and Future”, Economic Bulletin, No. 1, Europeaid/114287/CSV/RU, Experts: E. Vinokurov, A. Kharin, A. Yershov, and A. Usanov.
––––––––– (2004a), “Export support in the Kaliningrad Oblast”, Economic Bulletin, No. 2, EuropeAid/114287/C/SV/RU, Experts: S. Klessova, A. Ershov, G. Bunatian, A. Usanov and A. Kharin.
––––––––– (2004b), “Foreign Investment in the Kaliningrad Region: Diagnostic of Status, Support Measures, and Impact of the Investment Environment in the Region”, Economic Bulletin, No. 3, Europeaid/114287/C/SV/RU, Experts: M. Belonogova, A. Vialkin, A. Ershov, S. Klessova, A. Usanov and A. Kharin.
––––––––– (2004c), “Regional Policies in the Border Areas of Poland and Lithuania”, Economic Bulletin, No. 4, Europeaid/114287/C/SV/RU, Experts: G. Bunatian, A. Vialkin, A. Ershov and S. Klessova.
––––––––– (2004d), “Competitiveness of Enterprises in the Kaliningrad Region: Analysis of Macro- and Microeconomic Factors”, Economic Bulletin, No. 5, Europeaid/114287/C/SV/RU, Experts: G. Bunatian, A. Vialkin, A. Ershov, S. Klessova, A. Usanov and A. Kharin.
Fairlie, L.D. and A. Sergounin (2001), Are Borders Barriers? EU Enlargement and the Russian Region of Kaliningrad, Ulkopolittinen instituuti & Institut für Europäische Politik, Helsinki.
Federal Target Programme (2002), Federal Target Programme of Development of the Kaliningrad oblast until 2010, Ministry of Economic Development and Trade of the Russian Federation, Moscow (retrieved from http://www.programs-gov.ru/cgi-bin/index.cgi?prg=135 English version: http://kaliningrad-rda.org/en/development/docs.php).
KALININGRAD: ENCLAVES AND ECONOMIC INTEGRATION | 135
Fedorov, G.M. (1998a), “Geopoliticheskoye polozheniye Kaliningradkoy oblast I perspektivy ee ekonomicheskogo razvitiya” [The Geopolitical Location of the Kaliningrad oblast and the Perspectives of Economic Development], Vestnik Baltiyskogo nauchnogo centra, Vol. 1, No. 10, pp. 21-28.
––––––––– (1998b), “O perspektivakh poetapnogo vkhozhdeniya Rossiyskoy Federacii v Evrosoyuz i vozmozhnoy roli Kaliningradkoy oblasti v etom processe” [On the perspectives of the phased EU accession of the RF and the potential role of the Kaliningrad oblast in this process], Vestnik Baltiyskogo nauchnogo centra, Vol. 2, No. 11, pp. 19-25.
Gareev, T., V. Zhdanov and G. Fedorov (2005), “Novaya ekonomika Kaliningradskoy oblasti” [The new economy of the Kaliningrad region], Voprosy Ekonomiki, 2.
Gareev, T., V. Zhdanov, Y. Zverev, G. Fedorov and M. Tsikel (2005), Stanovleniye novoy ekonomiki Kaliningradskoy oblasti [Establishment of the new economy of the Kaliningrad region], Kaliningrad: Kaliningrad State University Press.
Gornig, G.H. (1995), Das nördliche Ostpreussen. Gestern und Heute [North-East Prussia: Yesterday and Today], Bonn: Kulturstiftung der deutschen Vertriebenen.
Grubel, H.G. and P.J. Lloyd (1975), Intra-Industry Trade: The Theory and Measurement of International Trade in Differentiated Products, New York: Wiley.
Hörning, E.M. (1992), Zwischen den Fronten. Berliner Grenzgänger und Grenzhändler 1948-1961 [Between the Lines: The Border Commuters and Border Traders of Berlin], Köln, Weimar, Wien: Böhlau Verlag.
Institute for the Economy in Transition (IET) (2002), Problems Related to Development of the Kaliningrad Region as an Exclave Territory of the Russian Federation, IET, Moscow.
––––––––– (2004), Russian Economy in 2003: Trends and Outlooks, IET, Moscow.
Ivchenko, V. (2001), “O dolgosrochnoy strategii Rossii po sokhraneniyu i razvitiyu ekskavnogo regiona – Kaliningradskoy oblasti” [On the Russian long-term strategy of the preservation and development of the exclave region – Kaliningrad oblast], Vestnik Baltiyskogo nauchnogo centra, 2, pp. 3-10.
Joenniemi, P., S. Dewar and L.D. Fairlie (2000), The Kaliningrad Puzzle – A Russian Region within the European Union, Baltic Institute and the Åland Islands Peace Institute, Karlkrona, Sweden.
Jones, R. and H. Kierzkowski (1997), Globalization and the Consequences of International Fragmentation, Festschrift in Honor of Robert A. Mundell, World Bank, Washington, D.C.
KRCS (Kaliningrad Regional Committee for Statistics) (2001), Kaliningradskaya oblast v cifrach 2001 [Kaliningrad region in numbers 2001], Kaliningrad.
––––––––– (2002), Kaliningradskaya oblast v cifrach 2002 [Kaliningrad region in numbers 2002], Kaliningrad.
––––––––– (2004), Kaliningradskaya oblast v cifrach 2004 [Kaliningrad region in numbers 2004], Kaliningrad.
––––––––– (2005), Kratkiy statisticheskiy sbornik 2005 [Short Statistics 2005], Kaliningrad.
––––––––– (2006), Kratkiy statisticheskiy sbornik 2006 [Short Statistics 2006], Kaliningrad.

136 | EVGENY VINOKUROV
Kaliningrad Sociological Centre (2002), “Kaliningradskaya problema: factor obshestvennogo mneniya” [Kaliningrad Problem: The Factor of Public Opinion], Kaliningradskaya Pravda, 10.12.2002, pp. 7-8 and 17.12.2002, p. 10.
Kernohan, D. and E. Vinokurov (2004), “The EU–Russia WTO Deal: Balancing Mid-term and Longer-term Growth Prospects?”, CEPS Commentary, CEPS, Brussels, October (retrieved from http://www.ceps.be/Article.php?article_id=382).
Khlopeckiy, A. and G. Fedorov (2000), Kaliningradskaya oblast: region sotrudnichestva [Kaliningrad oblast: The region of cooperation], Kaliningrad: Yantarny Skaz.
Kiel International Ad-hoc Group of Experts on Kaliningrad (2002), Kaliningrad in Focus: Policy recommendations in the perspective of problem-solving, Schleswig-Holstein Institute for Peace Research, SHIP-Texts 67, Kiel University.
Klemeshev, A. and G. Fedorov (2004), Ot izolirovannogo eksklava – k “koridory razvitiya”. Al’ternativy rossiyskogo eksklava na Baltike [From an isolated exclave – To a “development corridor”: The alternatives of the Russian exclave on the Baltics], Kaliningrad: Kaliningrad State University Press.
Klemeshev, A., S. Kozlov and G. Fedorov (2002), Ostrov sotrudnichestva [The Island of Cooperation], Kaliningrad: Kaliningrad State University Press.
Korolev, I.S. (2002), “Main impulses for Russia’s Europeanisation are in Russia itself”, in EU–Russian common market: Is it possible?, Russia in United Europe Committee, Moscow.
Kostyashov, Y.V. (1996), Zaseleniye Kaliningradskoy oblasti posle vtoroy mirovoy voyny [Inhabiting the Kaliningrad region after the Second World War], Humanitarian Sciences in Russia, Moscow.
Kuzin, V. (2005), “Razvitiye klasterov v Kaliningradskoy oblasti” [Cluster Development in the Kaliningrad Region], mimeo.
Kuznetsova O.V. and M.A. Mau (2002), Kaliningradskaya oblast: ot “nepotoplyaemogo avianostsa” k “nepotoplyaemomu sborochnomu tsehu”, Vzglyad iz Rossii. [Kaliningrad oblast: From the “unsinkable aircraft carrier” to the “unsinkable assembly shop”, View from Russia], Russia in United Europe Committee, Moscow.
Lafay, G. (1979), “Dynamique de la specialisation internationale” [The dynamics of international specialisation], Economica.
Lafay, G. and G. Herzog (1989), “Commerce international: la fin des avantages acquis” [The end of the acquired advantages], Economica.
Lamande, V. and E. Vinokurov (2003), “Formirovaniye torgovoy spezializacii Kaliningradskoy oblasty” [Formation of Kaliningrad Trade Specialisation], Voprosy Ekonomiki, 2, pp. 53-63.
Laursen, K. (1998), Revealed Comparative Advantage and the Alternatives as Measures of International Specialisation, Druid Working Paper 98-30, Copenhagen Business School, Copenhagen.
Linnemann, H. (1966), An Econometric Study of International Trade Flows, Amsterdam: North-Holland.
Liuhto, K. (2005), “Kaliningrad after the EU Enlargement but before the legislative change concerning its special economic zone”, in K. Liuhto (ed.), Kaliningrad 2020: Its future competitiveness and role in the Baltic Sea economic region, Pan-European Institute, Turku.
KALININGRAD: ENCLAVES AND ECONOMIC INTEGRATION | 137
Matochkin, Y., V. Kuzin and E. Vinokurov (2004), “Analiz opyta importnych kvot v Kaliningradskoy oblasti (1998–2003)” [Analysis of the Experience of the Import Quotas in the Kaliningrad region (1998–2003)], Ekonomika Severo-Zapada Rossii [Economics of the North-West of Russia], Vol. 2, No. 1, pp. 76-81. (A more comprehensive version in the format of a working paper is available at www.vinokurov.info/kaliningrad.htm).
Medvedev, S. and A. Ignatyev (2005), “Kaliningrad as a Pilot Region in EU–Russian relations: Scenario Exercise”, in K. Liuhto (ed.), Kaliningrad 2020: Its future competitiveness and role in the Baltic Sea economic region, Pan-European Institute, Turku, pp. 141-59.
Minghi, J.V. (1962), “Point Roberts, Washington – The problem of an American enclave”, Yearbook, Association of Pacific Coast Geographers, Sacramento, CA, pp. 29-34.
National Investment Council (NIC) (2002), Economic consequences of Russia’s WTO accession, NIC, Moscow.
Neven, D. (1995), “Trade Liberalisation with Eastern Nations: How Sensitive?”, in R. Faini and R. Portes (eds), European Union Trade with Eastern Europe: Adjustment and Opportunities, CEPR, London.
Niebuhr, A. and S. Stiller (2002), Integration Effect in Border Regions – A Survey of Economic Theory and Empirical Studies, HWWA Discussion Paper 179, Hamburg Institute of International Economics, Hamburg.
NWCO (North-West Customs Office) (2001), “Obshaya kharakteristika vneshney ekonomicheskoy deyatel’nosti Kaliningradskoy oblasti v 4 kvartale 2000 goda i za god v celom”, Tamozhenny bulleten’ 2000/4 [General Characteristics of the Foreign Economic Activities of the Kaliningrad oblast in the 4th Quarter of 2000 and in 2000 in general, Customs Bulletin 2000/4], Kaliningrad.
––––––––– (2002), “Obshaya kharakteristika vneshney ekonomicheskoy deyatel’nosti Kaliningradskoy oblasti v 4 kvartale 2001 goda i za god v celom”, Tamozhenny bulleten’ 2001/4 [General Characteristics of the Foreign Economic Activities of the Kaliningrad oblast in the 4th Quarter of 2001 and in 2001 in general, Customs Bulletin 2001/4], Kaliningrad.
––––––––– (2003), “Obshaya kharakteristika vneshney ekonomicheskoy deyatel’nosti Kaliningradskoy oblasti v 4 kvartale 2002 goda i za god v celom”, Tamozhenny bulleten’ 2002/4 [General Characteristics of the Foreign Economic Activities of the Kaliningrad oblast in the 4th Quarter of 2002 and in 2002 in general, Customs Bulletin 2002/4], Kaliningrad.
––––––––– (2004), “Obshaya kharakteristika vneshney ekonomicheskoy deyatel’nosti Kaliningradskoy oblasti v 4 kvartale 2003 goda i za god v celom”, Tamozhenny bulleten’ 2003/4 [General Characteristics of the Foreign Economic Activities of the Kaliningrad oblast in the 4th Quarter of 2003 and in 2003 in general, Customs Bulletin 2003/4], Kaliningrad.
––––––––– (2005), “Obshaya kharakteristika vneshney ekonomicheskoy deyatel’nosti Kaliningradskoy oblasti v 4 kvartale 2004 goda i za god v celom”, Tamozhenny bulleten’ 2004/4 [General Characteristics of the Foreign Economic Activities of the Kaliningrad oblast in the 4th Quarter of 2004 and in 2004 in general, Customs Bulletin 2004/4], Kaliningrad.
138 | EVGENY VINOKUROV
––––––––– (2006), “Obshaya kharakteristika vneshney ekonomicheskoy deyatel’nosti Kaliningradskoy oblasti v 4 kvartale 2005 goda i za god v celom”, Tamozhenny bulleten’ 2005/4 [General Characteristics of the Foreign Economic Activities of the Kaliningrad oblast in the 4th Quarter of 2005 and in 2005 in general, Customs Bulletin 2005/4], Kaliningrad.
Obolensky, V. (2004), “Prisoedineniye Rossii v VTO i ee uchastie v integracii” [Russia’s accession to the WTO and its participation in globalisation], Mirovaya ekonomika i mezhdunarodnye otnosheniya, 3, pp. 17-26.
OECD (2000), Non-observed economy handbook, OECD, Paris (retrieved from http://www1.oecd.org/std/dnm/meetings/RfnoeOct2000/handbookv4.pdf).
––––––––– (2002), Economic Outlook, OECD, Paris.
––––––––– (2004), Economic Survey – Russian Federation 2004: Industrial Competitiveness, OECD, Paris.
Perspektiva XXI (2004), Otchet, Razvitiye gruppy predpriyatiy s uchetom socialno-ekonomicheskogo polozheniya Kaliningradskoy oblasti…v machinostroitelnoy i selskokhozyaystvennoy otraslyach regiona [Report The Development of the Group of Enterprises in the Machine-Building and Agricultural Sectors Taking into Consideration the Socio-Economic Situation of the Kaliningrad oblast], Kaliningrad.
Porter, M. (1990), The Competitive Advantage of Nations, London and Basingstoke: Macmillan Press.
Reid, S. (1992), Canada Remapped: How the partition of Quebec will reshape the nation, Vancouver: Pulp Press.
Revyakin, E. (2002), Prioritety ekonomicheskoy politiki Rossii v Kaliningradskoy oblasti [The Priorities of the Russian Economic Policy in the Kaliningrad oblast], Mezhdunarodnaya economica i mezhdunarodnye otnosheniya [World Economy and International Relations], 12, pp. 68-75.
Robinson, G.W.S. (1959), “Exclaves”, Annals of the Association of American Geographers, 49 (September), pp. 283-95.
Richardson, D.J. and C. Zhang (1999), Revealing Comparative Advantage: Chaotic or Coherent Patterns across Time and Sector and U.S. Trading Partner?, NBER Working Paper 7212, NBER, Cambridge, MA.
Russian Federation (1996), Law on the Special Economic Zone in the Kaliningrad Oblast”, FZ No. 13 of 22 January, Rossiyskaya gazeta, 30 January 1996.
––––––––– (2006), Law on the Special Economic Zone in the Kaliningrad Oblast”, FZ No.16 of 10 January, Rossiyskaya gazeta, 19 January 2006 (retrieved from. http://www.rg.ru/2006/01/19/kaliningrad-dok.html with an English version available at http://www.gov.kaliningrad.ru/index.php?idpage=584).
Samson, I. (ed.) (2000a), Kaliningrad region: The diagnosis of a crisis, TACIS Prometee II, Grenoble, Moscow, Kaliningrad.
––––––––– (2000b), Kaliningrad region 2010: Potential, Concepts and Prospects, Grenoble, Kaliningrad, Moscow.
Samson, I. (2002), “The Common European Economic Space between Russia and the EU: An Institutional Anchor for Accelerating Russian Reform”, Russian Economic Trends, Vol. 11, No. 3, pp. 7-15.
KALININGRAD: ENCLAVES AND ECONOMIC INTEGRATION | 139
Samson, I., V. Lamande, I. Elisseeva, N. Burova, and G. Fedorov (2002), A New Look at the Kaliningrad Region, Grenoble Univeristy, Grenoble (retrieved from http://web.upmf-grenoble.fr/pepse/IMG/pdf/kalinewlook2.pdf, October 2005).
Samson, I., V. Lamande and E. Vinokurov (2004), “Measuring Regional Economic Development in Russia: The Case of the Kaliningrad oblast”, European Urban and Regional Studies, 11 (January), pp. 71-81.
Scherrer, R.E. (1973), Der Zollanschluss der deutschen Enklave Büsingen an die Schweiz : zugleich ein Beitrag zur Lehre von der Gebietshoheit [The Customs Inclusion of the German Enclave of Büsingen to Switzerland: Simultaneously a Contribution to the Doctrine of Territorial Sovereignty], Zürich: Schulthess.
Smorodinskaya, N. (2001a), Kaliningrad Exclave: Prospects for Transformation into a Pilot Region, Institute of Economics RAS, East West Institute, New York, NY.
––––––––– (2001b), “Kaliningrad v usloviyakh ob’yedineniya Evropy: vyzov i otvet” [Kaliningrad in the Conditions of the European Unification: Challenge and Response], Voprosy Ekonomiki, 11, pp. 106-27.
Smorodinskaya, N. and S. Zhukov (2003), The Kaliningrad Enclave in Europe: Swimming Against the Tide, Diagnostics of the State and Potential of Economic Development, East West Institute, New York, NY.
Switzerland and the Federal Republic of Germany (FRG) (1964), Vertrag zwischen der Schweizerischen Eidgenossenschaft und der Bundesrepublik Deutschland über die Einbeziehung der Gemeinde Büsingen am Hochrhein in das schweizerishen Zollgebiet. Abgeschlossen am 23. November 1964, in Kraft getreten am 4. Oktober 1967, Stand 17. July 2001 [Treaty between Switzerland and the Federal Republic of Germany on the inclusion of Büsingen am Hochrhein into the Swiss customs territory, signed 23 November 1965, coming into force 4 October 1967, stand 17 July 2001] (retrieved from http://www.admin.ch/ch/d/ff/2000/5640.pdf).
TACIS Programme of the European Commission (2002а), The Kaliningrad Economy – At the Edge of EU Enlargement, Economic survey directed by I. Samson, IMC/UPMF, TACIS Project “Promoting Trade and Investment in the Kaliningrad oblast”, European Commission, Brussels.
––––––––– (2002b), Second Economic Survey: Analysis of the social and economic position of Kaliningrad region and recommendations of regional development, Economic survey supervised by G. Dykhanov, TACIS Project IMC “Promoting Trade and Investment in the Kaliningrad oblast – Russia”, European Commission, Brussels, October.
Tatarinov, A. (2002), “Evaluation of structural activities in the economy of the region”, paper presented to RECEP Conference “Russia’s Opening to the World Economy and the Building of a Common European Economic Space”, held in Moscow on 20-21 September (retrieved in 2003 from www.recep.ru).
Usanov, A. (2005), “Future Vision of the Kaliningrad Economic in the Baltic Sea Region”, in K. Liuhto (ed.), Kaliningrad 2020: Its future competitiveness and role in the Baltic Sea economic region, Pan-European Institute, Turku, pp. 122-40.
Usanov, A. and A. Kharin (2005), “Sovremennaya situaciya i problemy pererabatyvayushey promyshlennosti v Kaliningradskoy oblasti” [Contemporary situation and the problems of the processing industry in the Kaliningrad oblast], mimeo, Kaliningrad.
140 | EVGENY VINOKUROV
Vinokurov, E. (2002a), Anklavy v mirovoy economike i politike [Enclaves in World Economy and Politics: Experience of the Last Decennials], Mezhdunarodnaya economica i mezhdunarodnye otnosheniya [World Economy and International Relations], 9, pp. 83-88.
––––––––– (2002b), “Development of Trade with Mainland Russia in the Trade Balance of Kaliningrad Region”, Les Cahiers de l’Espace Europe (Special issue on the theme Russia–European Union: On the eve of the EU enlargement), Fall 2002 (available at www.vinokurov.info).
––––––––– (2003a), “Obsheye ekonomicheskoye prostranstvo ES-Rossiya i Kaliningrad” [Common Economic Space EU–Russia and Kaliningrad], Mirovaya ekonomika i mezhdunarodnye otnosheniya [World Economy and International Relations], 11, pp. 53-60.
––––––––– (2003b), “Kaliningradu dolzhno byt’ vozvrasheno ego prezhneye nazvaniye”, Königsberg [Kaliningrad should reacquire its previous name, Königsberg], Kul’turny Sloy, 2 (available at www.vinokurov.info)
––––––––– (2004a), “Kaliningrad’s borders and transit to mainland Russia: Technicalities and remaining bottlenecks”, CEPS Commentary, CEPS, Brussels, February.
––––––––– (2004b), Kaliningrad in the Framework of the EU–Russian Dialogue: Towards Common Space, Chair Interbrew Baillet-Latour Working Paper Series, No. 20, Catholic Univerity of Leuven (retrieved from http://soc.kuleuven.be/iieb/ibl/ publications.htm#working).
––––––––– (2004c), Transit is just a part of it: Kaliningrad and the free movement of people, Association of International Experts on the Development of the Kaliningrad Region, sponsored by SHIP, Kiel University (retrieved from www.kaliningradexpert.org).
––––––––– (2004d), Economic Prospects for Kaliningrad: Between EU Enlargement and Russia’s Integration into the World Economy, CEPS Working Document No. 201, CEPS, Brussels.
––––––––– (2004e), “Ideya evropeysko-rossiyskoy zony svobodnoy torgovli v Kaliningradskoy oblasti” [The Idea of an EU–Russian Free Trade Zone in the Kaliningrad Oblast], Rossiya i Evropeyskiy Soyuz [Russia and the European Union], Kennan Institute, Moscow, pp. 249-57.
––––––––– (2005a), “The Enclave-Specific Vulnerability of Kaliningrad”, in K. Liuhto (ed.), Kaliningrad 2020: Its future competitiveness and role in the Baltic Sea economic region, Pan-European Institute, Turku, pp. 56-74.
––––––––– (2006a), The Making of the Concept of the EU–Russian Common Economic Space, in S. Bruno (ed.), Trade and Industry Developments in Central and Eastern Europe, London and Aldershot: Ashgate.
––––––––– (2006b), Enclaves and Exclaves of the World: Setting the Framework for a Theory of Enclaves, ZDES Working Paper, University of Bielefeld/St Petersburg State University (available at www.zdes.spb.ru).
––––––––– (2007), A Theory of Enclaves, Lanham, MD: Lexington Books (forthcoming).
Vinokurov, E., A. Usanov, P. Lindholm and A. Ignatyev (2005), Kaliningrad in the Context of Establishing the EU–Russia Common Economic Space, East-West Institute Policy Brief, East West Institute, New York, NY (available at www.ewi.org and www.kaliningradexpert.org).
KALININGRAD: ENCLAVES AND ECONOMIC INTEGRATION | 141
Voronov, K. (2005), “Kaliningradskaya oblast v otnosheniyakh Rossii i ES: medlenny dreif” [Kaliningradskaya oblast in the Russian–EU relations: The slow drift], Mirovaya ekonomika i mezhdunarodnye otnosheniya, 3, pp. 17-26.
Whyte, B. (2002), Waiting for the Esquimo, an historical and documentary study of the Cooch Behar enclaves of India and Bangladesh, Research Paper 8, School of Anthropology, Geography and Environmental Studies, University of Melbourne, Publication of Ph.D. thesis.
World Trade Organisation (WTO) Secretariat (2000), Trade Policy Review: European Communities, WTO, Geneva.
––––––––– (2002), Trade Policy Review: Hong Kong, China, WT/TPR/S/109, WTO, Geneva, pp. 8-9 (retrieved from http://www.wto.org/english/tratop_e/tpr_e/s109-1_e.doc).
––––––––– (2004), Trade Policy Review: European Communities, WT/TPR/S/136 37, WTO, Geneva.
Yeats, A.J. (1985), “On the Appropriate Interpretation of the Revealed Comparative Index”, Weltwirtschaftliches Archiv, 121, pp. 61-73.
Yudanov, Y. (2002), “Baltiysky region: osobennosti formirovaniya blagopriatnogo klimata dlya pryamykh inostrannikh investiciy” [The Baltic Region: The peculiarities of the formation of a favourable climate for foreign direct investments], Mezhdunarodnaya economica i mezhdunarodnye otnosheniya [World Economy and International Relations], 12, pp. 58-67.
Yusupov, I. (2000), Tendencii i problemy internacionalizacii regionalnoy ekonomiki v RF [Tendencies and Problems of the Internationalisation of the Regional Economies in the RF], Executive summary of the doctoral thesis, VNIKI, Moscow.
Zagashvili, V.S. (1997), Ekonomicheskaya bezopasnost Rossii [Economic Security of Russia], Moscow: Yurist.
Zernov, A. and K. Shopin (2005), Kaliningrad Transit of Goods: In Need of a Strategic Approach to Problem-Solving, East-West Institute Policy Brief, East West Institute, New York, NY.
Zhdanov, V. (2005), “Modern Terms and Future Competitiveness of the Kaliningrad Region’s Economy”, in K. Liuhto (ed.), Kaliningrad 2020: Its future competitiveness and role in the Baltic Sea economic region, Pan-European Institute, Turku, pp. 75-90.
Zverev Y.M. (2003), Kaliningradskaya oblast v klassifikacii anklavnykh (eksklavnykh) territories of the world [The Kaliningrad oblast in the classification of enclave (exclave) territories of the world], Kaliningrad: Kaliningrad State University Press.
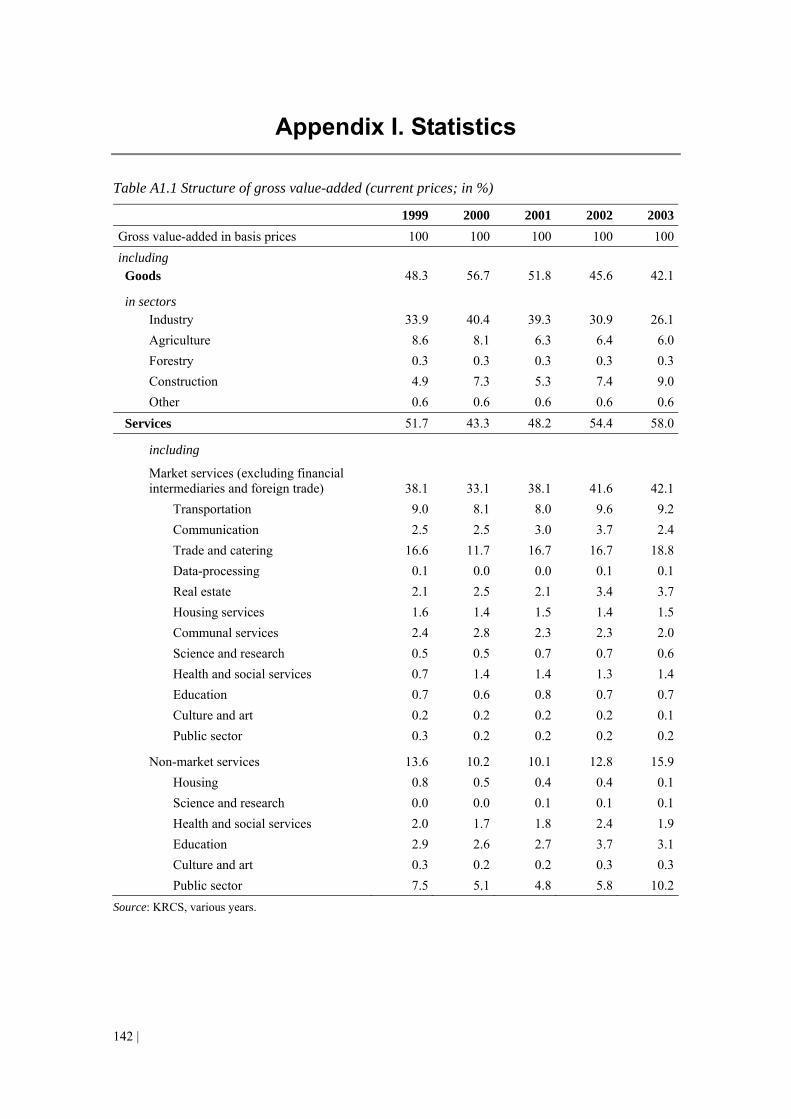
142 |
Appendix I. Statistics
Table A1.1 Structure of gross value-added (current prices; in %)
1999 2000 2001 2002 2003Gross value-added in basis prices 100 100 100 100 100including Goods 48.3 56.7 51.8 45.6 42.1
in sectors Industry 33.9 40.4 39.3 30.9 26.1Agriculture 8.6 8.1 6.3 6.4 6.0Forestry 0.3 0.3 0.3 0.3 0.3Construction 4.9 7.3 5.3 7.4 9.0Other 0.6 0.6 0.6 0.6 0.6
Services 51.7 43.3 48.2 54.4 58.0
including
Market services (excluding financial intermediaries and foreign trade) 38.1 33.1 38.1 41.6 42.1
Transportation 9.0 8.1 8.0 9.6 9.2Communication 2.5 2.5 3.0 3.7 2.4Trade and catering 16.6 11.7 16.7 16.7 18.8Data-processing 0.1 0.0 0.0 0.1 0.1Real estate 2.1 2.5 2.1 3.4 3.7Housing services 1.6 1.4 1.5 1.4 1.5Communal services 2.4 2.8 2.3 2.3 2.0Science and research 0.5 0.5 0.7 0.7 0.6Health and social services 0.7 1.4 1.4 1.3 1.4Education 0.7 0.6 0.8 0.7 0.7Culture and art 0.2 0.2 0.2 0.2 0.1Public sector 0.3 0.2 0.2 0.2 0.2
Non-market services 13.6 10.2 10.1 12.8 15.9Housing 0.8 0.5 0.4 0.4 0.1Science and research 0.0 0.0 0.1 0.1 0.1Health and social services 2.0 1.7 1.8 2.4 1.9Education 2.9 2.6 2.7 3.7 3.1Culture and art 0.3 0.2 0.2 0.3 0.3Public sector 7.5 5.1 4.8 5.8 10.2
Source: KRCS, various years.
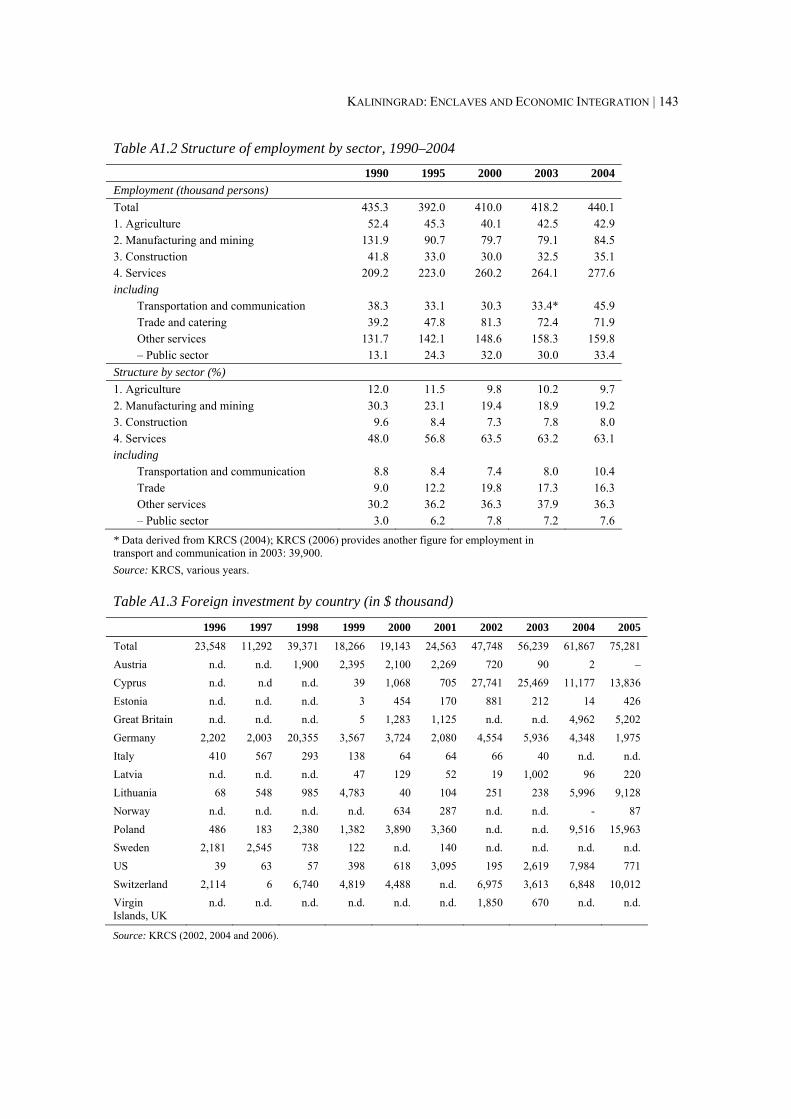
KALININGRAD: ENCLAVES AND ECONOMIC INTEGRATION | 143
Table A1.2 Structure of employment by sector, 1990–2004
1990 1995 2000 2003 2004 Employment (thousand persons) Total 435.3 392.0 410.0 418.2 440.1 1. Agriculture 52.4 45.3 40.1 42.5 42.9 2. Manufacturing and mining 131.9 90.7 79.7 79.1 84.5 3. Construction 41.8 33.0 30.0 32.5 35.1 4. Services 209.2 223.0 260.2 264.1 277.6 including
Transportation and communication 38.3 33.1 30.3 33.4* 45.9 Trade and catering 39.2 47.8 81.3 72.4 71.9 Other services 131.7 142.1 148.6 158.3 159.8 – Public sector 13.1 24.3 32.0 30.0 33.4
Structure by sector (%) 1. Agriculture 12.0 11.5 9.8 10.2 9.7 2. Manufacturing and mining 30.3 23.1 19.4 18.9 19.2 3. Construction 9.6 8.4 7.3 7.8 8.0 4. Services 48.0 56.8 63.5 63.2 63.1 including
Transportation and communication 8.8 8.4 7.4 8.0 10.4 Trade 9.0 12.2 19.8 17.3 16.3 Other services 30.2 36.2 36.3 37.9 36.3 – Public sector 3.0 6.2 7.8 7.2 7.6
* Data derived from KRCS (2004); KRCS (2006) provides another figure for employment in transport and communication in 2003: 39,900. Source: KRCS, various years.
Table A1.3 Foreign investment by country (in $ thousand)
1996 1997 1998 1999 2000 2001 2002 2003 2004 2005
Total 23,548 11,292 39,371 18,266 19,143 24,563 47,748 56,239 61,867 75,281 Austria n.d. n.d. 1,900 2,395 2,100 2,269 720 90 2 – Cyprus n.d. n.d n.d. 39 1,068 705 27,741 25,469 11,177 13,836 Estonia n.d. n.d. n.d. 3 454 170 881 212 14 426 Great Britain n.d. n.d. n.d. 5 1,283 1,125 n.d. n.d. 4,962 5,202 Germany 2,202 2,003 20,355 3,567 3,724 2,080 4,554 5,936 4,348 1,975 Italy 410 567 293 138 64 64 66 40 n.d. n.d. Latvia n.d. n.d. n.d. 47 129 52 19 1,002 96 220 Lithuania 68 548 985 4,783 40 104 251 238 5,996 9,128 Norway n.d. n.d. n.d. n.d. 634 287 n.d. n.d. - 87 Poland 486 183 2,380 1,382 3,890 3,360 n.d. n.d. 9,516 15,963 Sweden 2,181 2,545 738 122 n.d. 140 n.d. n.d. n.d. n.d. US 39 63 57 398 618 3,095 195 2,619 7,984 771 Switzerland 2,114 6 6,740 4,819 4,488 n.d. 6,975 3,613 6,848 10,012 Virgin Islands, UK
n.d.
n.d.
n.d.
n.d.
n.d.
n.d.
1,850 670 n.d. n.d.
Source: KRCS (2002, 2004 and 2006).
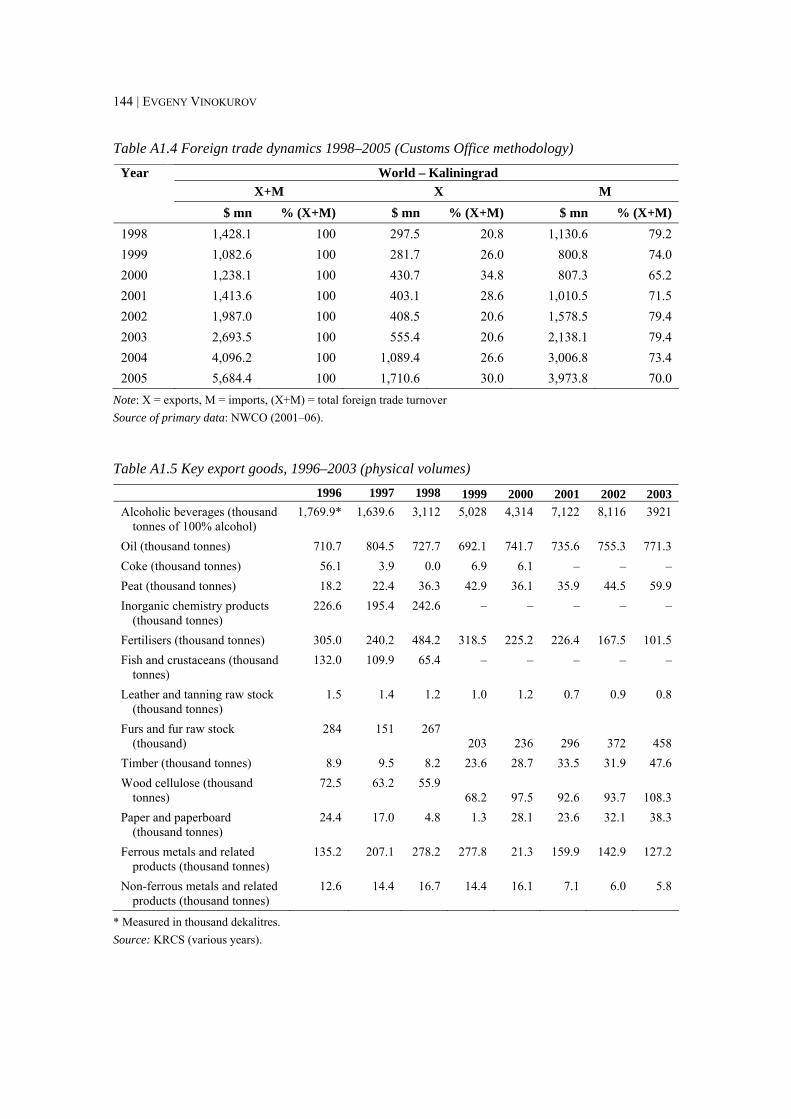
144 | EVGENY VINOKUROV
Table A1.4 Foreign trade dynamics 1998–2005 (Customs Office methodology)
World – Kaliningrad X+M X M
Year
$ mn % (X+M) $ mn % (X+M) $ mn % (X+M) 1998 1,428.1 100 297.5 20.8 1,130.6 79.2 1999 1,082.6 100 281.7 26.0 800.8 74.0 2000 1,238.1 100 430.7 34.8 807.3 65.2 2001 1,413.6 100 403.1 28.6 1,010.5 71.5 2002 1,987.0 100 408.5 20.6 1,578.5 79.4 2003 2,693.5 100 555.4 20.6 2,138.1 79.4 2004 4,096.2 100 1,089.4 26.6 3,006.8 73.4 2005 5,684.4 100 1,710.6 30.0 3,973.8 70.0
Note: X = exports, M = imports, (X+M) = total foreign trade turnover Source of primary data: NWCO (2001–06).
Table A1.5 Key export goods, 1996–2003 (physical volumes) 1996 1997 1998 1999 2000 2001 2002 2003
Alcoholic beverages (thousand tonnes of 100% alcohol)
1,769.9* 1,639.6 3,112 5,028
4,314
7,122
8,116
3921
Oil (thousand tonnes) 710.7 804.5 727.7 692.1 741.7 735.6 755.3 771.3 Coke (thousand tonnes) 56.1 3.9 0.0 6.9 6.1 – – – Peat (thousand tonnes) 18.2 22.4 36.3 42.9 36.1 35.9 44.5 59.9 Inorganic chemistry products
(thousand tonnes) 226.6 195.4 242.6 –
–
–
–
–
Fertilisers (thousand tonnes) 305.0 240.2 484.2 318.5 225.2 226.4 167.5 101.5 Fish and crustaceans (thousand
tonnes) 132.0 109.9 65.4 –
–
–
–
–
Leather and tanning raw stock (thousand tonnes)
1.5 1.4 1.2 1.0
1.2
0.7
0.9
0.8
Furs and fur raw stock (thousand)
284 151 267 203 236 296 372 458
Timber (thousand tonnes) 8.9 9.5 8.2 23.6 28.7 33.5 31.9 47.6 Wood cellulose (thousand
tonnes) 72.5 63.2 55.9
68.2 97.5 92.6 93.7 108.3 Paper and paperboard
(thousand tonnes) 24.4 17.0 4.8 1.3
28.1
23.6
32.1
38.3
Ferrous metals and related
products (thousand tonnes) 135.2 207.1 278.2
277.8
21.3
159.9
142.9
127.2
Non-ferrous metals and related
products (thousand tonnes) 12.6 14.4 16.7 14.4
16.1
7.1
6.0
5.8
* Measured in thousand dekalitres. Source: KRCS (various years).

KALININGRAD: ENCLAVES AND ECONOMIC INTEGRATION | 145
Table A1.6 Import commodity structure according to three indicators (net weight, price/weight ratio and price)
Net weight (thousand tonnes)
Price/weight ratio ($/kg)
Price ($ mn)
TN VED code
Sector
2003 2004 % to 2003
2003 2004 % to 2003
2003 2004 % to 2003
01-24 Food products and raw materials
1,033.9 1,203.5 116.4 0.58 0.64 110.6 600.1 772.5 128.4
25-27 Fuel and energy industry
270.7 321.7 118.8 0.07 0.06 82.8 19.0 18.7 98.4
Incl. 27
Fuel 12.3 12.8 104.1 0.55 0.53 96.1 6.8 6.8 100.0
28-40 Petrochemical industry
114.1 164.1 143.8 1.50 1.38 91.9 171.4 226.6 132.2
41-43 Raw leather and furs
0.6 0.8 133.3 30.67 28.88 94.2 18.4 23.1 125.5
44-49 Wood and products
256.6 216.7 84.5 0.33 0.47 143.6 84.7 102.4 120.9
50-67 Clothes and footwear
28.1 32.5 115.7 4.05 4.30 106.1 113.7 139.8 123.0
71 Precious stones, precious metals and products, tonnes
6.6 11.1 168.2 140.62
151.99
108.1 0.9 1.7 188.9
72-83 Ferrous and non-ferrous metals and products
116.3 165.8 142.6 1.31 1.24 95.2 151.8 206.0 135.7
84-90 Machine-building production
266.4 325.5 122.2 3.17 4.13 130.5 843.2 1,344. 159.4
68-70, 91-97
Other products 156.5 206.7 132.1 0.86 0.83 96.4 134.9 171.8 127.4
Total 2,243.2 2,637.3 117.6 0.95 1.14 119.6 2,138.1
3,006.8 140.6
Source: NWCO (2005), p. 19.
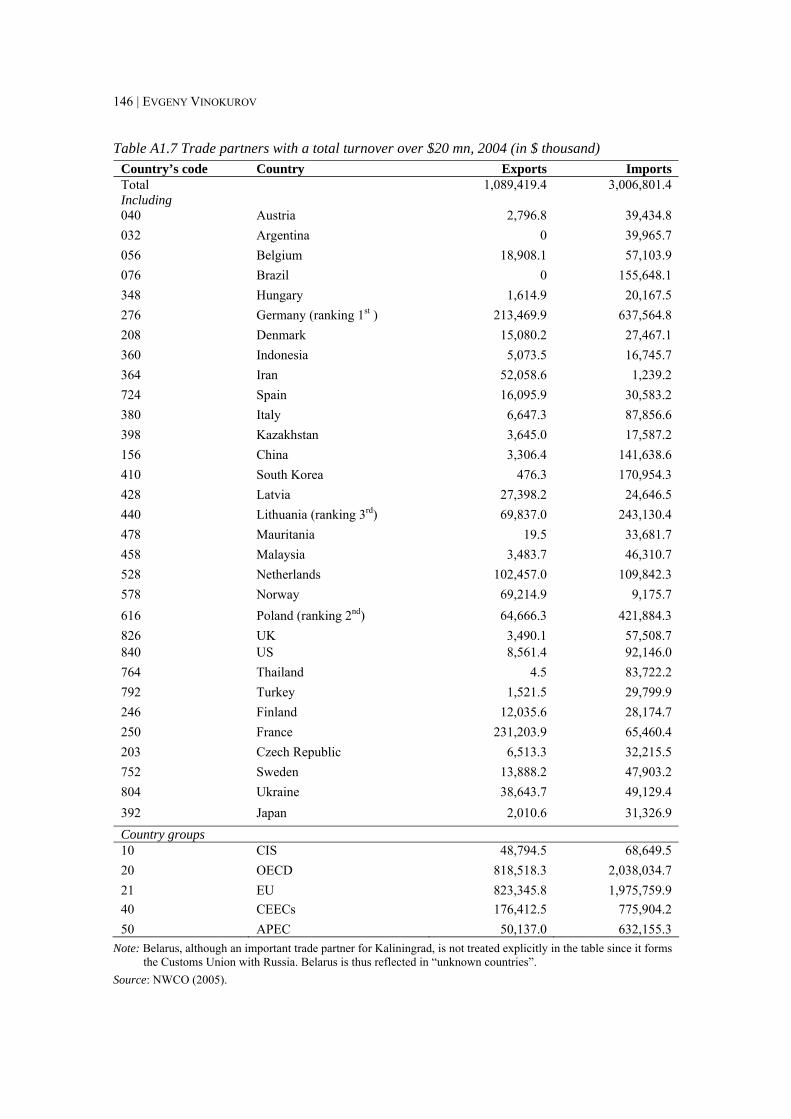
146 | EVGENY VINOKUROV
Table A1.7 Trade partners with a total turnover over $20 mn, 2004 (in $ thousand) Country’s code Country Exports Imports Total 1,089,419.4 3,006,801.4 Including 040 Austria 2,796.8 39,434.8 032 Argentina 0 39,965.7 056 Belgium 18,908.1 57,103.9 076 Brazil 0 155,648.1 348 Hungary 1,614.9 20,167.5 276 Germany (ranking 1st ) 213,469.9 637,564.8 208 Denmark 15,080.2 27,467.1 360 Indonesia 5,073.5 16,745.7 364 Iran 52,058.6 1,239.2 724 Spain 16,095.9 30,583.2 380 Italy 6,647.3 87,856.6 398 Kazakhstan 3,645.0 17,587.2 156 China 3,306.4 141,638.6 410 South Korea 476.3 170,954.3 428 Latvia 27,398.2 24,646.5 440 Lithuania (ranking 3rd) 69,837.0 243,130.4 478 Mauritania 19.5 33,681.7 458 Malaysia 3,483.7 46,310.7 528 Netherlands 102,457.0 109,842.3 578 Norway 69,214.9 9,175.7 616 Poland (ranking 2nd) 64,666.3 421,884.3 826 UK 3,490.1 57,508.7 840 US 8,561.4 92,146.0 764 Thailand 4.5 83,722.2 792 Turkey 1,521.5 29,799.9 246 Finland 12,035.6 28,174.7 250 France 231,203.9 65,460.4 203 Czech Republic 6,513.3 32,215.5 752 Sweden 13,888.2 47,903.2 804 Ukraine 38,643.7 49,129.4 392 Japan 2,010.6 31,326.9 Country groups 10 CIS 48,794.5 68,649.5 20 OECD 818,518.3 2,038,034.7 21 EU 823,345.8 1,975,759.9 40 CEECs 176,412.5 775,904.2 50 APEC 50,137.0 632,155.3
Note: Belarus, although an important trade partner for Kaliningrad, is not treated explicitly in the table since it forms the Customs Union with Russia. Belarus is thus reflected in “unknown countries”.
Source: NWCO (2005).
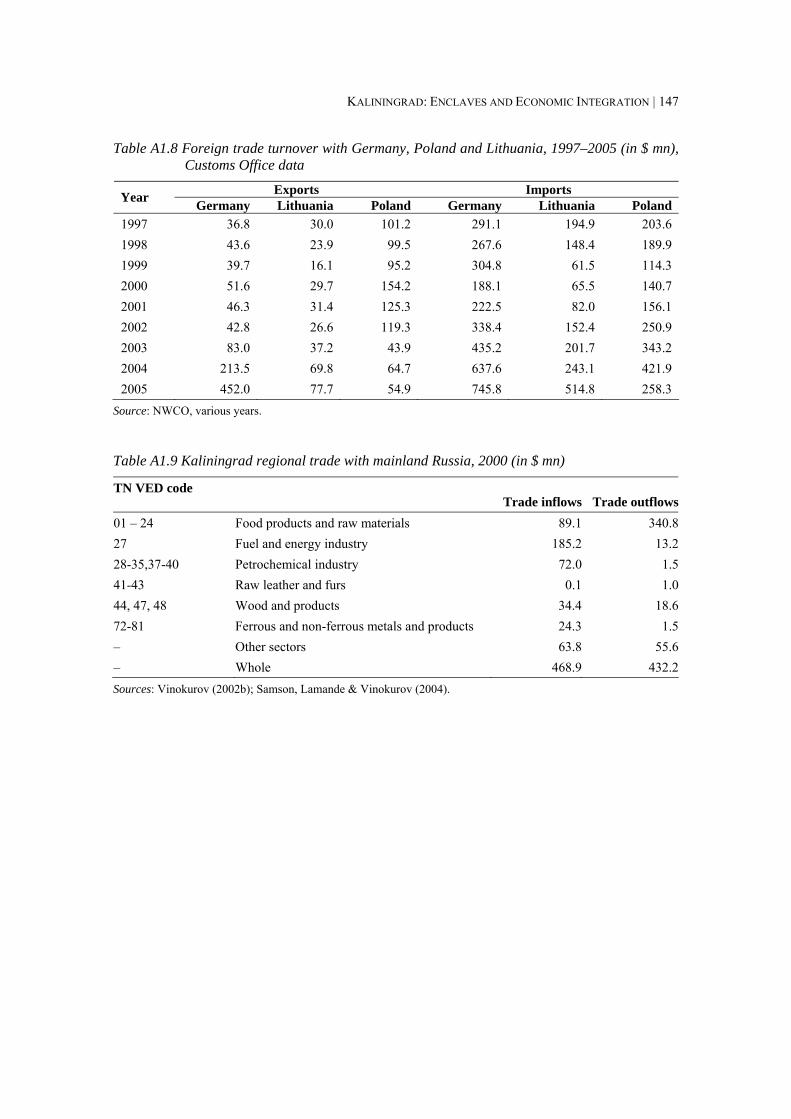
KALININGRAD: ENCLAVES AND ECONOMIC INTEGRATION | 147
Table A1.8 Foreign trade turnover with Germany, Poland and Lithuania, 1997–2005 (in $ mn), Customs Office data
Exports Imports Year Germany Lithuania Poland Germany Lithuania Poland 1997 36.8 30.0 101.2 291.1 194.9 203.6 1998 43.6 23.9 99.5 267.6 148.4 189.9 1999 39.7 16.1 95.2 304.8 61.5 114.3 2000 51.6 29.7 154.2 188.1 65.5 140.7 2001 46.3 31.4 125.3 222.5 82.0 156.1 2002 42.8 26.6 119.3 338.4 152.4 250.9 2003 83.0 37.2 43.9 435.2 201.7 343.2 2004 213.5 69.8 64.7 637.6 243.1 421.9 2005 452.0 77.7 54.9 745.8 514.8 258.3
Source: NWCO, various years.
Table A1.9 Kaliningrad regional trade with mainland Russia, 2000 (in $ mn)
TN VED code Trade inflows Trade outflows
01 – 24 Food products and raw materials 89.1 340.827 Fuel and energy industry 185.2 13.228-35,37-40 Petrochemical industry 72.0 1.541-43 Raw leather and furs 0.1 1.044, 47, 48 Wood and products 34.4 18.672-81 Ferrous and non-ferrous metals and products 24.3 1.5– Other sectors 63.8 55.6– Whole 468.9 432.2Sources: Vinokurov (2002b); Samson, Lamande & Vinokurov (2004).
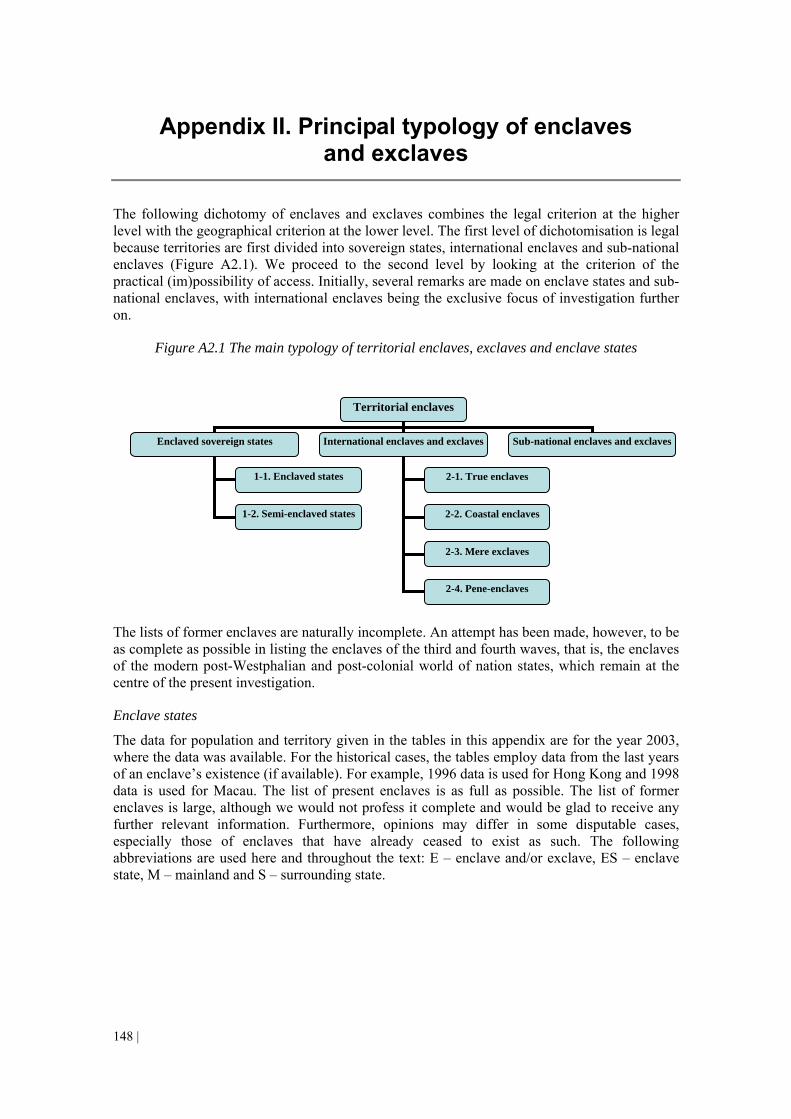
148 |
Appendix II. Principal typology of enclaves and exclaves
The following dichotomy of enclaves and exclaves combines the legal criterion at the higher level with the geographical criterion at the lower level. The first level of dichotomisation is legal because territories are first divided into sovereign states, international enclaves and sub-national enclaves (Figure A2.1). We proceed to the second level by looking at the criterion of the practical (im)possibility of access. Initially, several remarks are made on enclave states and sub-national enclaves, with international enclaves being the exclusive focus of investigation further on.
Figure A2.1 The main typology of territorial enclaves, exclaves and enclave states
The lists of former enclaves are naturally incomplete. An attempt has been made, however, to be as complete as possible in listing the enclaves of the third and fourth waves, that is, the enclaves of the modern post-Westphalian and post-colonial world of nation states, which remain at the centre of the present investigation.
Enclave states
The data for population and territory given in the tables in this appendix are for the year 2003, where the data was available. For the historical cases, the tables employ data from the last years of an enclave’s existence (if available). For example, 1996 data is used for Hong Kong and 1998 data is used for Macau. The list of present enclaves is as full as possible. The list of former enclaves is large, although we would not profess it complete and would be glad to receive any further relevant information. Furthermore, opinions may differ in some disputable cases, especially those of enclaves that have already ceased to exist as such. The following abbreviations are used here and throughout the text: E – enclave and/or exclave, ES – enclave state, M – mainland and S – surrounding state.
Territorial enclaves
Enclaved sovereign states International enclaves and exclaves Sub-national enclaves and exclaves
1-1. Enclaved states
1-2. Semi-enclaved states
2-4. Pene-enclaves
2-1. True enclaves
2-2. Coastal enclaves
2-3. Mere exclaves
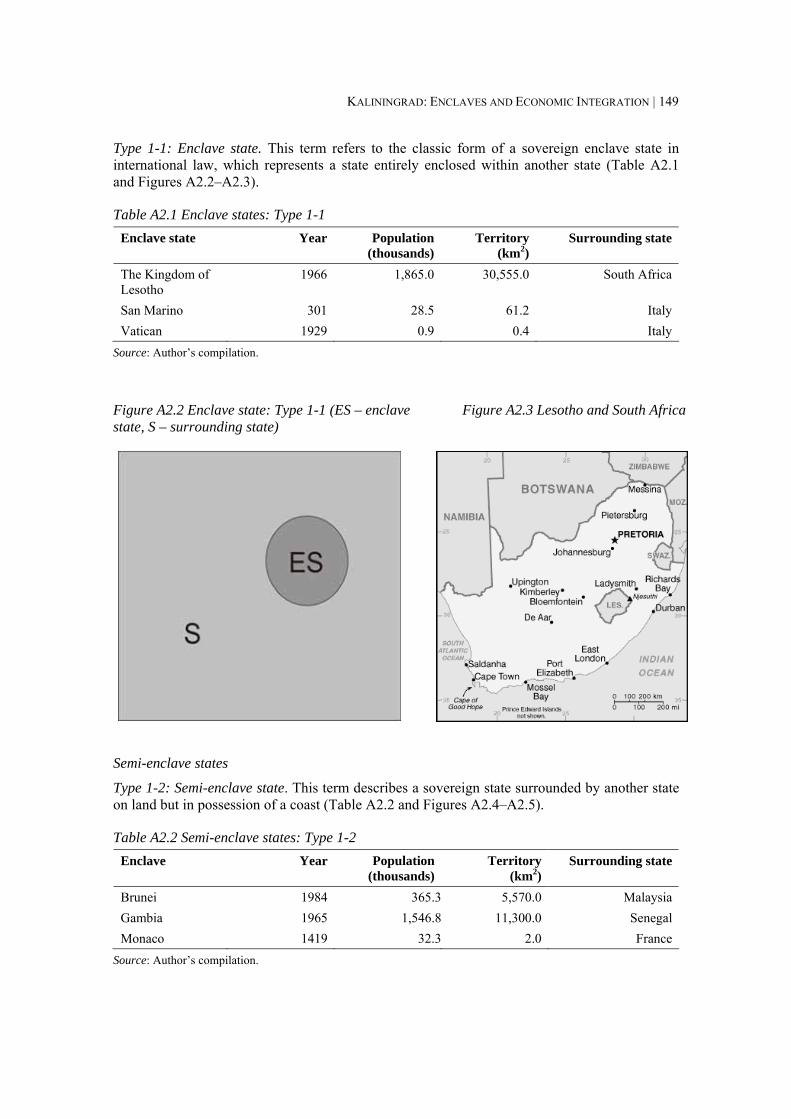
KALININGRAD: ENCLAVES AND ECONOMIC INTEGRATION | 149
Type 1-1: Enclave state. This term refers to the classic form of a sovereign enclave state in international law, which represents a state entirely enclosed within another state (Table A2.1 and Figures A2.2–A2.3).
Table A2.1 Enclave states: Type 1-1 Enclave state Year Population
(thousands) Territory
(km2) Surrounding state
The Kingdom of Lesotho
1966 1,865.0 30,555.0 South Africa
San Marino 301 28.5 61.2 Italy Vatican 1929 0.9 0.4 Italy
Source: Author’s compilation.
Figure A2.2 Enclave state: Type 1-1 (ES – enclave state, S – surrounding state)
Figure A2.3 Lesotho and South Africa
Semi-enclave states
Type 1-2: Semi-enclave state. This term describes a sovereign state surrounded by another state on land but in possession of a coast (Table A2.2 and Figures A2.4–A2.5).
Table A2.2 Semi-enclave states: Type 1-2 Enclave Year Population
(thousands) Territory
(km2) Surrounding state
Brunei 1984 365.3 5,570.0 Malaysia Gambia 1965 1,546.8 11,300.0 Senegal Monaco 1419 32.3 2.0 France
Source: Author’s compilation.
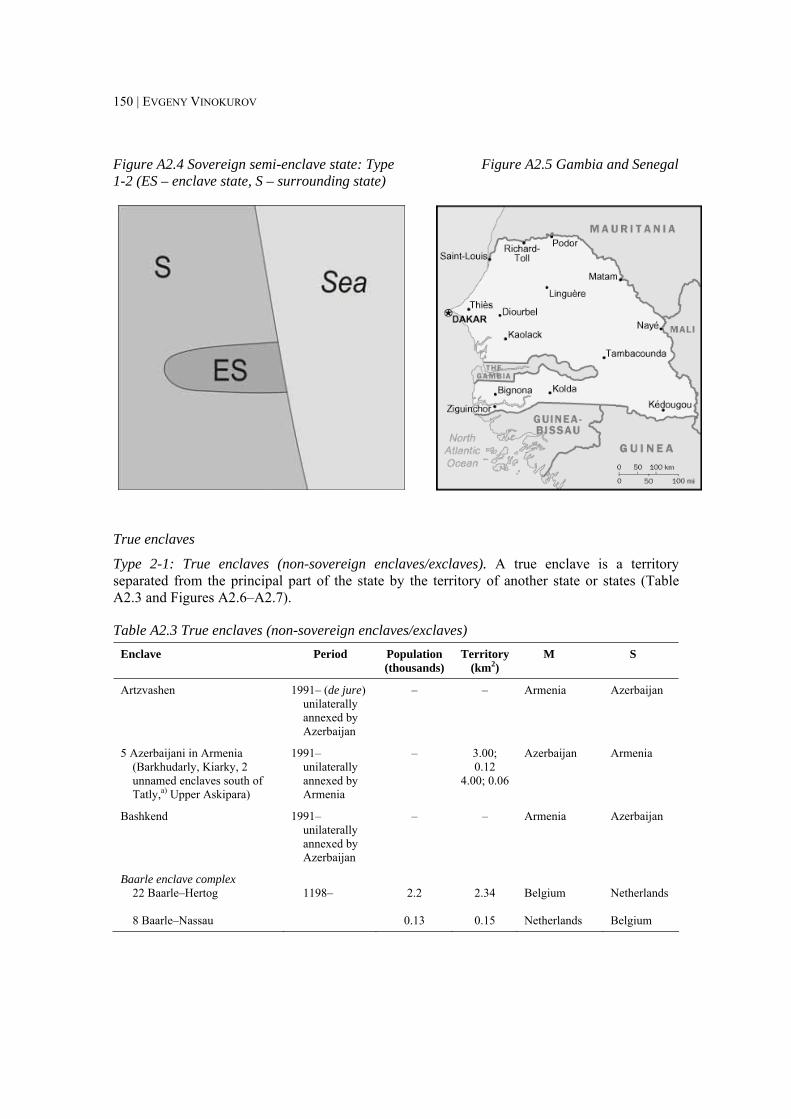
150 | EVGENY VINOKUROV
Figure A2.4 Sovereign semi-enclave state: Type 1-2 (ES – enclave state, S – surrounding state)
Figure A2.5 Gambia and Senegal
True enclaves
Type 2-1: True enclaves (non-sovereign enclaves/exclaves). A true enclave is a territory separated from the principal part of the state by the territory of another state or states (Table A2.3 and Figures A2.6–A2.7).
Table A2.3 True enclaves (non-sovereign enclaves/exclaves) Enclave Period Population
(thousands) Territory
(km2) M S
Artzvashen
1991– (de jure) unilaterally annexed by Azerbaijan
–
–
Armenia
Azerbaijan
5 Azerbaijani in Armenia (Barkhudarly, Kiarky, 2 unnamed enclaves south of Tatly,a) Upper Askipara)
1991–unilaterally annexed by Armenia
–
3.00; 0.12
4.00; 0.06
Azerbaijan Armenia
Bashkend 1991– unilaterally annexed by Azerbaijan
–
–
Armenia Azerbaijan
Baarle enclave complex 22 Baarle–Hertog 8 Baarle–Nassau
1198– 2.2
0.13
2.34
0.15
Belgium Netherlands
Netherlands Belgium
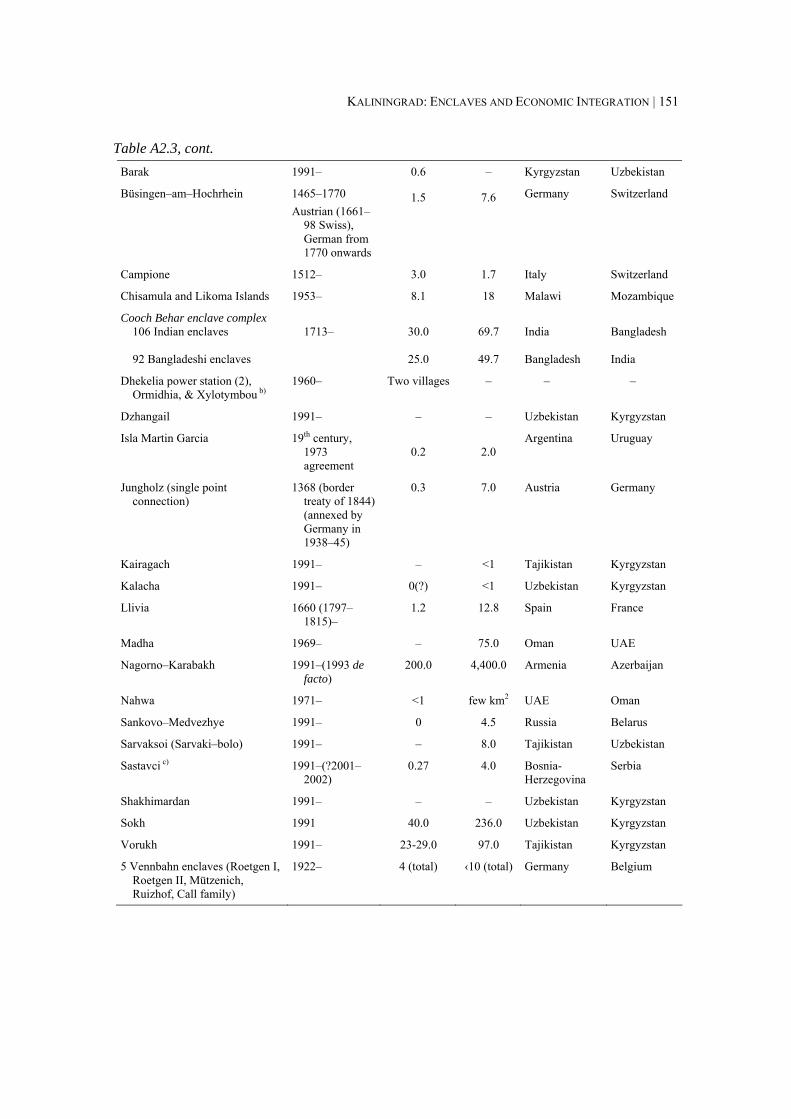
KALININGRAD: ENCLAVES AND ECONOMIC INTEGRATION | 151
Table A2.3, cont. Barak 1991– 0.6 – Kyrgyzstan Uzbekistan
Büsingen–am–Hochrhein 1465–1770 Austrian (1661–
98 Swiss), German from 1770 onwards
1.5
7.6
Germany Switzerland
Campione 1512– 3.0 1.7 Italy Switzerland
Chisamula and Likoma Islands 1953– 8.1 18 Malawi Mozambique
Cooch Behar enclave complex 106 Indian enclaves 92 Bangladeshi enclaves
1713–
30.0
25.0
69.7
49.7
India Bangladesh
Bangladesh India
Dhekelia power station (2), Ormidhia, & Xylotymbou b)
1960– Two villages
–
– –
Dzhangail 1991– – – Uzbekistan Kyrgyzstan
Isla Martin Garcia 19th century, 1973 agreement
0.2
2.0
Argentina Uruguay
Jungholz (single point connection)
1368 (border treaty of 1844)(annexed by Germany in 1938–45)
0.3
7.0
Austria Germany
Kairagach 1991– – <1 Tajikistan Kyrgyzstan
Kalacha 1991– 0(?) <1 Uzbekistan Kyrgyzstan
Llivia 1660 (1797–1815)–
1.2
12.8
Spain France
Madha 1969– – 75.0 Oman UAE
Nagorno–Karabakh 1991–(1993 de facto)
200.0
4,400.0
Armenia Azerbaijan
Nahwa 1971– <1 few km2 UAE Oman
Sankovo–Medvezhye 1991– 0 4.5 Russia Belarus
Sarvaksoi (Sarvaki–bolo) 1991– – 8.0 Tajikistan Uzbekistan
Sastavci c) 1991–(?2001–2002)
0.27
4.0
Bosnia-Herzegovina
Serbia
Shakhimardan 1991– – – Uzbekistan Kyrgyzstan
Sokh 1991 40.0 236.0 Uzbekistan Kyrgyzstan
Vorukh 1991– 23-29.0 97.0 Tajikistan Kyrgyzstan
5 Vennbahn enclaves (Roetgen I, Roetgen II, Mützenich, Ruizhof, Call family)
1922– 4 (total)
‹10 (total)
Germany Belgium
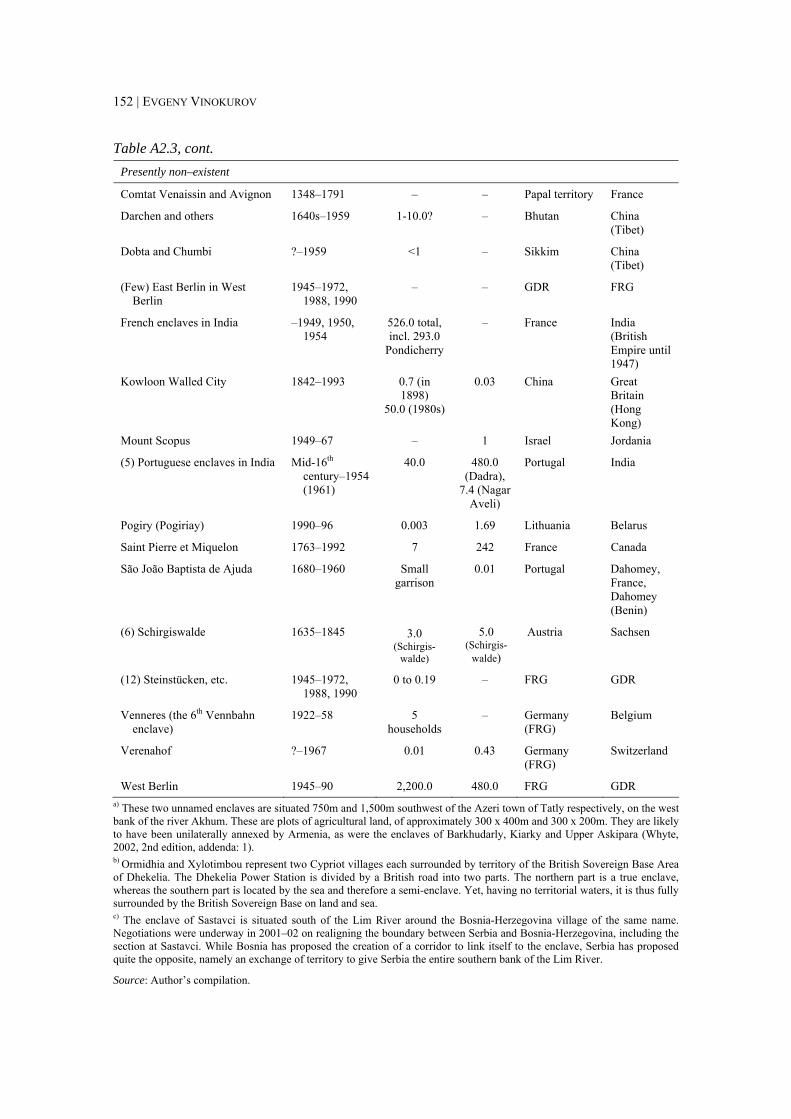
152 | EVGENY VINOKUROV
Table A2.3, cont. Presently non–existent
Comtat Venaissin and Avignon 1348–1791 – – Papal territory France
Darchen and others 1640s–1959 1-10.0? – Bhutan China (Tibet)
Dobta and Chumbi ?–1959 <1 – Sikkim China (Tibet)
(Few) East Berlin in West Berlin
1945–1972, 1988, 1990
– – GDR FRG
French enclaves in India –1949, 1950, 1954
526.0 total, incl. 293.0
Pondicherry
–
France India (British Empire until 1947)
Kowloon Walled City 1842–1993 0.7 (in 1898)
50.0 (1980s)
0.03
China Great Britain (Hong Kong)
Mount Scopus 1949–67 – 1 Israel Jordania
(5) Portuguese enclaves in India Mid-16th century–1954 (1961)
40.0
480.0 (Dadra),
7.4 (Nagar Aveli)
Portugal India
Pogiry (Pogiriay) 1990–96 0.003 1.69 Lithuania Belarus
Saint Pierre et Miquelon 1763–1992 7 242 France Canada
São João Baptista de Ajuda 1680–1960 Small garrison
0.01
Portugal Dahomey, France, Dahomey (Benin)
(6) Schirgiswalde 1635–1845 3.0 (Schirgis-
walde)
5.0 (Schirgis-
walde)
Austria Sachsen
(12) Steinstücken, etc. 1945–1972, 1988, 1990
0 to 0.19
–
FRG GDR
Venneres (the 6th Vennbahn enclave)
1922–58 5 households
–
Germany (FRG)
Belgium
Verenahof ?–1967 0.01
0.43
Germany (FRG)
Switzerland
West Berlin 1945–90 2,200.0 480.0 FRG GDR a) These two unnamed enclaves are situated 750m and 1,500m southwest of the Azeri town of Tatly respectively, on the west bank of the river Akhum. These are plots of agricultural land, of approximately 300 x 400m and 300 x 200m. They are likely to have been unilaterally annexed by Armenia, as were the enclaves of Barkhudarly, Kiarky and Upper Askipara (Whyte, 2002, 2nd edition, addenda: 1). b) Ormidhia and Xylotimbou represent two Cypriot villages each surrounded by territory of the British Sovereign Base Area of Dhekelia. The Dhekelia Power Station is divided by a British road into two parts. The northern part is a true enclave, whereas the southern part is located by the sea and therefore a semi-enclave. Yet, having no territorial waters, it is thus fully surrounded by the British Sovereign Base on land and sea. c) The enclave of Sastavci is situated south of the Lim River around the Bosnia-Herzegovina village of the same name. Negotiations were underway in 2001–02 on realigning the boundary between Serbia and Bosnia-Herzegovina, including the section at Sastavci. While Bosnia has proposed the creation of a corridor to link itself to the enclave, Serbia has proposed quite the opposite, namely an exchange of territory to give Serbia the entire southern bank of the Lim River.
Source: Author’s compilation.
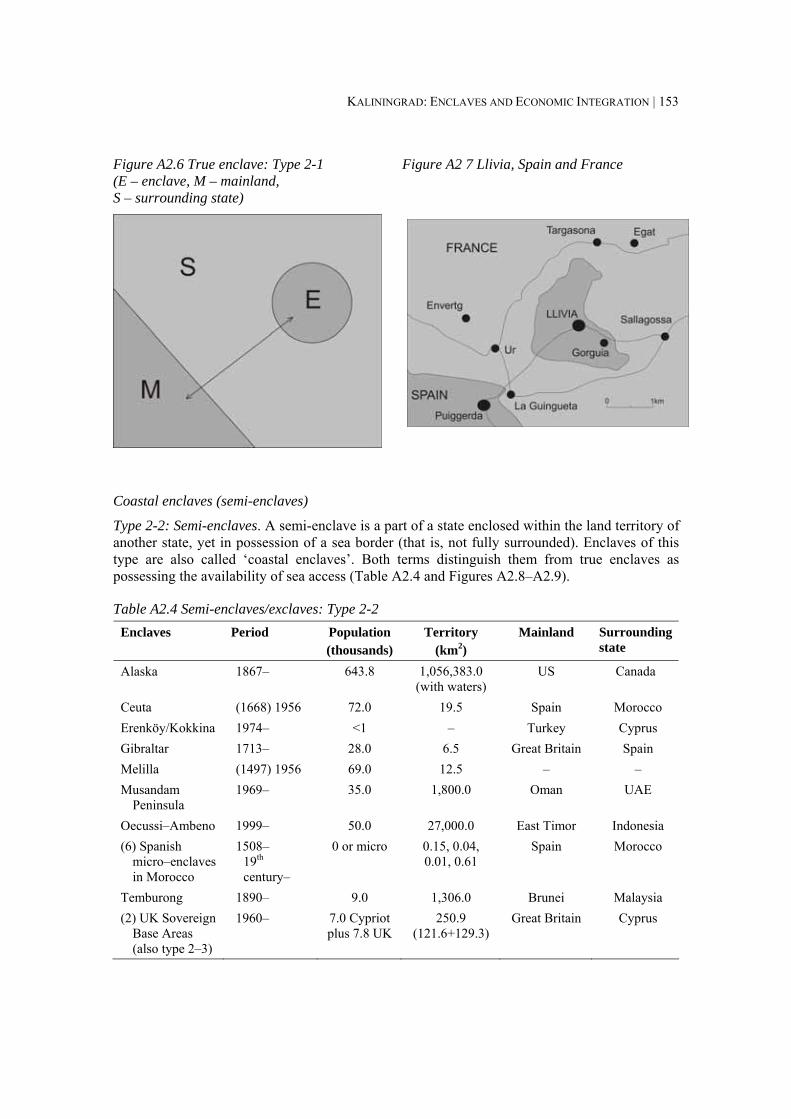
KALININGRAD: ENCLAVES AND ECONOMIC INTEGRATION | 153
Figure A2.6 True enclave: Type 2-1 (E – enclave, M – mainland, S – surrounding state)
Figure A2 7 Llivia, Spain and France
Coastal enclaves (semi-enclaves)
Type 2-2: Semi-enclaves. A semi-enclave is a part of a state enclosed within the land territory of another state, yet in possession of a sea border (that is, not fully surrounded). Enclaves of this type are also called ‘coastal enclaves’. Both terms distinguish them from true enclaves as possessing the availability of sea access (Table A2.4 and Figures A2.8–A2.9).
Table A2.4 Semi-enclaves/exclaves: Type 2-2 Enclaves Period Population
(thousands) Territory
(km2) Mainland Surrounding
state
Alaska 1867– 643.8
1,056,383.0 (with waters)
US
Canada
Ceuta (1668) 1956 72.0 19.5 Spain Morocco Erenköy/Kokkina 1974– <1 – Turkey Cyprus Gibraltar 1713– 28.0 6.5 Great Britain Spain Melilla (1497) 1956 69.0 12.5 – – Musandam
Peninsula 1969– 35.0
1,800.0
Oman
UAE
Oecussi–Ambeno 1999– 50.0 27,000.0 East Timor Indonesia (6) Spanish
micro–enclaves in Morocco
1508– 19th century–
0 or micro
0.15, 0.04, 0.01, 0.61
Spain
Morocco
Temburong 1890– 9.0 1,306.0 Brunei Malaysia (2) UK Sovereign
Base Areas (also type 2–3)
1960– 7.0 Cypriot plus 7.8 UK
250.9 (121.6+129.3)
Great Britain Cyprus
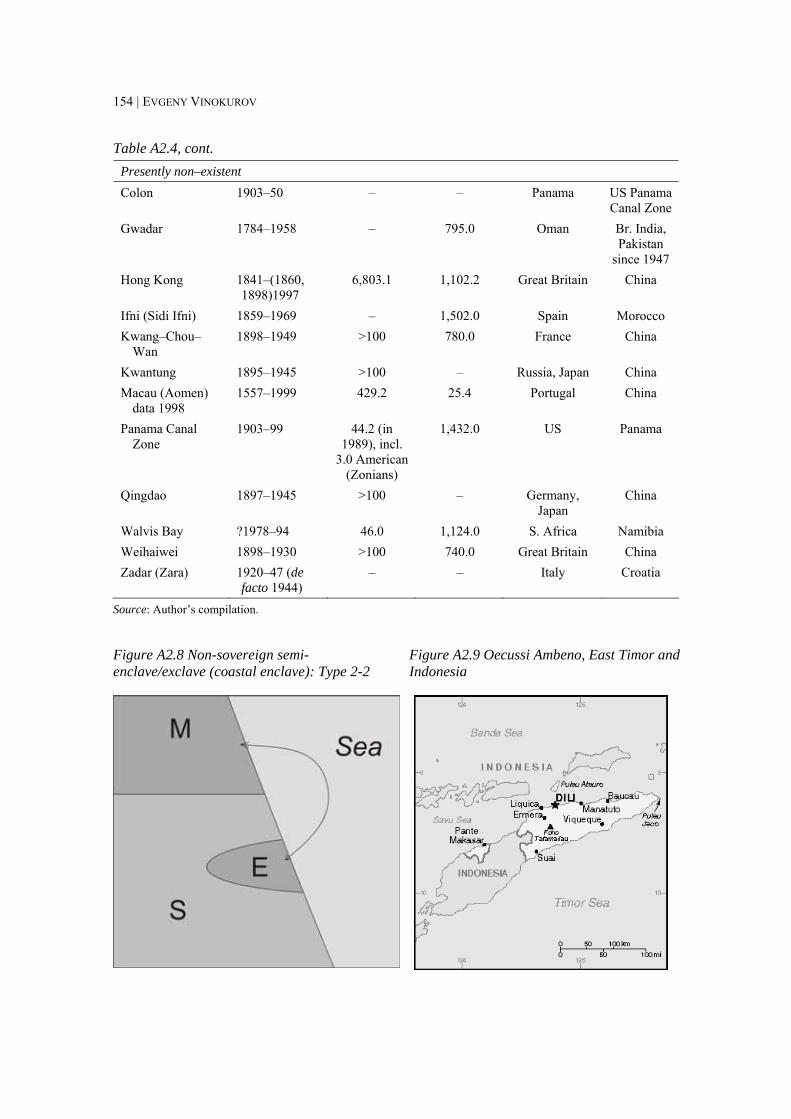
154 | EVGENY VINOKUROV
Table A2.4, cont. Presently non–existent Colon 1903–50 –
–
Panama
US Panama Canal Zone
Gwadar 1784–1958 –
795.0
Oman
Br. India, Pakistan
since 1947 Hong Kong 1841–(1860,
1898)1997 6,803.1
1,102.2
Great Britain
China
Ifni (Sidi Ifni) 1859–1969 – 1,502.0 Spain Morocco Kwang–Chou–
Wan 1898–1949 >100 780.0 France China
Kwantung 1895–1945 >100 – Russia, Japan China Macau (Aomen)
data 1998 1557–1999 429.2
25.4
Portugal
China
Panama Canal
Zone 1903–99 44.2 (in
1989), incl. 3.0 American
(Zonians)
1,432.0
US
Panama
Qingdao 1897–1945 >100 – Germany, Japan
China
Walvis Bay ?1978–94 46.0 1,124.0 S. Africa Namibia Weihaiwei 1898–1930 >100 740.0 Great Britain China Zadar (Zara) 1920–47 (de
facto 1944) –
–
Italy
Croatia
Source: Author’s compilation.
Figure A2.8 Non-sovereign semi-enclave/exclave (coastal enclave): Type 2-2
Figure A2.9 Oecussi Ambeno, East Timor and Indonesia
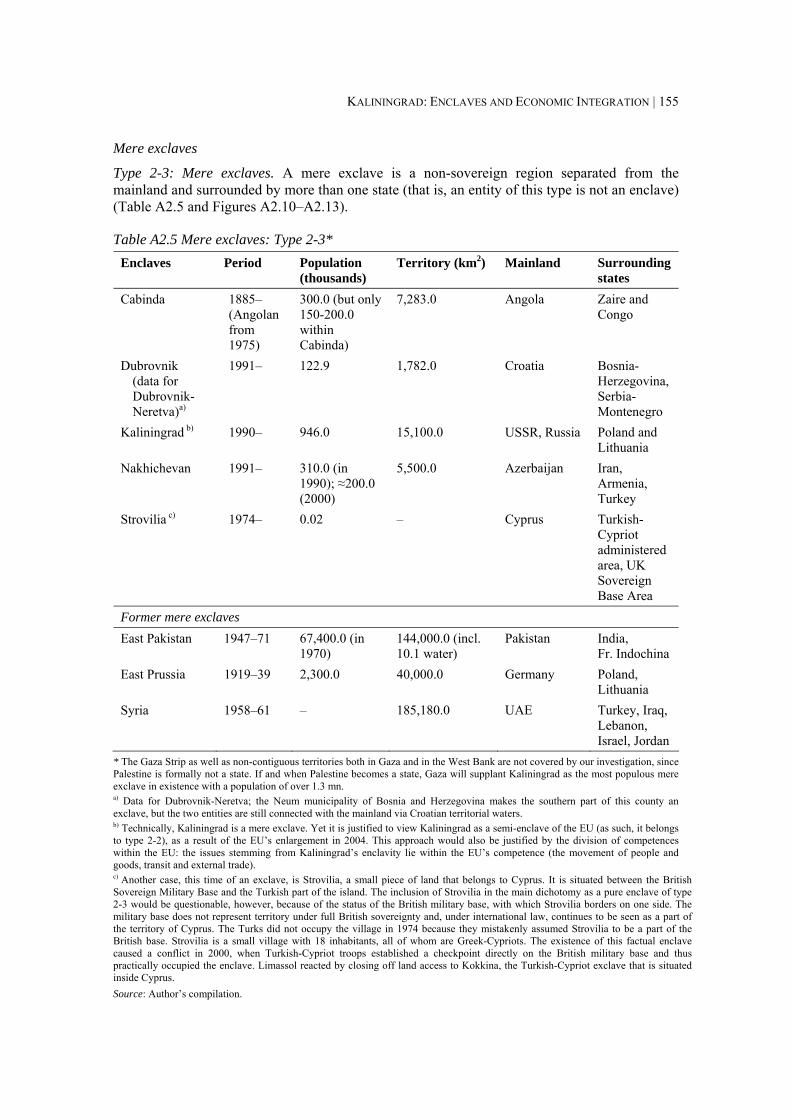
KALININGRAD: ENCLAVES AND ECONOMIC INTEGRATION | 155
Mere exclaves
Type 2-3: Mere exclaves. A mere exclave is a non-sovereign region separated from the mainland and surrounded by more than one state (that is, an entity of this type is not an enclave) (Table A2.5 and Figures A2.10–A2.13).
Table A2.5 Mere exclaves: Type 2-3* Enclaves Period Population
(thousands) Territory (km2) Mainland Surrounding
states Cabinda 1885–
(Angolan from 1975)
300.0 (but only 150-200.0 within Cabinda)
7,283.0
Angola
Zaire and Congo
Dubrovnik (data for Dubrovnik-Neretva)a)
1991– 122.9
1,782.0
Croatia
Bosnia-Herzegovina, Serbia-Montenegro
Kaliningrad b) 1990– 946.0
15,100.0
USSR, Russia Poland and Lithuania
Nakhichevan 1991– 310.0 (in 1990); ≈200.0 (2000)
5,500.0
Azerbaijan
Iran, Armenia, Turkey
Strovilia c) 1974–
0.02
–
Cyprus
Turkish-Cypriot administered area, UK Sovereign Base Area
Former mere exclaves East Pakistan 1947–71 67,400.0 (in
1970) 144,000.0 (incl. 10.1 water)
Pakistan
India, Fr. Indochina
East Prussia 1919–39 2,300.0 40,000.0 Germany Poland, Lithuania
Syria 1958–61 –
185,180.0
UAE
Turkey, Iraq, Lebanon, Israel, Jordan
* The Gaza Strip as well as non-contiguous territories both in Gaza and in the West Bank are not covered by our investigation, since Palestine is formally not a state. If and when Palestine becomes a state, Gaza will supplant Kaliningrad as the most populous mere exclave in existence with a population of over 1.3 mn. a) Data for Dubrovnik-Neretva; the Neum municipality of Bosnia and Herzegovina makes the southern part of this county an exclave, but the two entities are still connected with the mainland via Croatian territorial waters. b) Technically, Kaliningrad is a mere exclave. Yet it is justified to view Kaliningrad as a semi-enclave of the EU (as such, it belongs to type 2-2), as a result of the EU’s enlargement in 2004. This approach would also be justified by the division of competences within the EU: the issues stemming from Kaliningrad’s enclavity lie within the EU’s competence (the movement of people and goods, transit and external trade). c) Another case, this time of an exclave, is Strovilia, a small piece of land that belongs to Cyprus. It is situated between the British Sovereign Military Base and the Turkish part of the island. The inclusion of Strovilia in the main dichotomy as a pure enclave of type 2-3 would be questionable, however, because of the status of the British military base, with which Strovilia borders on one side. The military base does not represent territory under full British sovereignty and, under international law, continues to be seen as a part of the territory of Cyprus. The Turks did not occupy the village in 1974 because they mistakenly assumed Strovilia to be a part of the British base. Strovilia is a small village with 18 inhabitants, all of whom are Greek-Cypriots. The existence of this factual enclave caused a conflict in 2000, when Turkish-Cypriot troops established a checkpoint directly on the British military base and thus practically occupied the enclave. Limassol reacted by closing off land access to Kokkina, the Turkish-Cypriot exclave that is situated inside Cyprus. Source: Author’s compilation.
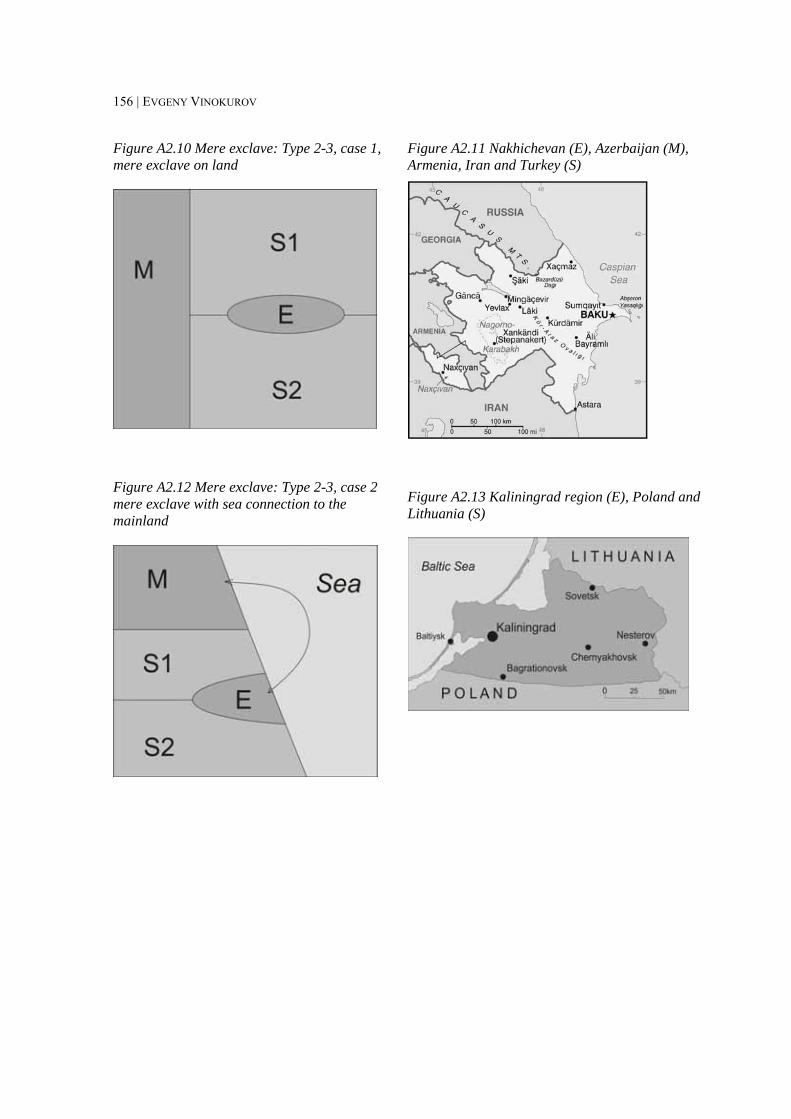
156 | EVGENY VINOKUROV
Figure A2.10 Mere exclave: Type 2-3, case 1, mere exclave on land
Figure A2.12 Mere exclave: Type 2-3, case 2 mere exclave with sea connection to the mainland
Figure A2.11 Nakhichevan (E), Azerbaijan (M), Armenia, Iran and Turkey (S)
Figure A2.13 Kaliningrad region (E), Poland and Lithuania (S)
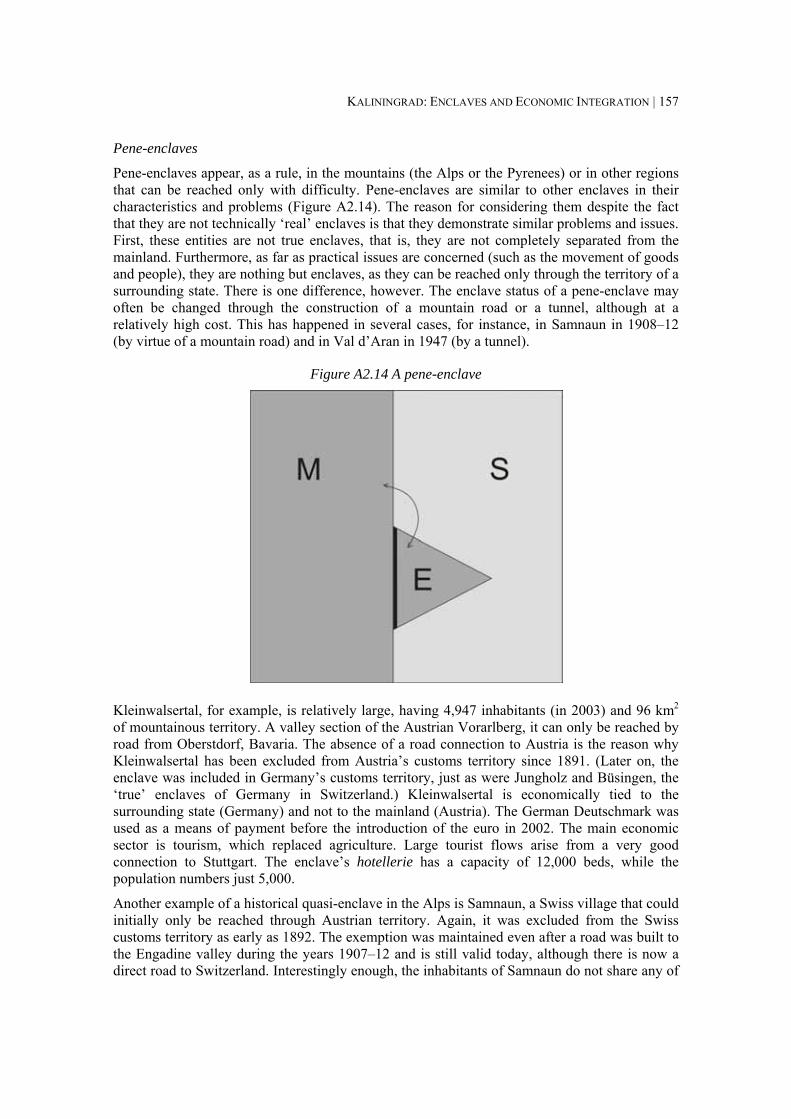
KALININGRAD: ENCLAVES AND ECONOMIC INTEGRATION | 157
Pene-enclaves
Pene-enclaves appear, as a rule, in the mountains (the Alps or the Pyrenees) or in other regions that can be reached only with difficulty. Pene-enclaves are similar to other enclaves in their characteristics and problems (Figure A2.14). The reason for considering them despite the fact that they are not technically ‘real’ enclaves is that they demonstrate similar problems and issues. First, these entities are not true enclaves, that is, they are not completely separated from the mainland. Furthermore, as far as practical issues are concerned (such as the movement of goods and people), they are nothing but enclaves, as they can be reached only through the territory of a surrounding state. There is one difference, however. The enclave status of a pene-enclave may often be changed through the construction of a mountain road or a tunnel, although at a relatively high cost. This has happened in several cases, for instance, in Samnaun in 1908–12 (by virtue of a mountain road) and in Val d’Aran in 1947 (by a tunnel).
Figure A2.14 A pene-enclave
Kleinwalsertal, for example, is relatively large, having 4,947 inhabitants (in 2003) and 96 km2 of mountainous territory. A valley section of the Austrian Vorarlberg, it can only be reached by road from Oberstdorf, Bavaria. The absence of a road connection to Austria is the reason why Kleinwalsertal has been excluded from Austria’s customs territory since 1891. (Later on, the enclave was included in Germany’s customs territory, just as were Jungholz and Büsingen, the ‘true’ enclaves of Germany in Switzerland.) Kleinwalsertal is economically tied to the surrounding state (Germany) and not to the mainland (Austria). The German Deutschmark was used as a means of payment before the introduction of the euro in 2002. The main economic sector is tourism, which replaced agriculture. Large tourist flows arise from a very good connection to Stuttgart. The enclave’s hotellerie has a capacity of 12,000 beds, while the population numbers just 5,000.
Another example of a historical quasi-enclave in the Alps is Samnaun, a Swiss village that could initially only be reached through Austrian territory. Again, it was excluded from the Swiss customs territory as early as 1892. The exemption was maintained even after a road was built to the Engadine valley during the years 1907–12 and is still valid today, although there is now a direct road to Switzerland. Interestingly enough, the inhabitants of Samnaun do not share any of

158 | EVGENY VINOKUROV
the official languages of Switzerland; they do not speak Schweizerdeutsche but a Bavarian-Tyrolean dialect of German instead.
Spanish Val d’Aran used to be unreachable from Spain for several months of the year until finally a tunnel was constructed through the mountains in 1948. It represents a valley of 620.5 km2 with a population of over 7,000. Administratively, Val d’Aran is a county (comarca) in north-western Catalonia. The complete, although temporary, isolation of the valley allowed Spanish Republican guerrillas to control the area from the end of World War II for three years until the opening of the tunnel in 1948.
Further pene-enclaves include the US Northwest Angle and Point Roberts, both bordering Canada. The Lake of the Woods separates some land in Minnesota, known as the Northwest Angle, from the rest of the US so that it can be reached from the rest of the state only by crossing the lake or going through Canada. Point Roberts is a town in Washington state. Like the Northwest Angle, it is on a peninsula in US territory that is not connected to the US mainland. Although Point Roberts would appear to be part of Canada (which it borders), it is actually part of the US because it is south of the 49th parallel, the official latitude defining the Canada–US border.1 The pene-enclave assumed its present status in 1846. The peninsula occupies 4.1 square miles (10.5 km2). Point Roberts’s land connections to the US are through Canadian territory although the territorial waters between the mainland and Point Roberts are within US sovereignty. This connection is unimportant, however, since adequate moorage facilities are lacking on the Point, so this mode of transportation is hardly ever used. In the second half of the 19th century, the Point was a military reserve, but its military status was quickly lost when the first settlers arrived. The peculiarity of Point Roberts’s location is its proximity to the metropolitan area of Vancouver. It is only half an hour’s drive away so the pene-enclave lies within commuting distance from downtown Vancouver. By comparison, it is almost an hour’s drive to the nearest small town on the mainland, Blaine, and even more (about 80 minutes) to a larger town, Bellingham (Minghi, 1962).
It is not necessary for a quasi-enclave to be separated from the mainland by mountains or water obstacles. An interesting historical case demonstrates that long distances and an extremely harsh climate can effectively make a territory a quasi-enclave. Before the construction of the Alaska Highway in the 1940s, Yukon, being part of Canada, was reachable only by passing through Alaska. All available routes (by foot through the Chilkoot Pass, by boat up the Yukon river or by the White Pass Railway (completed at the beginning of the 20th century), originated in the US. Despite the fact that the Yukon was not separated from Canada by insurmountable mountains or by other harsh obstacles, travellers had to take routes originating in the US for the sake of survival. When Dr Kristian Edmonton set out from Edmonton (British Columbia) in 1897 to chart an all-Canadian route to the Yukon, he took 22 months to reach his destination and almost died en route. Out of 775 men and women accompanied by 4,000 horses that had set out via this route during the Gold Rush, only 160 persons made it to the Klondike, and all the pack animals died on the trail (Reid, 1992, p. 63).
Most pene-exclaves could be connected to their mainlands at some expense by the construction of special roads or tunnels. Samnaun ceased to be a pene-enclave when a road was built to the Engadine valley at the beginning of the 20th century. Val d’Aran ceased to be a pene-enclave in 1948 owing to the construction of the tunnel connecting the valley to mainland Spain.
The list of existing pene-enclaves in Table A2.6 is not exhaustive. There are more of them, e.g. in the area of Drumully, belonging to the Republic of Ireland, which are accessible by car only from Northern Ireland. Another example is a territory in the north-western part of Togo, which 1 For more information about Point Roberts, see http://exclave.info/current/ptroberts/ptroberts.html; for great maps see also http://exclave.info/current/ptroberts/ptroberts.html.
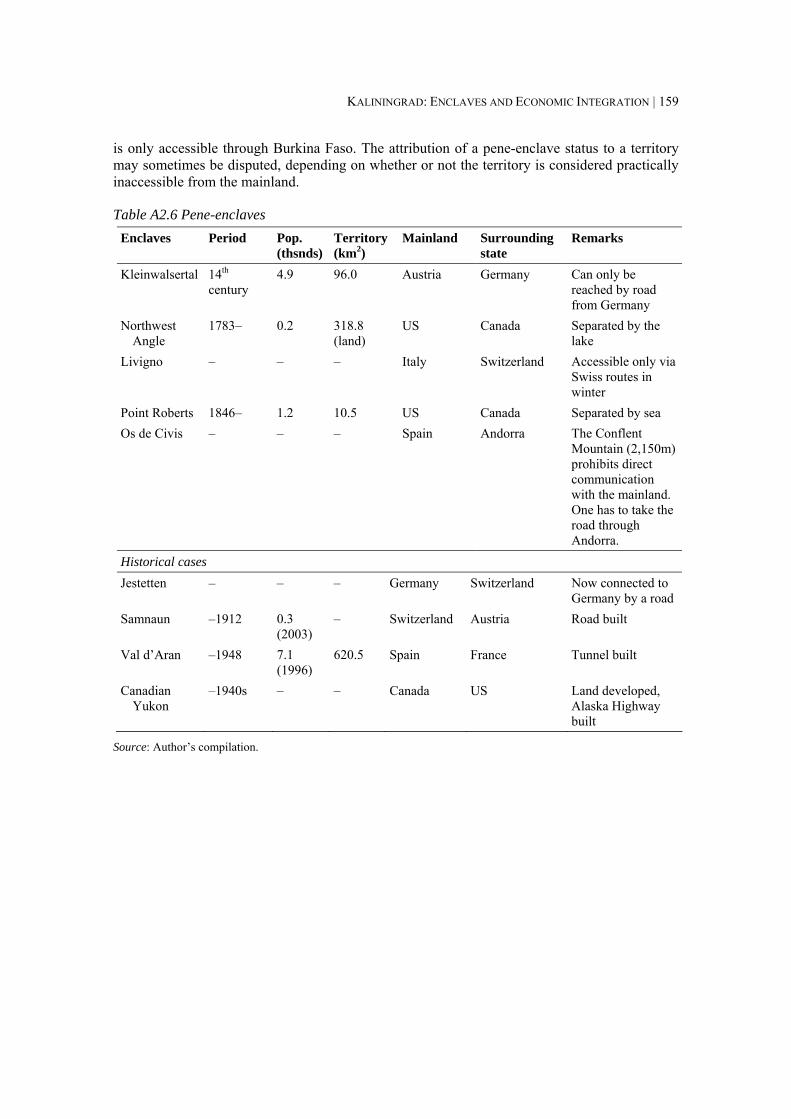
KALININGRAD: ENCLAVES AND ECONOMIC INTEGRATION | 159
is only accessible through Burkina Faso. The attribution of a pene-enclave status to a territory may sometimes be disputed, depending on whether or not the territory is considered practically inaccessible from the mainland.
Table A2.6 Pene-enclaves Enclaves Period Pop.
(thsnds) Territory (km2)
Mainland Surrounding state
Remarks
Kleinwalsertal 14th century
4.9
96.0
Austria Germany Can only be reached by road from Germany
Northwest Angle
1783– 0.2
318.8 (land)
US Canada Separated by the lake
Livigno – –
–
Italy Switzerland Accessible only via Swiss routes in winter
Point Roberts 1846– 1.2 10.5 US Canada Separated by sea Os de Civis – –
–
Spain Andorra The Conflent Mountain (2,150m) prohibits direct communication with the mainland. One has to take the road through Andorra.
Historical cases Jestetten – –
–
Germany Switzerland Now connected to Germany by a road
Samnaun –1912 0.3 (2003)
–
Switzerland Austria Road built
Val d’Aran –1948 7.1 (1996)
620.5
Spain France Tunnel built
Canadian Yukon
–1940s –
–
Canada US Land developed, Alaska Highway built
Source: Author’s compilation.
About CEPS
Place du Congrès 1 • B-1000 Brussels
Tel : 32(0)2.229.39.11 • Fax : 32(0)2.219.41.51
E-mail: [email protected] : http://www.ceps.beBookshop : http://shop.ceps.be
Founded in Brussels in 1983, the Centre for European Policy Studies (CEPS) is among the most experienced and authoritative think tanks operating in the European Union today. CEPS serves as a leading forum for debate on EU affairs, but its most distinguishing feature lies in its strong in-house research capacity, complemented by an extensive network of partner institutes throughout the world.
Goals• Tocarryoutstate-of-the-artpolicyresearchleading
tosolutionstothechallengesfacingEuropetoday.
• Toachievehighstandardsofacademicexcellence
andmaintainunqualifiedindependence.
• Toprovideaforumfordiscussionamongall
stakeholdersintheEuropeanpolicyprocess.
• Tobuildcollaborativenetworksofresearchers,
policy-makersandbusinessrepresentativesacross
thewholeofEurope.
• Todisseminateourfindingsandviewsthrougha
regularflowofpublicationsandpublicevents.
Assets• Completeindependencetosetitsownresearch
prioritiesandfreedomfromanyoutsideinfluence.
• Formationofninedifferentresearchnetworks,
comprisingresearchinstitutesfromthroughout
Europeandbeyond,tocomplementand
consolidateCEPSresearchexpertiseandtogreatly
extenditsoutreach.
• Anextensivemembershipbaseofsome120
CorporateMembersand130Institutional
Members,whichprovideexpertiseandpractical
experienceandactasasoundingboardforthe
utilityandfeasabilityofCEPSpolicyproposals.
Programme StructureCEPScarriesoutitsresearchviaitsownin-house
researchprogrammesandthroughcollaborative
researchnetworksinvolvingtheactiveparticipationof
otherhighlyreputableinstitutesandspecialists.
ResearchProgrammesEconomic&SocialWelfarePolicies
Energy,ClimateChange&SustainableDevelopment
EUNeighbourhood,Foreign&SecurityPolicy
FinancialMarkets&Taxation
Justice&HomeAffairs
Politics&EuropeanInstitutions
RegulatoryAffairs
Trade,Development&AgriculturalPolicy
ResearchNetworks/JointInitiativesChangingLandscapeofSecurity&Liberty(CHALLENGE)
EuropeanCapitalMarketsInstitute(ECMI)
EuropeanClimatePlatform(ECP)
EuropeanCreditResearchInstitute(ECRI)
EuropeanNetworkofAgricultural&RuralPolicyResearch
Institutes(ENARPRI)
EuropeanNetworkforBetterRegulation(ENBR)
EuropeanNetworkofEconomicPolicyResearchInstitutes
(ENEPRI)
EuropeanPolicyInstitutesNetwork(EPIN)
EuropeanSecurityForum(ESF)
CEPSalsoorganisesavarietyofactivitiesandspecial
events,involvingitsmembersandotherstakeholders
intheEuropeanpolicydebate,nationalandEU-level
policy-makers,academics,corporateexecutives,NGOs
andthemedia.CEPS’fundingisobtainedfroma
varietyofsources,includingmembershipfees,project
research,foundationgrants,conferencesfees,publi-
cationsalesandanannualgrantfromtheEuropean
Commission.