kaizen blitz project report
DESCRIPTION
A 5 member IT Security Services team of a large MNC, despite the existence of online tools to initiate, process and track requests, was feeling continuousy overworked. Was the team understaffed or inefficient? Where did the gaps lie and how were these to be fixed?TRANSCRIPT
Crafitti Consulting
© Crafitti Consulting Private Limited www.crafitti.com Kaizen Blitz Report May 24, 2011 1
Kaizen Blitz Project Report
Crafitti Consulting Private Limited |www.crafitti.com
KAIZEN BLITZ
© Crafitti Consulting Private Limited www.crafitti.com Confidential May 24, 2011 2
Background
Facilitated Kaizen Blitz
A focused 2-10 days (usually 5 comprehensive days of work) special event involving every member of the team
for crafting radical change in a process. It has following phases
– Training on Lean principles and concepts of value stream, flow and pull (ranging from half day to full day
based on awareness level of the team)
– Value stream mapping for the relevant processes which includes sequence of all activities and cycle times
and also the demand arrival rates which help in Takt time computations
– Analysis of VSM to find out Non-value adding (NVA) activities and capacity planning using queuing analysis
(Identifying problems)
– Brainstorming with the teams to eliminate NVA and maximizing flow
– Implementing changes in the process as per the flow based cycle time and Takt time
– Final report (Kaizen Blitz Diary) and possible routes to solve problems as they emerge in future
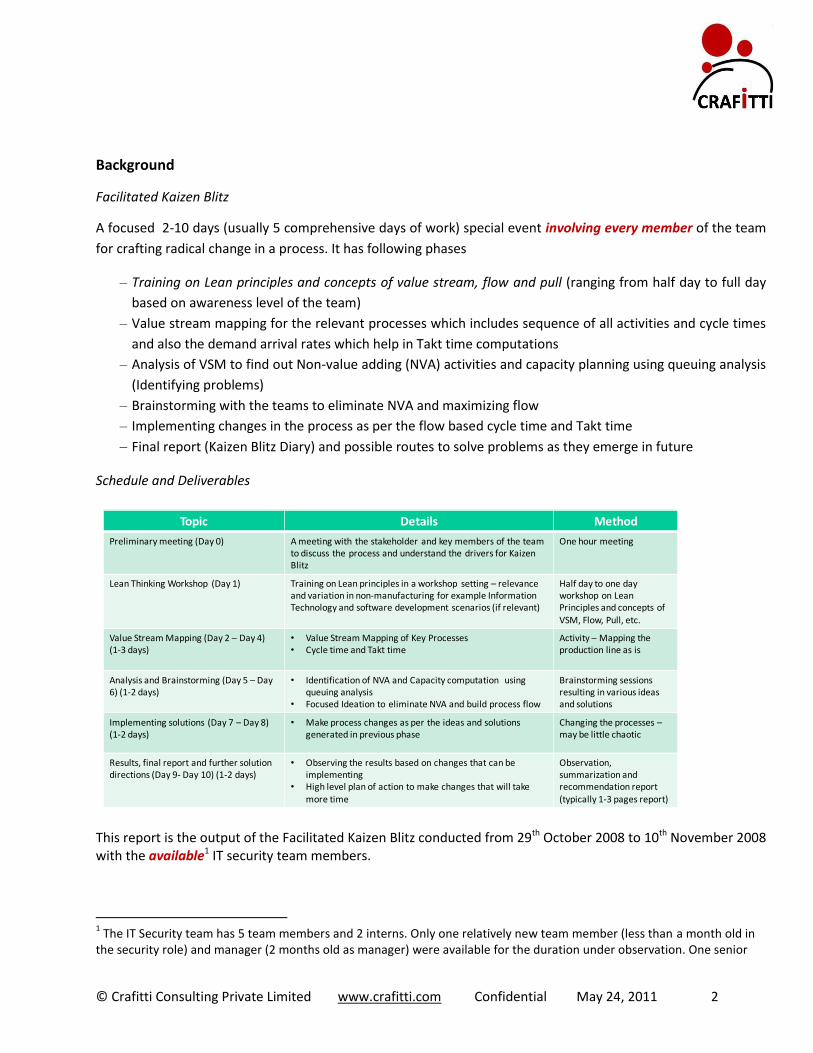
Schedule and Deliverables
Topic Details Method
Preliminary meeting (Day 0) A meeting with the stakeholder and key members of the team to discuss the process and understand the drivers for Kaizen Blitz
One hour meeting
Lean Thinking Workshop (Day 1) Training on Lean principles in a workshop setting – relevance and variation in non-manufacturing for example Information Technology and software development scenarios (if relevant)
Half day to one day workshop on Lean Principles and concepts of
VSM, Flow, Pull, etc.
Value Stream Mapping (Day 2 – Day 4)(1-3 days)
• Value Stream Mapping of Key Processes• Cycle time and Takt time
Activity – Mapping the production line as is
Analysis and Brainstorming (Day 5 – Day 6) (1-2 days)
• Identification of NVA and Capacity computation using queuing analysis
• Focused Ideation to eliminate NVA and build process flow
Brainstorming sessionsresulting in various ideas and solutions
Implementing solutions (Day 7 – Day 8)(1-2 days)
• Make process changes as per the ideas and solutions generated in previous phase
Changing the processes –may be little chaotic
Results, final report and further solution directions (Day 9- Day 10) (1-2 days)
• Observing the results based on changes that can be implementing
• High level plan of action to make changes that will take more time
Observation,summarization and recommendation report (typically 1-3 pages report)
This report is the output of the Facilitated Kaizen Blitz conducted from 29th October 2008 to 10th November 2008 with the available1 IT security team members.
1 The IT Security team has 5 team members and 2 interns. Only one relatively new team member (less than a month old in
the security role) and manager (2 months old as manager) were available for the duration under observation. One senior
© Crafitti Consulting Private Limited www.crafitti.com Confidential May 24, 2011 3
team member was available only for the first two days (30th and 31
st October 2008). Effectiveness of this report needs to
be judged and evaluated based on observations on the work done by these members.
© Crafitti Consulting Private Limited www.crafitti.com Confidential May 24, 2011 4
Introduction
This is the report of findings and activities carried out between 29th October 2008 and 11th November 2008 for the IT Security Team of a large Telecom Equipment Provider MNC as part of a Kaizen Blitz event. The report is organized in the following sections.
Section 2 briefly explains the need for such a study and provides the existing organization structure of the IT Security Team. Section 3 gives an overview of findings during pre-observation meeting with the team. Section 4 provides the system load based on data analysis. In Section 5 and Section 6 Value Stream Mapping activities and cycle times for all the streams are described. In Section 7 details about the audit report work carried out by the IT Security team is given. This was not part of the study; however, the information is included to account for workload on the system. In Section 8 the results in terms of the needed capacity are provided combining all value streams. Section 9 describes the results of two brainstorming sessions conducted using Crafitti’s Process and Crafitti’s Ideation cards. Finally in Section 10 conclusions and points of observations are given.
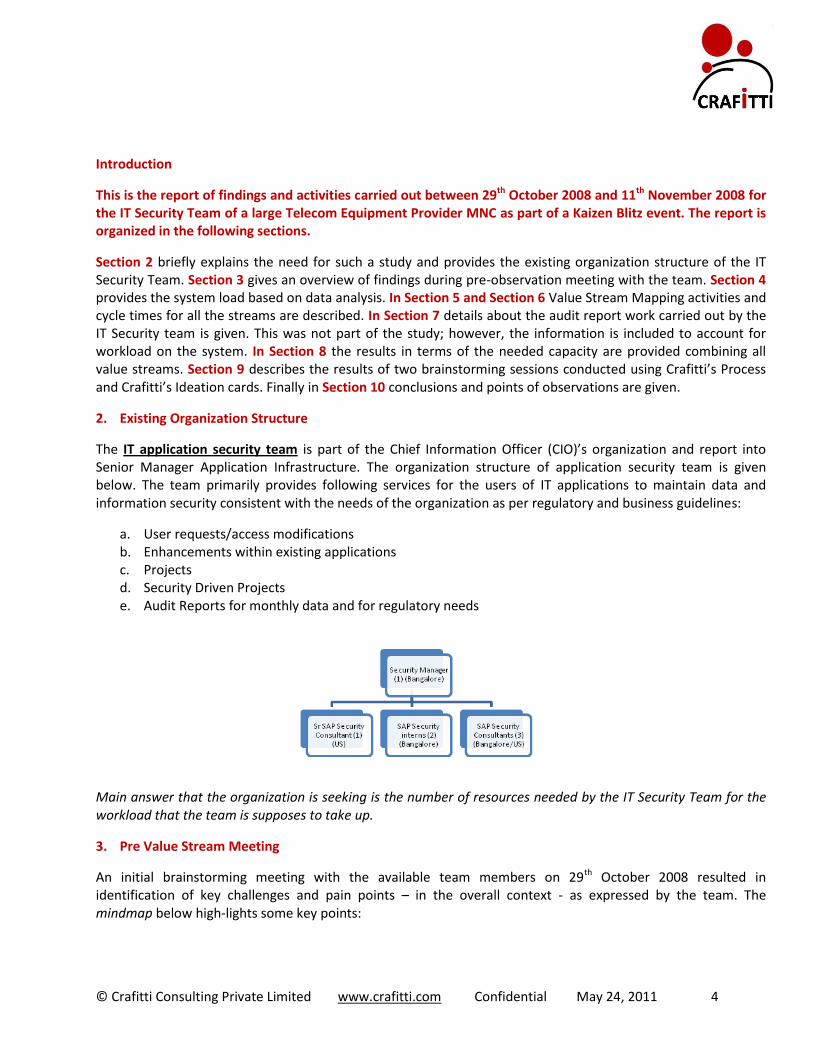
2. Existing Organization Structure
The IT application security team is part of the Chief Information Officer (CIO)’s organization and report into Senior Manager Application Infrastructure. The organization structure of application security team is given below. The team primarily provides following services for the users of IT applications to maintain data and information security consistent with the needs of the organization as per regulatory and business guidelines:
a. User requests/access modifications b. Enhancements within existing applications c. Projects d. Security Driven Projects e. Audit Reports for monthly data and for regulatory needs
Main answer that the organization is seeking is the number of resources needed by the IT Security Team for the workload that the team is supposes to take up.
3. Pre Value Stream Meeting
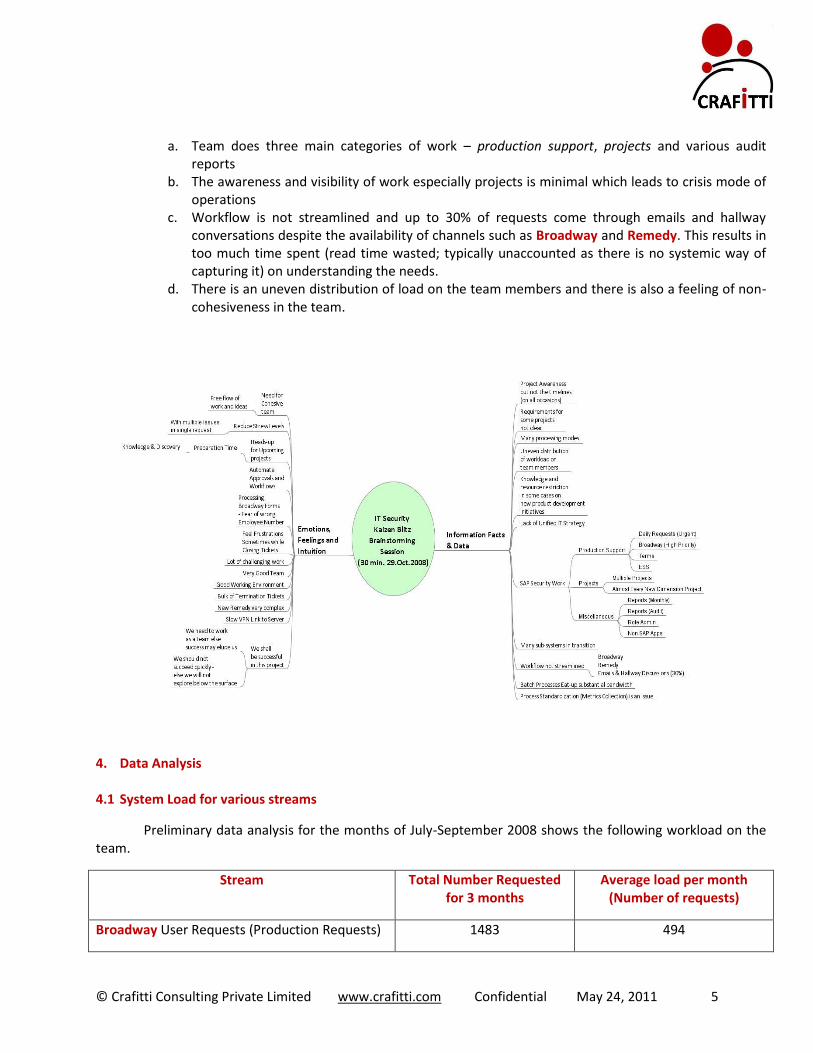
An initial brainstorming meeting with the available team members on 29th October 2008 resulted in identification of key challenges and pain points – in the overall context - as expressed by the team. The mindmap below high-lights some key points:
© Crafitti Consulting Private Limited www.crafitti.com Confidential May 24, 2011 5
a. Team does three main categories of work – production support, projects and various audit reports
b. The awareness and visibility of work especially projects is minimal which leads to crisis mode of operations
c. Workflow is not streamlined and up to 30% of requests come through emails and hallway conversations despite the availability of channels such as Broadway and Remedy. This results in too much time spent (read time wasted; typically unaccounted as there is no systemic way of capturing it) on understanding the needs.
d. There is an uneven distribution of load on the team members and there is also a feeling of non-cohesiveness in the team.
4. Data Analysis
4.1 System Load for various streams
Preliminary data analysis for the months of July-September 2008 shows the following workload on the team.
Stream Total Number Requested for 3 months
Average load per month (Number of requests)
Broadway User Requests (Production Requests) 1483 494
© Crafitti Consulting Private Limited www.crafitti.com Confidential May 24, 2011 6
Remedy Terminations 968 323
Remedy Creation ESS/MSS Account 93 31
Remedy Role Dev Security Enhancement 54 18
Remedy User Access Changes 401 134
Remedy Project 4 1
Besides the above streams the team is engaged in Audit reports creation. This is predominantly handled by the senior security consultant in the team who has been part of the system for more than a decade. All others members are relatively new to the IT Security team.
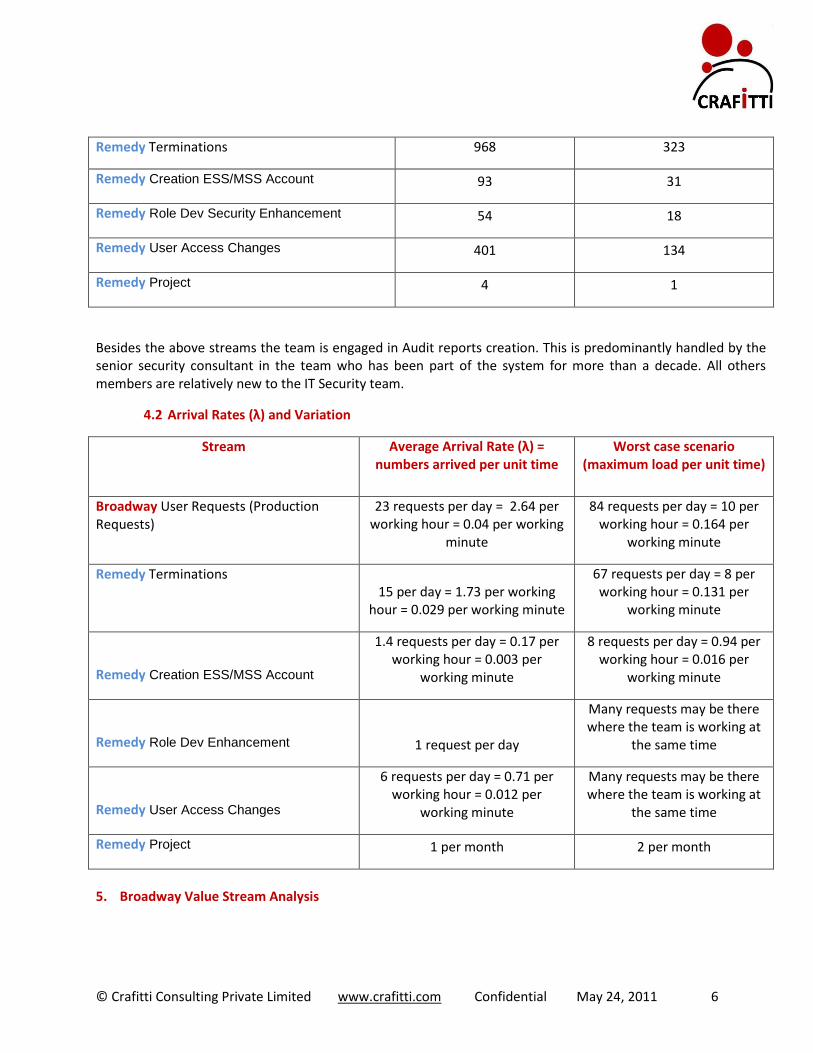
4.2 Arrival Rates (λ) and Variation
Stream Average Arrival Rate (λ) = numbers arrived per unit time
Worst case scenario (maximum load per unit time)
Broadway User Requests (Production Requests)
23 requests per day = 2.64 per working hour = 0.04 per working
minute
84 requests per day = 10 per working hour = 0.164 per
working minute
Remedy Terminations 15 per day = 1.73 per working
hour = 0.029 per working minute
67 requests per day = 8 per working hour = 0.131 per
working minute
Remedy Creation ESS/MSS Account
1.4 requests per day = 0.17 per working hour = 0.003 per
working minute
8 requests per day = 0.94 per working hour = 0.016 per
working minute
Remedy Role Dev Enhancement 1 request per day
Many requests may be there where the team is working at
the same time
Remedy User Access Changes
6 requests per day = 0.71 per working hour = 0.012 per
working minute
Many requests may be there where the team is working at
the same time
Remedy Project 1 per month 2 per month
5. Broadway Value Stream Analysis
© Crafitti Consulting Private Limited www.crafitti.com Confidential May 24, 2011 7
Broadway requests are typically created by end users for modification to the access needs or creation of a new user. These requests then go through an approver before reaching the IT Security team as a Production Request.
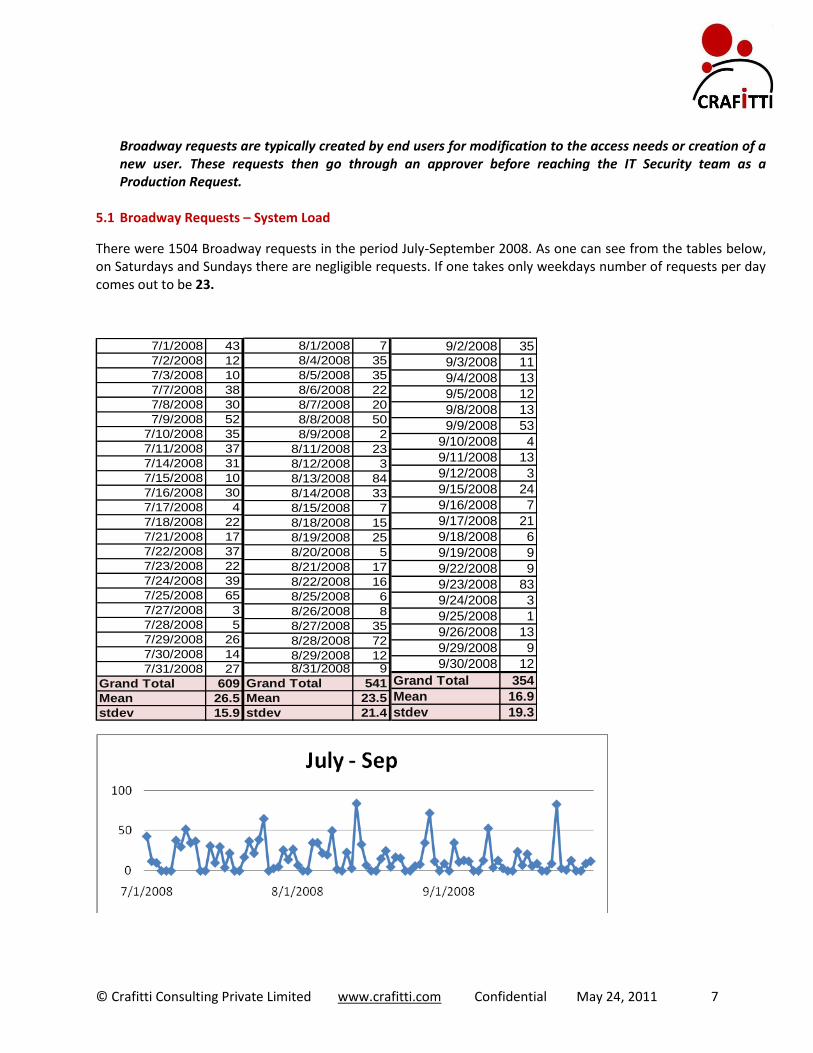
5.1 Broadway Requests – System Load
There were 1504 Broadway requests in the period July-September 2008. As one can see from the tables below, on Saturdays and Sundays there are negligible requests. If one takes only weekdays number of requests per day comes out to be 23.
7/1/2008 43
7/2/2008 12
7/3/2008 10
7/7/2008 38
7/8/2008 30
7/9/2008 52
7/10/2008 35
7/11/2008 37
7/14/2008 31
7/15/2008 10
7/16/2008 30
7/17/2008 4
7/18/2008 22
7/21/2008 17
7/22/2008 37
7/23/2008 22
7/24/2008 39
7/25/2008 65
7/27/2008 3
7/28/2008 5
7/29/2008 26
7/30/2008 14
7/31/2008 27
Grand Total 609
Mean 26.5
stdev 15.9
8/1/2008 7
8/4/2008 35
8/5/2008 35
8/6/2008 22
8/7/2008 20
8/8/2008 50
8/9/2008 2
8/11/2008 23
8/12/2008 3
8/13/2008 84
8/14/2008 33
8/15/2008 7
8/18/2008 15
8/19/2008 25
8/20/2008 5
8/21/2008 17
8/22/2008 16
8/25/2008 6
8/26/2008 8
8/27/2008 35
8/28/2008 72
8/29/2008 128/31/2008 9
Grand Total 541
Mean 23.5
stdev 21.4
9/2/2008 35
9/3/2008 11
9/4/2008 13
9/5/2008 12
9/8/2008 13
9/9/2008 53
9/10/2008 4
9/11/2008 13
9/12/2008 3
9/15/2008 24
9/16/2008 7
9/17/2008 21
9/18/2008 6
9/19/2008 9
9/22/2008 9
9/23/2008 83
9/24/2008 3
9/25/2008 1
9/26/2008 13
9/29/2008 9
9/30/2008 12(blank)
Grand Total 354
Mean 16.9
stdev 19.3
© Crafitti Consulting Private Limited www.crafitti.com Confidential May 24, 2011 8
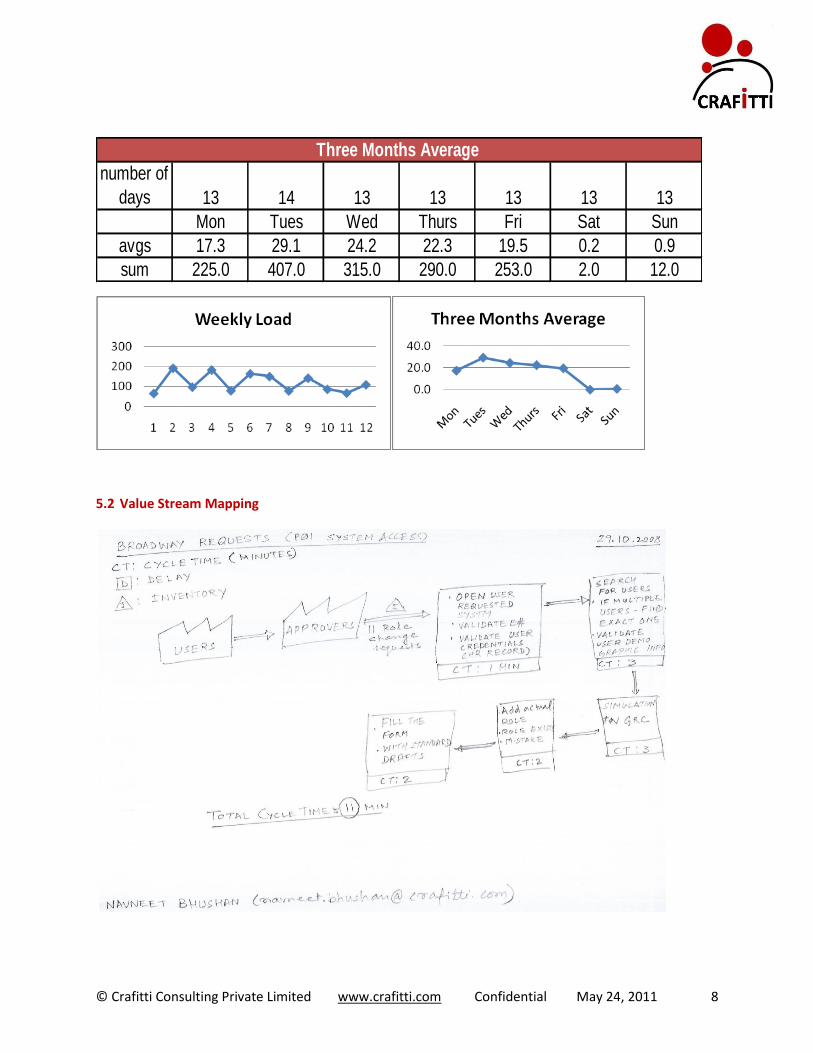
number of
days 13 14 13 13 13 13 13
Mon Tues Wed Thurs Fri Sat Sun
avgs 17.3 29.1 24.2 22.3 19.5 0.2 0.9
sum 225.0 407.0 315.0 290.0 253.0 2.0 12.0
Three Months Average
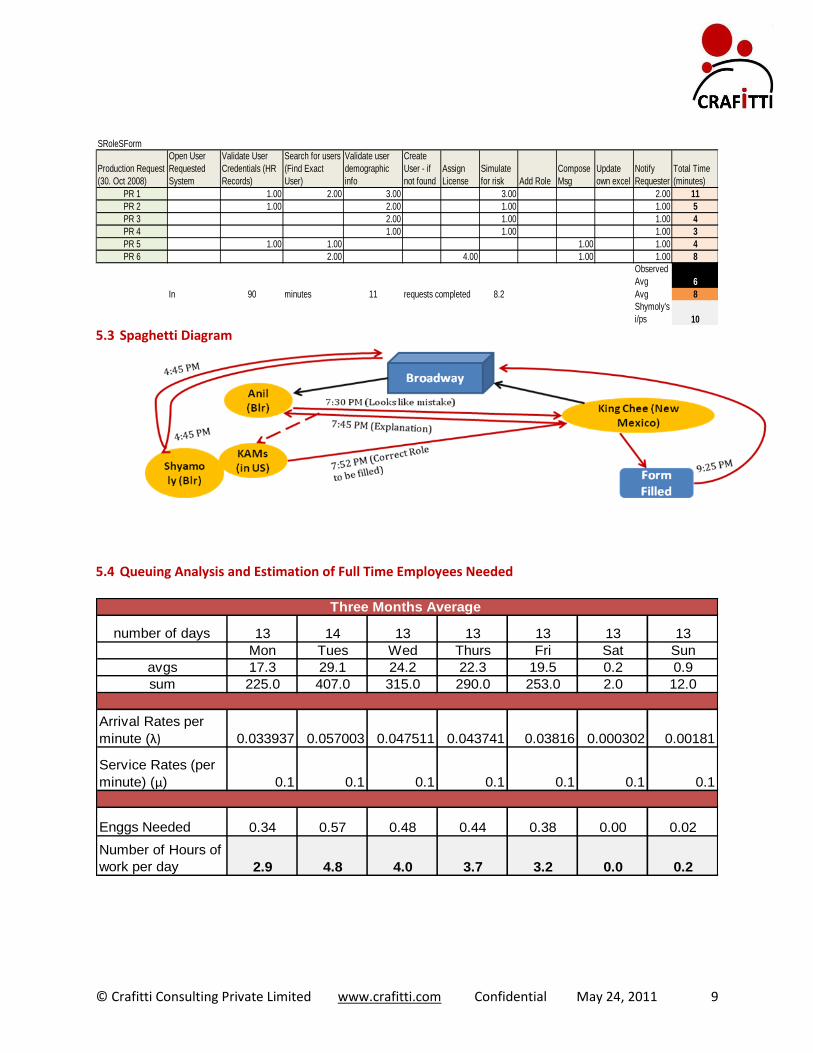
5.2 Value Stream Mapping
© Crafitti Consulting Private Limited www.crafitti.com Confidential May 24, 2011 9
SRoleSForm
Production Request
(30. Oct 2008)
Open User
Requested
System
Validate User
Credentials (HR
Records)
Search for users
(Find Exact
User)
Validate user
demographic
info
Create
User - if
not found
Assign
License
Simulate
for risk Add Role
Compose
Msg
Update
own excel
Notify
Requester
Total Time
(minutes)
PR 1 1.00 2.00 3.00 3.00 2.00 11
PR 2 1.00 2.00 1.00 1.00 5
PR 3 2.00 1.00 1.00 4
PR 4 1.00 1.00 1.00 3
PR 5 1.00 1.00 1.00 1.00 4
PR 6 2.00 4.00 1.00 1.00 8
Observed
Avg 6
In 90 minutes 11 requests completed 8.2 Avg 8
Shymoly's
i/ps 10 5.3 Spaghetti Diagram
5.4 Queuing Analysis and Estimation of Full Time Employees Needed
number of days 13 14 13 13 13 13 13
Mon Tues Wed Thurs Fri Sat Sun
avgs 17.3 29.1 24.2 22.3 19.5 0.2 0.9
sum 225.0 407.0 315.0 290.0 253.0 2.0 12.0
Arrival Rates per
minute (λ) 0.033937 0.057003 0.047511 0.043741 0.03816 0.000302 0.00181
Service Rates (per
minute) (μ) 0.1 0.1 0.1 0.1 0.1 0.1 0.1
Enggs Needed 0.34 0.57 0.48 0.44 0.38 0.00 0.02
Number of Hours of
work per day 2.9 4.8 4.0 3.7 3.2 0.0 0.2
Three Months Average
© Crafitti Consulting Private Limited www.crafitti.com Confidential May 24, 2011 10
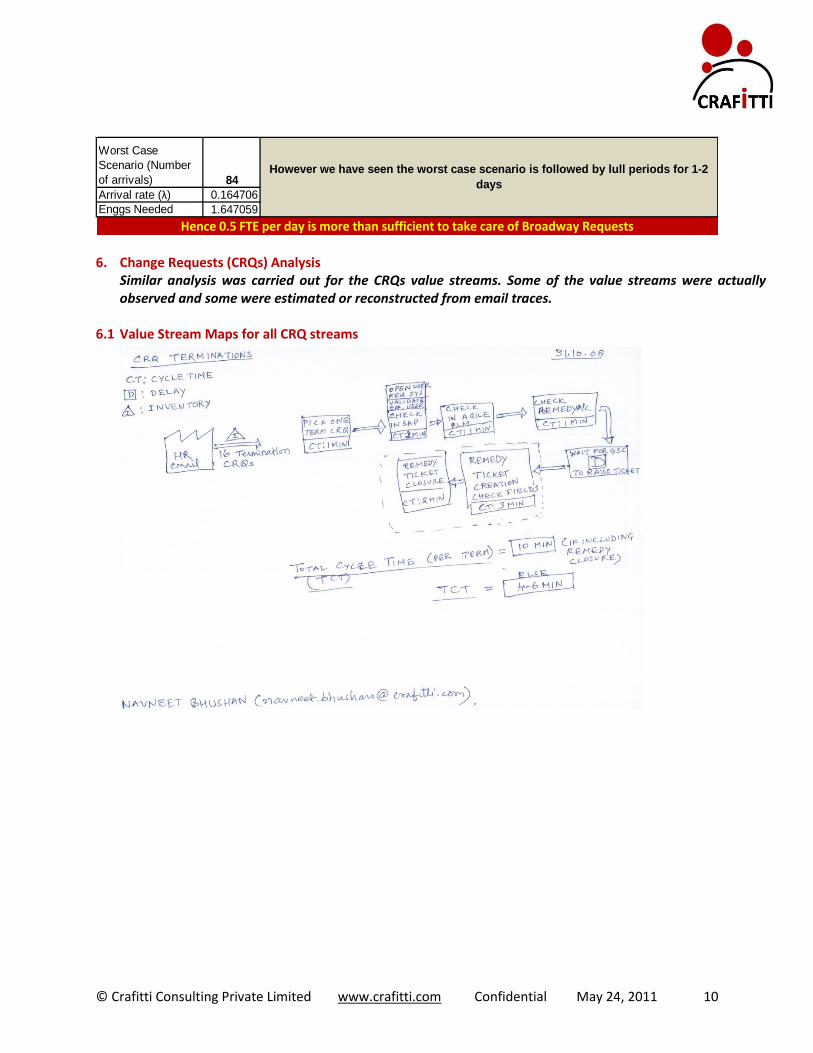
Worst Case
Scenario (Number
of arrivals) 84
Arrival rate (λ) 0.164706
Enggs Needed 1.647059
Hence 0.5 FTE per day is more than sufficient to take care of Broadway Requests
However we have seen the worst case scenario is followed by lull periods for 1-2
days
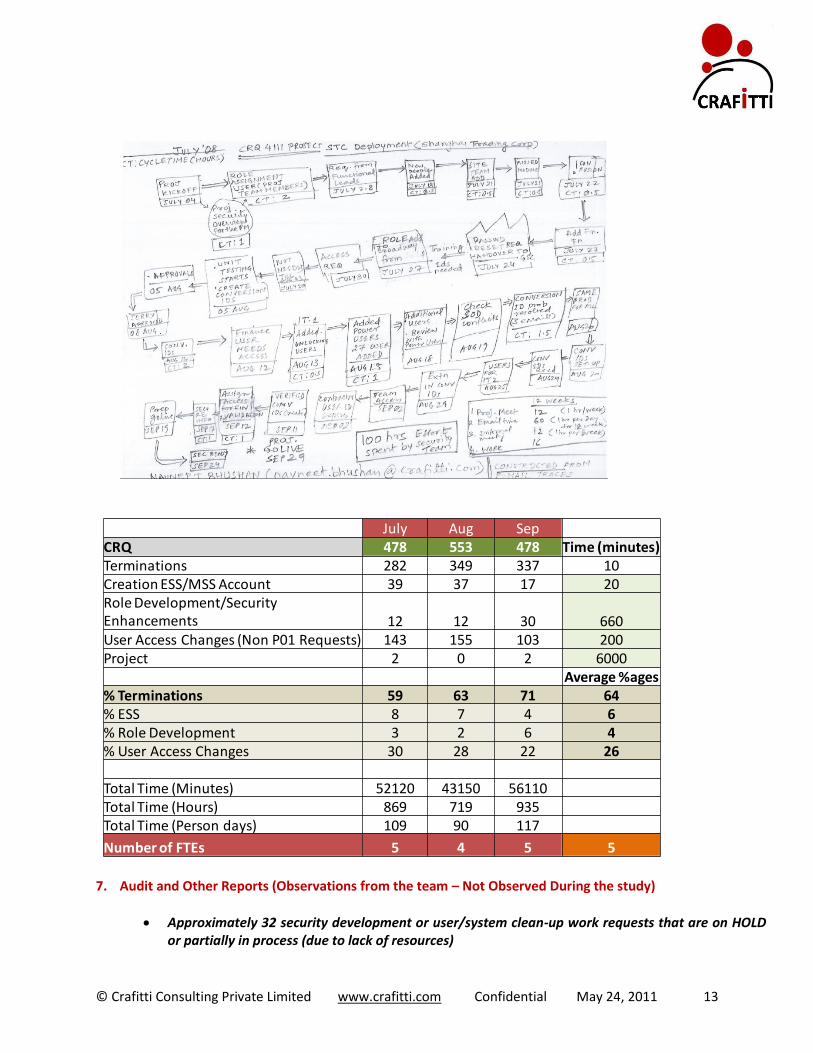
6. Change Requests (CRQs) Analysis Similar analysis was carried out for the CRQs value streams. Some of the value streams were actually observed and some were estimated or reconstructed from email traces.
6.1 Value Stream Maps for all CRQ streams
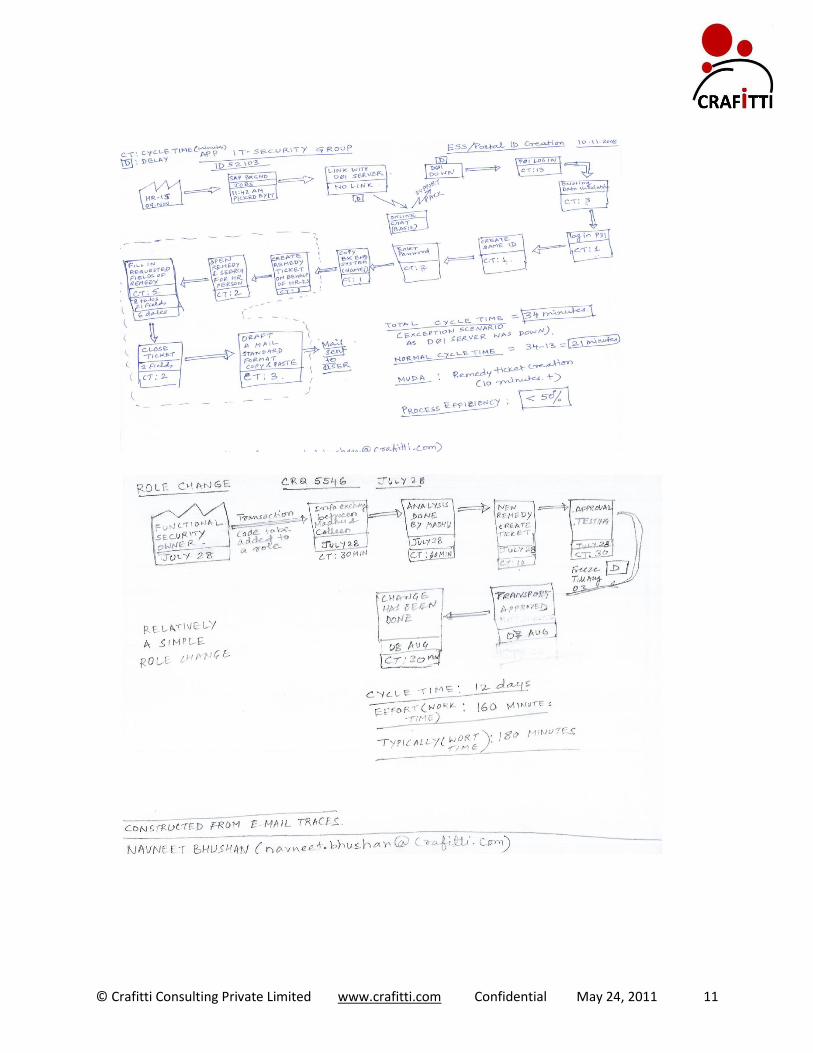
© Crafitti Consulting Private Limited www.crafitti.com Confidential May 24, 2011 11
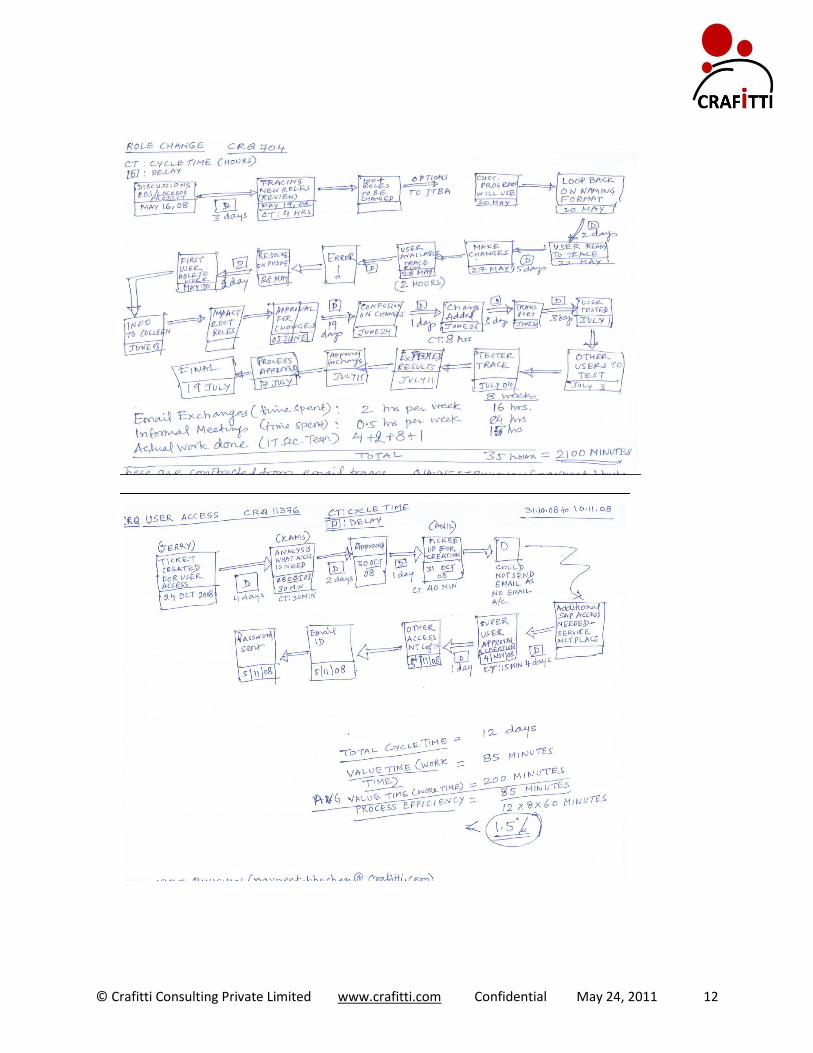
© Crafitti Consulting Private Limited www.crafitti.com Confidential May 24, 2011 12
© Crafitti Consulting Private Limited www.crafitti.com Confidential May 24, 2011 13
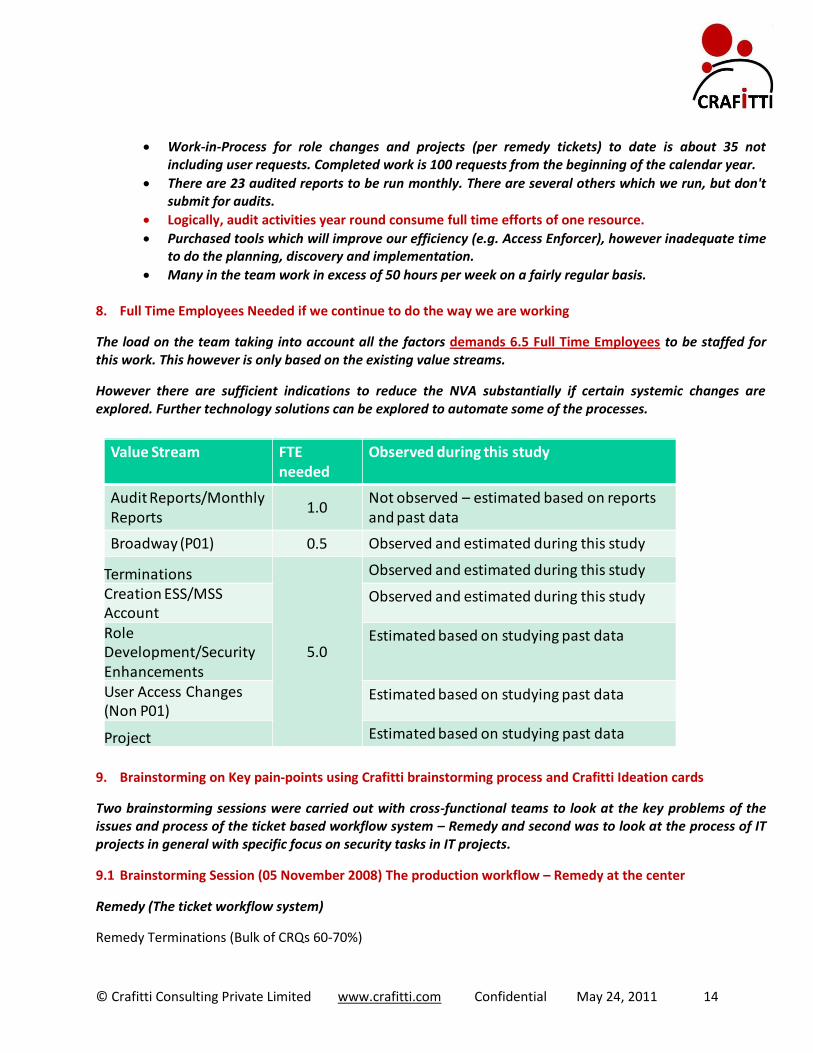
July Aug SepCRQ 478 553 478 Time (minutes)Terminations 282 349 337 10Creation ESS/MSS Account 39 37 17 20Role Development/Security Enhancements 12 12 30 660User Access Changes (Non P01 Requests) 143 155 103 200Project 2 0 2 6000
Average %ages% Terminations 59 63 71 64% ESS 8 7 4 6% Role Development 3 2 6 4% User Access Changes 30 28 22 26
Total Time (Minutes) 52120 43150 56110Total Time (Hours) 869 719 935Total Time (Person days) 109 90 117
Number of FTEs 5 4 5 5
7. Audit and Other Reports (Observations from the team – Not Observed During the study)
Approximately 32 security development or user/system clean-up work requests that are on HOLD or partially in process (due to lack of resources)
© Crafitti Consulting Private Limited www.crafitti.com Confidential May 24, 2011 14
Work-in-Process for role changes and projects (per remedy tickets) to date is about 35 not including user requests. Completed work is 100 requests from the beginning of the calendar year.
There are 23 audited reports to be run monthly. There are several others which we run, but don't submit for audits.
Logically, audit activities year round consume full time efforts of one resource.
Purchased tools which will improve our efficiency (e.g. Access Enforcer), however inadequate time to do the planning, discovery and implementation.
Many in the team work in excess of 50 hours per week on a fairly regular basis.
8. Full Time Employees Needed if we continue to do the way we are working
The load on the team taking into account all the factors demands 6.5 Full Time Employees to be staffed for this work. This however is only based on the existing value streams.
However there are sufficient indications to reduce the NVA substantially if certain systemic changes are explored. Further technology solutions can be explored to automate some of the processes.
Value Stream FTE needed
Observed during this study
Audit Reports/Monthly Reports
1.0Not observed – estimated based on reports and past data
Broadway (P01) 0.5 Observed and estimated during this study
Terminations
5.0
Observed and estimated during this study
Creation ESS/MSS Account
Observed and estimated during this study
Role Development/Security Enhancements
Estimated based on studying past data
User Access Changes (Non P01)
Estimated based on studying past data
Project Estimated based on studying past data
9. Brainstorming on Key pain-points using Crafitti brainstorming process and Crafitti Ideation cards
Two brainstorming sessions were carried out with cross-functional teams to look at the key problems of the issues and process of the ticket based workflow system – Remedy and second was to look at the process of IT projects in general with specific focus on security tasks in IT projects.
9.1 Brainstorming Session (05 November 2008) The production workflow – Remedy at the center
Remedy (The ticket workflow system)
Remedy Terminations (Bulk of CRQs 60-70%)
© Crafitti Consulting Private Limited www.crafitti.com Confidential May 24, 2011 15
• For each termination they have to check SAP, Agile and Portal and change the status there if the candidate has access
• For each Ticket 5-10 minutes are spent on closing the ticket by filling up closure information for audit purposes – This inflates the actual work by almost 100%
• Lot of information to be filled manually (almost as much time as the actual work) – ranges from 5-10 minutes
• Many time tickets created after the work for audit purpose – this also takes up substantial amount of time
Remedy ESS/Portal Id Creation (4-8% of CRQs) • For each id creation about 10 minutes (50%) are spent on doing the work and 10 minutes in creating and
closing the Remedy ticket (50% time) • For each Ticket about 10 minutes are spent on creating and closing the ticket by filling up closure
information for audit purposes – This inflates the actual work by almost 100% • Lot of information (for creating the ticket 8 tabs with 21 fields and 6 dates to be filled through a tedious
process of copy and paste) to be filled manually (almost as much time as the actual work) Remedy access is painfully slow and may be the VPN connection bandwidth also needs to be looked at.
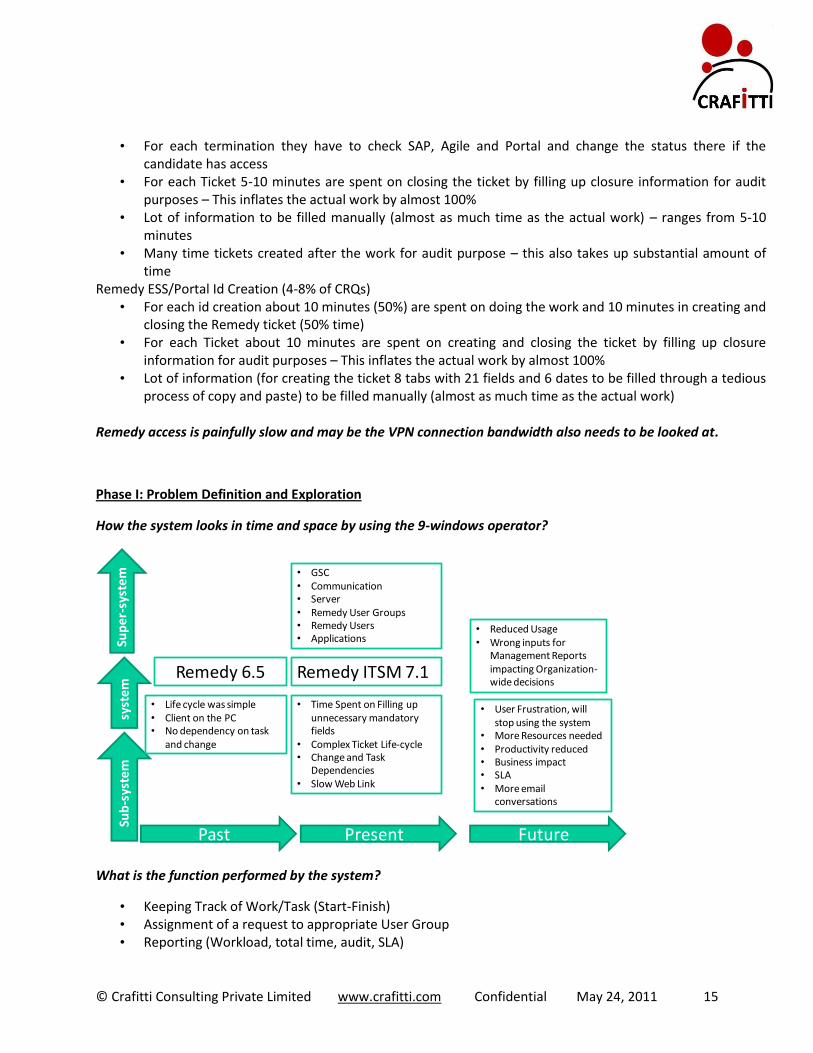
Phase I: Problem Definition and Exploration
How the system looks in time and space by using the 9-windows operator?
Remedy ITSM 7.1
• Time Spent on Filling up unnecessary mandatory fields
• Complex Ticket Life-cycle• Change and Task
Dependencies• Slow Web Link
• GSC• Communication• Server• Remedy User Groups• Remedy Users• Applications
Past Present Future
Remedy 6.5
• Reduced Usage• Wrong inputs for
Management Reports impacting Organization-wide decisions
• User Frustration, will stop using the system
• More Resources needed• Productivity reduced• Business impact• SLA• More email
conversations
Sub
-sys
tem
syst
em
Sup
er-
syst
em
• Life cycle was simple• Client on the PC• No dependency on task
and change
What is the function performed by the system?
• Keeping Track of Work/Task (Start-Finish) • Assignment of a request to appropriate User Group • Reporting (Workload, total time, audit, SLA)
© Crafitti Consulting Private Limited www.crafitti.com Confidential May 24, 2011 16
• Implement Change Management Process What is the IDEAL FINAL RESULT – so that the function is achieved with no cost, no extra resources and no
harm to the system?
(Appropriate/Needed) information capture should happen without manual intervention
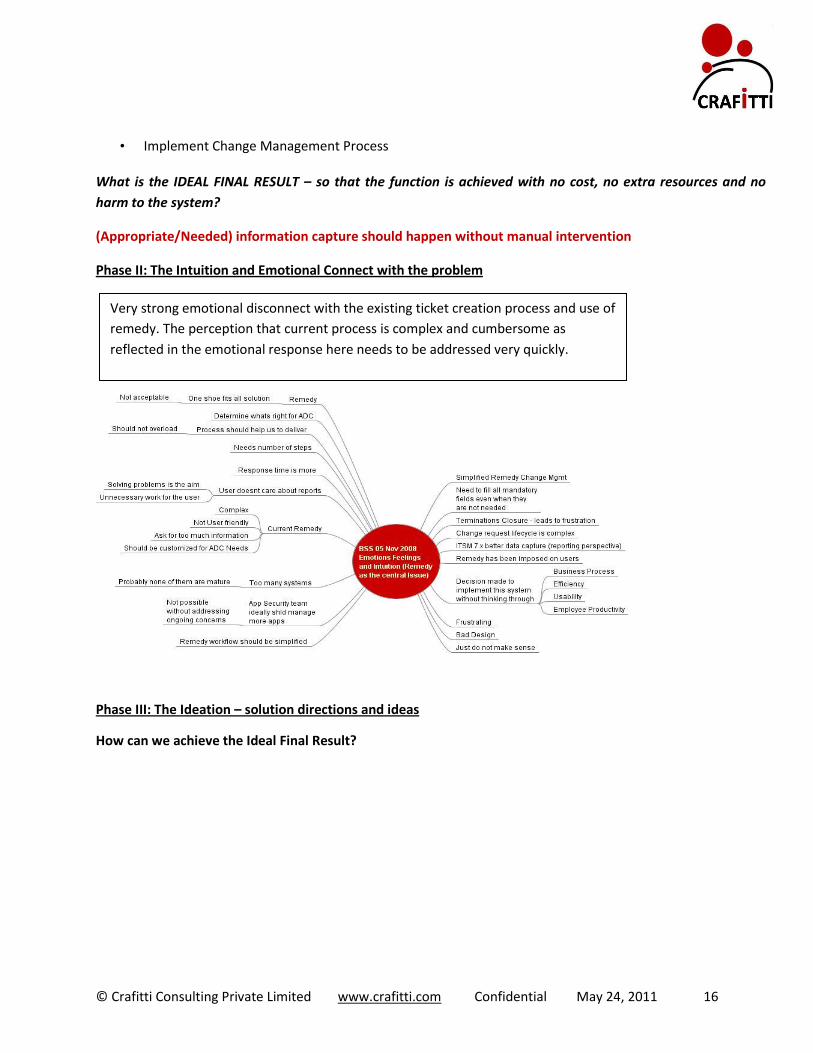
Phase II: The Intuition and Emotional Connect with the problem
Phase III: The Ideation – solution directions and ideas
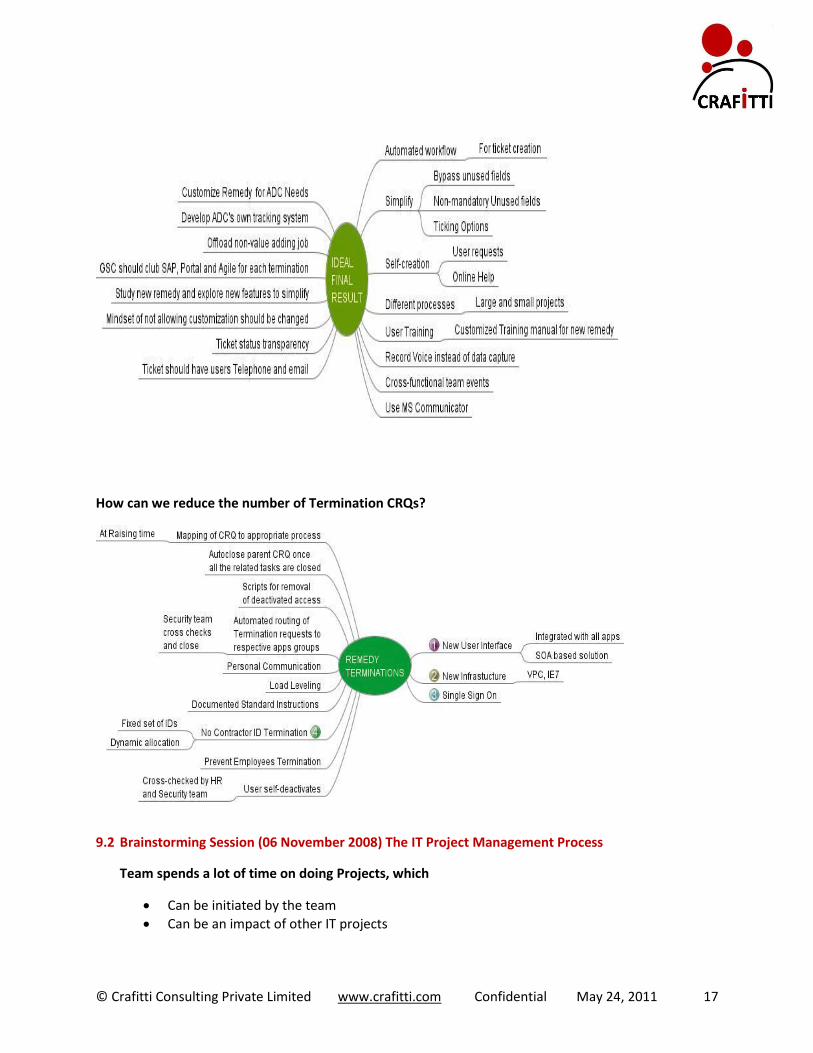
How can we achieve the Ideal Final Result?
Very strong emotional disconnect with the existing ticket creation process and use of
remedy. The perception that current process is complex and cumbersome as
reflected in the emotional response here needs to be addressed very quickly.
© Crafitti Consulting Private Limited www.crafitti.com Confidential May 24, 2011 17
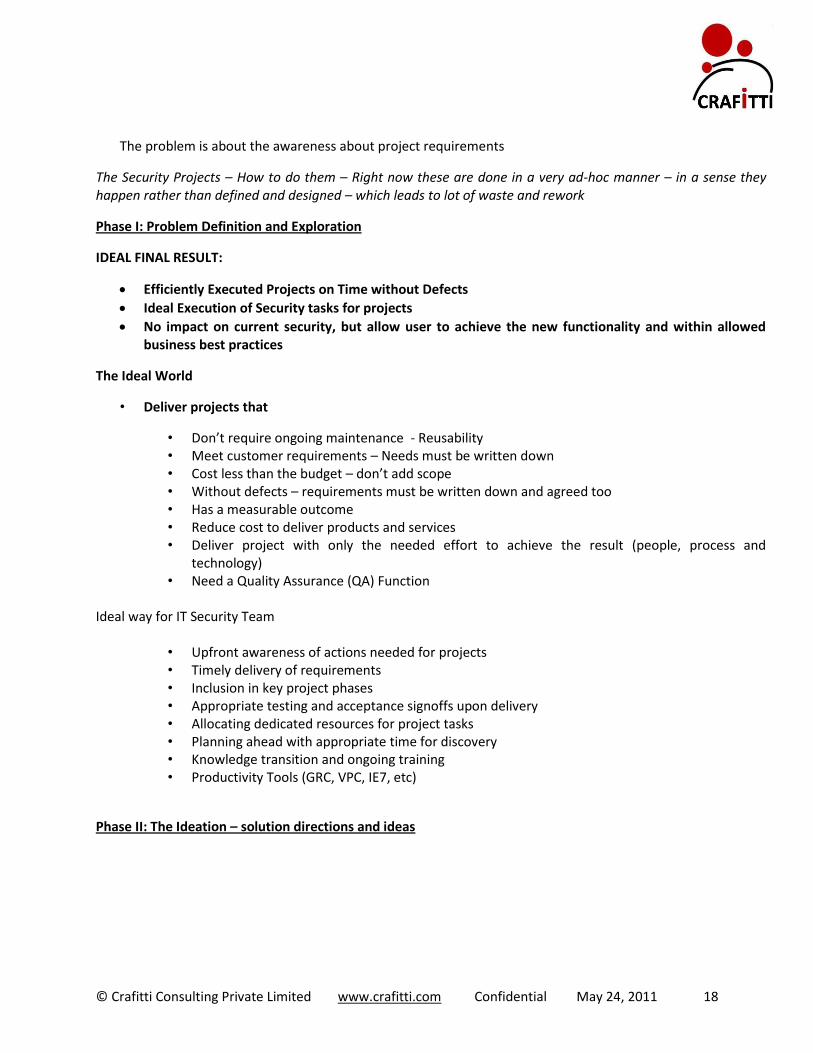
How can we reduce the number of Termination CRQs?
9.2 Brainstorming Session (06 November 2008) The IT Project Management Process
Team spends a lot of time on doing Projects, which
Can be initiated by the team
Can be an impact of other IT projects
© Crafitti Consulting Private Limited www.crafitti.com Confidential May 24, 2011 18
The problem is about the awareness about project requirements
The Security Projects – How to do them – Right now these are done in a very ad-hoc manner – in a sense they happen rather than defined and designed – which leads to lot of waste and rework
Phase I: Problem Definition and Exploration
IDEAL FINAL RESULT:
Efficiently Executed Projects on Time without Defects
Ideal Execution of Security tasks for projects
No impact on current security, but allow user to achieve the new functionality and within allowed business best practices
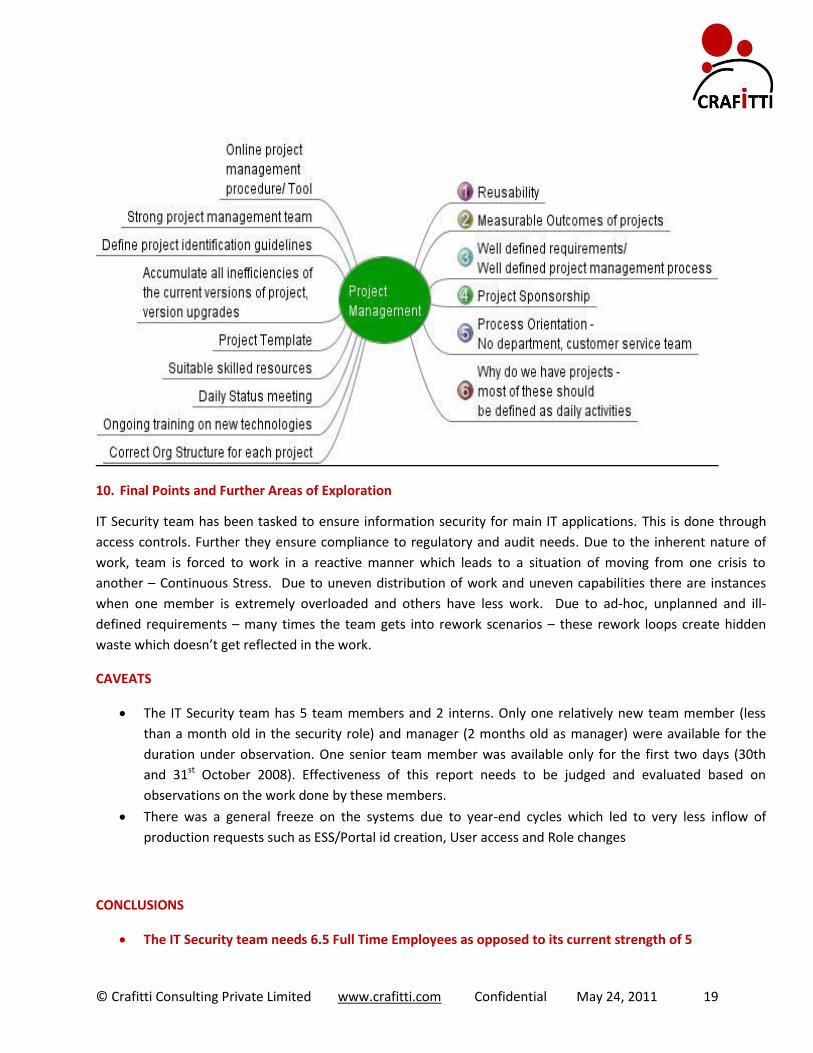
The Ideal World
• Deliver projects that
• Don’t require ongoing maintenance - Reusability • Meet customer requirements – Needs must be written down • Cost less than the budget – don’t add scope • Without defects – requirements must be written down and agreed too • Has a measurable outcome • Reduce cost to deliver products and services • Deliver project with only the needed effort to achieve the result (people, process and
technology) • Need a Quality Assurance (QA) Function
Ideal way for IT Security Team
• Upfront awareness of actions needed for projects • Timely delivery of requirements • Inclusion in key project phases • Appropriate testing and acceptance signoffs upon delivery • Allocating dedicated resources for project tasks • Planning ahead with appropriate time for discovery • Knowledge transition and ongoing training • Productivity Tools (GRC, VPC, IE7, etc)
Phase II: The Ideation – solution directions and ideas
© Crafitti Consulting Private Limited www.crafitti.com Confidential May 24, 2011 19
10. Final Points and Further Areas of Exploration
IT Security team has been tasked to ensure information security for main IT applications. This is done through
access controls. Further they ensure compliance to regulatory and audit needs. Due to the inherent nature of
work, team is forced to work in a reactive manner which leads to a situation of moving from one crisis to
another – Continuous Stress. Due to uneven distribution of work and uneven capabilities there are instances
when one member is extremely overloaded and others have less work. Due to ad-hoc, unplanned and ill-
defined requirements – many times the team gets into rework scenarios – these rework loops create hidden
waste which doesn’t get reflected in the work.
CAVEATS
The IT Security team has 5 team members and 2 interns. Only one relatively new team member (less
than a month old in the security role) and manager (2 months old as manager) were available for the
duration under observation. One senior team member was available only for the first two days (30th
and 31st October 2008). Effectiveness of this report needs to be judged and evaluated based on
observations on the work done by these members.
There was a general freeze on the systems due to year-end cycles which led to very less inflow of
production requests such as ESS/Portal id creation, User access and Role changes
CONCLUSIONS
The IT Security team needs 6.5 Full Time Employees as opposed to its current strength of 5
© Crafitti Consulting Private Limited www.crafitti.com Confidential May 24, 2011 20
The Ticket Workflow process and the way Remedy is used and integrated needs to be relooked in
comprehensive details. In fact, the idea of using SOA based solution to integrate all apps may actually
reduce the effort needed for manual rework by more than 50%.
The IT Project Management process needs an end-to-end relook and study and may well help
streamline some of the security projects or tasks related to IT Projects
In the true spirit of LEAN THINKING, frontline troops should be geared-up and trusted to solve
problems without many approvals. Kaizen should become regular day-to-day approach!
*****