k l krishna - cdedse.org · issn no. 2454 – 1427. cde . october 2016 . structural changes in...
TRANSCRIPT
ISSN No. 2454 – 1427
CDE October 2016
STRUCTURAL CHANGES IN EMPLOYMENT IN INDIA, 1980-2011
K L KRISHNA Email: [email protected]
Centre for Development Economics, Delhi School of Economics, Delhi, India
SURESH CHAND AGGARWAL Email: [email protected]
Department of Business Economics, University of Delhi, South Campus, India
ABDUL AZEEZ ERUMBAN Email: [email protected] The Conference Board, Brussels, Belgium
Faculty of Economics and Business, University of Groningen, the Netherlands
DEB KUSUM DAS Email: [email protected]
Department of Economics, Ramjas College, University of Delhi, India
Working Paper No. 262
http://www.cdedse.org/pdf/work262.pdf
CENTRE FOR DEVELOPMENT ECONOMICS DELHI SCHOOL OF ECONOMICS
DELHI 110007

1
Structural Changes in Employment in India, 1980-2011
K L KRISHNA Centre for Development Economics, Delhi School of Economics, Delhi, India
SURESH CHAND AGGARWAL* Department of Business Economics, University of Delhi, South Campus, India
ABDUL AZEEZ ERUMBAN The Conference Board, Brussels, Belgium
& Faculty of Economics and Business, University of Groningen, the Netherlands DEB KUSUM DAS
Department of Economics, Ramjas College, University of Delhi, India
Abstract
The paper documents the growth of employment and the structural changes in Indian economy during 1980-2011 period using India KLEMS database version 2015. Issues related to labor quality have also been documented and analyzed. We observe that employment grew at 2.1 percent per year during 1980-1993 but it fell to 1.6 percent during 1994-2002 and further to just 1 percent during 2003-2011. The growth in persons employed during the entire period of study, 1980-2011 is led by construction and the services sector, possibly due to less labor regulations, followed by the secondary sector-consisting of manufacturing, electricity; gas and water supply and then agriculture. There has been a structural shift of employment from agriculture to construction and services, especially market-based services. The plausible reasons for slow growth in employment have been low labor force participation rates, especially by females, low labor intensity, and use of high capital intensive technology in production. The quality of labor in India is characterized by the poor among the employed, low share of persons employed with skills (employed persons with education level “above higher secondary” was only 10.2% in 2011 in the total economy), low growth rate in educational attainments, high proportion of persons employed as casual labor and a very high share of unorganized sector employment. Though the Indian economy is supposed to enjoy the fruits of demographic dividend and achieve high growth rates but the recent trend of falling employment elasticity (just 0.07 during 2003-2011) paints a very disappointing employment scenario. Even the sustainability of the service sector to provide jobs in future is in doubt because of its falling employment elasticity in recent years.
Key words: employment, labor quality, education, employment elasticity JEL classification: I20
October 2016 ----------------------------------------------------------------------------------------------------------------------
This paper is a revised version of the paper prepared as part of the deliverables 2015 of the “Disaggregate Industry Level Productivity Analysis for India: The KLEMS Approach” research project at Centre for Development Economics (CDE), Delhi School of Economics. We are thankful to Bishwanath Goldar for research advice. Research support by Sreerupa Sengupta, Pilu Chandra Das, and Sanghita Mondal is acknowledged. The authors also wish to thank all the participants of the annual workshop in CDE on December 17, 2015. Special thanks are due to Prof Santosh Mehrotra, Prof Simrit Kaur, and Prof Arup Mitra for providing their very valuable comments and suggestions. The authors gratefully acknowledge the financial support from Reserve Bank of India in building the India KLEMS dataset. The usual disclaimer applies. *The corresponding author can be contacted at: [email protected]
2
I: Introduction Job creation is an essential aspect of economic development, and it has been one of the major policy priorities for national governments and international agencies. For instance, achieving full and productive employment and decent work for all was included as a sub-goal in the Millennium Development Goals (MDG1) in 2000. In addition to generating productive employment along with full employment and decent employment, Felipe and Hasan (2006) and Felipe (2010) emphasize the importance of reducing pervasive underemployment in developing countries.1 Yet, lack of adequate job creation is still a major problem for many economies. The problem has been worsening in several countries owing to a number of factors, including several changes in the structure of labor market and the impact of recent financial crisis on several advanced economies. From a policy perspective, it appears that the goal of achieving full employment has been abandoned by most of the central banks in developed and developing world in favor of price stability because of potential trade-off between full employment and price stability as enunciated by Philips curve (Felipe, 2010).2 Often, it is also argued that the process of globalization has led to “precarization” of labor in many countries (ILO, 2014), which includes the rise of so-called “atypical” employment agreements such as temporary contracts, part-time work and subcontracts. Hoeven (2014) summarizes six labor market trends which have been globally witnessed over the years: (i) a decline in the employment to population ratio partly due to low female labor participation rate, (ii) changing pattern of production, as the employment shifted from industry to services, (iii) existence of a large and pervasive “informal sector”3 especially in developing countries, (iv) declining wage share and growing wage inequality, (v) internationalization of the production process, and (vi) international migration.
There are significant differences in the quality of jobs created across countries, industries, and gender, and these differences have been nurtured by a number of factors such as socio-cultural perceptions, technology, and industry structure. In general, the importance of low-skilled manufacturing as a job provider has eroded significantly (Fox & Gaal, 2008). Inter-sectoral movement of workers—which is often called the process of structural change—is often hindered by lack of adequate skill, making it imperative to focus on enhancing skill and achieving more flexibility for worker mobility.4 The International Labor Organization (2011) argues that during the recent financial crisis, employment fell globally in industry but increased in agriculture providing a buffer. In many countries including India there are many who are employed, but are still poor—40 percent of the worldwide workers—implicitly suggesting that the link between growth and employment, especially “good” employment that may reduce poverty, is not automatic. 1They distinguish four types of underemployment: (i) working limited hours; (ii) high skilled workers being forced to take up low paying jobs- mismatch of skills demanded and supplied; a phenomenon very common in Indian labour market; (iii) overstaffing- which till few years back was a common sight in many public sector undertakings in India and was supposed to be one of the major causes of inefficiency in them; (iv) workers carrying out their work with very little capital- it is a common experience in many small and medium enterprises in India. 2 This may also be evident in the stance of RBI in India in recent times when they focused on inflation control. 3 Informal sector in India is often used as a synonym with unorganized sector. Note that this terminology is different from ‘informal employment’, as informal employment could also take place in organized or formal sector. We use these terms to distinguish between sectors, rather than job characteristics. 4 In India the inter-sectoral movement of workers is also hindered by the lack of growth of non-agricultural jobs.

3
This paper makes an attempt to understand the dynamics in Indian employment scenario during the period 1980 to 2011. Three sub-periods5 1980-93, 1994-2002 and 2003-11 are considered. The paper presents a comprehensive picture of employment trends using disaggregate industry level data from India KLEMS data base version 2015.6 In the second section of the paper, we discuss the growth and structure of employment, and in the third section, we address the question of quality of employment– are jobs in India predominantly decent ones? This question is addressed by examining various indicators such as compensation paid to workers, and casualization and informalization of labor. We have also examined the change in the quality of available employment by change in the educational attainment of workers. In section four, the likely impediments and the potential of employment in India are examined by analyzing employment elasticity. The final section concludes the paper.
II: Growth in Employment and Its Changing Structure
Indian economy has witnessed remarkable growth surge during the last two decades (Das et al., 2015). Moreover, it has turned out to be the fastest growing economy in the world in 2016 (IMF, 2015; The Conference Board, 2015). The economy has shown a lot of resilience to several external shocks in the recent period. It came out of the impact of the 2008 global financial crisis quickly as compared to many advanced economies. The acceleration of growth in the past two decades has been attributed to substantial policy changes initiated in the early 1990s, and continued through the 2000s. The pattern of India’s economic growth during different policy regimes has been summarized in many studies (e.g., Krishna, 2015; Jha, 2015). The GDP growth rate has been quite remarkable during the period 2001-2011 at 7.9 percent as compared to 5.6 percent during the earlier decade of 1991-2001 (Krishna, 2015). During 2001-2011period, industrial sector grew at 7.8 percent whereas services registered an impressive annual average growth of 9.4 percent. Consequently, some economists have defined this period as period of service-led growth in India (Ghose, 2015; Das et al., 2015). This fast growth of the service sector relative to the industrial sector, obviously resulted in a structural transformation featured by a larger share of services sector in the overall GDP, and several aspects of this structural transformation has been analyzed in the literature (Kochhar et al., 2006; Islam, 2008; Papola & Sahu, 2012; Krishna, 2015; Chandrasekhar, 2015; Erumban et al., 2015). The GDP share7 of the primary sector has declined to just 13.94 percent in 2013-2014 (at 2004-05 prices) from 29.53 percent in 1990-91. The share of the services sector, on the other hand, has increased from 42.55 percent to 59.93 percent and the share of the secondary sector decreased from 27.63 to 26.13 percent,
5 The division of the time period, 1980-80 to 2011-12 into three sub-periods follows the periodization adopted by Panagariya et al. (2014, Chapter 2) as reflecting three distinct periods of growth of the Indian Economy based on annual GDP growth, which was 2.9 percent, 3.9 percent, and 6.9 percent, respectively, in these three sub-periods. 6In India KLEMS data set 2015, a time series of employment and labor quality for the period 1980 to 2011 have been constructed for 27 industries comprising the Indian economy by using NSSO’s Employment and Unemployment Survey data from the major rounds and the series has been interpolated for mid-point of the financial year, i.e., October 1. Employment is measured by usual principal and subsidiary status (UPSS). For the detailed methodology se Aggarwal and Erumban (2013). 7 Source: Planning Commission, GOI (2015)

4
with the share of manufacturing decreasing from 15.08 percent to 14.94 percent.8 Clearly the structural transformation has bypassed the secondary sector and has been from the primary to the tertiary sector. It therefore has been quite unique in history.9 The uniqueness becomes sharper if we compare India’s growth path with that of China. While India attempted to leapfrog from a predominantly agricultural economy to a knowledge-based service economy, China followed a conventional path in transiting from an agricultural economy to a robust industrial economy and now gradually moving towards developing a strong service sector. Since China achieved higher growth as compared to India, the importance of a conventional structural change cannot be fully dismissed.10 In the subsequent discussions in this section, we look at the growth and structure of employment in India and its changes over time. Despite the faster growth in GDP, labor growth—both in terms of quantity and quality has been unsatisfactory. Therefore, doubts have been expressed about the impact of GDP growth on the labor market and employment situation in the country. For instance, concerns have been expressed about “jobless growth”11 in organized manufacturing (Mazumdar & Sarkar, 2008) on two counts. The organized sector was expected to take lead in generating new productive employment and with better standards of living. Also, several studies have tried to analyze and find explanations for the peculiar labor market characteristics (Papola & Sharma, 2015; Unni, 2015; Jha, 2015). They find that not only Indian labor market has small segment of organized labor and a large portion of unorganized labor, but is also “rigid” due to labor market regulations.
II.1 Growth of Persons Employed
In this section, we discuss the growth of employment measured as ‘total persons employed’ during the period 1980-2011. As mentioned before, all the employment estimates in this paper have been taken from India KLEMS database which has obtained employment numbers from Employment and Unemployment Survey (EUS) by National Sample Survey Office (NSSO) in the survey rounds for years 1983, 1993-94, 1999-00, 2004-05, 2009-10 and 2011-12 and has used UPSS (Usual Principal and Subsidiary Status) activity status.12 In Figure 1, we provide the aggregate economy employment numbers for various NSSO rounds. In 2011-2012, India had 472.9 million workers out of total population of 1,227.4 million. The increase in employment was very impressive between 1983 and 1993-1994 when 71 million more jobs were added but the pace slowed down between 1993-1994 and 1999-2000, when only 24 million more workers were added. Employment generation however, accelerated
8 With a change in base to 2011-12 and in methodology, the new shares in 2013-14 at 2011-12 prices, are 17.22 percent, 31.68 percent (18.08% for manufacturing), and 51.09 percent, respectively, for Agriculture & allied, Industry, and Services sector. 9Kaldor (1970), Cornwall (1977) and Syrquin (1986) observe that when overall growth accelerates, manufacturing typically leads the way and grows faster than other sectors. For a discussion of India’s unique experience, see Krishna (2015) and Erumban et al (2015). 10 For China and India comparison, see Krishna (2015), Bosworth and Collins (2008), Basu (2015) and Nagraj (2005). 11Kannan and Raveendran (2009) however show that “jobless’ growth has not been uniform in all 22 industry groups of the organized sector. 12Although Population Census also provides estimates of workers- main and marginal workers every ten years, but main plus marginal workers are not equal to UPSS estimates by NSSO and have been divergent. NSSO estimates are considered more reliable and consistent for employment and the related policy matters, so have been used in KLEMS study

5
during the period of 1999-2000 to 2004-2005 when 59.5 million more jobs were added.13 Economists attributed this acceleration to the success of the economic reforms, though doubts were expressed about the quality of employment in terms of type of jobs (e.g., self-employed), education level of workers, growth of wages and “working poor” (Chandrasekhar and Ghosh, 2006; Papola, 2008; Sarkar and Mehta, 2010; Thomas, 2011). It is also often argued that the increase in employment during the period 1993-94 to 2004-05 has helped reduce poverty in India from 36.0 percent in 1993-94 to 27.5 percent in 2004-05 (Papola and Sharma, 2015). However, the employment growth decelerated significantly between 2004-2005 (61st round of NSSO) and 2009-2010 (66th round of NSSO) and only 1 million jobs14 were created during this period despite impressive GDP growth. A slight revival in employment growth however took place between 2009-2010 and 2011-2012, when an additional 14 million jobs were added and poverty further declined to 21.9 percent in 2011-2012. The employment growth during 2009-2010 and 2011-2012 is partially attributed to the base effect of 2009-2010 being a drought year.
Figure 1: Estimates of persons employed (UPSS) (million)
Source: NSSO employment and unemployment surveys, various rounds and India KLEMS dataset version 2015.
However, growth of overall employment does not give a complete picture for a country like India which has a large agriculture sector along with non-agriculture sectors. It is all the more important because the rate of employment growth varies significantly across industries and over time reflecting a structural change. The employment growth rates in the six broad sectors of the economy and for the total economy for the entire period 1980-2011, and for the three sub-periods 1980-93, 1994-2002, and 2003-2011, are given in Table 1. For the entire period, the trend annual rate of growth of employment in the overall economy is 1.63
13 Though 20 million of these were employed in agriculture, and employment in agriculture started falling in absolute number only since 2005. 14 Refer to Mehrotra, et al. (2014) for more details on shift of employment from agriculture to construction.
6
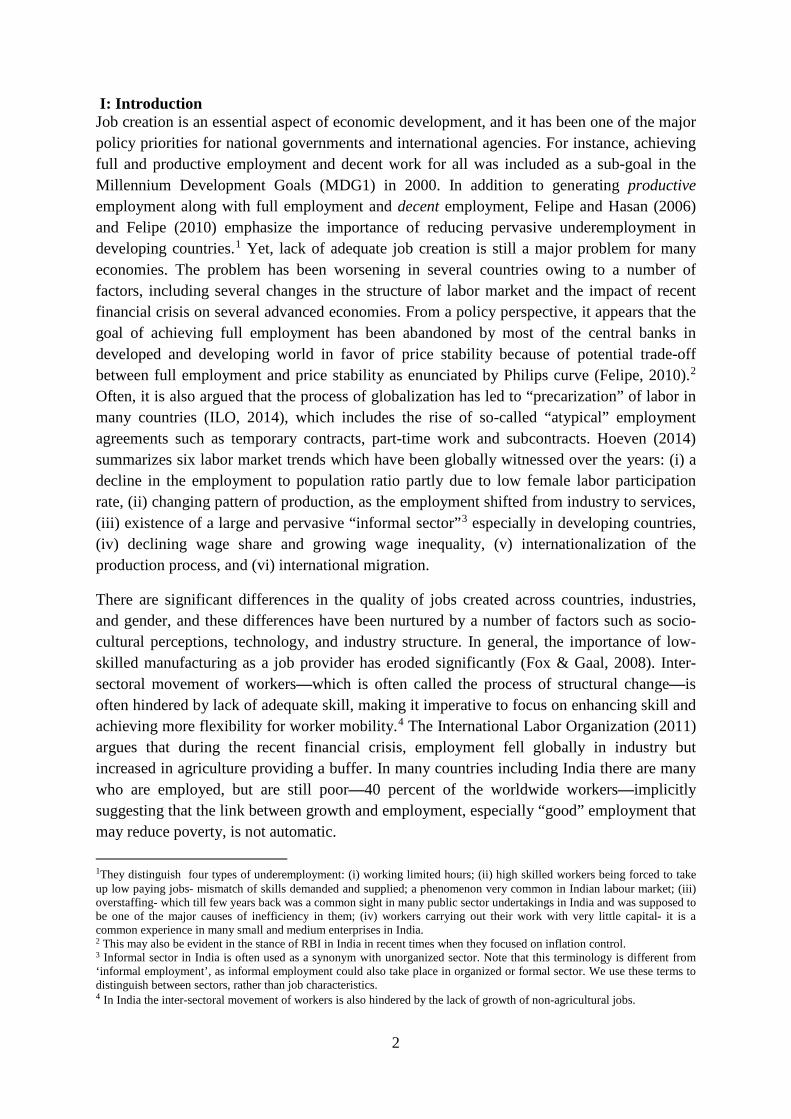
percent.15 However, there have been significant differences in employment growth across sectors of the Indian economy. While some sectors grew fast, others remained stagnant during this period. Employment in agriculture grew at more than 1 percent during the pre-reform period of 1980 to 1993 but stagnated at 0.52 percent during the first phase of reforms (1994-2002) and decelerated at -1.12 percent during 2003 to 2011. Consequently its share in total employment has reduced from almost 70 percent in 1980 to less than a half in 2011. Employment in mining &quarrying sector grew at 1.82 percent during the entire period and showed a recovery in employment growth in the recent period of 2003-2011 as compared to the first phase of reforms when it showed a negative trend in employment growth.
Table 1: Growth Rate of Persons Employed in Broad Sectors and Total Economy, 1980-1993, 1994-2002, 2003-2011, and 1980-2011. (Percent per annum)
Broad Sector/Period 1980-93 1994-2002 2003-11 1980-11
Agriculture, Forestry and Fishing 1.44 0.52 -1.12 0.43
Mining and Quarrying 4.27 -0.78 0.87 1.82
Manufacturing 2.18 2.24 1.23 1.92
Electricity, Gas and Water Supply 4.39 -1.63 2.84 2.19
Construction 5.79 6.60 9.08 6.98
Services 3.73 3.29 3.00 3.39
Total Economy 2.09 1.57 1.04 1.63
Source: Authors’ calculations from India KLEMS dataset, 2015. Over the period 1980-2011, the employment growth is driven mainly by the construction and the services sectors whereas the agriculture sector was a laggard (Table 1). Employment growth in construction has been high and increasing. Manufacturing employment grew slower but it grew relatively faster than in Agriculture. The growth rate of manufacturing employment has been around 2 percent during the first two sub-periods. Though the employment generation in the services sector has not been as spectacular as the GDP growth in the sector,16 Ghose (2015) argues that the services has generated better quality employment. Though the employment in services grew at a rate of 3.4 percent as against the aggregate employment growth of 1.63 percent, the growth marginally stagnated in the last sub-period of 2004 to 2011. In the second period of 1994-2003, Agriculture, Mining and Electricity sectors pulled back the employment growth in the economy, with deceleration in growth in Mining and Electricity sectors. Part of the reason for poor performance by Agriculture is ascribed to lack of investment in agriculture, lagging research and development efforts, rising soil degradation and over exploitation of ground water, economically non-
15The annual employment series is constructed by interpolation between the NSSO survey periods. Since the mid-year in NSSO survey corresponds to 1st January in all except the 1983 round, we have shifted it to 1st October by interpolation so as to make it compatible with National Accounts Statistics. Similarly all concordances between different National Industry Classification (NIC) codes in different rounds is made compatible with National Accounts Statistics. 16 The Services sector GDP grew at 7.3 percent during the period. Ghose (2015) describes this tendency as a colonial legacy when in British India the share of services in employment was far below the share in GDP.

7
viable land holdings, lack of coherent long-term policy and poor labor productivity because of surplus labor and use of old technology (Kapila, 2015).
In absolute numbers, out of a total increase in employment of around 64 million persons between 2000 and 2011, around half, an increase of more than 32 million was in the construction sector alone. The additional employment in manufacturing was only 15 million workers between 1999-2000 and 2011-2012. The other major contributor to growth in employment was the service sector—both market and nonmarket services. The non-agriculture employment increased by 5.9 million a year between 1993-1994 and 2004-2005 and it further went up to 6.9 million a year during 2004-2005 to 2011-2012.
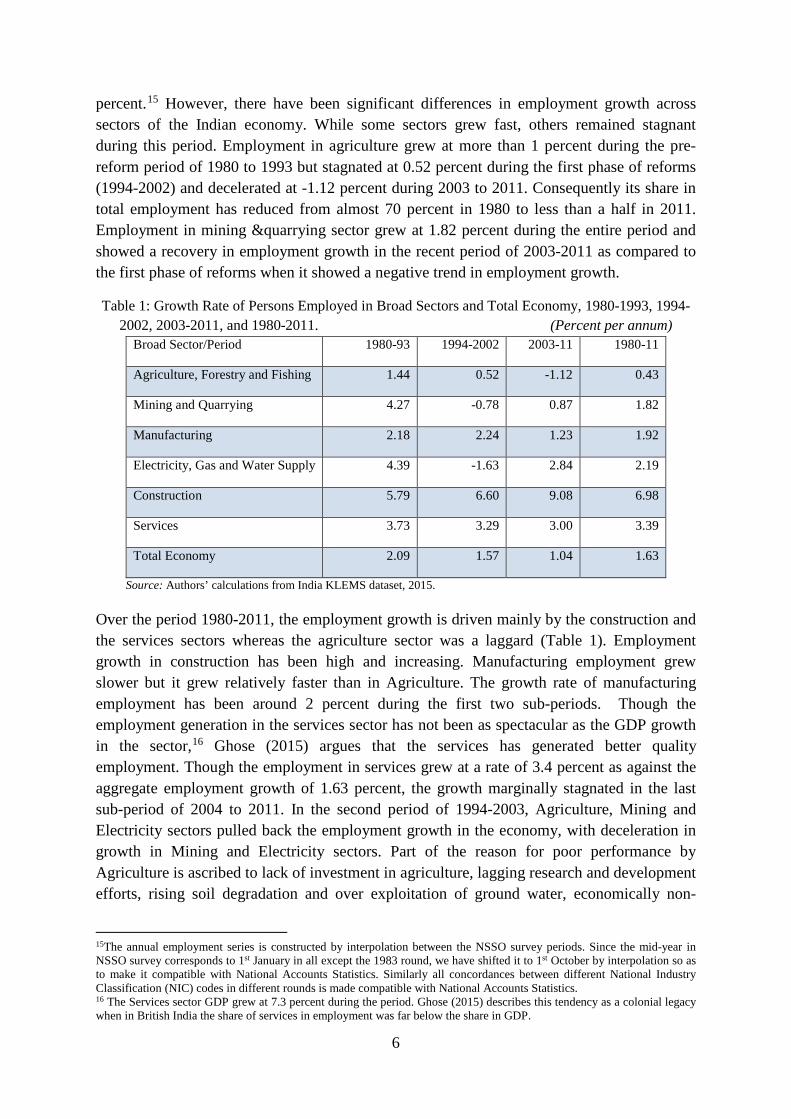
Among the industries in the manufacturing sector (Table 2) only a few industries showed fast growth rate in employment. These industries include rubber & plastic products, machinery, nec, electrical & optical equipment, coke, refined petroleum and pulp & paper each growing at 3 percent per annum. At the other extreme, in some industries employment growth was quite slow. These include textiles and leather products, wood and products of wood, food products, basic metals, and chemicals. As a result the share of manufacturing in total employment has remained relatively stagnant.
Business Services and Construction are two important industries which consistently experienced fast employment growth and even touched 9 percent in the recent period (2003-2011). Construction, a sector with extremely low labor productivity (see Erumban et al., 2015), seem to be attracting more workers from the agricultural sector perhaps due to the low skill requirement of this sector. Most of the industries in the services sector, except public administration grew at an average growth rate of above 3 percent during the last three decades. Employment in public administration actually shrunk since 1994. Several industries in the services sector like trade, hotels and restaurants, transport services, post and telecommunication, financial services, education, health and other services registered fast employment growth in the sub- periods. But all except financial services and other services experienced a slowdown in the growth of employment in the last sub-period of 2004-2011 as compared to the previous sub-period of 1994-2003. Attention has to be paid to tap the employment potential of this sector so as to absorb the shift of labor from agriculture.
The serious problem which India is now facing in terms of employment growth is the relatively slow employment growth in the current sub-period as compared to the last two sub-periods. Most sectors have registered a decline in the rate of employment growth in the recent period17 except transport equipment, manufacturing, nec., electricity, gas and water supply, construction, financial intermediation, and other services. Only transport equipment, other services, construction and financial intermediation experienced a real surge in employment growth. A meaningful employment policy has to recognize the dynamics of the employment potential of each industry and take necessary measures to tap their potential.
17The insignificant increase in employment between 2004 and 2009 is generally ascribed to sharp decline in labour force
participation rates (LFPR) (Papola, 2012).
8
Table 2: Growth Rates of Persons Employed by Industry, 1980-93, 1994-2002, 2003-2011, and 1980-2011(percent per annum)
Industry No.
KLEMS Industry/Period 1980-93 1994-2002 2003-11 1980-11
1 Agriculture, Forestry and Fishing 1.44 0.52 -1.12 0.43
2 Mining and Quarrying 4.27 -0.78 0.87 1.82
3 Food, Products, Beverages and Tobacco 2.79 1.39 0.91 1.84
4 Textiles, Textile Products, Leather and Footwear
0.52 1.98 0.02 0.80
5 Wood and Products of wood 1.57 4.47 -2.77 1.15
6 Pulp, Paper, Paper products, Printing and Publishing
2.33 4.63 0.69 2.52
7 Coke, Refined Petroleum Products and Nuclear fuel
9.11 0.04 -0.39 3.72
8 Chemicals and Chemical Products 3.93 1.61 0.19 2.17
9 Rubber and Plastic Products 7.39 3.91 2.42 4.93
10 Other Non-Metallic Mineral Products 1.58 2.37 2.35 2.03
11 Basic Metals and Fabricated Metal Products 2.24 3.16 2.28 2.52
12 Machinery, nec. 8.06 -1.76 3.90 4.00
13 Electrical and Optical Equipment 4.96 3.18 3.43 4.00
14 Transport Equipment 1.42 3.51 7.07 3.67
15 Manufacturing, nec; recycling 4.04 2.36 4.43 3.67
16 Electricity, Gas and Water Supply 4.39 -1.63 2.84 2.19
17 Construction 5.79 6.60 9.08 6.98
18 Trade 4.22 3.75 1.49 3.29
19 Hotels and Restaurants 2.91 5.36 4.17 3.99
20 Transport and Storage 4.63 4.64 2.94 4.14
21 Post and Telecommunication 5.05 8.29 1.06 4.83
22 Financial Services 6.92 2.32 5.68 5.22
23 Business Services 7.14 10.57 9.00 8.67
24 Public Administration and Defense; Compulsory Social Security
1.87 -0.52 -1.28 0.26
25 Education 2.84 4.75 3.80 3.67
26 Health and Social Work 1.81 5.10 3.77 3.33
27 Other Services 3.92 0.54 5.60 3.43
Total Economy 2.09 1.57 1.04 1.63
Source: Authors’ calculations from India KLEMS dataset, 2015. Note: The growth rate for sub-periods is calculated as simple average annual growth rates.

9
Several other studies have also analyzed the recent trends in employment18 and have highlighted the higher growth in employment during 2009-2010 and 2011-2012. The important trends highlighted are (i) the decline in casual labor in both rural and urban India (Rangarajan, 2013), (ii) low skill base and predominant informal character of employment (Sasikumar & Thimothy, 2013), (iii) sharp increase in non-agriculture employment (from 9 million between 1999-2000 to 2004-05 to 27 million between 1999-2000 to 2009-10) with most of it of informal nature and in small size firms (Mehrotra,et al., 2014), (iv) a higher employment growth in traditionally labor intensive manufacturing group (3.35% in traditionally labor-intensive manufacturing to 2.55% in aggregate manufacturing) over the last decades—1993-1994 to 2011-2012 (Goldar & Sadhukhan, 2015). Goldar and Sadhukhan (2015) also highlight that 50 percent of aggregate manufacturing employment was concentrated in rural areas and the share of females was 30 percent in aggregate manufacturing. There was also an increasing concentration of secondary and higher secondary level education in the Indian manufacturing over the period 1993-1994 to 2011-2012 (Goldar & Sadhukhan, 2015).
Several explanations have been provided for the low employment growth in India, which include low labor force participation rates (LFPR), especially by females, low labor intensity in several sectors (Panagariya, 2008), rigid labor laws (Fallon & Lucas, 1991; Besley & Burgess, 2004) and possibly increased use of capital intensive technology (Das et al., 2015; Jha, 2015). In the next subsection, we examine the workforce participation rates in India, with special focus on female participation.
II.2: Workforce Participation Rates by Gender—The Missing Women in WFPR
In this section we look at the broad pattern of workforce participation rates (WFPR) in India during 1983 to 2011-12. The WFPR is only 39 percent in 2011-12 (NSSO 68th round) for total persons which are slightly lower than the 66th round (2009-10) estimates. From 1983 (38th round) till 2004-05 (61st round), the WFPR was around 42 percent consistently, except in the 55th round (1999-2000).The WPFR are very low for females, only 22 percent as compared to 54 percent for males in the last round. Clearly, women are missing from the workforce.
Table 3: WFPR by Gender in Seven NSS Rounds (%) (UPSS) Round Males Females Total 38th (1983) 53.87 29.60 42.05 43rd (1987-88) 53.15 28.51 41.21 50th (1993-94) 54.49 28.56 41.97 55th (1999-00) 52.73 25.89 39.67 61st (2004-05) 54.68 28.67 42.01 66th (2009-10) 54.58 22.77 39.20 68th (2011-12) 54.40 21.90 38.60
Note: 1.UPSS is usual principal and subsidiary status. WFPR is the workforce participation rate. Source: NSSO, 38th, 43rd, 50th, 55th, 61st, 66th and 68th rounds.
18 A review of some recent studies on employment has been attempted by Krishna (2015).
10
The WFPR for females is not only extremely low, but has drastically fallen between 2004 and 2011. A closer look at rural and urban trends (Appendix Table 1) show that while the WFPR are more than half for rural and urban males, it was in the range of one-fourth to one-third for rural females and one-seventh to one-sixth for urban females till 2004. But since then the WFPR for rural females has fallen to just 25 percent in 2011 from 33 percent in 2004 and 30 percent in 1999-00 and for urban females it is now only 14.7 percent as compared to 16.6 percent in 2004 and 14 percent in 1999-00. So, the WFPRs are much higher for rural females as compared to urban females but for urban females there is an increase in WFPR since 2009-10, while it continues to fall for rural females as women withdrew from agriculture but faced a lack of alternative employment opportunities. Moreover, women are heavily represented in the informal economy with lack of legal protection. Simultaneously there has been a substantial increase in the number (253 million by author’s calculations) and proportion of females who attend to domestic duties- 35.3 percent in rural and 46.1 percent in urban areas in 2011-12 (Thomas, 2015).
The trend appears to be driven by improved educational enrollment, increase household incomes, and lack of access of jobs to women. Some of the plausible reasons seem to be ‘social restrictions’ on women participation in the labor force, discrimination at work places in terms of wages (Srivastva & Srivastva, 2010), in the matter of getting a regular job (Goldar & Aggarwal, 2015), absence of employment opportunities for women (Thomas, 2015), withdrawal of women from labor force during crisis especially in households with males having income earning opportunities, etc. It is also argued that more females, both in rural and urban India are joining school and hence WFPR for them has fallen (Chaddha, 2003; Mehrotra et al., 2014; Thomas, 2015). A consequence of higher attendance in schools by girls is also that the burden of tendering younger siblings now falls on the mothers, thus forcing them to withdraw from the labor force. However, it may be argued that WFPR of females may increase once they complete their education and join back the workforce, but unless suitable employment opportunities are provided to them in non-agricultural sector it may be difficult. Another reason which also forces women to withdraw from the labor force is the increased migration by males of the households to urban areas in search of jobs, putting family responsibility on them. While the phenomenon of attending to school is a positive feature, the one of attending to domestic duties may not be a healthy trend because it involves a lot of wastage of talent and a hurdle in achieving the demographic dividend. So if good quality jobs in non-agricultural sector are increased then it may induce the women workforce participation rate to go up. Polaski (2015) points out that even G-20 has adopted an ambitious goal of reducing the gender gap in male-female participation rates by 25 percent by 2025 by adopting the relevant policy measures. It is necessary so as not to waste an unexploited resource to boost global growth. Relying on the McKinsey Global Institute report, she stresses how parity between men and women in labor market could add up to $28 trillion or 26 percent to the Global annual GDP by 2025, implying that India could have 60 percent increase in GDP by 2025 by complete parity in labor force participation. Policy interventions are therefore necessary to bring about the parity. For it to happen, Polaski (2015) advocates for improved women access to and quality of education, suitable training and skill development, improved access to child care and elder care, improved maternity protection for
11
work-life responsibilities balancing, improved safe and accessible public transport, etc. These are all to be part of a coordinated policy framework which promotes a pattern of growth that creates job opportunities for women.
II.3 Changes in Structure of Employment
Agriculture is either still the largest employer in many developing countries in Asia or employs a significant share of the labor force (Felipe, 2010; p 35).However, the general tendency across many developing countries is that agricultural output and employment shares decline as countries become richer (Felipe, 2010). With development, as productive capacity increases more resources flow from low productive activities— traditionally agriculture into activities with high productivity, such as industry and services (ADB, 2007; Felipe & Estrada, 2008; Felipe et al., 2007; Erumban et al., 2015). However, agriculture could still be able to increase output and possibly employment. Agricultural output could increase by increase in crop area planted, better yield by use of better seeds; better fertilizers; new machinery; better irrigation, etc., and by allocating land and labor towards more productive products, i.e., produce more value added per unit area. Use of science and technology to get more output from same land could generate more employment (by using the re-investible surplus) along with increase in labor productivity.
We find (Table 4) that the structure of employment in India has changed over time. Agriculture now employs less than half of the workforce as compared to 70 percent in 1980. The agriculture workforce also fell in absolute number for the first time in 2005-2006 and continued to fall since then. The maximum growth in the employment share is in the construction sector where it increased from just 2 percent in 1980 to 10.5 percent now in 2011, a more than fivefold increase with a compound annual growth rate (CAGR) of 6.3 percent. The services sector employment share increased from 17 percent in 1980 to 29 percent in 2011 with a CAGR of 3.4 percent (Table 4)—with a growth being faster in market services than in nonmarket services. However, we find manufacturing sector has experienced slow growth in employment and its share marginally increased from 10.4 percent in 1980 to 11.4 percent in 2011. So the structural change has been such that employment has shifted from agriculture sector to non-agriculture sector, especially to construction19.
19 For data and more details one may refer to Thomas, 2015

12
Table 4: Changing Structure of Employment—Broad Sectors: 1980, 1990, 2000, and 2011 Broad Sector/Year 1980 1990 2000 2011
Agriculture, Forestry and Fishing 69.83 64.75 59.84 48.10 Mining and Quarrying 0.52 0.71 0.55 0.55 Manufacturing 10.43 10.75 11.07 11.40 Electricity, Gas and Water Supply 0.28 0.36 0.28 0.33 Construction 1.99 3.41 4.56 10.44 Services 16.94 20.03 23.71 29.19 Market services 9.13 11.84 15.29 18.38 Non market services 7.81 8.19 8.42 10.81 Total Economy 100 100 100 100
Source: Authors’ calculations from India KLEMS dataset, 2015. Market services include trade, transport services, financial services, business services post & telecom and hotels & restaurants services. Nonmarket services, however includes education, health & social work, public administration & defense, and other services. However, the structural change in employment is not similar to that of GDP. While agriculture still employed 48 percent of total persons employed in 2011and was the largest employer, its share in GDP was just around 15 percent. On the contrary, services with an employment share of 29 percent had a share in GDP of almost 59 percent. At the disaggregate level of 27 industries (Table 5) we find that besides agriculture, within manufacturing the traditional industries have lost their importance as major employers. Within manufacturing the organized sector workers constituted only about one-third of the total workforce.

13
Table 5: Changing Structure of Employment—27 KLEMS Industries, 1980, 1990, 2000, 2011
Industry No. Industry/Year
1980 1990 2000 2011
1 Agriculture, Forestry and Fishing 69.83 64.75 59.84 48.10 2 Mining and Quarrying 0.52 0.71 0.55 0.55
3 Food Products 2.23 2.34 2.54 2.37
4 Textiles & Leather Products 3.70 3.43 2.95 2.86
5 Wood and Products 0.94 0.90 1.14 0.81
6 Pulp, Paper 0.25 0.28 0.33 0.33
7 Coke, Refined Petroleum 0.02 0.03 0.05 0.03
8 Chemicals and Products 0.36 0.43 0.46 0.43
9 Rubber and Plastic Products 0.08 0.14 0.24 0.24
10 Other Non-Metallic Mineral Products 0.92 0.89 0.87 1.04
11 Basic Metals and Fabricated Metal Products
0.72 0.77 0.87 0.95
12 Machinery, nec. 0.19 0.25 0.31 0.40
13 Electrical and Optical Equipment 0.17 0.23 0.31 0.35
14 Transport Equipment 0.18 0.20 0.16 0.34
15 Manufacturing, nec 0.67 0.86 0.84 1.26
16 Electricity, Gas and Water Supply 0.28 0.36 0.28 0.33
17 Construction 1.99 3.41 4.56 10.44
18 Trade 5.80 7.35 9.16 9.69
19 Hotels and Restaurants 0.80 0.92 1.18 1.66
20 Transport and Storage 1.90 2.58 3.37 4.13
21 Post and Telecom 0.14 0.18 0.34 0.38
22 Financial Intermediation 0.31 0.51 0.58 0.95
23 Business Services 0.18 0.30 0.66 1.57
24 Public Administration and Defence 2.75 2.85 2.49 1.80
25 Education 1.58 1.63 2.17 2.98
26 Health and Social Work 0.58 0.56 0.72 0.98
27 Other Services 2.90 3.15 3.04 5.05
Total Economy 100 100 100 100
Source: Authors’ calculations from India KLEMS dataset, 2015.
As seen earlier, manufacturing has not played its traditional role of job provider to workers who were released from agriculture. The shares of Textiles & Leather products and Wood & wood products have reduced. Employment growth has been uneven across of manufacturing industries: with textiles, leather products, etc., export-oriented industries experiencing decline in shares because of slack in export demand due to global economic crisis in 2008. Similarly one of the biggest employers in the service sector—public administration and defense also witnessed a decline in employment share and a decline of around 2 million during 2000-

14
2011. However, on the other hand, some growing industries, besides Construction namely, Trade, Transport & Storage, Education, and Business Services (which also include ICT related services) gained in shares and created additional employment of about 8 million, 6 million, 5 million, and 5 million, respectively, during 1980-2011.
II.4 Low Labor Intensity
While the factor endowment of India is characterized by abundance of labor, reflected in high labor intensity (labor capital ratio, L/K), Indian manufacturing is characterized by low and declining labor intensity. Das et al. (2015) found that out of 52 three-digit manufacturing industries, only 13 are labor intensive (with labor intensity above average of 0.84). They found that these labor-intensive manufacturing industries generated only 31 percent of total manufacturing employment in 2000s and also showed a decline in employment elasticity. Das et al. (2015) found that labor intensity in Indian manufacturing declined form 3.34 in 1980s to just 0.78 in the 2000s. The authors mentioned four possible explanations for constraints to growth of labor-intensive manufacture in India: (i) the nature of trade regime which favored the capital-intensive industries; (ii) the labor legislation in India, especially Chapter VB of the Industrial Dispute Act, which led to the increase in employment of contract labor; (iii) infrastructure bottlenecks, especially shortage and unreliability of supply of electricity and credit (Panagariaya, 2008); and (iv) poor skills and low literacy rates among unskilled labor.
Unni (2015) cites reduced cost of capital as one reason for increased capital intensity in the post reform period. Chandrasekhar (2008) calculated the cost of capital and labor and concluded that there was a “negative shift in the price of capital to labor,” which was due to subsidy based on investment, interest subsidy and other incentives, e.g., cheap or free electricity offered by State and Central Government, thereby encouraging increase in capital intensity. Unni (2015) also cites another interesting explanation by Chandrasekhar (2008), to the jobless growth in organized manufacturing- a shift in demand towards better quality and branded products, which are capital intensive, by the rich class and aided by liberal loans for personal finance by banks. Jha (2015) attributes the adoption of “neo-liberal” trajectory as the reason for jobless growth.
Felipe (2010) has also advanced the reasons for why many developing countries could not create sufficient employment in the course of capital intensive industrialization. These are high growth of population; the industrialization policy adopted by the countries-promoting capital intensive technology to have trickle- down effect;20 similar technology in both industrial and developing economies because of limited capital labor substitution; market distortions in the form of subsidies to capital and high wages in modern industries—not reflecting the real price of factor (or its scarcity)—so cheaper the capital means more capital intensive the technique would be; also the old, labor-intensive technology may be suitable for developing countries but these may not now be produced and made available by the
20 This trickle down never took place in India (Basu & Mallick, 2007)

15
producing advanced countries;21 etc. As a result of these trends, many developing countries have not been able to generate enough employment opportunities to absorb the growing labor force.
III: Quality of Employment
In an emerging economy like India, it is not only the structural change in employment which is crucial to understand the growth process, but it is also desirable to know the quality of this employment. It is true that in India even among those who are employed, there are many who are poor, illiterate, employed as casual labor with relatively low wages, and who are predominantly in the informal sector of the economy where not only they earn lower wages, but with little social security and few days of employment in a year. Basu and Maertens (2010) have raised the issue of insufficient creation of “good jobs” which could help in reducing poverty. Nayyar (2012) has defined quality of employment on the basis of the three parameters—wages, the availability of written job contracts, and the availability of social security benefits. However, wages themselves depend among others, on skills and experience. So education plays an important role in the quality of employment and one may say that labor with higher educational level is of better quality. Written job contracts and availability of social security benefits are associated with the nature of employment. In regular and salaried jobs one generally has both, whereas in casual employment especially in informal sector both are missing. That is the reason it is generally perceived that regular wage and salary job is of best quality (Papola & Sharma, 2014, p. 549; Ghose, 2015) because along with a regular job they also have job security and social security. On the contrary, casual jobs, especially in the unorganized/informal sector are considered to be the worst jobs.22
III.1 The Working Poor
First aspect of quality of employment concerns the existence of poor among employed and is quite alarming. The report of the working Group on employment, Planning and Policy for the XII Five Year Plan (2011) highlighted the problem of the working poor. It pointed out that working poor are not included in the set of unemployed at all. These are the workers who cannot afford to remain openly unemployed and thus fall in to the category of “working poor.” Based on consumption expenditure and status of employment, it was reported that in 1999-00 a total of 24.5 percent persons were “working poor” (Report, GOI, 2011, Table 5, pp. 60) and the proportion was 37 percent among casual labor and 20 percent in self- employed persons. The proportion was higher among rural persons and also among females. In 2004-05 also the “working poor” constituted around 20.5 percent of all persons employed and casual labor still had the highest percent- 31.9. Papola and Sharma (2015, p. 545) also states that about one-fourth of the employed are poor and argue that the share may be higher among the casual wage workers because they do not have full time work. The poor are
21 Only technologies now available to the developing world are the same as those in developed countries (Felipe & Hasan, 2006, ch. 3) and are capital intensive. 22Ghose (2015, p. 72) also points out that good jobs- i.e., regular-formal employees are also highly skilled in terms of education, regular-informal employees are medium skilled and casual labor is low skilled.

16
employed because they cannot afford to be unemployed and take any kind of work. So it is generally low earnings out of their work-either on a self-employed, or wage/salary basis. Lot of disparities is found in the wages- casual and self- employed in agriculture earned much less than the per capita per day income for the entire population (Papola and Sharma (2015, p 545)).
III.2 Educational Attainments in a Cross-Country Perspective
The second aspect of quality of employment relates to the skill level and skill composition of the workforce. Economists have been engaged with the notion of the crucial importance of human capital, especially the importance of education for attaining faster economic growth (Mankiw, et al., 1992; Romer, 1990; Barro & Lee, 2001 and 2013). It is recognized that the correct measurement of labour service flows requires that we account for all changes which might take place in labour. All labour is not homogeneous but differs from each other. Over time labour increases not only in number but also lot of human capital growth takes place through investment in labour through education, training, experience, etc. While Mankiw et al. (1992) and Lucas (1988) emphasized on the role of human capital accumulation as a source of growth, Nelson & Plelps (1966) and Benhabib & Spiegel (1994)23 consider stock of human capital as the driver of growth. Some of the early empirical research (Romer, 1990; Barro & Sala-i-Martin, 1995; Barro, 1997) found significant positive relationship between educational attainment and subsequent economic growth. In order to find the contribution of education to growth, some economists have also estimated the returns to additional year of schooling and found it not only positive but quite substantial, confirming the contribution of education to growth (Bosworth, 2007). Because of the important role of education in human capital formation, Barro and Lee (2013) have estimated the educational attainment for 146 countries through average years of schooling at primary, secondary and tertiary level by using the school enrolment ratio and the survival rate (inverse of drop-out rates). They have improved upon their earlier estimates of 2001 of educational attainment for 107 countries. They have found that in 2010, for the World (146 countries) the average number of years of schooling is 7.9 years. The proportion of population with primary24 education being 24.6; with secondary education being 46.3 and with tertiary education is 14.2. Obviously it varies among countries and continents; being 11.3 years in advanced (24) countries and just 7.2 years in developing countries (122) with the proportion of population with tertiary education being 32.2 and 10.5 percent, respectively. It shows therefore that with development one may expect not only the average years of schooling to go up, but also a higher proportion of population with tertiary education. A similar trend is visible for India from Table 6 (last row), where we see an increase in the proportion of workers with tertiary (above Higher Secondary) education from 2.6 percent in 1980s to 10 percent in 2011, but 55 percent of persons
23 Refer to Aghion and Howitt (2009), ch 13 for more details. 24Barro and Lee (2013) defines primary which includes both incomplete and complete primary; secondary includes both lower secondary and upper secondary; and tertiary education includes incomplete and complete tertiary. Our classification is almost similar as up to primary is 5 years of education; middle and secondary is from 6 to 12 years and above Hr Secondary is more than 12 years of education.

17
employed in 2011 still have primary or below primary level of education.25 It thus imply that Indian labor is still of very poor quality because of low level of education. The challenge then is where to absorb this poor quality labor. If it is the service sector, which requires a relative high level of skills, that is the main engine of growth in India then the absorption problem is even more severe.
III.2.1 Educational Distribution of the Workforce by Industry: 1983, 1993, 2004, and 2011
The distribution of persons employed by broad education category is not only important at the aggregate level, but also at the disaggregate industry level so as to understand the “skill” intensity of each industry. It would help us to know the employment potential and prospects of “educated” workforce in the country. We show the education distribution for the three categories of education26 in the years 1983, 1993, 2004, and 2011 for the 27 industries of India.
Table 6: Educational Distribution (%) of the Employed by Industry: 1983, 1993, 2004, and 2011
1983 1993 2004 2011
Industry/ Education categories
up to primary
middle to Hr.
Secondary
above Hr. Sec
up to primary
middle to Hr.
Secondary
above Hr. Sec
up to primary
middle to Hr.
Secondary
above Hr. Sec
up to primary
middle to Hr.
Secondary
above Hr. Sec
Agriculture, Forestry and Fishing
89.65 9.88 0.47 84.53 14.59 0.87 76.56 21.71 1.74 67.97 29.45 2.57
Mining and Quarrying
81.55 16.28 2.16 73.49 21.00 5.51 69.36 22.69 7.96 55.29 30.53 14.19
Food Products 82.15 16.27 1.59 77.43 20.46 2.11 69.77 26.14 4.09 61.96 31.98 6.06
Textiles & Leather Products
76.27 22.35 1.38 70.78 26.65 2.58 59.09 36.32 4.59 54.72 38.73 6.56
Wood and wood products
79.23 18.81 1.96 81.69 17.57 0.74 73.30 24.81 1.89 64.95 32.65 2.41
Pulp, Paper 45.89 45.95 8.16 34.08 50.37 15.55 22.89 51.55 25.56 27.92 42.75 29.33
Coke, Refined Petroleum
40.46 39.94 19.60 33.34 50.06 16.60 29.13 32.01 38.87 20.43 44.58 34.99
Chemicals and Products
54.19 32.88 12.93 45.70 36.79 17.51 44.83 29.44 25.74 27.12 41.71 31.16
Rubber and Plastic Products
52.24 41.09 6.65 42.46 45.22 12.32 30.30 51.91 17.79 27.59 55.15 17.27
Other Non-Metallic Mineral Products
86.57 12.07 1.36 79.24 18.92 1.83 77.76 18.95 3.29 70.30 25.61 4.10
Basic Metals and Fabricated Metal Products
59.15 34.88 5.97 49.17 42.52 8.32 44.20 42.78 13.02 38.60 46.97 14.43
Machinery, nec. 62.59 30.50 6.91 38.58 50.34 11.08 29.31 42.33 28.36 25.93 44.11 29.96
Electrical and Optical Equipment
22.31 61.39 16.30 18.52 53.68 27.80 23.09 49.18 27.73 12.61 40.09 47.30
Transport Equipment
40.67 53.30 6.03 24.02 60.64 15.33 20.91 42.71 36.38 8.58 45.41 46.02
Manufacturing, nec 72.45 26.11 1.44 62.92 34.28 2.80 47.92 46.96 5.12 45.51 49.27 5.21
Electricity, Gas and Water Supply
44.00 44.33 11.67 36.03 49.89 14.08 22.27 47.95 29.77 21.75 41.96 36.29
Construction 82.65 15.46 1.89 75.78 21.63 2.59 68.92 27.85 3.24 65.07 31.56 3.37
25Census 2011 shows that between 2001 and 2011, 59 million literate main workers joined the workforce. But the population had illiterate main and marginal workers at 126.2 million (30 percent) and 79.5 million (19 percent) as matriculate/secondary but below graduate level. However, in the total population 32.6 percent is illiterate or educated below the primary level, 25.2 percent are educated till primary level, middle school 15.7 percent, matric 11.1 percent, higher secondary 8.6 percent, and graduate and above 4.5 percent. 26 The three categories are: up to primary (up to 5 years of education), middle to Higher secondary (from 8 years to 12 years), and above higher secondary (more than 12 years).

18
Trade 62.43 33.50 4.06 53.31 40.50 6.19 42.73 46.03 11.24 34.03 51.45 14.52
Hotels and Restaurants
72.44 25.91 1.65 69.92 27.93 2.14 59.36 36.51 4.13 46.31 45.86 7.83
Transport and Storage
65.93 30.37 3.69 58.33 36.90 4.77 48.97 43.52 7.51 41.87 49.34 8.79
Post and Telecom 15.69 70.20 14.11 15.91 63.89 20.21 10.18 61.92 27.90 6.02 49.89 44.09
Financial Intermediation
10.77 39.96 49.27 5.64 34.66 59.71 4.87 35.05 60.08 2.30 30.37 67.32
Business Services 19.04 38.58 42.38 14.72 42.67 42.62 13.30 31.77 54.93 10.50 30.71 58.79
Public Administration and Defence
28.97 53.35 17.67 20.05 53.42 26.53 18.89 47.62 33.49 12.34 45.73 41.92
Education 11.79 53.46 34.75 8.79 46.16 45.05 7.38 31.02 61.60 5.53 26.46 68.01
Health and Social Work
26.31 54.97 18.73 17.81 53.52 28.67 16.64 38.22 45.15 12.32 36.04 51.65
Other Services 84.90 13.48 1.63 70.29 26.82 2.89 60.77 33.82 5.41 49.54 42.30 8.15
Total Economy 81.07 16.32 2.61 74.31 21.59 4.09 64.72 28.16 7.12 54.94 34.86 10.21
Source: Authors’ calculations from India KLEMS dataset, 2015.
From Table 6 we find that the skill composition of all 27 industries is very different from each other. In 2011, the proportion of employed persons with ‘above Higher Secondary’ education is more than 40 percent only in two industries (Electrical and Optical Equipment and Transport Equipment ) in the manufacturing sector while most industries in the service sector (six out of ten) have it. Its highest proportion is in the education industry (68%) followed by financial intermediation (67%) and the minimum is in wood and wood products (2%) and in construction (3%). As discussed earlier, construction has experienced the maximum addition to employment in recent years but it has employed only a very small proportion of ‘above Higher secondary’ educated workers. The services industry showed a higher use of graduates. The dilemma of educated employment then is that the industry- construction which adds to employment does not use educated man power and the industries in the services sector which employs a large proportion of them are not labour intensive and does not generate many employment opportunities for them. As a result in 2011 we find a higher proportion of workers with ‘above higher secondary’ education among the total unemployed workers27—at 31 percent. Despite this, we find that having a graduate degree or higher increases the chances of being employed in service industry compared to manufacturing as service industry employs higher proportion of ‘educated’ labour.
From Table 6 it is seen that in all the industries over the period of 1983 to 2011, the proportion of ‘above higher secondary’ educated workers has increased and that of educated only ‘up to primary’ has reduced, though the extent of change may be different. It seems therefore that the general level of education among the employed persons has improved, due to a general increase in education level in the country. The implication of this trend is that if more and more jobs are to be created for educated workforce, then it is mainly possible only in low labour intensive service sector industries. The focus of the present government on skill India and make in India, then seems to be contradictory as skill in India may empower persons with higher and better skills but the manufacturing sector, which is the focus of make
27 Census 2011

19
in India may not able to create enough employment opportunities unless it is high value added manufacturing. We need to change the focus of our education, to ensure a match between what is needed in industry and what is being supplied by the labour market. Along with general education, more and more vocational skills and other transferable skills like communication, English language, knowledge of ICT, etc., may have to be provided so that employment opportunities in not only low value added manufacturing industries, but also high value added manufacturing and services could be utilized.28
A pertinent question which however need to be addressed is whether we only are concerned about the number of employed persons and their general education level or are we also interested in their general quality, which could in its computation include the reward which the educated workforce get for their higher education level. However, because of mismatch of skill required by the job and the skill available for it, in general the level of education of the newly employed may be higher which could change the education composition of the workforce within an industry. It is also argued that education as a proxy for skill is not appropriate in a country with such a high level of illiteracy and a low level of education but with very many traditional skills. This is especially true in sectors like Construction which has absorbed a substantial portion of increased employment and the persons employed possess and use many of the traditional skills despite introduction of new technology also.
III.2.2 Labor Quality Growth
The question is how to synthesize the distribution of education with returns to education and capture the changes in labor composition. One of the widely used methodologies to capture changes in labor composition is given by Jorgenson, Gollop and Fraumeni (1987). It recognizes that a lot of human capital growth takes place through investment in labor through education, training, experience, etc., and measures human capital as an index of labor service flows and accounts for all the changes which might take place in the labor input due to educational attainment, age or gender.29 The growth in labor composition index is mainly the measurement of change in the educational skills of the employed persons over the period and their reward (wages or earnings) for these skills. It must therefore be emphasized that the index is sensitive to the measurement of the reward of labor, i.e., earnings.
It may be pointed out that even though the growth rate in aggregate employment declined from 2.09 percent p.a. in the period 1980-91 to 1.04 percent p.a. in the period 2003-11, i.e., by one percentage point, this was compensated partly by an acceleration in the growth rate in labor quality (labor composition index) which increased from 1.42 percent p.a. during 1980-91 to 1.63 percent p.a. during 2003-11. The growth rate of labor quality may go up further in the coming years especially with the efforts being made by the present government towards “skill development.” Thus, even if the growth rate in the number of persons employed does not go up, the growth rate in labor quality may go up and thus the contribution of labor input to GDP growth may increase.
28 Refer to Mehrotra, S (2014) 29 See Aggarwal and Erumban (2013) for details of the methodology.

20
It is however observed from Table 7 that the extent of human capital growth was relatively low in the construction sector (0.41%) and agriculture (0.42%) but high in mining and quarrying sector (1.37%). At the industry level, the growth in labor composition index reflecting labor quality was fastest in Machinery, nec., Transport equipment, Mining and Quarrying, Chemical and chemical products, Electrical and optical equipment, Pulp and paper, Other services, Food products, beverages and tobacco, Electricity, gas & water supply and Rubber and Plastic products, and very slow in Health and social work,30 Wood and products of wood, Construction, Agriculture, hunting, forestry and fishing, Business services, Financial services, and Education. In quite a few industries, e.g., Agriculture, Mining, Chemicals, Electrical and Optical Equipment, Transport equipment, etc., the growth in labor quality was faster in recent period of 2004 to 2011 as compared to 1994 to 2003. So we find that not only skill composition of each industry was different, but it changed differently over the period.
Table 7: Growth Rate of Labour Composition Index by KLEMS Industry, 1980-1993, 1994-2002, 2003-2011, and 1980-2011. (percent per annum)
Industry No.
KLEMS Industry/Period 1980-93 1994-2002 2003-11 1980-11
1 Agriculture, Forestry and Fishing 0.39 0.35 0.56 0.42
2 Mining and Quarrying 1.26 0.46 2.79 1.47
3 Food Products, Beverages and Tobacco 0.78 0.90 0.93 0.86
4 Textiles, Textile Products, Leather and Footwear
0.72 0.85 0.69 0.75
5 Wood and Products of wood 0.12 0.77 0.47 0.41
6 Pulp, Paper, Paper products, Printing and Publishing
1.19 0.87 0.89 1.01
7 Coke, Refined Petroleum Products and Nuclear fuel
0.40 1.83 0.67 0.90
8 Chemicals and Chemical Products 1.34 0.85 1.96 1.38
9 Rubber and Plastic Products 1.34 0.76 0.07 0.80
10 Other Non-Metallic Mineral Products 1.29 0.24 0.64 0.80
11 Basic Metals and Fabricated Metal Products 1.48 0.54 0.64 0.96
12 Machinery, nec. 2.47 1.49 0.80 1.70
13 Electrical and Optical Equipment 0.79 -0.21 2.61 1.03
14 Transport Equipment 1.66 0.87 1.47 1.38
15 Manufacturing, nec; recycling 0.78 0.82 0.28 0.65
16 Electricity, Gas and Water Supply 0.60 1.26 0.86 0.87
17 Construction 0.60 0.31 0.30 0.43
18 Trade 0.71 0.75 0.70 0.72
19 Hotels and Restaurants 0.29 0.70 1.04 0.63
20 Transport and Storage 0.66 0.62 0.67 0.65
30It is possibly because the sector already has very high share of skilled workers- also visible from Table 6.

21
21 Post and Telecommunication 0.51 0.72 1.32 0.80
22 Financial Services 0.79 -0.02 0.64 0.51
23 Business Services 0.20 0.60 0.78 0.49
24 Public Administration and Defense; Compulsory Social Security
0.81 0.30 0.92 0.69
25 Education 0.55 0.57 0.61 0.57
26 Health and Social Work 1.07 0.72 -0.49 0.52
27 Other Services 1.16 0.31 1.18 0.92
Total Economy 1.42 1.26 1.63 1.43
Source: Authors’ calculations from India KLEMS dataset, 2015.
III.3 Employment Quality
The third aspect of employment status in India concerns the high proportion of persons employed as casual labour. While the share of regular wage and salary jobs varied between 13 percent and 18 percent over the period 1983-2011 (Table 8), the share of casual labour was much higher, in the range 29-33 percent (Table 8).
Table 8: Percentage Distribution of Workers (UPSS) by Employment Status (1983-2011) Employment Status/ Year
1983 1993 1999 2004 2009 2011
Self-Employed
56.86 54.75 52.84 56.89 50.96 52.22
Regular-Wage 13.83 13.22 13.99 14.25 15.59 17.85
Casual labour 29.32 32.03 33.17 28.85 33.45 29.92
Total 100 100 100 100 100 100
Source: Authors’ calculations from India KLEMS dataset, 2015.
A closer look at the proportion of casual labour in the workforce within broad sectors of the economy (Table 9) reveals that the construction sector (85%) and mining and quarrying (58%) sector predominantly had majority of their workforce as casual labor. The share is not only higher but has been increasing over the period. Looking at the fact that most of the recent increase in employment has been in construction, one may deduce that most of the recent increase in employment is of casual labor or “bad quality.” On the contrary electricity and services are the sectors wherein the share of casual labor was not only very small, but also tended to decline. However, while electricity is mainly in organized sector and employs 90 percent of persons as regular and salary job workers, services sector consist of both organized and unorganized industries and employs more than 50percent of the workers as self- employed category. Manufacturing on the contrary has 64percent share of unorganized sector and also has high share of casual labor (18%). So one may say that on an average, employment in services is of better quality than employment in manufacturing despite high share of unorganized sector (72%) in services. It is evident from the Table 9 that agriculture

22
and manufacturing have relatively stable share of casual labor within these sectors. While in agriculture it was in the range 34 to 38 percent, in manufacturing it was in the range 18 to 22 percent.
Table 9: Percent of Casual Workers (UPSS) by Broad Sector of the Economy: 1983, 1993, 2004, and 2011
Broad Sector/Year 1983 1993 2004 2011 Agriculture, Forestry and Fishing 34.54 38.51 34.75 34.01 Mining and Quarrying 44.52 52.4 57.89 58.23 Manufacturing 21.24 22.17 18.22 17.95 Electricity, Gas and Water Supply 9.26 8.14 5.04 5.93 Construction 70.33 76.13 78.31 84.9 Services 9.33 9.41 7.58 6.84 Total Economy 29.32 32.04 28.85 29.92
Source: Authors’ calculations from India KLEMS dataset, 2015.
23
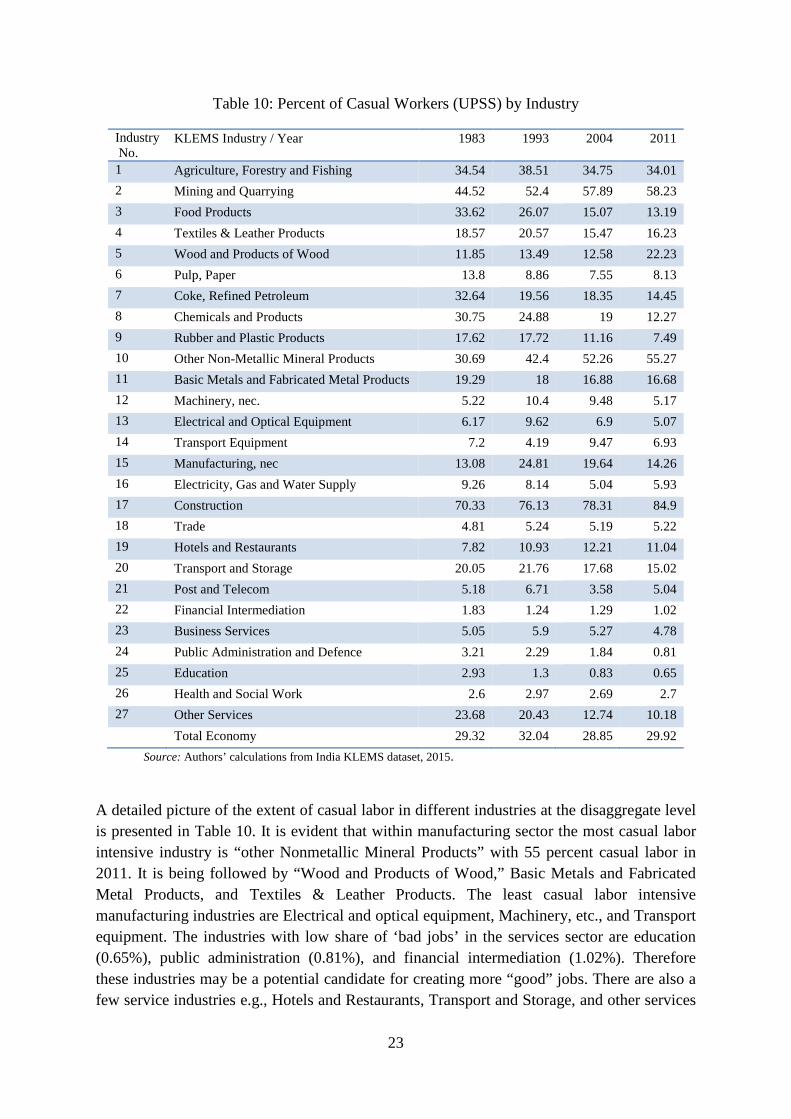
Table 10: Percent of Casual Workers (UPSS) by Industry
Industry No.
KLEMS Industry / Year 1983 1993 2004 2011
1 Agriculture, Forestry and Fishing 34.54 38.51 34.75 34.01 2 Mining and Quarrying 44.52 52.4 57.89 58.23 3 Food Products 33.62 26.07 15.07 13.19 4 Textiles & Leather Products 18.57 20.57 15.47 16.23 5 Wood and Products of Wood 11.85 13.49 12.58 22.23 6 Pulp, Paper 13.8 8.86 7.55 8.13 7 Coke, Refined Petroleum 32.64 19.56 18.35 14.45 8 Chemicals and Products 30.75 24.88 19 12.27 9 Rubber and Plastic Products 17.62 17.72 11.16 7.49 10 Other Non-Metallic Mineral Products 30.69 42.4 52.26 55.27 11 Basic Metals and Fabricated Metal Products 19.29 18 16.88 16.68 12 Machinery, nec. 5.22 10.4 9.48 5.17 13 Electrical and Optical Equipment 6.17 9.62 6.9 5.07 14 Transport Equipment 7.2 4.19 9.47 6.93 15 Manufacturing, nec 13.08 24.81 19.64 14.26 16 Electricity, Gas and Water Supply 9.26 8.14 5.04 5.93 17 Construction 70.33 76.13 78.31 84.9 18 Trade 4.81 5.24 5.19 5.22 19 Hotels and Restaurants 7.82 10.93 12.21 11.04 20 Transport and Storage 20.05 21.76 17.68 15.02 21 Post and Telecom 5.18 6.71 3.58 5.04 22 Financial Intermediation 1.83 1.24 1.29 1.02 23 Business Services 5.05 5.9 5.27 4.78 24 Public Administration and Defence 3.21 2.29 1.84 0.81 25 Education 2.93 1.3 0.83 0.65 26 Health and Social Work 2.6 2.97 2.69 2.7 27 Other Services 23.68 20.43 12.74 10.18 Total Economy 29.32 32.04 28.85 29.92
Source: Authors’ calculations from India KLEMS dataset, 2015.
A detailed picture of the extent of casual labor in different industries at the disaggregate level is presented in Table 10. It is evident that within manufacturing sector the most casual labor intensive industry is “other Nonmetallic Mineral Products” with 55 percent casual labor in 2011. It is being followed by “Wood and Products of Wood,” Basic Metals and Fabricated Metal Products, and Textiles & Leather Products. The least casual labor intensive manufacturing industries are Electrical and optical equipment, Machinery, etc., and Transport equipment. The industries with low share of ‘bad jobs’ in the services sector are education (0.65%), public administration (0.81%), and financial intermediation (1.02%). Therefore these industries may be a potential candidate for creating more “good” jobs. There are also a few service industries e.g., Hotels and Restaurants, Transport and Storage, and other services

24
where the share of casual labor in total employment is more than 10 percent in 2011. All service sector industries are not necessarily providing “good jobs.”
III.4 Organized–Unorganized Sector Dichotomy
The fourth aspect of quality of employment in India relates to the nature of employment- organized/formal sector vs. unorganized/informal sector. The details about the exact categories which are included to define organized sector in non-agriculture sectors is provided by Sundaram31 (2008), and that has been followed in this paper. Persons in unorganized sector have no job security or social security. They have no secured tenure of employment. Informal32 employment in India was however very high—around 93 percent of the total employment in 2000s and later (Papola, 2015, p. 533; Mehrotra et al., 2014; Polaski, 2015), out of which 82.7 percent were in the unorganized sector and 9.3 percent in the organized sector.
Table 11 shows that in 2011, unorganized sector accounts for 70 percent of total non- agriculture employment. It is very large in important sectors like services, construction and manufacturing constituting 72 percent, 75 percent and 64 percent, respectively. Mining and quarrying sector is the key sector where the decline in the share of unorganized sector is more than 20 percent points. For the economy as a whole, though the share of unorganized employment has declined in recent years it is still more than two-third of the total employment. Goldar and Sadhukhan (2015) have estimated that during 1999-2000 and 2011-2012 organized sector manufacturing employment grew faster (4.26%) as compared to unorganized sector manufacturing (2.49%) and this could be the reason for a substantial increase in the share of the organized sector in manufacturing. However, some economists (Papola and Sharma, 2015, and Kumar, 2012) have looked at the distribution of unorganized employment in both the formal/organized and informal/unorganized sectors and also in the public sector and private sector. Papola and Sharma find that since the initiation of economic reforms in 1991, there has been tendency to employ contract workers at the expense of regular workers and outsource the production. On the basis of the Annual survey of Industry (ASI) data also, Kumar (2012) shows that the share of contract workers in total employment of the manufactured sector has increased between 2000-01 and 2008-09. The share of contract workers in organized manufacturing has increased to 34 percent in 2010-11 from about 10 percent in early 1990s, 14 percent in 1995-96 and 20 percent in 2000-01. The 31The organized sector covers all workers on the Usual Status who report themselves to be employed in Government/Public Sector or Public/Private Limited Companies or Co-operative enterprises, i.e., with enterprise type Codes 5, 6 or 7 in the NSSO surveys since 1999-2000. It also includes workers in proprietary/partnership enterprises engaged in manufacturing using electricity and employing 10 or more workers. A clear distinction has to be made between the nature of sector and nature of employment. An organized/ unorganized sector may have both formal/informal employment. 32The informal sector in India includes wide variety of economic activities in both rural and urban areas (NCEUIS-2008). But ILO (2002) defines employment that is not covered by labor and other regulations as informal sector employment. So in reality not only workers employed by an informal sector enterprise, but a part of the workforce of the formal sector enterprise may well be informal sector workers. NSSO (2001a, 2001b) specifically identifies the informal sector as being made up of unincorporated enterprises owned either as a proprietorship or as a partnership. NCEUS (2007, 2008) used the terms ‘unorganized sector’ and ‘informal sector’ as interchangeable and included all unincorporated private enterprises owned either as a proprietorship or as a partnership basis and with less than 10 total workers.

25
advantage of engaging contract workers was flexibility of varying the number to the employees, who being overwhelmingly non-unionized are pliable and can be hired at a much cheaper rate compared to regular workers through a contractor with no statutory obligation of non-wage benefits. Papola and Sharma (2015) estimates that the per day cost of hiring a contract worker is 20 percent of the cost of employing a regular worker in 2007-08. As a result, not only private sector but also the public sector uses them. So we find that though there is a fall in the share of the unorganized sector but a rise in the share of informal workers in the organized sector (resulting in growing inequalities also).
Table 11: Share of Employment in Unorganized Sector by Broad Sector of the Economy: 1999, 2004, and 2011.
Broad sector/Year 1999 2004 2011 Mining and Quarrying 60.78 44.26 38.03 Manufacturing 74.45 72.83 63.77 Electricity, Gas and Water Supply
15.39 7.92 10.34
Construction 86.55 88.13 75.3 Services 74.17 75.92 72.2 Total Non-Agricultural Economy
75.03 75.87 70.23
Source: Authors’ calculations from India KLEMS dataset, 2015. .
An analysis at a more disaggregate level of industries (Table 12) reveals that with in manufacturing the three industries with highest concentration of unorganized employment are wood and products of wood, food products and manufacturing nec., each with its share of more than three-fourth . However, within manufacturing we have few industries where the share is relatively very low and could be the industries where it may be relatively easier to generate organized sector employment. These industries are coke and refined petroleum, chemicals and transport equipment, each with less than one-fifth share in the unorganized sector of the industry. However, Goldar and Sadhukhan (2015) has divided the manufacturing sector in to traditionally labor intensive, traditionally low capital intensive and traditionally high capital intensive industries in terms of capital intensity.33 They find that during 1989-2010, the annual organized employment growth rate of traditionally low capital intensive industries was fastest at 3.9 percent and its share in total organized manufacturing increased from 29 percent in 1989 to 35.8 percent in 2010, while the share of organized traditionally labor-intensive industries and traditionally high capital-intensive industries fell from 50.6 percent and 20.3 percent to 46.6 percent, and 17.6 percent, respectively, during the same period. An important result of the study by the authors is that the quality of employment measured in terms of share and growth of contract labor has deteriorated. They show that not only the growth of contract workers in all 3 industry groups of organized manufacturing was 33They used the cluster analysis in terms of capital labor ratio of 3-digit manufacturing industries in 1960 to group them in to 3 groups, with the mean and standard deviation of 1.7 and 0.63, respectively, for traditionally labor-intensive manufacturing industries; 4.02 and 1.27 for traditionally low capital-intensive manufacturing industries; and 20.5 and 24.9, respectively, for traditionally high capital-intensive manufacturing industries.

26
quite high, the highest at 15 percent being in the traditionally low capital intensive industries, but the share of contract workers in total organized manufacturing workers (based on ASI data) also increased from just 14 percent in 1989 to 34 percent in 2010.34 Construction sector also has high (75%) share of employment in unorganized sector.
Similarly in the service sector we have different industries with different concentration of unorganized or “bad” employment. The service sector industries with low share of ‘bad’ employment, besides public administration are education, financial intermediation and post and telecom each with less than one-third share of unorganized employment. On the other extreme, the service industries with more than two-third share of unorganized employment are trade, hotel & restaurants, transport and storage, and other services.
So the Indian economy has a dualistic character where the informal sector with low productivity and low wages is predominant as compared to the formal sector. The World Bank (2010) provides four reasons for the continuation of the dualistic structure: (i) labor market segmentation; (ii) capital market segmentation; (iii) product market segmentation; and (iv) policy-induced segmentation (Unni, 2015, p. 236).
Table 12: Share of Employment in Unorganized Sector (UPSS) by Industry (non-agriculture): 1999, 2004, and 2011
KLEMS Industry No.
KLEMS Industry / Year 1999 2004 2011
2 Mining and Quarrying 60.78 44.26 38.03 3 Food Products 81.08 78.77 79.72 4 Textiles & Leather Products 77.98 74.15 66.91 5 Wood and Products 97.64 97.09 93.62 6 Pulp, Paper 65.45 55.79 60.75 7 Coke, Refined Petroleum 22.86 25.55 12.88 8 Chemicals and Products 45.02 42.32 20.12 9 Rubber and Plastic Products 45.81 52.9 33 10 Other Non-Metallic Mineral
Products 73.32 69.17 50.19
11 Basic Metals and Fabricated Metal Products
64.48 65.36 53.5
12 Machinery, nec. 47.65 49.92 36.96 13 Electrical and Optical Eqp 31.68 56.82 34.04 14 Transport Equipment 28.1 24.21 19.39 15 Manufacturing, nec 85.51 81.82 76.25 16 Electricity, Gas and Water Supply 15.39 7.92 10.34 17 Construction 86.55 88.13 75.3 18 Trade 95.91 97.1 94.18 19 Hotels and Restaurants 93.66 91.35 88.08 20 Transport and Storage 79.73 83.3 82.24
34 The corresponding share of contract workers is 30 percent, 37 percent, and 40 percent, respectively, in three industrial groups based on labor intensity.

27
21 Post and Telecom 39.82 46.96 32.63 22 Financial Intermediation 27.97 27.81 30.31 23 Business Services 80.76 71.25 47.92 24 Public Administration and Defence 14.35 2.55 0 25 Education 35.96 32.04 26.69 26 Health and Social Work 49.76 48.43 40.42 27 Other Services 90.03 94.96 92.63 Total Non – Agricultural Economy 75.03 75.87 70.23
Source: Authors’ calculations from India KLEMS dataset, 2015.
Despite the large share of employment in the unorganized sector of the Indian economy, no major or minor policy initiatives have been taken. So what can be done to facilitate the transition from informal to formal employment? Pais (2015) shows that ‘the informal sector has more or less not benefitted much from direct State policy’ and therefore, the way forward is to rethink informal sector strategies including state policies differently and focus on enterprise and employment. He argues to include all enterprises in the regulatory framework, as well as for universal systems of protection- social security for all35 and including all hired workers in labor regulations.Moreno-Monroy et al. (2014) argues that policies should focus on helping to modernize and formalize informal sector, and relax several constraints on firms’ ability to grow in size. Polaski (2015) advocates reliance on ILO Recommendation “Transition from the Informal to the Formal Economy” (2015), which is based on best practices of countries to reduce informality and offers an integrated policy framework that favours the use of economic and tax policies, labor market laws and regulations, equality and anti-discrimination measures, skill development, financial and business services, social protection and income security, and so on. This international consensus on how to formalize jobs could be used by India to reduce informality in employment.
From the preceding discussion in this section on quality of employment, one may infer that there is considerable diversity across industries. Some industries have high proportion of employment with high educational level (more than higher secondary), some have high proportion of casual labor, and some have high proportion of employment in the informal sector. In Table 13, we have tried to identify those industries that have “high” educational level and also “low” proportion of casual labor and “low” proportion of unorganized sector employment- thus have relatively “good” quality of employment (highlighted in green). It is obvious that agriculture and construction are sectors with low educated, casual and unorganized labor (highlighted in yellow) and the employment growth is low in agriculture but very high in construction. So the release of low quality labor from agriculture must have been absorbed by the construction sector. On the contrary some of the industries in both manufacturing and services are such as to employ relatively more educated labor with low concentration of casual labor and low share of employment in unorganized sector. These are Coke, Refined Petroleum Products and Nuclear fuel, Chemicals and Chemical Products, Rubber and Plastic Products, Basic Metals and Fabricated Metal Products, Machinery, nec., 35 Mehrotra (2016) also argues in favor of the social insurance for the informal sector.

28
Electrical and Optical Equipment, Transport Equipment in manufacturing, and Electricity, Gas and Water Supply, Post and Telecommunication, Financial Services, Business Services, Public Administration; Defense; and Compulsory Social Security, Education, Health and Social Work in services. Several industries witnessed low to moderate growth in employment. Nayyar (2012, p. 180) also finds empirical evidence of more employment growth in those sectors of services where quality of employment is low. So it is evident how “good quality employment” is required not only in the services sector, but also in the manufacturing sector. One plausible reason for it is that manufacturing has now become quite similar to services in terms of use of technology, capital intensity and skill requirements. India thus has to invest in human capital to make workers suitable for both manufacturing as well as services.
Table 13: Growth Rate of Persons Employed (1980-2011), Level of Educational Requirement, Proportion of Casual Labour and Share of Unorganized Sector Employment by
Industry in 2011.
S.No. Industry Description Growth rate of persons employed (1980-2011)
Level of Education (2011)
Proportion of Casual labour (2011)
Share of Unorganized sector (2011)
1 Agriculture, Forestry and Fishing 0.43 Low High High 2 Mining and Quarrying 1.82 High High Low 3 Food Products, Beverages and Tobacco 1.84 Low Low High 4 Textiles, Textile Products, Leather and
Footwear 0.80
Low Low High 5 Wood and Products of wood 1.15 Low Low High 6 Pulp, Paper, Paper products, Printing
and Publishing 2.52
High Low High 7 Coke, Refined Petroleum Products and
Nuclear fuel 3.72
High Low Low 8 Chemicals and Chemical Products 2.17 High Low Low 9 Rubber and Plastic Products 4.93 High Low Low 10 Other Non-Metallic Mineral Products 2.03 Low High Low 11 Basic Metals and Fabricated Metal
Products 2.52
High Low Low 12 Machinery, nec. 4.00 High Low Low 13 Electrical and Optical Equipment 4.00 High Low Low 14 Transport Equipment 3.67 High Low Low 15 Manufacturing, nec; recycling 3.67 Low Low High 16 Electricity, Gas and Water Supply 2.19 High Low Low 17 Construction 6.98 Low High High 18 Trade 3.29 High Low High 19 Hotels and Restaurants 3.99 Low Low High 20 Transport and Storage 4.14 Low Low High 21 Post and Telecommunication 4.83 High Low Low 22 Financial Services 5.22 High Low Low

29
23 Business Services 8.67 High Low Low 24 Public Administration and Defense;
Compulsory Social Security 0.26
High Low Low 25 Education 3.67 High Low Low 26 Health and Social Work 3.33 High Low Low 27 Other Services 3.43 Low Low High
“Low” and “High” have been defined relative to the value for the total economy. For level of education “high” means that the proportion of employed persons with education above “higher secondary” in the industry is more than the average of total economy (10.2%). For proportion of casual labor any value less than the average value for the total economy (29.4 in 2011-12) is described as low and a value more than the total economy value is defined as high. For Share of Unorganized sector, a value less than 60 percent is taken as low and more than it is considered high.
IV: Impediments to Employment Growth and Future Prospects
IV.1 Impediment to Employment Growth
A strong, effective, and well-oriented labor market laws, regulations, policies and institutions are necessary for a healthy labor market in any country. Debates have generally centered around the role of labor market regulations on employment creation and conditions of employment. It is generally argued that excessive labor regulations tend to constrain the growth of employment and the story has been same in India. Therefore, one of the most important corrective measures to employment growth could be reducing the distortions in labor market regulations.
The debate about regulations, which mainly centers on chapter VB of Industrial Dispute Act, pertains to rigidities in response to changes in labor demand or speed of adjustment of labor, etc. The empirical evidence on the role of labor market rigidity in growth of employment in India is ambiguous. Several scholars conclude that labor market rigidity has had negative impact on growth of employment Fallon and Lucas (1991); Aghion and Burgess (2003); Hassan et al. (2003); Besley and Burgess (2004); Kochhar et al. (2006); Basu (2009); Mazumdar and Sarkar (2008); Ahsan and Pag`es (2009); Goldar (2011); Goldar and Aggarwal (2015); Saha (2015); Ramaswamy (2015); and Unni (2015). On the other hand, many scholars do not find any conclusive link between labor market flexibility and employment growth [Deshpande et al. (2004), Sunder (2005), Bhattacharjea (2006), Sharma (2006), Sood et al. (2009), Kumar (2012), Papola & Sharma (2014),and Das et al. (2015)]. However, some of these studies [Das et al. (2015)] do find evidence of firms bypassing labor market rigidities by the use of contract labor and higher capital intensity.
Though labor laws are applicable to organized sector which constitutes around 40 percent in manufacturing and 30 percent in services (Table 11), still it has affected growth of employment, especially the quality of employment by encouraging the use of contract labor. It is found that informal employment in the organized sector increased from 20.5 million in 1999-2000 to 42.1 million in 2009-10. In this context Saha, (2015) finds that labor regulations are hurting employment in the formal sector and describe the tendency of firms to use contract labor, subcontracting etc., as a response to ‘some over restrictive regulations’. It

30
may thus also be argued that relatively few regulations in the services sector as compared to the manufacturing sector may be the reason for the continuous faster growth of employment in service sector (Table 1). Unni (2015) however also points out that flexibility debate may be overstating the impact of labor legislation and the causes of labor market rigidity may be in land-related laws; banking laws on insolvency and bankruptcy; lack of infrastructure and fragmented, localized product market. It has thus been pointed out that if changes are instituted in labor regulations then it may be possible to increase employment and overall productivity, as it is possible that some of the current labor regulations might also be inducing firms to substitute capital for labor (Fernandes, 2009; pp. 165-166).
Bardhan (2014) supports the reforms in labor market and an overhaul of Indian labor laws but argues that flexibility in hiring and firing of employees has to be combined with a reasonable scheme of unemployment compensation, so that the overall reforms may help both labor and capital. Unni (2015) also supports the view that regulations should cover all—formal and informal sectors. Saha (2015) advocates for a “compromise between the worker’s interests and firms’ investment incentives”
All these studies indicate that labor market flexibility has been an issue with employers. Some employers might have been able to bypass them by different lacuna in labor laws or by subcontracting and outsourcing of many jobs or by more intensive use of capital. But this may involve a cost for the firms, and is not the best solution. This basically reinforces the argument that rigid labor laws make firms to go for contract labor, thus deteriorating the quality of jobs. Thus the need for bringing in more flexibility in the labor laws to avoid many of the adverse consequences of different labor legislations cannot be ignored.
However, OECD (2015) in its Economic Outlook report for India points out that besides labor market regulations, large Non-Performing Assets (NPAs), high leverage ratio for some companies and delay in key structural reforms are also holding back the Indian economy. The Report not only called for greater public investment in some key sectors, but also emphasized ‘the need for further improving the ease of doing business, modernizing labor regulations, implementing the Goods and Service Tax (GST) and making land transactions easier for creating more and better jobs’.
IV.2 Future Employment Prospects: Employment Elasticity and Possible Policy Initiatives
The ability of an economy to generate employment depends, among other things on the growth process and can be indicated by employment elasticity. Employment elasticity is basically a measure of the percentage change in employment associated with a one percentage point change in output growth. There could be two set of criticisms to its measurement (Misra and Suresh, 2014): (1) the employment and output relationship need not be unidirectional, (2) the notion of employment elasticity depends upon a given state of technology, wage rate and policies. It is pointed out by them that despite the criticism, it is an important indicator of sensitivity of employment to output growth and is commonly used to track sectoral potential for generating employment and for forecasting future growth in
31
employment. However, Ghose (2015a) has argued that employment elasticity at aggregate level is misleading because the growth rate in workforce tends to be almost equal to the growth rate of working age population and hence is essentially driven by demographic factors. On the contrary, the growth rate of the economy keeps varying over time for various reasons. Thus, a period of high growth is bound to show low employment elasticity but it need not necessarily imply a period of jobless growth.
The employment elasticity numbers as calculated by the Sub-Group on Employment/Unemployment Projections, set up by the Planning Commission for the 12th Five Year Plan were based on NSSO employment data up to 2009-10. For all sectors taken together the estimated employment elasticity for the period 1999-00 to 2009-10 was 0.19. In line with the Planning Commission estimates based on Compound annual average growth (CAGR) approach, Papola and Sahu (2012) have also estimated the employment elasticity to be 0.20 for the same period. The sector wise elasticity and the decline in aggregate employment elasticity for the period 1977-78 to 1999-2000 has also been documented by Papola and Sahu (2012), as well as by Rangarajan, Kaul and Seema (2007). Many studies have attempted to compute employment elasticity only for the organized manufacturing based on ASI data (Goldar, 2000, Nagaraj, 2001, Kannan & Raveendran, 2009).
Employment elasticity36 figures for the total economy and broad sectors for the three sub-periods are presented in Table 13. There has been a steep fall in employment elasticity in the third sub-period to 0.07 from 0.26 in the second sub-period and the fall in non-agriculture sector has been much smaller than that of agriculture-including forestry and fisheries. Since employment elasticity for the economy during 1980-2011 has been low (0.28), it implies that for every 10 percent increase in real GDP, there is about 2.8 percent increase in employment. It is thus necessary that GDP must grow by around 10.5 percent, much faster than at present and not in the realm of near future, so that employment growth rate of 3 percent could be achieved which is necessary to take care of employment challenge of providing employment to the backlog and the additions to labor force. Since fast growth in GDP is desired, it is essential that aggregate employment intensity is increased by focusing on those sectors where long term employment elasticity is high such as construction; trade; transport; education; health; other services; machinery, nec., etc. Papola and Sahu (2012) plead for the accelerated growth of the manufacturing sector which had high employment elasticity till 2002-03 but later on lost its employment potential. Though service sector has grown quite fast and its share in GDP is more than half, but with fall in its employment elasticity in recent years from 0.43 between 1994-95 and 2002-03 to 0.25 between 2003-04 and 2011-12, it is doubtful that how much it could contribute to future growth in employment. However, some of its segments; e.g., trade (0.47); transport (0.59); education (0.55); business services (0.64), other services (0.62) and health (0.47) have shown overall employment potential which must be tapped (Table 14) but there are only few segments, i.e., business services, education, health and other services which have consistently high employment elasticity in all the sub-periods
36 Employment elasticity has been computed by regressing log of employment over log of real value added and it gives the point elasticity of growth. The regression has been possible because we have a time series on both employment as well as real value added.

32
of analysis, and thus have shown employment potential. It is these sectors which could provide some scope for future employment generation.
Table 13: Employment Elasticity by Broad Sector and Sub-periods, 1980-93, 1994-2002, 2003-2011, and 1980-2011
Broad sector/sub-period 1980 to 1993
1994 to 2002
2003 to 2011
1980 to 2011
Agriculture, Hunting, Forestry and Fishing 0.44 0.13 -0.43 0.23 Mining and Quarrying 0.61 -0.25 0.23 0.29 Manufacturing 0.41 0.41 -0.02 0.28 Electricity, Gas and Water Supply 0.53 -0.41 0.28 0.21 Construction 1.26 1.05 1.07 0.97 Services 0.57 0.43 0.25 0.46 Total Economy 0.40 0.26 0.07 0.28
Source: Authors’ calculations from NSSO and National Accounts data.
Table 14: Employment Elasticity by Industry, 1980-83, 1994-2002, 2003-2011, and 1980-2011 SL No
KLEMS Industry Description 1980-81 to 1993-94
1994-95 to 2002-03
2003-04 to 2011-12
1980-81 to 2011-12
1 Agriculture, Hunting, Forestry and Fishing
0.44 0.13 -0.43 0.23
2 Mining and Quarrying 0.61 -0.25 0.23 0.29 3 Food Products, Beverages and Tobacco 0.44 0.24 0.08 0.29 4 Textiles, Textile Products, Leather and
Footwear 0.08 0.35 -0.32 0.10
5 Wood and Products of wood -0.45 -0.44 -0.46 -0.71 6 Pulp, Paper, Paper products, Printing and
Publishing 0.37 1.64 0.00 0.51
7 Coke, Refined Petroleum Products and Nuclear fuel
0.69 -0.25 -0.28 0.41
8 Chemicals and Chemical Products 0.44 0.18 -0.10 0.24 9 Rubber and Plastic Products 0.67 0.32 0.10 0.51 10 Other Non-Metallic Mineral Products 0.19 0.23 0.08 0.25 11 Basic Metals and Fabricated Metal
Products 0.55 0.58 0.21 0.38
12 Machinery, nec. 0.77 -0.51 0.29 0.59 13 Electrical and Optical Equipment 0.61 0.43 0.30 0.41 14 Transport Equipment 0.44 0.46 0.56 0.45 15 Manufacturing, nec; recycling 0.64 0.20 0.20 0.43 16 Electricity, Gas and Water Supply 0.53 -0.41 0.28 0.21 17 Construction 1.26 1.05 1.07 0.97 18 Trade 0.77 0.51 0.12 0.47 19 Hotels and Restaurants 0.46 0.52 0.30 0.44 20 Transport and Storage 0.73 0.74 0.33 0.59 21 Post and Telecommunication 0.68 0.46 -0.02 0.38 22 Financial Services 0.63 0.20 0.38 0.47 23 Business Service 0.79 0.57 0.52 0.64 24 Public Administration and Defense;
Compulsory Social Security 0.38 -0.04 0.02 0.07
25 Education 0.43 0.50 0.41 0.55 26 Health and Social Work 0.26 0.55 0.58 0.47 27 Other services 0.58 0.03 0.78 0.62 Total Economy 0.40 0.26 0.07 0.28
Source: Author’s calculations from NSSO and National Accounts data.

33
If employment elasticity is not only low but declining over the period, then what could be the accelerator to growth in employment and what should be the appropriate employment policies? In this context Papola and Sharma (2015) argue that new jobs are to be created in non-agricultural sectors. They envision that in the next 20-25 years, 70-75 percent of employment has to be in the non-agriculture sectors as compared to just 52 percent in 2011. So it would imply that it is the non-agricultural sectors where all the new employment opportunities would exist.
Manufacturing employment may be one alternative which could generate employment in the next phase of development. National Manufacturing Plan (NMP) has also focused on the growth of the manufacturing sector so that by 2025, it contributes 25 percent to GDP instead of the 16 percent now. It has aimed at simultaneous creation of 100 million jobs in manufacturing (Krishna, 2015). The recent initiative of ‘Make in India’ is also an endeavor in the same direction. The success of this scheme would require broad-based policy actions in enhancing human capital, access to inputs and finance and better connectivity. Growth of Micro Small and Medium enterprises (MSMEs) sector, which has emerged as a highly dynamic sector over the recent period could be an enabler of employment creation. It is well known that the MSMEs provide the maximum opportunities for both self-employment and jobs after agriculture sector and are the primary drivers of employment growth. As per the estimates of MSME Ministry, while the number of units has increased from 105.21 lakhs in 2001-02 to 467.56 lakh units in 2012-13, the employment has increased from 249 lakhs to 1061 lakhs during the same period. The MSMEs now contribute around 37.5 percent of the total output of manufacturing sector and 7.3 percent of the GDP. However it is noticed that the growth of employment as well as number of units in unregistered sector f MSME - both manufacturing and services grew faster than the registered sector between 2001-02 to 2006-07 (between the third and fourth All India Census). Retail trade and repair of HHs goods has emerged as the leading sector with share of 40 percent in 2011-12. It is hoped that if sufficient attention is given to the MSMEs and some of their challenges of finance, infrastructure and governance are addressed, then these could be a huge source of employment creation, not only in manufacturing, but also in services. Since major share of employment in MSMEs is in the unregistered sector as self -employment, it may not be skill-intensive unless new technology and new business ideas are accepted and adopted by them. Along with MSMEs, startups are also to be encouraged through promotion of an ecosystem for entrepreneurship, by providing proper incentives and a suitable technology platform for their growth (Wadhwani, 2016). It is all the more essential as manufacturing everywhere has become more capital and skill intensive. A lot of emphasis thus has to be given to increase the potential of manufacturing- both large and MSMEs. However, large public investment in electricity and other infrastructure sectors may be required to facilitate it.
Trade, especially exports is viewed as another potential engine of employment growth by many studies because of plentiful supplies of labor in India. The important empirical evidence obtained by some of the studies on trade-employment relationship is: (i) that though

34
India’s trade to GDP ratio has increased from 13 percent in 1987 to 43 percent in 2013,37 wherein the export performance was better in service sector rather than in manufacturing sector, but there is no ambiguous empirical evidence that trade liberalization has resulted in any substantial positive break in employment trends except some growth in informal employment in some specific export industries (Damodaran, 2015), (ii) exports had a positive impact and imports a negative impact on employment growth in the Indian manufacturing and the low net effect was attributed possibly to change in the composition and direction of exports (Goldar, 2002; 2009), (iii) decline in employment intensity of major exports in organized and unorganized manufacturing (Raj and Sen, 2012), (iv) change in the composition of exports to capital and skill-intensive products (Veeramani, 2012). It seems therefore from these studies that the evidence in favor of trade as an engine of employment growth is not conclusive.
So we would also have to search for few more alternative routes to employment growth and find suitable policies. Hoeven (2014) has suggested few short-term and long-term policies. For short term, he emphasizes on (i) macroeconomic policy targeting on employment rather than on inflation; (ii) considering Central Bank as agents of development- adopting an employment targeting approach; (iii) setting of minimum wages which could reduce poverty and wage inequalities. The long term policy advocated is the focus on structural change—to shift in focus from low value added activities to high value added activities. Khan (2007) suggests some policies to create employment which take care of quantity as well as quality of employment—decent work which may reduce poverty, rather than perpetuating it. The policies suggested by him are aimed at (a) increase in wage employment; (b) an increase in real wage; (c) an increase in self-employment to reduce “casualization” of labor; (d) an increase in productivity of self-employment; and (e) an increase in the terms of exchange of the output of the self-employment.
The Sub-Group on Employment/Unemployment Projections (2011), set up by the Planning Commission for the 12th Five Year Plan recommended that “while creating employment, objective should be that the work created should be (a) decent work and (b) productive employment. To achieve the latter objective transfer of surplus labor out of low productivity agriculture to industry or services would lead to an overall increase in productivity. In order to achieve the first objective two kinds of transitions would be needed: first, movement of unskilled labour from agriculture to unorganized industry or unorganized services; second, movement of labour from informal employment in the unorganized sectors to either formal employment in organized sectors (preferably), or at least informal employment in the organized sectors.” Hoeven (2014) also argues for a refocus on employment creation and adopting suitable policies. Jha (2015) emphasizes on reducing the level of under employment and or raising the real wage rates for casual workers to reduce the problem of working poor. He also advocates the creation of regular wage employment outside the organized sector, especially for poor workers by suitable labor market policies. He supports Ghose (2004) in targeting those areas where the working poor have predominant share in total employment and also fixing and enforcing a national minimum wage for unskilled casual labor. OECD 37 Source: Damodaran, S. (2015)

35
(2015) and Unni (2015) also called for suitable complementary policies related to further improving the ease of doing business, modernizing labor regulations, implementing the GST and making land transactions easier, framing proper banking laws on insolvency and bankruptcy; investment in infrastructure- especially in power and roads for creating more and “better jobs.” All the studies thus call for designing of suitable policies for a faster growth in employment and to provide for “good” jobs. We thus find that suitable policies aimed at creation of regular wage employment, especially outside the organized sector along with increase in real wages may go a long way in creating not only more jobs, but also decent jobs. Emphasis has to be laid on removal of infrastructural bottlenecks and loosening of State controls and regulations so as to make it easy for the industry, both domestic and foreign to grow and create more employment.
V: Conclusion
The importance and role of structural change in the process of economic growth has been emphasized in the economic literature for long time. It has been suggested by Kuznets (year) that traditionally a shift of employment from less productive agriculture to more productive manufacturing and later to services would take place with economic growth. However, the recent literature has shown that rising GDP per capita is associated with an increase in the share of services in total employment and a decline in agriculture (Kongsamut et al., 2001). The share of industry by contrast first increases modestly and then may stabilize or decline (Gorden & Gupta, 2003).The present paper has attempted to examine the pattern of growth of employment in India and the nature of structural transformation in its growth journey. The paper has used the India KLEMS data base, version 2015 which provides employment and labor quality estimates for 27 industries comprising the total economy and six broad sectors.
The results show that employment, as measured by persons employed has almost stagnated in the 2000s; especially between 2004-05 (61st NSSO round) and 2009-10 (66th NSSO round) when only 1 million jobs were added. However, India witnessed an increase in employment of 14 million persons between the 2009-10 (66th round) and 2011-12 (68th round).We observe that while employment increased at a rate of almost 2 percent during the first sub-period of the analysis- 1980-1993, the rate slowed down to just 1 percent during the sub-period 2003-2011. While the growth of employment has been highest in construction sector in all the sub-periods, the growth rate is negative in agriculture during 2003-2011, as a result of which the share of agriculture in total employment has reduced to just 48 percent in 2011 as compared to 70 percent in 1980 and 60 percent in 2000. It is also noted that growth rates of persons employed have not been uniform across all industries and considerable variations are observed in growth rates of labor persons employed across industries. Over the period 1980-2011, while employment grew at 5 percent in business services, construction, financial services, rubber & plastic products, and post & telecommunication; it grew at less than 2 percent in some industries such as food products, mining and quarrying, wood and wood products, agriculture, hunting, forestry & fishing, and public administration. As a result of this pattern of growth of employment, we find that there has been a structural shift of employment from agriculture to construction and services, especially market-based services.

36
While the share of agriculture in total employment reduced from 70 percent in 1980 to 48 percent in 2011, that of construction and services increased from 2 percent to 10.4 percent and 17 percent to 29 percent, respectively, during the same period.
In India, agriculture thus still occupies a prominent place in providing employment, though its share has reduced substantially over time. However, the shift of labor has not been to manufacturing, whose share remained almost stagnant but to construction and services sectors. Relatively few labor regulations in these sectors could be one of the reasons for the higher growth of employment in the sectors. Though the overall employment elasticity has been very low in recent years but it has been relatively high in both construction and services sectors. However, whether construction and service sectors have absorbed and would continue to absorb the surplus labor from agriculture can be debated. But, with a massive need of infrastructure in the Indian economy, construction sector may continue to absorb surplus labor from agriculture for a long time in future. While the skill composition of agriculture is similar to that of construction- both have predominantly ‘less’ educated labor force, so a shift of labor from agriculture to construction is possible and may be easier, but doubts can especially be expressed on the shifting of surplus agriculture labor to service sector where overall skill composition is different- where more “educated or skilled” labor is required (Table 7). Surplus or displaced agriculture labor, which is generally unskilled, has generally taken employment as self –employed or casual labor mostly in the informal sector of the economy. Manufacturing sector has not been able to absorb the surplus labor because the technology available and used has been either capital or skill intensive, with limited scope to expand employment. Rigid labor laws in different states have also not helped the growth in employment in the manufacturing sector.
The concerns in India are not only about the slow growth of employment, but also the ‘bad’ quality of employment. India is now faced with poor among employed (one-fourth of total); low share of persons employed with skills (only 10% with education ‘above higher secondary’); low growth rate in educational attainment (only 1.43% during 1980-2011); high proportion of persons employed as casual labor (30% in 2011) and a very high share of unorganized sector employment (70% in 2011). The educational profile of the Indian employed persons shows that most of the employed persons still have low education levels and they are employed in mostly the ‘traditional’ industries. For ‘modern’ manufacturing industries and the service sector industries higher skill sets would be required to benefit from demographic dividend. Though the reality is that steep fall in employment elasticity (0.07) during 2003-2011 paints a very disappointing scenario. Even the sustainability of the service sector to provide jobs in near future is in doubt because of its falling employment elasticity in recent years. The situation thus calls for suitable short term and long term employment policies. The policies to create employment must be designed to take care of quantity as well as quality of employment-decent work to reduce poverty, rather than perpetuating it. Policy interventions on both demand and supply side of labor may be needed. Macroeconomic policies should aim at increasing the aggregate demand of goods which could push investment and employment. The policies could aim at increasing wages, the disposable income of households, a social security cover for households, and continuation of policies

37
like Mahatma Gandhi National Rural Employment Guarantee Act (MNREGA) and The Pradhan Mantri Gram Sadak Yojana (PMGSY). Supply of labor could be enhanced by encouraging the participation of more and more women in the labor force by removing barriers which they face. The quality of employment needs to be improved by better access to education and facilitating the expansion of formal employment.

38
Appendix Table 1: WFPR by Gender in Rural and Urban Areas in Seven NSS Rounds (%) (UPSS)
Round Rural Rural Rural Urban Urban Urban Total Total Total
Males Females Persons Males Females Persons Males Females Persons
38th (1983) 54.72 33.97 44.54 51.21 15.11 34.06 53.87 29.6 42.05
43rd (1987-88) 53.89 32.31 43.39 50.65 15.22 33.74 53.15 28.51 41.21
50th (1993-94) 55.3 32.79 44.37 52.11 15.46 34.7 54.49 28.56 41.97
55th (1999-00) 53.06 29.88 41.72 51.76 13.90 33.67 52.73 25.89 39.67
61st (2004-05) 54.62 32.7 43.88 54.86 16.60 36.53 54.68 28.67 42.01
66th (2009-10) 54.7 26.08 40.78 54.28 13.77 34.99 54.58 22.77 39.2
68th (2011-12) 54.3 24.8 39.9 54.6 14.70 35.5 54.4 21.9 38.6
Note: 1.UPSS is usual principal and subsidiary status. WFPR is the workforce participation rate. Source: NSSO, 38th, 43rd, 50th, 55th , 61st , 66th and 68th rounds.

39
References Aggarwal, S.C., and A.A. Erumban (2013), Labor Input for Measuring Productivity Growth in India: Methodology and Estimates, Mimeo.
Aghion, Philippe and Robin Burgess (2003), “Liberalization and Industrial Performance: Evidence from India and the UK,” Paper presented at the conference, The Future of Globalization at Yale University. Aghion, Plilippe and Peter Howitt (2009), The Economics of Growth. Delhi: PHI Learning Private Limited.
Ahsan, A. and C. Pag`es (2009), “Are All Labour Regulations Equal? Evidence from Indian Manufacturing,” Journal of Comparative Economics 37(1):62-75.
Amsden, A. (2011), The Rise of the Rest: Challenges to the West from the Late-Industrializing Economies. Oxford, OUP.
Asian Development Bank (2007), “Asian Development Outlook 2007.” Special Chapter Growth and Change and special Volume Growth and Change in Developing Asia, Manila.
Bardhan, P. (2014), “The Labour Reform Myth,” The Indian Express, 23rd August, 2014.
Barro, Robert J. (1997), Determinants of Economic Growth: A Cross Country Empirical Study. Cambridge. MA: MIT Press.
Barro, Robert J. and X. Sala-i- Martin (1995), Economic Growth. New York: McGraw Hill.
Barro, Robert J., and Jong-Wha Lee (2001), “International data on educational attainment: updates and implications,” Oxford Economic Papers, vol 3, pp 541-563.
Barro, Robert J., and Jong-Wha Lee (2013), “A New Data Set Of Educational Attainment in the World, 1950–2010,” Journal of Development Economics, vol. 104. Pp 184-198.
Basu, Kaushik (2015), “China and India: Idiosyncratic Paths to High Growth,” in Uma Kapila (Ed.): Indian Economy Since Independence, New Delhi: Academic Foundation.
Basu, Kaushik and Annemie Maertens (2009), “The Growth of Industry and Services in South Asia,” in Ejaz Ghani and Sadiq Ahmed (Eds.): Accelerating Growth And Job Creation In South Asia, OUP. Basu, Santanu and Sushanta Mallick (2007), “When does growth Trickle Down to the Poor? The Indian Case,” Cambridge Journal of Economics. Vol. 32: 461-77.

40
Benhabib, J. and M.M. Spiegel (1994), “The Role of Human Capital in Economic Development: Evidence from Aggregate Cross Country Data.” Journal of Monetary Economics, 34:143-173.
Besley, Tim and Robin Burgess (2004), “Can Labour Regulation Hinder the Growth of Industry and Services in South Asia Economic Performance? Evidence from India,” Quarterly Journal of Economics, 119(1): 91–134. Bhattacharjea, Aditya (2006), “Labour market regulation and industrial Performance in India: a critical review of the empirical evidence,” Indian Journal of Labour Economics, Vol 49(2), pp.211-32, New Delhi. Bosworth, Barry and Susan M. Collins (2008), “Accounting for Growth: China and India,” Journal of Economic Perspective.
Bosworth, Barry, Susan M Collins and Arvind Virmani (2007). “Sources of Growth in Indian Economy,” NBER Working Paper 12901. Central Statistical Organisation (2011). Population of India, different years. Chaddha, G. K. (2003). “Issues in Employment and Poverty,” Discussion Paper 7, Recovery and Reconstruction Department, International Labour Office, Geneva. Chandrasekhar, C.P. (2008). “Revisiting the Policy Environment for Engendering Employment Intensive Growth,” Background Paper prepared for ILO, New Delhi.
Chandrasekhar, C.P. (2015). “Promise Belied: India’s Post Independence Industrialization Experience” in C.P. Chandrasekhar (ed): Economics: Indian Industrialization, Vol I, ICSSR Research Surveys and Explorations. New Delhi: Oxford.
Chandrasekhar, C.P. and Jayati Ghosh (2006). “Working More for Less,” Macroscan: An Alternative Economics Webcentre, 28th November 2006. Available at www.macroscan.org.
Cornwall, J. (1977). Modern Capitalism: Its Growth and Transformation. London: Robertson
Damodaran, Sumangla (2015). “Trade and Employment in India,” in Jayati Ghosh (ed): India and the International Economy. Vol II: ICSSR Research Surveys and Explorations Economics
Das, D. K., A.A. Erumban, Suresh Aggarwal, and Sreerupa Sengupta (2013). “Revisiting the Service-led Growth in India: Understanding India’s Service Sector Productivity Growth,” Paper prepared and presented at the IARIW-UNSW special conference on“ Productivity Measurement, Trends and Drivers” organized by School of Economics, University of New South Wales in Sydney on 26-27 November 2013.

41
Das, D. K., A.A. Erumban., Suresh Aggarwal and S. Sengupta (2015). “Productivity growth in India under different Policy Regimes,” In Jorgenson, D., M.P.Timmer and K.Fukao (eds), The World Economy: Growth or Stagnation?, Cambridge University Press.
Das, D. K., Kunal Sen and Pilu Chandra Das (2015). “Labour Intensity in Indian Manufacturing”; in Ramaswamy, K.V. (Ed) Labour, Employment and Economic Growth in India, Cambridge University Press, Delhi.
Denison, Edward F. (1962). “The sources of Economic Growth in the United States and the alternatives before US,” Supplementary paper 13, New York: Committee for Economic Development. Deshpande, L. K., Alakh N Sharma, A. Karan and S. Sarkar (2004). Liberalization and Labour: Labour Flexibility in Indian Manufacturing. New Delhi: IHD.
Erumban, A.A., D.K.Das, Suresh Aggarwal and Pilu Das (2015). “The Industry Origins of Economic Growth and Structural Change in India,” paper prepared for presentation at the India KLEMS Workshop, December, 17, 2015, Delhi School of Economics, New Delhi.
Fallan, P. and R.E.B. Lucas (1991). “The Impact of Job Security Regulations in India and Zimbabwe,” The World Bank Economic Review 5(3):395-413.
Felipe, Jesus (2010). Inclusive Growth, Full Employment, and Structural Change: Implications and Policies for Developing Asia. ADB: Anthem Press.
Felipe, Jesus and Gemma Estrada (2008). "Benchmarking Developing Asia's Manufacturing Sector", International Journal of Development Issues, Vol. 7(2): 97 – 119.
Felipe, Jesus and Rana Hasan (2006). Labour Markets in Asia: Issues and Perspectives. Basingstoke, UK: Palgrave Macmillan.
Felipe, Jesus, León-Ledesma, Miguel; Lanzafame, Matteo; Estrada, Gemma (2007). Sectoral Engines of Growth in Developing Asia: Stylized Facts and Implications. Manila: Asian Development Bank. Fernandes, Ana M. and Ariel Pakes (2009). “Evidence of Underemployment of Labour and Capital in Indian Manufacturing” in Ejaz Ghani and Sadiq Ahmed (Eds): Accelerating Growth and Job Creation in South Asia, OUP. Fields, G. (2007). “Economic Development, Labour Market and Poverty Reduction,” Policy and Issue Briefs, 24. Ithaca, NY: School of Industrial and Labour Relations, Cornell University.
Fosgerau, Mogens; et al (2002). “Measuring Educational Heterogeneity and Labor Quality: A Note,” Review of Income and Wealth, 48 (2), June, pp. 261-69.
42
Fox, L. and Gaal, M. (2008). Working Out of Poverty: Job Creation and the Quality of Growth in Africa. Washington DC: World Bank.
Ghose, Ajit. K. (2004). “The Employment Challenges in India,” Economic and Political Weekly, 39(48), 5106-16.
Ghose, Ajit. K. (2015). “Service-led Growth and Employment in India” in Ramaswamy, K.V. (ed): Labour, Employment and Economic Growth in India, Cambridge University Press, Delhi. Ghose, Ajit. K. (2015a). “ Draft India Employment Report -2016” a panel discussion at 57th Annual conference of The Indian Society of Labour Economics, Srinagar, J&K, 10-12 October.
Goldar, Bishwanath (2000). “Employment Growth in Organized Manufacturing in India,” Economic and Political Weekly, vol 35, no 14, April 1-7, pp 1191-1195.
Goldar, Bishwanath and Amit Sadhukhan (2015). “Employment and Wages in Indian Manufacturing: Post Reform Performance,” Employment Working Paper No. 185: Employment Policy Department, ILO.
Goldar, Bishwanath and Suresh Chand Aggarwal (2015). “Gender Discrimination in Manufacturing Employment in India, 1999-2009’, in Ramaswamy, K.V. (ed): Labour, Employment and Economic Growth in India, Cambridge University Press, Delhi Gorden, Jim and Poonam Gupta (2003). “Understanding India’s Services Revolution,” Paper prepared for the IMF-NCAER ConferenceA Tale of Two Giants: India and the China’s Experience with Reform, November 14-16, New Delhi.
Government of India (2011). Report of the Subgroup on employment for the 12th five year Plan, December. Harrison, A. (2002). “Has Globalization Eroded Labour’s Share? Some Cross Country Evidence.” Cambridge, MA.NBER. Mimeo
Hassan, Rana, Devashish Mitra and K V Ramaswamy (2003). “Trade Reforms, Labour Regulations and Labour Demand Elasticities: Empirical Evidence from India,” Working Paper 9879, National Bureau of Economic Research, Cambridge MA. Hoeven, Rolph van der (2014). “Employment, Poverty and Development: Do we have the Priorities Right?” in Giovanni Andrea Cornia and Frances Stewart: Towards Human Development: New Approaches to Macro Economics and Inequality, OUP, UK.
ILO (2002). Women and Men in the Informal Economy: A Statistical Picture, Report, 2nd edition. ILO, Geneva.

43
ILO (2011).Global Employment Trends 2011: The Challenge of a Jobs Recovery, ILO, Geneva.
ILO (2014). World of Work Report 2014: Developing with Jobs, ILO, Geneva.
Islam, R. (2008). “Has Development and Employment through Labour Intensive Industrialization Become History?” in Kaushik Basu and R Kanbur (eds), Arguments for a Better World: Essays for Amartya Sen, Vol II.
Jha, Praveen (2015). “Labour Conditions in Contemporary India,” in Prabhat Patnaik (ed) Economics: Macroeconomics, Vol IIIICSSR Research Surveys and Explorations. New Delhi: Oxford
Jorgenson, Dale W., Frank M. Gollop, and Barbara M. Fraumeni (1987). Productivity and U.S. Economic Growth, Cambridge, Harvard University Press.
Kaldor, N. (1970). “The Case for Regional Policies,” The Scottish Journal of Political Economy,
Vol 17:337-348.
Kannan, K. P. and G. Raveendran (2009). “Growth sans Employment: A Quarter Century of Jobless Growth in India’s Organized manufacturing,” Economic and Political Weekly 44(10):80-91. March 7.
Khan, A. (2007). “Growth, Employment and Poverty” in J.A. Ocampo and K.S. Jomo (eds), Towards Full and Decent Employment. London: Xed Books, 123-57.
Kochhar, K., U. Kumar, R. Rajan, A Subramanian and I. Tokattidis (2006). “India’s Pattern of Development: What happened, What Follows,” Journal of Monetary Economics 53(5):981-1019.
Kongsamut, Piyabha, Sergio Rebelo and DanyangXie (2001). “Beyond Balanced Growth,” IMF Working Paper, WP/01/85
Krishna, K.L. (2015). “Industrial development and Policies since Independence: Growth without Employment” in Uma Kapila (ed): Indian Economy Since Independence, New Delhi: Academic Foundation.
Kucera, D. and L. Roncolato, (2008). “Informal Employment: Two Contested Policy Issues” International Labour Review, 147(4):321-48.
Kumar, Vinita (2012). “Labour Laws: Are they Holding Back Manufacturing Sector Growth and Employment in India? in Rajeev Malhotra (ed), A Critical Decade: Policies for India’s Development. New Delhi: Oxford University Press.
Lim, J. (2000). “The Effects of the East Asian Crisis on the Employment of Women and Men: the Philippines case,” World Development 28(7): 1285-1306.

44
Lucas, R.E., Jr (1988). “On the Mechanics of Economic Development,” Journal of Monetary Economics, 22(1): 3-42.
Mankiw, N.G., D. Romer, and D.N. Weil (1992). “A Contribution to the Empirics of Economic Growth,” Quarterly Journal of Economics, 124(2):771-807.
Mazumdar, D. and S. Sarkar (2008). Globalization, Labour Markets and Inequality in India. London and New York: Routledge and IRDC.
Mehrotra, S (2014). India’s Skill Challenge. Reforming Vocational education and training to harness the demographic dividend, Oxford University Press, New Delhi.
Mehrotra, S., Parida, J., Sinha, S., & Gandhi, A. (2014). “Explaining Employment Trends in the Indian Economy: 1993-94 to 2011-12,” Economic and Political Weekly, 49(32), 49-57.
Mehrotra, S (2016). Seizing the Demographic Dividend Policies to Achieve Inclusive Growth in India, Cambridge University Press, New Delhi.
Misra, Sangita and Anoop K Suresh (2014). “Estimating Employment Elasticity of Growth for the Indian Economy,” RBI Working Paper Series: 06/2014 Moreno-Monroy, et al (2014). “Formal Sector Subcontracting and Informal Sector Employment in Indian Manufacturing,” IZA Journal of Labor & Development, 3:22. Nagaraj, R. (2001). “Organised manufacturing employment,” Economic and Political Weekly, September 16, vol. 35, No-38, pp 3445-3448.
Nagraj, R.(2005). “Industrial Growth in China and India: A Preliminary Comparison,” Economic
and Political Weekly, Vol 40(21) May 21-27: 2163-2171.
National Commission for Enterprises in the Unorganized Sector (NCEUS) (2007). “Financing of Enterprises in the Unorganized Sector and Creation of a National fund for Unorganized Sector (NAFUS),” New Delhi: National Commission for Enterprises in the Unorganized Sector, GOI, November.
National Commission for Enterprises in the Unorganized Sector (NCEUS) (2008). “Definitional and Statistical Issues Relating to the Informal Economy,” New Delhi: National Commission for Enterprises in the Unorganized Sector, GOI.
National Sample Survey Office (2001a). “Non –agricultural Enterprises in the Informal Sector in India, 1999-2000.” Key Results, Report No. 456. New Delhi: National Sample Survey Office, Ministry of Statistics and Programme Implementation, GOI.

45
National Sample Survey Office (2001b). “Informal Sector in India, 1999-2000.” Salient Features, Report No. 459. New Delhi: National Sample Survey Office, Ministry of Statistics and Programme Implementation, GOI.
National Sample Survey Office, Employment and Unemployment in India, Different Rounds
Nayyar, Gaurav (2009). “The Nature of Employment in India’s Services Sector: Exploring the Heterogeneity,” No 452, September 2009, Discussion Paper Series, Department of Economics, University of Oxford, Oxford.
Nayyar, Gaurav (2012). The Service Sector in India’s Development, Cambridge University Press, New York.
Nelson, R. and E. Phelps (1966). “Investment in Humans, Technological Diffusion, and Economic Growth,” American Economic Review, 61,69-75.
OECD (2015). OECD Economic Outlook, November 2015. Paris: OECD.
Overseas Development Institute (ODI) (2011). “Jobs, growth and Poverty: What do we know, what don’t we know, what should we know?,” Background Note: ODI. May.
Pais, Jesim (2015). “Informal Sector industry in India: A Brief Review,” in CP Chandrasekhar (ed): Economics: Indian Industrialization, Vol I, ICSSR Research Surveys and Explorations. New Delhi: Oxford.
Panagariya, A. (2008). India: The Emerging Giant. New Delhi: Oxford.
Papola, T.S. (2008). “Employment Challenge and Strategies in India,” Asia Pacific Working Paper series. New Delhi: ILO.
Papola, T.S. and Alakh N Sharma (2015). “Labour and Employment in Fast Growing India: Issues of Employment and Inclusiveness” in Uma Kapila (Ed): Indian Economy since Independence, Academic Foundation, New Delhi.
Papola, T.S. and Partha Pratim Sahu (2012). Growth and Structure of Employment in India: Long-Term and Post-Reform Performance and the Emerging Challenge, Institute for Studies in Industrial Development, New Delhi.
Polaski, Sandra (2015). “The current reality and future of work, in India and beyond,” MOLE IHD-ILO public lecture, New Delhi, 7th October.
Raj, S. R. Rajesh and K. Sen. (2012). “The Impact of International Trade on Manufacturing Employment In India” in K. Pushpangadan and V.N. Balasubramanyam (eds) , Growth, Development and Diversity: India’s record since Liberalization. New Delhi: Oxford.

46
Ramaswamy, K.V. (2015). “Employment Protection Legislation and threshold Effects,” in Ramaswamy, K.V. (ed): Labour, Employment and Economic Growth in India, Cambridge University Press, Delhi.
Ramaswamy, K.V. and Tushar Agrawal (2012). Services-led Growth, Employment and Job Quality: A Study of Manufacturing and Service-sector in Urban India, Indira Gandhi Institute of Development Research, Mumbai.
Rangarajan, C. (2009). India Monetary Policy, Financial Stability and Other Essays, Academic Foundation, New Delhi
Rangarajan, C., Padma Iyer Kaul and Seema (2007). “Revisiting Employment and Growth,” Money and Finance, September.
Rangarajan, C., Seema and E.M. Vibeesh (2013).“Developments in the workforce between 2009-10 and 2011-12,” Economic and Political Weekly, 49(23). June 7.
Romer, P. (1990). “Endogenous Technological Change,” Journal of Political Economy. 98(5): S71-S102.
Saha, Bibhas (2015). “From Rigidity to Flexibility: Changes in Indian labour Market” in Ramaswamy, K.V. (ed): Labour, Employment and Economic Growth in India, Delhi: Cambridge University Press.
Sarkar, Sandip and Balwant Singh Mehta (2010). “Income Inequality in India: Pre and Post Reform Periods,” Economic and Political Weekly, 45(37):45-55.
Sasikumar, S.K. and R. Thimothy (2013). “Surmounting India’s employment Challenge: Evidence from NSSO data (2004-05 to 2011-12),” Labour and Development 20(1). June.
Sharma, Alakh N. (2006). “Flexibility, Employment and Labour Market Reforms in India,” Economic and Political Weekly, 41(24):2278-85.
Sood Atul, Paaritosh Nath, and Sangeeta Ghosh (2014). “Deregulating Capital, Regulating Labour: The Dynamics in the Manufacturing Sector in India,” Economic & Political Weekly, June 28, Vol. XLIX, Nos 26 & 27: 58-68. Srivastva, Nisha and Ravi Srivastva (2010). “Women, Work and Employment Outcomes in Rural India,” Economic and Political Weekly, 45(28):49-63.
Sundaram, K. (2007). “Employment and Poverty in India, 2000-2005,” Economic and Political Weekly, Vol. XLII (30), pp.3121-31.
Sundaram, K. (2008). “Measurement of Employment and Unemployment in India: Some Issues,” Seminar of the National Statistical Commission, December, New Delhi.

47
Sunder, Shyam K.R. (2005). “Labour Flexibility Debate in India: A comprehensive Review and Some Suggestions,” Economic and Political Weekly, 40(24): 2274-85.
Syrquin, Moshé (1986). “Growth and Structural Change in Latin America since 1960: A Comparative Analysis,” Economic Development and Cultural Change, Vol. 34(3). Thomas, Jayan Jose. (2011). “Locked in a Low –Skilled Equilibrium? Trends in Labour Supply and Demand in India,” Indian Journal of Labour Economics 54(2):195-218.
Thomas, Jayan Jose. (2015). “India’s labour Market during the 2000s,” in Ramaswamy, K.V. (ed): Labour, Employment and Economic Growth in India, Delhi: Cambridge University Press.
Unni, Jeemol (2015). “Employment and Industrial Development in India,” in CP Chandrasekhar (ed): Economics: Indian Industrialization, Vol. I, ICSSR Research Surveys and Explorations. New Delhi: Oxford.
Veeramani, C. (2012). “Anatomy of India’s Merchandise Export growth, 1993-94 to 2010-11,” Economic and Political Weekly, 47(1).
Wadhwani, Romesh (2016). “India’s Jobs Crisis,” Times of India, Feb 9th.
******************