k-7 corridor management plan prepared for - ksdot.org · k-7 corridor management plan 223rd street...
TRANSCRIPT

K-7 Corridor Management Plan
223rd Street in Miami County toK-5/Muncie in Leavenworth
February 2006
PREPARED FOR
Kansas Department of Transportation
PREPARED BY
George Butler Associates, Inc.HDRStinson Morrison Hecker, L.L.P.Foth and Orrick, L.L.P.DOC CommunicationsTJ Brown and Associates
IN ASSOCIATION WITH
Kansas Turnpike AuthorityMid-America Regional CouncilLeavenworth CountyUnified Government of WyandotteCounty and Kansas City, KansasJohnson CountyMiami County
The City of LeavenworthThe City of LansingThe City of BasehorThe City of Bonner SpringsThe City of ShawneeThe City of LenexaThe City of OlatheThe City of Spring Hill

AcknowledgementsK-7 Corridor Management StudyMiami, Johnson, Wyandotte and
Leavenworth Counties
Preparation of this report required the input and efforts of many team members from the Kansas Department of Transportation and the HNTB
study team, as well as community offi cials and the general public. This report acknowledges and expresses our appreciation for everyone’s efforts.
Kansas Department of TransportationDeb Miller
Terry HeidnerMick HalterJulie Lorenz
Sally HowardJerry YoungerJoe BlubaughChris HerrickThomas DowRobert Ott
HNTB CorporationJoe BrandChris RopsAdam DayhoffRobyn ArthurKip StraussBrian ComerElizabeth GarvinPaul Lemon
FHWAMark Huffi nes
George Butler AssociatesTim RossPaul BertrandMandy SiemonTodd Jones
HDRChristopher KinzelJason WaldronMolly Nick
Stinson Morrison Hecker, L.L.P.Steven Chinn
Foth and Orrick, L.L.P.Tim Orrick
DOC CommunicationsMichael DeMentSusan Tolleson
Technical CommitteeRon Achelpohl - MARCTodd Ashby - MARCFred Backus - Unifi ed GovernmentNorm Bowers - Johnson CountyKevin Bruemmer - Bonner SpringsPaul Chaffee - ShawneeTim Collins - LenexaPenny Evans - Miami CountyBrant Gaul - LenexaJerry Gies - LeavenworthKenny Hamm - Spring HillMike Hooper - BasehorJohn Jacobson - LansingBill Lahey - Bonner SpringsAlonzo Linan - OlatheMike McDonald - LeavenworthJanet McRae - Spring HillGene Myracle - BasehorDavid Peterson - Spring HillBrian Pietig - Johnson CountyRob Richardson - Unifi ed GovernmentSteve Schooley - LenexaMark Sherfy - ShawneeDon Slone - Bonner SpringsMichael Spickelmier - Leavenworth CountyJohn Young - LansingJohn Zoellner - Leavenworth County
Advisory Council MembersRon Achelpohl - MARCMac Andrew - Johnson CountyKenneth Bernard - LansingRick Biery - OlatheThomas Cooley - Unifi ed GovernmentIris Dysart - BasehorPenny Evans - Miami CountyRon Freyermuth - ShawneeArt Godfrey - Miami CountyBrian Grittmann - LeavenworthRick Hanson - Spring HillJohn Helin - Bonner SpringsChris Garcia - BasehorBob Montgomery - OlatheDonald Navinsky - Leavenworth CountyMike Novosel - ShawneeGary Ortiz - LeavenworthDean Palos - Johnson CountyJonathan Roberts - Spring HillRobert Roddy - Unifi ed GovernmentSteve Schooley - LenexaMike Smith - LansingClausie Smith - Bonner SpringsMichael Spickelmier - Leavenworth CountyTom Wurdeman - Kansas Turnpike Authority
i

K-7 Corridor Management Study
Executive Summary . . . . . . 1
Study Introduction and Approach . . . 2 History of the K-7 Corridor Study . . . . 2 Purpose and Objectives . . . . . 2 Limits . . . . . . . . 3 Approach and Schedule . . . . . 5
Meetings . . . . . . . . 6 Meetings and Workshops . . . . . 6 Presentations . . . . . . . 6 Surveys . . . . . . . 6
Traffi c Analysis . . . . . . . 9 Traffi c and Land Use . . . . . . 9 Study Methodology . . . . . . 9 Land Use . . . . . . . 9 Existing Land Use . . . . . . 10 Future Land Use for 2030 and Ultimate Build Out . . 10 The Economics of Mobility vs. Accessibility . . . 12 Travel Model . . . . . . . 12 Traffi c Analysis . . . . . . . 15 Operational Analysis . . . . . . 22
Street Network . . . . . . . 25 Introduction . . . . . . . 25 K-7 Corridor . . . . . . . 25 Local Street Network . . . . . . 25 Implementation . . . . . . 27 Segment 1 Summary . . . . . . 27 Segment 2 Summary . . . . . . 28 Segment 3 Summary . . . . . . 28
Access Management/Corridor Preservation Tools . . . 29 Introduction . . . . . . . . . 29 Access Management Tools . . . . . . . 29 Corridor Preservation Tools . . . . . . . 30
Cost Estimates . . . . . . . . . 32 Introduction. . . . . . . . . . 32 Constructible Sections . . . . . . . 32 Per Mile Breakdown . . . . . . . . 32 Segment Costs . . . . . . . . 33
Memorandum of Understandings and Next Steps . . . 35 Memorandum of Understanding . . . . . . 35 Corridor Review Committee . . . . . . . 35 Innovative Financing . . . . . . . . 35 Parcel Maps . . . . . . . . . 37 Corridor Preservation/Access Management . . . . . 37 Permanent Improvements . . . . . . . 37 Interim Improvements . . . . . . . 37
Appendix . . . . . . . . . . 39Appendix Sheet Guide . . . . . . . . 39A. K-7 Mainline Plate Drawings . . . . . . . 40B. Intersection Plate Drawings . . . . . . . 55
ii

Executive Summary
The K-7 Corridor Management Study began in January of 2004 in response to a decision by the Kansas Department of Transportation (KDOT) and the local communities that a more comprehensive study of the corridor was needed. The study needed to address more areas than just the technical elements of K-7, it needed to address local concerns and identify necessary improvements for the total transportation system well into the future. Since that time study team partners which included KDOT, Kansas Turnpike Authority (KTA), Mid-America Regional Council (MARC) and the communities of Miami County, Spring Hill, Johnson County, Olathe, Lenexa, Shawnee, Bonner Springs, Unifi ed Government, Basehor, Leavenworth County, Lansing, and Leavenworth worked together in a collaborative effort to arrive at recommendations for an achievable K-7 Corridor Plan.
Unlike previous studies, this new study focused on (1) the K-7 mainline and the local street network, (2) more community involvement, and (3) concrete recommendations and implementation responsibilities through Memorandums of Understanding (MOU). Specifi cally, the primary objectives of the study were as follows:
• Determine Facility Type (freeway vs. urban arterial)
• Develop Access Requirements and Street Network System
• Determine Right-of-Way Preservation Needs
• Develop a Phased Implementation Plan Given the Lack of Current Funding
• Execute Memorandums Of Understanding
Through development of a comprehensive travel demand model and future land use plan crafted through input from each community, traffi c forecast information was developed. From this information, a recommendation was made for a freeway facility type along the entire corridor. Given the communities vision for future land use, an arterial facility would ultimately be unable to accommodate the anticipated traffi c resulting in signifi cant congestion and unacceptable levels of service for the corridor. While not every community agreed in total with the recommendation of a freeway, every community did agree that it would be prudent to preserve the right-of-way needed for a freeway with interchanges in order to not preclude the ability to build a freeway in the future. As a result, a series
of meetings were held to determine the future locations of interchanges and overpasses as well as to layout the local street system to ensure the total transportation system worked together in the future. Conceptual interchange confi gurations and local street requirements were then used to establish a conceptual right-of-way preservation footprint for the entire corridor. While additional design will be performed to refi ne the improvements. The right-of-way footprint is a good fi rst step.
It was also recognized that given the lack of funding to build the freeway today, interim improvements would be needed to accommodate the growing traffi c demand. Examples of interim improvements included adding traffi c signals and turn lanes at future interchange and overpass locations knowing that these would need to be converted into interchanges and overpasses in the future. Other examples of interim improvements included reducing access to K-7 and preserving important tracts of land for future improvements. Given the uncertainty of the timing of future development, it was impossible to predict the priority and order of implementation of the interim and ultimate improvements over time. The report’s purpose was to provide guidelines for interim improvements that could occur and the expectations for what would ultimately need to occur.
Finally, Memorandums of Understanding (MOU’s) were developed with each community to establish roles and responsibilities for KDOT and the local communities in implementing the K-7 Corridor Management Plan. These MOU’s formalized the continued collaborative environment initiated by the study and created a moral framework for implementing the recommendations of the study. The MOU’s also established a K-7 Corridor Review Committee made up of representatives from KDOT and the local communities. The committee’s purpose will be to meet periodically to review the corridor plan, assess development issues, and evaluate compliance with the K-7 Corridor Management Plan.
In summary, this study was just the fi rst step in what will be a long term effort to ensure effective development along the K-7 Corridor through safe and effi cient management of traffi c and access. With the K-7 Corridor Management Plan and MOU’s in place, it will be up to KDOT and the local communities to collaboratively work together to implement the Plan and carry out the “next steps”.
1

Study Introduction and Approach
History of the K-7 Corridor Study
K-7 has long been recognized as a vital north-south travel corridor in the western side of the Kansas City metropolitan area which has experienced on-going rapid development. The study area’s nearly 40-mile length from 223rd Street in Miami County to K-5/Muncie in Leavenworth, links local cities in the south like Spring Hill to cities in the north like Leavenworth (refer to Figure 1 – Study Area Map in the Limits section). In addition, K-7 experiences statewide travelers extending as far south as Oklahoma and north to Nebraska.
A Technical Report was completed for the K-7 Corridor in 2002. It examined what the impact would be of allowing the corridor to develop as it had been with the limitation of only looking at a 20 year future time horizon. The report’s focus was strictly technical to give a better idea of the magnitude of the issues along the corridor and a potential range of solutions.
Throughout the development of the 2002 Technical Report and continuing to this day, there has been a lot of pressure from development along the corridor. There was a need to provide communities with an answer on what the future of the K-7 Corridor would be. Given the development pressures and communities’ need to plan their future, Secretary Miller held a workshop on November 4, 2003 to discuss the future of the K-7 Corridor. The overwhelming consensus from the workshop was that a more comprehensive corridor master plan needed to be developed immediately. As a result, Secretary Miller made a commitment to fund a more comprehensive study and asked the communities to provide staff time and assistance in support of the study.
The K-7 Corridor Management Study which began in January of 2004, has addressed more areas than just the technical elements of K-7. It has addressed local concerns and identifi ed needed improvements well into the future. Since the beginning of the study, KDOT and the stakeholders which included Miami County, Spring Hill, Johnson County, Olathe, Lenexa, Shawnee, Bonner Springs, Unifi ed Government, Basehor, Leavenworth County, Lansing, Leavenworth, KTA and MARC have worked together in a collaborative effort to arrive at recommendations for an achievable K-7 Corridor Master Plan. For the purposes of this study, the K-7 Corridor has been broken into segments for analysis. The three segments are defi ned in Figure 1.
Purpose and Objectives
The purpose of the K-7 Corridor Management Study was to identify the ultimate traffi c demands that would be placed on K-7, be responsive to communities’ need to plan their future, and create a mutually agreeable ultimate plan for K-7 that KDOT and the communities would embrace and implement over time. The study looked at what type of improvements would be necessary on
K-7 and the local street system to handle the amount of traffi c and development projected. These elements where accomplished within minimum technical design criteria that included:
• Desired minimum level of service = D (for 2030 traffi c projections)• Desired to have a uniform facility type within logical terminus points• Freeway interchange spacing of two-miles desired with a minimum of one-mile spacing• Access will be controlled for a freeway facility
Unlike previous studies, this study focused on the K-7 mainline and the local street network as an integrated system; more community involvement which involved two-way listening, education, and the desire to reach a consensus; and concrete recommendations and implementation responsibilities through Memorandums of understanding. Specifi cally, the primary objectives of the study were as follows:
• Determine what K-7’s facility type would ultimately be (freeway versus urban arterial)• Identify where access points would be along the corridor and the local street network• Defi ne what the right-of-way footprint and preservation needs would be for the facility• Determine acceptable phased implementation opportunities• Execute memorandums of understanding
Determining the facility type required gaining a better understanding of the local land use and travel demand market. This entailed working with each community to understand their plans and to make sure that each fi t into an overall plan for the corridor. It required educating each community on the relationship between land use and traffi c. For example, higher land use intensity would generate more traffi c and required greater capacity on the transportation network.
Once the recommendation of a freeway facility was made for all three Segments, access requirements and the local street network system needed to be developed. Each Segment team honed in on determining the specifi c access points which would be allowed along with a solution that included a broader examination of the street network system to support the future plans for K-7. Following the transportation network identifi cation, the right-of-way needs along the corridor and local street system were identifi ed. The goal was to establish a preservation footprint for the areas to allow the construction of the identifi ed improvements in the future.
The next step was the identifi cation of phased implementation opportunities. This entailed interim and ultimate improvements to K-7. Included with this was the establishment of the enforcement mechanisms to regulate access requirements. The challenge with the implementation plan was to recognize the funding limitations, identify the hot spots, and prioritize future efforts along the corridor.
2
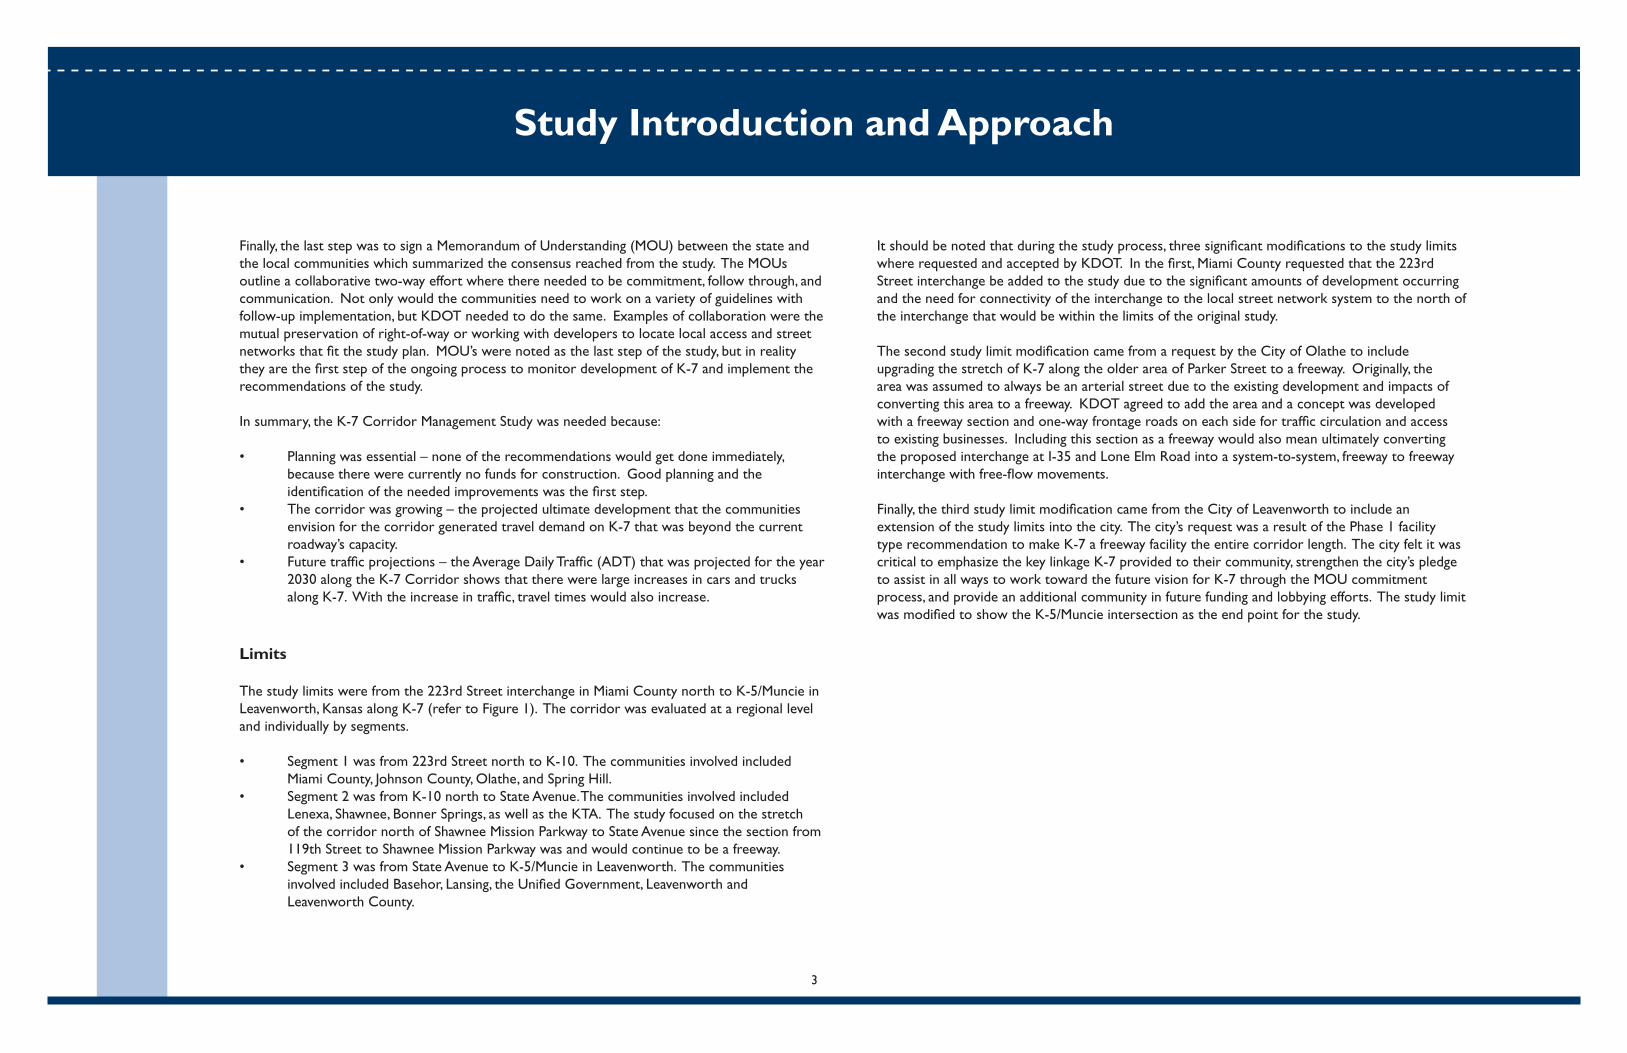
Finally, the last step was to sign a Memorandum of Understanding (MOU) between the state and the local communities which summarized the consensus reached from the study. The MOUs outline a collaborative two-way effort where there needed to be commitment, follow through, and communication. Not only would the communities need to work on a variety of guidelines with follow-up implementation, but KDOT needed to do the same. Examples of collaboration were the mutual preservation of right-of-way or working with developers to locate local access and street networks that fi t the study plan. MOU’s were noted as the last step of the study, but in reality they are the fi rst step of the ongoing process to monitor development of K-7 and implement the recommendations of the study.
In summary, the K-7 Corridor Management Study was needed because:
• Planning was essential – none of the recommendations would get done immediately, because there were currently no funds for construction. Good planning and the identifi cation of the needed improvements was the fi rst step.• The corridor was growing – the projected ultimate development that the communities envision for the corridor generated travel demand on K-7 that was beyond the current roadway’s capacity.• Future traffi c projections – the Average Daily Traffi c (ADT) that was projected for the year 2030 along the K-7 Corridor shows that there were large increases in cars and trucks along K-7. With the increase in traffi c, travel times would also increase.
Limits
The study limits were from the 223rd Street interchange in Miami County north to K-5/Muncie in Leavenworth, Kansas along K-7 (refer to Figure 1). The corridor was evaluated at a regional level and individually by segments. • Segment 1 was from 223rd Street north to K-10. The communities involved included Miami County, Johnson County, Olathe, and Spring Hill. • Segment 2 was from K-10 north to State Avenue. The communities involved included Lenexa, Shawnee, Bonner Springs, as well as the KTA. The study focused on the stretch of the corridor north of Shawnee Mission Parkway to State Avenue since the section from 119th Street to Shawnee Mission Parkway was and would continue to be a freeway.• Segment 3 was from State Avenue to K-5/Muncie in Leavenworth. The communities involved included Basehor, Lansing, the Unifi ed Government, Leavenworth and Leavenworth County.
It should be noted that during the study process, three signifi cant modifi cations to the study limits where requested and accepted by KDOT. In the fi rst, Miami County requested that the 223rd Street interchange be added to the study due to the signifi cant amounts of development occurring and the need for connectivity of the interchange to the local street network system to the north of the interchange that would be within the limits of the original study.
The second study limit modifi cation came from a request by the City of Olathe to include upgrading the stretch of K-7 along the older area of Parker Street to a freeway. Originally, the area was assumed to always be an arterial street due to the existing development and impacts of converting this area to a freeway. KDOT agreed to add the area and a concept was developed with a freeway section and one-way frontage roads on each side for traffi c circulation and access to existing businesses. Including this section as a freeway would also mean ultimately converting the proposed interchange at I-35 and Lone Elm Road into a system-to-system, freeway to freeway interchange with free-fl ow movements.
Finally, the third study limit modifi cation came from the City of Leavenworth to include an extension of the study limits into the city. The city’s request was a result of the Phase 1 facility type recommendation to make K-7 a freeway facility the entire corridor length. The city felt it was critical to emphasize the key linkage K-7 provided to their community, strengthen the city’s pledge to assist in all ways to work toward the future vision for K-7 through the MOU commitment process, and provide an additional community in future funding and lobbying efforts. The study limit was modifi ed to show the K-5/Muncie intersection as the end point for the study.
Study Introduction and Approach
3

New
Cen
tury
Air
Cen
ter
John
son
Cou
nty
Exec
utiv
eA
irpor
t
SANTA
FETR
AIL
SANTA
FETR
AIL
ORE
GONTR
AIL
LEA
VEN
WO
RTH
CO
.
WYA
ND
OTT
EC
O.
LEAVENWORTHCO.WYANDOTTECO.
WYA
ND
OTT
EC
O.
JOH
NSO
NC
O.
EDW
ARD
SVIL
LE
BON
NER
SPRI
NG
S
MER
RIA
MM
ISSI
ON
OLA
THE
OLA
THE
Ola
the
Lake
Ced
arLa
ke
Gar
dner
Lake
OV
ERLA
ND
PARK
B.N.S.F.RY.
Shaw
nee
Mis
sion
Lake
B.N. S
.F.RY
.
B.N.S
.F.RY
.
LAKE
QU
IVIR
A
Kans
asRi
ver
KAN
SAS
AV
E.
LORINGDR.
B.N
.S.F
.RY. SP
RIN
GH
ILL
JOH
NSO
NC
O.
MIA
MIC
O.
GA
RDN
ER
DES
OTO
119
THST
.
83RD
ST.
95TH
ST.
111T
HST
.
127
THST
.
135
THST
.
143R
DST
.
151S
TST
.
167
THST
.
175
THST
.17
5TH
ST.
55TH
ST.
47TH
ST.
63RD
ST.
159T
HST
.
DEN
NIS
AV
E.
SAN
TAFE
LONEELMRD.
WOODLANDRD.
RIDGEVIEWRD.
MIZERD.H
OLL
ING
SWO
RTH
RD.
DO
NA
HO
ORD
.
LEA
VEN
WO
RTH
RD.
STAT
EAV
E.
PARA
LLEL
PKW
Y.
MET
ROPO
LITA
NM
ORS
EA
VE.
KUM
PA
VE.
S.138THST.
S.134THST.
S.110THST.EDWARDSVILLEDR.
NORTHGATERD.
MC
INTY
RERD
.
N.131STST.
N.115THST.
95TH
ST.
127T
HST
.
135T
HST
.
143R
DST
.
151S
TST
.
159T
HST
.
207
THST
.
199
THST
.
191
THST
.
183
RDST
.
215
THST
.
207
THST
.
191
THST
.
183
RDST
.
215
THST
.
175
THST
.
LONEELMRD.
WOODLANDRD.
RIDGEVIEWRD.
SWITZERRD.
QUIVIRARD.
ANTIOCHRD.
75TH
ST.
71ST
ST.
MONTICELLORD.
FAIR
MO
UN
TRD
.
223
RDST
.
LEAV
ENW
ORT
H
LAN
SIN
GE.
MAR
Y ST
.
BASE
HO
RKA
NSA
S C
ITY
LEN
EXA
SHAW
NEE
1
3
2
7
7
10
7
70
435
7
7 73
35
56 69
32
32
40
69
24
40
32
69
24
5
169
567
3
435
435
635
70
35
169
69
169
69
LE
GE
ND
Ove
rpas
s
Inte
rch
ang
e
Are
ato
be
up
gra
de
dth
rou
gh
Ola
the
K-7
real
ign
me
nt
Se
gm
en
t 3
Se
gm
en
t 2
Se
gm
en
t 1
NK
-7co
rrid
or
foo
tpri
nt
bo
un
dar
y
K-7
CO
RR
IDO
R M
AP
Stu
dy A
rea
Map
- F
igur
e 1
4
Dis
clai
mer
:T
his
illus
trat
ion
depi
cts
the
conc
eptu
al
alig
nmen
t an
d in
terc
hang
e lo
catio
ns
for
the
K-7
Cor
rido
r. T
his
illus
trat
ion
shou
ld n
ot b
e us
ed t
o de
term
ine
the
exac
t lo
catio
n, d
esig
n or
rig
ht-o
f-way
.

Approach and Schedule
As noted previously, the K-7 Corridor Management Study went beyond the prior Technical Study to include an approach that examined the mainline and local transportation system, included more involvement with the communities, and resulted in clear conclusions with signed memorandums of understanding. The study approach is graphically shown in Figure 2.
As Figure 2 shows, the study approach was broken into two primary phases:
Phase 1 Corridor Analysis – K-7 was evaluated as a regional corridor through a series of workshops and meetings with the local communities along the entire corridor. Initial focus was on regional issues to defi ne a reasonable transportation market by developing a corridor wide land use and traffi c model. Through development of a comprehensive travel demand model and future land use plan crafted through input from each community, traffi c forecast information was developed. From this information, a recommendation was made for a freeway facility type along the entire corridor. Given the communities vision for future land use, an arterial facility would ultimately be unable to accommodate the anticipated traffi c resulting in signifi cant congestion and unacceptable levels of service for the corridor. Phase 1 took approximately one year to complete.
Phase 2 Segment Analysis – K-7 and the local street network was evaluated on a segment basis through a series of meetings with local communities within each segment. During this phase, the freeway facility type recommendation from Phase 1 was used as the basis for discussion. While not every community agreed in total with the recommendation of a freeway, every community did agree that it would be prudent to preserve the right-of-way needed for a freeway with interchanges in order to not preclude the ability to build a freeway in the future. As a result, a series of meetings were held to determine the future locations of interchanges and overpasses as well as the layout of the local street system to make every effort that the total transportation system worked together in the future. Interchange confi gurations concepts and local street requirements were then used to establish a conceptual right-of-way footprint for the entire corridor.
It was also recognized that given the lack of funding to build the freeway today, interim improvements would be needed to accommodate the growing traffi c demand. Examples of interim improvements included adding traffi c signals and turn lanes at future interchange and overpass locations knowing that these would need to be converted into interchanges and overpasses in the future. Other examples of interim improvements included reducing access to K-7 and preserving important tracts of land for future improvements. Given the uncertainty of the timing of future development,
it was impossible to predict the priority and order of implementation of the interim and ultimate improvements over time. This plan’s purpose was to provide guidelines for interim improvements that could occur and the expectations for what would ultimately need to occur.
Finally, Memorandums of Understanding (MOU’s) were developed with each community to establish roles and responsibilities for KDOT and the local communities in implementing the K-7 Corridor Management Plan. These MOU’s formalized the continued collaborative environment and created a moral framework for implementing the recommendations of the study. The MOU’s also established of a K-7 Corridor Review Committee made up of representatives from KDOT and the local communities. The committee’s purpose would be to meet periodically to review the corridor plan, assess development issues, and evaluate compliance with the K-7 Corridor Plan.
Study Introduction and Approach
April May June July Aug. Sept. Oct. Nov. Jan. Mar.Feb.Dec.
20062005
April May June July Aug. Sept. Oct. Nov. Dec.
2004
Facility Issues
Traffic Analysis
StreetNetwork
Memos ofUnderstandingDevelopment
LEGEND
Community Meetings Community Meetings
PublicMeeting
AdvisoryCouncil and
Public OfficialsMeeting
Community Meetings
Community Meetings
Determine Facility Type Recommendation
Phase 2 - Segment AnalysisPhase 1 - Corridor Analysis
Updated K-7 Schedule
P
FinalReport
PublicMeeting
P
P
POB
M Combined Advisory Council and Public Officials Meetings
Public Meeting
Public Officials Briefing
W
T
A
T
T A TAdvisory
Council andPublic Officials
Meeting
MPOBAdvisoryCouncil Meeting
Public OfficialsBriefing
AdvisoryCouncil Meeting
A
M
W MWorkshopon MOUProcess
AdvisoryCouncil and
Public OfficialsMeeting
TechnicalCommitteeMeeting
TechnicalCommitteeMeeting
TechnicalCommitteeMeeting
Advisory Council Meeting
Workshop
Technical Committee Meeting
Figure 2
5

Collaboration and communication with the eight cities, three counties, the Mid-American Regional Council, and the Kansas Turnpike Authority along the K-7 corridor required an input process that considered local needs and regional goals. The study team gathered and provided information to develop the corridor recommendations through:• Meetings and workshops• Presentations• Surveys
Meetings and Workshops
Individual meetings with each community throughout the study process encouraged an on-going open dialogue about community needs and concerns. The committee meetings allowed for the opportunity for communities to share information and learn from each other. The Technical Committee, made up of traffi c engineers and planners from each community, provided important information and feedback on local traffi c conditions, future growth/anticipated land use, and street network/access issues. The Advisory Council, made up of key decision-makers from each community, provided feedback at the highest levels for the study team on recommendations and policy discussions. The Public Offi cial Briefi ngs provided additional coordination with elected offi cials and provided educational opportunities on several of the study concepts. Finally, the Public Meetings allowed the study team to present the corridor plan and recommendations to the general public as yet another opportunity for input and feedback.
The long-term needs of K-7 will continue after the conclusion of this study. A foundation for communication between KDOT and the local communities has been established through the intensive efforts made through each meeting held to date and through the written Memorandums of Understanding that formalize a partnership to work on K-7 issues together. This communication and collaboration will hopefully continue through the anticipated K-7 Review Committee that will continue to meet and work toward implementation of the commitments made on the K-7 Corridor Plan.
The meeting matrix shown in the following pages (Figure 3 a and b) identifi es the communities engaged, purpose and outcomes for the meetings.
Presentations
In order to provide updates and information to local offi cials and civic interests throughout the region, presentations were made to various groups, including:• Mid-America Regional Council Total Transportation Policy Committee• Leavenworth Area Development Council• Kansas City Kansas Chamber of Commerce Board Meeting• Spring Hill Chamber of Commerce• Basehor/Tonganoxie Chamber of Commerce• Olathe City Council• Shawnee Public Works Committee• Basehor City Council• Leavenworth County Commission• Wyandotte/Leavenworth County State Legislators• Wyandotte State Legislators
Surveys
Measurement is an important tool to gauge progress, but it is also important to gauge attitudes regarding transportation issues. During the fi rst two Advisory Council meetings the study team provided surveys to gather information about values, preferences and familiarity with transportation planning. These tools helped the study team measure where there was agreement and where more work through education needed to be done. Each survey had four sections:• Experience with transportation and land use planning• Attitudes about land use planning and transportation trade-offs• Beliefs and attitudes regarding the K-7 Corridor today• Beliefs and attitudes regarding the K-7 Corridor in the future
The results from the surveys provided the study team with information that assisted in the development of a recommendation for the facility type and helped focus discussion on other areas like access management, the local street network and corridor preservation.
Three important observations from the survey results include:• Regional mobility is more important than local access.• Preserving land for future transportation use is needed.• Coordinating with KDOT and other communities will be essential.
More details about specifi c surveys can be provided upon request.
Meetings
6

Meeting Matrix - 2004 Figure 3a
SECTI
ON
1
KTA
Public Officials BriefingAdvisory Council
Meeting/TechnicalCommittee Meeting #3
Technical CommitteeMeeting #2
Technical CommitteeMeeting #1
Advisory CouncilMeeting #2
Advisory CouncilMeeting #1
City/County Meeting#1 Introduction
Technical CommitteeMeeting #3
Public Officials BriefingAdvisory Council
Meeting/TechnicalCommittee Meeting #3
Technical CommitteeMeeting #2
Technical CommitteeMeeting #1
Advisory CouncilMeeting #2
Advisory CouncilMeeting #1
City/County Meeting#1 Introduction
Community
City of Leavenworth
Leavenworth County
Lansing
Basehor
Unified Government
Bonner Springs
Shawnee
Lenexa
Johnson County
Olathe
Spring Hill
Mid-America RegionalCouncil (MARC)
Miami County
April 19, 2004
June 14,2004
April 29, 2004
April 21, 2004
April 28, 2004
May 18, 2004
April 30, 2004
April 27, 2004
December 8,2004
November 4,2004
October 11,2004
July 30,2004
July 28,2004
June 23,2004May 18, 2004
May 10, 2004
April 15, 2004
April 21, 2004
April 29, 2004
SECTI
ON
2SE
CTI
ON
3
Community
City/County Meeting #1 IntroductionPurpose: To meet individually with all the citiesand counties to explain the purpose of the projectand gather input on issues and concerns.Outcome: The communities shared their informationrelated to growth, land use, traffic plans and theimportance of K-7 in their community.
Technical Committee Meeting #1Purpose: Establish methodology for trafficand land use scenario developments,present information gathered and earlymodel development.Outcome: Initial reaction to growth scenariosand comment on model development.
Public Officials BriefingPurpose: To provide information on study status,objective and goals. Also communicate theimportance of planning ahead and to introducethe concepts of corridor preservation and accessmanagement. Outcome: Public Officials have better understandingabout purpose and goals for the study.
Technical Committee Meeting #3Purpose: Review preliminarytraffic demand model.Outcome: Refinements anddevelopment of ‘what ifscenarios’.
Advisory Council Meeting #1Purpose: Project Kick-off—review project background, objectivesand schedule. Information on land use and traffic was presented.A summary of City/County meetings was provided. Outcome: Goals, expectations and Advisory Committee rolefor study established.
Technical Committee Meeting #2Purpose: Land use information summaryto help develop traffic model.Outcome: Input and feedback on informationprovided and more refinements to data forthe traffic model and build out scenarios.
Advisory Council Meeting #2Purpose: Project review and status. RightTurns Exercise Part 1—review issues,and constraints in each segment.Outcome: Update on study and refinedinformation on transportation trade-offs.
Advisory Council/TechnicalCommittee Meeting #3Purpose: Present preliminary draftfacility type recommendation.Outcome: Gather input/feedback andthoughts on draft recommendation.
Technical CommitteeMeeting #3
communityublic worksningom KDOTMARC
dnderstandncil wasconcernssportation
s
e
TTPC-PresentationMarch 23, 2004
Advisory CouncilWho: Two representatives from each communitythat are decision makers (mayors, public worksdirectors, city council members, planningdirectors, etc.) Two representatives from KDOTand a representative from KTA and MARCalso participated.Purpose: To serve as a sounding boardthroughout the project and work to understandthe study process. The Advisory Council wasalso a forum to discuss interests and concernsabout growth, development and transportationas it related to the K-7 corridor.
Technical CommitteeWho: Public works officials, engineersand city and county staff who haveexpertise in the areas of land use,traffic, and local streets. They knowthe ins and outs of implementationin their community.Purpose: To work through the detailsof issues, such as land use andtraffic, to gather input and helpdevelop support for approachesand methodology.
Public OfficialsWho: Local and state elected officials.Purpose: To provide information forelected officials on project objectivesand progress as well as communicatethe importance of planning andcorridor preservation.
7

Meeting Matrix - 2005 -2006 Figure 3b
Phased ImplementationWorkshop
Advisory CouncilMeeting/ PublicOfficials Briefing
MOU Meetings/Presentations
Round 2Public Meeting #2Public Meeting #1
Advisory Council Meeting/Public Officials
Briefing #4
MOU MeetingsRound 1
City/County MeetingStreet Network
Meetings - Round 3City/County Meeting
Round 2
SECTI
ON
1
KTA
Phased ImplementationWorkshop
Advisory CouncilMeeting/ PublicOfficials Briefing
MOU Meetings/Presentations
Round 2Public Meeting #2Public Meeting #1
Advisory Council Meeting/Public Officials
Briefing #4
MOU MeetingsRound 1
City/County MeetingRound 3-Street
Network Meetings
City/County MeetingRound 2
Community
City of Leavenworth
Leavenworth County
Lansing
Basehor
Unified Government
Bonner Springs
Shawnee
Lenexa
Johnson County
Olathe
Spring Hill
Miami County
October 7, 2005
November 10, 2005
February 23, 2006October 12, 2005
October 20, 2005
October 13, 2005
November 15, 2005
October 20, 2005
October 13, 2005
No MeetingScheduled
October 19, 2005
October 14, 2005
October 17, 2005
October 12, 2005
January 26, 2005
July 13, 2005June 9, 2005
April 27, 2005
May 25, 2005
July 14, 2005
July 14, 2005
July 18, 2005
July 19, 2005
July 13, 2005
July 22, 2005
July 28, 2005
July 25, 2005May 16, 2005
May 2, 2005
June 20, 2005
April 13,2006
March 28,2006
December 15, 2005
September 14,2005
September 13,2005
August 28,2005May 16, 2005
No MeetingScheduled
No MeetingScheduled
No MeetingScheduled
May 2, 2005
March 23, 2005
January 17, 2005
January 30, 2005
SECTI
ON
2SE
CTI
ON
3
Community
City/County Meeting Round 2Purpose: Opportunity forindividual thoughts on draftfacility type recommendation.Outcome: Provide more detail tocommunities and answer questions.
Individual Meetings forMOUs Round 2Purpose: Continued discussionand refinement of MOUs.Outcome: Some meetings withcommunities or presentationsto governing bodies on MOUs.
City/County Meeting Round 3 - Street Network MeetingsPurpose: Information on the local street network, so thatit can support the facility type recommendation andhelp alleviate traffic concerns on K-7.Outcome: Information to develop or refine local streetnetwork system.
Public Meeting #1Purpose: To present draft corridor recommendationand facility type for Public Review.Outcome: Nearly 100 people from all along thecorridor attended and provided 19 comments.
Access Meetings - MOU MeetingsPurpose: Individual opportunityto discuss particulars of MOUs.Outcome: Understand MOUsand gather initial feed back.
h communitypublic worksanningfrom KDOT
d MARC
ardo understandouncil wasnd concernsansportation
erse
w
s
ls.
esate
Phased Implementation WorkshopPurpose: Begin discussion of access managementand corridor preservation in a general workshopformat with break out sessions.Outcome: Further reinforce and introduce the accessmanagement approach and to the Memorandumsof Understanding (MOUs) process.
Advisory Council Meeting/Public Officials Briefing #4Purpose: Present refinements to draft facilitytype recommendations and local street network.Outcome: Review of draft recommendationsand information to be presented atPublic Meeting.
Mid-America RegionalCouncil (MARC)
Public Meeting #2Purpose: Present final report and corridor planfor general public.Outcome: Opportunity for review and comment.
Advisory Council Meeting/PublicOfficials Briefing #5Purpose: Summarize project andcelebrate MOU agreements.Outcome: Signed MOUs andcommitment to the K-7Corridor Plan.
Advisory CouncilWho: Two representatives from each communitythat are decision makers (mayors, public worksdirectors, city council members, planningdirectors, etc.) Two representatives from KDOTand a representative from KTA and MARCalso participated.Purpose: To serve as a sounding boardthroughout the project and work to understandthe study process. The Advisory Council wasalso a forum to discuss interests and concernsabout growth, development and transportationas it related to the K-7 corridor.
Technical CommitteeWho: Public works officials, engineersand city and county staff who haveexpertise in the areas of land use,traffic, and local streets. They knowthe ins and outs of implementationin their community.Purpose: To work through the detailsof issues, such as land use andtraffic, to gather input and helpdevelop support for approachesand methodology.
Public OfficialsWho: Local and state elected officials.Purpose: To provide information forelected officials on project objectivesand progress as well as communicatethe importance of planning andcorridor preservation.
8

Traffi c and Land Use Introduction
In 2002, the K-7 Corridor Technical Report was completed. The report analyzed the technical aspects of existing and future transportation conditions along the K-7 Corridor. Due to study constraints with the original study, changes in peoples travel patterns could not be evaluated. The study analyzed the traffi c operational differences between an arterial and a freeway along the K-7 Corridor. Recognizing that the roadway type could change along the corridor, it was important to plan for logical transition points. This resulted in not recognizing that motorists will choose a travel route based on the facility type and travel time which will affect future traffi c demand. Also, focusing on a single design year did not consider the full development potential of the corridor. Finally, analysis focused only on K-7 and did not include the surrounding local street network. It is critical to recognize that both K-7 and the local street network system work and function together to serve the total transportation demand.
Since the previous study was technical in nature, it did not strive to achieve political support, therefore a more comprehensive study of the K-7 Corridor was undertaken. From a land use and traffi c perspective the primary study goals were:
• Work with the local communities to develop a 2030 and full build out land use database.• Develop a regional travel demand model that included the K-7 mainline and local street network and considered changes in traffi c as a result of the K-7 facility type.
The K-7 study corridor was defi ned as a two mile wide corridor centered on K-7. Within this area a street network and traffi c analysis was performed. The corridor study was separated into two phases consisting of a macro-level and a micro-level analysis. The macro-level analysis focused on identifying what type of facility K-7 should become, a freeway or an urban arterial. The micro-level analysis focused on developing a local street network that was complementary to the identifi ed facility type and created a total transportation system. The primary traffi c and land use tasks for each phase included:
• Facility Type (Phase 1 Macro-Level Corridor Analysis)
• Developing a planning level traffi c forecasting tool to analyze facility type for each segment of K-7, • Collecting 2030 and full build out land use from each community along the corridor to input into the traffi c model, and • Using the MARC regional model to analyze land use and transportation effects on traffi c in the corridor.
• Street Network (Phase 2 Micro-Level Segment Analysis)
• Performing Highway Capacity Manual (HCM) methodology operational analysis of K-7 mainline and intersections, • Performing volume threshold evaluations of the local street network, and • Developing a simulation model of the K-7 and I-70 Interchange
STUDY METHODOLOGY
Phase 1 analysis represented a macro-level planning understanding at the corridor level. The analysis focus was to assess the ability of K-7 to serve the transportation demand associated with the future land use when the facility was modeled as an urban arterial and a freeway.
Data collected included development plans, traffi c counts, accident data and land use plans. Developer plans were collected from local communities to identify recent development along the corridor. Daily traffi c counts were collected and used during model calibration. Accident data was collected to review more recent data since the K-7 Corridor Technical Report, 2002. KDOT provided crash data for years 2000, 2001 and 2002.
Land Use
Transportation and land use form a symbiotic relationship. Land use factors such as population density, income, employment and activity centers (which include shopping, recreation and institutional uses) impact travel patterns. A dispersed land use pattern increases the need for high-mobility roadways with minimal turning confl icts to facilitate timely access to goods, services and activities at longer distances. Conversely, a condensed land use pattern provides the ability to support a roadway that serves the needs of local developments at slower speeds by providing convenient access to adjacent land uses. Accessibility refl ects the ability to conveniently move from an origin to a destination. Any location is accessible given enough time and safe and functional transportation facilities. Travel time tends to be the dominant measure of accessibility. As traffi c increases, congestion occurs and mobility decreases. As congestion increases adjacent land uses are negatively impacted due to excessive travel delay, facilitating the need to make transportation improvements such as widening or construction of new roads and facilities.
Given the relationship between transportation and land use, decisions about transportation facilities should take into account the demands of the local population as well as the community’s economic needs. Typically, land use plans at both the local and regional level are used to forecast future
Traffi c Analysis
9
Traffi c Analysis
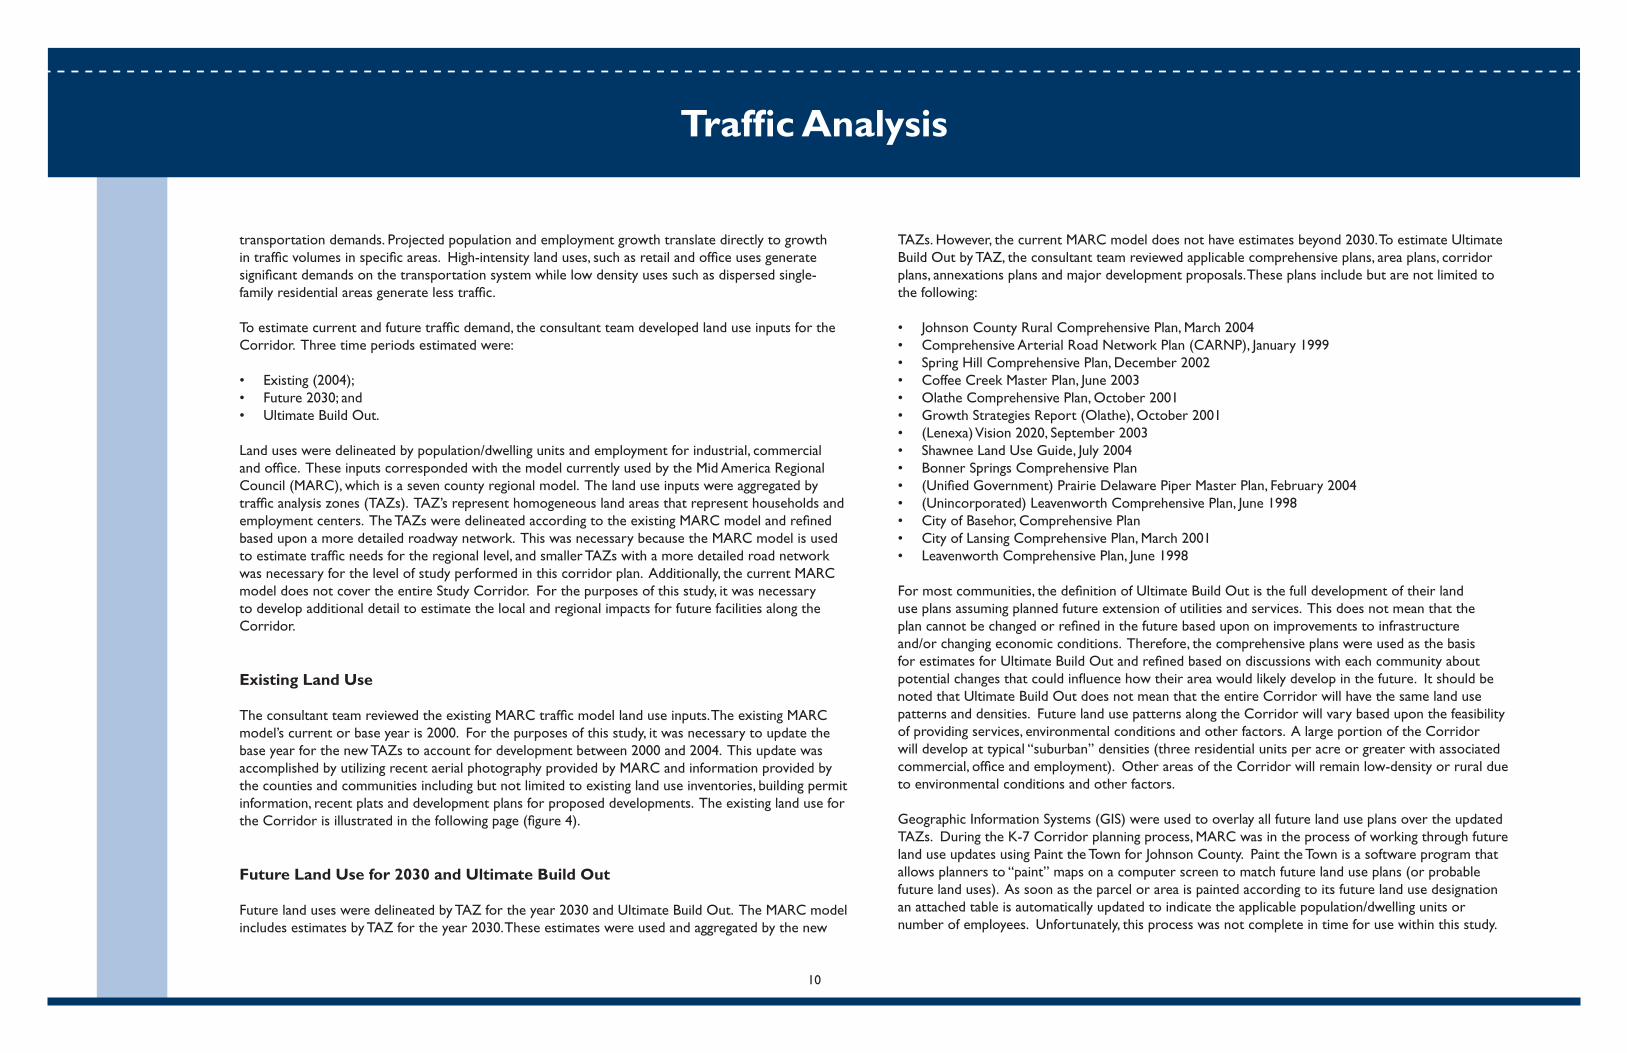
transportation demands. Projected population and employment growth translate directly to growth in traffi c volumes in specifi c areas. High-intensity land uses, such as retail and offi ce uses generate signifi cant demands on the transportation system while low density uses such as dispersed single-family residential areas generate less traffi c.
To estimate current and future traffi c demand, the consultant team developed land use inputs for the Corridor. Three time periods estimated were:
• Existing (2004);• Future 2030; and• Ultimate Build Out.
Land uses were delineated by population/dwelling units and employment for industrial, commercial and offi ce. These inputs corresponded with the model currently used by the Mid America Regional Council (MARC), which is a seven county regional model. The land use inputs were aggregated by traffi c analysis zones (TAZs). TAZ’s represent homogeneous land areas that represent households and employment centers. The TAZs were delineated according to the existing MARC model and refi ned based upon a more detailed roadway network. This was necessary because the MARC model is used to estimate traffi c needs for the regional level, and smaller TAZs with a more detailed road network was necessary for the level of study performed in this corridor plan. Additionally, the current MARC model does not cover the entire Study Corridor. For the purposes of this study, it was necessary to develop additional detail to estimate the local and regional impacts for future facilities along the Corridor.
Existing Land Use
The consultant team reviewed the existing MARC traffi c model land use inputs. The existing MARC model’s current or base year is 2000. For the purposes of this study, it was necessary to update the base year for the new TAZs to account for development between 2000 and 2004. This update was accomplished by utilizing recent aerial photography provided by MARC and information provided by the counties and communities including but not limited to existing land use inventories, building permit information, recent plats and development plans for proposed developments. The existing land use for the Corridor is illustrated in the following page (fi gure 4).
Future Land Use for 2030 and Ultimate Build Out
Future land uses were delineated by TAZ for the year 2030 and Ultimate Build Out. The MARC model includes estimates by TAZ for the year 2030. These estimates were used and aggregated by the new
TAZs. However, the current MARC model does not have estimates beyond 2030. To estimate Ultimate Build Out by TAZ, the consultant team reviewed applicable comprehensive plans, area plans, corridor plans, annexations plans and major development proposals. These plans include but are not limited to the following:
• Johnson County Rural Comprehensive Plan, March 2004• Comprehensive Arterial Road Network Plan (CARNP), January 1999• Spring Hill Comprehensive Plan, December 2002 • Coffee Creek Master Plan, June 2003 • Olathe Comprehensive Plan, October 2001• Growth Strategies Report (Olathe), October 2001• (Lenexa) Vision 2020, September 2003• Shawnee Land Use Guide, July 2004• Bonner Springs Comprehensive Plan• (Unifi ed Government) Prairie Delaware Piper Master Plan, February 2004• (Unincorporated) Leavenworth Comprehensive Plan, June 1998• City of Basehor, Comprehensive Plan• City of Lansing Comprehensive Plan, March 2001• Leavenworth Comprehensive Plan, June 1998
For most communities, the defi nition of Ultimate Build Out is the full development of their land use plans assuming planned future extension of utilities and services. This does not mean that the plan cannot be changed or refi ned in the future based upon on improvements to infrastructure and/or changing economic conditions. Therefore, the comprehensive plans were used as the basis for estimates for Ultimate Build Out and refi ned based on discussions with each community about potential changes that could infl uence how their area would likely develop in the future. It should be noted that Ultimate Build Out does not mean that the entire Corridor will have the same land use patterns and densities. Future land use patterns along the Corridor will vary based upon the feasibility of providing services, environmental conditions and other factors. A large portion of the Corridor will develop at typical “suburban” densities (three residential units per acre or greater with associated commercial, offi ce and employment). Other areas of the Corridor will remain low-density or rural due to environmental conditions and other factors.
Geographic Information Systems (GIS) were used to overlay all future land use plans over the updated TAZs. During the K-7 Corridor planning process, MARC was in the process of working through future land use updates using Paint the Town for Johnson County. Paint the Town is a software program that allows planners to “paint” maps on a computer screen to match future land use plans (or probable future land uses). As soon as the parcel or area is painted according to its future land use designation an attached table is automatically updated to indicate the applicable population/dwelling units or number of employees. Unfortunately, this process was not complete in time for use within this study.
10

Exi
stin
g L
and
Use
- F
igur
e 4
11
Traffi c Analysis
Additionally, Paint the Town was not going to be developed for all parts of the Corridor, including Miami and Leavenworth Counties. Although Paint the Town was not ready and does not include the entire study Corridor, the K-7 Technical Advisory Committee and Policy Committee decided to use the land use density assumptions developed for Paint the Town. In other words, the consultant team used the same assumptions and a similar process to complete the Paint the Town exercise as part of this study.
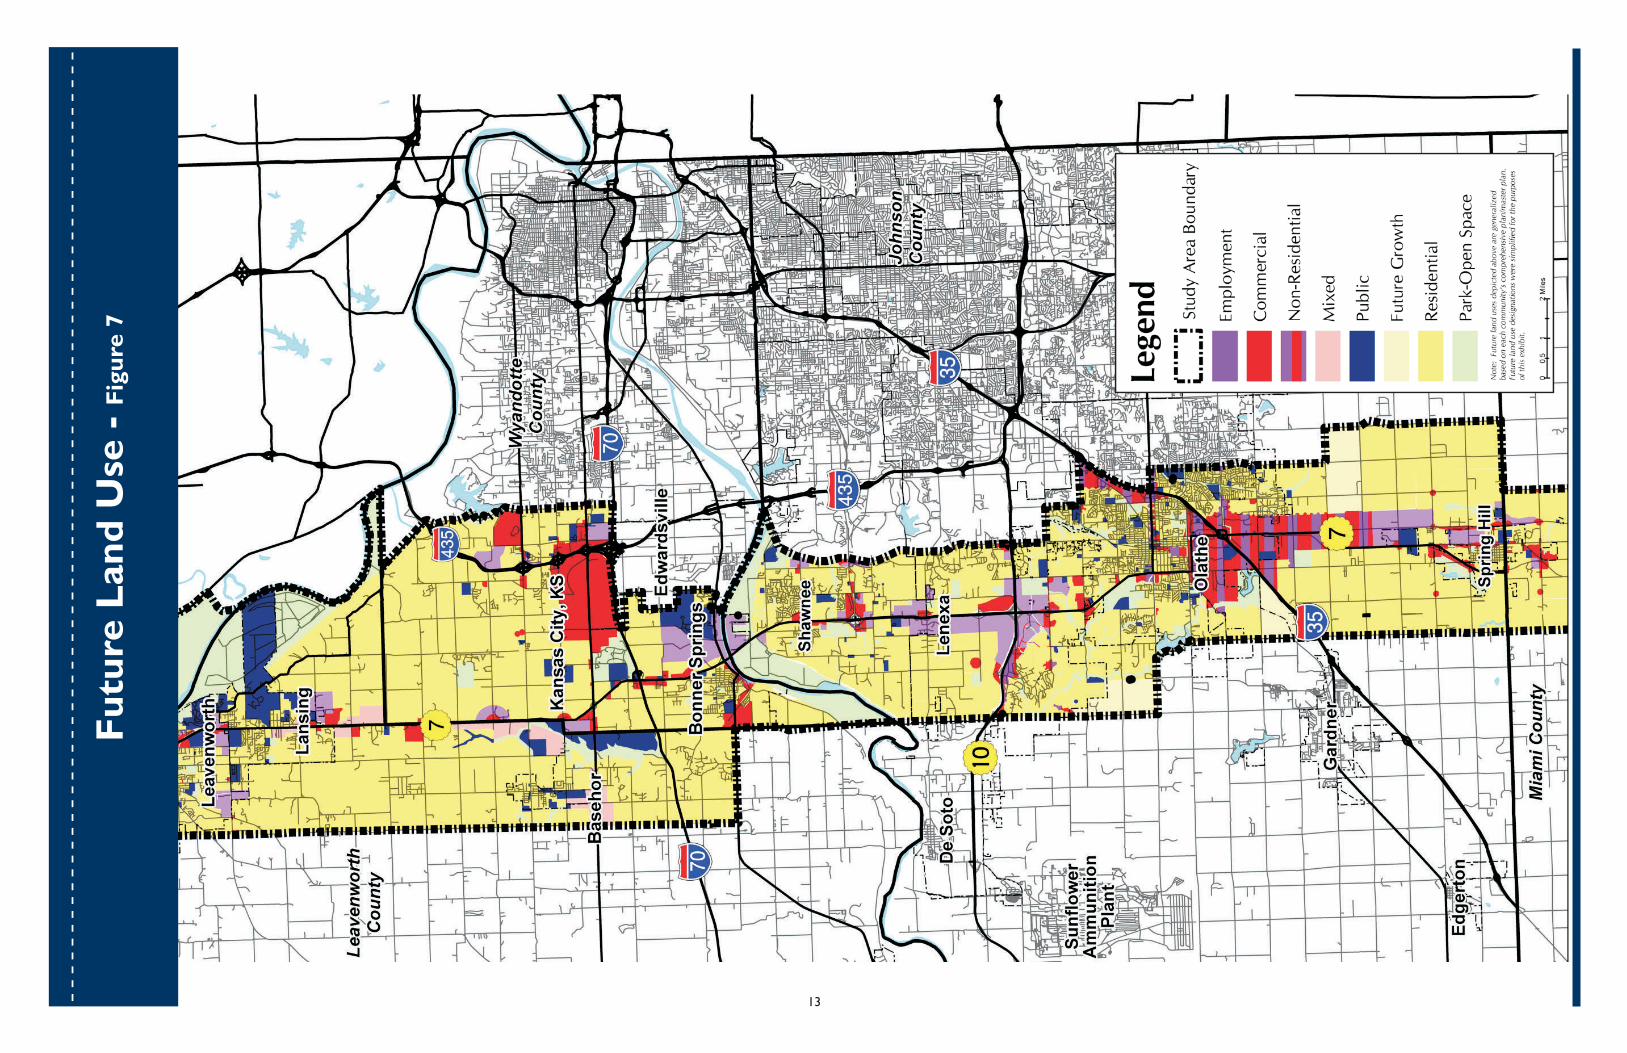
As part of the Paint the Town process, MARC worked with the communities in the Kansas City Metropolitan Area to develop assumptions based upon generalized future land use designations. This was necessary because each community’s land use plans have different use designations with their own assumptions for densities, mix and development patterns. Based on these assumptions, the consultant team developed an Ultimate Build Out map using the generalized land uses similar to those used in Paint the Town. The land use for the Ultimate Build Out is illustrated in the following page (fi gure 5).
The Economics of Mobility vs. Accessibility
As stated earlier, there is a trade-off between mobility and accessibility (freeway vs. arterial roadway) when deciding what type of transportation improvement best fi ts an area. Land uses, especially commercial, offi ce and industrial uses need to be visible and accessible to and from the transportation network. However, these uses also need to be convenient to areas where people live. If a transportation corridor becomes too congested with high traffi c volumes, a corridor’s traffi c operations can begin to break down and adjacent land uses will ultimately suffer. Individuals make choices about where they live, work, shop, play and do business in part based on the amount of travel time it takes them to access these destinations. Other factors include quality of life, schools, taxes and amenities.
Where these factors are met, the major difference between freeway interchange development and arterial development tends to be the overall pattern of the development. Freeway interchanges encourage nodal development where all users want proximity to the access point. Arterial development is more spread-out along the road; access points are not as important.
There does not appear to be a measurable correlation between selecting freeway or arterial development and the ultimate economic impact (or benefi t) on the community. More important factors would include the availability of public services, existing development policies, and relative size of the existing community, economic incentives, and the overall strength of the real estate market.
Travel Model
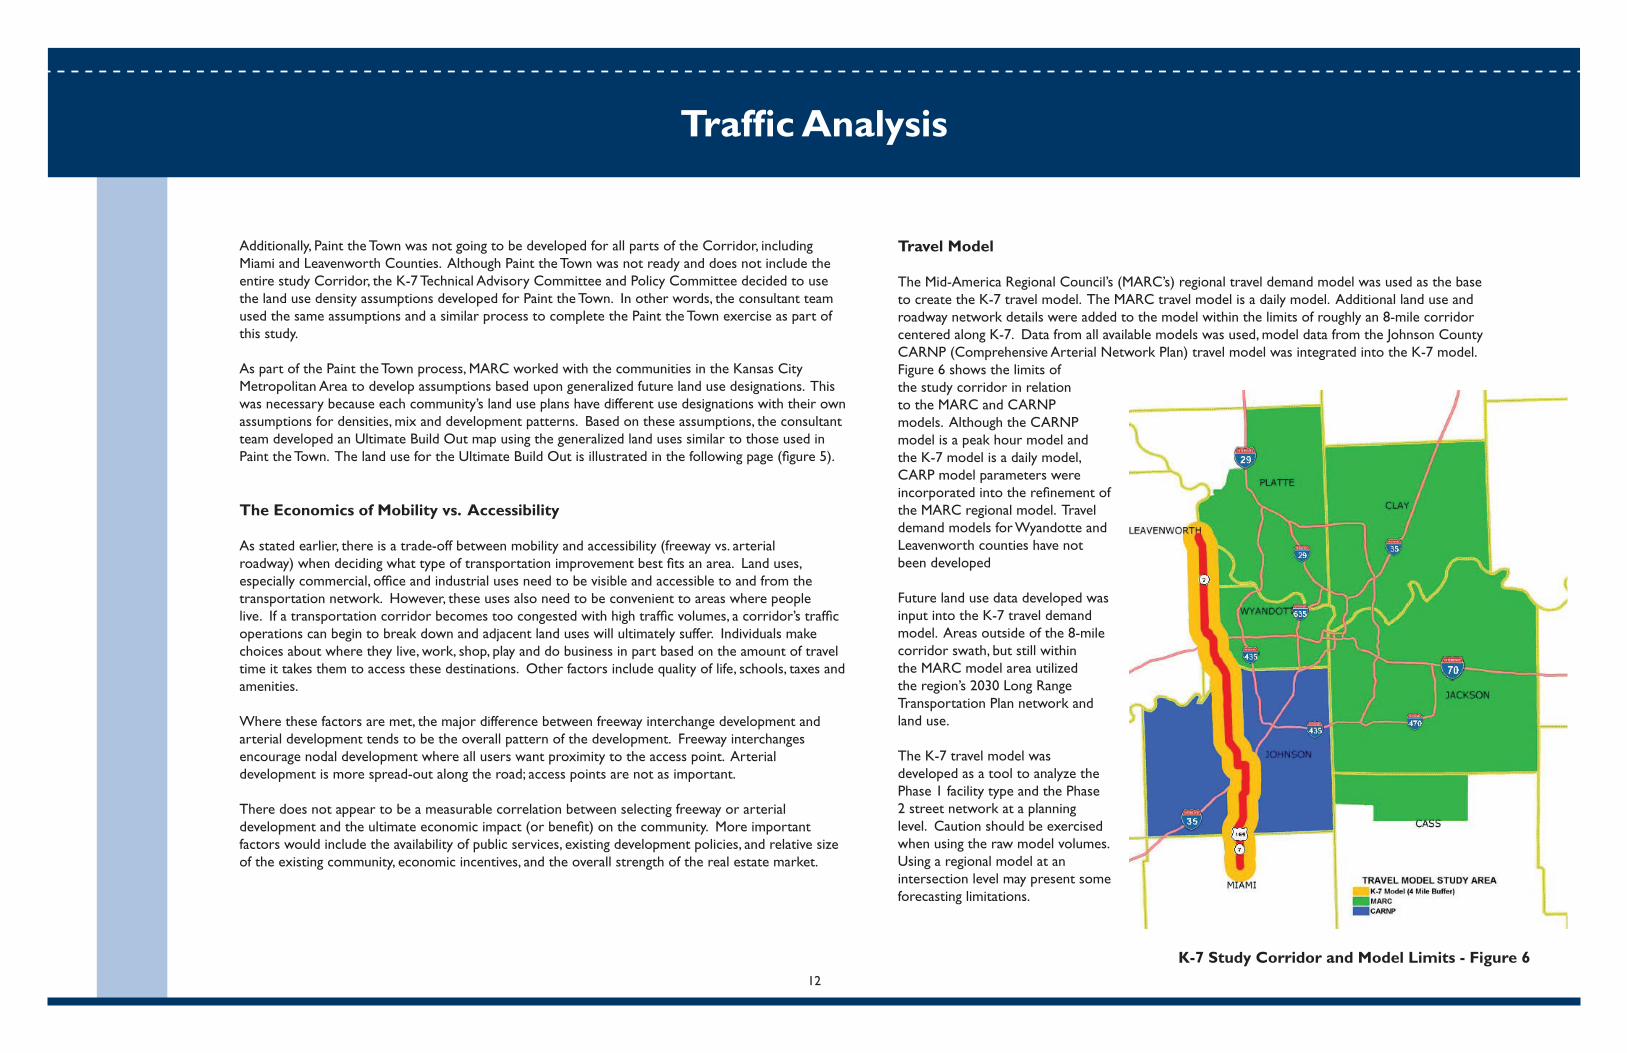
The Mid-America Regional Council’s (MARC’s) regional travel demand model was used as the base to create the K-7 travel model. The MARC travel model is a daily model. Additional land use and roadway network details were added to the model within the limits of roughly an 8-mile corridor centered along K-7. Data from all available models was used, model data from the Johnson County CARNP (Comprehensive Arterial Network Plan) travel model was integrated into the K-7 model. Figure 6 shows the limits of the study corridor in relation to the MARC and CARNP models. Although the CARNP model is a peak hour model and the K-7 model is a daily model, CARP model parameters were incorporated into the refi nement of the MARC regional model. Travel demand models for Wyandotte and Leavenworth counties have not been developed
Future land use data developed was input into the K-7 travel demand model. Areas outside of the 8-mile corridor swath, but still within the MARC model area utilized the region’s 2030 Long Range Transportation Plan network and land use.
The K-7 travel model was developed as a tool to analyze the Phase 1 facility type and the Phase 2 street network at a planning level. Caution should be exercised when using the raw model volumes. Using a regional model at an intersection level may present some forecasting limitations.
12
K-7 Study Corridor and Model Limits - Figure 6
Fut
ure
Lan
d U
se -
Fig
ure
7
13

Traffi c Analysis
Alternatives
Phase 1 tested simple planning-level alternatives. Two facility types were developed for K-7 consisting of a freeway and an urban arterial as defi ned below. Table 1 provides a description of each facility type. Each facility type provides a range of mobility and accessibility to motorists. Figure 8 shows the degree of mobility and accessibility offered by each facility type.
Function Defi nition:How do we defi ne road types?
Traffi c Volume to be Serviced:How busy is the road?
Performance is Measured by:How do you busy is the road?
Posted Travel Speed
Travel Time
Freeway Arterial
A multilane, divided highway with full control ofaccess and uninterrupted fl ow of traffi c. Accessis provided with grade separated interchanges.
• Factors that affect traffi c operations include interactions among vehicles and roadway geometrics.• 4-lane freeway is assumed with interchange spacing of 1-2 miles.
Typical: 1,800 vehicles per lane per hour at LOS D
I-435 between U.S. 69 and Metcalf• Existing is 2,400 per lane WB PM peak• Existing is 2,300 per lane EB AM peak
Density of vehicles - Number of vehicleswithin a given space
65 mph.
Freeway serves longer trips with a better traveltime. (about 1 minute per mile)
A street that primarily serves mobility and secondarily serves accessibility. Partial controlof access is maintained with interrupted fl owat signalized intersections with spacing of 2miles or less.
• Factors that affect traffi c operations include spacing of intersections and signal timing.• 6-lane arterial with full intersections every 0.5 miles.
Typical: 900 vehicles per lane per hour at LOS D
135th Street between U.S. 69 and Metcalf• Existing is 1,000 per lane WB PM peak• Existing is 800 per lane EB AM peak
Average vehicle travel speed - How fast a car can travel
45 mph
Arterial serves shorter trips with a bettertravel time. (about 3 minutes per mile)
Freeway and Urban Arterial Facility Description - Table 1
Freeway and Arterial Mobility vs.Accessibility Range - Figure 8
Abi
lity
to A
cces
s A
djac
ent
Lan
d U
ses
Ease, Speed and Safety for Travelers
14

Traffi c Analysis
Phase 1 analysis was performed at the segment and sub segment level. Figure 1 (Study Map, page 4) shows the limits of the study segments. Sub-segments represent study segments that cross two segments.
• Segment 1 – Miami/Johnson County Line to K-10• Segment 2 – K-10 to State Avenue• Segment 3 – State Avenue to K-5/Muncie Street
Travel model output compared 2030 design year model measures of effectiveness to determine travel effi ciencies of the freeway versus arterial facility type.
In addition to the base alternatives, “What-If” alternatives were developed as a means of testing changes in land use and roadway network conditions. What-If alternatives analyzed included:
• 6-lane freeway • Full Build Out land use• Northern Connector between K-7 and I-435
TRAFFIC ANALYSIS
Phase 1 traffi c analysis used the K-7 travel demand model to analyze traffi c demand and travel characteristics. Results from this analysis were used to recommend a facility type for the corridor. Table 2 shows the forecasted daily traffi c demand for each study segment by analysis alternative.
Table 3 shows the forecasted travel time for each study segment by analysis alternative. Conclusions from the analysis were:
• 2030 and full build out land use generates more traffi c than the K-7 Corridor Technical Report, 2002 had identifi ed.• Freeway facility type draws more traffi c than the arterial facility type. • Original concept of 4-lane freeway versus 6-lane arterial needs to be 6-lane freeway versus 8-lane arterial.• No-Build is not an option.• Travel time is signifi cantly longer for arterial facility type than freeway facility type.
2004 Existing
2030 No Build
2030 Build 6-lane Freeway 6-Lane Arterial
Full Build Out 6-Lane Freeway 8-Lane Arterial
Segment 1223rd to I-35
Segment 2K-10 to I-70
16k - 24k
17k - 38k
20k - 53k20k - 45k
28k - 75k27k - 60k
Segment 3I-70 to K-5/Muncie
16k - 25k
29k - 69k
72k - 99k32k - 54k
107k - 139k 53k - 121k
20k
23k - 36k
50k - 67k25k - 36k
60k - 112k29k - 66k
Daily Traffi c
Daily Traffi c
Daily Traffi cDaily Traffi c
Daily Traffi cDaily Traffi c
2004 Existing
2030 No Build
2030 Build 6-lane Freeway 6-Lane Arterial
Full Build Out 6-Lane Freeway 8-Lane Arterial
Segment 1223rd to I-35
Segment 2K-10 to I-70
11.0
17.7
8.412.2
8.713.5
Segment 3I-70 to K-5/Muncie
10.6
36.4
13.119.3
18.526.6
10.0
27.6
9.314.0
11.516.3
Minutes
Minutes
MinutesMinutes
MinutesMinutes
Phase 1 Travel Time Forecast - Table 3
Phase 1 Traffi c Forecast - Table 2
15
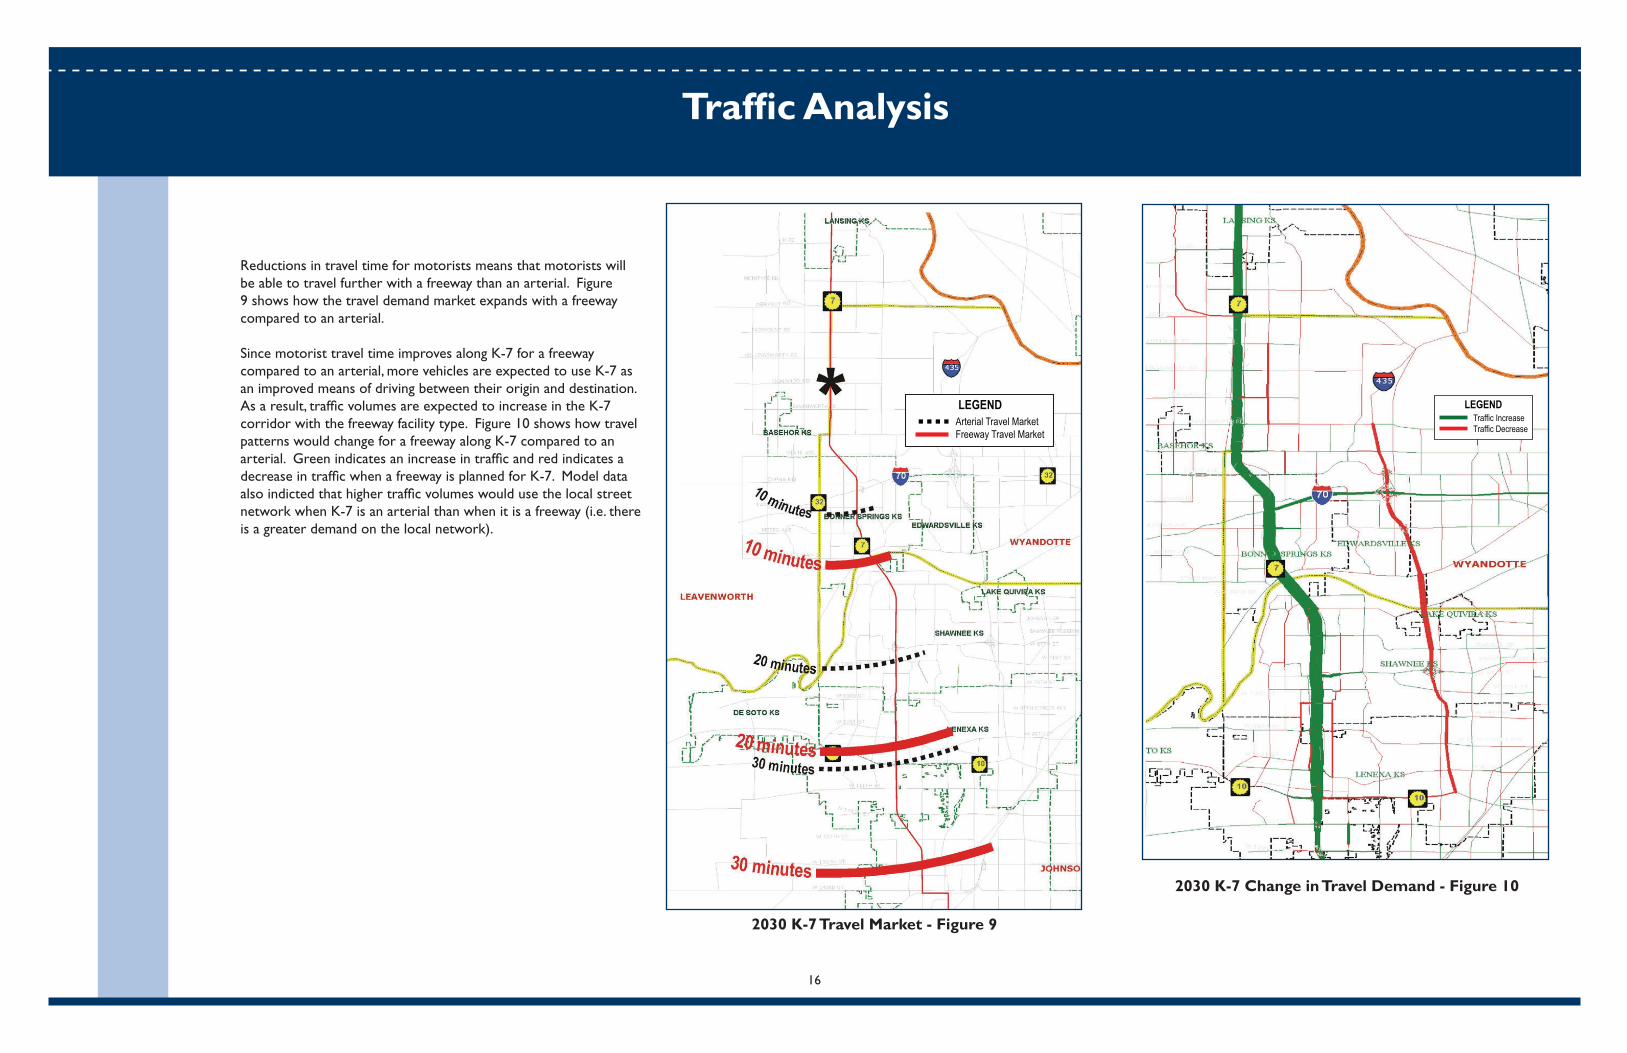
Reductions in travel time for motorists means that motorists will be able to travel further with a freeway than an arterial. Figure 9 shows how the travel demand market expands with a freeway compared to an arterial.
Since motorist travel time improves along K-7 for a freeway compared to an arterial, more vehicles are expected to use K-7 as an improved means of driving between their origin and destination. As a result, traffi c volumes are expected to increase in the K-7 corridor with the freeway facility type. Figure 10 shows how travel patterns would change for a freeway along K-7 compared to an arterial. Green indicates an increase in traffi c and red indicates a decrease in traffi c when a freeway is planned for K-7. Model data also indicted that higher traffi c volumes would use the local street network when K-7 is an arterial than when it is a freeway (i.e. there is a greater demand on the local network).
Traffi c Analysis
LEGENDArterial Travel MarketFreeway Travel Market
LEGENDTraffic IncreaseTraffic Decrease
2030 K-7 Travel Market - Figure 9
2030 K-7 Change in Travel Demand - Figure 10
16

What-If travel model scenarios are changes to either land use or the roadway network from the base condition. Phase 1 What-If scenario results were:
• 6-lane freeway – Previous estimates of a 4-lane freeway in the K-7 Technical Report were proven inadequate by the results of the 6-lane freeway What-If scenario. In Phase 1, a minimum of 6-lanes was shown to be needed in much of the corridor north of I-35 by 2030.
• Full build out land use – Full build out land use represents additional land use and traffi c growth beyond the 2030 design year. Additional land use and traffi c growth beyond 2030 was high at both ends of the study corridor and lower in the middle. Results indicated that traffi c volumes increased by a signifi cant amount from 2030 to Full Build Out conditions to warrant additional capacity.
• Northern Connector between K-7 and I-435 – A four lane freeway between K-7 and I-435 was analyzed with no improvements to K-7 between I-70 and Mary Street. Traffi c demand results indicated that the majority of the motorists continued to use K-7 and only a few vehicles were diverted to a new east/west route.
Safety Analysis
The K-7 Corridor Technical Report, 2002, performed a crash analysis of the corridor. The purpose was to analyze the corridors current safety. Five years of crash data was provided by KDOT from 1995 through 1999. The purpose of the safety analysis in this study was to review the more recent crash data to see if any trends had changed since the Technical Report. Crash data was provided by KDOT for years 2000, 2001 and 2002.
Table 4 shows the crash data provided by KDOT for years 2000, 2001 and 2002. As shown in the table, there were a signifi cant number of crashes in the study corridor. In the last three years of available data, there were 1,167 total accidents for an average of 389 accidents per year. Previously, between 1995 and 1999 there were 1,933 total accidents for an average of 387 per year, indicating that the average total accidents per year is similar to previous results. When crash rates were compared to the statewide crash rates for similar facilities, segment 1 shows a higher total crash rate than the statewide average. Other study segments show a crash rate close to the statewide average. As traffi c volumes increase in the corridor, the number and crash rate is expected to exceed the statewide average for most of the study segments.
Street Network (Phase 2 Micro-Level Segment Analysis)Study Methodology
Phase 2 analysis generated a micro-level understanding of K-7 and the street network for each study segment as opposed to the macro-level corridor analysis performed in Phase 1. A preliminary street network plan was developed for each study segment based on Phase 1 results and discussions with the study partners. The street network plan included identifi cation of lanes and locations where access would be for K-7 and the supporting street network.
In Phase 2, the travel model was taken to a greater level of detail that included a detailed street network concept plan. Based on the revised travel model, 2030 and full build out daily forecasted volumes for each study segment were developed.
Traffi c analysis tested traffi c results for K-7 and the supporting roadway network. Traffi c analysis utilized traffi c software that used traditional Highway Capacity Manual, 2000 methods.
Roadway segment and intersection/interchange level of service analysis of the K-7 Corridor street plan was performed for 2030 and full build out conditions. Design level of service D was used for 2030 conditions and design level of service E was used for full build out. Traffi c assumptions provided by KDOT for the K-7 Corridor Technical Report, 2002 were also used in this study:
• DHV = 11%• Directional Distribution = 55/45• Truck 11% mainline, 3%-5% urban streets In order to convert daily volumes to a design hour volume, complimentary movements were added together and then multiplied by the 0.55 directional split and 0.11 design hour volume factors. This approach provides a balanced volume that peaks in both the AM and PM directions at the same time, which provides a conservative analysis result.
K-7 mainline and local street network capacity was analyzed using urban arterial and freeway level of service capacity thresholds from Table 5 (below) and Table 6 (on the following page).
Traffi c Analysis
K-7 Overall Total Crashes by Segment 2000 – 2002 - Table 4
CorridorStudy
Segment
11223
TechnicalReport
Segment
12345
PDO
311250119156162
998
Injury
5228232631
160
Fatality
21222
9
TotalCrashes
365279144184195
1,167
AverageCrash Rate
[mvm]
2.12.60.72.01.0
Ave. StatewideCrash Rate
[mvm]
0.9862.8321.3072.8320.986
StatewideFacilityType*
4-Partial / Rural4-Partial / Urban
4-Full / Urban4-Partial / Urban4-Partial / Rural
TOTAL Source: KDOT *Statewide accidents for years 1997 - 2001Urban Arterial Thresholds
Daily Volumes Two-Way (vehicles/day) - Table 5
Lanes
2
4
6
8
LOS-A
NA
NA
NA
NA
LOS-B
NA
NA
NA
NA
LOS-C
10,800
23,700
36,800
49,900
LOS-D
13,700
27,400
41,200
54,900
LOS-E
14,300
28,700
43,100
57,500
Source: HCM 2000, Class ll
17

Traffi c Analysis
TRAFFIC ANALYSIS
Phase 2 traffi c analysis used a more detailed K-7 travel demand model to analyze traffi c demand and traffi c operations for the K-7 corridor and supporting street network. Results from this analysis were used to identify the necessary estimated right of way needs along K-7 as well as the supporting local street network.
Traffi c Demand
Existing, 2030 and full build out traffi c demand is shown on Figures 11 through 13. Traffi c forecasts represent Phase 2 model refi nements. (Note: Phase 1 assumed that K-7 between I 35 and K-10 remained in its current confi guration, whereas, Phase 2 assumed that K-7 between I-35 and K-10 was upgraded to a freeway.) The number of planned lanes for 2030 and full build out conditions are also shown.
Roadway Network
A large portion of land adjacent to K-7 is undeveloped. This is especially true north of I-70 and south of I-35. Consequently, a plan for the K-7 corridor and supporting roadway network was essential for the entire system to function together. The key features of the comprehensive roadway system are:
• Mainline Facility Type: Based on 2030 and full build out traffi c demand, the necessary K 7 freeway through and auxiliary lanes were developed to achieve a reasonable level of service in the respective design years. The number and type of K-7 mainline lanes are shown in Figure 12 and 13 for 2030 and full build out conditions.
• Interchanges: While KDOT prefers two-mile spacing for interchanges, K-7 interchanges would be located at a minimum of one-mile spacing. Most interchanges were initially laid out as typical diamond confi gurations, with signalized ramp terminals anticipated. However, due to existing or anticipated physical constraints, interchange confi gurations were modifi ed. Interchange layouts are shown in plan plates located in Appendix B.
• Frontage Roads: To effectively serve properties adjacent to K-7 in the future, and to conform to access management principles, a network of frontage roads was developed on both sides of K-7 in most areas. An effort was made to offset the frontage roads roughly one-quarter mile from the center line of K-7, in order to maintain adequate spacing between ramp terminals and adjacent intersections. Thus, these parallel facilities would serve as “reverse frontage” roads, with access to properties coming from the “rear”. The quarter-mile offset was used as a guide; existing topography, land use, and other features further guided the conceptual horizontal layout. The frontage roads are shown continuous when possible, not only to serve for local/regional circulation needs but to serve as relievers for K-7, reducing the need for short-trip local traffi c to use the freeway and providing potential diversion routes during freeway incidents. Frontage road layouts are shown in plan plates located in Appendix A.
• Supporting Local Arterials: Within the K-7 corridor, future major east-west arterials would fall at approximately one-mile intervals. It is envisioned that the major north-south facilities would be located approximately one mile on either side of K-7. Supporting local arterials are shown in plan plates located in Appendix A. • Property Access: Many properties currently have direct access to K-7 at points that would need to be closed to convert the facility to a freeway in the future. Therefore, the supporting network concept included access provisions to serve these properties, largely via connections to the frontage roads. The current concept illustrates potential ways to serve these properties if they remain in their current state. As anticipated development/redevelopment occurs along the corridor, these access considerations should be revisited to determine the best confi guration for individual developments and the system as a whole.
Freeway ThresholdsDaily Volumes Two-Way (vehicles/day) - Table 6
Lanes
2
4
6
8
LOS-A
19,700
30,400
41,700
53,600
LOS-B
32,200
49,800
68,300
87,800
LOS-C
46,500
71,900
98,600
132,800
LOS-D
62,700
96,800
132,800
170,700
LOS-E
80,600
124,500
170,800
219,500
Source: HCM 2000, Class ll
18

ADT
=Av
erag
eDa
ilyTr
affic
(2-W
ay)
LEAV
ENW
ORT
HCO
.
MIA
MIC
O.
WYA
NDO
TTE
CO.
JOHN
SON
CO.
Sprin
gH
ill
Ola
the
Ove
rland
Park
Kan
sas
City
Gar
dner
De
Soto
Lene
xa
Shaw
neeLa
keQ
uivi
ra
Edw
ards
ville
Bon
ner
Sprin
gs
Bas
ehor
Lans
ing
SAS NAK
I RUOSSI M
SAS NAK
I RUOSSI M10
32
10
32
69
56
40
50
169
2473
2440
50
56
71
69
69169
169
207T
HST
215T
HST
199T
HST
191S
TST
183R
DST
167T
HST
159T
HST
151S
TST
143R
DST
135T
HST
127T
HST
119T
HST
111T
HST
95TH
ST
83RD
ST
JOHN
SON
DR
SHAW
NEE
MISS
ION
PKW
Y
METR
OAV
E
KANS
ASAV
E
STAT
EAVE
LEAV
ENW
ORTH
RD
DONA
HOO
RD
HOLL
INGS
WOR
THRD
FAIR
MOUN
TRD
DEMP
SEY
RD
MCIN
TYRE
RD
PARA
LLEL
PKW
Y
5
5
43RD
ST
47TH
ST
55TH
ST
63RD
ST
67TH
ST
71ST
ST
75TH
ST
SANT
AFE
DENN
ISAV
E
175T
HST
19,3
00AD
T
24,4
00AD
T
16,1
00AD
T
22,2
00AD
T
20,5
00AD
T
16,3
00AD
T
15,3
00AD
T
24,9
00AD
T
20,2
00AD
T
21,1
00AD
T
7
169
73 7
Prop
osed
New
Align
ment
670
635
435
7070
29
35
Exi
stin
g T
raffi
c (
2002
-200
4) -
Fig
ure
11
19

2030
Tra
ffi c
and
Lan
es -
Fig
ure
12
133,
600
AD
T
124,
600
AD
T
90,9
00A
DT
93,2
00A
DT
118,
300
AD
T
72,0
00A
DT
41,7
00A
DT
73,6
00A
DT
46,0
00A
DT
LEA
VEN
WO
RTH
CO
.
MIA
MIC
O.
WYA
ND
OTT
EC
O.
JOH
NSO
NC
O.
Sprin
gH
ill
Ola
the
Ove
rlan
dPa
rk
Kan
sas
City
Gar
dner
De
Soto
Lene
xa
Shaw
neeLa
keQ
uivi
ra
Edw
ards
ville
Bon
ner
Sprin
gs
Bas
ehor
Lans
ing
SAS NAK
I RUOSSI M
SAS NAK
I RUOSSI M10
32
7
10
32
69
56
40
50
169
73
2473
2440
50
56
71
69
69
169
169
169
207T
HST
215T
HST
199T
HST
191S
TST
183R
DST
167T
HST
159T
HST
151S
TST
143R
DST
135T
HST
127T
HST
119T
HST
111T
HST
95TH
ST
83RD
ST
JOHN
SON
DR
SHAW
NEE
MISS
ION
PKW
Y
METR
OAV
E
KANS
ASAV
E
STAT
EAV
E
LEAV
ENW
ORTH
RD
DONA
HOO
RD
HOLL
INGS
WOR
THRD
FAIR
MOUN
TRD
DEMP
SEY
RD
MCIN
TYRE
RD
PARA
LLEL
PKW
Y
5
5
43RD
ST
47TH
ST
55TH
ST
63RD
ST
67TH
ST
71ST
ST
75TH
ST
SANT
AFE
DENN
ISAV
E
175T
HST
AD
T
6-La
neA
rter
ial
4-La
neFr
eew
ay4-
Lane
+A
uxili
ary
Lane
Free
way
6-La
neFr
eew
ay6-
Lane
+C
DLa
nes
Free
way
6-La
ne+
Aux
iliar
yLa
neFr
eew
ay
6-La
ne+
Aux
iliar
yLa
neFr
eew
ay+
One
-Way
Fron
tage
Roa
ds
Ave
rage
Dai
lyTr
affic
(2-W
ay)
LEG
END
7
GILM
ANRD
E.MA
RYST
4HRD
35
35
7070
29
435
635
670
435
35
20
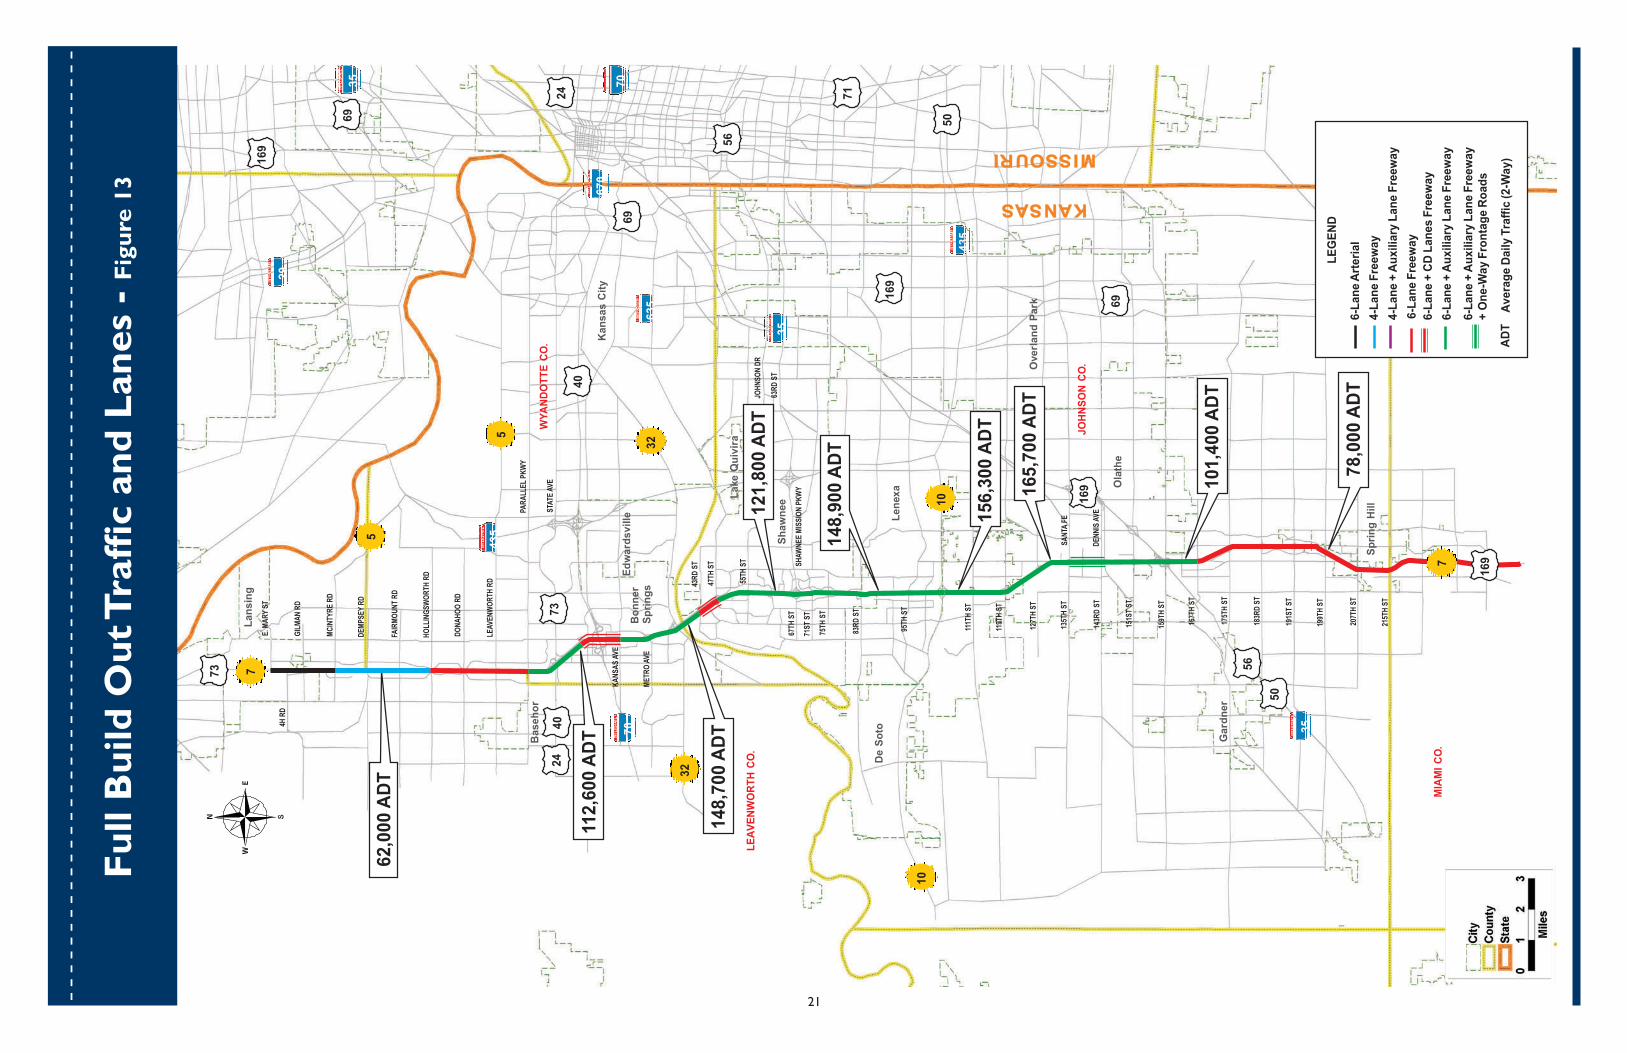
165,
700
ADT
156,
300
ADT
121,
800
ADT
148,
700
ADT
148,
900
ADT
112,
600
ADT
62,0
00AD
T
101,
400
ADT
78,0
00AD
T
LEAV
ENW
ORT
HCO
.
MIA
MIC
O.
WYA
NDO
TTE
CO.
JOHN
SON
CO.
Sprin
gH
ill
Ola
the
Ove
rland
Park
Kan
sas
City
Gar
dner
De
Soto
Lene
xa
Shaw
neeLa
keQ
uivi
ra
Edw
ards
ville
Bon
ner
Sprin
gs
Bas
ehor
Lans
ing
SAS NAK
I RUOSSI M
SAS NAK
I RUOSSI M
70
29
435
35
670
635
10
32
7
10
435
70
35
35
32
69
56
40
50
169
2473
2440
50
56
71
69
69169
169
169
207T
HST
215T
HST
199T
HST
191S
TST
183R
DST
167T
HST
159T
HST
151S
TST
143R
DST
135T
HST
127T
HST
119T
HST
111T
HST
95TH
ST
83RD
ST
JOHN
SON
DR
SHAW
NEE
MISS
ION
PKW
Y
METR
OAV
E
KANS
ASAV
E
STAT
EAVE
LEAV
ENW
ORTH
RD
DONA
HOO
RD
HOLL
INGS
WOR
THRD
FAIR
MOUN
TRD
DEMP
SEY
RD
MCIN
TYRE
RD
PARA
LLEL
PKW
Y
5
5
43RD
ST
47TH
ST
55TH
ST
63RD
ST
67TH
ST
71ST
ST
75TH
ST
SANT
AFE
DENN
ISAV
E
175T
HST
73 7
GILM
ANRD
E.MA
RYST
4HRD
ADT
6-La
neAr
teria
l4-
Lane
Free
way
4-La
ne+
Auxi
liary
Lane
Free
way
6-La
neFr
eew
ay6-
Lane
+CD
Lane
sFr
eew
ay6-
Lane
+Au
xilia
ryLa
neFr
eew
ay
6-La
ne+
Auxi
liary
Lane
Free
way
+ O
ne-W
ayFr
onta
geRo
ads
Aver
age
Daily
Traf
fic(2
-Way
)
LEG
END
Ful
l Bui
ld O
ut T
raffi
c a
nd L
anes
- F
igur
e 13
21

Operational Analysis
Based on the Phase 2 forecasted traffi c demand from the K-7 travel model, traffi c operations analysis was performed. Roadway capacity analysis was performed as described in the study methodology Section. This analysis was used to determine the number of future lanes on the K-7 mainline and supporting roadway network. Intersection level of service and queue analysis was performed to evaluate the number of lanes and operational characteristics for each interchange. Table 7 shows the K-7 Interchange ramp intersection level of service results for full build out conditions at ramp terminal intersections.
Because of their complexity, more detailed analysis was performed at the system to system interchanges of I-70, Shawnee Mission Parkway, K-10 and I-35.
Unique Areas
Based on the operational analysis performed, problem areas were identifi ed. These areas should be analyzed in greater detail as the planning and design process continues.
Segment 1
I-35 Interchange – The conceptual layout of the I-35 Interchange is shown in plan plate B-7 in Appendix B. The I-35 Interchange mainline, ramps, ramp junctions, and weaves were analyzed using Highway Capacity Software; preliminary analysis indicates that operations during 2030 are anticipated to be at LOS D or better and during full build out anticipated to be at LOS E or better. More detailed analysis of the interchange should be performed during design.
Traffi c Analysis
Intersection
Segment 3 - State Avenue to E. Mary StreetMcIntyre RoadFairmount Road/Polfer RoadDonahoo RoadHollingsworth RoadLeavenworth RoadParallel Parkway
Segment 1 - Miami/Johnson County Line to K-10
K-10College Boulevard (111th Street)119th StreetHarold (127th Street)Santa Fe (135th Street)Dennis Avenue (143rd Street)Old Highway 56151st Street159th StreetI-35167th Street175th Street183rd Street191st Street199th Street207th Street223rd Street
ABBBBB
9.013.219.014.914.613.1
BBBBCB
11.312.312.511.123.916.3
SouthboundK-7 Ramp Intersection
NorthboundK-7 Ramp Intersection
LOS Delay LOS Delay
AC-CDDBDB-CCC
-BABFEBCC-BBBBAAB
3.922.5
-31.440.342.411.441.612.9
-23.434.836.3
-11.98.131.5>8070.614.827.423.8
-11.512.27.412.79.07.815.5
C---DDBCB-CDD
33.4---
36.835.611.221.812.0
-31.653.646.2
-ABAFECBC-BAAABAB
-6.711.40.8>8056.721.912.622.1
-12.246.98.63.513.97.85.2
Segment 2 - K-10 to State AvenueUS-24130th StreetI-70Kansas AvenueNettletonK-3243rd Street47th StreetJohnson DriveShawnee Mission Parkway75th Street83rd StreetPrairie Star Parkway
Full Build Out K-7 Interchange Ramp Intersection Level of Service - Table 722

Traffi c Analysis
Old 56 Highway to Santa Fe (135th Street) – The conceptual design of the freeway system between US 56 and Santa Fe is shown in plan plates B-8 and B-9 in Appendix B. K-7 between US 56 and Santa Fe is proposed to have 6 lanes plus auxiliary lanes in each direction with slip ramps to and from one-way frontage roads. Both the northbound and southbound frontage roads will have two lanes in each direction and provide access to property and local streets. The area that presented the greatest traffi c operational problems in the K-7 corridor was the K-7 and Santa Fe northbound and southbound intersections. These two intersections were the only locations in the K-7 corridor that had level of service below the desired level for 2030 and full build out conditions.
Level of service problems are a direct result of the high traffi c forecasts around the intersections. K-7 model volume indicate 65,000 daily vehicles east of the intersection in 2030 and 84,000 daily vehicles east of the intersection in full build out.
Considering the planning level of this study, caution should be exercised with using the raw model volume output. Using the regional model at the intersection turning level may present some forecasting problems. Although the K-7 model refi ned the regional model by adding more model detail within the study corridor, limitations in the travel model may present infl ated traffi c volumes within this section of the study corridor. Some of the model limitations that may have contributed to the higher forecasts along Santa Fe include:
• Turning movements represent both AM and PM peaks occurring at the same time to be conservative, as described in the Study Methodology Section.• K-7 model is a daily model. Post processing using a uniform peak hour percent (K factor) was used to develop design hour volumes.• The regional model may not be refl ecting true corridor capacity constraints along Santa Fe.• Caution should be presented when using a regional model to extract turning movements.
In order to develop more accurate turning volumes at the K-7 and Santa Fe intersection, Olathe’s new travel demand model should be used which refl ects local travel conditions. External model freeway demand from the K-7 model could then be used in the Olathe model.
K-10 Interchange – The conceptual design of the K-10 Interchange is shown in plan plate A-5 in Appendix A. Detailed operational analysis of the K-10 Interchange was performed in the K-10 Interchanges Study. Travel demand for a 2030 (also considered full build out in this area) condition was correlated with the K-7 study. Study recommendations were for a system to system directional interchange and were modeled using VISSIM. Detailed operational results are found in the K-10 study. Based on the proposed design that includes braided ramps on all four segments of the interchange, no levels of service problems are anticipated.
Segment 2
I-70 Interchange – The conceptual design of the I-70 Interchange is shown in plan plate B-22 in Appendix B. The interchange at I-70 with K-7 required many design considerations. This was due to the fact that the existing interchange was designed to serve a toll plaza for the Kansas Turnpike. As such, very high turning movements were created at the intersection of K-7 with the I-70 ramps / Caanan Drive. In the previous K-7 study, a three level single point diamond interchange was recommended at this location. This design was a compromise from a fully directional Maltese cross design that is actually needed to satisfy the high existing and even higher expected movements between K-7 and I-70.
Further analysis has been completed and the results still do not favor the Maltese cross design. The right of way necessary to construct this type of interchange would require purchasing many of the businesses near the existing interchange. Also to construct this interchange, the ramps required to accommodate the projected traffi c volumes would extend south past the proposed Kansas Avenue interchange and north past the proposed interchange at 130th Street. This type of interchange would eliminate an interchange at Kansas Avenue as well as at 130th Street without an extensive collector-distributor system with braided ramps to grade-separate the weaving movements. This type of system, which is very similar to what would be required at the interchange of K-7 with K-10 to accommodate the close interchanges at Prairie Star Parkway and College Boulevard, would require the acquisition of almost all existing businesses along K-7 between 130th Street and Kansas Avenue.
Therefore to serve the high turning movements to and from K-7 at the I-70 ramps intersection, a unique layout for the interchange at I-70 with K-7 was developed. The proposed intersection design allows for directional traffi c movements without at grade signalized intersections. The interchanges at Kansas Avenue and at 130th Avenue could also be constructed. Finally, the right of way required to construct this interchange would not include purchasing any land currently occupied by a business.
23

Traffi c Analysis
The ramps between I-70 and K-7 most resemble a trumpet interchange in the northeast portion of the interchange. The same idea is mirrored in the southwest portion of the interchange. The unique design of this interchange also includes single-point urban interchanges at Kansas Avenue and at 130th Avenue. A system of collector-distributor roads was utilized to separate all ramp traffi c from mainline traffi c between Kansas Avenue and 130th Avenue.
One advantage to this design concept is that it could be implemented in phases to address even existing congestion at the K-7 intersection with the I-70 Ramps. The existing interchange could be modifi ed to serve only movements to and from northbound K-7. The mirrored interchange to the west could then serve the movements to and from southbound K-7.
43rd to 47th Street – The conceptual design of the K-7 collector/distributor system from 43rd Street to 47th Street is shown in plan plates B-17 and B-18 in Appendix B. It was determined that interchanges needed to be provided at both the intersections of 43rd and 47th Streets at K-7. 43rd Street serves large areas of developable non residential land that need direct highway access without traveling through residential neighborhoods to connect to 47th Street or Clare Road. 47th Street is an arterial route that connects between I-435 and K-7 and therefore also needs a direct connection to K-7. Construction of interchanges at 43rd Street and at 47th Street poses a variety of problems. Due to the existing 3250-foot spacing of the intersections, it would be very diffi cult to construct an interchange with direct access to K-7 at each of these locations. The short weave length between the on-ramp of one interchange and the off-ramp of the next interchange would create a safety problem for traffi c attempting to enter or exit the fl ow of highway traffi c. The terrain between these intersections also provides a design challenge due to the great elevation change between each existing location.
A split diamond interchange at each of the locations connected by a system of collector distributor roads is recommended. The collector-distributor roads allow traffi c to weave between interchanges without mixing with highway traffi c creating a safer highway and allowing interchanges to be constructed at each of the existing interchanges. The collector-distributor roads would also provide needed north-south connectors between 43rd and 47th Streets that would be very diffi cult to construct due to the terrain, railroad, existing developments, and other topographic limitations.
Shawnee Mission Parkway – The conceptual design of the Shawnee Mission Parkway Interchange is shown in plan plate B-15 in Appendix B. This existing small clover leaf interchange can serve the traffi c demands today and for a few years into the future. However, the full build out design traffi c volumes will require that this interchange be modifi ed to provide a collector-distributor system between the northbound and southbound clover leaf ramps on K-7. Without these collector distributor roads the weaving sections along K-7 will fail.
Segment 3
Donahoo Road Interchange – The conceptual design of the Donahoo Road Interchange is shown in plan plate B-27 in Appendix B. Existing development constrained the potential frontage road alternatives, resulting in the roundabout concepts developed for the ramp terminals. At the western roundabout (southbound on/off-ramps), the overall intersection is expected to operate at level of service B, however, the northbound frontage road approach is expected to operate at LOS F under full build out conditions. As development progresses in this area of the corridor, it will be important to monitor the expected operations of this interchange and continue to refi ne the concept.
Hollingsworth Road Interchange – The conceptual design of the Hollingsworth Road Interchange is shown in plan plate B-28 in Appendix B. Much like the Donahoo Road Interchange, at the western roundabout (southbound on/off-ramps), the overall intersection is expected to operate at level of service B, however, the northbound frontage road approach is expected to operate at LOS E under full build out conditions. As with Donahoo Road, it will be important to monitor the expected operations of this interchange and continue to refi ne the concept.
Frontage Road Alignments – The conceptual concept of continuous frontage roads is more important than the exact alignments chosen. To ensure a successful continuous facility on each side of K 7, the communities along Segment 3 will need to collaboratively plan (especially at jurisdictional boundaries) with an eye toward ultimately realizing this concept.
Future Property Access – The local access roads shown connecting to the frontage roads represent one concept of how the local properties could be served. They are by no means fi rm recommendations as to specifi c alignments. As the frontage roads are planned, and as properties develop or redevelop along the corridor, the responsible jurisdictions will need to consider how access needs will be met while maintaining adequate traffi c fl ow on the system as a whole.
Traffi c Addendum (Available Upon Request)
TransCAD K-7 Model with documentation Synchro, VISSIM, Sidra models Full build out Synchro Output for K-7 Corridor• Intersections HCM Report• Queue Report
24

Street Network
Introduction
The K-7 Corridor Management Study focused on K-7 and the adjacent local street system as contrasted to the 2002 Technical Report which primarily focused on the mainline of K-7. This is because K-7 and the local street network are an integrated system that must work together. The Traffi c Analysis section of the report discussed the development of the travel demand model used for the entire corridor and the nexus between land use and traffi c. This section describes the signifi cant freeway traffi c volumes on K-7 and the required complementary local street system.
K-7 and the local street network function as an integrated system that serves different destination and travel purposes. The differing destinations are evident in the aerial photography shown with the network and interchange plate drawings provided in Appendix A and B respectively. With the freeway facility type determination made for the entire corridor, K-7’s travel purpose will be to serve the higher traffi c demand volumes and faster travel times. The local street network will provide access to fi nal destinations and the ability to provide a reverse frontage road system to distribute traffi c and facilitate development opportunities.
Laying out an effective street network will enhance the capacity of K-7 and make the most use of the surrounding land, both developed and undeveloped. To accomplish an effective layout of the street network around K-7, City and County existing long range transportation plans were used along with input in the form of City/County meetings. Three of these meetings were held with each city and county along the corridor over the course of the project.
K-7 Corridor
As stated previously, the recommendation is for K-7 to be developed to an access controlled freeway its entire length. While there isn’t total agreement that a freeway is ultimately going to be needed, there is agreement that it would be prudent to plan and preserve right-of-way for a freeway. The Traffi c Analysis section describes in detail how the recommendation was made and justifi ed, but fundamentally the decision was driven by the future land use plans the communities and counties along K-7 provided to KDOT.
Appendix A presents the plate drawings at a scale that allows the proposed local street network system to be shown. Appendix B presents the interchange plate drawings at a larger scale to be able to see details and right-of-way preservation needs near the interchanges more clearly. For K-7, the drawings are developed with the following basic criteria:
• K-7 will be an access controlled freeway with primarily six through lanes.• Long term goals are to eliminate any existing at grade access points along K-7 and provide access only at interchanges.• K-7 will require approximately 300 feet of right-of-way for the mainline.
• KDOT will continue to have primary responsibility for maintaining K-7.• Interchanges are typically laid out as standard KDOT diamond interchanges with standard right-of-way needs preserved where feasible.• Desirable interchange spacing is every two miles to allow for safe weaving associated with ingress and egress to the freeway. However, more frequent access was uniformly desired by most communities along K-7 and the plate drawings in Appendix A and B generally show a minimum of one-mile spacing.• One-mile spacing of interchanges will require additional auxiliary lanes between interchange ramps.• Complex system to system interchanges at I-35 and I-70 have been laid out to serve the maximum amount of traffi c possible but also be sensitive to socioeconomic considerations.
A typical section of the K-7 mainline is provided in Figure 14 (in the following page). Individual interchange confi gurations are summarized with the Segment Summaries given below and unique traffi c challenges discussed within the Traffi c Analysis section of the report.
Local Street Network
Through local input and the use of general traffi c planning principles, the following guidelines were established for the local street network:
Arterials:
1.) The primary function is to distribute traffi c away from the interchanges, serve as medium to long range travel on the local street network, and distribute traffi c to the collector road system.
2.) Existing arterials are generally laid out in a one-mile grids.
3.) Arterials should be planned as 4-6 lane facilities with additional intersection turn lanes as dictated by turning movement volumes.
4.) Arterials should be planned to provide control of access as much as possible to facilitate the longer range nature of the travel trips.
5.) Access control is especially critical at interchange locations to more safely and effectively distribute the traffi c desiring to enter and exit the K-7 freeway and to avoid adverse operations on the K-7 mainline. Desired guidelines include having major intersections spaced a minimum of 1000 feet from the ramp intersections.
6.) Arterial streets are recommended to have a minimum proposed right-of-way of 120 feet.
25

Mainline Typical Section - Figure 14
26

Street Network
Collectors:
1.) The primary function is to distribute traffi c away from the arterials, provide short range trips to fi nal destinations, and provide access into developments.
2.) Collectors should be planned as 2-3 lane facilities with the third lane being a continuous turn lane as warranted.
3.) The collectors immediately adjacent to K-7 act as reverse frontage roads to distribute traffi c and provide access to properties for economic development.
4.) Collector streets are recommended to have a minimum proposed right-of-way of 80 feet.
5.) Access points should be a minimum of 600 feet from the collector and arterial street intersection.
Typical sections of the arterial and collector characteristics are provided in Figure 15 (in thefollowing page).
Implementation
This report only shows approximate locations of the local street network. As development occurs, there may need to be changes to the local street network shown. As these developments occur however, the cities and counties should seek to preserve the right-of-way for both K-7 and the local street network.
It will be important to incorporate the local street network into the city’s and county’s long range plans through updating their master plans. These long range plans should contain more detail about the exact location of the street network. The intent of this report is to show the right-of-way preservation needs that should be secured as development happens.
Segment 1 Summary
With the exception of the section through Olathe, this segment is largely undeveloped and already a high level expressway. Appendix A and B provide plate drawings showing the integrated K-7 freeway and local street system. The following is a brief summary of issues primarily focused on the interchanges:
• 223rd Street is a rapidly developing area and good connectivity to the local road system was desired. Future capacity enhancements to the existing interchange bridge are also desired.
• 215th Street was reviewed as a potential interchange location but eliminated due to the constrained 215th Street roadway section traveling east into Spring Hill. Capacity enhancements to 215th Street to serve the interchange traffi c would be detrimental to the existing homes east of the interchange.
• 207th Street provides good connectivity to Spring Hill’s industrial developments but requires the grade separation of the at-grade intersection at Lone Elm Road.
• 199th Street is a signifi cant east-west arterial in Johnson County with substantial capacity enhancements programmed along its entire length.
• 191st and 183rd Streets are shown as one-mile interchange spacings due to the ultimate development anticipated north of Spring Hill and south of Olathe.
• 175th Street like 199th Street is a signifi cant east-west arterial. A future interchange location to the west is needed to allow for the realignment of K-7 to provide a freeway through Olathe.
• 167th and 151st Street were initially examined as interchange locations but dropped since they were too close to the I-35 system to system interchange.
• The ultimate I-35 interchange concept will be a very large system to system fully directional interchange, but will also provide local access from K-7 to 159th Street. The I-35 interchange will utilize as much as possible of the bridges and right-of-way currently being acquired for the 159th/ Lone Elm Road service interchange. Impacts to the Cedar Lake Park are recognized but it is also noted that the lake has siltation issues and may not be a viable lake in the future when the system to system interchange is needed.
• An option was looked at to provide a freeway link between I-35 and approximately 119th Street on new alignment. Due to new development, terrain, and cost issues the existing K-7/Parker Street alignment was selected.
• The recommended K-7/Parker Street alignment will require converting an existing arterial street into a freeway. It impacts residences and businesses but achieves the goal of a continuous K-7 freeway with less impacts and constraints than a comparable western alignment. This conversion of K-7/Parker will be similar in character, concept, and impacts as Wichita experienced with the conversion of Kellogg/US 54 to a freeway. Old 56 Highway, Dennis Avenue, and Santa Fe Avenue would all be connected to the freeway by ramps and connected to each other by one way frontage roads. These frontage roads would provide access to local properties and to the local street system.
• The 127th Street interchange is immediately adjacent to Ernie Miller Park. To lessen the impact to the park but still provide access to it and 127th Street, a single roundabout is proposed. This will provide the capacity needed at this location, lessen the footprint of the interchange, and provide area for landscaping the entrance to the park.
27
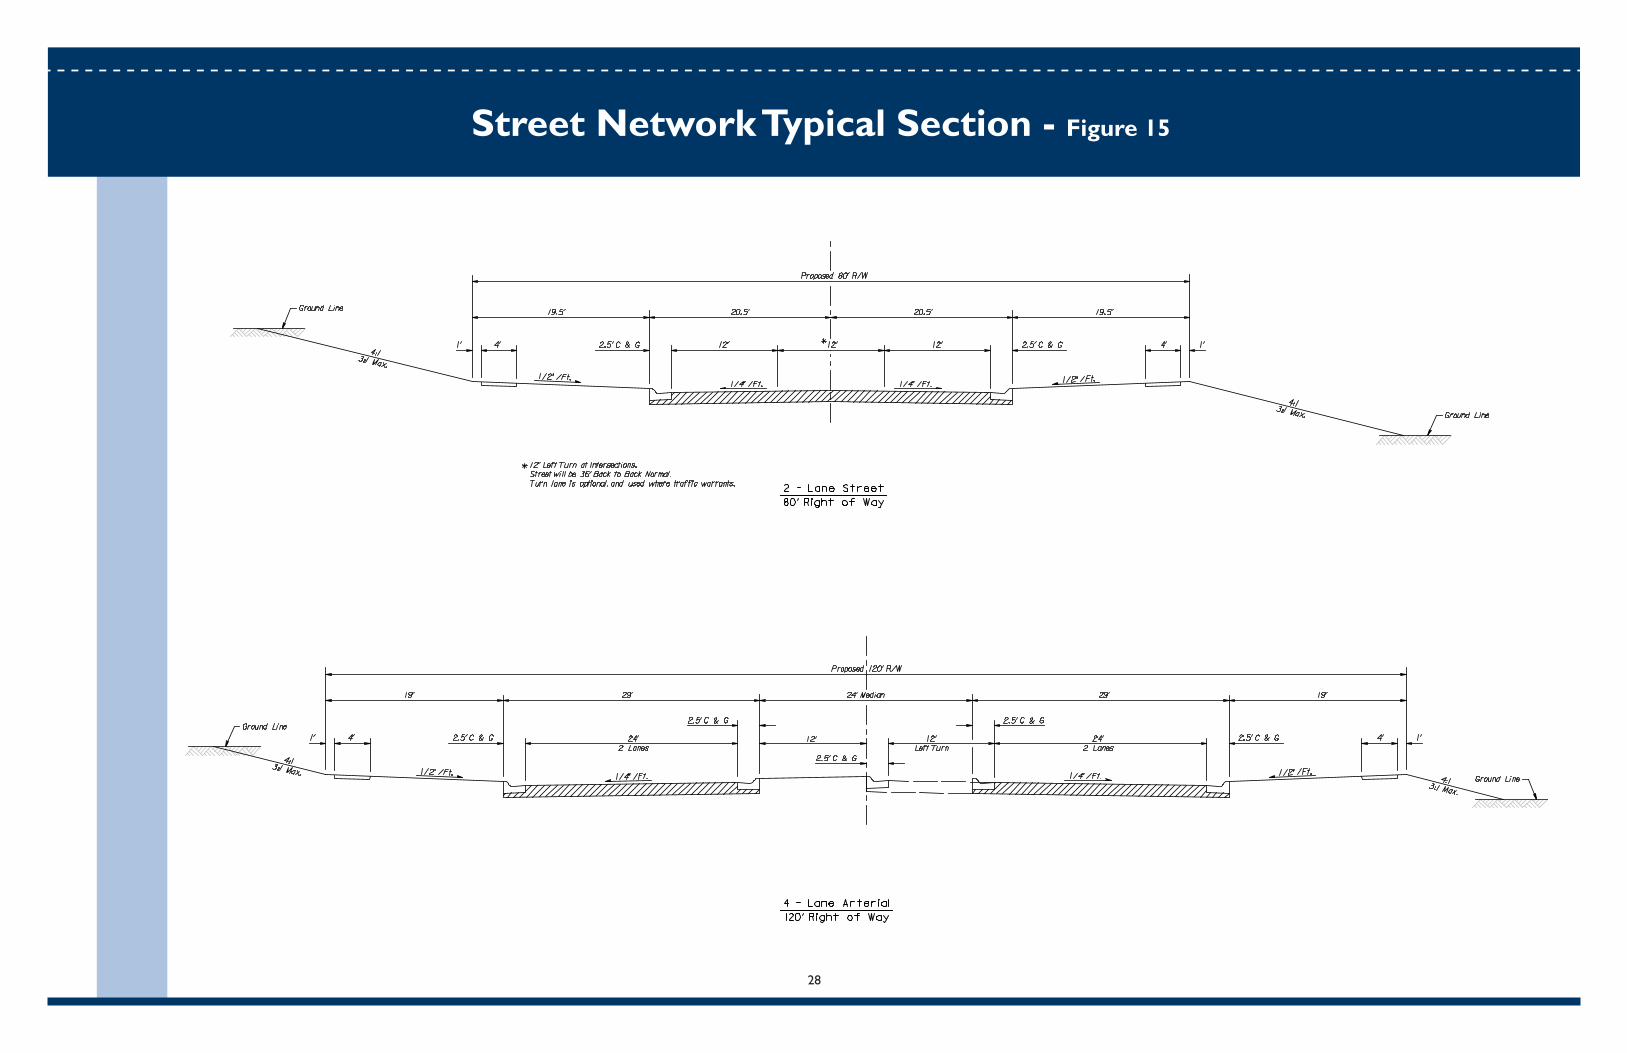
Street Network Typical Section - Figure 15
28

Street Network
• North of 127th Street is essentially a freeway to the end of Segment 1, at K-10. There are currently interchanges at both 119th Street and College Boulevard and these interchanges will remain in place and be largely unchanged. However, the mainline traffi c will go from 4 lane divided highway to a 6 lane closed median as shown in the typical sections.
• The College Boulevard and K-10 interchange confi guration was studied in detail as part of the K-10 Corridor Study and referenced into this study without modifi cation.
Segment 2 Summary
This segment is experiencing rapid development. K-7 is essentially a freeway from K-10 to 83rd Street with the exception of access closure needed at 91st Street. North of 83rd Street K-7 acts as an expressway with the exception of existing interchanges at Shawnee Mission Parkway, K-32, and Nettleton Avenue. Appendix A and B provide plate drawings showing the integrated K-7 and local street system. The following is a brief summary of issues primarily focused on the interchanges:
• The Prairie Star Parkway interchange confi guration was studied in detail as part of the K-10 Corridor Study and referenced into this study without any modifi cation.
• The 83rd Street, Shawnee Mission Parkway, K-32, and Nettleton Avenue interchange confi gurations remain the same with the notation that the pavement is assumed to be replaced in the report’s cost estimates.
• The access point on the east and west side of K-7 at approximately 91st Street does not meet access control requirements for a freeway and will be removed with access provided to the properties via a collector street system.
• A new diamond interchange is proposed for 75th Street to provide one-mile access.
• An overpass of K-7 is proposed at 71st Street to provide local road network continuity.
• Clear Creek Parkway will become an overpass of K-7 once the interchange at Johnson Drive is constructed.
• The Johnson Drive interchange layout will be as it is currently designed by KDOT for construction.
• Due to their proximity to each other, the 47th Street and 43rd Street interchanges will be designed as a split diamond interchange with a collector distributor connection system.
• Due to right-of-way issues the Kansas Avenue and 130th Street interchanges are laid out as tight urban diamond interchanges with a single point at Kansas Avenue.
• The I-70 system to system interchange has complex geometrics that are a result of the desire to serve traffi c demand, minimize impacts to existing businesses, and maximize the economic development opportunities on land vacant near the interchange.
• The US 24/US 40 interchange layout will be as it is currently designed by KDOT for construction.
Segment 3 Summary
The existing land use in Segment 3 is generally more rural in character and just beginning to experience development pressures. This segment of K-7 is currently an expressway. Appendix A and B provide plate drawings showing the integrated K-7 and local street system. The following is a brief summary of issues primarily focused on the interchanges:
• Given the limited physical constraints and the magnitude of the projected traffi c volumes, standard diamond interchange confi gurations are generally proposed in Segment 3. Parallel Parkway, Leavenworth Road, and McIntyre Road interchanges are all standard KDOT diamond interchanges.
• Donahoo Road, Hollingsworth Road, and Fairmount Road are slightly modifi ed diamond interchanges that include roundabouts that will effectively serve the traffi c distribution from the ramps and reverse frontage roads.
29

Access Management / Corridor Preservation Tools
Introduction
Access management and corridor preservation tools will be important instruments for KDOT and the communities to use as they implement the K-7 Corridor Plan. While the ultimate objective of an access controlled facility cannot be realized immediately, KDOT and the communities need to look for opportunities to eliminate access at locations other than approved interchange locations.
Access Management Tools
Access management is necessary to protect safety for the motoring public and the operational effi ciency of the K-7 Corridor. Effective access management also protects public investment and the continued economic vitality of the corridor as contrasted with uncontrolled access that can impede development and produce high costs if retrofi ts are needed.
KDOT and local communities can undertake access management activities as part of what is known as “governmental police powers” which is the authority used to take action to protect citizens’ well-being, safety and health. A component of access management is known as regulation of traffi c fl ow. Regulation of traffi c fl ow could include several actions listed in the access management tools below or be as simple as prohibiting left turns, prescribing one-way traffi c, or restricting speed as examples. Managing access is complicated and requires careful consideration but it can be done while still allowing the property owner reasonable access to their property and surrounding street network.
It is important to understand the differences between access (connection with surrounding roadways) and routing (direction of fl ows between properties and surrounding roadways). This difference is a prelude to listing and illustrating a variety of access management and corridor preservation tools. Lists of the tools are provided below and an illustration in Figure 16.
Access Management Tools
1.) Close median breaks
2.) Consolidate mainline driveways
3.) Eliminate mainline driveways/side road access
4.) Install frontage roads and reverse frontage roads
5.) Interim intersection upgrades (traffi c signals, turn-lanes, and acceleration lanes)
6.) Eliminate 1/2 mile intersections with overpass/underpass
7.) Utility master planning
8.) Intersection consolidation
9.) Convert one-mile intersections to interchanges
10.) Advance R.O.W. acquisition
11.) Dedication of R.O.W. for mainline and local roads in proportion to traffi c demands created by development
Typical Access Management - Figure 1630
Access Management
Corridor Preservation Tools
Corridor preservation is the application of planning efforts to identify needed right-of-way and control or protect it for a future transportation facility. Frequently the application of corridor preservation also accomplishes access management goals by providing connectivity to alternate transportation facilities for existing access points that are desired to be removed. Access management tools and regulations can be imposed as an overlay district and don’t have to be city or county wide. They can be deployed for corridor preservation through a coordinated use of techniques to control or protect right of way for planned transportation facilities. However, they can’t be used solely to reduce the cost of the facility; in such a case they could be construed as a compensable taking. Benefi ts of corridor preservation include:
• Preventing incompatible development• Minimizing environmental/social/economic impacts• Reducing displacements• Fixing the location of the facility which allows communities to make future plans with orderly development• Reduction in project costs
Close coordination between KDOT and the local communities is essential since authority for some preservation tools are vested in the state and others are vested in the locals.
1.) Land acquisition - Public sector entities have the authority to acquire land for public improvements including state highways and local roads and streets by gift, purchase, or condemnation. Suffi cient land may be acquired to accommodate immediate construction needs, as well as for future needs. In appropriate circumstances, public sector entities can acquire interests in land for public improvements in advance of the date of the start of construction. Jurisdiction: KDOT/Local.
2.) Transfer of development rights - The transfer or removal of the right to develop or build, expressed in units per acre or fl oor area ratio, from one lot or parcel to another, or from a portion of a lot to another part of the same lot. This transfer generally occurs in accordance with a legislative established program that allows the relocation of potential development (that authorized under applicable zoning regulations) from areas where proposed land uses or environmental impacts are considered undesirable (the donor site or sending zone), such as at locations where interchanges are to be constructed, to another areas (receiver or receiving zones) chosen on the basis of its ability to accommodate additional units of development beyond that for which it was zoned, with minimal environmental, social and aesthetic impacts. Jurisdiction: Local.
3.) Density transfers - The transfer of all or a part of the permitted density on a parcel to another parcel or to another portion of that same parcel at higher density that would be allowed under the existing zoning regulations. A way of retaining open space or land for future improvements by concentrating densities usually in compact areas at other locations while leaving unchanged historic, sensitive or hazardous areas. In some jurisdictions, for example, developers can buy development rights of properties targeted for public open space and transfer the additional density to the base number of units permitted in the zone in which they propose to develop. Jurisdiction: Local.
4.) Cluster Development - Similar to density transfers. Generally authorized by specifi c district regulations,
such as a cluster subdivision. A development design technique that concentrates buildings in specifi c areas on a site to allow the remaining land to be used for recreational, common open space, preservation or historically or economically sensitive areas. Jurisdiction: Local.
5.) Impact fees - A payment of money imposed by a public sector entity on development activity as a condition of granting development approval and/or a building permit in order to pay for the planned facilities needed to serve new growth and development activity. Involves the development of a legislative adopted system that provides the calculation methodology for the fee, and a system of credits, exemptions and appeals, etc. Jurisdiction: Local.
6.) Economic incentives - Measures that can be taken by a public sector entity to encourage certain types of development, such as: the grant of additional development capacity in exchange for the developer’s provision of a public benefi t or amenity, an increase in permitted density, tax abatement, and other forms of development subsidies. Jurisdiction: KDOT/Local.
7.) Development moratorium - The adoption by a public sector entity of a temporary halt on the processing of applications for all or a specifi ed type of development until a governmental activity is completed such as the adoption of a plan or the passage of a revised ordinance on a specifi ed subject. The Supreme Court recently held that a reasonable moratorium fulfi lls a legitimate public purpose and is not per se a taking. Jurisdiction: Local.
8.) Subdivision Regulation and Platting - The control of the division of a tract of land by a requiring development according to design standards and procedures adopted by local ordinance. These regulations usually specifi c what improvement the subdivider will be required to provide and the standard to which the improvements will need to be constructed. A plat is a map prepared by a registered civil engineer or licensed land surveyor showing the boundaries and locations of individual properties and streets of a proposed subdivision. The plat generally also shows land to be dedicated to a public sector entity for streets and easements for public utilities. Jurisdiction: Local.
9.) Zoning - A process utilizing the police power of local governments classifying land into areas and districts, such areas and districts being generally referred to as “zones” and imposing, in each area and district, regulations concerning building and structure designs, building and structure placement, and uses to which land, buildings, and structures within these districts may be put, including setbacks and height restrictions, lot coverage restrictions, impervious cover restrictions and typically allowing for certain uses only by special or conditional use permit. Jurisdiction: Local.
10.) Overlay districts - A zoning district that can be either initially mapped or narratively described to be mapped at some later point in time. An overlay district superimposes certain additional requirements that modify or supplement the regulations of the underlying general zoning district or districts, in recognition that distinguishing circumstances exist within the area that must be regulated in a manner different from the regulations of the underlying district. In the instance of confl icting requirements, the stricter of the requirements apply. Jurisdiction: Local.
12.) Setback ordinances - Regulations establishing the requirement that a building or structure be set back a certain distance from a road , street highway or lot line, generally at street-grade level, although it can be at a prescribed height. K.S.A. § 12-765 is an example of legislation that authorizes the adoption of setback regulations from major streets or highways by cities or counties. This statute specifi cally authorizes the incorporation by reference of an offi cial map and a prohibition on the locations of any new buildings within those established building setback lines. Jurisdiction: KDOT/Local.
13.) Offi cial Map - A legally adopted map that conclusively shows the location and width of proposed road or streets, public facilities and public areas and drainage rights-of-way. Jurisdiction: KDOT/Local.
31
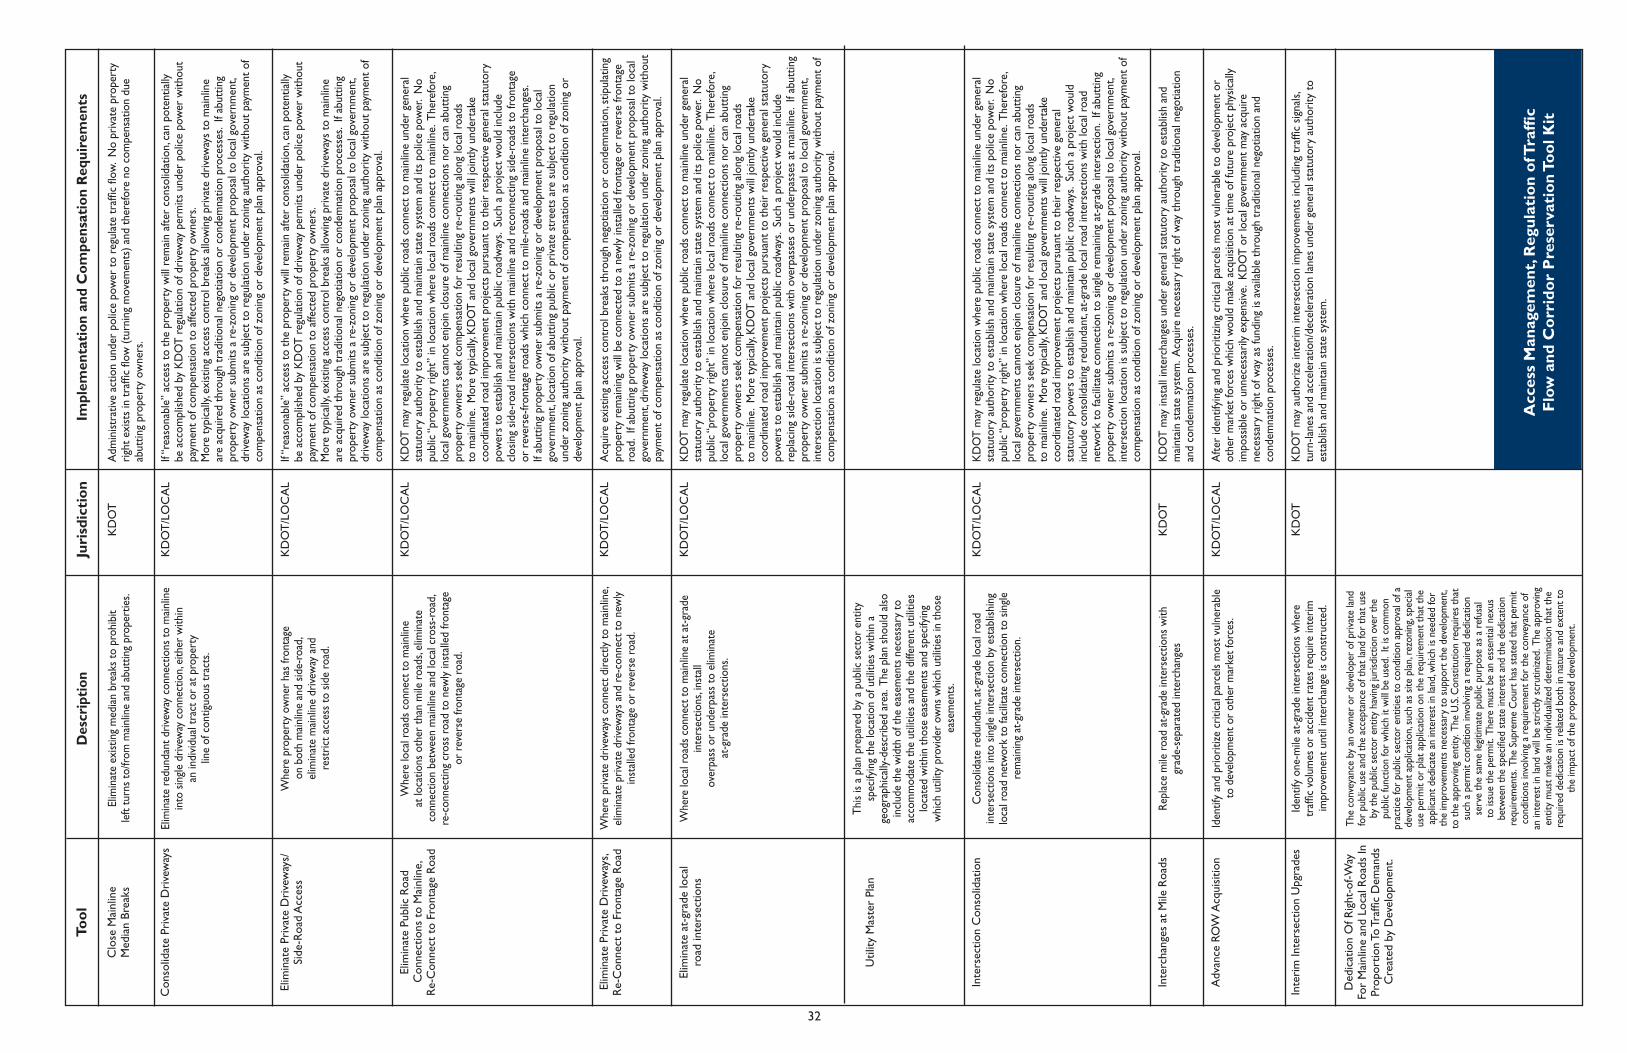
Too
l
Clo
se M
ainl
ine
Med
ian
Brea
ks
Con
solid
ate
Priv
ate
Dri
vew
ays
Elim
inat
e Pr
ivat
e D
rive
way
s/Si
de-R
oad
Acc
ess
Elim
inat
e Pu
blic
Roa
d C
onne
ctio
ns t
o M
ainl
ine,
R
e-C
onne
ct t
o Fr
onta
ge R
oad
Elim
inat
e Pr
ivat
e D
rive
way
s,R
e-C
onne
ct t
o Fr
onta
ge R
oad
Elim
inat
e at
-gra
de lo
cal
road
inte
rsec
tions
Util
ity M
aste
r Pl
an
Inte
rsec
tion
Con
solid
atio
n
Inte
rcha
nges
at
Mile
Roa
ds
Adv
ance
RO
W A
cqui
sitio
n
Inte
rim
Inte
rsec
tion
Upg
rade
s
Ded
icat
ion
Of R
ight
-of-W
ay
For
Mai
nlin
e an
d Lo
cal R
oads
In
Prop
ortio
n To
Tra
ffi c
Dem
ands
C
reat
ed b
y D
evel
opm
ent.
Des
crip
tion
Elim
inat
e ex
istin
g m
edia
n br
eaks
to p
rohi
bit
left
turn
s to
/from
mai
nlin
e an
d ab
uttin
g pr
oper
ties.
Elim
inat
e re
dund
ant d
rivew
ay c
onne
ctio
ns to
mai
nlin
e in
to s
ingl
e dr
ivew
ay c
onne
ctio
n, ei
ther
with
inan
indi
vidu
al tr
act o
r at
pro
pert
ylin
e of
con
tiguo
us tr
acts
.
W
here
pro
pert
y ow
ner
has
front
age
on b
oth
mai
nlin
e an
d sid
e-ro
ad,
elim
inat
e m
ainl
ine
driv
eway
and
rest
rict a
cces
s to
sid
e ro
ad.
Whe
re lo
cal r
oads
con
nect
to m
ainl
ine
at lo
catio
ns o
ther
than
mile
roa
ds, e
limin
ate
conn
ectio
n be
twee
n m
ainl
ine
and
loca
l cro
ss-r
oad,
re
-con
nect
ing
cros
s ro
ad to
new
ly in
stal
led
front
age
or r
ever
se fr
onta
ge r
oad.
Whe
re p
rivat
e dr
ivew
ays
conn
ect d
irect
ly to
mai
nlin
e, el
imin
ate
priv
ate
driv
eway
s an
d re
-con
nect
to n
ewly
in
stal
led
front
age
or r
ever
se r
oad.
Whe
re lo
cal r
oads
con
nect
to m
ainl
ine
at a
t-gr
ade
inte
rsec
tions
, inst
all
over
pass
or
unde
rpas
s to
elim
inat
eat
-gra
de in
ters
ectio
ns.
This
is a
plan
pre
pare
d by
a p
ublic
sec
tor
entit
y sp
ecify
ing
the
loca
tion
of u
tiliti
es w
ithin
a
geog
raph
ical
ly-d
escr
ibed
are
a. T
he p
lan
shou
ld a
lso
incl
ude
the
wid
th o
f the
eas
emen
ts n
eces
sary
to
acco
mm
odat
e th
e ut
ilitie
s an
d th
e di
ffere
nt u
tiliti
es
loca
ted
with
in th
ose
ease
men
ts a
nd s
peci
fyin
g w
hich
util
ity p
rovi
der
owns
whi
ch u
tiliti
es in
thos
e ea
sem
ents
.
Con
solid
ate
redu
ndan
t, at
-gra
de lo
cal r
oad
inte
rsec
tions
into
sin
gle
inte
rsec
tion
by e
stab
lishi
ng
loca
l roa
d ne
twor
k to
faci
litat
e co
nnec
tion
to s
ingl
e re
mai
ning
at-
grad
e in
ters
ectio
n.
Repl
ace
mile
roa
d at
-gra
de in
ters
ectio
ns w
ithgr
ade-
sepa
rate
d in
terc
hang
es
Iden
tify
and
prio
ritiz
e cr
itica
l par
cels
mos
t vul
nera
ble
to d
evel
opm
ent o
r ot
her
mar
ket f
orce
s.
Iden
tify
one-
mile
at-
grad
e in
ters
ectio
ns w
here
tr
affi c
vol
umes
or
acci
dent
rat
es r
equi
re in
terim
im
prov
emen
t unt
il in
terc
hang
e is
cons
truc
ted.
The
conv
eyan
ce b
y an
ow
ner
or d
evel
oper
of p
rivat
e la
nd
for
publ
ic u
se a
nd th
e ac
cept
ance
of t
hat l
and
for
that
use
by
the
publ
ic s
ecto
r en
tity
havi
ng ju
risdi
ctio
n ov
er th
e pu
blic
func
tion
for
whi
ch it
will
be
used
. It
is co
mm
on
prac
tice
for
publ
ic s
ecto
r en
titie
s to
con
ditio
n ap
prov
al o
f a
deve
lopm
ent a
pplic
atio
n, su
ch a
s sit
e pl
an, r
ezon
ing,
spec
ial
use
perm
it or
pla
t app
licat
ion
on th
e re
quire
men
t tha
t the
ap
plic
ant d
edic
ate
an in
tere
st in
land
, whi
ch is
nee
ded
for
the
impr
ovem
ents
nec
essa
ry to
sup
port
the
deve
lopm
ent,
to th
e ap
prov
ing
entit
y. T
he U
.S. C
onst
itutio
n re
quire
s th
at
such
a p
erm
it co
nditi
on in
volv
ing
a re
quire
d de
dica
tion
serv
e th
e sa
me
legi
timat
e pu
blic
pur
pose
as
a re
fusa
l to
issu
e th
e pe
rmit.
The
re m
ust b
e an
ess
entia
l nex
us
betw
een
the
spec
ifi ed
sta
te in
tere
st a
nd th
e de
dica
tion
requ
irem
ents
. The
Sup
rem
e C
ourt
has
sta
ted
that
per
mit
cond
ition
s in
volv
ing
a re
quire
men
t for
the
conv
eyan
ce o
f an
inte
rest
in la
nd w
ill b
e st
rictly
scr
utin
ized.
The
app
rovi
ng
entit
y m
ust m
ake
an in
divi
dual
ized
dete
rmin
atio
n th
at th
e re
quire
d de
dica
tion
is re
late
d bo
th in
nat
ure
and
exte
nt to
th
e im
pact
of t
he p
ropo
sed
deve
lopm
ent.
Juri
sdic
tio
n
KD
OT
KD
OT
/LO
CA
L
KD
OT
/LO
CA
L
KD
OT
/LO
CA
L
KD
OT
/LO
CA
L
KD
OT
/LO
CA
L
KD
OT
/LO
CA
L
KD
OT
KD
OT
/LO
CA
L
KD
OT
Impl
emen
tati
on a
nd C
ompe
nsat
ion
Req
uire
men
ts
Adm
inist
rativ
e ac
tion
unde
r po
lice
pow
er to
reg
ulat
e tr
affi c
fl ow
. N
o pr
ivat
e pr
oper
ty
righ
t exi
sts
in tr
affi c
fl ow
(tur
ning
mov
emen
ts) a
nd th
eref
ore
no c
ompe
nsat
ion
due
abut
ting
prop
erty
ow
ners
.
If “r
easo
nabl
e” a
cces
s to
the
prop
erty
will
rem
ain
afte
r co
nsol
idat
ion,
can
pot
entia
lly
be a
ccom
plish
ed b
y K
DO
T re
gula
tion
of d
rive
way
per
mits
und
er p
olic
e po
wer
with
out
paym
ent o
f com
pens
atio
n to
affe
cted
pro
pert
y ow
ners
.M
ore
typi
cally
, exi
stin
g ac
cess
con
trol
bre
aks
allo
win
g pr
ivat
e dr
ivew
ays
to m
ainl
ine
are
acqu
ired
thro
ugh
trad
ition
al n
egot
iatio
n or
con
dem
natio
n pr
oces
ses.
If a
butt
ing
prop
erty
ow
ner
subm
its a
re-
zoni
ng o
r de
velo
pmen
t pro
posa
l to
loca
l gov
ernm
ent,
driv
eway
loca
tions
are
sub
ject
to r
egul
atio
n un
der
zoni
ng a
utho
rity
with
out p
aym
ent o
f co
mpe
nsat
ion
as c
ondi
tion
of z
onin
g or
dev
elop
men
t pla
n ap
prov
al.
KD
OT
may
reg
ulat
e lo
catio
n w
here
pub
lic r
oads
con
nect
to m
ainl
ine
unde
r ge
nera
l st
atut
ory
auth
ority
to e
stab
lish
and
mai
ntai
n st
ate
syst
em a
nd it
s po
lice
pow
er.
No
publ
ic “p
rope
rty
righ
t” in
loca
tion
whe
re lo
cal r
oads
con
nect
to m
ainl
ine.
The
refo
re,
loca
l gov
ernm
ents
can
not e
njoi
n cl
osur
e of
mai
nlin
e co
nnec
tions
nor
can
abu
ttin
g pr
oper
ty o
wne
rs s
eek
com
pens
atio
n fo
r re
sulti
ng r
e-ro
utin
g al
ong
loca
l roa
ds
to m
ainl
ine.
Mor
e ty
pica
lly, K
DO
T an
d lo
cal g
over
nmen
ts w
ill jo
intly
und
erta
ke
coor
dina
ted
road
impr
ovem
ent p
roje
cts
purs
uant
to th
eir
resp
ectiv
e ge
nera
l sta
tuto
ry
pow
ers
to e
stab
lish
and
mai
ntai
n pu
blic
roa
dway
s. S
uch
a pr
ojec
t wou
ld in
clud
e cl
osin
g sid
e-ro
ad in
ters
ectio
ns w
ith m
ainl
ine
and
reco
nnec
ting
side-
road
s to
fron
tage
or
rev
erse
-fron
tage
roa
ds w
hich
con
nect
to m
ile-r
oads
and
mai
nlin
e in
terc
hang
es.
If ab
uttin
g pr
oper
ty o
wne
r su
bmits
a r
e-zo
ning
or
deve
lopm
ent p
ropo
sal t
o lo
cal
gove
rnm
ent,
loca
tion
of a
butt
ing
publ
ic o
r pr
ivat
e st
reet
s ar
e su
bjec
t to
regu
latio
n un
der
zoni
ng a
utho
rity
with
out p
aym
ent o
f com
pens
atio
n as
con
ditio
n of
zon
ing
or
deve
lopm
ent p
lan
appr
oval
.
Acq
uire
exi
stin
g ac
cess
con
trol
bre
aks
thro
ugh
nego
tiatio
n or
con
dem
natio
n, s
tipul
atin
g pr
oper
ty r
emai
ning
will
be
conn
ecte
d to
a n
ewly
inst
alle
d fr
onta
ge o
r re
vers
e fr
onta
ge
road
. If
abut
ting
prop
erty
ow
ner
subm
its a
re-
zoni
ng o
r de
velo
pmen
t pro
posa
l to
loca
l go
vern
men
t, dr
ivew
ay lo
catio
ns a
re s
ubje
ct to
reg
ulat
ion
unde
r zo
ning
aut
hori
ty w
ithou
t pa
ymen
t of c
ompe
nsat
ion
as c
ondi
tion
of z
onin
g or
dev
elop
men
t pla
n ap
prov
al.
KD
OT
may
reg
ulat
e lo
catio
n w
here
pub
lic r
oads
con
nect
to m
ainl
ine
unde
r ge
nera
l st
atut
ory
auth
ority
to e
stab
lish
and
mai
ntai
n st
ate
syst
em a
nd it
s po
lice
pow
er.
No
publ
ic “p
rope
rty
righ
t” in
loca
tion
whe
re lo
cal r
oads
con
nect
to m
ainl
ine.
The
refo
re,
loca
l gov
ernm
ents
can
not e
njoi
n cl
osur
e of
mai
nlin
e co
nnec
tions
nor
can
abu
ttin
g pr
oper
ty o
wne
rs s
eek
com
pens
atio
n fo
r re
sulti
ng r
e-ro
utin
g al
ong
loca
l roa
ds
to m
ainl
ine.
Mor
e ty
pica
lly, K
DO
T an
d lo
cal g
over
nmen
ts w
ill jo
intly
und
erta
ke
coor
dina
ted
road
impr
ovem
ent p
roje
cts
purs
uant
to th
eir
resp
ectiv
e ge
nera
l sta
tuto
ry
pow
ers
to e
stab
lish
and
mai
ntai
n pu
blic
roa
dway
s. S
uch
a pr
ojec
t wou
ld in
clud
e re
plac
ing
side-
road
inte
rsec
tions
with
ove
rpas
ses
or u
nder
pass
es a
t mai
nlin
e. I
f abu
ttin
g pr
oper
ty o
wne
r su
bmits
a r
e-zo
ning
or
deve
lopm
ent p
ropo
sal t
o lo
cal g
over
nmen
t, in
ters
ectio
n lo
catio
n is
subj
ect t
o re
gula
tion
unde
r zo
ning
aut
hori
ty w
ithou
t pay
men
t of
com
pens
atio
n as
con
ditio
n of
zon
ing
or d
evel
opm
ent p
lan
appr
oval
.
KD
OT
may
reg
ulat
e lo
catio
n w
here
pub
lic r
oads
con
nect
to m
ainl
ine
unde
r ge
nera
l st
atut
ory
auth
ority
to e
stab
lish
and
mai
ntai
n st
ate
syst
em a
nd it
s po
lice
pow
er.
No
publ
ic “p
rope
rty
righ
t” in
loca
tion
whe
re lo
cal r
oads
con
nect
to m
ainl
ine.
The
refo
re,
loca
l gov
ernm
ents
can
not e
njoi
n cl
osur
e of
mai
nlin
e co
nnec
tions
nor
can
abu
ttin
g pr
oper
ty o
wne
rs s
eek
com
pens
atio
n fo
r re
sulti
ng r
e-ro
utin
g al
ong
loca
l roa
ds
to m
ainl
ine.
Mor
e ty
pica
lly, K
DO
T an
d lo
cal g
over
nmen
ts w
ill jo
intly
und
erta
ke
coor
dina
ted
road
impr
ovem
ent p
roje
cts
purs
uant
to th
eir
resp
ectiv
e ge
nera
l st
atut
ory
pow
ers
to e
stab
lish
and
mai
ntai
n pu
blic
roa
dway
s. S
uch
a pr
ojec
t wou
ld
incl
ude
cons
olid
atin
g re
dund
ant,
at-g
rade
loca
l roa
d in
ters
ectio
ns w
ith lo
cal r
oad
netw
ork
to fa
cilit
ate
conn
ectio
n to
sin
gle
rem
aini
ng a
t-gr
ade
inte
rsec
tion.
If a
butt
ing
prop
erty
ow
ner
subm
its a
re-
zoni
ng o
r de
velo
pmen
t pro
posa
l to
loca
l gov
ernm
ent,
inte
rsec
tion
loca
tion
is su
bjec
t to
regu
latio
n un
der
zoni
ng a
utho
rity
with
out p
aym
ent o
f co
mpe
nsat
ion
as c
ondi
tion
of z
onin
g or
dev
elop
men
t pla
n ap
prov
al.
KD
OT
may
inst
all i
nter
chan
ges
unde
r ge
nera
l sta
tuto
ry a
utho
rity
to e
stab
lish
and
mai
ntai
n st
ate
syst
em. A
cqui
re n
eces
sary
rig
ht o
f way
thro
ugh
trad
ition
al n
egot
iatio
n an
d co
ndem
natio
n pr
oces
ses.
Afte
r id
entif
ying
and
pri
oriti
zing
cri
tical
par
cels
mos
t vul
nera
ble
to d
evel
opm
ent o
r ot
her
mar
ket f
orce
s w
hich
wou
ld m
ake
acqu
isitio
n at
tim
e of
futu
re p
roje
ct p
hysic
ally
im
poss
ible
or
unne
cess
arily
exp
ensiv
e. K
DO
T or
loca
l gov
ernm
ent m
ay a
cqui
re
nece
ssar
y ri
ght o
f way
as
fund
ing
is av
aila
ble
thro
ugh
trad
ition
al n
egot
iatio
n an
d co
ndem
natio
n pr
oces
ses.
KD
OT
may
aut
hori
ze in
teri
m in
ters
ectio
n im
prov
emen
ts in
clud
ing
traf
fi c s
igna
ls,
turn
-lane
s an
d ac
cele
ratio
n/de
cele
ratio
n la
nes
unde
r ge
nera
l sta
tuto
ry a
utho
rity
to
esta
blish
and
mai
ntai
n st
ate
syst
em.
Acc
ess
Man
agem
ent,
Reg
ulat
ion
of T
raffi
c
Flo
w a
nd C
orr
ido
r P
rese
rvat
ion
Too
l Kit
32

Cost Estimates
Introduction
The programming costs for this project were developed to provide a conceptual level estimate at 2005 construction dollars. These numbers do not include any infl ation. With the exception of the section through Olathe, it is generally assumed that the project will be able to be constructed using conventional means without large amounts of temporary pavements or retaining walls. However, the section through Olathe does account for the increased cost associated with assumed retaining walls and a freeway section similar to what is used in Wichita for the Kellogg/US-54 project.
Constructible Sections
The cost estimate is broken down into constructible sections within each segment. These sections go from one complete interchange to another complete interchange. Therefore the cost includes the interchange and approximately one-half mile of freeway on each side of the interchange including the freeway through the interchange as noted by fi gure 17. This approach was chosen because it allows for projects that could be completed independently of each other.
Per Mile Breakdown
Each type of roadway was developed by a per-mile basis. The cost of pavement, earthwork, drainage, intersections, interchanges, etc were added up for the one mile section of each of the three roadway types. These totals for the one mile stretch were then compared to current projects being constructed around the metro area. The length of each roadway was measured and the per-mile costs applied to each one within each section. The result is an estimate of the cost of construction.
This method averages together all of the roadways of that type. It does not take into account specifi c construction complications for one individual piece of roadway, but assumes that those diffi culties will be averaged out over the entire length of the project. It is not the intention of this cost estimate to be used in the planning of each individual section of street or highway, it is intended, rather, to be a guide for macro level project budgeting purposes.
The fi gure below includes those roads and interchanges included in the cost estimates.
33
Conceptual Constructable Segments - Figure 17
Cost estimates do notinclude preliminary engineering, right-of-way, or construction engineering.
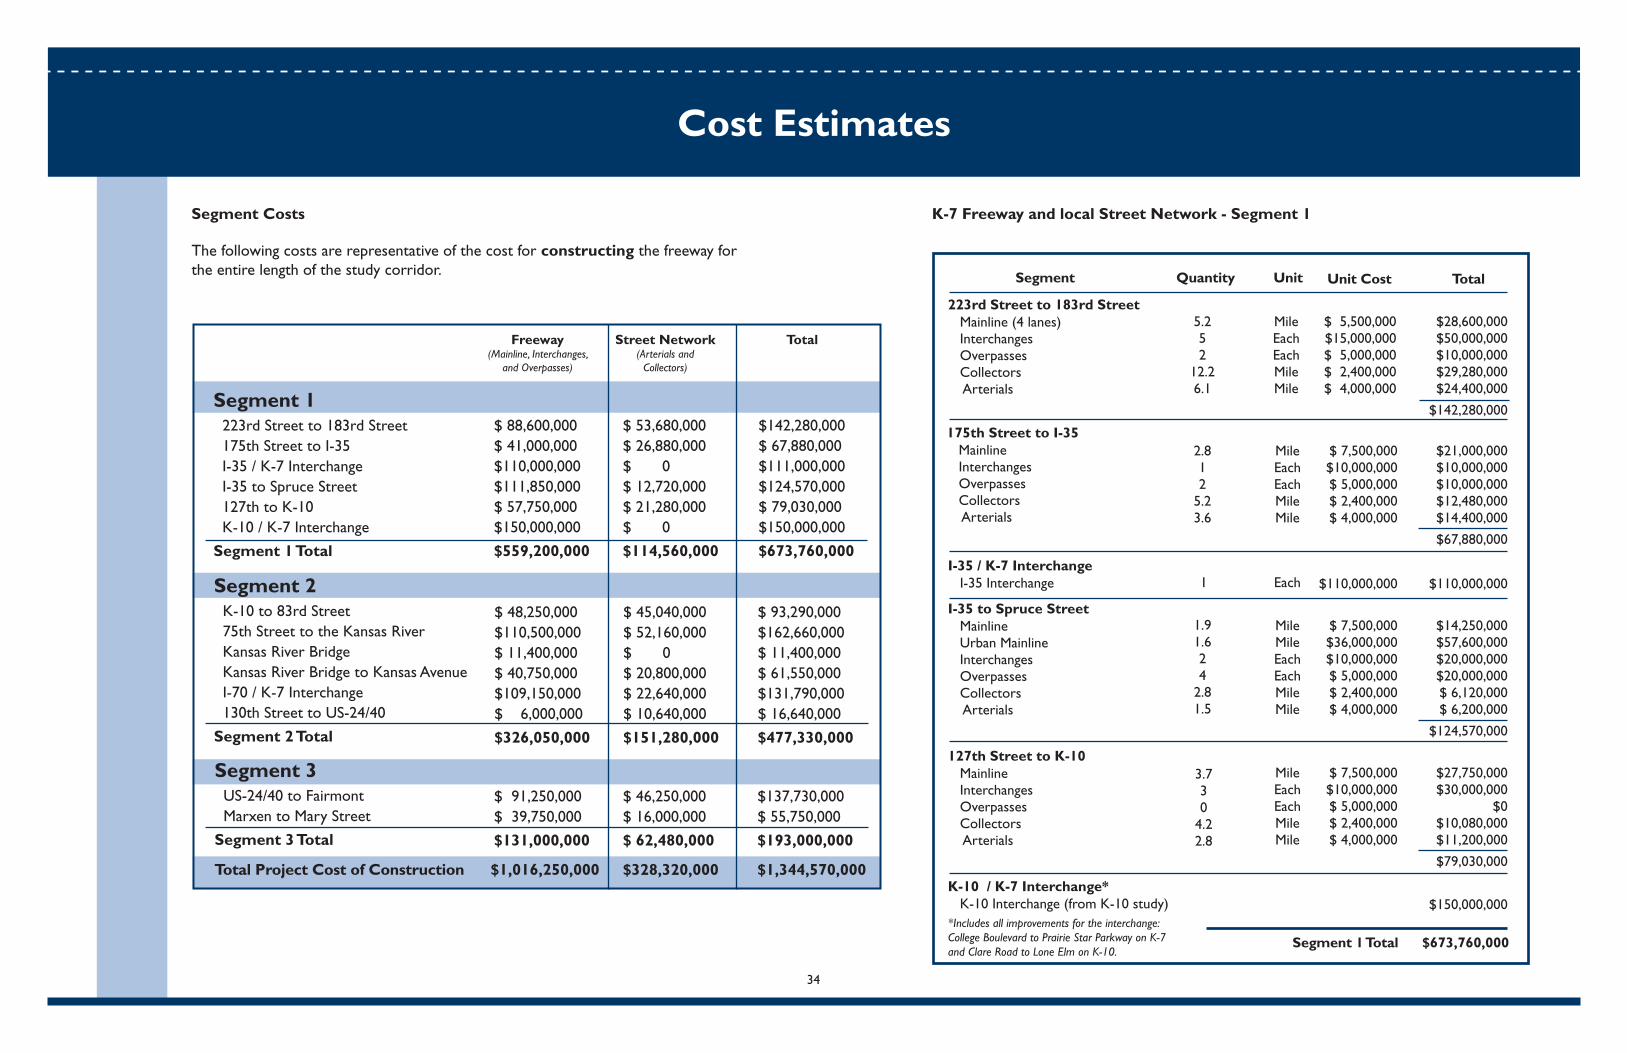
Cost Estimates
Segment Costs
The following costs are representative of the cost for constructing the freeway forthe entire length of the study corridor.
K-7 Freeway and local Street Network - Segment 1
34
Segment 1 223rd Street to 183rd Street 175th Street to I-35 I-35 / K-7 Interchange I-35 to Spruce Street 127th to K-10 K-10 / K-7 Interchange
Segment 1 Total
Segment 2 K-10 to 83rd Street 75th Street to the Kansas River Kansas River Bridge Kansas River Bridge to Kansas Avenue I-70 / K-7 Interchange 130th Street to US-24/40
Segment 2 Total
Segment 3 US-24/40 to Fairmont Marxen to Mary Street
Segment 3 Total
$ 88,600,000$ 41,000,000$110,000,000$111,850,000$ 57,750,000$150,000,000
$559,200,000
$ 48,250,000$110,500,000$ 11,400,000$ 40,750,000$109,150,000$ 6,000,000
$326,050,000
$ 91,250,000$ 39,750,000
$131,000,000
Total Project Cost of Construction $1,016,250,000
$ 53,680,000$ 26,880,000$ 0 $ 12,720,000$ 21,280,000$ 0
$114,560,000
$142,280,000$ 67,880,000$111,000,000$124,570,000$ 79,030,000$150,000,000
$673,760,000
$ 45,040,000$ 52,160,000$ 0$ 20,800,000$ 22,640,000$ 10,640,000
$151,280,000
$ 93,290,000$162,660,000$ 11,400,000$ 61,550,000$131,790,000$ 16,640,000
$477,330,000
Freeway(Mainline, Interchanges,
and Overpasses)
Street Network(Arterials and
Collectors)
Total
$ 46,250,000$ 16,000,000
$ 62,480,000
$328,320,000
$137,730,000$ 55,750,000
$193,000,000
$1,344,570,000
223rd Street to 183rd Street Mainline (4 lanes) Interchanges Overpasses Collectors Arterials
$ 5,500,000$15,000,000$ 5,000,000$ 2,400,000$ 4,000,000
Segment 1 Total $673,760,000
$28,600,000$50,000,000$10,000,000$29,280,000$24,400,000
$142,280,000
MileEachEachMileMile
5.252
12.26.1
175th Street to I-35 Mainline Interchanges Overpasses Collectors Arterials
$ 7,500,000$10,000,000$ 5,000,000$ 2,400,000$ 4,000,000
$21,000,000$10,000,000$10,000,000$12,480,000$14,400,000
$67,880,000
MileEachEachMileMile
2.812
5.23.6
I-35 to Spruce Street Mainline Urban Mainline Interchanges Overpasses Collectors Arterials
$ 7,500,000$36,000,000$10,000,000$ 5,000,000$ 2,400,000$ 4,000,000
$14,250,000$57,600,000$20,000,000$20,000,000$ 6,120,000$ 6,200,000
$124,570,000
MileMileEachEachMileMile
1.91.624
2.81.5
I-35 / K-7 Interchange I-35 Interchange
$110,000,000
$110,000,000
Each
1
127th Street to K-10 Mainline Interchanges Overpasses Collectors Arterials
$ 7,500,000$10,000,000$ 5,000,000$ 2,400,000$ 4,000,000
$27,750,000$30,000,000
$0$10,080,000$11,200,000
$79,030,000
$150,000,000
MileEachEachMileMile
3.730
4.22.8
Segment Quantity TotalUnit CostUnit
K-10 / K-7 Interchange* K-10 Interchange (from K-10 study)*Includes all improvements for the interchange: College Boulevard to Prairie Star Parkway on K-7and Clare Road to Lone Elm on K-10.

Cost Estimates
Construction Cost Estimate - Segment 2
Construction Cost Estimate - Segment 3K-10 to 83rd Street* Mainline Interchanges Overpasses Collectors Arterials*Does not include K-10 interchange
$ 7,500,000$10,000,000$ 5,000,000$ 2,400,000$ 4,000,000
Segment 2 Total $477,330,000
$23,250,000$20,000,000$ 5,000,000$17,040,000$28,000,000
$93,290,000
MileEachEachMileMile
3.121
7.17
75th Street to the Kansas River Mainline Interchanges Overpasses Collectors Arterials
$ 7,500,000$10,000,000$ 5,000,000$ 2,400,000$ 4,000,000
$40,500,000$50,000,000$20,000,000$33,360,000$18,800,000
$162,660,000
MileEachEachMileMile
5.454
13.94.7
Kansas River Bridge to Kansas Ave. Mainline Interchanges Overpasses Collectors Arterials
$ 7,500,000$10,000,000$ 5,000,000$ 2,400,000$ 4,000,000
$15,750,000$20,000,000$ 5,000,000$ 6,560,000$14,800,000
$69,510,000
MileEachEachMileMile
2.121
2.53.7
Kansas River Bridge
$11,400,000
I-70 / K-7 Interchange** Mainline Interchanges Overpasses Arterials**Includes Kansas Avenue interchange and 130th Street interchange
$7,500,000
$99,400,000$2,400,000$4,000,000
$ 9,750,000$99,400,000$20,640,000$20,000,000
$129,790,000
MileEachMileMile
1.31
8.60.5
Segment Quantity TotalUnit CostUnit
130th Street to US 24/40*** Mainline Interchanges Overpasses Collectors Arterials***Does not include US-24 interchange
$ 7,500,000$10,000,000$ 5,000,000$2,400,000$4,000,000
$ 6,000,000
$0$0
$ 8,640,000$ 2,000,000
$16,640,000
MileEachEachMileMile
0.800
3.60.5
US 24/40 to Fairmont Mainline Interchanges Overpasses Collectors Arterials
$ 7,500,000$10,000,000$ 5,000,000$ 2,400,000$ 4,000,000
Segment 3 Total $193,480,000
$41,250,000$50,000,000
$0$28,080,000$18,400,000
$137,730,000
MileEachEachMileMile
5.550
11.74.6
Marxen to Mary Street Mainline Interchanges Overpasses Collectors Arterials
$ 7,500,000$10,000,000$ 5,000,000$ 2,400,000$ 4,000,000
$24,750,000$10,000,000$ 5,000,000$13,200,000$ 2,800,000
$55,750,000
MileEachEachMileMile
3.311
5.50.7
Segment Quantity TotalUnit CostUnit
35

Memorandums of Understanding
Memorandums of Understanding (MOU’s) formalized the continued collaborative environment initiated by the study and created a moral framework to encourage implementation of the provisions of the K-7 Corridor Management Plan. While each MOU was customized to meet the individual needs of each community, every MOU included the same general information:
• Whereas Clauses – Defi ne the study limits and process• Corridor Purpose – purpose of the corridor plan• Corridor Parameters – minimum requirements (i.e. interchange spacing, level of service, etc.)• Establishment of Corridor Review Committee – Representatives of the communities and KDOT to review the progress of implementation of the plan and to evaluate any required changes to the plan• Roles and Responsibilities of KDOT and the Communities - • Roles and Responsibilities of KDOT • Roles and Responsibilities of the Communities• Miscellaneous Provisions – term, termination, etc.
Within the roles and responsibilities sections of the MOU are provisions identifying corridor preservation, access management tools, and improvements. These provisions essentially outline the “next steps” to implementing the K-7 Corridor Management Plan. Beyond incorporating the K-7 Corridor Management Plan into MARC’s Long Range Transportation Plan, several of these “next steps” are highlighted in the following sections.
Corridor Review Committee
The purpose of the Committee is to serve as an advisory body to regularly review, evaluate, facilitate discussions of and provide input on events and developments that may have an impact on the K-7 Corridor and the Corridor Management Plan, and to assist in the development of the K-7 Corridor implementation strategy. The Committee shall not have any authority regarding powers vested in cities and counties pursuant to state law. The Committee shall be composed of one representative from each participating county and city whose jurisdictional boundary includes land covered by the K-7 Footprint Map, a KDOT representative and a representative of the Mid-America Regional Council. The city and county representatives shall be appointed by the chief elected offi cial of that particular city or county for a term to be determined by that offi cial. A KDOT representative will serve as one Co-Chair of the Committee and the members of the Committee each year shall elect one other member to serve as the other Co-Chair. The Committee shall meet whenever the Co-Chairs jointly determine that a meeting is appropriate, but shall, at a minimum, meet twice a year.
Innovative Financing
KDOT currently has very little funding to implement the K-7 Corridor Plan. There is currently a Corridor Preservation Fund ($5-10 million annually Statewide, some portion of which could be utilized for K-7) which could be utilized to preserve strategic parcels of right-of-way. KDOT is also looking into options to establish a specifi c budget for K-7 which would provide small amounts of money for corridor preservation. KDOT also has Economic Development funds for qualifying projects to construct minor interim improvements. Beyond this, potential for signifi cant funding will have to wait until another highway bill is passed.
Federal dollars through the Mid America Regional Council (MARC) are also available for several of the needed interim improvements. Projects would need to qualify for the various federal funding sources and be included on MARC’s list of Transportation Improvement Projects (TIP). KDOT would look for ways to co-sponsor K-7 Corridor Management Plan improvements.
As private development occurs along K-7, developers could be required to dedicate reasonable amounts of right-of-way for K-7 and the local street network. In addition, they could be required to construct improvements needed as a result of their developments (i.e. reverse frontage roads, turn lanes, etc.)
Beyond this, funding will also need to come from the communities themselves. Given that most of the communities have tight CIP budgets with many other needs, the communities have expressed an interest in identifying a new funding source which could be used to help fi nance the K-7 Corridor Plan. After evaluating a number of options, several funding options show some potential:
a) Excise Tax: method of raising revenue by levying a tax on a certain activity, such as business done, income received, or privilege enjoyed.
Premise: Some activities (such as platting) create extra impacts (e.g., necessitating new or widened roads) and those activities should pay accordingly. Current use: registration on platted lots (e.g., $100 per lot paid at fi nal plat recordation).
Geographic Application: Community wide.
Who Pays: Developer at platting (home buyer at purchase).
Use of Funds: Anything in budget if money is placed in general fund, but good faith and/or adopting ordinance may require use for purpose adopted, e.g., transportation improvements.
Keeping of funds: Permitted in general fund, but may be held in special account
Challenges: Only works where developers are platting.
Used in Kansas: Yes, widely used.
Memorandums of Understanding and Next Steps
36

b) Transportation Development District: Form of special assessment district focused on transportation needs. The TDD has authority to raise funds either through special assessment or sales tax in district.
Premise: District should pay for improvements for which it creates the demand. This can be done through assessing property and/or imposing sales tax.
Geographic Application: District identifi ed at project creation.
Who Pays: Property owners or users.
Use of Funds: Extensive list provided in statute.
Keeping of Funds: Special account.
Challenge: Requires approval of all property owners within the district.
Used in Kansas: Yes, authorized by K.S.A. 12-17,141 et seq.
c.) Transportation Utility Fee: Fee collected on residences and businesses within a city’s corporate limits tied to the use and consumption of transportation services.
Premise: Local government is responsible for making roadways available to anybody who wants to use them, all potential users should pay for upkeep.
Similar to: Stormwater utility fees (also water and sewer fees).
Geographic Application: Typically community-wide, but may potentially be limited tocorridor or district
Who Pays: All users within designated area.
Use of Funds: Transportation improvements identifi ed by utility provider.
Keeping of Funds: Special account.
Challenge: No specifi c enabling authority or home rule adoptions
Use in Kansas: Not yet. Currently used in Washington and Colorado.
d.) Impact Fees: One time payments assessed against new development to cover the costs for necessary capital improvements proportionate to the demand generated by the new development.
Premise: Existing development has already paid for its infrastructure; new development should pay for its own infrastructure.
Geographic Application: Typically community-wide but has been limited to specifi c corridorsin Kansas.
Who Pays: Depends upon when fee is collected, which ranges from platting to certifi cateof occupancy.
Use of Funds: New capital facilities and services required by development: roads, sewer, stormwater; sometimes police, fi re, EMS, schools, public buildings.
Keeping of Fees: Special account.
Challenge: Amount of fee collected depends on rate of development and the law (community must document that): - New facilities/services are a consequence of new development; - There is a proportionate relationship between the fee and the infrastructure demand - The funds collected will be use to provide a substantial benefi t to the new development
Used in Kansas: Yes, but through home rule, no specifi c authority.
e.) Tax Increment Financing: Capture of future increment in property taxes (and sometimes sales taxes) and then reinvesting that increment in specifi ed projects.
For Example: Blighted building property tax is $100/year. Demo and construction of new building yields $10,000/year. $9,900 increment available for development.
Premise: If local government allows project funds to be reinvested in project to pay for infrastructure costs, more people will be encouraged to redevelop because they will havemore money to use.
Geographic Application: District identifi ed at project creation.
Who Pays: Developer, however, some argue that this technique redirects money that would otherwise go to the general fund so the public pays for these projects.
Use of Funds: Improvements within TIF district – sometimes across multiple districts
Memorandums of Understanding and Next Steps
37
Keeping of Funds: Special account, to be used for project only.
Challenge: Relies on demand for redevelopment, revenue can be unpredictable; also, propertymust be blighted.
Used in Kansas: Yes, specifi c authority.
In evaluating the previously described funding options, the one that shows the most potential is the transportation utility fee. It is essentially a user fee collected based on the number of trips individuals and businesses generate within the K-7 Corridor. It is similar to other utility fees already established in the region with payment and collection systems in place. It may be possible to establish a transportation utility fee to cover the entire corridor; however, consideration will need to be given to political concerns such as intergovernmental cooperation and the movement of funds across jurisdictional boundaries. This may result in the creation of multiple fee districts (e.g., one for each jurisdiction), or the establishment of regional fee sub-districts (such as north, central, and south) to avoid perceived funding inequalities. This is a good example of an initiative for the K-7 Review Committee to tackle.
Parcel Maps
While the plate drawings attached to this report show improvements and general right-of-way requirements, they do not show the detail needed to fully assess the impact to properties. Therefore, parcel maps indicating property lines and ownership information will help identify in more detail the right-of-way required for the corridor. Specifi cally, they will help to identify who is impacted by any potential right-of-way setback lines and by any of the proposed K-7 improvements.
Corridor Preservation/Access Management
With the general right-of-way needs identifi ed in the K-7 Corridor Plan coupled with the parcel maps, needed tracts of land will be identifi ed for right-of-way preservation. Planning tools highlighted in previous sections of this report should be utilized including overlay zones to assist in the preservation of needed land. As development occurs through the platting process, communities will need to collaborate with KDOT regarding the need for dedication and/or purchase of the required parcels of land, the construction of portions of the street network (i.e. turn lanes, reverse frontage roads, etc.), and in the modifi cations to local access to K-7. A number of the access management tools identifi ed in previous sections of this report should be used to eventually achieve the access parameters established for the corridor.
Permanent Improvements
a.) K-7: At some point in the future, preliminary design will need to be performed for the proposed K-7 improvements to further defi ne in more detail the required right-of-way footprint for the corridor. The plate drawings within this plan identify a conceptual right-of-way footprint based on standard interchange templates and conservative assumptions on customized interchange confi gurations. No vertical information has been analyzed nor any detailed horizontal alignments performed. More detailed traffi c analysis along with preliminary horizontal and vertical geometrics, cross sections, drainage, and environmental work will need to be performed to determine grading limits and more accurate right-of-way requirements. Examples of where this is especially important would be the new system-to-system interchanges at K-7 and I-70 and K-7 and I-35 as well as other interchanges which are non-standard diamonds. Another area needing further evaluation would be the section of K-7 in Olathe between 175th Street and 119th Street. This is where a realignment of K-7 and an upgrade to freeway will more than likely require an Environmental Assessment to determine exact location of the alignment before right-of-way can be further defi ned. Finally, as traffi c warrants and as funding becomes available, fi nal design will need to be performed on those sections of K-7 which move forward to construction.
b.) Local Streets: As development occurs and as traffi c demand increases, each community will need to make every effort that the identifi ed reverse frontage roads and cross street improvements get constructed in compliance with the K-7 Corridor Management Plan. This can be done through normal CIP improvements or can be accomplished through private development participation.
Interim Improvements
Given the current lack of funding to build the permanent improvements, interim improvements will be needed to accommodate the growing traffi c demands and to address safety issues that arise. Examples of interim improvements include adding traffi c signals and/or turn lanes at intersections which will eventually become interchanges or overpasses. These minor improvements could be funded from one or several of the following sources: (1) projects which qualify and are placed on MARC’s TIP, (2) projects which qualify for special KDOT funding (ie. Geometric improvement funds, economic development funds, etc.), (3) projects which are included on a communities CIP, and (4) projects funded by developers as a result of development impacts.
Memorandums of Understanding and Next Steps
38

New
Cent
ury
Air
Cent
er
John
son
Coun
tyEx
ecut
ive
Airp
ort
SANTAFETRAIL
SANTAFE
TRAIL
OREGO
NTRAIL
LEA
VEN
WO
RTH
CO.
WYA
ND
OTT
ECO
.
LEAVENWORTHCO.
WYANDOTTECO.
WYA
ND
OTT
ECO
.
JOH
NSO
NCO
.
EDW
ARD
SVIL
LE
BON
NER
SPRI
NG
S
MER
RIA
MM
ISSI
ON
OLA
THE
OLA
THE
Ola
the
Lake
Ceda
rLa
ke
Gar
dner
Lake
OV
ERLA
ND
PA
RK
B.N.S.F.RY.
Shaw
nee
Mis
sion
Lake
B.N. S
.F.RY.
B.N.S.F
.RY.
LAKE
QU
IVIR
A
Kansas
River
KAN
SAS
AVE
.
LORINGDR.
B.N.S
.F.RY.
SPRI
NG
HIL
LJO
HN
SON
CO.
MIA
MIC
O.
GAR
DN
ER
DES
OTO 11
9TH
ST.
83RD
ST.
95TH
ST.
111T
HST
.
127
THST
.
135
THST
.
143R
DST
.
151S
TST
.
167
THST
.
175
THST
.17
5TH
ST.
55TH
ST.
47TH
ST.
63RD
ST.
159T
HST
.
DEN
NIS
AVE
.
SAN
TAFE
LONEELMRD.
WOODLANDRD.
RIDGEVIEWRD.
MIZERD.
HO
LLIN
GSW
ORT
HRD
.
DO
NA
HO
ORD
.
LEA
VEN
WO
RTH
RD.
STAT
EAV
E.
PARA
LLEL
PKW
Y.
MET
ROPO
LITA
NM
ORS
EA
VE.
KUM
PA
VE.
S.138THST.
S.134THST.
S.110THST.EDWARDSVILLD ER.
NORTHGATERD.
MCI
NTY
RERD
.
N.131STST.
N.115THST.
95
THST
.
12
7TH
ST.
13
5TH
ST.
14
3RD
ST.
15
1ST
ST.
15
9TH
ST.
207
THST
.
199
THST
.
191
THST
.
183
RDST
.
215
THST
.
207
THST
.
191
THST
.
183
RDST
.
215
THST
.
175
THST
.
LONEELMRD.
WOODLANDRD.
RIDGEVIEWRD.
SWITZERRD.
QUIVIRARD.
ANTIOCHRD.
75
THST
.
71
STST
.
MONTICELLORD.
FAIR
MO
UN
TRD
.
223
RDST
.
LEAV
ENW
ORTH
LANS
ING
E.M
ARY
ST.
BASE
HOR
KAN
SAS
CITY
LENE
XA
SHAW
NEE
1
3
2
7
7
10
7
70
435
7
7 73
35
56 69
3232
40 69
24 40
32
69
24
5
169
56
73
435
435
635
70
35
169
69
169
69
LE
GE
ND
Ove
rpas
s
Inte
rch
ang
e
Are
ato
be
up
gra
de
dth
rou
gh
Ola
the
K-7
real
ign
me
nt
Se
gm
en
t 3
Se
gm
en
t 2
Se
gm
en
t 1
N
B-1
6
B-1
1
B-8
B-7
B-3
B-4
B-5
A-1A-2A-3A-4
A-5A-6A-7A-8
A-9
B-1
B-2
B-6
B-9
B-1
0
B-1
2
B-1
3
B-1
4
B-1
5
B-1
7B
-18
B-1
9
B-2
0
B-2
1B
-22
B-2
3
B-2
4
B-2
5
B-2
6
B-2
7
B-2
8
B-2
9
Inde
x Sh
eet f
orA
ppen
dix A
and
B
39
A-10
A-11A-12A-13A-14

K-7 Corridor Management Study
Appendix - A
40
K-7 Corridor Management Study
Appendix - B
55