k-12 school spending and performance review -...
TRANSCRIPT
State of Washington Joint Legislative Audit and Review Committee (JLARC)
K-12 School Spending and Performance Review
Report 05-19
November 30, 2005
Upon request, this document is available in alternative formats for persons with disabilities.
JOINT LEGISLATIVE AUDIT AND REVIEW COMMITTEE 506 16th Avenue SE PO Box 40910 Olympia, WA 98501-2323 (360) 786-5171 (360) 786-5180 Fax http://jlarc.leg.wa.gov
Committee Members SENATORS Brad Benson
Jeanne Kohl-Welles
Bob Oke
Linda Evans Parlette, Vice Chair
Debbie Regala
Phil Rockefeller, Asst. Secretary
Pat Thibaudeau
Joseph Zarelli
REPRESENTATIVES Gary Alexander, Secretary
Glenn Anderson
Kathy Haigh
Janéa Holmquist
Ross Hunter, Chair
Fred Jarrett
Kelli Linville
Deb Wallace
LEGISLATIVE AUDITOR Ruta Fanning
The Joint Legislative Audit and Review Committee (JLARC) carries out oversight, review, and evaluation of state-funded programs and activities on behalf of the Legislature and the citizens of Washington State. This joint, bipartisan committee consists of eight senators and eight representatives, equally divided between the two major political parties. Its statutory authority is established in RCW 44.28. JLARC staff, under the direction of the Committee and the Legislative Auditor, conduct performance audits, program evaluations, sunset reviews, and other policy and fiscal studies. These studies assess the efficiency and effectiveness of agency operations, impacts and outcomes of state programs, and levels of compliance with legislative direction and intent. The Committee makes recommendations to improve state government performance and to correct problems it identifies. The Committee also follows up on these recommendations to determine how they have been implemented. JLARC has, in recent years, received national recognition for a number of its major studies.
K-12 SCHOOL SPENDING AND
PERFORMANCE REVIEW
REPORT 05-19
REPORT DIGEST
NOVEMBER 30, 2005
STATE OF WASHINGTON
JOINT LEGISLATIVE AUDIT AND REVIEW COMMITTEE
STUDY TEAM STEPHANIE HOFFMAN
LISA JEREMIAH
LEGISLATIVE AUDITOR RUTA FANNING
Copies of Final reports and Digests are
available on the JLARC website at:
http://jlarc.leg.wa.gov
or contact
Joint Legislative Audit & Review Committee
506 16th Avenue SE Olympia, WA 98501-2323
(360) 786-5171 (360) 786-5180 FAX
Study Background As part of its 2003-05 Work Plan, JLARC initiated this study of spending and performance assessment of individual schools within the state’s K-12 public education system. In the state’s 2005-07 budget, K-12 public schools receive $10.9 billion, or 42 percent of the State General Fund.
Legislators wanted to know how school districts distribute resources to individual schools and what information on school spending and performance is available. This study describes:
• District budgeting and decision-making practices;
• District and school spending patterns;
• The types of assessments schools use to understand student performance;
• Data that the state collects on districts and schools; and
• Alternative approaches in other states and school districts to reporting and budgeting school spending.
To conduct this review, we surveyed all 296 school districts within the state and interviewed six case study districts. We hired consultants to review budgeting and reporting practices in other states.
District Budgeting and Decision-Making PracticesBased on our review of district budgeting, accounting, and decision-making practices, we have the following findings:
• Districts allocate money to schools in various ways, but most districts consider student enrollment as one factor when allocating resources.
• Districts use different methods of tracking school expenditures within their own accounting systems. This makes it difficult to compare school spending across districts.
• In general, school principals have limited authority to make decisions about their school budgets.
• Districts and schools are using performance data in budgeting and program decision-making.

Data Availability and Reporting Requirements We reviewed data that is collected by the state on district and school budgeting and spending. We found:
• The state does not collect spending data from individual schools, though schools, along with districts, are accountable for the performance of their students. The state does collect district-level spending data.
• The state already requires numerous reports from districts. Policymakers should be cautious about adding reporting requirements without first considering streamlining or discontinuing other requirements.
Alternative Approaches to Reporting and Budgeting School Expenditures JLARC hired consultants to look at how other states and districts outside of Washington report school-level spending data and make budgeting decisions.
• States and districts around the country are considering other ways of reporting and budgeting school-level spending to address various goals, such as increasing accountability and transparency of decision-making, and linking performance and spending.
• Generally, individual districts initiate budgeting changes, but reporting changes have been made by both districts and states. Some states are requiring districts to report more information on school spending.
• Gaining additional information about school-level spending is possible in Washington, but higher levels of detail or uniformity in reporting will come at greater costs. Currently, changes in budgeting are possible at the district level, but staffing ratio requirements, categorical spending restrictions, and collective bargaining agreements limit the amount of discretion schools have over spending their resources.
Conclusion Before beginning any effort at changing district reporting requirements or budgeting practices, the Legislature should consider:
• What the state’s role should be in school-level finance given that state law dictates that the state allocation formula “…shall be for state allocation and equalization purposes only and shall not be construed as mandating specific operational functions of local school districts….”;1
• How policymakers would use additional financial data to answer questions about school performance; and
• Whether the usefulness of school-level spending data would justify the costs of collecting and analyzing it.
1 RCW 28A.150.260.
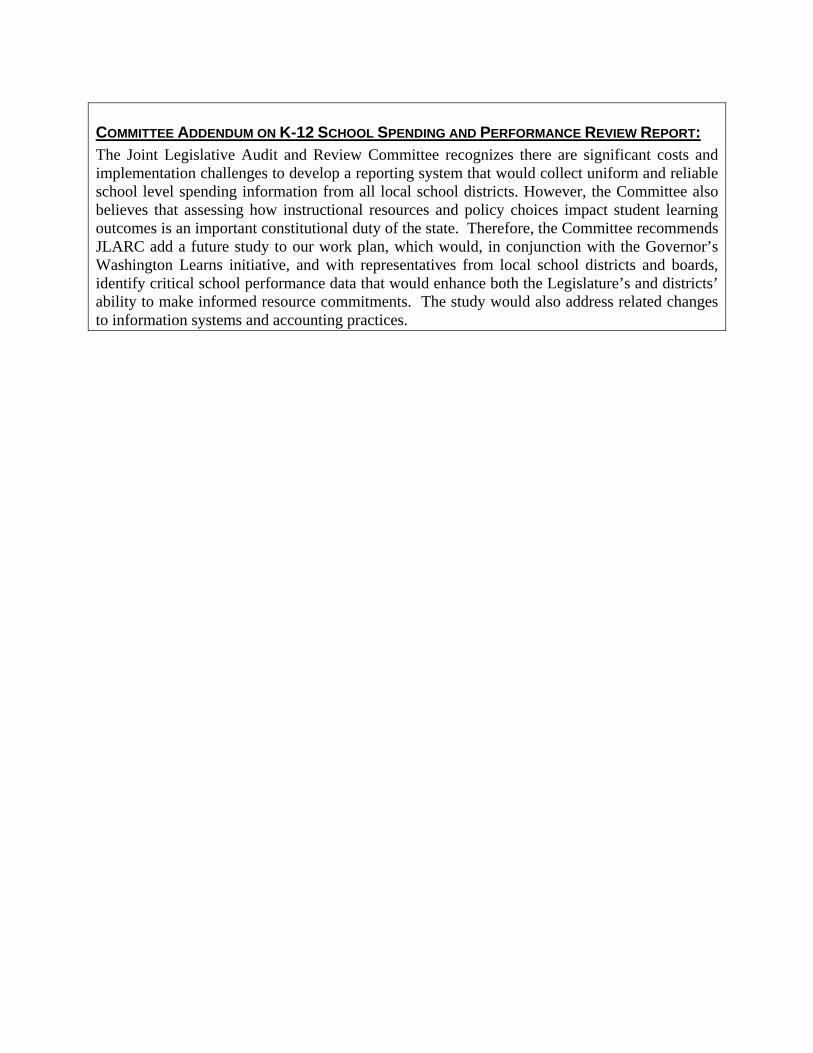
COMMITTEE ADDENDUM ON K-12 SCHOOL SPENDING AND PERFORMANCE REVIEW REPORT: The Joint Legislative Audit and Review Committee recognizes there are significant costs and implementation challenges to develop a reporting system that would collect uniform and reliable school level spending information from all local school districts. However, the Committee also believes that assessing how instructional resources and policy choices impact student learning outcomes is an important constitutional duty of the state. Therefore, the Committee recommends JLARC add a future study to our work plan, which would, in conjunction with the Governor’s Washington Learns initiative, and with representatives from local school districts and boards, identify critical school performance data that would enhance both the Legislature’s and districts’ ability to make informed resource commitments. The study would also address related changes to information systems and accounting practices.

TABLE OF CONTENTS
CHAPTER ONE: INTRODUCTION................................................................................. 1 STUDY OVERVIEW.......................................................................................................... 1 K-12 BUDGET AND ENROLLMENT..................................................................................... 1 EDUCATION REFORM...................................................................................................... 2 PAST AND CURRENT K-12 STUDIES................................................................................. 2 CURRENT JLARC STUDY ............................................................................................... 2
CHAPTER TWO: BASICS OF K-12 FUNDING.............................................................. 5 CHAPTER OVERVIEW...................................................................................................... 5 SCHOOL DISTRICT FUND SOURCES ................................................................................. 5 SCHOOL DISTRICT SPENDING.......................................................................................... 7
CHAPTER THREE: RESOURCE ALLOCATIONS, EXPENDITURES, AND DECISION-MAKING AUTHORITY.................................................................................................... 9
CHAPTER OVERVIEW...................................................................................................... 9 BACKGROUND................................................................................................................ 9 DISTRICT SPENDING..................................................................................................... 10 SCHOOL SPENDING ...................................................................................................... 11 DECISION-MAKING AUTHORITY...................................................................................... 14 IN SUMMARY................................................................................................................ 18
CHAPTER FOUR: PERFORMANCE ASSESSMENT.................................................. 19 CHAPTER OVERVIEW.................................................................................................... 19 ACCOUNTABILITY IN EDUCATION .................................................................................... 19 PERFORMANCE ASSESSMENTS...................................................................................... 19 USING ASSESSMENT DATA............................................................................................ 21 SHARING PERFORMANCE ASSESSMENT AND IMPROVEMENT STRATEGIES......................... 22 LIMITS TO UNDERSTANDING PERFORMANCE THROUGH BUDGETS .................................... 23 IN SUMMARY................................................................................................................ 23
CHAPTER FIVE: REPORTING REQUIREMENTS AND DATA AVAILABILITY.......... 25 CHAPTER OVERVIEW.................................................................................................... 25 CURRENT REPORTING REQUIREMENTS.......................................................................... 25 IN SUMMARY................................................................................................................ 28
CHAPTER SIX: ALTERNATIVE APPROACHES TO REPORTING AND BUDGETING SCHOOL EXPENDITURES .......................................................................................... 29
CHAPTER OVERVIEW.................................................................................................... 29 WHY CHANGE SCHOOL REPORTING AND BUDGETING PRACTICES? .................................. 29 NINE OPTIONS FOR CHANGE......................................................................................... 30 IN SUMMARY................................................................................................................ 36
CHAPTER SEVEN: CONCLUSION.............................................................................. 37 STUDY FINDINGS.......................................................................................................... 37 CONCLUSION ............................................................................................................... 38

AGENCY RESPONSES ................................................................................................... 38 ACKNOWLEDGEMENTS.................................................................................................. 39
APPENDIX 1: SCOPE AND OBJECTIVES.................................................................. 41
APPENDIX 2: AGENCY RESPONSES ........................................................................ 43
APPENDIX 3: SCHOOL DISTRICT SURVEY .............................................................. 49
APPENDIX 4: LIST OF REPORTS DISTRICTS ARE REQUIRED TO SUBMIT TO OSPI.............................................................................................................................. 59
APPENDIX 5: ADDITIONAL RESEARCH ON ALTERNATIVE APPROACHES TO REPORTING AND BUDGETING SCHOOL EXPENDITURES..................................... 69
CHAPTER ONE: INTRODUCTION STUDY OVERVIEW As part of its 2003-05 Work Plan, JLARC initiated this study of school spending and performance assessment within the state’s K-12 system. Legislators wanted to know how school districts distribute resources to individual schools and how much discretion school principals have over allocating resources within their schools. This study comes at a time when schools are increasingly held responsible for the achievement of their students. Yet, the state only requires school districts, and not individual schools, to report spending data.
This study examines district and school decision-making practices in order to understand how districts and schools manage resources to improve student achievement. It also reviews the types of assessments schools use to understand student performance. Finally, it identifies other states’ and school districts’ approaches to reporting and budgeting school spending.
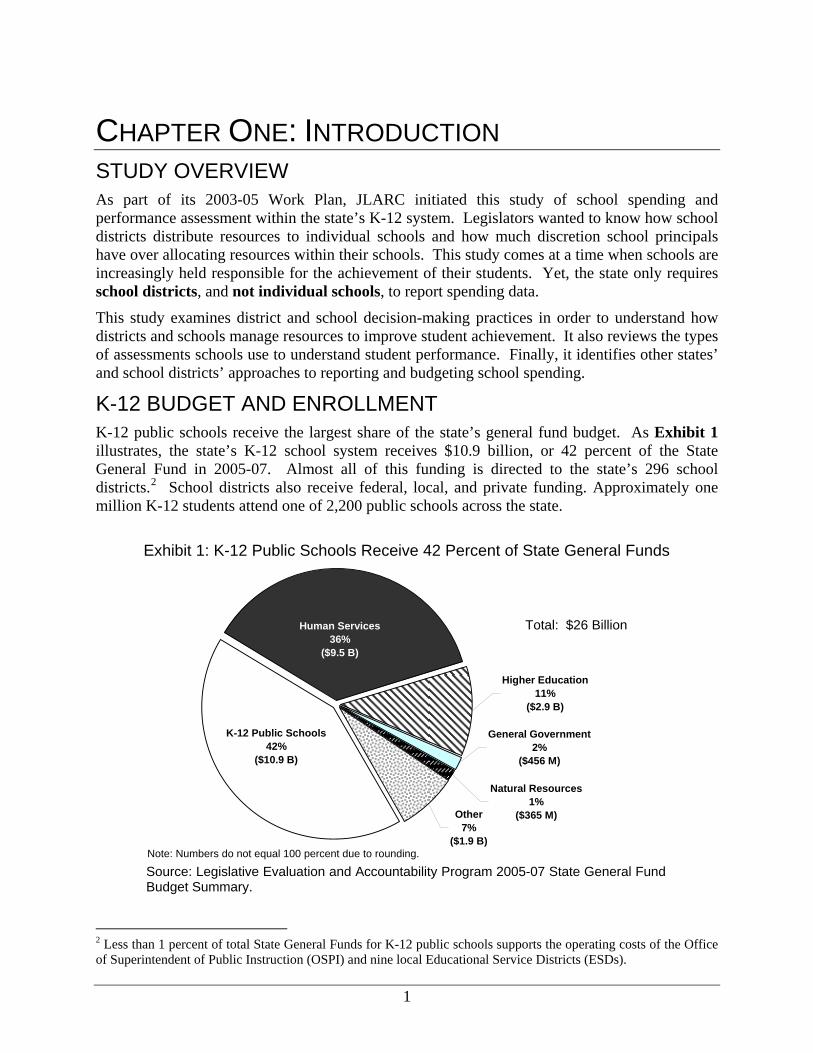
K-12 BUDGET AND ENROLLMENT K-12 public schools receive the largest share of the state’s general fund budget. As Exhibit 1 illustrates, the state’s K-12 school system receives $10.9 billion, or 42 percent of the State General Fund in 2005-07. Almost all of this funding is directed to the state’s 296 school districts.2 School districts also receive federal, local, and private funding. Approximately one million K-12 students attend one of 2,200 public schools across the state.
Human Services36%
($9.5 B)
K-12 Public Schools42%
($10.9 B)
Higher Education11%
($2.9 B)
General Government2%
($456 M)
Natural Resources1%
($365 M)Other7%
($1.9 B)
Source: Legislative Evaluation and Accountability Program 2005-07 State General Fund Budget Summary.
Total: $26 Billion
Exhibit 1: K-12 Public Schools Receive 42 Percent of State General Funds
Note: Numbers do not equal 100 percent due to rounding.
2 Less than 1 percent of total State General Funds for K-12 public schools supports the operating costs of the Office of Superintendent of Public Instruction (OSPI) and nine local Educational Service Districts (ESDs).
1
K-12 School Spending and Performance Review
EDUCATION REFORM State and national education reform efforts have shaped the focus and expectations of Washington’s schools for more than a decade. Washington’s education reform holds schools responsible for meeting essential academic learning requirements for reading, writing, math, and other skills.3 Students in elementary, middle, and high schools take the Washington Assessment of Student Learning (WASL) to demonstrate whether they have mastered the essential academic learning requirements. Beginning in 2008, all high school seniors must meet the proficient standard on the reading, writing, and mathematics assessments to receive a Certificate of Academic Achievement—a requirement for high school graduation.4
Schools in Washington also are subject to new requirements under the federal No Child Left Behind Act of 2001 (NCLB). NCLB mandates minimum achievement standards for every school, expands assessment requirements, and sets a mandatory national deadline of 2014 for schools to have nearly 100 percent of their students meeting a “proficient” achievement level as defined by each state. In Washington, the WASL is used to evaluate student proficiency levels.
PAST AND CURRENT K-12 STUDIES This study of school spending and performance assessment is one of many studies completed or currently being conducted on K-12 issues. Since 1995, JLARC has completed 15 K-12 reports on topics ranging from special education and the Learning Assistance Program to supplemental contracts and school bus bidding and purchasing.
In 1999, JLARC completed a “K-12 Finance and Student Performance Study.”5 This study found that: (1) revenue allocation is equitable around the state, (2) districts spend money in similar ways, and (3) the state does not collect data on spending from individual schools. At the time, JLARC did not recommend that the state collect school-level expenditure data. Instead, JLARC concluded that the Legislature could use data on staffing to approximate school spending because personnel costs represent about 90 percent of total district spending.
Beyond JLARC’s work, many public and private organizations continue to examine different aspects of K-12 funding and student achievement. In 2005, the Legislature passed E2SSB 5441, requiring a comprehensive study on early learning, K-12, and higher education finance and policy. This effort, now known as “Washington Learns,” will look broadly at the state’s education system and how it uses funds to provide all students with the opportunity to achieve state standards. It is scheduled to be completed in November 2006.
CURRENT JLARC STUDY In light of other K-12 study efforts underway, it is important to clarify the scope of this study and how it relates to other work taking place. This is a descriptive analysis of school district and school-level spending, decision-making and performance assessment practices. This study does
3 Chapter 336, Laws of 1993 (ESHB 1209). 4 Students who do not meet proficient standards in one or more content areas can retake the WASL up to four times. Exceptions to the assessment requirements include students who have an Individual Education Plan requiring an alternative assessment and students who qualify to demonstrate that they meet the same reading, writing, and/or mathematics proficiency standards in an alternative format. 5 JLARC Report 99-9.
2
K-12 School Spending and Performance Review
not evaluate the statewide finance structure. Rather, it describes how resources are allocated once they reach the state’s school districts. This study addresses the following questions:
1. What processes do districts use to distribute funds to schools?
2. What information does the state have on school spending?
3. Who has authority over school spending decisions?
4. What performance assessments do districts and schools use to understand student achievement and make programmatic and budgeting decisions?
5. What are the national trends in school-based or student-based budgeting and reporting and how might these be applied in Washington?
General conclusions from this report can inform the broader discussions taking place on Washington’s education finance and performance systems.
Study Methodology To answer these questions, JLARC surveyed all 296 school districts within the state about their resource allocation methodologies and assessment practices. About 72 percent, or 214 districts, responded to the survey. Collectively, these districts represent 84 percent of all student FTEs enrolled in Washington public schools. Survey responses are summarized in Appendix 3.
We also selected six case study districts to learn about their budgeting processes and expenditures in greater detail. The size of these districts ranged from just under 1,000 to over 20,000 students. Case study districts are located in eastern and western Washington and educate students with a variety of socio-economic and racial backgrounds. We visited each of the six districts to talk to their administrators and school principals. We also reviewed budget and expenditure data for each district. These districts are anonymous in this report because our intent is to describe the range of practices, rather than to evaluate individual districts’ practices.
Additionally, JLARC hired consultants to review other states’ and school districts’ reporting and budgeting practices.
Report Organization Chapter 2 provides a summary of K-12 funding in Washington by describing major fund sources and spending categories. Chapter 3 describes the following:
• The processes that districts use to allocate money to schools; • What we do – and do not – know about school spending; and • Three levels of expenditure decision-making authority.
Chapter 4 describes the state’s performance assessment system and how schools use performance data to make program and budgeting decisions. Chapter 5 summarizes the type of district and school data the state collects. Chapter 6 provides information on alternative ways that districts and other states report and budget expenditures. Chapter 7 presents the report’s conclusions.
3

K-12 School Spending and Performance Review
4

CHAPTER TWO: BASICS OF K-12 FUNDING CHAPTER OVERVIEW This chapter provides a brief overview of where funding for school districts comes from and how districts spend it. In Washington, most school district funding comes from the state. The rest comes from local taxes, the federal government, and other local and private sources. Districts around the state spend their money in similar ways.
SCHOOL DISTRICT FUND SOURCES In Washington, K-12 funding comes primarily from the state general fund. Additional funding comes from local taxes, the federal government, and other sources.
State Funding As shown in Exhibit 2, approximately 70 percent of school district funds come from the state.
State70%
($5.2 B)
Federal10%
($732 M)
Other4%
($321 M)
Local Taxes 16%
($1.2 B)
Exhibit 2: School District Fund Sources, School Year 2003-04
Source: JLARC analysis of OSPI’s State Summary School District Financial Reports 2003-04, available at www.k12.wa.us/safs/PUB/FIN/0304/FinSum2.pdf.
Total: $7.47 Billion
State 70%
($5.2 B)
5
K-12 School Spending and Performance Review
Of this state funding, 88 percent goes to what the Legislature has defined as basic education, which includes the following:
• General apportionment is the main source of basic education funding. The apportionment funding formula is based on the average annual enrollment of students in the district.
• Special education allocation is for costs of serving students with disabilities that exceed the general apportionment allotment. Funding is based on the number of special education students in a district.
• Pupil transportation funding is based on the number of students transported and the distance these students must travel to school.
• Learning Assistance Program provides funding for districts to assist underachieving students. As a result of changes passed by the Legislature in 2005, beginning in the 2005-06 school year, district funding is based on the number of students eligible for lunch at a free or reduced price.6
• Bilingual education funding is for students who speak little or no English. Funding is based on the number of students enrolled in the bilingual program.
• Education provided in juvenile detention centers and state institutions is the final segment of basic education funding. Funding is based on the number of students served.
The remaining 12 percent of state funding is for expenses such as school food services, levy equalization funding to help districts with above-average tax rates due to low property values, and the Student Achievement Fund which was created by Initiative 728 in 2000 to reduce class sizes and pay for other learning improvement opportunities.
Local Taxes Local property tax funding makes up 16 percent of school district revenue. Districts use levy revenues to fund local priorities. The Levy Lid Act of 1977 prohibits districts from using local levies to collect more than 24 percent of the total amount of most state and federal revenues to the district. Currently, the 24 percent lid applies to 205 of the 296 districts. The other 91 school districts have levy lids up to 33.9 percent because they had higher local levies when the Levy Lid Act was passed. Not all districts have passed levies and some districts tax below the levy lid.
Federal Funding Federal funding provides ten percent of school district revenue. This funding is provided by Congress to local education agencies for several federal programs. The three largest, which together make up approximately 60 percent of all federal funds, are:
• Special education, through the Individuals with Disabilities Education Act;
• Programs for improving academic achievement in high-poverty schools; and
• School food services.
6 ESHB 2314.
6
K-12 School Spending and Performance Review
Other Fund Sources Additionally, districts receive about four percent of their revenue from other sources, such as fees for extra-curricular programs, school lunch charges, revenue from other school districts, rental income, and private donations.
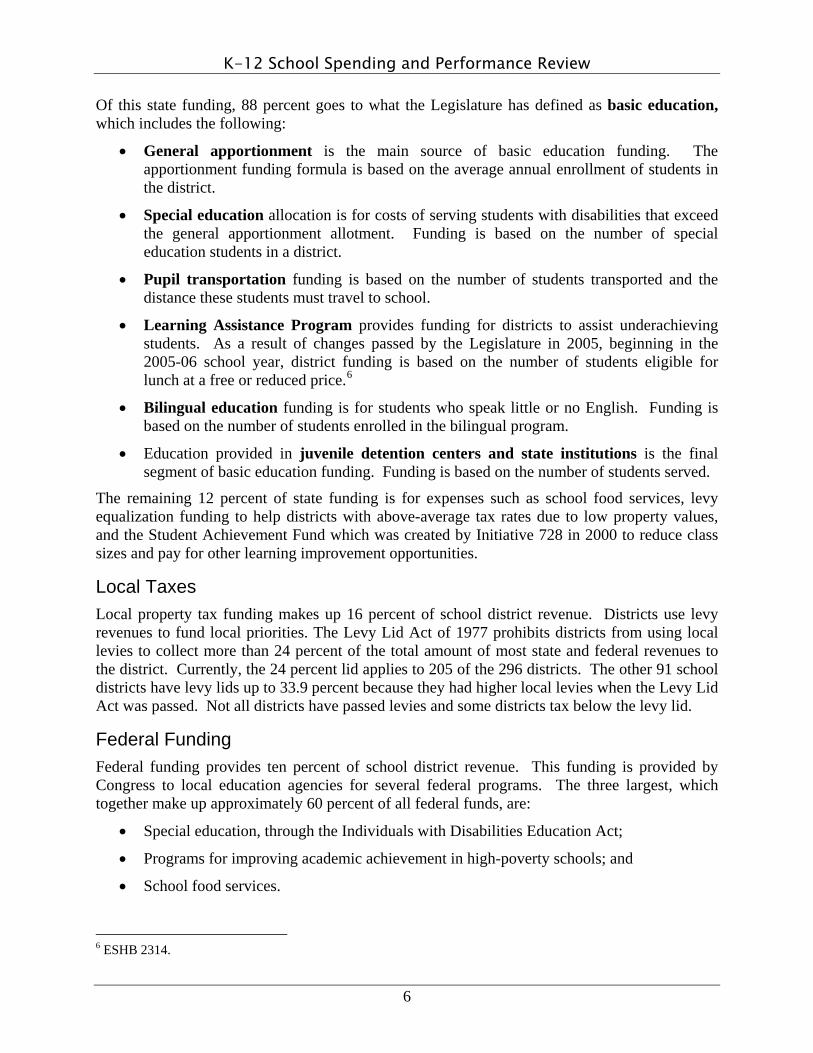
SCHOOL DISTRICT SPENDING
Teaching 60%
($4.4 B)
Other 11%
($843 M)
Teaching Support
10%($757 M)
Food Services 3%
($256 M)Transportation
4%($292 M)
Central Administration
6%($434 M)
SchoolAdministration
6%($451 M)
Exhibit 3: School District Expenditures by Activity, School Year 2003-04
Source: JLARC analysis of OSPI’s State Summary School District Financial Reports 03-04, available at www.k12.wa.us/safs/PUB/FIN/0304/FinSum2.pdf.
Total: $7.42 Billion7
Districts spend their resources in the following manner:
• Sixty percent of school district spending is for teaching. This includes salaries and benefits for teachers, curriculum, professional development, and payments to other school districts for educational services.7
• Other services, such as maintenance, utilities, insurance, and information systems make up 11 percent of spending.8
• Another 10 percent of expenditures is for teaching support activities, such as counseling, libraries, audio-visual equipment, extra-curricular activities, and other activities that support student education.9
• Central administration, such as the superintendent, business office, human resources, and the school board comprises six percent of expenditures.10
7 Activities 27, 29 as defined by Accounting Manual for Public School Districts. 8 Activities 61, 62, 63, 64, 65, 67, 68, 72, 73, 74, 75, 83, 84, 85, 91. 9 Activities 22, 24, 25, 26, 28.
7

K-12 School Spending and Performance Review
• School administration, including principals, makes up another 6 percent of expenditures.11
• Transportation makes up 4 percent of expenditures. This includes operational and maintenance costs of busing students to and from school and related program supervision.12
• Food service is an additional 3 percent of expenditures, including food purchases and the operational and supervisory costs for the provision of school meals.13
10 Activities 11, 12, 13, 14, 21 as defined by Accounting Manual for Public School Districts. 11 Activity 23. 12 Activities 51, 52, 53, 56, 59. 13 Activities 41, 42, 43, 44, 49.
8

CHAPTER THREE: RESOURCE ALLOCATIONS, EXPENDITURES, AND DECISION-MAKING AUTHORITY CHAPTER OVERVIEW This chapter provides general information on how resources are allocated and spent by districts and schools. It examines the various methods districts use for allocating resources to schools and identifies commonalities and differences. It also describes district and school spending patterns and identifies limitations of school-level spending information accounted for by districts. Finally, the chapter discusses three levels of spending authority: 1) district-managed expenses, 2) school-managed expenses, and 3) jointly-managed expenses.
BACKGROUND The Office of the Superintendent of Public Instruction (OSPI) collects information about how federal, state, and local funds are generated and distributed to its 296 school districts. The state has little information, however, about how districts distribute funds to cover district-wide and school-level expenses. Since much of the accountability for performance is now focused on schools, policymakers are interested in the answers to these questions:
• How do districts allocate funds to schools? • How do districts and schools spend the money? • Who is primarily responsible for making decisions about district and school spending?
DISTRICT METHODS FOR ALLOCATING RESOURCES Washington’s school districts have independent control over how they manage and allocate their resources. RCW 28A.150.260 states that the state allocation formula “shall be for state allocation and equalization purposes only and shall not be construed as mandating specific operational functions of local school districts….” While subject to certain guidelines tied to public revenue sources, school districts retain overall responsibility for determining how to allocate resources to schools.
The next section highlights similarities and differences in the way districts allocate funds. This information is based on general findings from JLARC’s survey and interviews with six case study districts. Although our intent is to describe the range in practices among districts, the findings on district allocation methods may not reflect the practices in very small districts that only distribute resources to one or a few schools.
Districts Consider Similar Factors When Allocating Resources to Schools Even though there is a high degree of independent control, districts use some common factors when making allocation decisions.
• About 85 percent of the 214 districts responding to our survey said that they allocate resources to schools based on the size of student enrollment.
9

K-12 School Spending and Performance Review
• Over half of the responding districts also said they consider grade levels (elementary, middle, or high school) and student characteristics (such as number of students receiving free and reduced price meals) when deciding how to allocate resources.
• A third of responding districts consider the number of teachers at each of their schools as a factor when deciding how to distribute funds for non-employee related expenses.
• Districts also reported that the needs and expectations of district stakeholders, a school’s unique facilities or programs, and student performance assessment indicators (such as WASL scores, classroom assessment data, and Adequate Yearly Progress status) influence how they distribute resources to schools. 14
Districts Use Different Processes for Distributing Resources In interviews with our six case study districts, we learned that the actual processes for distributing public funds to schools vary greatly across the state. Some districts allocate staff and additional resources based on a fixed number of staff and dollars per student FTE. For example, a district might allocate one teacher for every 25 students or $100 per elementary student for non-employee related costs.
Some districts make flat staffing and supplemental allocations (e.g., one principal, secretary, and counselor for every school or fixed allocations for field trips, extracurricular activities, furniture, and printing expenses). Still others use a combination of these approaches. A few districts make lump sum allocations to schools, allowing principals and their school management teams to allocate resources for staffing, curriculum, professional development, supplies, and other school expenses.
Private revenues are also distributed in varying ways. Some districts have private foundations that provide supplemental funding for all the schools in the district (for example, $250 for every teacher). Private organizations also may award grants and donations directly to schools, which must manage those funds according to the donor’s conditions or requirements.
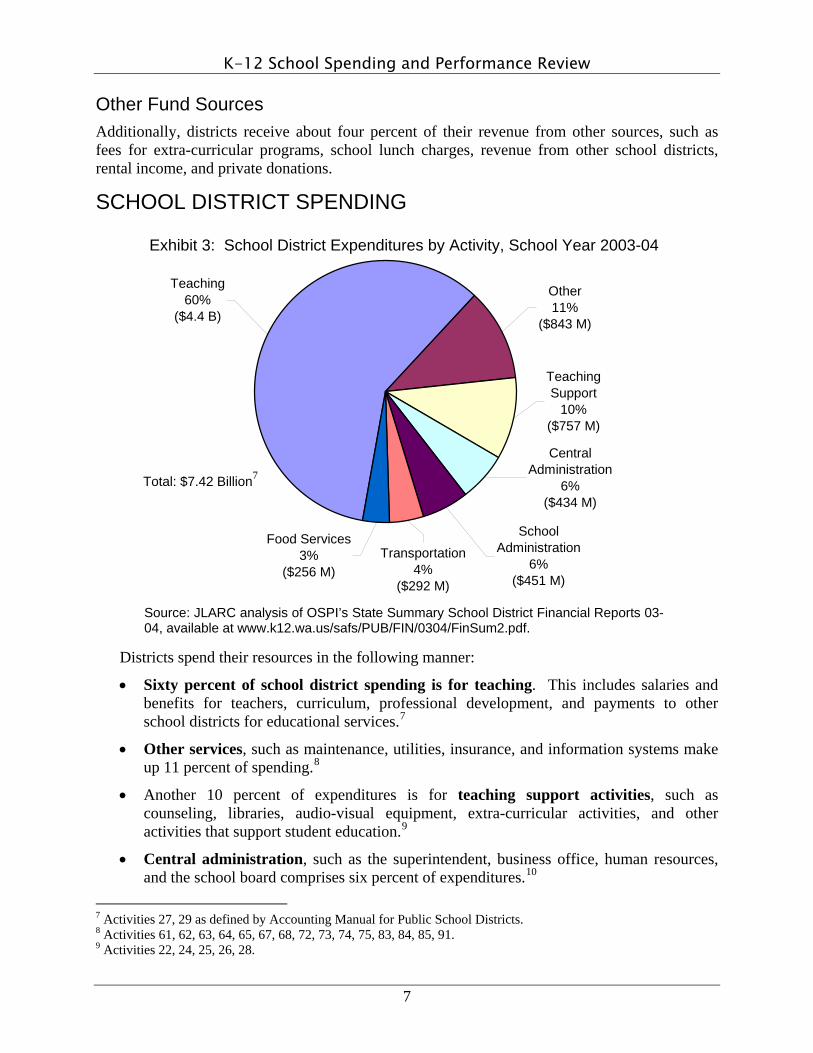
DISTRICT SPENDING Despite the differences across districts in how resources are allocated to schools, JLARC’s 1999 K-12 Finance and Student Performance Study found that districts and schools across the state spend their money in similar ways. Although the amount districts spend on various state-defined activities is different, the proportion of money spent on each of those activities is similar. For example, districts tend to spend about 60 percent of their budgets on teaching (which includes expenditures for teacher salaries and benefits, curriculum, and professional development).
For this study, JLARC looked at spending in six case study districts and again found that districts have the same patterns of expenditures as the 1999 report identified. These patterns are also the same as those exhibited statewide (see Chapter 2). Exhibit 4 illustrates the spending patterns of our case study districts.
14 Adequate Yearly Progress (AYP) is a key element of the federal No Child Left Behind Act. In Washington, AYP measures how much student performance in a school has improved annually on the WASL in reading and math.
10
K-12 School Spending and Performance Review
0%
10%
20%
30%
40%
50%
60%
70%
80%
CentralAdministration
SchoolAdministration
Teaching Support Teaching Food Transportation Buildings,Grounds,
Technology, Other
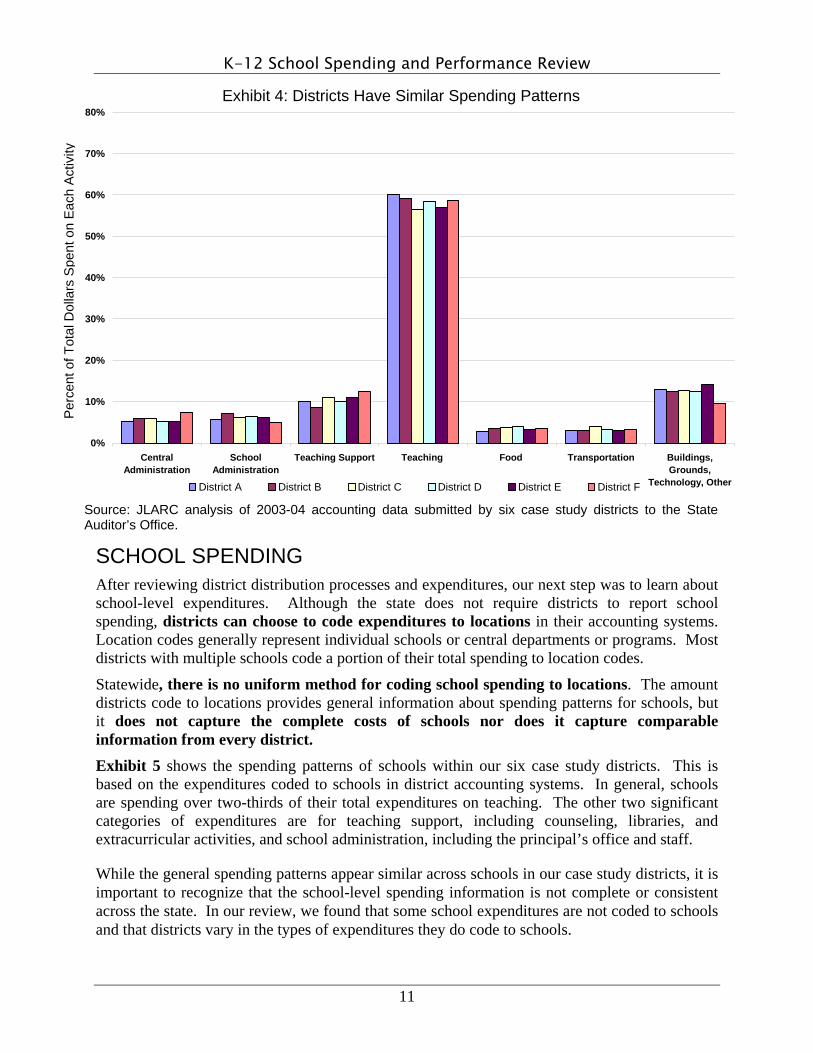
SCHOOL SPENDING After reviewing district distribution processes and expenditures, our next step was to learn about school-level expenditures. Although the state does not require districts to report school spending, districts can choose to code expenditures to locations in their accounting systems. Location codes generally represent individual schools or central departments or programs. Most districts with multiple schools code a portion of their total spending to location codes.
Statewide, there is no uniform method for coding school spending to locations. The amount districts code to locations provides general information about spending patterns for schools, but it does not capture the complete costs of schools nor does it capture comparable information from every district. Exhibit 5 shows the spending patterns of schools within our six case study districts. This is based on the expenditures coded to schools in district accounting systems. In general, schools are spending over two-thirds of their total expenditures on teaching. The other two significant categories of expenditures are for teaching support, including counseling, libraries, and extracurricular activities, and school administration, including the principal’s office and staff.
While the general spending patterns appear similar across schools in our case study districts, it is important to recognize that the school-level spending information is not complete or consistent across the state. In our review, we found that some school expenditures are not coded to schools and that districts vary in the types of expenditures they do code to schools.
District A District B District C District D District E District F
Exhibit 4: Districts Have Similar Spending Patterns
Source: JLARC analysis of 2003-04 accounting data submitted by six case study districts to the State Auditor’s Office.
Per
cent
of T
otal
Dol
lars
S
pent
on
Eac
h A
ctiv
ity
11
K-12 School Spending and Performance Review
0%
10%
20%
30%
40%
50%
60%
70%
80%
CentralAdministration
SchoolAdministration
Teaching Support Teaching Food Transportation Buildings,Grounds,
Technology, Other
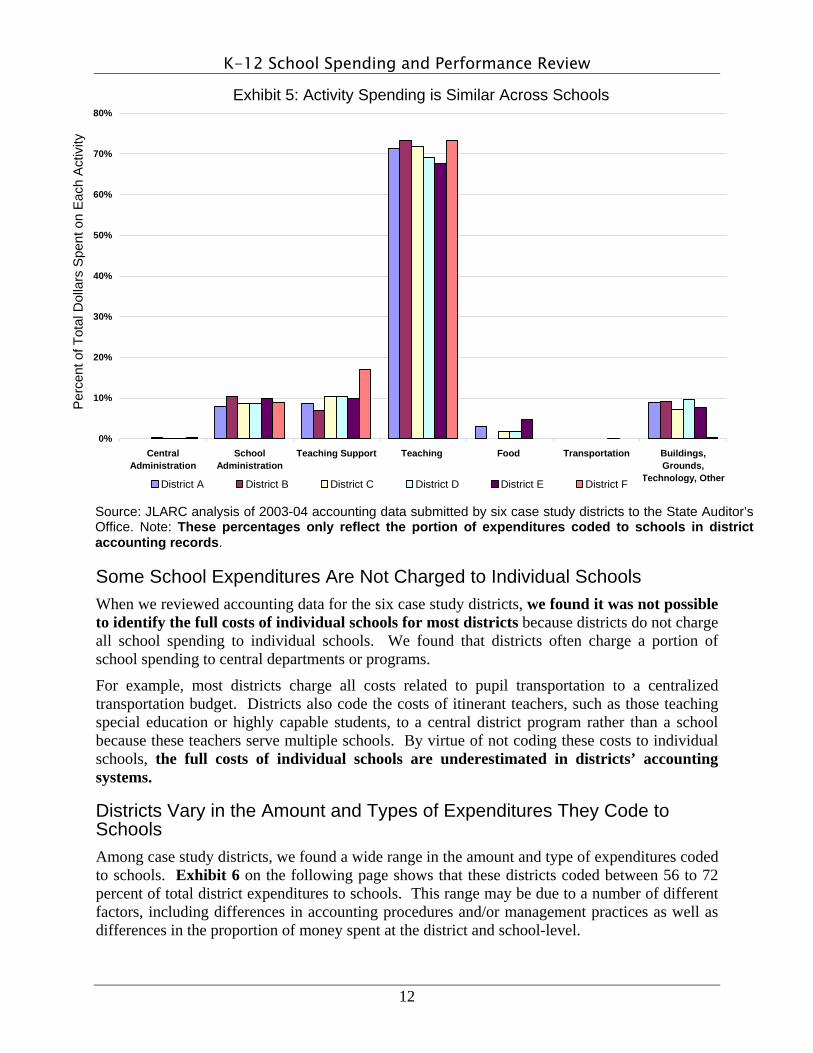
Some School Expenditures Are Not Charged to Individual Schools When we reviewed accounting data for the six case study districts, we found it was not possible to identify the full costs of individual schools for most districts because districts do not charge all school spending to individual schools. We found that districts often charge a portion of school spending to central departments or programs.
For example, most districts charge all costs related to pupil transportation to a centralized transportation budget. Districts also code the costs of itinerant teachers, such as those teaching special education or highly capable students, to a central district program rather than a school because these teachers serve multiple schools. By virtue of not coding these costs to individual schools, the full costs of individual schools are underestimated in districts’ accounting systems.
Districts Vary in the Amount and Types of Expenditures They Code to Schools Among case study districts, we found a wide range in the amount and type of expenditures coded to schools. Exhibit 6 on the following page shows that these districts coded between 56 to 72 percent of total district expenditures to schools. This range may be due to a number of different factors, including differences in accounting procedures and/or management practices as well as differences in the proportion of money spent at the district and school-level.
District A District B District C District D District E District F
Exhibit 5: Activity Spending is Similar Across Schools
Source: JLARC analysis of 2003-04 accounting data submitted by six case study districts to the State Auditor’s Office. Note: These percentages only reflect the portion of expenditures coded to schools in district accounting records.
Per
cent
of T
otal
Dol
lars
S
pent
on
Eac
h A
ctiv
ity
12

K-12 School Spending and Performance Review
Coded To Schools
56%
60%
72%
71%
67%
71%
44%
40%
28%
29%
33%
29%
0% 10% 20% 30% 40% 50% 60% 70% 80% 90% 100%
District F
District E
District D
District C
District B
District A
Not Coded to Schools
Exhibit 6: Districts Code Different Proportions of Their Budgets to Schools
Source: JLARC analysis of 2003-04 accounting data submitted by six case study districts to the State Auditor’s Office.
Districts also vary in the types of expenses coded to schools. As Exhibit 7 on the following page illustrates, some activities are more often coded to schools than others. For example, costs of school administration (e.g., principal’s office) are almost entirely coded to schools while transportation and central administration costs (e.g., superintendent, business and human resources offices) are generally not coded to schools.
Some activities, such as teaching, include costs coded to both schools and to central departments. As mentioned earlier, teachers who are full-time basic education teachers may be coded to the schools where they teach. Itinerant teachers serving multiple schools, however, may be coded to the district office.
The most striking variation in how districts code costs to schools is in food services – districts allocate anywhere from zero to 85 percent of their food costs to schools. Some districts may code all of their food costs centrally, while other districts allocate food costs to individual schools. In both cases, food services are delivered at the school-level but only some districts track those costs to individual schools in their accounting systems.
Due to the variation across districts in the types of expenditures coded to schools, it is not possible to rely on accounting data alone to understand the total spending for individual schools in most districts. For many districts, identifying total school-level costs would require tracking new information, such as itinerant staff recording their time and expenses for each school they serve. Tracking these costs would take substantial time and effort, as is further discussed in Chapters 5 and 6.
13

K-12 School Spending and Performance Review
14
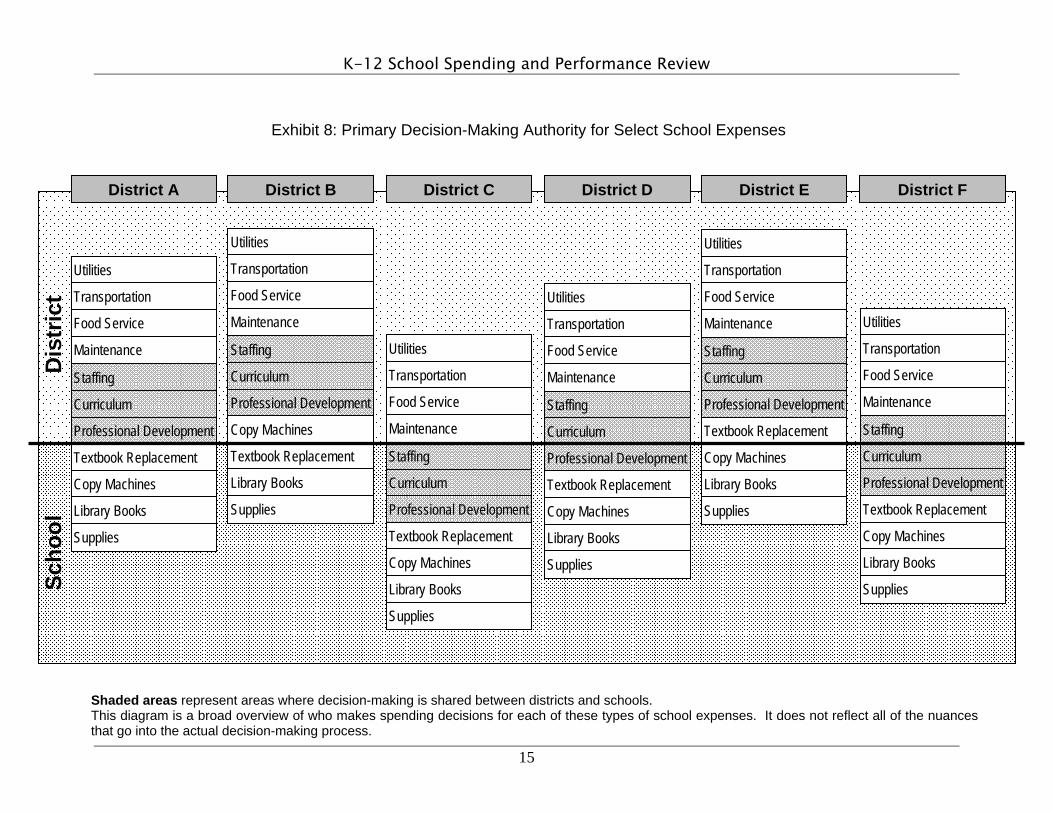
DECISION-MAKING AUTHORITY Another important distinction to make regarding school-level financial information is that the expenditures coded to schools do not necessarily reflect who is primarily responsible for making decisions about how those funds are spent. Coding expenditures to schools is generally an exercise in expenditure tracking. In many cases, the school principals have limited influence over most of the funds coded to their schools by the district. For instance, one of our case study districts coded $1.7 million in expenditures to an elementary school in the district’s accounting system, but the principal of that school only had management discretion over approximately $52,000, or about 3 percent of the school’s expenditures. The following section describes who has the primary authority for making decisions about school spending. Exhibit 8 on the next page lists some of the major expenses for operating a school that were identified by the district and school personnel we interviewed. This diagram highlights who is primarily responsible for making decisions about these common school expenses.15
Decision-Making Authority for District-Managed Expenses Items above the thick black line in Exhibit 8 represent spending primarily determined by the district. All six of our case study districts reported that the district has primary authority for costs related to utilities, transportation, food services, and maintenance. Districts may choose to control these expenses centrally in order to benefit from cost efficiencies, such as centralizing transportation functions, or to share resources among multiple schools, such as centrally-managed maintenance crews. 15 The expenses do not directly align with the statewide activities discussed previously because some of the expenses fall into more than one activity category.
0%
20%
40%
60%
80%
100%
CentralAdministration
SchoolAdministration
Teaching Support Teaching Food Transportation Buildings,Grounds,
Technology, Other
District A District B District C District D District E District F
Per
cent
of E
xpen
ditu
res
Cod
ed to
Sch
ools
Exhibit 7: Districts Vary in the Types of Expenditures They Code to Schools
Source: JLARC analysis of 2003-04 accounting data submitted by six case study districts to the State Auditor’s Office.
K-12 School Spending and Performance Review
15
Exhibit 8: Primary Decision-Making Authority for Select School Expenses
Utilities
Transportation
Food Service
Maintenance
Staffing
Curriculum
Professional Development
Textbook Replacement
Copy Machines
Library Books
Supplies
Utilities
Transportation
Food Service
Maintenance
Staffing
Curriculum
Professional Development
Copy Machines
Textbook Replacement
Library Books
Supplies
Utilities
Transportation
Food Service
Maintenance
Staffing
Curriculum
Professional Development
Textbook Replacement
Copy Machines
Library Books
Supplies
Utilities
Transportation
Food Service
Maintenance
Staffing
Curriculum
Professional Development
Textbook Replacement
Copy Machines
Library Books
Supplies
Utilities
Transportation
Food Service
Maintenance
Staffing
Curriculum
Professional Development
Textbook Replacement
Copy Machines
Library Books
Supplies
Utilities
Transportation
Food Service
Maintenance
Staffing
Curriculum
Professional Development
Textbook Replacement
Copy Machines
Library Books
Supplies Scho
ol
Dis
tric
t
District A District B District C District D District E District F
eas represent areas where decision-making is shared between districts and schools. agram is a broad overview of who makes spending decisions for each of these types of school expenses. It does not reflect all of the nuance
ecision-making process.
Shaded arThis di s that go into the actual d

K-12 School Spending and Performance Review
Decision-Making Authority for School-Managed Expenses Schools control the spending that appears below the thick black line on Exhibit 8. Major spending decisions for schools generally include buying supplies (for classrooms, offices, and health care), library books, textbook replacements, and copier machine contracts.
Many of the principals of our case study schools reported managing very limited budgets. They may have discretion over less than 5 percent of the resources coded to their schools in district accounting systems. Small increases in printing, postage, or textbook replacement costs can consume all of their discretionary resources. Several principals specifically mentioned that copy machine expenses represent a significant portion of their budgets and that they often have to save money for this purchase for several years.
The exception to this characterization among our case study districts is District C, which is a district that gives principals more decision-making responsibility. This district uses site-based management because it believes that schools should be more involved in financial decisions since schools are accountable for student achievement.
In District C, principals make more significant spending decisions related to staffing, curriculum, and professional development than any of the other principals in our case studies. For example, the district coded $3.5 million in expenditures to one middle school, and the principal managed a budget of over $3 million, or over 85 percent of the expenditures coded to that school.
Decision-Making Authority for Jointly-Managed Expenses The shaded areas on Exhibit 8 represent items that are decided on jointly between districts and schools. Their placement above or below the line depends on whether the district or school has final decision-making responsibility and which organizational budget is responsible for paying for those items. These joint areas also represent areas where there was considerable variation among our case study districts. These expenses include some of the large instruction-related costs, such as staffing, curriculum, and professional development. Both district and school leaders talked about the direct impact these major expenditures have on student learning.
Staffing – In most cases, central administrators determine the number of certificated and classified staff assigned to individual schools. Almost 96 percent of districts responding to JLARC’s survey said that central administrators determine whether to hire additional teachers and 89 percent said central administrators determine the number and type of classified staff employed at each school.
One of our case study districts was an exception to this practice. Again, in District C, the site-based model, schools receive a lump sum dollar allocation based on student enrollment and grade level (elementary, middle, or high school), and the schools can decide how to use this money. In this district, the school leaders decide how many staff and the type of staff to hire, as long as they stay within the state’s statutory class size limits.
Although decisions about staffing levels for many schools are made by the district office, the principals and superintendents both make decisions about whom to hire. In the JLARC survey, a little over half of the districts reported that central administrators make the decision about which teacher candidate to hire. The remaining districts reported that school principals make these decisions. Under both scenarios, hiring decisions are influenced by district collective bargaining requirements. For example, collective bargaining may require that the most senior teachers in
16

K-12 School Spending and Performance Review
the district have priority over teachers from outside the district or less experienced teachers when they apply for jobs.
Curriculum – In four of the six districts we studied, central administrators make final curriculum decisions (i.e., selecting and purchasing text books and associated supplies). Funding for the curriculum comes from district budgets. Central administrators reported that they maintained primary authority in curriculum decisions for two reasons: (1) to ensure continuity for students who move between schools within their district; and (2) to consolidate the number of different curriculum materials the school board needs to approve.
In two districts, school principals have more influence over their curriculum selection. District C selects curriculum for different grade levels, but individual schools have the option of choosing to use alternative instructional materials. District F is a small district with only one elementary, middle, and high school. Here principals, teachers, and central administrators work together to select curriculum. The school board then must approve the curriculum.
Professional development – This is one other area in which there is variation across districts about who makes decisions. In many districts, this is a shared process where both principals and central administrators have a role in identifying and organizing professional development programs; the variation revolves around how much control each level has, and the types of professional development offered by each. For example, central staff typically facilitate professional development around district curriculum, general district programs and policies, and state-level requirements. Principals, on the other hand, tend to use their professional development funds to target more specific school challenges identified through student assessments and classroom observations. Of course, in districts where the schools choose and purchase their own curriculum, the schools also have a greater responsibility for providing professional development opportunities that assist staff in implementing the curriculum.
Note on the Role of the School Board, Principal, and School Site Council To fully understand how spending decisions are made at districts and schools, it is important to consider the roles of the school boards, principals, and site councils.
State law is clear that the school board has the “…final responsibility for the setting of policies ensuring quality in the content and extent of its educational program…”16 As such, state law directs school boards to set policies to:
• Develop performance criteria and evaluation processes for certificated personnel;
• Determine staff assignments;
• Determine the number of instructional hours;
• Determine the allocation of certificated and classified staff time;
• Establish curriculum standards; and
• Evaluate teaching materials, including text books, teaching aids, handouts, or other printed material.
16 RCW 28A.150.230.
17

K-12 School Spending and Performance Review
Depending on the philosophy of the district’s school board, the principals play more or less of a role in making spending decisions. In many centralized districts, principals are primarily the instructional leader of the school. These principals are actively involved in the day-to-day delivery of instruction, but do not make substantial spending decisions. In districts where principals have more budgeting authority, they are site managers as well. Some principals that we spoke with enjoy this additional responsibility. Other principals, however, prefer to focus on their role as instructional leaders without the added financial management responsibilities.
Almost all of the principals we spoke with use site councils to help them manage their schools. These councils are generally made up of the principal and representatives of certificated and classified staff, parents, and community members. At many schools, site councils are involved in budget decision-making. However, a few principals did tell us that their site councils were primarily focused on student learning issues and not interested in talking about finances.
IN SUMMARY Districts around the state have different processes for distributing resources to schools, but their spending patterns are similar. While districts are not required to do so, most use existing accounting systems to track some spending to the school level. However, districts vary in the amount and types of expenditures they code to schools and some school-level expenditures are accounted for at the district-level rather than by individual school. Because districts code costs in different ways, the school spending information tracked in district accounting systems is not comparable across districts. We also found differences among the case study districts in who makes budget and spending decisions: the central administrators and/or individual school principals. In most districts, principals only have discretion over a limited amount of the total spending for their schools.
18
CHAPTER FOUR: PERFORMANCE ASSESSMENT CHAPTER OVERVIEW State and federal education reform has focused the attention of policymakers on accountability for district and school performance. Schools have increasingly become the point of focus for improving student achievement as reform measures require students to meet higher standards. This chapter begins with a summary of education reform policies. It then describes different types of assessments and how districts and schools are using assessment data to make budgeting and programmatic decisions.
ACCOUNTABILITY IN EDUCATION In 1993, the Legislature passed the Education Reform Act, with the goals of improving student achievement and strengthening the state’s educational accountability system.17 The Education Reform Act created the Washington Commission on Student Learning. The job of the Commission was to develop “Essential Academic Learning Requirements” based on student learning goals and an academic assessment system to determine if students were meeting these requirements.18
The other major accountability change for education is the federal No Child Left Behind Act (NCLB) of 2001, which increased the federal role in education. Under NCLB, states must use assessment systems to hold schools and districts accountable for student learning. NCLB can have a significant impact on schools that receive federal Title 1 funding for improving the achievement of low-performing students.19 Currently, 45 percent of Washington schools receive Title 1. These schools will face a series of increasing sanctions if they fail to meet Adequate Yearly Progress (AYP) for improving student performance. These sanctions include allowing students to transfer to other schools and providing supplemental instruction services from an OSPI-approved provider.
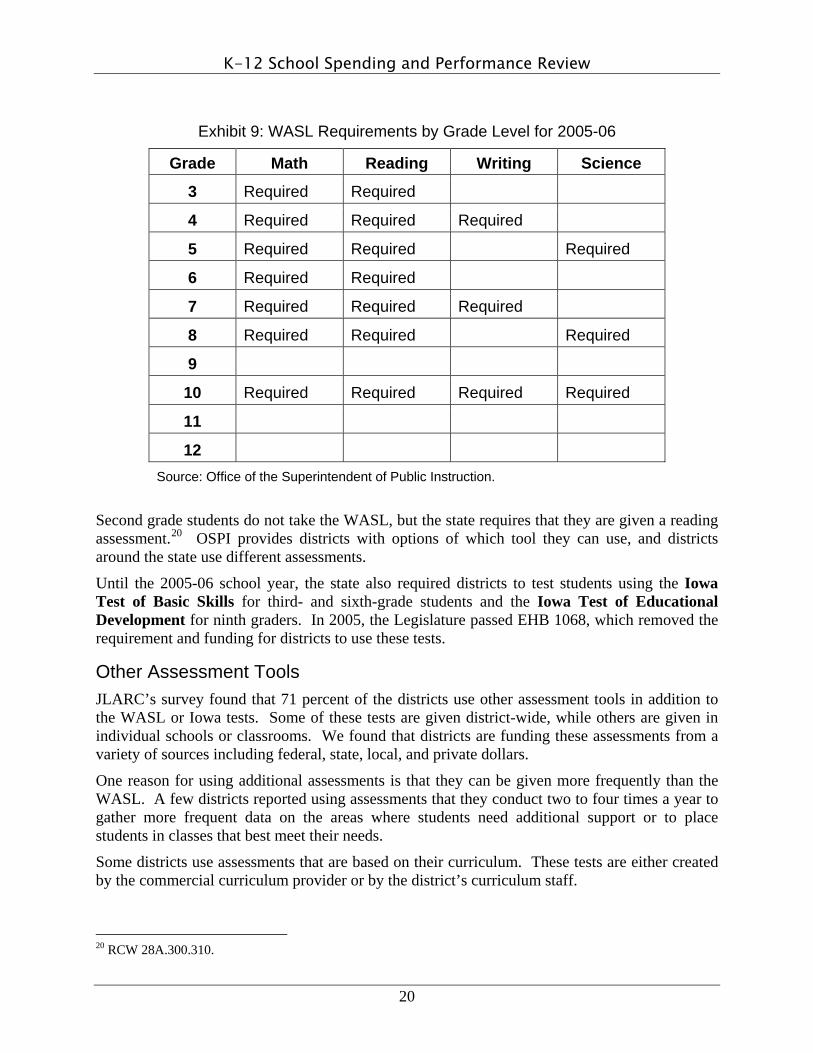
PERFORMANCE ASSESSMENTS State Assessments The primary performance assessment the state requires all schools to use is the Washington Assessment of Student Learning (WASL), which is the test developed after the Education Reform Act of 1993. The WASL is also used to satisfy NCLB requirements of a criterion-based assessment to measure state standards. Exhibit 9 on the following page shows WASL requirements for each grade level. Beginning in the 2005-06 school year, students in third, fifth, sixth, and eighth grade will be tested in reading and math to comply with NCLB requirements.
17 Chapter 336, Laws of 1993 (ESHB 1209). 18 The Washington Commission on Student Learning was replaced by the Academic Achievement and Accountability Committee in 1999. This committee was dissolved in 2005 and its duties were transferred to the State Board of Education. 19 Title 1 of the No Child Left Behind Act provides funding for helping disadvantaged children.
19
K-12 School Spending and Performance Review
Exhibit 9: WASL Requirements by Grade Level for 2005-06
Grade Math Reading Writing Science
3 Required Required
4 Required Required Required
5 Required Required Required
6 Required Required
7 Required Required Required
8 Required Required Required
9
10 Required Required Required Required
11
12 Source: Office of the Superintendent of Public Instruction.
Second grade students do not take the WASL, but the state requires that they are given a reading assessment.20 OSPI provides districts with options of which tool they can use, and districts around the state use different assessments.
Until the 2005-06 school year, the state also required districts to test students using the Iowa Test of Basic Skills for third- and sixth-grade students and the Iowa Test of Educational Development for ninth graders. In 2005, the Legislature passed EHB 1068, which removed the requirement and funding for districts to use these tests.
Other Assessment Tools JLARC’s survey found that 71 percent of the districts use other assessment tools in addition to the WASL or Iowa tests. Some of these tests are given district-wide, while others are given in individual schools or classrooms. We found that districts are funding these assessments from a variety of sources including federal, state, local, and private dollars.
One reason for using additional assessments is that they can be given more frequently than the WASL. A few districts reported using assessments that they conduct two to four times a year to gather more frequent data on the areas where students need additional support or to place students in classes that best meet their needs.
Some districts use assessments that are based on their curriculum. These tests are either created by the commercial curriculum provider or by the district’s curriculum staff.
20 RCW 28A.300.310.
20

K-12 School Spending and Performance Review
OSPI also provides teachers with classroom-based assessments for use throughout the school year. These tests can be tailored to the unique needs and learning styles of students and enable teachers to measure student progress over time.
In addition, several districts are using surveys of teachers, parents, and students to assess the education the districts are providing and to identify areas in need of improvement. One district described an annual survey they provide to all students in the district asking them what they learned in the prior school year that prepared them for their current grade-level course work.
USING ASSESSMENT DATA In both our survey and our interviews with case study district personnel, we heard many examples of how districts and schools use assessment data to make decisions. Several case study districts said that performance data has helped them become “smarter about what they do.” Below we describe some of the most common uses of performance data identified in our survey and case study districts.
Review Teaching Practices We found that two-thirds of survey respondents use the results from assessments to make changes to their programs and services. As one principal in a case study district said, “Assessment drives how we do things.”
In one case study district, teachers review performance data of students and use those results to modify instruction. An elementary school principal mentioned that the teachers decided to re-teach multiplication after seeing that their students had not done well on a math assessment.
Another district also looks at performance data to identify how well it is delivering curriculum district-wide. For example, we heard from a high school principal that performance data showed ninth graders were struggling in math and English. Rather than just looking within the high school to solve this problem, the principal worked with the middle school principals to set targets for performance in every grade level.
Some case study district principals and superintendents mentioned that they use performance data to determine areas for professional development. In one case study district, we heard from elementary, middle, and high school principals about how they use WASL scores and other performance data to make decisions about professional development needs.
Review Curriculum Other districts described using performance data in making decisions about what curriculum to use. For example, one district used WASL results to evaluate their middle school math curriculum. The district found that their curriculum and materials were not preparing students for the WASL. The district looked at which math skills were areas of weakness for their students and, in 2001, the district purchased new curriculum and changed the way that instructors teach math. Between 2001 and 2004, the percentage of seventh-grade students passing the math WASL has nearly doubled in this district.
21

K-12 School Spending and Performance Review
Identify Students Who Need Extra Assistance Several principals in our case study districts talked about the ways that they use performance data to identify individual students, groups, or classes that need additional assistance. One principal has an assessment notebook that shows the reading performance of all of her students. At this school, the principal, assistant principal, curriculum coach, and kindergarten teachers form a “swat team” to give individual attention to kindergarteners who need extra help learning to read.
Another principal has similar spreadsheets that show the performance of all students in a class. In addition to using this data to identify students who need additional assistance, this principal also uses this data to identify strengths and weaknesses of individual teachers. He can then use this data in making decisions about professional development needs.
Another of the districts we studied uses reading assessments to place students in reading classes depending on their abilities. Additionally, the staff of every school has two or more meetings a year to assess the academic, social, health, and well-being of all of their students.
SHARING PERFORMANCE ASSESSMENT AND IMPROVEMENT STRATEGIES While districts and schools have considerable flexibility in the types of assessments and interventions used to evaluate and improve student performance, the state has several methods for collecting and sharing evidence of successful strategies.
• Professional development programs – The primary mode of identifying and sharing promising practices for improving student achievement is through professional development conferences and trainings. OSPI selects schools that have effectively improved student achievement scores as presenters at state-sponsored conferences and summer institutes. OSPI also makes presentations on best practices at other trainings held throughout the state and works with local educational service districts to share these practices as well.
• Nine characteristics of high performing schools – Through a broad research effort, OSPI identified nine common features of effective schools. OSPI shares this information with schools through trainings held across the state. The characteristics include having effective school leadership, high levels of collaboration, frequent monitoring of teaching and learning, and focused professional development.
• Evaluating curriculum to ensure it is aligned with state standards – OSPI brings together stakeholders to evaluate and score curriculum materials based on how well they align with state learning standards. This information is shared with school districts on OSPI’s website.
• Focused assistance program – OSPI provides three years of focused assistance to select schools that have been identified as needing “school improvement” under No Child Left Behind. This assistance includes a comprehensive educational audit, a school improvement facilitator to help with the development and implementation of a school improvement plan, and other necessary tools, resources, and training for improving student achievement. These efforts are funded by both federal and state sources.
22
K-12 School Spending and Performance Review
LIMITS TO UNDERSTANDING PERFORMANCE THROUGH BUDGETS Most school districts around Washington report using performance data to make budget and program decisions. They use this data to evaluate curriculum and teaching, and to identify students that need additional help. However, this is not readily apparent by looking only at district and school budgets.
The budgets may show that a district bought new curriculum, but it does not tell the story of how districts select one curriculum over another, such as selecting a curriculum that addresses specific weaknesses in student learning. Budgets also can identify the total amount spent on professional development training within a district or school, but not necessarily show how those funds were targeted at areas where students were having the most difficulty meeting state standards.
Some examples from our case studies illustrate the difficulty in relying only on budgets to understand how schools are strategically using resources to improve student performance:
• One principal described how he made additional instructional assistance available for struggling students after reorganizing the schedules of his staff assistants. By coordinating their schedules to avoid unnecessary time spent traveling from one end of the building to the other, the principal was able to gain more time to serve students in need of extra support. This efficiency change is not reflected in the school’s budget because the assistants continue to work the same amount of hours per day.
• Similarly, another principal described how he carved out portions of staff time from the school’s total staffing allotment to provide support classes for students to help them succeed in challenging classes. The school chose to increase class size in certain subject areas to fill the need for additional certificated staff time for before and after school support classes for struggling students. Again, this type of change would not be reflected in a traditional school or district budget.
• To help improve student reading scores, one of the case study high schools decided to focus its professional development dollars on reading. Teachers from all departments and subject areas receive reading training in order to help their students improve their reading abilities. While the total budget for professional development may not have changed, the targeted training represents a new effort to address areas of weakness in the school.
Although budgets often provide a window into understanding district and school priorities and philosophies, they do not capture all of the strategic decisions and detailed resource allocations that are made to improve student performance and achieve state learning standards.
IN SUMMARY Districts around the state are using performance data in making budget and program decisions. They are using assessment results to review curriculum and teaching practices, and to identify students who need help. However, policymakers would not necessarily be able to look at district and school budgets to identify the strategic manner in which they are using assessment data.
23
K-12 School Spending and Performance Review
24
CHAPTER FIVE: REPORTING REQUIREMENTS AND DATA AVAILABILITY CHAPTER OVERVIEW School districts have extensive reporting requirements. The state collects data on districts’ budgets, spending, enrollment, and student achievement. Individual schools also report information on student enrollment and student characteristics. Yet the state does not collect budget or spending data for individual schools.
CURRENT REPORTING REQUIREMENTS During the course of this review, we heard from many district staff that fulfilling state reporting requirements requires significant time and resources. Districts report that they often submit the same data elements to multiple programs at OSPI and that they are uncertain how some of these reports are used by the state. OSPI’s current list of reporting requirements is provided in Appendix 4.
Current state reporting requirements include the following types of information:
• Monthly school district enrollment;
• School district budgets and spending;
• School district personnel data, such as salaries, benefits, education and experience levels and professional certifications; and
• Numerous program-specific reports, such as reports on Bilingual Education, Special Education, Vocational/Career and Technical Education, Child Nutrition, Transportation, and Health Services.
In addition to its own reports, OSPI also collects district reports required by the federal Department of Education and Washington State’s Departments of Health, Social and Health Services, and Corrections. OSPI forwards some of these reports directly to the sponsoring agency, while OSPI reviews others for accuracy before passing them on.
DATA AVAILABILITY Several types of data are needed to understand and evaluate how well schools are meeting performance standards and to make comparisons of schools with similar student characteristics. These include student enrollment, performance, and financial data.
25

K-12 School Spending and Performance Review
Enrollment Data The state collects monthly student enrollment data by district and school. The state also gathers student enrollment in specific programs, including vocational and bilingual education. Enrollment in special education and highly-capable programs is reported at the district level. OSPI also tracks some student characteristics at the school-level, such as ethnicity and percent of students receiving free or reduced-price meals.
Performance Data State-mandated performance data is readily available at both the district and school level. OSPI’s “Report Card” webpage displays the WASL and Iowa Test scores for all districts and schools.21 The Report Card also shows the dropout rates and graduation rates for each high school and district, and shows whether schools are meeting Adequate Yearly Progress (AYP) standards according to No Child Left Behind requirements.
Financial Data The state collects district-level financial information. The funding source and expenditure data presented in Chapter 2 of this report is available for all school districts, organized by state-defined programs, objects of expenditures, and activities. The state also collects personnel costs from each district, including the salaries, and education and experience levels of all certificated and classified staff employed by the district. Most districts code a portion of their personnel to individual schools, but some school personnel are assigned to central departments or programs. As mentioned previously, OSPI does not currently collect spending data for individual schools.
A Note on Collecting School-Level Expenditures JLARC’s 1999 K-12 Finance and Student Performance Study recognized that expenditure data for individual schools would be useful, but concluded that the state did not need to collect this data. The 1999 report stated that the staffing data that OSPI does collect on schools could be used to estimate school-level expenditures since a significant portion of school expenditures are for staffing.
Since the 1999 report was issued, schools and districts are under increased pressure to meet accountability standards set by No Child Left Behind. While staffing continues to represent a major portion of school spending today, district leaders and policymakers may benefit from having more detailed school spending data to help understand and assess school performance. Chapter 6 outlines in more detail some options for reporting and budgeting school expenditures. Exhibit 10 on the next page describes some of the benefits and challenges to collecting school-level spending data.
21 OSPI’s Washington State Report Card is at http://reportcard.ospi.k12.wa.us/default.aspx.
26

K-12 School Spending and Performance Review
• School-level financial data does not provide complete picture of changes made to improve performance. Budgets and expenditure reporting alone do not reveal all of the strategic decisions and resource allocations made to improve student achievement. School-level financial data would have to be combined with other types of information in order to fully understand school performance.
• Unclear whether school-level financial data will answer questions about performance. Some research suggests that the biggest influence on student performance is student characteristics, not spending in schools. If the state collects school-level spending data, it will need to be clear on the type of analyses it hopes to conduct with the information to ensure that the burden of collecting this information outweighs the benefits, and that it is collected in a format that lends itself to specific types of analyses.
• Allocating shared staff and services to individual schools may be difficult. Many districts have staff and programs that serve more than one school. Shared staff may include psychologists, speech language pathologists, and health specialists. Shared programs may include a program for highly capable students or other special needs programs managed by the district and serving multiple schools. Allocating these costs to individual schools would require more extensive timekeeping and reporting than currently is maintained by most school districts. Additionally, to obtain comparable information, districts would need to track these costs in a consistent manner.
• Districts have different ways of accounting for school-level spending in their accounting systems. As discussed in Chapter 3, districts have different ways of coding expenditures to schools. The state would need to develop and require the use of uniform accounting standards for school-level expenditures in order to collect comparable information about school-level spending from districts around the state.
• An increased transparency and accountability in K-12 spending. School-level financial data would allow the public to see exactly what is being spent at individual schools and how resources are allocated within school districts and schools.
Challenges:
• An improved understanding of the impact (if any) spending may have on performance. Researchers in education policy do not agree on whether and to what extent school spending patterns influence student achievement. If school expenditure information was readily available, including spending on professional development, curriculum, teacher mentorship, and special supports for struggling students, more detailed analysis could be conducted on the linkage between spending and performance.
Benefits: • A more complete picture of school spending than current state personnel system can
provide. In general, districts assign most of their certificated and classified staff to individual schools. However, some employees are assigned to a central department or program because they serve multiple schools. These employee expenditures are often lost in any analysis that uses existing personnel assignments as a proxy for school expenditures.
Exhibit 10 – Benefits and Challenges of Collecting and Using School-Level Spending Data
27
K-12 School Spending and Performance Review
IN SUMMARY The state collects data on district spending, enrollment, and performance. However, it does not collect spending data for individual schools. This information could be useful because of increased attention on school performance. It would provide a more complete picture of school-level spending, provide data to examine the link between spending and performance, and increase transparency and accountability. However, reporting this data may be difficult for districts and schools. It also is unclear how this data would be used by the state to understand school performance, especially since expenditure data alone does not tell the entire story of how districts and schools are making strategic changes to improve performance.
28
CHAPTER SIX: ALTERNATIVE APPROACHES TO REPORTING AND BUDGETING SCHOOL EXPENDITURES CHAPTER OVERVIEW This chapter discusses alternative approaches to reporting and budgeting school expenditures that are being considered or implemented throughout the country. The nine alternative approaches outlined here respond to a variety of district or state goals. When policymakers consider these varying approaches, it is important to think about the appropriate role of the state in school-level finance and the specific goals intended behind each alternative approach.
This chapter is based on a report completed by consultants JLARC hired for this review.22 The full report includes specific examples of states and districts that are engaged in alternative reporting and budgeting practices. Here, we focus on the merits and challenges of each option and its applicability to Washington State.
WHY CHANGE SCHOOL REPORTING AND BUDGETING PRACTICES? As education reform has placed increased emphasis on school-level accountability, some policymakers have become interested in changing the way school finances are reported and budgeted to achieve varying goals, as indicated below:
• Align finance with school accountability so policymakers can see how much is spent at individual schools;
• Provide for greater spending transparency and clarity;
• Allow for increased flexibility in resource use;
• Link spending with student performance;
• Increase equity among schools within each district; and
• Allow schools greater discretion in budgeting decisions.
If policymakers consider changes to school reporting and budgeting practices, it is important to have a clear idea of which of these goals they are trying to address.
22 The group of consultants JLARC hired for this piece of analysis is Marguerite Roza, Research Assistant Professor and research consultant at the University of Washington; Claudine Swartz, independent policy consultant for the development of K-12 education reforms; and Jennifer Harris, attorney and research consultant in public finance. Their work is based on a review of literature on this topic and their original research on what is happening around the country and in Washington school districts.
29
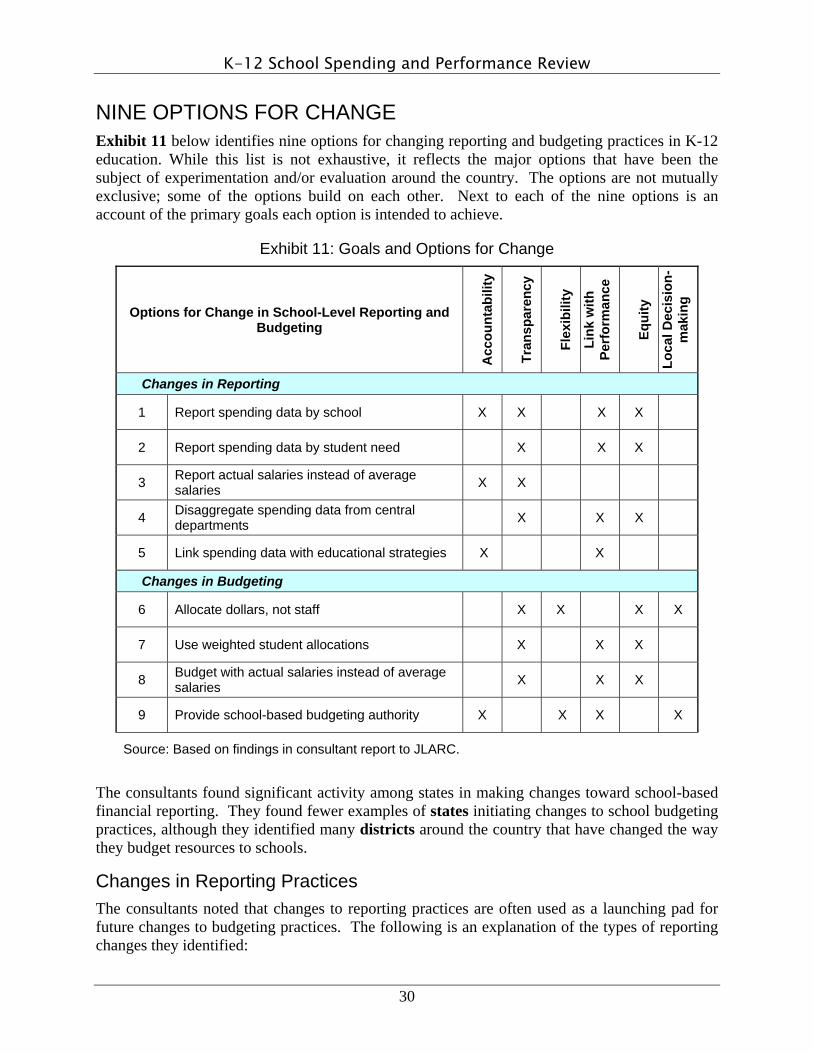
K-12 School Spending and Performance Review
NINE OPTIONS FOR CHANGE Exhibit 11 below identifies nine options for changing reporting and budgeting practices in K-12 education. While this list is not exhaustive, it reflects the major options that have been the subject of experimentation and/or evaluation around the country. The options are not mutually exclusive; some of the options build on each other. Next to each of the nine options is an account of the primary goals each option is intended to achieve.
Exhibit 11: Goals and Options for Change
Options for Change in School-Level Reporting and Budgeting
Acc
ount
abili
ty
Tran
spar
ency
Flex
ibili
ty
Link
with
Pe
rfor
man
ce
Equi
ty
Loca
l Dec
isio
n-m
akin
g
Changes in Reporting
1 Report spending data by school X X X X
2 Report spending data by student need X X X
3 Report actual salaries instead of average salaries X X
4 Disaggregate spending data from central departments X X X
5 Link spending data with educational strategies X X
Changes in Budgeting
6 Allocate dollars, not staff X X X X
7 Use weighted student allocations X X X
8 Budget with actual salaries instead of average salaries X X X
9 Provide school-based budgeting authority X X X X
Source: Based on findings in consultant report to JLARC.
The consultants found significant activity among states in making changes toward school-based financial reporting. They found fewer examples of states initiating changes to school budgeting practices, although they identified many districts around the country that have changed the way they budget resources to schools.
Changes in Reporting Practices The consultants noted that changes to reporting practices are often used as a launching pad for future changes to budgeting practices. The following is an explanation of the types of reporting changes they identified:
30
K-12 School Spending and Performance Review
1. Report spending data by school This change requires districts to track and report how funds flow to individual schools. It often means that districts have to add new school-specific account codes to their existing accounting systems in order to break down spending by school. About 20 states collect financial information by school, but the extent of the data reported varies greatly across these states.
Merits of this option include revealing what portion of total district spending reach individual schools, understanding how much a district spends per pupil from site to site, and identifying spending inequities between schools within the same district. This option also provides more useful data for analyzing the link between spending and student performance.
Challenges of implementing this option include the fact that it does not always provide a complete picture of school-level spending. In other words, it does not make clear whether all district resources are allocated to schools or just those directly associated with the activities of an individual school. This approach also may not provide information about why spending may vary among schools. When states have initiated this change, it is often very expensive and complex because of the need to create and maintain large electronic data systems and provide substantial training and support to districts to ensure comparable reporting.
Application to Washington State – In addition to the challenges mentioned above, a statewide effort to implement school-level financial reporting would require changes to the state accounting requirements and financial reporting forms. Some districts in Washington currently collect spending data by school, but these districts vary in the extent to which school-level financial information is reported. As indicated in Chapter 5, the state would need to institute standardized accounting methods if it sought to ensure consistent and comparable treatment of school costs. The consultants did note that Washington districts of varying sizes are adept at complex accounting, as evidenced by their financial reports, which show spending separated for numerous discrete funds and programs.
2. Report spending data by student need
By combining financial information with each school’s student demographic data, districts can look at the additional spending for student needs and the programs that serve those needs, such as bilingual education, special education, and social and academic needs often associated with poverty. For example, a district could identify how many additional dollars it spends on each bilingual education student. Reporting spending data by student need also provides the baseline information necessary to compare spending across schools with different student needs. Many larger districts and some states have implemented this type of financial reporting.
Merits of this option include helping district leaders and policymakers see if each school receives an equitable share of base funding and resources to meet specific needs and to identify the incremental spending that addresses each student need. This reporting allows for differentiation between spending differences that result from student need and spending differences driven by other budget decisions. It can also lead to discussions about appropriate funding levels for particular student needs and more strategic and deliberate resource allocations.
31
K-12 School Spending and Performance Review
Challenges include how to account for centrally budgeted programs or resources that serve student needs but do not appear in school spending reports (e.g., itinerant special education teachers or centrally budgeted programs serving highly capable students). This type of reporting also is difficult, particularly in small districts and schools, when the same resources are dedicated to multiple student needs. Further, the state would have to establish accounting methods to ensure consistency across districts and schools.
Application to Washington State – Washington districts are already required to report spending by program (i.e., bilingual education, special education), but they do not report spending for each program by school. This would require a change to current state budgeting and expenditure reporting forms and new accounting practices for most districts.
3. Report actual salaries instead of average salaries
Another way of obtaining more detailed information about school-level spending is to require districts to report spending that reflects actual salaries by school. Many districts nationwide use average district salaries for school-level budgeting and reporting, even though teachers in any given school may earn significantly more or less than the district average. A few states and districts across the country now report spending using actual salary information by school.
Merits include providing a more accurate picture of school-level spending and identifying spending variations among schools within a district that are driven by differences in teacher experience and education.
Challenges include the time and resources necessary to merge personnel databases with budgeting and/or expenditure databases.
Application to Washington State – In Washington, districts already report actual salaries to OSPI, but they do not consistently code staff to specific schools. Based on JLARC’s discussions with district and school officials over the course of this project, reporting actual salary information by school would require uniform accounting and reporting methodologies for coding staff to schools.
4. Disaggregate spending data from central departments
Reporting spending data by school generally captures only those resources included in school budgets. It may not include many resources that flow to schools but are centrally budgeted, such as shared or on-site school staff, psychologists, nurses, equipment, professional development, etc. Currently, no states disaggregate spending data from central departments, although there is some evidence of such activity among more decentralized districts.
Merits include providing a more accurate understanding of how district resources are distributed to schools and the extent to which resources are distributed equitably.
Challenges include a very intensive effort in the short run for districts of all sizes, and it is not clear that collecting this data is useful for every program or in every year. Most districts lack a comprehensive accounting framework to determine how central office personnel allocate their time and resources among schools. Central departments that do track school-level spending may not do so in a uniform manner across departments.
Application to Washington State – All of the challenges listed above would apply to Washington if this type of reporting were required. The consultants noted that an
32
K-12 School Spending and Performance Review
alternative approach for the state would be to provide training or materials on how to disaggregate central budgets for interested districts. There are some online tools now available to help with this process.
5. Link spending data with educational strategies As policymakers at all levels look for a greater return on each education dollar spent, there is increasing interest in linking spending for specific programs or strategies to student performance gains. More specifically, state and district education leaders want to know which programs work and how much they cost. Throughout the country, there are no large-scale examples of districts routinely collecting detailed spending data to analyze the cost effectiveness of different educational strategies. Some districts, however, are more adept than others at using school spending data to reallocate resources to meet educational goals.
Merits include more efficient and strategic resource use by districts when they have the data to assess successful educational practices and the costs of those practices.
Challenges include the need for extensive school data collection to understand the costs of specific educational strategies. This likely requires adding new expenditure categories to the states’ and/or districts’ accounting systems, such as class size, length of core classes, professional development, and time individual students spend in various settings. The consultants also noted that district leaders must start with a sophisticated understanding of their budgets and a commitment to routinely analyze data.
Application to Washington State – Washington could fund this kind of investigation with specific strategies in mind. For instance, the state might select a specific program area (e.g., bilingual education) and investigate the cost effectiveness of various practices by soliciting cost and performance data on a limited basis from specific districts. The state could then share findings with the districts that could benefit from the information.
Changes in Budgeting Practices In general, changes in budgeting practices are initiated at the district level. Some districts that have begun using these practices have requested changes in their state’s allocation process to facilitate the implementation of new budgeting practices.
6. Allocate dollars, not staff This option involves states or districts making lump sum allocations to schools rather than allocating a set number of staff to schools. States could pass funds directly to schools via block grants or require districts to allocate a fixed percentage of funds to schools. Districts could choose to distribute a fixed sum to schools rather than staff positions. States and districts throughout the country use lump sum allocations in varying ways, including allocating funds to schools for specific programs. No state, however, has yet to implement a mandatory dollar-based allocation system.
Merits include eliminating diverse allocations that often result from staff-based allocations. For example, a district that allocates an additional administrator, such as a vice principal, to schools with over 400 students may not recognize that it is providing significantly more resources to those schools than to schools with just under 400 students. By allocating dollars rather than staff positions, these funding differences would be
33
K-12 School Spending and Performance Review
explicit. Additionally, this option provides schools with the ability to have unique staff mixes and alternative staffing models specific to their needs that can foster innovation and yield more efficient use of resources. Lump sum allocations for staffing can increase the portion of district resources used directly at the school site.
Challenges include the potential misalignment of state and district allocation systems. For example, districts using lump sum allocations could find it challenging to align revenues with allocations and satisfy state and federal compliance reporting requirements. The consultants also noted that small schools may encounter the most change under a lump sum approach.
Application to Washington State – Changes needed to implement this option depend on the state’s or districts’ intended goal. For example, if the goal is to encourage alternative use of staff, changes to the state staffing ratios and other requirements may be needed. In addition, each district would need to negotiate allowances for staffing flexibility in their collective bargaining agreements since these agreements almost always include class size and staff assignment requirements.
7. Use weighted student allocation Weighted student allocation, also known as weighted student funding or student-based allocation, is one approach to lump sum budgeting with dollars distributed to schools on the basis of student types (e.g., regular education, highly capable, bilingual education, etc.). Districts decide how much additional funding should be provided for different student needs on top of the base funding provided to all students—this additional funding is considered a “student weight.” For instance, a district might specify that for every non-English speaking student, a school is allocated 20 percent more than the base (or regular education) amount. Weighted student allocation has been tried in many districts around the country, including Seattle.
Merits include a deliberate and transparent process for choosing student weights, and an assurance that, on a per pupil basis, resources for each category of students are the same across schools within a district.
Challenges include difficulties using certain fund sources in weighted student formulas when those fund sources often come with guidelines or restrictions. For instance, federal Title I allocations are not intended to be disbursed on a per student basis but to schools with higher proportions of poverty children. Furthermore, some funding is earmarked for specific purposes. This “categorical funding” often carries detailed reporting requirements that place limits on the way the dollars are distributed.
Application to Washington State – The challenges described above would all apply to Washington. The consultants noted that Washington’s districts often make very different choices about how much to spend on students of any given need. A shift to weighted student allocations may reveal differences in district decision making that have not been known before.
8. Budget with actual salaries instead of average salaries This option requires that districts deduct the actual amount of staff salaries from each school’s budget rather than using district-wide average salaries. In other words, for a school with more senior staff, their higher costs consume a larger portion of the school’s budget, leaving fewer
34
K-12 School Spending and Performance Review
dollars remaining for other needs. For a school with more junior staff (often those serving high poverty populations), the real staff costs consume a smaller portion of the school’s budget, leaving more dollars for other purchases. While the concept is gaining attention, the consultants identified only one large urban district (Oakland Unified in California) that is currently requiring schools to use the real cost of its teachers in their budgets.
Merits include more real purchasing power for schools that are unable to attract more senior teachers. Some proponents believe this policy change provides the potential for fundamental shifts in teacher allocation practices within districts.
Challenges include concerns from teacher unions regarding seniority transfer rights and the potential for schools to favor more junior teachers in order to conserve funds.
Application to Washington State – While the state funds districts for the actual salaries of teachers regardless of where they work, making this change from the district to the school level would be a major change in the way districts and schools hire and place teachers—one that would require districts to tackle challenging collective bargaining issues.
9. Provide school-based budgeting authority Under school-based budgeting, districts empower school leaders to make more extensive decisions about how resources are used than they do under traditional budgeting systems. The rationale underlying this option is that resource decisions are best made close to students because school staff are more knowledgeable about student needs. However, there is no agreement on the exact authority that should be shifted to the school. As a result, districts often increase, and experiment with, control of school resources over time. In districts across the country that have increased school-based budgeting authority, implementation differs dramatically from site to site.
Merits include a greater awareness among school leaders and stakeholders of budget constraints and the need for efficiency as budget decisions become an everyday school activity. School-based budgeting can also provide more opportunities for schools to focus their resources on the unique needs of their students.
Challenges include the costs of training needed to build capacity among school leaders to make financial decisions. Maintaining accountability for school spending also becomes more complex when more parties are involved with budget decision making.
Application to Washington State – The consultants found examples of districts in Washington practicing different degrees of school-based budgeting. They note that some school principals want this additional responsibility, while others find it overwhelming. Implementing school-based budgeting in Washington may be complicated by the fact that state funding allocations to districts are based on attendance, which is a variable that changes throughout the school year. This variable makes school-level budgeting difficult because districts cannot guarantee funds for any one site. Additionally, schools will be limited in the scope of staffing decisions because the state can withhold funds if schools fail to meet required staffing ratios.
35
K-12 School Spending and Performance Review
IN SUMMARY States and districts around the country have made changes to their reporting and budgeting practices in order to achieve various education goals. It is important for policymakers and district leaders to identify which goals are most desired, such as increased transparency or accountability, before deciding whether to change current reporting and budgeting processes. Generally, changes to budgeting processes have been initiated by individual districts. Some states as well as districts have made changes to reporting requirements.
Gaining additional information about school-level spending is possible in Washington, but higher levels of detail or uniformity in reporting will come at greater costs. Currently, changes in budgeting are possible at the district level, but staffing ratio requirements, categorical spending restrictions, and collective bargaining agreements limit the amount of discretion schools can have over spending their resources.
36

CHAPTER SEVEN: CONCLUSION STUDY FINDINGS The following findings are based on our review of six case study districts, survey responses from over 200 school districts, and our consultants’ review of alternative approaches to reporting and budgeting school expenditures:
District Budgeting and Decision-Making Practices • Districts allocate money to schools in various ways, but most districts consider student
enrollment as one factor when allocating resources.
• Districts use numerous methods of tracking school spending within their own accounting systems. They code different types of expenditures and different proportions of their budgets to schools so it is not possible to compare school-level spending across districts.
• Once the money is distributed to schools, we also found differences in who has the ultimate authority in deciding how the money is spent: central administrators, school principals, or both. Decision-making in most Washington districts is fairly centralized and principals have limited authority to make spending decisions. Thus, while schools are accountable for their performance, school principals generally have limited spending decision-making authority.
• Districts and schools are using performance data to make budget and programmatic decisions. We found many examples of districts using performance assessment data to review curriculum and teaching practices, and to provide additional assistance to struggling students. However, policymakers would not necessarily be able to look at budget or expenditure reports to see the strategic decisions that administrators have made to improve performance.
Data Availability and Reporting Requirements • The state does not collect spending data from individual schools, even though
schools, along with districts, are accountable for the performance of their students. Information about school spending may not fully show the ways in which schools use performance data to make decisions. However, school spending data could help policymakers understand how K-12 funding is distributed to individual schools and whether spending impacts performance. Policymakers will need to consider the merits and challenges of collecting this data before requiring districts to report it.
• The state already requires numerous fiscal reports from districts. Policymakers should be cautious about adding requirements without first considering streamlining or discontinuing other requirements.
37

K-12 School Spending and Performance Review
Alternative Approaches to Reporting and Budgeting School Expenditures • States and districts around the country are considering other ways of reporting and
budgeting school-level spending to address various goals, such as increasing accountability and transparency of decision making, and linking performance and spending.
• Generally, budgeting changes are initiated by individual districts, but districts and states have made reporting changes. Some states are now requiring districts to report more information on school spending.
• Gaining additional information about school spending is possible in Washington, but higher levels of detail or uniformity in reporting will come at greater costs. Currently, changes in budgeting are possible at the district level, but staffing ratio requirements, categorical spending restrictions, and collective bargaining agreements limit the amount of discretion schools have over spending their resources.
CONCLUSION Discussions about school spending and performance continue to be the subject of much debate in Washington. Although state and national education reform efforts hold schools increasingly accountable for the achievement of their students, Washington only collects expenditure data from school districts, not individual schools. This study identifies the benefits and challenges of collecting school-level expenditure information. It highlights some of the differences in how school finances are currently accounted for among districts. It also explains that school principals generally have limited influence over their budgets.
Before beginning any effort at changing district reporting or budgeting requirements, the Legislature should consider the following:
• What the state’s role should be in school-level finance given that state law dictates that the state allocation formula “…shall be for state allocation and equalization purposes only and shall not be construed as mandating specific operational functions of local school districts….”;23
• How policymakers would use additional financial data to answer questions about school performance; and
• Whether the usefulness of school-level spending data would justify the costs of collecting and analyzing it.
AGENCY RESPONSES Responses from the Office of the Superintendent of Public Instruction (OSPI) and the Office of Financial Management (OFM) are included in Appendix 2.
23 RCW 28A.150.260.
38
K-12 School Spending and Performance Review
ACKNOWLEDGEMENTS We would like to thank the school districts that responded to our online survey. We also gratefully acknowledge the assistance of the administrators, principals, and board members of the six case study districts for sharing their time and detailed information about their practices.
We would also like to thank OSPI staff for their assistance with the study.
Finally, we appreciate the assistance provided by Marguerite Roza, Claudine Swartz, and Jennifer Harris.
Ruta Fanning Legislative Auditor This report was provided to members of the Joint Legislative Audit and Review Committee at its October 18, 2005, meeting. Because the Committee did not have a quorum at the October 18th meeting, a formal vote to approve the report for distribution was delayed until the Committee’s November 30, 2005, meeting. On November 30, 2005, this report was approved for distribution by the Joint Legislative Audit and Review Committee. Representative Ross Hunter Chair
COMMITTEE ADDENDUM ON K-12 SCHOOL SPENDING AND PERFORMANCE REVIEW REPORT: The Joint Legislative Audit and Review Committee recognizes there are significant costs and implementation challenges to develop a reporting system that would collect uniform and reliable school level spending information from all local school districts. However, the Committee also believes that assessing how instructional resources and policy choices impact student learning outcomes is an important constitutional duty of the state. Therefore, the Committee recommends JLARC add a future study to our work plan, which would, in conjunction with the Governor’s Washington Learns initiative, and with representatives from local school districts and boards, identify critical school performance data that would enhance both the Legislature’s and districts’ ability to make informed resource commitments. The study would also address related changes to information systems and accounting practices.
39

K-12 School Spending and Performance Review
40

APPENDIX 1: SCOPE AND OBJECTIVES
School-Level Spending and
Performance Review
SCOPE AND OBJECTIVES
MARCH 2005
STATE OF WASHINGTON
JOINT LEGISLATIVE AUDIT AND REVIEW COMMITTEE
STUDY TEAM HEATHER MOSS
STEPHANIE HOFFMAN
LISA JEREMIAH Analysts
LEGISLATIVE AUDITOR
CINDI YATES
Joint Legislative Audit & Review Committee
506 16th Avenue SE Olympia, WA 98501-2323
(360) 786-5171 (360) 786-5180 Fax
Website: http://jlarc.leg.wa.gov e-mail: [email protected]
BACKGROUND
As part of its 2003-05 Work Plan, JLARC initiated this study of school-level spending and performance measures within the K-12 education system. This study is coming at a time when schools are increasingly held responsible for the achievement of their students. Yet, it is the school districts, and not individual schools, that report expenditure data to the state. Because district reported expenditure data does not link directly to school-level performance data, JLARC will review the availability and utility of expenditure data at the individual school-level.
K-12 EDUCATION BUDGET
The state K-12 system provides public education to over one million students. In the 2003-05 biennium, K-12 public schools received $10.6 billion in state funding.
The following chart shows that 88 percent of state K-12 funding goes to what the Legislature has defined as basic education: general apportionment, special education, transportation, Learning Assistance Program, transitional bilingual instruction, and institutional education. The remaining 12 percent covers expenses such as school food services, levy equalization, and Student Achievement Fund for I-728 distributions.
State Funding for K-12 Education (2003-05)
Special Education($862 mil)
Learning Assistance
Program($127 mil)
General Apportionment
($7.7 bil)
Other($1.3 bil)
Transportation($434 mil)
Institutions($36 mil)
Bilingual($105 mil)
Basic Education Non-Basic Education
Source: Overview of K-12 Budget Issues, 2005 Session, Senate Ways and Means Committee Staff.
41
K-12 School Spending and Performance Review
PREVIOUS JLARC WORK ON K-12 FINANCE
In 1999, JLARC issued a K-12 Finance and Student Performance Study that focused on four main issue areas: revenue and expenditure patterns, student and staff patterns, factors affecting student performance, and various data availability issues. Key findings were that revenue allocation to school districts is equitable, that districts tend to spend the funds they receive in the same way, and that external factors such as family income have more influence on student performance than education-related factors such as class size.
STUDY SCOPE
This study is designed to build upon JLARC’s 1999 review by taking a closer look at school-level expenditures. This study will look at how the state’s school districts distribute money to individual schools. It will also focus on school-level spending and will review the key measures used to assess overall school performance.
OBJECTIVES
This study will review school-level expenditures and performance measures by answering the following questions: (1) What processes do districts use to distribute funds to schools?
(2) What school-level enrollment and expenditure data is available?
(3) What measures are used to track student achievement and school performance?
(4) How valuable is school-level enrollment and expenditure data in understanding school performance?
(5) What are the national trends in school-based or student-based budgeting and how might these be applied in Washington?
METHODOLOGY
This study will include a statewide survey of all 296 school districts in order to understand basic distribution methods. We will also examine more specific school-level expenditures and performance measures for a few case studies of individual school districts. Finally, JLARC plans to hire a consultant familiar with the K-12 finance field who can identify national trends in school-based or student-based finance and look at their applicability to Washington.
Timeframe for the Study
Staff will present its preliminary report at the JLARC meeting in August 2005. The final report will be presented in September 2005.
JLARC Staff Contacts for the Study Heather Moss (360) 786-5174 [email protected] Stephanie Hoffman (360) 786-5176 [email protected] Lisa Jeremiah (360) 786-5293 [email protected]
42

APPENDIX 2: AGENCY RESPONSES
• Office of Superintendent of Public Instruction (OSPI)
• Office of Financial Management (OFM)
43
K-12 School Spending and Performance Review
44


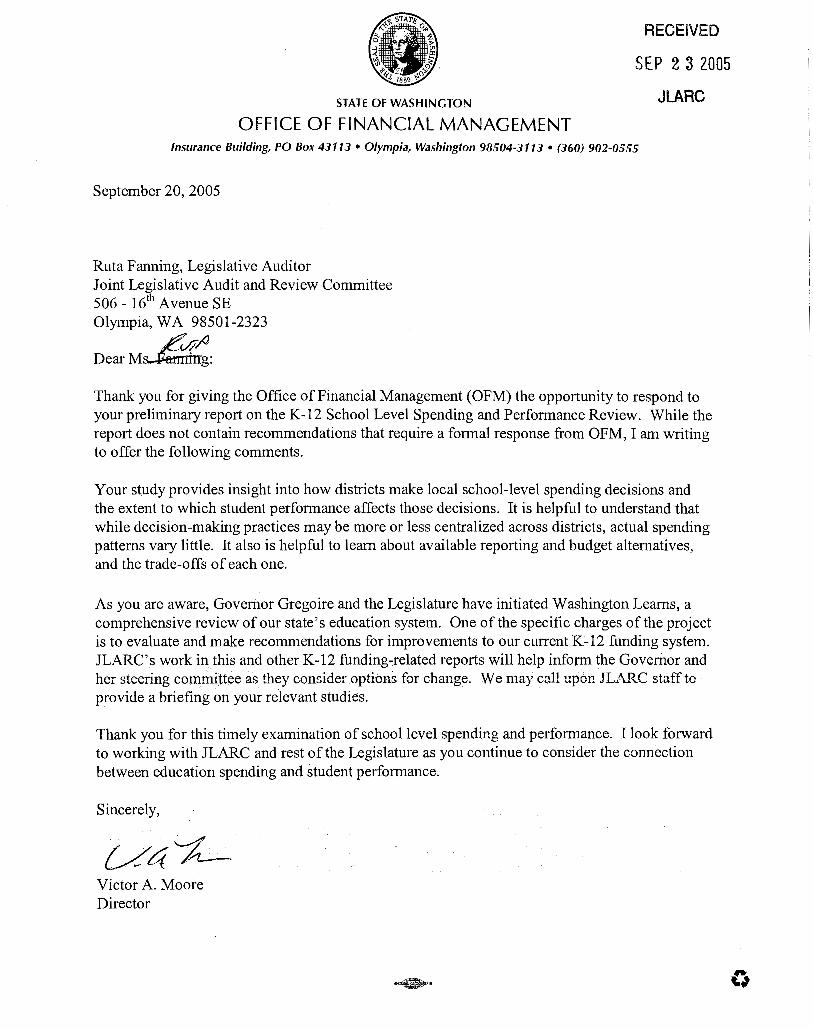

K-12 School Spending and Performance Review
48
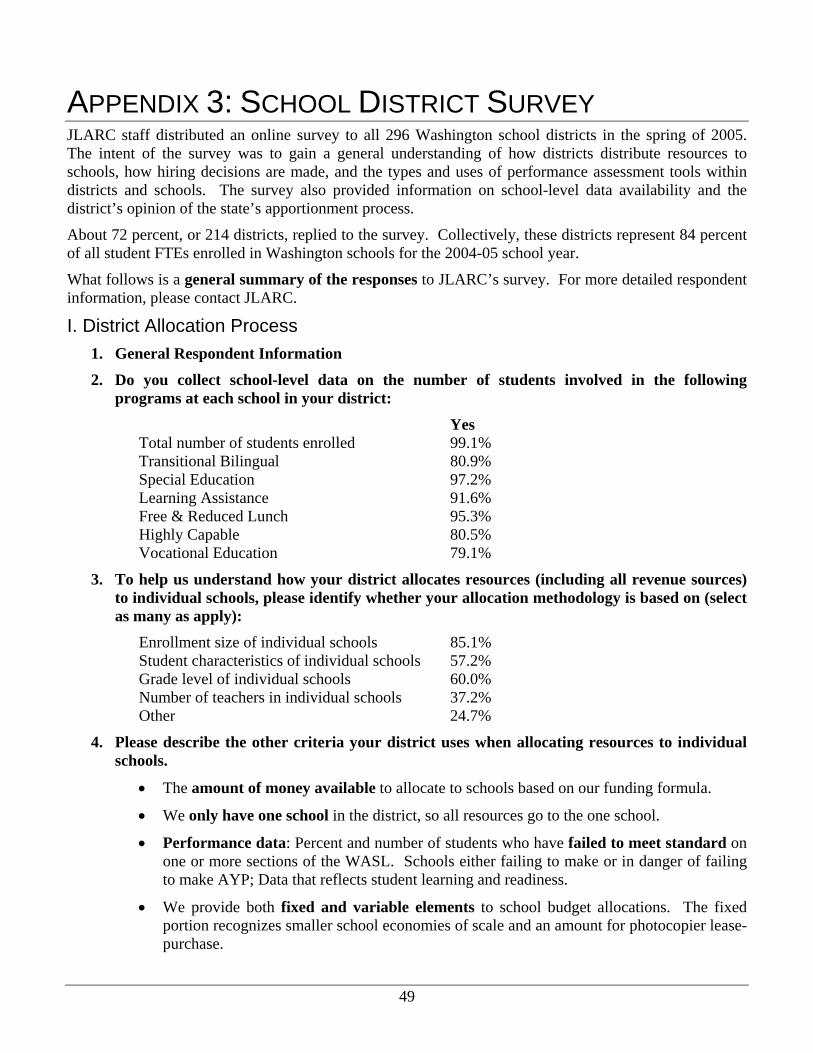
49
APPENDIX 3: SCHOOL DISTRICT SURVEY JLARC staff distributed an online survey to all 296 Washington school districts in the spring of 2005. The intent of the survey was to gain a general understanding of how districts distribute resources to schools, how hiring decisions are made, and the types and uses of performance assessment tools within districts and schools. The survey also provided information on school-level data availability and the district’s opinion of the state’s apportionment process.
About 72 percent, or 214 districts, replied to the survey. Collectively, these districts represent 84 percent of all student FTEs enrolled in Washington schools for the 2004-05 school year.
What follows is a general summary of the responses to JLARC’s survey. For more detailed respondent information, please contact JLARC.
I. District Allocation Process 1. General Respondent Information
2. Do you collect school-level data on the number of students involved in the following programs at each school in your district:
Yes Total number of students enrolled 99.1% Transitional Bilingual 80.9% Special Education 97.2% Learning Assistance 91.6% Free & Reduced Lunch 95.3% Highly Capable 80.5% Vocational Education 79.1%
3. To help us understand how your district allocates resources (including all revenue sources) to individual schools, please identify whether your allocation methodology is based on (select as many as apply):
Enrollment size of individual schools 85.1% Student characteristics of individual schools 57.2% Grade level of individual schools 60.0% Number of teachers in individual schools 37.2% Other 24.7%
4. Please describe the other criteria your district uses when allocating resources to individual schools.
• The amount of money available to allocate to schools based on our funding formula.
• We only have one school in the district, so all resources go to the one school.
• Performance data: Percent and number of students who have failed to meet standard on one or more sections of the WASL. Schools either failing to make or in danger of failing to make AYP; Data that reflects student learning and readiness.
• We provide both fixed and variable elements to school budget allocations. The fixed portion recognizes smaller school economies of scale and an amount for photocopier lease-purchase.

K-12 School Spending and Performance Review
50
• The district will be starting a strategic plan process which will help give a focused expenditure plan.
• Prioritize needs across schools, including taking into account staff experience, student needs, class size, courses needed, special projects, and building needs (maintenance and repair); Special requests of principals or teachers are considered.
• Type of schools: Alternative high school gets a higher allocation than comprehensive high schools.
• Special needs (equipment, resources, professional development) expressed by staff in a survey conducted prior to budget development.
• Consider actual level of expenditures in the current school year when budgeting for the next.
• Location of special programs.
• Resources are allocated based on the needs and expectations of the district’s stakeholders (e.g., levy dollars allocated to fine arts, extra-curricular, and vocational programs above and beyond our state apportionment dollars).
• Student achievement indicators - Student test score performance and AYP status (e.g., WASL scores and classroom based assessment data).
• We use student need as our criteria with parent and teacher input.
• School Improvement Program funds are allocated based on test scores.
• Resources may be allocated to support activities in a school's learning improvement plan.
• Beginning in 2005-06, an added allocation will be provided for each vocational FTE student.
• Unique facilities (for example, shared theater space used by multiple schools) or unique programs (for example, International Baccalaureate).
• Variation across buildings maybe due to differences in amount of carryover from previous year or bargained allocations for specialists that may vary by building.
• Continuation of current programs showing success.
• District-wide plans influence allocations—Technology Plan, Facility Maintenance plan, school improvement plans, and strategic planning goals.
• Rules specific to individual grant awards (PTA, federal, private, etc.).
• Size of schools—special weighting factor for a very small elementary and for a remote and necessary school program.
5. Who usually has the ultimate authority for making decisions concerning the following? District Administrators Principals Whether to hire an additional teacher 95.8% 4.2% What education and experience level to hire at 54.4% 45.6% Which teacher candidate is offered a position 49.8% 50.2% Whether non-state mandated performance assessments are used 74.0% 26.0% How many/what type of classified staff are employed at each school 88.8% 11.2%
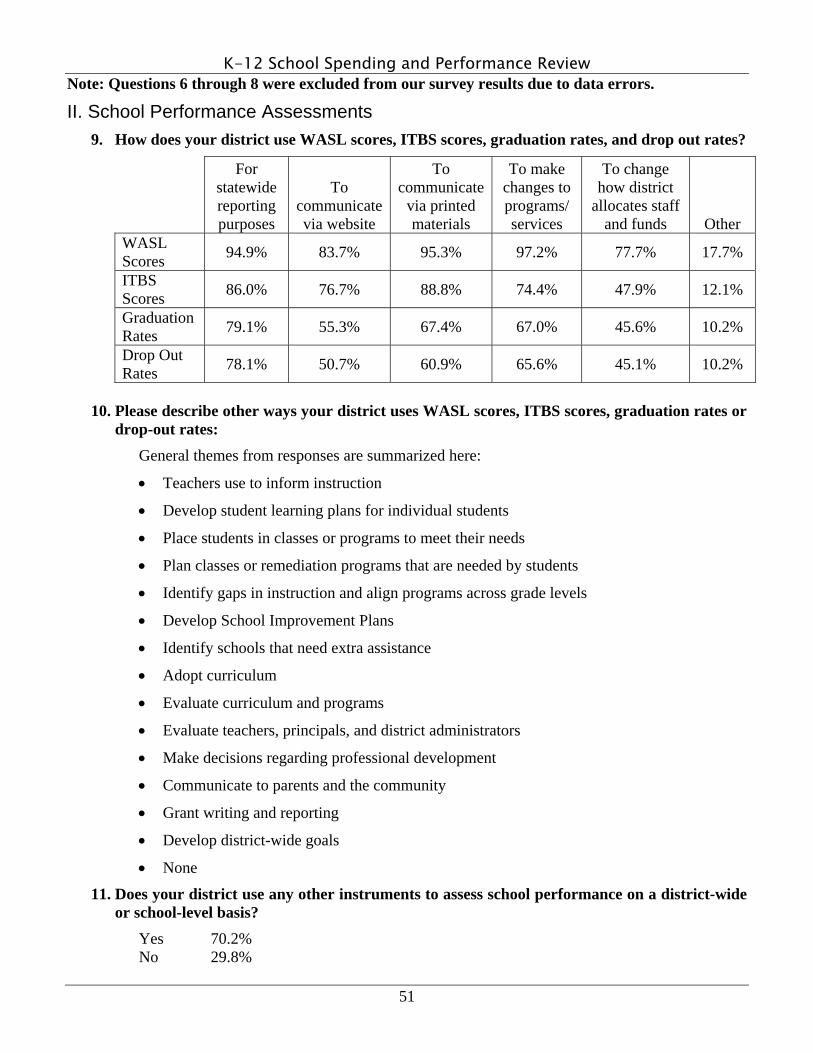
K-12 School Spending and Performance Review
51
Note: Questions 6 through 8 were excluded from our survey results due to data errors.
II. School Performance Assessments 9. How does your district use WASL scores, ITBS scores, graduation rates, and drop out rates?
For statewide reporting purposes
To communicate via website
To communicate
via printed materials
To make changes to programs/ services
To change how district
allocates staff and funds Other
WASL Scores 94.9% 83.7% 95.3% 97.2% 77.7% 17.7%
ITBS Scores 86.0% 76.7% 88.8% 74.4% 47.9% 12.1%
Graduation Rates 79.1% 55.3% 67.4% 67.0% 45.6% 10.2%
Drop Out Rates 78.1% 50.7% 60.9% 65.6% 45.1% 10.2%
10. Please describe other ways your district uses WASL scores, ITBS scores, graduation rates or
drop-out rates:
General themes from responses are summarized here:
• Teachers use to inform instruction
• Develop student learning plans for individual students
• Place students in classes or programs to meet their needs
• Plan classes or remediation programs that are needed by students
• Identify gaps in instruction and align programs across grade levels
• Develop School Improvement Plans
• Identify schools that need extra assistance
• Adopt curriculum
• Evaluate curriculum and programs
• Evaluate teachers, principals, and district administrators
• Make decisions regarding professional development
• Communicate to parents and the community
• Grant writing and reporting
• Develop district-wide goals
• None
11. Does your district use any other instruments to assess school performance on a district-wide or school-level basis?
Yes 70.2% No 29.8%
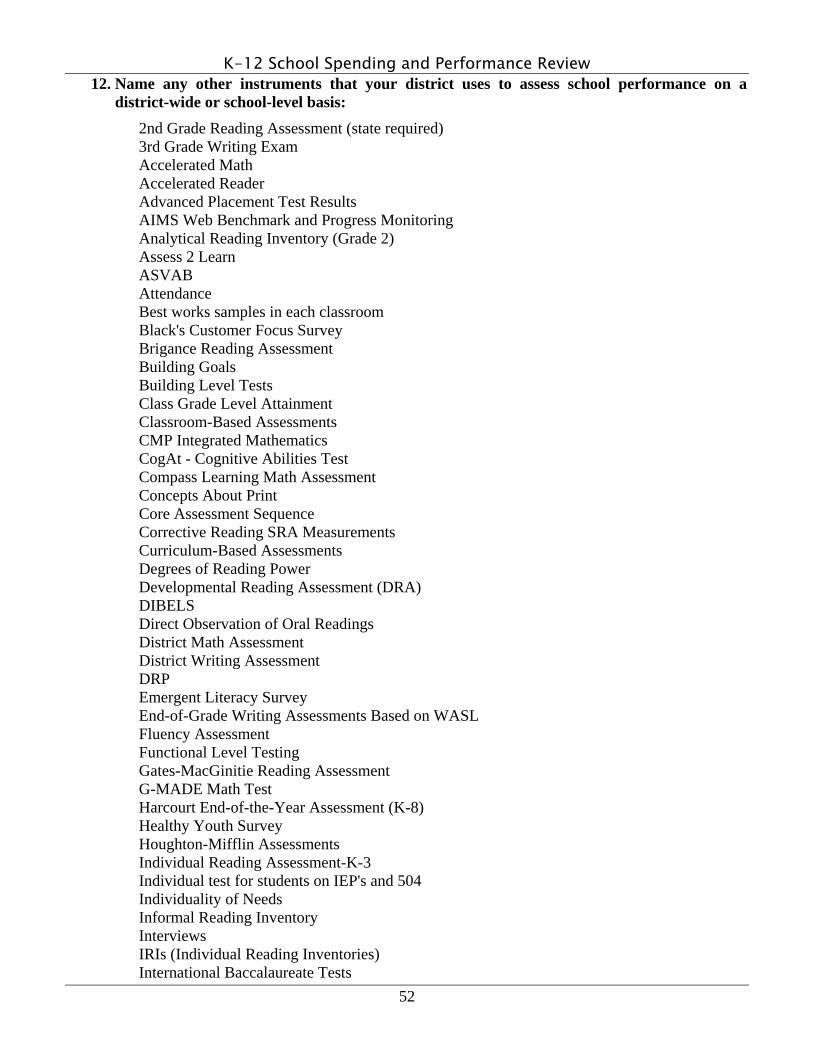
K-12 School Spending and Performance Review
52
12. Name any other instruments that your district uses to assess school performance on a district-wide or school-level basis:
2nd Grade Reading Assessment (state required) 3rd Grade Writing Exam Accelerated Math Accelerated Reader Advanced Placement Test Results AIMS Web Benchmark and Progress Monitoring Analytical Reading Inventory (Grade 2) Assess 2 Learn ASVAB Attendance Best works samples in each classroom Black's Customer Focus Survey Brigance Reading Assessment Building Goals Building Level Tests Class Grade Level Attainment Classroom-Based Assessments CMP Integrated Mathematics CogAt - Cognitive Abilities Test Compass Learning Math Assessment Concepts About Print Core Assessment Sequence Corrective Reading SRA Measurements Curriculum-Based Assessments Degrees of Reading Power Developmental Reading Assessment (DRA) DIBELS Direct Observation of Oral Readings District Math Assessment District Writing Assessment DRP Emergent Literacy Survey End-of-Grade Writing Assessments Based on WASL Fluency Assessment Functional Level Testing Gates-MacGinitie Reading Assessment G-MADE Math Test Harcourt End-of-the-Year Assessment (K-8) Healthy Youth Survey Houghton-Mifflin Assessments Individual Reading Assessment-K-3 Individual test for students on IEP's and 504 Individuality of Needs Informal Reading Inventory Interviews IRIs (Individual Reading Inventories) International Baccalaureate Tests
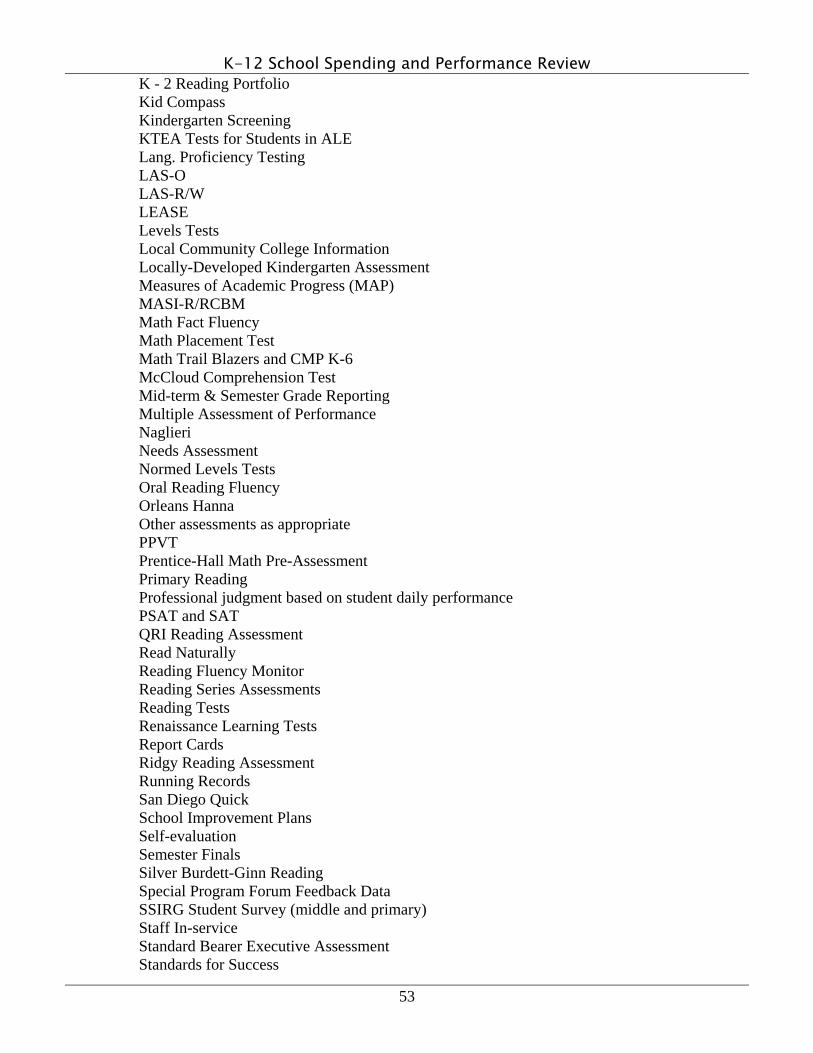
K-12 School Spending and Performance Review
53
K - 2 Reading Portfolio Kid Compass Kindergarten Screening KTEA Tests for Students in ALE Lang. Proficiency Testing LAS-O LAS-R/W LEASE Levels Tests Local Community College Information Locally-Developed Kindergarten Assessment Measures of Academic Progress (MAP) MASI-R/RCBM Math Fact Fluency Math Placement Test Math Trail Blazers and CMP K-6 McCloud Comprehension Test Mid-term & Semester Grade Reporting Multiple Assessment of Performance Naglieri Needs Assessment Normed Levels Tests Oral Reading Fluency Orleans Hanna Other assessments as appropriate PPVT Prentice-Hall Math Pre-Assessment Primary Reading Professional judgment based on student daily performance PSAT and SAT QRI Reading Assessment Read Naturally Reading Fluency Monitor Reading Series Assessments Reading Tests Renaissance Learning Tests Report Cards Ridgy Reading Assessment Running Records San Diego Quick School Improvement Plans Self-evaluation Semester Finals Silver Burdett-Ginn Reading Special Program Forum Feedback Data SSIRG Student Survey (middle and primary) Staff In-service Standard Bearer Executive Assessment Standards for Success

K-12 School Spending and Performance Review
54
Standards Master Stanford Achievement Test STAR Reading and Math Step Up to Writing Student Classroom Grades Student Portfolios Student Report Cards Success For All Surveys - Community Surveys - General Surveys - Graduate Surveys - Parent Surveys - Staff Surveys - Student Teacher-Developed Assessments Tech Assessment Technology Plans TERRA NOVA Test Texas Primary Reading Inventory (TPRI) TIMMS Assessment - Michigan State Unit Assessments in Math WA Language Proficiency Test (WLPT) WAAS WALT Washington Microsystems Assessment Woodcock-Johnson III Write From the Beginning Writing Assessments
13-17. Please provide a description of the instrument, its primary use and how it is funded: Contact JLARC for summary of the responses to these questions.
18. Does your district have information systems that track school performance and/or outcome goals?
Have Systems 60.0% Do not Have Systems 40.0%
19. Are your information systems that track school performance and/or outcome goals linked to any budgetary or expenditure data?
Linked 23.3% Not Linked 76.7%
20. Is your district involved in developing School Improvement Plans?
Not at all, or very little 0.9% In an advisory role 5.6% Active participant in developing plan 65.1% Approve finalized plan 28.4%

K-12 School Spending and Performance Review
55
21. Does your district receive any of the following types of funds specifically intended to improve student achievement at low-performing schools? (select all that apply)
Federal 54.9% State 57.7% Local 24.2% Private 12.1% None of the Above 40.0%
22. How does your district manage funds that are specifically intended for improving student achievement at low-performing schools?
Allocated directly to schools 4.6% Managed by the district 17.7% Both 77.7%
III. State Apportionment Process 23. What do you consider to be the strengths of the state’s current apportionment process?
General themes from responses are summarized here:
• Payments are reliable, consistent, accurate, predictable, and never late.
o Current system provides consistent process to make relatively accurate budget projections and decisions as long as enrollment projections are accurate—can accurately predict apportionment revenues each month.
• Equity: provides a base-level equity among school districts while providing additive resources for special populations and needs (i.e., takes into account socioeconomic demographics of district).
o Somewhat responsive to individual district needs. o The small schools formula sets a funding floor for small schools, enabling rural
schools to offer comprehensive programs (remote and necessary schools formula). o LAP funding meets needs of low-performing students (apportionment based on
enrollment with some consideration for poverty).
• Levy equalization o Levy lid prevents over reliance on local fundraising which helps prevent excessive
inequalities across districts. o However levy equalization funding is diminishing through cuts and recalculations.
• Apportionment based on monthly enrollment rather than average daily attendance (have to pay teachers regardless of whether kids are present or absent).
o Like fact that enrollment and LEAP factors are updated monthly. o Like fact that apportionment not based on highly variable factors.
• Fairness of staff mix formula o Statewide salary schedule better than each district competing on pay—(many
districts said LEAP salary schedule is good for certificated teaching staff but LEAP schedules for classified and administrative staff are in need of major adjustment).
o Not penalized or helped b/c of training or experience of staff and districts treated equally. Districts are reimbursed for teachers’ placement on a statewide salary
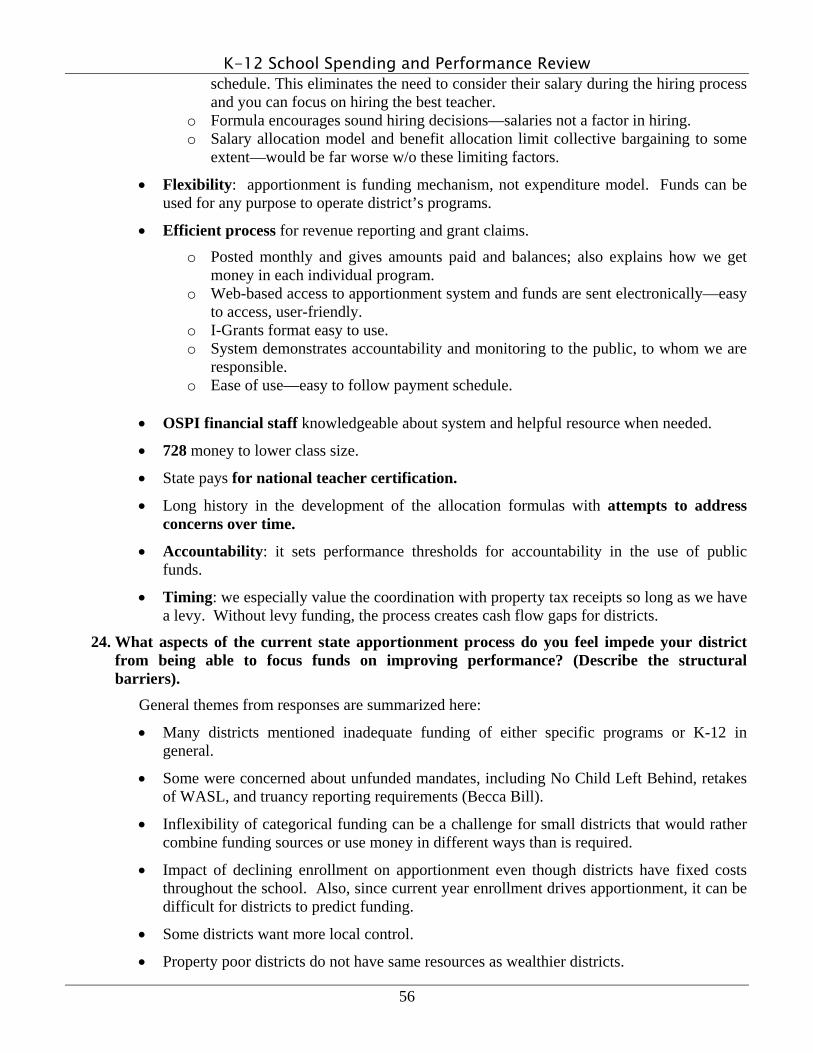
K-12 School Spending and Performance Review
56
schedule. This eliminates the need to consider their salary during the hiring process and you can focus on hiring the best teacher.
o Formula encourages sound hiring decisions—salaries not a factor in hiring. o Salary allocation model and benefit allocation limit collective bargaining to some
extent—would be far worse w/o these limiting factors.
• Flexibility: apportionment is funding mechanism, not expenditure model. Funds can be used for any purpose to operate district’s programs.
• Efficient process for revenue reporting and grant claims.
o Posted monthly and gives amounts paid and balances; also explains how we get money in each individual program.
o Web-based access to apportionment system and funds are sent electronically—easy to access, user-friendly.
o I-Grants format easy to use. o System demonstrates accountability and monitoring to the public, to whom we are
responsible. o Ease of use—easy to follow payment schedule.
• OSPI financial staff knowledgeable about system and helpful resource when needed.
• 728 money to lower class size.
• State pays for national teacher certification.
• Long history in the development of the allocation formulas with attempts to address concerns over time.
• Accountability: it sets performance thresholds for accountability in the use of public funds.
• Timing: we especially value the coordination with property tax receipts so long as we have a levy. Without levy funding, the process creates cash flow gaps for districts.
24. What aspects of the current state apportionment process do you feel impede your district from being able to focus funds on improving performance? (Describe the structural barriers).
General themes from responses are summarized here:
• Many districts mentioned inadequate funding of either specific programs or K-12 in general.
• Some were concerned about unfunded mandates, including No Child Left Behind, retakes of WASL, and truancy reporting requirements (Becca Bill).
• Inflexibility of categorical funding can be a challenge for small districts that would rather combine funding sources or use money in different ways than is required.
• Impact of declining enrollment on apportionment even though districts have fixed costs throughout the school. Also, since current year enrollment drives apportionment, it can be difficult for districts to predict funding.
• Some districts want more local control.
• Property poor districts do not have same resources as wealthier districts.

K-12 School Spending and Performance Review
57
• Too many reporting requirements.
• Federal funding can reduce state apportionment.
• Apportionment process is complex.
• Accountability requirements require shifting resources away from other programs.
• Accountability requirements do not align with financing process.
• Collective bargaining.
25. The space below is provided for any additional comments you wish to make regarding your district's allocation process, performance assessments, or the state apportionment process.
Contact JLARC for summary of the responses to this question.

K-12 School Spending and Performance Review
58
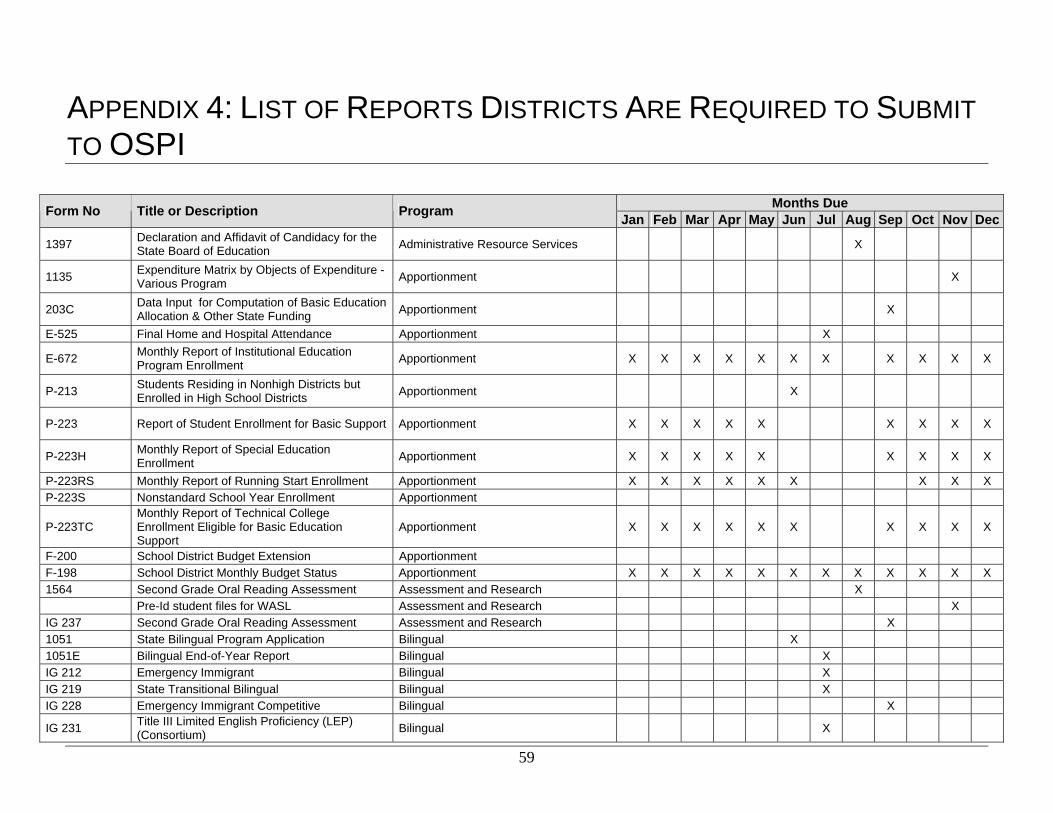
59
APPENDIX 4: LIST OF REPORTS DISTRICTS ARE REQUIRED TO SUBMIT TO OSPI
Months Due Form No Title or Description Program Jan Feb Mar Apr May Jun Jul Aug Sep Oct Nov Dec
1397 Declaration and Affidavit of Candidacy for the State Board of Education Administrative Resource Services X
1135 Expenditure Matrix by Objects of Expenditure -Various Program Apportionment X
203C Data Input for Computation of Basic Education Allocation & Other State Funding Apportionment X
E-525 Final Home and Hospital Attendance Apportionment X
E-672 Monthly Report of Institutional Education Program Enrollment Apportionment X X X X X X X X X X X
P-213 Students Residing in Nonhigh Districts but Enrolled in High School Districts Apportionment X
P-223 Report of Student Enrollment for Basic Support Apportionment X X X X X X X X X
P-223H Monthly Report of Special Education Enrollment Apportionment X X X X X X X X X
P-223RS Monthly Report of Running Start Enrollment Apportionment X X X X X X X X X P-223S Nonstandard School Year Enrollment Apportionment
P-223TC Monthly Report of Technical College Enrollment Eligible for Basic Education Support
Apportionment X X X X X X X X X X
F-200 School District Budget Extension Apportionment F-198 School District Monthly Budget Status Apportionment X X X X X X X X X X X X 1564 Second Grade Oral Reading Assessment Assessment and Research X Pre-Id student files for WASL Assessment and Research X IG 237 Second Grade Oral Reading Assessment Assessment and Research X 1051 State Bilingual Program Application Bilingual X 1051E Bilingual End-of-Year Report Bilingual X IG 212 Emergency Immigrant Bilingual X IG 219 State Transitional Bilingual Bilingual X IG 228 Emergency Immigrant Competitive Bilingual X
IG 231 Title III Limited English Proficiency (LEP) (Consortium) Bilingual X
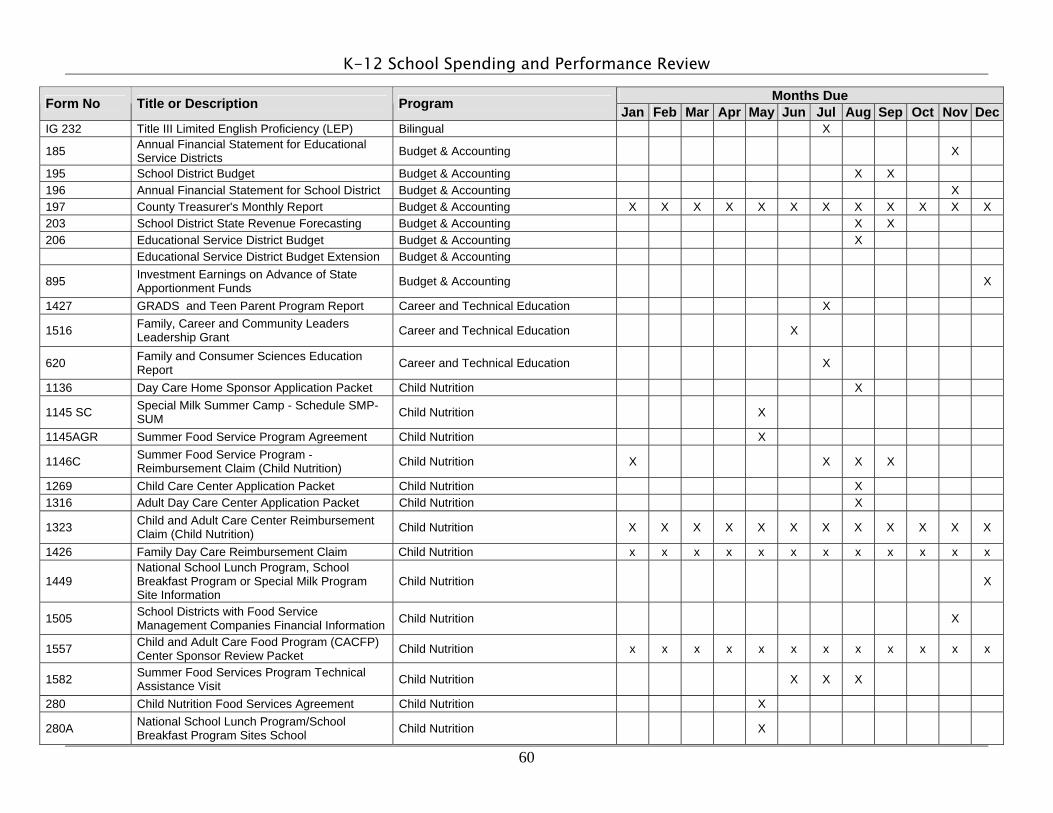
K-12 School Spending and Performance Review
60
Months Due Form No Title or Description Program Jan Feb Mar Apr May Jun Jul Aug Sep Oct Nov Dec IG 232 Title III Limited English Proficiency (LEP) Bilingual X
185 Annual Financial Statement for Educational Service Districts Budget & Accounting X
195 School District Budget Budget & Accounting X X 196 Annual Financial Statement for School District Budget & Accounting X 197 County Treasurer's Monthly Report Budget & Accounting X X X X X X X X X X X X 203 School District State Revenue Forecasting Budget & Accounting X X 206 Educational Service District Budget Budget & Accounting X Educational Service District Budget Extension Budget & Accounting
895 Investment Earnings on Advance of State Apportionment Funds Budget & Accounting X
1427 GRADS and Teen Parent Program Report Career and Technical Education X
1516 Family, Career and Community Leaders Leadership Grant Career and Technical Education X
620 Family and Consumer Sciences Education Report Career and Technical Education X
1136 Day Care Home Sponsor Application Packet Child Nutrition X
1145 SC Special Milk Summer Camp - Schedule SMP-SUM Child Nutrition X
1145AGR Summer Food Service Program Agreement Child Nutrition X
1146C Summer Food Service Program - Reimbursement Claim (Child Nutrition) Child Nutrition X X X X
1269 Child Care Center Application Packet Child Nutrition X 1316 Adult Day Care Center Application Packet Child Nutrition X
1323 Child and Adult Care Center Reimbursement Claim (Child Nutrition) Child Nutrition X X X X X X X X X X X X
1426 Family Day Care Reimbursement Claim Child Nutrition x x x x x x x x x x x x
1449 National School Lunch Program, School Breakfast Program or Special Milk Program Site Information
Child Nutrition X
1505 School Districts with Food Service Management Companies Financial Information Child Nutrition X
1557 Child and Adult Care Food Program (CACFP) Center Sponsor Review Packet Child Nutrition x x x x x x x x x x x x
1582 Summer Food Services Program Technical Assistance Visit Child Nutrition X X X
280 Child Nutrition Food Services Agreement Child Nutrition X
280A National School Lunch Program/School Breakfast Program Sites School Child Nutrition X

K-12 School Spending and Performance Review
61
Months Due Form No Title or Description Program Jan Feb Mar Apr May Jun Jul Aug Sep Oct Nov Dec
280B Special Milk Program Site Information - Schedule SMP Child Nutrition X
280C-1 Policy Statement and Meals/Milk Counting and Collection Procedure - POL-1 Child Nutrition X
280C-2 Student Income Policy Statement - RCCI- POL-2 Child Nutrition X
280D Severe Need Breakfast Application - Schedule SNB Child Nutrition X
280E Food Distribution Program Application - Schedule FDP Child Nutrition X
280F-1 Certification Regarding Child Nutrition Program Lobbying Child Nutrition X
280F-2 Certification Regarding Lobbying Child Nutrition X 280F-EXH-VII Disclosure of Lobbying Activities Child Nutrition X 280REN Child Nutrition Programs Agreement Checklist Child Nutrition X 280SM Special Milk Program Agreement - Summer Child Nutrition X 283a Funding Disclosure Report Child Nutrition X
305 Special Milk Program Claim For Reimbursement (Child Nutrition) Child Nutrition X X X X X X X X X X X X
398 School Lunch and Breakfast Program Claim for Reimbursement (Child Nutrition) Child Nutrition X X X X X X X X X X X X
887 Severe Need Breakfast Program Claim (Child Nutrition) Child Nutrition X
1552 Second Grade Oral Reading Assessment Materials Grant Application Curriculum and Instruction X
1556 Washington Reading Corps Grant Award Agreement Curriculum and Instruction X
4702 Application for Teacher Exchange with Australia Curriculum and Instruction X
1485 Sequenced Transition to Education in Public Schools (STEPS) Team Application Early Childhood Education X X X
IG 203 Title 1 Part B Even Start Family Literacy Continuing Early Childhood Education X
472E Educational Clinic Certificated Personnel Report Education Centers X
791B Education Center Annual Assurance of Compliance Education Centers X
P-105C Home-Based Student Annual Report Education Centers X X

K-12 School Spending and Performance Review
62
Months Due Form No Title or Description Program Jan Feb Mar Apr May Jun Jul Aug Sep Oct Nov Dec 1302A/B Report on Unexcused Absences (Truancy) Enrollment X P-105A School Enrollment Report (Minority) - Public Enrollment X P-210 Graduate and Dropout Statistics Enrollment X 1208B Desegregation Plan Brief Equity Education X X 1221A Chapter 28A.640 Assurance Form Equity Education X
1457 Equity Education Athletic Certification Reporting Equity Education X
1461 Equity Education Worksheets for Collecting Participation Data in Schools Equity Education X
785 Affirmative Action Equity Education X
1569 Certification of Constitutionally Protected Prayer Federal Programs X
IG 200 Consolidated Program Review Federal Programs X
IG 225 Title VI Flexibility and Accountability (Rural Education Achievement Program - REAP) Federal Programs X
IG 226 Consolidation of Funds for Local Education Agencies Federal Programs X
IG 235 Title II Part D Enhancing Education Through Technology (Consortium Forms) Federal Programs X
IG 236 Title II Part D Enhancing Education Through Technology Federal Programs X
IG 262 Rural and Low-Income School Grant Federal Programs X
AP Advanced Placement (AP) Fee Reimbursement Federal Programs X
AP Advanced Placement (AP) Incentive & Progress Report Federal Programs X
AP Competitive Application Federal Programs
Community Higher Education & Schools Partnership Federal Programs X
Community Higher Education & Schools Partnership End-of-Year Report Federal Programs X
1018B Highly Capable Student End-of-Year Report Gifted Education X
1144 Robert C. Byrd Honors Scholarship Application Gifted Education X X
1202 Robert C. Byrd Scholarship Recipient Gifted Education X X IG 217 Highly Capable Students Program Gifted Education X IG 250 Highly Capable End of Year Report Gifted Education X
1507 Final Assessment of District Student Health Services Health Services X
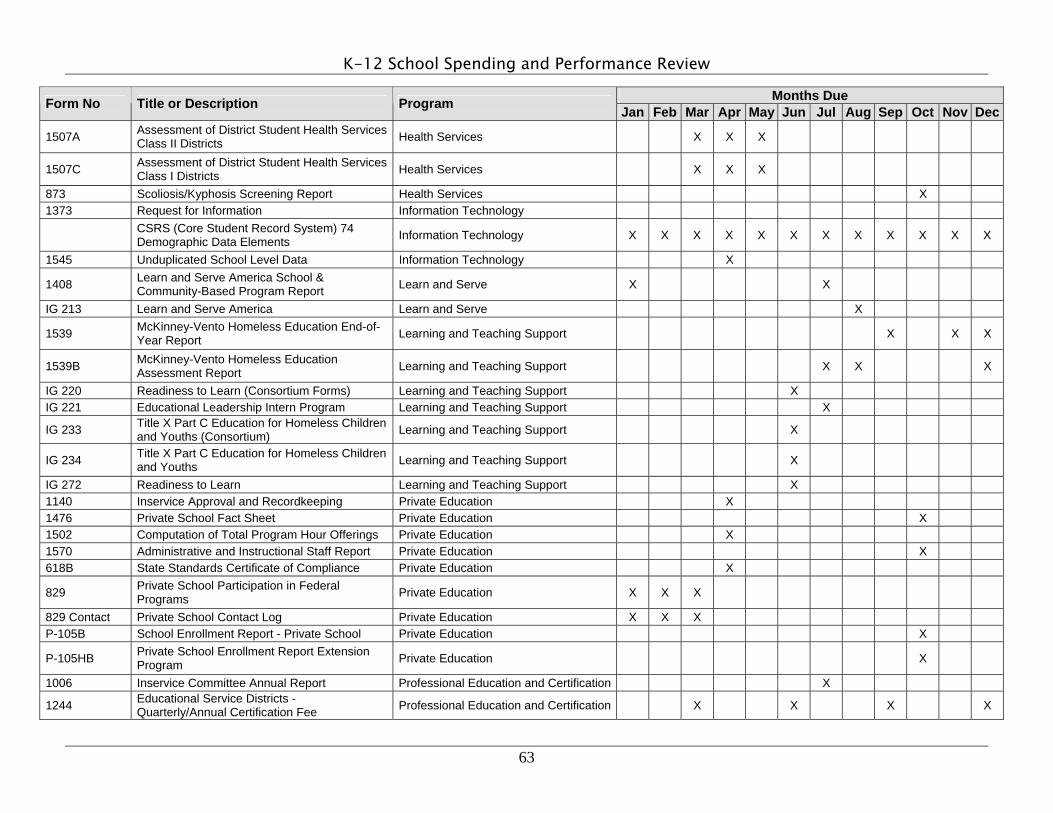
K-12 School Spending and Performance Review
63
Months Due Form No Title or Description Program Jan Feb Mar Apr May Jun Jul Aug Sep Oct Nov Dec
1507A Assessment of District Student Health Services Class II Districts Health Services X X X
1507C Assessment of District Student Health Services Class I Districts Health Services X X X
873 Scoliosis/Kyphosis Screening Report Health Services X 1373 Request for Information Information Technology
CSRS (Core Student Record System) 74 Demographic Data Elements Information Technology X X X X X X X X X X X X
1545 Unduplicated School Level Data Information Technology X
1408 Learn and Serve America School & Community-Based Program Report Learn and Serve X X
IG 213 Learn and Serve America Learn and Serve X
1539 McKinney-Vento Homeless Education End-of-Year Report Learning and Teaching Support X X X
1539B McKinney-Vento Homeless Education Assessment Report Learning and Teaching Support X X X
IG 220 Readiness to Learn (Consortium Forms) Learning and Teaching Support X IG 221 Educational Leadership Intern Program Learning and Teaching Support X
IG 233 Title X Part C Education for Homeless Children and Youths (Consortium) Learning and Teaching Support X
IG 234 Title X Part C Education for Homeless Children and Youths Learning and Teaching Support X
IG 272 Readiness to Learn Learning and Teaching Support X 1140 Inservice Approval and Recordkeeping Private Education X 1476 Private School Fact Sheet Private Education X 1502 Computation of Total Program Hour Offerings Private Education X 1570 Administrative and Instructional Staff Report Private Education X 618B State Standards Certificate of Compliance Private Education X
829 Private School Participation in Federal Programs Private Education X X X
829 Contact Private School Contact Log Private Education X X X P-105B School Enrollment Report - Private School Private Education X
P-105HB Private School Enrollment Report Extension Program Private Education X
1006 Inservice Committee Annual Report Professional Education and Certification X
1244 Educational Service Districts - Quarterly/Annual Certification Fee Professional Education and Certification X X X X

K-12 School Spending and Performance Review
64
Months Due Form No Title or Description Program Jan Feb Mar Apr May Jun Jul Aug Sep Oct Nov Dec
1520 Special Project Grant to Support Pre-Certification Program Activities Professional Education and Certification X
1804 Annual Assurance of Compliance Form Professional Education and Certification X
662A Administrator Preparation Program Annual Report Professional Education and Certification X
662ESA Educational Staff Associate (ESA) Preparation Program Annual Report Professional Education and Certification X
662T Teacher Preparation Program Annual Report Professional Education and Certification X IG 222 Teachers Assistance Program Professional Education and Certification X
1551 Alternative Routes to Teacher Certification Partnership Grant Application Professional Educator Standards Board
1571 Unexcused Absence Worksheet Research and Evaluation X X 1092 Federal Substance Abuse Grant Application Safe and Drug-Free Schools X 1092A Report Form Safe and Drug-Free Schools X 1092B-M Final Report for Competitive Grant Safe and Drug-Free Schools X
1149 Prevention and Intervention Services Program Application Safe and Drug-Free Schools X X
1197 Prevention and Intervention Services Monitoring Report Safe and Drug-Free Schools X X X
IG 210 Title IV Part A Safe and Drug-Free Schools (Consortium Forms) Safe and Drug-Free Schools X
IG 211 Title IV Part A Safe and Drug-Free Schools Safe and Drug-Free Schools X
IG 281 Title IV Safe and Drug Free (End-of-Year Report) (District) Safe and Drug-Free Schools X
IG 282 Title IV Safe and Drug Free (End-of-Year Report) (Consortium) Safe and Drug-Free Schools X
1066 Enrollment/Classroom Count School Facilities and Organization X
1190 Notification & Designation of Serving High School District School Facilities and Organization X X
IG 253 School Improvement Assistance Cohort 2 (Federal Funds) School Improvement X
IG 254 School Improvement Assistance Cohort 3 (Federal Funds) School Improvement X
IG 255 School Improvement Assistance Cohort 1 (State Funds) School Improvement X
IG 256 School Improvement Assistance Cohort 2 (State Funds) School Improvement X
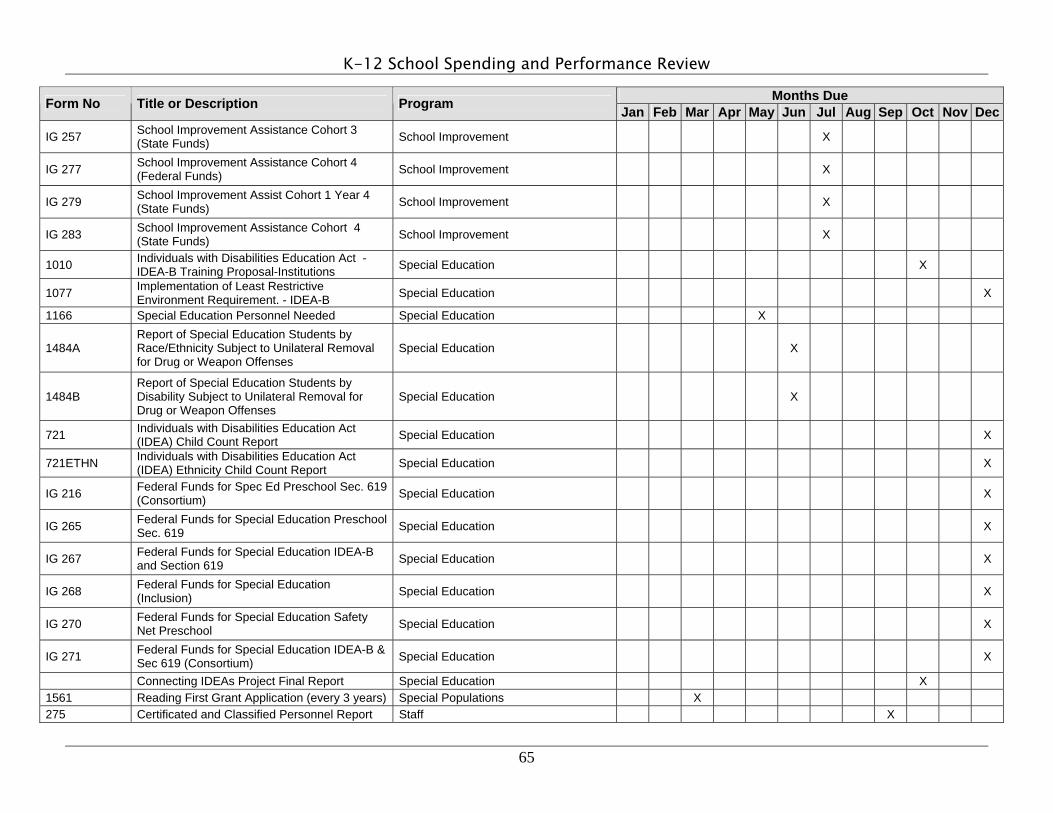
K-12 School Spending and Performance Review
65
Months Due Form No Title or Description Program Jan Feb Mar Apr May Jun Jul Aug Sep Oct Nov Dec
IG 257 School Improvement Assistance Cohort 3 (State Funds) School Improvement X
IG 277 School Improvement Assistance Cohort 4 (Federal Funds) School Improvement X
IG 279 School Improvement Assist Cohort 1 Year 4 (State Funds) School Improvement X
IG 283 School Improvement Assistance Cohort 4 (State Funds) School Improvement X
1010 Individuals with Disabilities Education Act -IDEA-B Training Proposal-Institutions Special Education X
1077 Implementation of Least Restrictive Environment Requirement. - IDEA-B Special Education X
1166 Special Education Personnel Needed Special Education X
1484A Report of Special Education Students by Race/Ethnicity Subject to Unilateral Removal for Drug or Weapon Offenses
Special Education X
1484B Report of Special Education Students by Disability Subject to Unilateral Removal for Drug or Weapon Offenses
Special Education X
721 Individuals with Disabilities Education Act (IDEA) Child Count Report Special Education X
721ETHN Individuals with Disabilities Education Act (IDEA) Ethnicity Child Count Report Special Education X
IG 216 Federal Funds for Spec Ed Preschool Sec. 619 (Consortium) Special Education X
IG 265 Federal Funds for Special Education Preschool Sec. 619 Special Education X
IG 267 Federal Funds for Special Education IDEA-B and Section 619 Special Education X
IG 268 Federal Funds for Special Education (Inclusion) Special Education X
IG 270 Federal Funds for Special Education Safety Net Preschool Special Education X
IG 271 Federal Funds for Special Education IDEA-B & Sec 619 (Consortium) Special Education X
Connecting IDEAs Project Final Report Special Education X 1561 Reading First Grant Application (every 3 years) Special Populations X 275 Certificated and Classified Personnel Report Staff X

K-12 School Spending and Performance Review
66
Months Due Form No Title or Description Program Jan Feb Mar Apr May Jun Jul Aug Sep Oct Nov Dec
1315 Washington State Teacher of the Year Program Teacher Awards Program X
1279SUMMER Title I Migrant Education Program Summer Review Checklist Title I Migrant X X X
757SP Special Projects End-of-Year Report Title I Migrant X IG 206 Title I Migrant Summer Application Title I Migrant X IG 206 Title I Part C Education of Migrant Children Title I Migrant X IG 207 Title I Migrant Summer Application Title I Migrant X IG 208 Title I Migrant Evaluation End-of-Year Report Title I Migrant X IG 209 Title I Migrant Summer End-of-Year Report Title I Migrant X
IG 248 Title I Part C Ed of Migrant Children End-of-Year (Regular Year) Title I Migrant X
IG 249 Title I Part C Education of Migrant Children End-of-Year (Summer Program) Title I Migrant X
1034 Annual Report for Neglected or Delinquent Children in Local Institutions Title I Neglected & Delinquent X
1371 Annual Report for Children in State Institutions for Neglected or Delinquent Title I Neglected & Delinquent X
749ND Title I Neglected or Delinquent Program End-of-Year Report Title I Neglected & Delinquent X
IG 208 Title I Part D Subpart 2 Neglected or Delinquent Local Agency Title I Neglected & Delinquent X
IG 209 Title I Part D Subpart 1 Neglected or Delinquent State Agency Title I Neglected & Delinquent X
IG 259 Title I Part D State Agency End-of-Year Report Title I Neglected & Delinquent X IG 260 Title I Part D State Agency Annual Report Title I Neglected & Delinquent X IG 261 Title I Part D Local Agency Annual Report Title I Neglected & Delinquent X
1094E Learning Assistance Program End-of-Year Report Title I/LAP X
1094ES Learning Assistance Program End-of-Year Report Summer School Title I/LAP X
1445 Title I Comprehensive School Reform Application Title I/LAP X
Comprehensive School Reform Grantees Title I/LAP X
Comprehensive Program Review Self Study (every 4 years) Title I/LAP
1550 School Improvement End-of-Year Report Title I/LAP X 749 Title I Regular End-of-Year Report Title I/LAP X
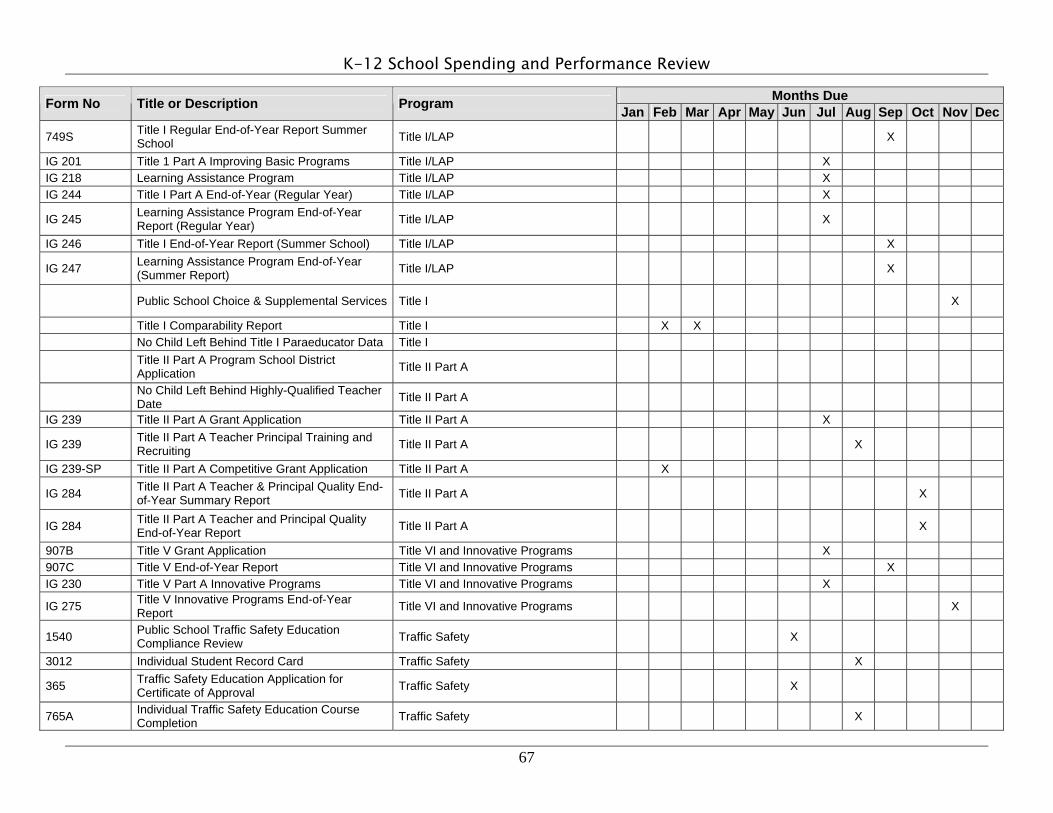
K-12 School Spending and Performance Review
67
Months Due Form No Title or Description Program Jan Feb Mar Apr May Jun Jul Aug Sep Oct Nov Dec
749S Title I Regular End-of-Year Report Summer School Title I/LAP X
IG 201 Title 1 Part A Improving Basic Programs Title I/LAP X IG 218 Learning Assistance Program Title I/LAP X IG 244 Title I Part A End-of-Year (Regular Year) Title I/LAP X
IG 245 Learning Assistance Program End-of-Year Report (Regular Year) Title I/LAP X
IG 246 Title I End-of-Year Report (Summer School) Title I/LAP X
IG 247 Learning Assistance Program End-of-Year (Summer Report) Title I/LAP X
Public School Choice & Supplemental Services Title I X
Title I Comparability Report Title I X X No Child Left Behind Title I Paraeducator Data Title I
Title II Part A Program School District Application Title II Part A
No Child Left Behind Highly-Qualified Teacher Date Title II Part A
IG 239 Title II Part A Grant Application Title II Part A X
IG 239 Title II Part A Teacher Principal Training and Recruiting Title II Part A X
IG 239-SP Title II Part A Competitive Grant Application Title II Part A X
IG 284 Title II Part A Teacher & Principal Quality End-of-Year Summary Report Title II Part A X
IG 284 Title II Part A Teacher and Principal Quality End-of-Year Report Title II Part A X
907B Title V Grant Application Title VI and Innovative Programs X 907C Title V End-of-Year Report Title VI and Innovative Programs X IG 230 Title V Part A Innovative Programs Title VI and Innovative Programs X
IG 275 Title V Innovative Programs End-of-Year Report Title VI and Innovative Programs X
1540 Public School Traffic Safety Education Compliance Review Traffic Safety X
3012 Individual Student Record Card Traffic Safety X
365 Traffic Safety Education Application for Certificate of Approval Traffic Safety X
765A Individual Traffic Safety Education Course Completion Traffic Safety X

K-12 School Spending and Performance Review
68
Months Due Form No Title or Description Program Jan Feb Mar Apr May Jun Jul Aug Sep Oct Nov Dec 765B Continuous Traffic Safety Education Course
Completion Traffic Safety X
1020 School Bus Acquisition and Disposition Transportation X X X X X X X X X X X X 1021 Annual School Bus Mileage Report Transportation X 1022A School Bus Route Logs - Decimal Degrees Transportation X
1022B Kindergarten-Fifth Grade Enrollment Route Log Transportation X
1022C District Car Route Log Transportation X 1022E Verification of Ridership Data Submitted Transportation X
1024 Depreciation and Replacement Allocation Report Transportation X
1026A Operation Allocation Worksheet Transportation X X 1394 School Bus State Low Quote Packet Transportation X 1400 Vendor Bid Proposal Packet Transportation X X X X X X X X X X X X 1799 School Bus Drivers Status Report Transportation X
645A Application for School Bus Driver's Authorization Transportation X X X X X X X X X X X X
1565 21st Century Community Learning Centers Grant Application Twenty-First Century Learning X
IG 240 21st Century Schools (Consortium Forms) Twenty-First Century Learning X IG 241 21st Century Schools Twenty-First Century Learning X 138M Annual Districtwide Plan Vocational-Technical Education X X
1403 Barrier Reduction Extended Day Documentation Vocational-Technical Education X X
218 SUM Skills Center Summer School Vocational-Technical Education X X 710 Annual Agriculture Education Report Vocational-Technical Education X 874 Office for Civil Rights Data Vocational-Technical Education X X P-210 VOC Enrollment Report for Vocational Education Vocational-Technical Education X
Source: Office of the Superintendent of Public Instruction.

69
APPENDIX 5: ADDITIONAL RESEARCH ON ALTERNATIVE APPROACHES TO REPORTING AND BUDGETING SCHOOL EXPENDITURES JLARC hired a group of consultants to study alternative approaches to reporting and budgeting school expenditures. The consultants are Marguerite Roza, Research Assistant Professor and research consultant at the University of Washington; Claudine Swartz, independent policy consultant for the development of K-12 education reforms; and Jennifer Harris, attorney and research consultant in public finance.
Chapter 6 of this report is based on the consultants’ findings. Here we are providing a list of research they cited for those who want additional information on alternative approaches.
1. Report spending by school Berne, R., Moser, M. and Stiefel, L. (1997). The Coming Of Age Of School-level Finance Data. Journal of
Education Finance, 22 (3), 246-254.
Busch, C and Odden, A. (1997). Introduction to the Special Issue: Improving Policy and Results With School Level Data: A Synthesis of Multiple Perspectives. Journal of Education Finance 22 (Winter 1997). 225-245.
Cohen, M.C. (1997). Issues In School Level Analysis of Education Expenditure Data. Journal of Education Finance, 22(3), 255-279.
Cooper, B.S., Sarrel, R., Darvas, P., Alfano, F., Meier, E., Samuels, J., and Heinbuch, S. (1994). Making Money Matter in Education: A Micro-Financial Model for Determining School-Level Allocations, Efficiency, and Productivity. Journal of Education Finance, 20, Summer 1994, 66-87.
Cooper, B.S. & Speakman, S.T. (1997). "The Three R’s of Education Finance Reform: Re-Thinking, Re-Tooling, and Re-Evaluating School-Site Information (1997). Journal of Education Finance, 22 (4), Spring 1997. 337-367.
Goertz, M. (1997). The Challenges of Collecting School Based Data. The Journal of Education Finance (22) 3, pp. 291-302.
Guthrie, J. Implications for Policy: What Might Happen In American Education If It Were Known How Money Was Actually Spent? In Lawrence O. Picus and James L. Wattenbarger (Eds.), Where Does the Money Go? Resource Allocation in Elementary and Secondary Schools, 1996. (pp. 71-84). Thousand Oaks, CA: Corwin Press.
National Conference of State Legislatures (1999). Study of Three States That Utilize School-level Finance Data. Prepared for the Joint Legislative Audit and Review Committee of the Washington State Legislature.
Picus, L.O. (1998) The Collection and Use of School Level Data. Final Report submitted to the Joint Legislative Audit and Review Committee of the Washington State Legislature.
Picus, L.O (1997). Using School Level Finance Data: Endless Opportunity or Bottomless Pit. Journal of Education Finance, 22(3), pp 317-330.
2. Report spending by student need Annenberg Task Force on School Communities that Work (2004). Tool To Compare Spending Across Schools
Within Districts. Available at http://www.schoolcommunities.org/resources/APRD/welcome.php

K-12 School Spending and Performance Review
70
Goertz, M. and Stiefel, L. (1998). School Level Resource Allocation In Urban Public Schools. Journal of Education Finance. 23 (Spring 1998), 435-446.
National Center for Education Statistics (2003). Financial Accounting for Local and State School Systems, 2003 Edition.
Odden, A., Archibald, S., Ferminick, M., and Gross, B. (2003). Defining School-level Expenditure Structures That Reflect Educational Strategies. Journal of Education Finance, 28 (3), pp. 323-356.
Roza, M. and Swartz, C. (2005). Empowering School District Policymakers with Information and Evidence: A Framework to Enlighten Resource Allocation Decisions. Working Paper.
3. Report actual salary information instead of average salaries Education Trust - West (2005). California’s Hidden Teacher Spending Gap: How State and District Spending
Practices Shortchange Poor and Minority Students and Their Schools. Available online at www.edtrustwest.org.
Roza, M., & Hill, P. (2004). How Within-district Spending Inequities Help Some Schools to Fail. In Dianne Ravitch (Ed.), Brookings Papers on Education Policy: 2004. Brookings Institution Press Sponsored by the Brown Center on Education Policy, Washington D.C.
4. Disaggregate spending data from central departments Chambers, J.G. 1999. Measuring Resources in Education: From Accounting to the Resource Cost Model
Approach. Working Paper Series: American Institutes for Research (CRESS), Kensington, MD. [BBB04123]
Coopers and Lybrand. (1994). Resource Allocation in the New York City Schools. New York City.
Miles, Odden, Archibald, and Fermanich, 2005 Inside the Black Box. The School Finance Project.
Miller, L., Roza, M., and Swartz, C. (in press). A Cost Allocation Model For` Shared District Resources: A Means For Comparing Spending Across Schools. Developments in School Finance 2004. Washington, DC: National Center for Education Statistics.
Roza, M., Miller, L., and Swartz, C. (2005) Lessons on Assessing the Costs of Small High Schools: Evidence From Seattle and Denver. Center on Education Policy Brief available at: http://www.crpe.org/.
Roza, M., Miller, L., and Swartz, C. (2005). Peeling Back The Layers Of Spending: An Examination Of District Expenditures in Denver Public Schools. Working paper.
5. Link spending data with educational strategies Cooper, B.S., Sarrel, R., Darvas, P., Alfano, F., Meier, E., Samuels, J., and Heinbuch, S. (1994). Making Money
Matter in Education: A Micro-Financial Model for Determining School-Level Allocations, Efficiency, and Productivity. Journal of Education Finance, 20 (Summer 1994): 66-87.
Odden, A., Archibald, S., Ferminich, M., and Gross, B. (2003). Defining School-level Expenditure Structures That Reflect Educational Strategies. Journal of Education Finance, 28 (3), pp. 323-356.
Odden, A., & Archibald, S. (2000). Reallocating Resources: How to Boost Student Achievement Without Asking For More. Thousand Oaks, CA: Corwin Press.
6. Allocate dollars not staff Clark and Toejnes (1997). Exploring Alternatives For School-based Funding. In Fowler, Bill, ed. Selected Papers
in School Finance, 1996. Washington DC: US Department of Education, National Center for Education Statistics.

K-12 School Spending and Performance Review
71
Hess, G. (1995). School-Based Finance: An Equity Solution for Urban Schools. School Business Affairs (August): 34-38.
Odden, A. and Busch, C. (1998). Financing Schools for High Performance. San Francisco, CA; Jossey-Bass.
Stiefel, Rubenstein, and Schwartz (2004). From Districts to Schools: The Distribution of Resources Across Schools in Big City School Districts.
7. Use weighted student allocations Goertz, M. and Stiefel, L. (1998). School-level Resource Allocation In Urban Public Schools. Journal of Education
Finance, 23 (4), 435-446.
Goertz, M.E. and Odden, A. (1999). School-Based Financing. Thousand Oaks, CA: Corwin Press.
Miles, K. and Roza, M. (2002). First Steps To A Level Playing Field: An Introduction To Student-Based Budgeting. Portfolio for District Redesign. (New York, NY: Annenberg Institute for School Reform at Brown University, 2002).
Miles and Roza (2005). Understanding Student-Weighted Allocation as a Means to Greater School Resource Equity. Working paper available at www.crpe.org.
Ouchi, W.G. and Segal, L.G. (2003). Making Schools Work: A Revolutionary Plan to Get Your Children the Education They Need. New York: Simon & Schuster.
8. Budget with actual salaries instead of average salaries Archer, J. (2005). Actual Cost of Salaries Figures Into Budgets for Oakland’s Schools. In Education Week.
January 5, 2005.
Roza, M., & Hill, P. (2004). How Within-district Spending Inequities Help Some Schools To Fail. In Dianne Ravitch (Ed.), Brookings Papers on Education Policy: 2004. Brookings Institution Press Sponsored by the Brown Center on Education Policy, Washington D.C.
9. Provide school-based budgeting authority General Accounting Office (1994). School Based Management Results in Changes in Instruction and Budgeting.
Washington, D.C.
Goertz, M.E. & Stiefel, L. (1998). School-Level Resource Allocation in Urban Public Schools. Journal of Education Finance. 23(4), 435-446.
Moser, M. (1998). School-based Budgeting: Increasing Influence and Information at the School Level in Rochester, New York. Journal of Education Finance, 23 (4), 507-31.
Siegel, D., and Fruchter, N. (2000) Final Report: Evaluation of the Performance Driven Budgeting Initiative of the New York City Board of Education (1997-2000). New York: NYU Institute for Education and Social Policy.
Stiefel, L., Schwartz, A.E., Dae Yeop Kim, and Portas, C. (2003). School Budgeting and School Performance: The Impact of New York City’s Performance Driven Budgeting Initiative. Journal of Education Finance, 28 (3), 403-424.
Wohlstetter, P. & Buffett, T. (1992). Promoting School-based Management: Are Dollars Decentralized Too? In A. Odden (Ed.), Rethinking School Finance: An Agenda for the 1990s, (pp. 128-165). San Francisco: Jossey-Bass
Wohlstetter, P. and Mohrman, S. (1996). Assessment of School Based Management. Prepared for the U.S. Department of Education.
K-12 School Spending and Performance Review
72
Wohlstetter, P. & Van Kirk, A. (1995). Redefining School-based Budgeting For High-involvement. In Lawrence O. Picus (Ed.), Where Does Money Go? Resource Allocation in Elementary and Secondary Schools. (pp. 212-235) Newbury Park, CA: Corwin Press

