thesis.eur.nl jw bruijsten v0… · web viewanother word of thanks goes to karsten, ......
TRANSCRIPT

ERASMUS UNIVERSITY ROTTERDAM
Erasmus School of Economics
Department of Applied Economics
Master’s Thesis Entrepreneurship, Organisation and Strategy Economics
PolycentricityIn search of the ‘pur-fect’ region
J.W. Bruijsten
288376
Supervisor: Dr. L. van der Laan
Co-reader: G. Mingardo

Polycentricity: In search of the ‘pur-fect’ region
Preface
The ending of my academic career is ‘crowned’ by this thesis. It is the last result of my six years at the
Erasmus University. Stumbling across some problems with my initial supervisor and topic it has led me
to the subject as it is now. Being absolutely pleased with this subject it has made the making of this
thesis probably a lot easier. Therefore I would like to thank my supervisor, Dr. Lambert van der Laan, for
bringing this subject to my attention. His guidance has helped me a lot during the construction of this
thesis. Further I would like to thank Giuliano Mingardo for being not only the co-reader but more a
second supervisor. His enthusiasm for the work I showed was extraordinary.
During the construction of this thesis I spend a lot of hours in the university library or in the computer
labs of the economics department. Fortunately I was not alone. Special thanks goes to Salko who gives
himself the credits for the fast ending of my study. Another word of thanks goes to Karsten, Sonny and
Laurens who were pleasant friends during ‘work’ hours and coffee or lunch breaks. Hopefully they will
end their academic career fruitfully.
Furthermore I would like to thank my girlfriend Ilse who continuously asked me about my progress so
she could attend my graduation; it was a good stimulus to continue the hard work. I also want to
dedicate some words to my uncle Sil, who acted as a guide in the greater part of my academic career.
For me your help was inexpressible, so I hope you had joy in doing it. Last but not least I would like to
thank my parents for their continuous support and always showing the right amount of interest in my
achievements.
Rotterdam, August 2010
J.W. Bruijsten
J.W. Bruijsten

Polycentricity: In search of the ‘pur-fect’ region
Abstract
This paper uses commuting flows to investigate the development of polycentricity in the Veneto region
between 1991 and 2001, which is located in the North-East of Italy. Both ingoing and outgoing
commuting flows are used to measure two aspects of polycentricity at two spatial scales; the inter- and
the intra-urban scale. Although commuting flows are limited to some extent it is considered an
appropriate measure to analyze the urban structure of regions. It is argued that the monocentric model
is being surpassed by the polycentric model. Where commuting used to be aimed at the city, it is the
multi-directional aspect of commuting that the polycentric model sets forth. Furthermore, polycentricity
refers to a balanced distribution of employment centers throughout a region. The results from this
thesis show that only Venice can be characterized by the monocentric model. However, the polycentric
model does not fully characterize the other regions in the entire Veneto region. Only between a few
functional urban regions in the Veneto region there is a polycentric structure, and the same holds for
the urban structure within a few functional urban regions. Hence, this thesis does not support the
argument from previous studies that the Veneto region is a polycentric region.
J.W. Bruijsten
Polycentricity: In search of the ‘pur-fect’ region
Table of Contents
Abstract...............................................................................................................................................3
List of figures and tables......................................................................................................................5
List of abbreviations.............................................................................................................................6
Chapter 1: Introduction........................................................................................................................7
Chapter 2: Polycentricity......................................................................................................................9
2.1 The concept of polycentricity............................................................................................................9
2.2 Causes..............................................................................................................................................10
2.3 Benefits and disadvantages.............................................................................................................12
2.4 Morphological and functional polycentricity...................................................................................14
2.5 Intra- and inter-urban scale.............................................................................................................15
2.6 Evidence of PURs.............................................................................................................................16
2.7 The concept of the FUR...................................................................................................................18
Chapter 3: Commuting flows..............................................................................................................21
3.1 Commuting......................................................................................................................................21
3.2 In- and outgoing commuting...........................................................................................................23
Chapter 4: Veneto..............................................................................................................................26
4.1 Veneto.............................................................................................................................................26
4.2 FURs in Veneto................................................................................................................................28
Chapter 5: Data..................................................................................................................................31
5.1 Description of data..........................................................................................................................31
5.2 Methodology...................................................................................................................................33
Chapter 6: Results..............................................................................................................................43
6.1 Morphological polycentricity...........................................................................................................43
6.2 Functional polycentricity.................................................................................................................50
6.3 Overview..........................................................................................................................................55
6.4 Discussion........................................................................................................................................59
6.5 Limitations.......................................................................................................................................62
Chapter 7: Conclusion........................................................................................................................64
J.W. Bruijsten

Polycentricity: In search of the ‘pur-fect’ region
Reference list.....................................................................................................................................70
Appendix...........................................................................................................................................78
List of figures and tables
Figure 2.1: Two structural aspects of polycentricity..................................................................................14Figure 3.1: Types of DUS............................................................................................................................24Figure 4.1: Map of Veneto.......................................................................................................................248Figure 4.2: FURs in Veneto........................................................................................................................29Figure 4.3: FURs in Verona........................................................................................................................30Figure 4.4: Municipalities in Verona..........................................................................................................30Figure 5.1: Neighborhood definitions........................................................................................................35Figure 5.2: Types of FUR based on N1 and N2...........................................................................................40
Table 5.1: Example of commuting pattern matrix.....................................................................................31Table 5.2: Total number of persons commuting into or out of the different provinces............................32Table 5.3: Overview of the direction of N1 and N2...................................................................................39Table 5.4: Methods used to measure polycentricity.................................................................................42Table 6.1: Different systems in Veneto......................................................................................................50Table 6.2: Summary of the results of the hypotheses...............................................................................55Table 6.3: Percentage of outgoing commuting to Verona, San Giovanni Lupatoto and San Martino B.A. 57Table 6.4: Percentage of outgoing commuting from FURs with low N1 to main central city....................58
J.W. Bruijsten

Polycentricity: In search of the ‘pur-fect’ region
List of abbreviations
CBD Central Business District
CR City Region
C zone City zone
DUS Daily Urban System
ESDP European Spatial Development Perspective
FUR Functional Urban Region
HHI Herfindahl-Hirschmann Index
ISTAT Italian National Institute for Statistics
IO Inward Openness
LISA Local Indicators of Spatial Association
LLM Local Labor Market
LLS Local Labor System
N1 Nodality 1
N2 Nodality 2
OO Outward Openness
PUR Polycentric Urban Region
SA Spatial Autocorrelation
S zone Zone surrounding city zone
TAZ Transportation Analysis Zone
J.W. Bruijsten

Polycentricity: In search of the ‘pur-fect’ region
Chapter 1: Introduction
‘Location, location, location’. Real estate brokers use this phrase to emphasize the importance of
location. Location is also an aspect of this thesis. However, this thesis uses commuting flows to analyze
where employment is located and whether this location is characterized by employment concentration.
In other words, it investigates polycentricity. Spatial planning policy is primarily build on these two
issues. Differences over time in the location of employment and households changed the urban spatial
structure of regions. To illustrate, in medieval times merchants travelled long distances to sell their
products on the market. Because of huge developments in transport and communication technologies
the choice of where to locate for selling and buying has changed dramatically. Nowadays, it is possible to
locate out of the city to avoid congestion and high commuting costs. It is therefore interesting for
policymakers to understand the urban structure of the region. Especially in the last two decades there
have been developments in the urban structure of regions. This has led to the following research
question:
To what extent do commuting flows support the development of polycentricity in the Veneto region
between 1991 and 2001?
The Veneto region is analyzed because several scholars argue that the (Central) Veneto region is one of
the prime examples of polycentricity (Dieleman and Faludi, 1998; Musterd and Van Zelm, 2001; Meijers,
2007). However, this has not been empirically investigated which Cristaldi (2005) emphasizes.
Furthermore, the Veneto region is believed to be similar to the Randstad. However, recent studies
regarding polycentricity in the Randstad marked another urban structure (Cowell 2010; Van der Laan,
2010; Van Oort et al., 2010). The results of this thesis can thus show whether the Veneto region is
indeed similar with the Randstad. Finally, this thesis uses the periods of 1991 and 2001 because 1) these
are the most recent data and 2) because using different years can show how the urban structure has
developed.
Relevance
J.W. Bruijsten
Polycentricity: In search of the ‘pur-fect’ region
De Goei et al. (2010, p. 3) argue that only ‘a few studies on the configuration of urban systems using
flow characteristics predominantly assess the central place model versus the network model at one
point time’ whereas this thesis analyzes the inter- and intra-urban configuration of urban systems at two
points in time. Van Oort et al. (2010, p. 742) argue that there is a need for analyzing the configuration of
urban systems as ‘a burgeoning literature suggests that the polycentric region as a spatial economic
concept replaces the hierarchical, central node concept’. Furthermore, this thesis contributes to existing
literature because the work-related commuting flows in Italy have rarely been analyzed (Cristaldi, 2005).
It differs from the work of Cristaldi (2005) in that it uses a more recent data set, it focuses more on
polycentricity and it analyzes one entire region where Cristaldi (2005) takes nine different regions
throughout Italy.
The framework this thesis uses for functional polycentricity is well-suited because it ‘takes into account
not only the monocentric or polycentric structure of the urban system, but also looks at its effects on
commuting patterns’ (Schwanen et al., 2001, p. 177). Furthermore, Parr (2005, p. 558) argues that the
‘most important component in the overall pattern of interaction within the FUR involves commuting
flows’. This thesis further takes spatial dependence into account: ‘avoiding the pitfalls from spatially
correlated data is crucial to good spatial data analysis’ (Fischer, 2006, p. 20). Dominics et al. (2007) argue
that their analysis also takes spatial dependence into account and thereby contributes to empirical
literature. Additionally, this thesis assumes that the local indicators for spatial association (LISA) are
complementary to the Herfindahl-Hirschmann Index (HHI); ‘inspecting the local Moran significance map
is very useful for local policy authorities interested in identifying new industrial clusters and in testing
the performance of pre-existing industrial districts’ (Dominics et al., 2007, p. 11).
J.W. Bruijsten
Polycentricity: In search of the ‘pur-fect’ region
Chapter 2: Polycentricity
The urban spatial structure of cities and regions is changing; it is shifting from the monocentric model to
the polycentric model. Polycentricity can refer to inter- or intra-urban patterns of clustering of, for
example, employment and population. The Polycentric Urban Region (PUR) corresponds with the inter-
urban pattern and the Functional Urban Region (FUR) with the intra-urban pattern. This chapter will
firstly define the concept of polycentricity (section 2.1), it will investigate how it came into existence
(section 2.2) and it will discuss benefits and disadvantages related to polycentricity (section 2.3). Two
aspects of polycentricity – morphological and functional – will be introduced (section 2.4). The inter-
urban pattern will then be discussed which relates to openness (section 2.5). The inter-urban pattern
refers to the PUR (section 2.6) and finally, the concept of the FUR will be defined (section 2.7)
2.1 The concept of polycentricity
In the monocentric model transport is aimed at a single city centre or Central Business District (CBD),
which dominated the hierarchy between the different business centers in the city (Clark and Kuiijpers-
Linde, 1994; Kloosterman and Musterd, 2001; Limtanakool et al., 2007a). Employment is concentrated in
the CBD and the rest of the region is committed for residential use (Anderson and Bogart, 2001; de Goei
et al., 2010). This monocentric model reflects the traditional central place model, which focuses on the
hierarchy in the relations between cities. This hierarchy contains one-sided vertical relationships
between different classes of places. It means that the smaller cities are dependent on the larger cities
(Meijers, 2007).
Suburbanization changed the urban structure of regions which led to a period of spatial deconcentration
(Bramezza, 1996). This means that the population moves to suburban municipalities. The high income
groups move first to the suburbs followed by the middle class (Mieszkowski and Mills, 1993). A main
characteristic of suburbanization is that the population moving to the suburbs remains oriented at the
central city they have left, resulting in commuting flows from the suburbs to the central city (Bramezza,
1996).
J.W. Bruijsten
Polycentricity: In search of the ‘pur-fect’ region
However, over time the suburbs ‘tended to absorb an increasing share of the CBD employment’ (Romein
and Verkoren, 2007, p. 4) and employment shifted to the suburbs (Clark and Kuijpers-Linde, 1994).
These suburbs ‘increasingly emerged into local centers that developed their own economic activities’
(De Goei et al., 2010, p. 3). This resulted in multiple centers in one area (Kloosterman and Musterd,
2001; Riguelle et al., 2007; Cowell, 2010), which this thesis defines as polycentricity. Polycentricity
reflects the network model. It emphasizes relationships between two or more independent cities, which
cooperate to achieve economies of scope – i.e. economic growth achieved through, among others 1,
knowledge exchange with nearby partners (e.g. firms or cities) - and complementarity (Batten, 1995).
Commuting flows are reciprocal; they are not only directed anymore from the suburbs to the central
city, but also the other way around (De Goei et al., 2010).
Firms and households are now scattered over an area. The monocentric model ‘appears to be a relic of
the past’ (Shearmur et al., 2007, p. 1714). The result of this scatteration is the development of regions
into polycentric regions. The corresponding commuting flows are one of the essential characteristics for
identifying a polycentric region2 (Kloosterman and Musterd, 2001). Bailey and Turok (2001, p. 698) argue
that such a region can be defined as ‘a region having two or more separate cities, with no one centre
dominant, in reasonable proximity and well-connected’. Examples of these regions are predominantly
present in Europe (Bailey and Turok, 2001), which include the Dutch Randstad, the Rhine-Ruhr area in
Germany and the Veneto region in Italy (Meijers, 2007). For more evidence on these regions see section
2.6.
2.2 Causes
As the previous section showed there are a number of historically distinct cities present in a polycentric
region. Urban regions with one dominant city, such as London or Paris (Dieleman and Faludi, 1998;
Limtanakool et al., 2007a), cannot be defined or analyzed as polycentric; there must be the lack of a
dominant city in a polycentric region. As firms and households are locating outside the CBD (McMillen
and Smith, 2003), suburban areas emerge into local centers (De Goei et al., 2010). Romein and Verkoren
(2007) argue that urban regions have become border- and centre less due to the concentration of
1 Other mechanisms are: unexpected creativity and reciprocity (Batten, 1995).2 Other characteristics are: A number of historically distinct cities, lack of a clear leading city, consisting of a small number of larger cities, located in close proximity, constitute independent political entities.
J.W. Bruijsten
Polycentricity: In search of the ‘pur-fect’ region
employment in local economic centers. In other words, the locational choices of firms and households
have extended spatially (Limtanakool et al., 2007a). Bertaud (2004, p. 6) states that ‘large cities are not
born polycentric; they may evolve in that direction’. The causes for the emergence of a polycentric
region can be grouped in three ways: ‘the increased spatial mobility and flexibility of firms, the increased
spatial mobility and flexibility of households and local and regional policy’ (De Goei et al., 2010, p. 9).
This section will briefly discuss the first two, as the latter is beyond the scope of this thesis:
Increased spatial mobility and flexibility of firms
The increased spatial mobility and flexibility of firms is also called the restructuring hypothesis. It means
that changes in the locations of employment (Renkow and Hoover, 2000) are the main reasons for the
emergence of a polycentric region. Huge developments in transport and communication technologies
(Batten, 1995; Kloosterman and Lambregts, 2001; Kloosterman and Musterd, 2001), increasing
congestion and better accessibility of the suburban locations (Riguelle et al., 2007; Romein and
Verkoren, 2007) have caused firms to move out of the CBD. Firms that move out of the CBD distribute
employment opportunities over the region (Renkow and Hoover, 2000). This and the ‘results from
improvements in transportation systems and accessibility, which diminish the importance of distance’
(Patuelli et al., 2010, p. 6) are the main reasons for the development of a polycentric region, according
to this hypothesis.
Increased spatial mobility and flexibility of households
The increased mobility and flexibility of households implies that the main reason for the emergence of a
polycentric region lays in the residential preferences of individuals (Renkow and Hoover, 2000). This is
also known as the deconcentration hypothesis. Costs of living in the city, such as congestion and crime,
and also the developments in the transport and communication technologies have caused individuals to
move out of the CBD; to minimize commuting costs the rational individual will change his place of
residence (Van der Laan et al., 1998). In addition, the increase in two-earner households implies that for
an optimal residential location two work locations have to be taken into account (Kloosterman and
Musterd, 2001). This means that, bearing in mind the deconcentration of employment, ‘households
have to find a residential compromise between two spatially rather distinct location of jobs’
(Kloosterman and Musterd, 2001, p. 625).
J.W. Bruijsten
Polycentricity: In search of the ‘pur-fect’ region
J.W. Bruijsten

Polycentricity: In search of the ‘pur-fect’ region
Demand for and supply of labor
These two ‘schools of thought’ are intertwined with each other. The restructuring hypothesis involves
the demand for labor and the deconcentration hypothesis involves the supply of labor. For example, in
the monocentric model jobs are located in the CBD and households are located around this CBD (De
Graaff et al., 2008; Van Oort and Ritsema van Eck, 2010). In this example the supply of labor (people)
follows the demand for labor (firms/jobs). However, Van Oort and Ritsema van Eck (2010) argue that
this has changed; the demand for labor is now following the supply of labor. For example, banks or
cinemas will establish themselves in places where households are located. Hence, the demand for labor
follows the supply of labor. In this example consumer oriented services follow suburbanization (Romein
and Verkoren, 2007). This change has been empirically investigated and supported by De Graaff et al.
(2008) who show that in the Netherlands between 1996 and 2005 the demand for labor follows the
supply of labor, especially in the Randstad. In other words, jobs follow residential locations (at a lag),
which is an expected result of an (emerging) polycentric region (Clark and Kuijpers-Linde, 1994).
Additionally, Clark and Kuijpers-Linde (1994) also argue that specialization and competition strengthens
the emergence of local economic centers and that the demand for and supply of labor drives the urban
structure to change.
Since the focus of this thesis is to study the development of the urban structure of Veneto through
commuting flow analysis, it is important where employment is located en where households are settled.
These two factors are essential for how the commuting flows look like. Urban (spatial) structure refers
to where employment and households are located (Sohn, 2005). Commuting flows will be further
discussed in chapter 3.
2.3 Benefits and disadvantages
The development of a region into a polycentric region is believed to be economically beneficial (Meijers,
2005), while it avoids the costs of world cities (Dieleman and Faludi, 1998; Bailey and Turok, 2001), e.g.
high commuting costs, congestion, social inequality and pollution (Van Oort, 2004). This paragraph will
discuss these benefits. Within a polycentric region cities are functionally related through co-operation
(Meijers, 2005) and competition (Cowell, 2010). These two mechanisms lead to stronger interaction
between cities, which in turn leads to specialization and complementarity (Bailey and Turok, 2001).
J.W. Bruijsten
Polycentricity: In search of the ‘pur-fect’ region
Specialization and complementarity strengthens the functional relationship between cities and
enhances their interrelated trade (Kloosterman and Lambregts, 2001), which supports their economic
development and regional competitiveness. On the one hand, complementarity can lead to economies
of scale ‘between cities performing similar economic roles, such as port cities or tourist cities’ (Meijers,
2005, p. 768). On the other hand, specialization can lead to agglomeration benefits ‘as the assets of each
city are effectively pooled together’ (Bailey and Turok, 2001, p. 699). In other words, it shows that there
are agglomeration benefits ‘to economic activities being located in spatial proximity’ (Shearmur et al.,
2007, p. 1715). Furthermore, Batten (1995, p. 324-325) argues that polycentric regions ‘offer a unique
combination of characteristics: an attractive, culturally diverse environment, advanced R&D and
educational facilities, a flexible and creative workforce, improving accessibility to the outside world, and
a dynamic vision of the future’.
There is wide agreement that polycentricity can be beneficial, but the empirical evidence for these
benefits is limited; Meijers and Burger (2010) argue that the influence of polycentricity on the urban
structure is unclear. Meijers (2005) shows using correspondence analysis that synergy has increased, but
complementarity decreased in the Randstad between 1996 and 2002. Cowell (2010) uses the same
technique and finds that complementarity in the San Francisco Bay Area, the Emilia-Romagna region in
Italy and the Randstad has decreased between 1996 and 2001 time. However, this thesis has another
focus and will therefore not further discuss this shortcoming. The next paragraph will shortly discuss
disadvantages related to polycentricity.
Parr (2004) argues that there are three disadvantages to the polycentric region. First, relative to a
metropolitan region of similar population size, commuting flows will be longer and information flows
less efficient. Second, some disadvantages of the polycentric region come from the nature of its urban
spatial structure. This means that factors such as ‘density, proximity, face-to-face contact, informal
structures, unplanned interaction etc’ (Parr, 2004, p. 236) are excluded by a polycentric urban structure.
This is confirmed by Meijers (2008, p. 2338), who shows that for the Netherlands ‘the more polycentric
a region is, the fewer cultural, leisure and sports amenities are present’. This finding does not support
the unique combination of characteristics (Batten, 1995) as argued above. Third, the spatial structure of
the polycentric region can cause a poor investment situation through, for example, the dispersion of
households and poor infrastructure.
J.W. Bruijsten

Polycentricity: In search of the ‘pur-fect’ region
2.4 Morphological and functional polycentricity
The previous three sections investigated polycentricity. This section finalizes the concept of
polycentricity; it can be referred to as functional or as morphological (Meijers and Burger, 2010).
Functional polycentricity is defined as the direction of flows within urban areas where morphological
polycentricity refers to the distribution of an urban region (Espon, 2005). This division of polycentricity is
used because this thesis analyzes both aspects with different measures (see chapter 5). The following
figure presents these two aspects of polycentricity:
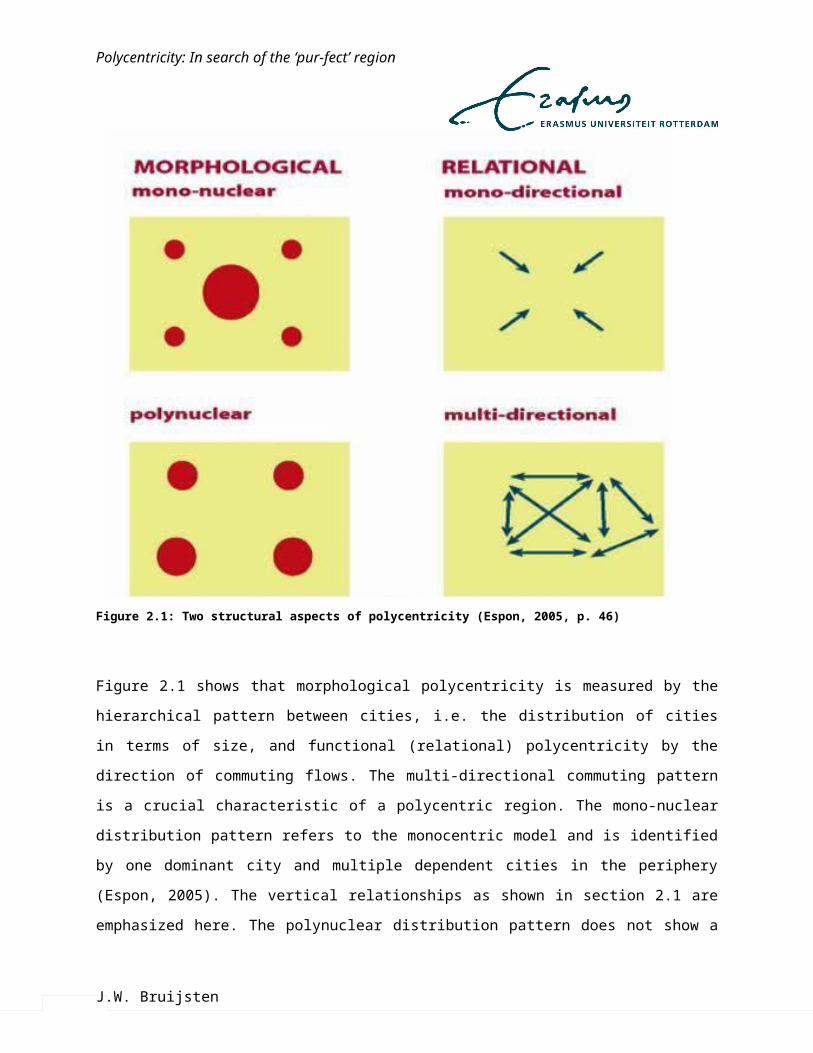
Figure 2.1: Two structural aspects of polycentricity (Espon, 2005, p. 46)
Figure 2.1 shows that morphological polycentricity is measured by the hierarchical pattern between
cities, i.e. the distribution of cities in terms of size, and functional (relational) polycentricity by the
J.W. Bruijsten
Polycentricity: In search of the ‘pur-fect’ region
direction of commuting flows. The multi-directional commuting pattern is a crucial characteristic of a
polycentric region. The mono-nuclear distribution pattern refers to the monocentric model and is
identified by one dominant city and multiple dependent cities in the periphery (Espon, 2005). The
vertical relationships as shown in section 2.1 are emphasized here. The polynuclear distribution pattern
does not show a dominant city; the cities are of similar size (Espon, 2005). Van der Laan (2010) argues
that there is a weak relationship between the level of morphological and functional polycentricity,
although the level of functional polycentricity follows the level of morphological polycentricity and not
vice versa. The Espon report (2007) states that Italy has the second highest level of morphological
polycentricity in Europe, but also showed that the level of functional polycentricity is rather average.
Understanding the direction of commuting flows - functional polycentricity - is important since this may
help prevent urban sprawl (Espon, 2007). Morphological polycentricity is measured in order to support
specialization and complementarity (see section 2.3) between cities.
2.5 Intra- and inter-urban scale
‘Polycentricity can either refer to the intra-urban pattern of clustering or to inter-urban patterns’
(Kloosterman and Musterd, 2001, p. 624); i.e. the clustering of employment. Inter-urban patterns refer
to the entire polycentric region; the PUR, where the intra-urban pattern refers to a lower spatial scale;
the FUR. This section is dedicated to previous research regarding the inter-urban scale, where the next
two sections will discuss evidence for PURs (section 2.6) and the concept of the FUR (section 2.7).
Only a small amount of research is dedicated to the inter-urban scale. Van der Laan (1998) investigates
whether or not the Randstad is a PUR and Van Nuffel (2007) argues to do the same for the Flanders
region in Belgium, but fails to analyze the entire PUR. In another study Van Nuffel and Saey (2005) do
analyze the Flanders region at the inter-urban scale. Patuelli et al. (2009) investigate commuting flows at
the inter-urban scale in Germany. The results of these studies will now be discussed.
Van der Laan (1998) investigates whether the different FURs in the Netherlands have some degree of
openness. This means that there exist reciprocal commuting flows between the different FURs.
Openness can be measured as inward and outward openness (Van der Laan, 1998). Inward openness
(IO) means that a FUR is open for commuters from outside that FUR and outward openness (OO) means
that a FUR has commuters that go outside the FUR of origin. The results of Van der Laan (1998) show
J.W. Bruijsten

Polycentricity: In search of the ‘pur-fect’ region
that in the Netherlands only between a few FURs a polycentric structure has developed. Van Nuffel and
Saey (2005) find evidence for multi-directional commuting flows between different FURs at the regional
scale which indicates polycentricity at the inter-urban scale. These linkages are primarily between the
central cities and the suburbs of the FURs of Brussels, Mechelen and Leuven. Furthermore, almost all
the FURs have relationships with the FUR of Brussels. The results of Patuelli et al. (2009) show that the
commuting network in Germany is multi-directional. This holds especially at the local level, but also at
the regional level as the importance of central cities declines over time. However, the openness at the
intra-urban scale overshadows the openness at the inter-urban scale. This means that at the intra-urban
scale Germany is characterized by a more polycentric structure and less at the inter-urban scale.
A true PUR is thus characterized by a high degree of inward and outward openness. However, as the two
next sections will show, no region is ever fully polycentric and the main commuting of people is within
one FUR. Therefore, thresholds for the openness of a FUR have to be determined. These are presented
in chapter 5.
2.6 Evidence of PURs
Renkow and Hoover (2000) argue that no city is ever fully monocentric or fully polycentric. Every PUR
will have its own reason why it emerged (Champion, 2001). A lot of research regarding the presence of
polycentric regions has been performed, as well in Europe as in North America (including: Gordon et al.,
1986; Albrechts, 1998; Lambooy, 1998; Dieleman and Faludi, 1998; Van der Laan, 1998; Bailey and
Turok, 2001; Kloosterman and Lambregts, 2001; Schwanen et al., 2001; Baumont et al., 2004; Van
Nuffel, 2007; Eskelinen and Fritsch, 2009; Meijers and Lambregts, 2009; Cowell, 2010; De Goei et al.,
2010; Van der Laan, 2010). A recent issue of Urban Research & Practice (Vol. 2, No. 3, 2009) was actually
dedicated to polycentricity in Central Europe and Schwanen et al. (2004) argue that most urban regions
in the US and Europe have changed from a monocentric structure to a polycentric structure. Examples of
the PURs in these studies are: the Flemish diamond (Belgium), Central Scotland, the Rhine-Ruhr region,
Los Angeles, the San Francisco Bay area, greater Cleveland (USA), the Veneto region, the Emilia-
Romagna area, Dijon (France), eastern Finland and the Randstad. However, most of the above research
is performed at the intra-urban scale. This will be discussed further in the next section. This section will
continue with an example at the inter-urban scale - the Randstad - as this region contains several recent
and surprising developments and because it contains similarities with Veneto.
J.W. Bruijsten

Polycentricity: In search of the ‘pur-fect’ region
The Randstad
The Randstad serves as the classic and most cited example of a PUR (Batten, 1995; Dieleman and Faludi,
1998; Kloosterman and Lambregts, 2001; Musterd and van Zelm, 2001). It consists of several historically
distinct cities which are believed to function as one urban region (Musterd and van Zelm, 2001).
Lambooy (1998) argues that the Randstad has the attributes of a metropolitan area, with Amsterdam
and Rotterdam as the two largest cities, and that the region contains possibilities for the development of
agglomeration advantages. The Randstad is ‘one of the most accessible urban agglomerations in the
world’ (Batten, 1995, p. 321). The Randstad contains the characteristics, presented in section 2.1, for
identifying it as a PUR. Van der Laan (1998) shows that there are multi-directional commuting flows
present in 2/3 of the Dutch Daily Urban Systems (DUS) which includes the Randstad. These studies in the
last decade of the previous century mostly argued that the Randstad is a PUR. However, recent studies
revealed different results.
These recent studies showed that the Randstad does not serve the classic example for a polycentric
structure anymore (Van der Laan, 1998 and 2010; Cowell 2010; Van der Laan, 2010; Van Oort et al.,
2010). Van der Laan (1998; 2010) reveals in the 1998 study that the Randstad contains a south and north
wing and that, in the 2010 study, morphological polycentricity is rather low in the Randstad . Van Eck et
al. (2006) shows that the central city still serves an important role and commuting flows flow between
and to the four main cities (Rotterdam, The Hague, Utrecht and Amsterdam). Meijers (2005) also argues
that these four cities still perform important roles. Van Oort et al. (2010) find evidence for the central
place model, using business start-ups. This study shows that the Randstad is not a spatially and
functionally integrated region. Cowell (2010) shows that complementarity, which is argued in section 2.1
to be a result of the development into a PUR, has decreased in the Randstad over time.
Summarizing, the presence of a polycentric structure at the inter-urban scale in the Randstad is
questioned. The results discussed in this paragraph show that the characteristics of a PUR are not really
present in the Randstad. The results of this thesis will show how the urban structure of the Veneto
region has developed between 1991 and 2001.
J.W. Bruijsten

Polycentricity: In search of the ‘pur-fect’ region
2.7 The concept of the FUR
Urban regions consist of several provinces and municipalities. As argued in section 2.2 changes in the
location of employment and households caused the emergence of multiple centers in one region; i.e.
polycentricity. Slightly different concepts have been proposed over time to determine the boundaries of
these regions. These include DUS (Van der Laan, 1998), local labor systems (LLS) (Cristaldi, 2005), local
labor markets (LLM) (Sebastiani, 2003), FURs (Limtanakool et al., 2007a), the city region (CR) (Riguelle et
al., 2007) and employment centers (Anderson and Bogart, 2001). These concepts acknowledge that the
existing administrative borders of municipalities are not the borders of the commuting flows (Cristaldi,
2005). In other words, the spatial reference frame for the economic analysis of urban regions at the
intra-urban scale has to be properly identified (Sebastiani, 2003). This section will investigate the
different concepts mentioned above and will argue why the FUR is the best spatial level to analyze intra-
urban patterns of clustering.
Riguelle et al. (2007) study Belgium and take the entire province around the four largest cities; Liege,
Antwerp, Ghent and Brussels. They argue that this is performed in order to avoid the problems of setting
the limits of urban areas. However, their study does measure polycentrism and they find a trend toward
employment decentralization. Parr (2005) argues that the CR as a planning concept, particularly in the
UK, is undergoing a revival. The CR consists of a city zone (C zone) and an area surrounding this zone (S
zone), where the most important interaction between these zones are commuting flows. Parr (2005)
also argues that it is possible that more than one C zone exists in a single CR, or multiple urban areas of
significance within the S zone of one city region. The latter is an example of multiple local economic
centers in one area.
Anderson and Bogart (2001) identify employment centers using the transportation analysis zone (TAZ)
as the unit of analysis. These TAZs are ‘composed of one or more census blocks with the borders being
supplied by the US Census Bureau’ (Anderson and Bogart, 2001, p. 148-149). Employment centers are
areas with high density and a high quantity of employment (Giuliano and Small, 1991). The employment
centers consist of several contiguous TAZs, with ‘total employment exceeding some minimum’
(Anderson and Bogart, 2001, p. 149). It relates to the LLS and LLM which are one and the same concept.
Cristaldi (2005) defines the LLS with reference to daily commuting flows. This means that the LLS is ‘a
set of elemental territorial units, geographically connected to each other, such that the proportion of
J.W. Bruijsten
Polycentricity: In search of the ‘pur-fect’ region
people living in that set who also work there is large whereas the proportion of people who work in the
set but do not live there is small’ (Sebastiani, 2003, p. 201). Therefore, the LLS is a region where a very
small amount of people commute to other LLSs, implying that the LLS is thé spatial reference frame for
identifying and analyzing urban regions at the intra-urban scale. Furthermore, Cristaldi (2005) shows
that the LLS is an area where, next to the journey from home to their work, also the leisure and sport
activities of most households take place.
All these concepts, including the DUS, relate to the FUR. The FUR refers to ‘the space in which urban
activities such as living, working, shopping, relaxing, etc. proceed (Van den Berg and Klink, 1995). It
reflects a core city and ‘all the areas that have regular daily relationships with this core city’ (Hall et al.,
2006, p. 19). Aujean et al. (2005) defines the FUR as an economic core with surrounding municipalities
where the main commuting flows are aimed at this economic core. The DUS is also called FUR and the
local urban labor market (Van der Laan, 1998).
In sum, the LLS, the FUR and the DUS all refer to the same region. The people in a LLS mainly commute
within this region and this is also true for the FUR. For consistency reasons, this thesis refers to the LLS
as the FUR.
Spatial level of analysis
The FUR as spatial level of analysis at the intra-urban scale serves best for several reasons. Firstly,
Dominics et al. (2007) argue that the FUR can be classified by looking at patterns of spatial interaction.
These patterns of daily commuting flows are contained in one area (Cristaldi, 2005; Dominics et al.,
2007), which is key in defining the FUR (Cristaldi, 2005). Secondly, Limtanakool et al. (2007a) show that
the Institute for Urban Planning and Development of the Paris Ile-de-France Regions (IAURIF, 2002)
considers FURs the best spatial unit for analyzing metropolitan areas. Van Nuffel (2007) confirms this as
she argues that FURs are considered good spatial reference frame for defining them on the basis of
commuting flows. Thirdly, administrative boundaries cannot be considered as good spatial reference
frames (Sebastiani, 2003) as they are based on historical, political and/or social events and because the
boundaries of the FUR go beyond that of the administrative partitions (Sebastiani, 2003; Dominics et al.
(2007).
J.W. Bruijsten
Polycentricity: In search of the ‘pur-fect’ region
To conclude, the polycentric model is replacing the monocentric model. Polycentricity is defined as the
existence of multiple centers in one area. Changes in the location of employment and households
caused the development of a polycentric urban structure. A polycentric region is a well connected
region with multiple neighboring and separate cities, with no city being dominant. Polycentricity is
believed to have economic benefits while avoiding the costs of congested cities. However, these
benefits still have to be empirically investigated. Furthermore, polycentricity is divided into
morphological and functional polycentricity. Both aspects of polycentricity are measured in this thesis,
at the intra-urban and at the inter-urban scale. The PUR reflects the inter-urban scale which is
characterized by high inward and outward openness between FURs. The intra-urban scale reflects the
spatial reference frame of the FUR, which is part of the PUR. The majority of the daily commuting flows
are within one FUR and the FUR therefore serves best as the spatial level of analysis.
J.W. Bruijsten
Polycentricity: In search of the ‘pur-fect’ region
Chapter 3: Commuting flows
The previous chapter showed that commuting flows are essential to identify the urban spatial structure
of regions. In a polycentric region commuting flows are multi-directional. This chapter will go into the
concept of multi-nodality (section 3.1), where it is also argued why commuting flows can be used to
study the development of an urban area. The second part of this chapter will discuss in- and outgoing
commuting (section 3.2).
3.1 Commuting
‘Commuting is an essential part of urban life in modern urbanized areas’ (Sohn, 2005, p. 306) and is
defined as the journeys individuals undertake to travel from their home to their work, thereby crossing
at least the municipality border (Van der Laan et al., 1998). Section 2.1 showed that firms and
households are dispersed over the area in the polycentric model. The emergence of a polycentric region
leads to multi-directional commuting flows, which are not primarily aimed anymore at the CBD. For
example, Jansen (1993) shows that the commuting flows in Germany between different municipalities
increased with nearly 50 percent between 1970 and 1988. This is ‘a clear indication of a growing
dispersal of commuting patterns (Jansen, 1993, p. 103). Commuting depends on where firms (jobs) and
households are located (Sohn, 2005). Commuting flows can therefore reveal two issues: where
employment is concentrated and where individuals live, indicating the urban (spatial) structure of a
region (see section 2.2). The following paragraph will discuss why commuting flows are used.
Travisi et al. (2010, p. 384) argue that commuting, as it refers to the demand for urban mobility, is useful
for analyzing some specific dimensions of cities: ‘density, settlement patterns and functional mix’. Van
Nuffel and Saey (2005) find evidence that commuting flows reflect the urban structure of Flanders
(Belgium). Clark and Kuijpers-Linde (1994) argue that the debate about the organization of the changing
urban form has centered on commuting and Sohn (2005) shows that commuting flows clearly reflect the
employment distribution. Commuting flows are ideal for ‘the identification of significant employment
concentrations and the areas over which these economic centers extend their influence’ (Limtanakool et
al., 2007a, p. 2129). They clearly refer to the dispersed structure of a polycentric region; this can be at
J.W. Bruijsten

Polycentricity: In search of the ‘pur-fect’ region
the inter- or intra-urban scale. Furthermore, Jansen (1993) argues that (multi-directional) commuting
flows reflect the development of multi-centered urban regions. This is also emphasized by Clark and
Kuijpers-Linde (1994), Van der Laan (1998) and Schwanen (2002). For the reasons mentioned in this
paragraph, this thesis uses commuting flows to study the development of the urban structure of Veneto.
Multi-nodality
In the monocentric model, commuting flows are aimed at the city centre, indicating concentration of
employment in the CBD (Hincks and Wong, 2010). Commuting flows aimed at the city centre is also
called mono-nodality (Clark and Kuijpers-Linde, 1994). Individuals undertaking these commutes are
primarily living in the suburbs. However, as this thesis focuses on polycentricity, multi-nodality will now
be discussed.
Orfeuil and Salomon (1993) argue that the residential suburbanization and job scattering (see section
2.2) have caused new spatial relations in commuting; it has led to multi-directional commuting flows.
These new spatial relations have led to a multi-nodal pattern (Clark and Kuijpers-Linde, 1994), where the
local centers in the region compete with the traditional central city (Van der Laan, 1998). Multi-nodality
basically means the presence of several nodes in an area. It ‘emphasizes the existence of
multidirectional interconnections’ (Van Nuffel and Saey, 2005, p. 321). In other words, multi-nodality
refers to the existence of multi-directional commuting flows. Section 2.1 showed that these are essential
for identifying a polycentric region. Multi-nodality is thus a crucial characteristic of polycentricity.
Multi-nodality exists of both ingoing and outgoing commuting flows. Ingoing commuting is defined as
individuals travelling to one specific municipality for their work coming from outside that municipality.
Outgoing commuting is defined as individuals travelling from one specific municipality for their work
going to another municipality.
For example, ingoing commuting flows are relevant for identifying a central city’s dominance
(Limtanakool et al., 2007a). This can be measured by the level of nodality 1 (N1), as previously
performed by Van der Laan (1998). Outgoing commuting flows can be used to determine the outward
openness of a FUR and are therefore needed to determine the level of functional polycentricity at the
inter-urban scale.
J.W. Bruijsten
Polycentricity: In search of the ‘pur-fect’ region
3.2 In- and outgoing commuting
The previous section showed that ingoing commuting can be used to determine the importance of
central cities. This refers to functional polycentricity as the total number of persons that commute into a
city indicates how much employment that city has generated for people living outside that city. This
section continues with the level of nodality, and presents a framework for identifying four different
kinds of commuting flows, as previously performed by Van der Laan (1998) and extended by Schwanen
et al. (2004). In other words, it continues with the level of functional polycentricity, which is indicated by
the different kinds of commuting flows. This refers to polycentricity at the intra-urban scale.
Aguilera (2005) argues that a dispersed distribution of households and employment have shortened
commuting distances, because individuals locate near their local economic center. According to Levine
(1992, cited in Aguilera, 2005) a polycentric region shows a pattern where the suburbs attract a great
part of the commuting flows. This means that the commute is going from the suburbs to other suburbs.
The results from Aguilera (2005) show these commuting flows for Lyon and Marseille with an increase
between 1990 and 1999. Results from Clark and Kuijpers-Linde (1994) show less ingoing commuting into
the central city and more commuting to and from the suburbs for the Randstad and Southern California.
Both results imply a move to a (more) dispersed system (Van der Laan, 1998) and to more functional
polycentricity.
The in- and outgoing commuting flows result in four different kinds of commuter flows (Van der Laan,
1998):
* Traditional commuting; from the suburbs into the central city (N1).
* Reverse commuting; from the central city to the suburbs (N2).
* Locally employed commuting; central city commuters stay in the central city (1-N2).
* Cross commuting; from the suburbs to other suburbs (1-N1).
The term in brackets refers to the nodality (see previous section and chapter 5). Schwanen et al. (2004)
has extended this framework and presented a schematic representation of the corresponding types of
DUS (see chapter 4):
J.W. Bruijsten
Polycentricity: In search of the ‘pur-fect’ region
Figure 3.1: Types of DUS (Schwanen et al., 2004, p. 313)
Figure 3.1 shows which way the dominant commuting flows go. However, this picture shows these flows
between the core city and the suburbs. Chapter 2 showed that a polycentric region in characterized by a
similar distribution of cities, which corresponds with morphological polycentricity. The difference in the
circles must therefore be ignored if morphological polycentricity is high.
The centralized system corresponds to the traditional monocentric model (N1). The decentralized
system shows ‘that the suburbs are complementary to the central city and important for job supply’
(Van der Laan, 1998, p. 239) (N2 and 1-N1). In this system the commuting flows are multi-directional.
The self contained system resembles cross-commuting and locally employed commuting, where the
central city is contained and the suburb commuters commute to other suburbs (1-N2 and 1-N1). Finally,
in the exchange commuting system there are reciprocal commuting flows corresponding to the
emergence of employment in the suburbs (N1 and N2).
Furthermore, functional polycentricity shows a multi-directional pattern of commuting flows. Figure 2.1
showed how this looks like. When functional polycentricity is established, it means that the commuting
flows within are multi-directional. The decentralized system shows functional polycentricity. This thesis
argues that the Veneto region is undergoing a move to a more polycentric structure.
J.W. Bruijsten

Polycentricity: In search of the ‘pur-fect’ region
This chapter identified commuting as the journey from home to work with crossing at least one
municipality border. It showed why commuting flows are used to analyze the urban structure. It argued
that in a polycentric region commuting flows are multi-directional which refers to multi-nodality. Four
levels of nodality are introduced. Based on the relationship between these two nodalities four different
kinds of systems are presented where the decentralized system corresponds with a polycentric region.
J.W. Bruijsten

Polycentricity: In search of the ‘pur-fect’ region
Chapter 4: Veneto
This chapter will introduce the Veneto region. The specialization of the different cities will first be
discussed (section 4.1) where after the FURs in this region will be defined (section 4.2). This chapter will
finalize the theoretical part of this thesis and chapter 5 will continue with the empirical part.
4.1 Veneto
For this thesis, the Veneto region will be analyzed in two time periods; 1991 and 2001. The Veneto
region contains similarities with the Randstad, because both regions have multiple neighboring cities
(Treviso, Vicenza, Verona, Padova, Venice, Belluno and Rovigo in Veneto and Rotterdam, Utrecht, Den
Haag and Amsterdam in the Randstad) with no city as the dominant one. The cities of both regions have
specialized in different functions: Kantor (2006) argues that Amsterdam has developed new economic
activities, especially in the financial sector. Furthermore, Amsterdam is the most cultural city (Van Oort
et al., 2010). Rotterdam relies on their port activities for entry and distribution to Europe, and for port-
related trade (Ploeger, 2004). Van Oort et al. (2010) show that The Hague is the political capital of the
Netherlands and Ploeger (2004) shows that Utrecht serves as a commercial center for the domestic
service economy.
Travisi et al. (2010) argue that the Padova region shows a polycentric structure and Bramezza (1996)
shows that the Veneto region is organized by a classic model of cities with their own specialization,
which are related through, among others, complementarity. The Espon project (2007) identified the
North Eastern part of Italy as the most polycentric region of Europe. Venice is the city with a port and
with the most cultural value. Padova is the main trade and industrial center, especially because of their
links with central Eastern Europe. The agricultural market is most present in Treviso. Verona serves as a
major link with northern Europe with their road and rail communications (Eurostat, 1993) and Vicenza
differs from the other areas as it is the most advanced and dynamic manufacturing area. Rovigo has a
mixed economy with agriculture and industry as most dominating3. The Central Veneto region (Padova, 3 http://www.sapere.it/enciclopedia/Rovigo+%28provincia%29.html
J.W. Bruijsten

Polycentricity: In search of the ‘pur-fect’ region
Treviso and Venice) is argued to be the most important area of the Italian economy (Bramezza, 1996;
Besussi et al., 1998). Camagni and Salone (1993) argue that the Central Veneto region is characterized
by polycentricity where the functions between these cities are efficient organized. Cosgrove (2007)
argues that Vicenza also comprises the wealthy Veneto region, as it dominates the manufacturing of
gold in Europe and he also argued that Verona is one of the larger cities in this region. Figure 4.1 shows
that the northern part of the province of Belluno is characterized by mountainous areas, where
population is gradual diminishing (Eurostat, 1993). This region and Rovigo both ‘have declining and
ageing population’ (Eurostat, 1993, p. 187). It is for all these reasons that Rovigo and Belluno are not
part of the wealthy economy of the Veneto region. They are therefore excluded from the analysis in this
thesis (see also chapter 5). Figure 4.1 shows the Veneto region and where the different (central) cities
are located:
J.W. Bruijsten

Polycentricity: In search of the ‘pur-fect’ region
Figure 4.1: Map of Veneto (http://viaggi.virgilio.it/images/cartine/veneto.jpg)
4.2 FURs in Veneto
Section 2.7 provided the general definition of the FUR. This paragraph will define the FURs in Veneto.
For the FURs in Veneto, ‘municipalities that exchange more than 75 percent of their daily home-work
trips are aggregated’ (Cristaldi, 2005, p. 271) in one FUR. This implies that at least 75 percent of the
commuters have a destination within the same FUR; i.e. the commuting flows are self-contained such
that 75 percent of the employed also live in the same area and 75 percent of the residents also work in
that area. Van der Laan (2010) uses almost the same classification, but takes 70 percent as a threshold
J.W. Bruijsten

Polycentricity: In search of the ‘pur-fect’ region
for delimiting the FUR. The Italian National Institute for Statistics (ISTAT) began in 1981 with defining
FURs in Italy and did so every 10 years. There are currently 34 FURs in Veneto4:
Figure 4.2: FURs in Veneto. Stata output. Colored are the different provinces.
For example, the two figures below show the FURs of the province of Verona (4.3) and the municipalities
of the province of Verona (4.4). In some cases the administrative boundaries of a municipality belong to
one province, but it belongs to a FUR of a different province. This follows from the definition of the FUR
that at least 75 percent of the local commuters have a destination within the FUR the municipality
belongs. The full list of municipalities and FURs in the Veneto region is found here5.
4 http://dawinci.istat.it/daWinci/jsp/MD/misc.jsp?p=2&pd=610 and http://www.istat.it/ambiente/cartografia/5 http://dawinci.istat.it/daWinci/jsp/MD/download/sll_sist_loc_lav.xls and http://www.istat.it/strumenti/definizioni/comuni/elenco_comuni_italiani_30_giugno_2010.xls
J.W. Bruijsten
Polycentricity: In search of the ‘pur-fect’ region
132: Bovolone133: Grezzana134: Legnago135: Malcesini136: San Bonifacio137: San Giovanni Ilarione138: Verona
Figure 4.3: FURs in Verona. Stata output Figure 4.4: Municipalities in Verona. Stata output
This chapter introduced the Veneto region. Veneto consists of several neighboring cities of similar size,
which are characterized by their own specialization. The peripheral provinces of Belluno and Rovigo are
excluded from the analysis. Hence, the Veneto region consists of 24 FURs in which 75 percent of the
commuters have a destination within the same FUR.
J.W. Bruijsten

Polycentricity: In search of the ‘pur-fect’ region
Chapter 5: Data
The previous chapters investigated the necessary concepts to study the development of the urban
structure of Veneto. This chapter will show how the data looks like (section 5.1) and it will present the
methodology this thesis uses to investigate morphological and functional polycentricity at the intra- and
inter-urban scale (section 5.2).
5.1 Description of data
The ISTAT collects every 10 years a ‘census’ on commuting patterns. Although a census is usually at the
individual level, this particular census aggregates the number of persons when they make exactly the
same trip. The second and fourth row of table 5.1 are examples of these aggregate numbers. This thesis
uses 4 sets of those data, namely both in- and outgoing commuting in the years 1991 and 2001. It means
that for all people commuting to and from one specific municipality data is collected. The following table
presents a minor piece of the ingoing data from 1991:
Prov. of
origin
Mun. of
origin
Gen-
der
Modal
split
Occupatio-
nal status
Time of
departure
Travel
time
Prov. of
dest.
Mun. of
dest.
Number of
persons
23 6 1 1 2 2 3 23 6 1
23 6 1 1 2 3 1 23 6 64
23 6 1 1 2 3 1 23 43 1
23 6 1 1 2 3 1 23 91 1
23 6 1 1 2 4 1 23 6 38
23 6 1 1 2 4 1 23 91 1
23 6 1 2 1 1 4 23 42 2
Table 5.1: Example of commuting pattern matrix
The first two columns rank the province and municipality of origin from the commuter. The provinces of
Veneto are: Verona (23), Vicenza (24), Belluno (25), Treviso (26), Venice (27), Padova (28) and Rovigo
(29). Gender is either male (1) or female (2). The modal split refers to the means of transport: on foot,
J.W. Bruijsten

Polycentricity: In search of the ‘pur-fect’ region
bike or other (1), train, tram or subway (2), bus (3), private car as driver (4), private car as passenger (5)
or moped (6). The 2001 database contains more variables for modal split, especially for public transport.
However, this thesis does not use public transport. The few other variables the 2001 database contains
that the 1991 database does not contain are also not used for this thesis. For the occupational status,
the only difference is if the commute is made for study (1) or work (2) purposes. For the time of
departure four classifications are used: before 7:14 (1), between 7:14 and 8:14 (2), between 8:14 and
9:14 (3) and after 9:14 (4). For travel time it is: less than 15 minutes (1), between 15 and 30 minutes (2),
between 31 and 60 minutes (3) and more than 60 minutes (4). The last three columns are the province
and municipality of destination of the commuter and the number of persons that made that particular
trip. For example, the third row shows a commute from Verona, Bardolino to Verona, Lazise. One male
made this commute on foot, by bike or some other way for work purposes. He left between 8:14 and
9:14 and it took him less than 15 minutes.
The exclusion of Rovigo and Belluno is also marked by the total number of persons commuting into and
out of these two provinces because that number is about four to five times as small as it is for the other
provinces, which is shown in table 5.2:
Province Year Ingoing Outgoing
Belluno 1991 27888 28410
2001 33888 34131
Rovigo 1991 27488 30835
2001 31022 37220
Verona 1991 107194 107809
2001 124031 124337
Vicenza 1991 138287 133033
2001 163244 154250
Treviso 1991 139093 140727
2001 162108 160383
Padova 1991 149607 148844
2001 166832 164890
Venice 1991 103754 108149
2001 108271 118833
J.W. Bruijsten
Polycentricity: In search of the ‘pur-fect’ region
Table 5.2: Total number of persons commuting into or out of the different provinces
5.2 Methodology
This section will discuss the methodology for measuring polycentricity in the Veneto region and will
present the corresponding hypotheses. Morphological polycentricity will first be addressed and
functional polycentricity secondly. In turn, these sections are divided in the analysis at the intra- and
inter-urban scale.
Morphological polycentricity
Intra-urban scale
To measure morphological polycentricity at the intra-urban scale, this thesis uses three methods: the
HHI, Moran’s I and LISA. The field of ‘industrial organization’ developed the HHI (Van der Laan, 2010),
but can also be used to measure spatial patterns (Guillain and Le Gallo, 2006). Other existing indices to
measure spatial patterns are the Krugman Specialisation Index, the Ellison and Glaeser index or the
locational Gini coefficient (Guillain and Le Gallo, 2006; Dominics et al., 2007). The HHI is used in this
thesis because of its easy way to compute. It directly shows the level of morphological polycentricity of a
region. The HHI is ‘a concentration measure based on the sum of the squared market changes of all
firms in the industry’ (Lipczynski et al., 2005). For this thesis, the HHI is measured as the sum of the
squared total number of ingoing commuting of the municipalities in the FURs6. The HHI ranges from 0 to
1, where 1 means a concentrated spatial pattern (Van der Laan, 2010). Therefore, low values of the HHI
mean high morphological polycentricity. The formula for the HHI is:
HHI=∑i=1
N
S i2
N refers to the total number of regions or municipalities used and Si to the market share, calculated as
the share of employment in one municipality, of region i in the total region. Although the data provided
the trips made for study reasons, they are not used here because for the HHI this thesis is concerned
about whether employment is concentrated or dispersed. If there are N regions, the maximum of the
index is 1 which indicates a concentrated spatial pattern; i.e. there is one city in the region where all
6 This includes the people ‘commuting’ inside one municipality. Therefore, the HHI indicates employment.
J.W. Bruijsten

Polycentricity: In search of the ‘pur-fect’ region
commuters are going to. This is the lowest level of morphological polycentricity possible. The minimum
is 1/N, which indicates that the N regions are of similar size. In the analysis only the five largest
municipalities are taken into account for calculating the HHI, because the HHI is sensitive to the number
of municipalities used (Van der Laan, 2010). Furthermore, the difference between the HHI of the 5
largest municipalities of a FUR and the HHI of all municipalities of that same FUR stayed constantly very
small.
For example, for two municipalities (001 Affi and 021 Castel d'Azzano) in the province and the same FUR
of Verona N is 2. There are 853 people who are commuting to and within Affi and 2627 people who
commute to and within Castel d'Azzano. The total number of people working in these two municipalities
is thus 3480. The minimum of the HHI is then 1/2= 0.50.
HHI=∑i=1
2
( 8533480 )
2
+( 26273480 )
2
=0.630
The HHI gives 0.630 where the minimum is 0.50. The level of morphological polycentricity is in this
example not that high: Affi and Castel d'Azzano are not of similar size. However, the HHI is also not so
high to indicate a concentrated structure of employment.
The disadvantage of the HHI is that it does not show where employment is spatially clustered.
Therefore, Moran’s I will also be used to show morphological polycentricity. Riguelle et al. (2007) argue
that to understand the urban structure of cities Moran’s I can be used and that it provides an idea of
how employment is spatially organized. Nevertheless, Moran’s I does not ‘identify local spatial patterns
of agglomeration’ (Guillain et al., 2006, p. 8).
Moran’s I indicates spatial autocorrelation (SA). SA measures the way observations are distributed
(Goodchild, 1986). It reflects Tobler’s (1970, p. 236) first law of geography: ‘everything is related to
everything else, but near things are more related than distant things’. SA shows if objects or activities in
one place are (dis)similar to other objects or activities located nearby where the proximity between the
places where the object or activity is located will determine the level of SA (Goodchild, 1986). In this
thesis Moran’s I indicates if employment in the different municipalities of one FUR is spatially
autocorrelated. This means that if Moran’s I indicates positive and significant SA employment in the
municipalities is clustered in space, i.e. employment is concentrated. The null hypothesis of Moran’s I is
J.W. Bruijsten

Polycentricity: In search of the ‘pur-fect’ region
no (global) SA where the expected value of Moran’s I is: E (I) = -1/ (N-1) (Pisati, 2001). The values of
Moran’s I lie between 1 and -1 (Vasiliev, 1996). If it approaches 1 it means strong positive SA which
indicates concentration of employment. This means that one location has neighboring locations with
similar low or high employment values7. If it approaches -1, it means strong negative SA which indicates
a dispersed structure of employment. In other words, the location with negative SA has neighboring
locations with dissimilar values8. When Moran’s I approaches the expected value, -1/ (N-1), employment
is randomly distributed. High levels of morphological polycentricity intuitively correspond with negative
SA. The formula for Moran’s I is shown in the appendix.
Moran’s I requires a spatial weights matrix to define which observations are neighbors. This matrix
‘allows formalizing the contiguity between spatial observations and assesses the significance of the
results produced’ (Baumont et al., 2004, p. 12). However, this implies that Moran’s I is very sensitive to
the definition of neighborhood (Riguelle et al., 2007). This is solved by using several levels of separation,
which is shown in figure 5.1:
Figure 5.1: Neighborhood definitions (Bivand and Portnov, 2004, p. 3)
This thesis uses a combination of B and D. The definition of neighborhood is selected using distance
bands in Stata. Moran’s I takes for every individual location the same distance band (B). However, if the
7 http://help.arcgis.com/en/arcgisdesktop/10.0/help/index.html#//005p00000012000000.htm8 Idem
J.W. Bruijsten

Polycentricity: In search of the ‘pur-fect’ region
distance band is set too small some observations may have no neighbors. The distance band can also not
be too large because no observation should have all other observations as a neighbor 9. This is observed
in Stata when creating the weights matrix; it gives the largest minimum distance and the smallest
maximum distance. The former indicates at which distance all municipalities have at least one neighbor
and the latter shows at which distance at least one municipality has all other municipalities as a
neighbor. Therefore a combination of B and D is used. A and C from figure 5.1 are for these reasons not
useful. The latter defines neighbors based on distance contiguity and the former defines neighbors when
regions have adjacent borders. Both can give biased results.
It implies that for every province there is one unique distance band which serves best for that province.
For example, for the province of Verona the municipality of Verona is centered in that province and it is
the biggest municipality (see figure 4.4). The distance band used is somewhat bigger than the largest
minimum distance so that this municipality has enough neighbors. The province of Venice has another
structure (see figure 1 in the appendix). First of all, it is positioned at sea and secondly, it is characterized
by multiple larger municipalities around Venice and smaller ones on the edges of the province. The
distance band for the province of Venice thus has to be larger than the largest minimum distance.
Intuitively, for the FURs which have low levels of the HHI (which indicates a dispersed pattern of
employment) Moran’s I should indicate negative SA and vice versa. The results of the analysis will
indicate whether this is true, as this has not been previously tested.
To identify local spatial patterns of agglomeration, LISA are used for the ‘assessment of significant local
spatial clustering around an individual location’ (Anselin, 1995, p. 94). In other words, for the
measurement of employment concentration the ‘relative position between the spatial units and the
distance between them matters’ (Baumont et al., 2004, p. 6). LISA indicates SA at the local level, i.e. it
indicates SA of each individual observation (Anselin, 1995). Hence, this thesis uses LISA to detect
significant spatial concentration patterns around each observed location, which are also called hotspots
(Pisati, 2001).
LISA computes four different local SA statistics: the local Moran’s I, Geary’s C, Getis and Ord’s G and
Ord’s G*. These statistics should satisfy two requirements (Anselin, 1995, p. 94): ‘1) the LISA for each
9 http://help.arcgis.com/en/arcgisdesktop/10.0/help/index.html#//005p00000012000000.htm
J.W. Bruijsten
Polycentricity: In search of the ‘pur-fect’ region
observation gives an indication of the extent of significant spatial clustering of similar values around that
observation and 2) the sum of LISAs for all observations is proportional to a global indicator of spatial
association’. The null hypothesis and the values of the LISAs are interpreted in the same manner as
Moran’s I. Negative SA should thus indicate high levels of morphological polycentricity.
Calculating Getis and Ord’s G and Ord’s G* requires using a non-standardized binary weights matrix. A
binary weights matrix takes the value of 1 if locations are within a pre-specified band width (distance)
and 0 otherwise. This thesis only has access to X and Y coordinates given in meters. The binary option
will not be used to avoid problems converting these coordinates. This means that the computed weights
matrix is based on distance contiguity (Anselin, 1993). The several levels of separation used with
Moran’s I will determine which band width serves best for the LISA. Furthermore, the weights matrix
constructed will be row-standardized which means that all the elements in each row sum to 1 (Anselin,
1993). This is performed such that the Moran scatterplot can also be visualized. This scatterplot can be
interpreted as a normal linear regression model and can therefore ‘indicate observations that do not
follow the overall trend which represents useful information on local instability and non-stationarity’
(Anselin, 1993, p. 9). However, interpreting local instability and non-stationarity is beyond the scope of
this thesis.
Important in the interpretation in the LISA is that significance testing for local SA can be problematic and
‘the reported p-values should be regarded as an approximate indication of statistical significance.
However they are informative when employed in an exploratory manner’ (Sokal et al., 1998 cited in
Pisati, 2001, p. 29). The Moran scatterplot is of relevance, because it can be presented in two ways: 1)
divided into four quadrants which all indicate different levels of spatial association for each individual
observation and 2) the Moran scatterplot values can be easily mapped to explore where and how the SA
is located (Pisati, 2001). The Moran scatterplot is thus used in this thesis to explore the spatial data.
This thesis expects that the Veneto region is growing towards a more polycentric structure at the intra-
urban scale:
Hypothesis 1: the level of morphological polycentricity has increased in the FURs between 1991 and
2001.
J.W. Bruijsten

Polycentricity: In search of the ‘pur-fect’ region
Inter-urban scale
Morphological polycentricity at the inter-urban scale can only be measured using the HHI. The HHI will
be calculated for the different provinces. This index is explained in the previous section. Moran’s I and
LISA cannot be calculated due to limits of Stata in the size of the weights matrix. Employment and
households are becoming more dispersed over an area when polycentricity develops. Therefore:
Hypothesis 2: the level of morphological polycentricity has increased in the different provinces in Veneto
between 1991 and 2001
Functional polycentricity
Intra-urban scale
Functional polycentricity at the intra-urban scale is measured using two levels of nodality. Section 3.1
introduced N1 which indicates the importance of central cities:
Nodality1=ICcIC t
∗100
ICc = Incoming commuting in the central city emerging from the FUR
IC t = All incoming commuting in the areas of the FUR, emerging from the FUR.
N2 is calculated as follows:
Nodality2=OC c
OCt∗100
OCc = Outgoing commuting of the central city directed at the FUR.
OC t = All outgoing commuting of all areas of the FUR, directed at the FUR.
J.W. Bruijsten

Polycentricity: In search of the ‘pur-fect’ region
These nodalities measure functional polycentricity at the intra-urban scale. Four different kinds of
commuter flows are separated which are presented in table 5.3:
From / to Central City Suburbs
Central City 1-N2 N2
Suburbs N1 1-N1
Table 5.3: Overview of the direction of N1 and N2 (Van der Laan, 1998, p. 239)
This table shows the direction of the commuting flows and which nodality belongs to it. Functional
polycentricity refers to the decentralized system, where the commuting flows are multi-directional.
Functional polycentricity also reflects the exchange commuting and self-contained system. The former
shows reciprocal commuting flows between the central city and the suburbs and the latter multi-
directional commuting flows between the suburbs (1-N1). However, functional polycentricity is the
highest when FURs show the decentralized system. The other two correspond with the emergence of
polycentricity, especially in the suburbs. Finally, in the centralized system the central city is the most
important for employment: the commuting flows are from the suburbs to the central city and individuals
living in the central city also work there.
J.W. Bruijsten
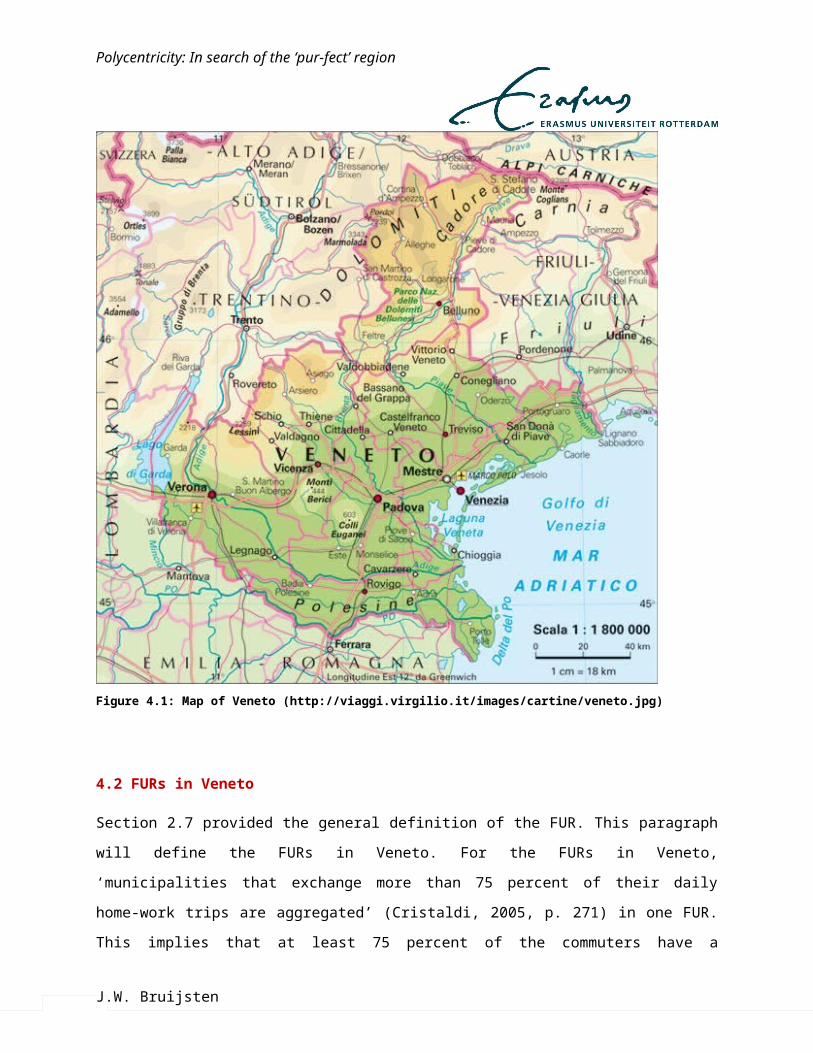
Polycentricity: In search of the ‘pur-fect’ region
051015202530350
5
10
15
20
25
30
35
40
45
50
55
60
65
70
75Four systems based on N1 and N2
Nodality 2
Nod
ality
1
Decentralized
Centralized
Self contained
Exchange com-muting
Figure 5.2: Types of FUR based on N1 and N2.
Figure 5.2 shows these systems distinguished based on the relationship between N1 and N2. Van der
Laan (1998) takes the average as a threshold for N1 and N2, which are 65 percent and 25 percent. This
thesis will also use the average of the results to determine the threshold. These are 36 percent for N1
and 19 percent for N2.
Hypothesis 3: the level of functional polycentricity has increased in the FURs between 1991 and 2001.
Hypothesis 4: the FURs in the Veneto region show the decentralized system.
Inter-urban scale
Section 2.5 argued that a true PUR is characterized by a high degree of inward and outward openness.
This implies that between the different FURs reciprocal commuting flows exist. Furthermore, chapter 2
J.W. Bruijsten

Polycentricity: In search of the ‘pur-fect’ region
argued that the urban spatial structure of cities and regions is changing. The monocentric model appears
to be transcended by the polycentric model because of the dispersion of employment and households:
Hypothesis 5: the level inward and outward openness has increased in the different FURs between 1991
and 2001.
IO and OO is defined and measured as follows: IO is the total number of ingoing commuters into each
municipality of the FUR coming from outside the FUR as a share of the total number of ingoing
commuters into the municipalities of the FUR (Van der Laan, 1998; Van Nuffel and Saey, 2005):
IO=( IC¿¿o−IC ti)∗100 ¿
ICo= ingoing commuters into the FUR from outside the FUR
ICt i = ingoing commuters into the FUR
OO is the total number of outgoing commuters originating from the FUR directed outside the FUR as a
share of the total number of outgoing commuters originating from the FUR (Van der Laan, 1998; Van
Nuffel and Saey, 2005):
OO=(OC¿¿o−OC ¿)∗100¿
OCo = outgoing commuters originating from the FUR directed outside the FUR
OCto = outgoing commuters originating from the FUR
The definition for the FURs in Veneto (see section 4.2) states that at least 75 percent of the daily
commuting flows are within the FUR. This means that there has to be two thresholds, one for IO and
one for OO, to determine whether the Veneto region is characterized by a polycentric structure at the
inter-urban scale. Patuelli et al. (2009; 2010) determine the cut-off at 37 percent for IO and 38 percent
for OO. Van Nuffel and Saey (2005) find high IO from 40 percent and high OO from 36 percent. Van der
Laan (1998) finds a multi-nodal system with values for IO from 25 percent (but none higher than 36
percent) and for OO from 30 percent. All these studies determine their cut-off afterwards. This thesis
does the same and takes the mean of IO and OO as thresholds. It resulted in 38 percent for IO and 42
percent for OO.
J.W. Bruijsten

Polycentricity: In search of the ‘pur-fect’ region
Table 5.4 gives an overview of the methods this thesis uses to measure both aspects of polycentricity:
Morphological
polycentricity
Functional
polycentricity
Intra-urban scale HHI, Moran’s I and LISA
(Hypothesis 1)
N1 and N2
(Hypotheses 3 and 4)
Inter-urban scale HHI
(Hypothesis 2)
IO and OO
(Hypothesis 5)
Table 5.4: Methods used to measure polycentricity
J.W. Bruijsten
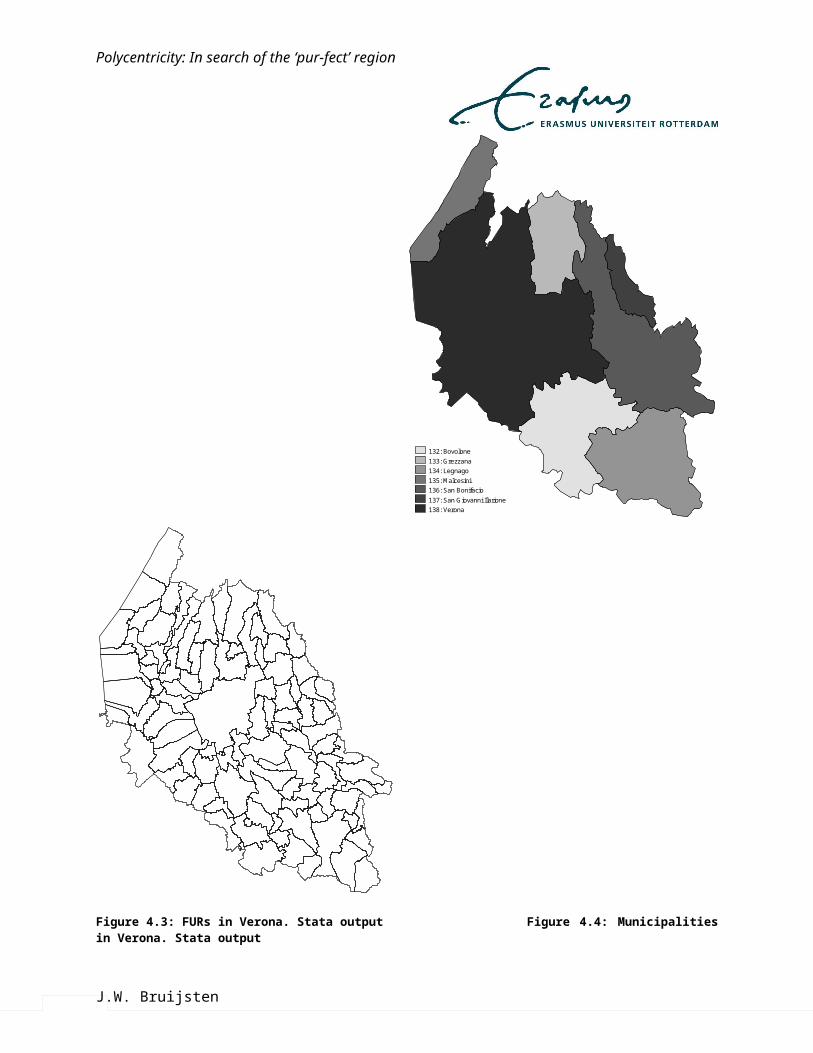
Polycentricity: In search of the ‘pur-fect’ region
Chapter 6: Results
This chapter will discuss the results of the tested hypotheses. First, the results of morphological
polycentricity at the intra- and inter-urban scale will be presented (section 6.1). That is because the
results of the HHI at the inter-urban are calculated together with the HHI at the intra-urban scale.
Second, the results of functional polycentricity will be presented in the same order (section 6.2). An
overview of the results will be presented thirdly (section 6.3), where also morphological and functional
relationships will be investigated. Fourthly, the results will be discussed (section 6.3). Limitations of this
thesis will conclude this chapter (section 6.4).
6.1 Morphological polycentricity
Intra-urban scale
1991
The results of the HHI are presented in tables 1 - 5 in the appendix. In 1991 the FURs of the main central
cities10 have relatively high levels of the HHI indicating a clustered pattern of employment. Although the
FUR of Treviso has a relatively low HHI, it is still higher in comparison with the other FURs in the same
province. The main central cities thus seem to be important for employment. The results of the
nodalities – functional polycentricity in section 6.2 – will show whether this can be confirmed.
The FURs of Malcesini, San Giovanni Ilarione, Grezzana (all Verona) and Asiago (Vicenza) consist of
respectively three, four, six and five municipalities. This could be an indication of why all four FURs have
high levels of the HHI. Results of the LISA will show if the employment in these FURs have a ‘pure’
employment concentration structure. In other words, it will show whether these FUR are local economic
centers.
10 Verona, Vicenza, Treviso, Venice and Padova.
J.W. Bruijsten

Polycentricity: In search of the ‘pur-fect’ region
Leaving these four FURs aside, almost all of the FURs surrounding the FURs of the main central cities
have lower levels of the HHI than the FUR of the main central city. This indicates a dispersed structure of
employment. However, the FURs of Legnago (Verona), Schio (Vicenza) and San Dona’ di Piave (Venice)
still have a high level of the HHI (over 0.20). This indicates that employment in these FURs is less
dispersed or even concentrated in comparison with all the other FURs. The results of the LISA will again
be used to show whether employment in these three FURs serve a true concentrated structure.
2001
Turning to the results of the HHI for 2001, the main point arising is that in all FURs of the main central
cities the HHI has decreased with more than 10 percent. Employment here is thus less concentrated
than 10 years before. However, with only three exceptions, the FURs surrounding the FURs of the main
central cities still have lower levels of the HHI. It thus seems that the FURs of the main central cities
became less concentrated but the surrounding FURs still remain more dispersed. There appears to be no
clear structure in the in- or decreasing levels of the HHI in these FURs. On top of that, both the in- and
decreases for the surrounding FURs are small, either relatively or absolutely.
The FURs with the small number of municipalities have all increasing levels of the HHI; Malcesini even
with an increase of 21.5 %. The same reasoning as before holds here. The results of the LISA will show
whether these levels are accurate.
In sum, the HHI shows that the level of morphological polycentricity has increased in the FURs of the
main central cities between 1991 and 2001 indicating a less concentrated pattern of employment. The
surrounding FURs are all more dispersed in 1991 and almost all more dispersed in 2001 than the main
central city FURs, with the exception of three FURs. However, these consist of a small number of
municipalities.
Moran’s I
The results of Moran’s I are presented in table 7 in the appendix. A positive Moran’s I (second column)
refers to positive SA which indicates a clustered structure of employment; i.e. one location has
neighboring locations with similar low or high employment values. A negative Moran’s I refers to a
dispersed structure; i.e. one location has neighboring locations with dissimilar values. When Moran’s I
J.W. Bruijsten
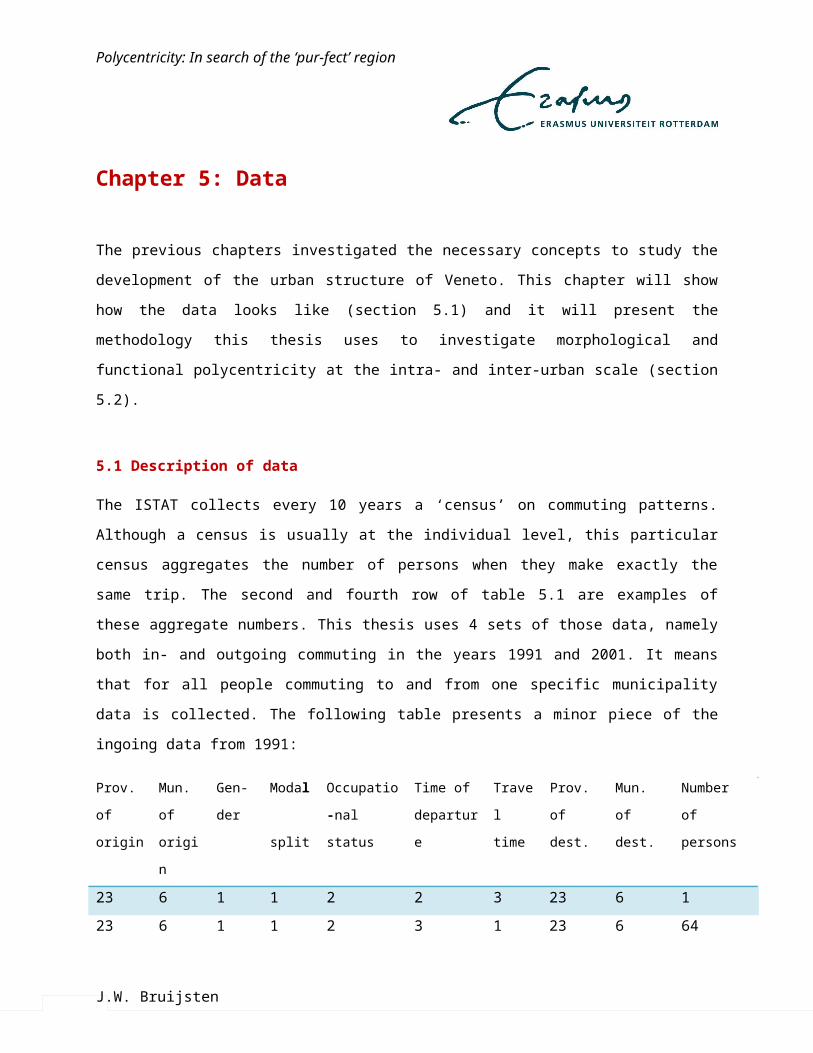
Polycentricity: In search of the ‘pur-fect’ region
approaches the expected value (E (I), third column) employment is randomly distributed. The last two
columns rank the z-score and the p-value. Interpretation of these values is according to the normal
distribution (see notes table 7).
For both 1991 and 2001 Moran’s I is significant for Verona, Venice and Padova. The null hypothesis of no
global SA can thus be rejected. The index is just above the expected value which indicates a limited
amount of positive SA. However, for Verona and Padova the z-score is very high which means that
employment in these two provinces is spatially clustered11. The z-score of Venice is not high (1.789 and
1.832, with a normal distribution the critical value is 1.96 when significant at the 0.05 level) which
means that employment in the province of Venice is not as spatially clustered as it is for Verona and
Padova. This result could be influenced by the particular structure of the province of Venice (see figure
4.2). The LISA will investigate this further.
For Treviso and Vicenza in 1991 the null hypothesis cannot be rejected. The spatial pattern of
employment can be a result of spatial randomness12. This means that employment in these two
provinces appears not to be clustered or dispersed. In 2001 Moran’s I is significant at the 0.10 level for
both provinces. However, Moran’s I is very small and the z-score is below 1.65 but did increase in both
provinces. This result seems to indicate a small amount of spatial clustering of employment in 2001.
LISA
The results of the LISA are shown in table 8 - 12 in the appendix and will be discussed per province. The
same interpretation of Moran’s I is applied for the LISA. As section 5.2 argued LISA calculates four
different indices. Only the local Moran’s I is shown as the others cannot be used to visualize the Moran
scatterplot and because interpretation is then more comparable with Moran’s I.
Verona
The results of Moran’s I are confirmed by the LISA. Where Moran’s I shows significant spatial clustering,
the LISA indicate significant positive spatial autocorrelation in three municipalities in 1991; i.e. Verona,
San Giovanni Lupatoto and San Martino Buon Albergo (B.A). The latter two are located just south and
east of the city of Verona respectively. For 2001 the same results holds with increasing clustering of
11 http://help.arcgis.com/en/arcgisdesktop/10.0/help/index.html#//005p0000000t000000.htm12 Idem
J.W. Bruijsten

Polycentricity: In search of the ‘pur-fect’ region
employment in Verona and San Giovanni Lupatoto and a small decrease in San Martino B.A. Also the
municipality of Bussolengo seems to be spatially clustered, which is located between Verona and ‘Lake
Garda’. However, it is only significant at the 0.10 level and the z-score is only 1.302. It seems like that
employment here is growing as in 1991 there was no significant result.
Where the results of the HHI show an increase in morphological polycentricity in the FUR of Verona, the
results of Moran’s I and the LISA show an overall decrease in morphological polycentricity. In other
words, the former reflects a dispersion of employment and the latter reflects clustering. However, the
clustering of employment is found in three municipalities. There seems to be no other clusters or
outliers in the rest of the province. What the results of all three methods do show is a clustered
structure of employment which is revealed near and in the city of Verona. This clustering will be
investigated further in section 6.2 where functional polycentricity is addressed.
Vicenza
The results of the LISA explain the not significant result of Moran’s I. In 1991, there is significant negative
spatial autocorrelation in the municipalities of Vicenza and Bassano del Grappa. Both municipalities
seem to have a dispersed structure of employment, with a high level of employment in these two
municipalities and low levels in the surrounding municipalities. The results of the HHI confirm this for
Vicenza, but not for Bassano del Grappa. However, the HHI is measured at the FUR level where the LISA
looks at each municipality for the entire province. Furthermore, Arzignano and Montecchio Maggiore
seem to be positive spatially autocorrelated in 1991 (the latter at the 0.10 level). Employment in both
municipalities is clustered. However, the z-score is below the critical value. These municipalities both
belong to the FUR of Arzignano which has an HHI of 0.134. Both LISA and the HHI thus show a clustered
structure to a limited extent.
For 2001, employment in Bassano del Grappa has become more spatially dispersed. This means that in
this municipality employment has grown and in the surrounding municipalities there are low levels of
employment. This result is confirmed by the HHI which shows a two percent increase. The LISA of
Vicenza has decreased and is only significant at the 0.10 level. Employment in 2001 is thus not that
dispersed as it was in 1991. The results of the HHI confirm this as the HHI decreased with 14.1 percent.
In other words, the LISA and the HHI show that the distribution of employment has become more
J.W. Bruijsten

Polycentricity: In search of the ‘pur-fect’ region
balanced throughout the FUR of Vicenza. Further, employment in Arzignano and Montecchio Maggiore
has become more positively spatial autocorrelated where the latter is now also significant at the 0.05
level. This means that employment is in 2001 more clustered than it was in 1991, indicating a growing
difference in the distribution in size of municipalities in the entire FUR. This result is not confirmed by
the HHI. However, the decrease is not large and the HHI remains above 0.12 which is three times as
large as it is for the entire province (see results inter-urban scale).
Furthermore, the results of the HHI for the FURs with a small number of municipalities are not
confirmed with the LISA in both 1991 and 2001. This implies that the high levels of the HHI for these
FURs are biased and that these FURs do not have a ‘pure’ concentration of employment; i.e. they cannot
be characterized as a local economic center. The high level of the HHI for the FUR of Schio is also not
confirmed with the LISA. It does indicate negative SA, but not significant. It is assumed that the results of
the HHI for Schio are biased because Schio is also characterized by a (relative) small number of
municipalities (eight).
Treviso
For 1991 and 2001 the LISA show high and increasing levels of significant positive spatial autocorrelation
in the municipality of Treviso and Villorba. Villorba is located just north of the city of Treviso. This result
can be confirmed with the HHI, because the HHI of the FUR Treviso is (one of) the highest of the FURs in
the province of Treviso. Additionally, the HHI at the inter-urban scale will show that the entire province
has a very low HHI which means that the HHI of the FUR of Treviso is relatively high.
For Vittorio Veneto the LISA in 1991 and 2001 show high and increasing levels of negative spatial
autocorrelation; Vittorio Veneto has a high level of employment and the surrounding municipalities have
low levels. However, the results of the HHI show an increase in morphological polycentricity in the FUR
of Conegliano. Investigating this FUR shows that there is another municipality (Conegliano) that has a
high absolute number of employment. LISA does not show this probably because the surrounding
municipalities have also (relatively) high levels of employment. This could be a reason why the HHI is low
and decreasing in the FUR and the LISA is negative, high and increasing in the municipality of Vittorio
Veneto. Another reason could be that the distance band is too small. Increasing the distance band to
J.W. Bruijsten
Polycentricity: In search of the ‘pur-fect’ region
15000 resulted also in significant negative spatial autocorrelation for Conegliano, but yielded odd results
for the rest of the province. Therefore the same distance band is used as with Moran’s I.
The results of the LISA confirm the result found with Moran’s I in the province of Treviso. Moran’s I
indicated in 2001 positive SA at the 0.10 level, but not in 1991. Employment seems to be clustering. The
LISA increases more for Treviso and Villorba, with positive SA, than it decreases for Vittorio Veneto and
the increasing values of the LISA are even significant at the 0.01 level where the decreasing value is not.
Venice
In the province of Venice only the municipality of Venice shows high, but decreasing levels of negative
SA between 1991 and 2001. The scatterplot for both years (figure 2 and 3 in the appendix) show that
there is a high level of employment in Venice. The municipalities surrounding Venice have low levels of
employment in 1991, which intuitively indicates that the city of Venice is attracting a lot of employment.
For 2001 the result is different because the scatterplot now indicates (relatively) high levels of
employment in the surrounding municipalities. It seems like that the city of Venice thus became less
important for job supply. The results from N1 in section 6.2 will confirm or reject this.
For San Dona’ di Piave, which yielded a high level of the HHI, the results of the LISA show negative SA
but not significant. The scatterplot shows that in 1991 the municipality of Venice is an outlier but in 2001
it is part of a cluster, probably together with San Dona’ di Piave. The particular structure of the province
of Venice is likely to influence the result of the LISA here, because the municipality of Venice is closely
located. Therefore it can be assumed that that the distribution of employment became more dispersed.
The low z-score found with Moran’s I can be explained by the FUR in the north east of the province of
Venice; Portogruaro. The scatterplot in 1991 and 2001 both indicate, although not significant, high levels
of employment in this FUR. This probably influences Moran’s I.
Padova
The significant results found for the province of Padova are for the municipality of Padova and four
other municipalities, which are surrounding the city of Padova itself. Only two of these are significant for
both years: Abano Terme and Rubano. Where Padova has a high I, these two have smaller I’s. Further,
for Abano Terme the positive AC is decreasing. These results seem contradictory with the HHI result.
J.W. Bruijsten

Polycentricity: In search of the ‘pur-fect’ region
However, the HHI measures at the FUR level. The LISA for the other two municipalities – Selvazzano
Dentro and Vigonza – is significant at the 0.10 level in 1991 but not significant anymore in 2001. This, in
combination with the decreasing AC for Abano Terme, could explain the decreasing HHI from 0.249 in
1991 to a 0.222 in 2001. This means that although the municipality Padova is becoming more important
for job supply, the other municipalities of the FUR are becoming more alike in terms of employment.
Hypothesis 1: the level of morphological polycentricity has increased in the FURs between 1991 and 2001.
Overall, hypothesis 1 cannot be rejected for the main central city FURs. It can be supported with the
results of the HHI and the LISA for these FURs. Further, hypothesis 1 cannot be rejected for some, but
not all FURs. For the FUR of Conegliano (Treviso) the LISA is showing a more equal distribution of
municipalities which is confirmed by the increasing level of the HHI. The results also support this
hypothesis for San Dona’ di Piave (Venice).
Inter-urban scale
The results of the HHI at the inter-urban scale are presented in table 6 in the appendix. In 1991, the
most concentrated province is Venice with an HHI of 0.263; it shows that employment here is clustered.
Intuitively this is because the city of Venice attracts a lot of workers in the tourist industry. Results of N1
will confirm or reject this. After Venice, Padova and Verona are less concentrated with an HHI of 0.162
and 0.140 respectively. This can be a result of the FURs of Padova and Verona having high levels of the
HHI at the intra-urban scale. The most dispersed pattern is found in Treviso (0.031) followed by Vicenza
(0.048). Employment in these provinces seems to be dispersed. This confirms the results of Moran’s I
and the LISA.
The same results hold for 2001. However, all levels of the HHI at the inter-urban scale have decreased
with more than 10 percent, Treviso and Venice even with 25 percent. This indicates that in all provinces
employment has become more dispersed over the area.
Hypothesis 2: the level of morphological polycentricity has increased in the different provinces between 1991 and 2001
J.W. Bruijsten

Polycentricity: In search of the ‘pur-fect’ region
Hypotheses 2 thus cannot be rejected. The level of morphological polycentricity did increase in the
different provinces in Veneto between 1991 and 2001 at the inter-urban scale.
6.2 Functional polycentricity
Intra-urban scale
Functional polycentricity at the intra-urban scale is measured with N1 and N2. The relationship between
these two results in four different kinds of systems as showed in section 3.2. Figure 4 and 5 in the
appendix show the results. Three FURs with the small number of municipalities – Asiago, Malcesini and
San Giovanni Ilarione – all show the exchange commuting system in both 1991 and 2001 and will not be
further discussed. The FURs with nodalities around the average will be shortly discussed. Important to
note is that there is no relationship between the two types of nodalities, in 1991 R2 is 0.0054 and in
2001 it is 0.0227. The following table shows the number of systems present in the Veneto region in both
years and the in- or decrease:
Centralized Exchange commuting
Self contained
Decentralized
1991 5 7 6 62001 5 6 9 4
Difference (%) 0 (0%) -1 (-17%) +3 (+50%) -2 (-25%)Table 6.1: Different systems in Veneto
Table 6.1 shows that there is a clear increase towards the self-contained system and decreases for the
exchange commuting and the decentralized system. The existence of a dual spatial labor market (Van
der Laan, 1998), one in the central city and the other in the suburbs, has grown between 1991 and 2001.
Section 5.2 argued that high functional polycentricity corresponds with the decentralized system and
that the exchange commuting and self contained system are more likely to reflect the emergence of
polycentricity. Hence, ‘true’ functional polycentricity decreased in Veneto between 1991 and 2001. The
presence of the self contained system, where the suburbs are complementary to each other and the
central city is contained, increased. However, the presence of the exchange commuting system with
reciprocal commuting flows between the central city and the suburbs, decreased. Hence, lower levels of
functional polycentricity increased in Veneto between 1991 and 2001. To investigate these results more
J.W. Bruijsten

Polycentricity: In search of the ‘pur-fect’ region
in-depth, the following two paragraphs will discuss the results in more detail for both years and the end
of this section will conclude and will thereby answer the hypotheses.
1991
First of all, there is a clear centralized system in Venice and Grezzana (Verona). This result is in line with
the HHI which shows an unequal employment distribution. For both FURs the central city seems to be
important for job supply. Thiene (Vicenza) has an average level of N1 but a low level of N2. This means
that central city commuters stay in the central city, but that the suburbs are not relying highly on the
central city for their job supply. The centralized system is thus only present to a limited extent in Thiene.
Secondly, the exchange commuting system, with reciprocal commuting flows between the city and the
suburbs is present in Schio (Vicenza) and San Dona’ di Piave (Venice). In both FURs especially N2 is high,
which means that the suburbs are important for the commuters coming from the central city. The
results of 2001 will show whether these two FURs have developed towards a more polycentric region.
Thirdly, there is a clear functional polycentric structure in Castelfranco Veneto (Treviso) and Bovolone
(Verona) and somewhat less in Legnago (Verona) and Conegliano (Treviso). The HHI confirm this as the
HHI of the former two is relatively low and of the latter two relatively higher in comparison with the
result of the HHI at the inter-urban scale. Fourthly, there seems to be a dual spatial labor market in four
FURs: Arzignano (Vicenza), San Bonifacio (Verona), Este and Montagnana (both Padova). It resembles
the cross commuting system which means that individuals mostly are locally employed, in the central
city or in the suburbs. Finally, the main central cities – Verona, Vicenza, Treviso and Padova – all serve
average levels of N2 and just above average levels of N1. The central city thus seems to be somewhat
important for commuters.
2001
First of all, the same FURs as in 1991 show the centralized system. Grezzana (Verona) reveals the most
change which shows that the central city became less important for labor. Secondly, the FURs which
show the exchange commuting (Schio and San Dona’ di Piave) all have less N2 which means that less
central city commuters are commuting to the suburbs. These FURs have not developed towards a more
polycentric structure. Thirdly, only three FURs now show the exchange commuting system, because the
FUR of Conegliano has become more self-contained. The other three FURs all show growth towards the
J.W. Bruijsten

Polycentricity: In search of the ‘pur-fect’ region
middle of the figure. Fourthly, the same FURs as in 1991 show the cross commuting system; all with little
change. The commuting flows thus did not really change in ten years. Finally, for all the FURs of the main
central cities N2 decreased which means that commuting is more locally employed in the central city.
The results from N1 in Venice confirm the significant SA found with the LISA for both years. The city of
Venice is important for job supply. This is also marked with the HHI at the inter-urban scale which shows
a low level of morphological polycentricity. However, the increase in morphological polycentricity is not
confirmed with this HHI. It is confirmed with the LISA because in 2001 the LISA indicates that the
municipality of Venice is part of a cluster of employment. The municipality of San Dona’ di Piave is likely
to be the reason for this result. Furthermore, the high, but decreasing HHI level of Grezzana is confirmed
with N1; the level of N1 is high in 1991, but lower in 2001. Schio also has high, but increasing levels of
the HHI. It corresponds with the exchange commuting system. The reason for the high level of the HHI
lays probably in the employment figures in the suburbs. It is likely to be unequal. Investigating these
numbers show that this is true: 825 – 12713 – 13343 – 20086 for 1991 and for 2001 944 – 14793 –
15337 – 22961 persons employed in the suburbs of Schio. This shows an unequal distribution of
employment in the suburbs
Furthermore, the results from the HHI at the intra-urban scale for the FURs of the main central cities
(without Venice) are partly confirmed with N1. N1 is for all four FURs higher as the average but it
decreased in 2001. The large decrease of the HHI, which indicates a more equal distribution of
employment, seems to be going along with a decrease in N1.
Hypothesis 3: the level of functional polycentricity has increased in the FURs between 1991 and 2001.
Hypothesis 4: the FURs in the Veneto region show the decentralized system.
In sum, there is no functional polycentric structure at the intra-urban scale in most of the FURs of
Veneto. The decentralized system is actually underrepresented just as the centralized system. Dropping
the N1 and N2 values of 4 FURs, which clearly show both systems, leads to an R2of only 0.3604 in 1991
and 0.3184 in 2001. This implies that there is no relationship between the levels of nodalities and even
J.W. Bruijsten

Polycentricity: In search of the ‘pur-fect’ region
when some outliers are dropped the relationship is weak. Low levels of N1 are thus not followed by low
levels of N2. Hypotheses 3 can be rejected. The level of functional polycentricity at the inter-urban scale
did not increase. Moreover, the overall trend is towards the self contained system which indicates that
the suburbs are complementary to each other. Hypothesis 4 cannot be rejected. However, it can only be
supported for a few FURs. The presence of the decentralized system in these FURs even decreased
towards 16 % in 2001. In other words, the presence of true functional polycentric regions decreased
while the presence of a dual spatial labor market increased.
Inter-urban scale
For measuring functional polycentricity at the inter-urban scale both inward and outward openness are
calculated for the 24 FURs in the 5 provinces of Veneto. Figure 6 and 7 in the appendix show the results.
Overall, the results show that only 5 FURs have above average degrees of IO and OO in both years. The
FURs of the main central cities have low degrees of IO and OO with a slight increase in 2001. The other
FURs all have average degrees of IO and OO in both 1991 and 2001. In other words, functional
polycentricity at the inter-urban scale is only present for 20.8 % of the FURs. Hence, the Veneto region
cannot be characterized as a PUR. The following two paragraphs will discuss the results in more detail
and this section will close with answering the hypothesis.
1991
For the FURs in Verona, four of the five FURs surrounding the FUR Verona (Bovolone, Grezzana, Legnago
and Malcesini) and the FUR of Montagnana (Padova) have high degrees of in- and outward openness.
Only San Bonifacio (Verona) has a just above average degree of outward openness and an average
degree of inward openness. However, the FUR of Verona has one of the lowest in- and outward
openness of all the 24 FURs. This last result holds for every FUR of the main central cities; Vicenza,
Treviso, Padova and Venice. Further, Pieve di Soligo and Montebelluna (both Vicenza) have above
average degrees of IO but not of OO. This implies that they attract more commuters from outside their
FUR than they have commuters that go outside their FUR. Este (Padova) and San Dona’ di Piave (Venice)
have low levels of IO, which implies that they do not attract a high number of commuters from outside
their FUR, and higher levels of OO which indicates that commuters from both FURs go outside their own
FUR.
J.W. Bruijsten

Polycentricity: In search of the ‘pur-fect’ region
TheR2 is 0.8671. This means that there is a strong relationship between the levels of in- and outward
openness. However, most of the FURs have relative low degrees of (both) IO and OO. This implies that
functional polycentricity at the inter-urban scale is low in 1991. For 2001 R2 decreased to 0.807. The
same results are observed; a strong relationship between IO and OO but low functional polycentricity.
This implies that the Veneto region cannot be characterized as a PUR.
2001
For 2001 the same FURs as in 1991 have high degrees of IO and OO. It has declined for Malcesini but this
is a FUR of only three municipalities so a small absolute number will give big results. The FURs of the
main central cities have all risen in their IO and OO. However, this result cannot wholly confirm the
result of morphological polycentricity at the inter-urban level because the HHI there decreased between
10 and 25 percent. The IO and OO only rose with a maximum of 4.4 percent. Although these numbers
are not (perfectly) comparable, the difference is large enough to assume that there is no strong
relationship between morphological and functional polycentricity at the inter-urban scale.
For Asiago (Vicenza) the level of IO has fallen. Results at the intra-urban level show that the central city
has become more important and that morphological polycentricity has decreased slightly. However, this
FUR consists of only five municipalities and it is likely to be biased. Schio (Treviso) has become more
polycentric in 2001. Their level of IO and OO has increased.
Furthermore, the clustering of employment near and in Verona seems to be supported because the
surrounding FURs of Verona have high degrees of OO and the FUR of Verona itself is found in the
bottom region of IO and OO. The direction of these flows is particularly coming from the FURs Grezzana
(around 80 percent for both years), Bovolone and San Bonifacio (around 40 percent for both years) and
less from Legnago (20 percent for both years). Legnago is further located from Verona which is assumed
to explain this result
Aggregating the differences of both years leads to a decrease of IO of -0.8 percent and an increase of 5.5
percent for OO (see table 13 in the appendix). The decrease of IO is influenced by (large) decreases in IO
for Grezzana (6 percent), Malcesini (10 percent), San Giovanni Ilarione (3.2 percent) and Asiago (11
percent). If these are left out, because these are the FURs with the small number of municipalities, than
J.W. Bruijsten
Polycentricity: In search of the ‘pur-fect’ region
the level of IO increased with 29.5 percent. This does not hold for OO where there is only a little change
when these FURs are left out.
Hypothesis 5: the level of inward and outward openness has increased in the different FURs between 1991 and 2001.
Overall, the level of functional polycentricity at the inter-urban scale did increase when looking at the
aggregate numbers. However, only four FURs have high levels of IO and OO in 1991 and 2001. The other
FURs are around the average or well below the average. The FURs of the main central cities all have low
levels of IO and OO, but it increased slightly between 1991 and 2001. Although hypothesis 5 can
therefore not be rejected, it can only be supported for the FURs surrounding the FUR of Verona and for
the FUR of Schio, which shows higher IO and OO in 2001. In other words, the FURs of the province of
Verona surrounding the FUR of Verona show functional polycentricity at the inter-urban level. This
cannot be supported for the other provinces, where the level of functional polycentricity is low at the
inter-urban level. It implies that, as argued before, the Veneto region is not a PUR.
6.3 Overview
The following table summarizes the results for the tested hypotheses:
Morphological polycentricity
Functional polycentricity
Intra-urban scaleHypothesis 1Increasing morph. poly.
Cannot be rejected for main central city FURs, Conegliano and San Dona’ di Piave
Hypothesis 3 Increasing funct.poly.Hypothesis 4Presence decentralized system
Rejected
Supported for a decreasing number of FURs between 1991 and 2001
Inter-urban scaleHypothesis 2Increasing morph. poly.
Cannot be rejected for all provinces
Hypothesis 5Increasing IO and OO
Only supported for FURs surrounding the FUR of Verona and for the FUR of Schio.
Table 6.2: Summary of the results of the hypotheses
Table 6.2 shows that hypothesis 1 cannot be rejected for some FURs, which means that in these FURs
the distribution of employment became more balanced between 1991 and 2001. Hypothesis 2 shows
J.W. Bruijsten

Polycentricity: In search of the ‘pur-fect’ region
that all provinces became more polycentric at the inter-urban scale in terms of the employment
distribution throughout the province. However, Venice became less monocentric. Hypothesis 3 is
rejected which indicates that the commuting flows in all FURs did not disperse between 1991 and 2001.
However, the commuting flows are multi-directional for a decreasing number of FURs which implies that
hypothesis 4 can therefore not be rejected. Hypothesis 5 can also only be supported for some FURs
which means that these FURs became more inward and outward open between 1991 and 2001.
However, as this is measured at the inter-urban scale high IO and OO should be present between FURs.
Morphological and functional relationships
This section will argue whether the methods used and whether the two aspects of polycentricity are
related with each other. The inter-urban scale reflects the relationships between FURs and the intra-
urban scale the relationships within FURs. It was argued in section 5.2 that high levels of morphological
polycentricity measured with the HHI correspond with negative SA at the intra-urban scale. However,
this relationship is more refined. The FURs of the main central cities all have a high HHI which indicates a
low level of morphological polycentricity. The LISA on the other hand showed only decreasing negative
SA for Venice and Vicenza. The other main central city FURs showed increasing positive SA. This implies
that there is clustering of employment in the neighboring municipalities of the main central city itself
which is confirmed with the LISA: Verona, Treviso and Padova all three have neighboring municipalities
with significant and positive SA. The cities of Venice and Treviso do not show this, both cities have high
employment concentration and the neighboring municipalities have low employment concentration.
This is confirmed with N1, where especially the city of Venice has high N1 and the FUR of Vicenza has a
high level of N1 relative to the other main central city FURs. For both FURs the level of N1 also
decreased. However, the clustering of employment near and in Verona, Treviso and Padova is only to
some extent supported with the results of functional polycentricity at the intra-urban scale: for all three
provinces there seemed to be a development towards the self-contained system. However, this
development is very weak. These results do seem to confirm the weak relationship between the level of
morphological and functional polycentricity, previously reported by Van der Laan (2010). This thesis did
found a clear relationship between high levels of the HHI and both positive and negative SA. It can thus
be assumed that the LISA is complementary to the HHI.
J.W. Bruijsten

Polycentricity: In search of the ‘pur-fect’ region
The methods used to measure morphological polycentricity at the inter-urban scale do not seem to have
a clear relationship with morphological relationship at the intra-urban level. A correlation coefficient is
lacking because the former is measured at the province level and the latter at the FUR level, which
means that there is no equal amount of numbers necessary to perform a regression. There seems to be
a relationship with the increase of morphological polycentricity at the inter-urban scale and the increase
of Moran’s I. However, this latter increase is very small and the relationship is therefore not further
investigated. What the LISA does show is the existence of multiple employment centers in the provinces
of Vicenza and Treviso. This confirms the high level of morphological polycentricity at the inter-urban
level. For these reasons, only a weak relationship between morphological polycentricity at both levels
can be supported. Additionally, this thesis assumes that the morphological polycentricity at the inter-
urban level is better explained by the indices used to measure it at the intra-urban level because at the
intra-urban level the methods used are more in-depth, more clarifying and more conclusive. The results
at the inter-urban level do show that all five provinces are becoming more polycentric, or in the case of
Venice, less monocentric.
Functional polycentricity at the intra-urban level appears to have no clear structure (very lowR2). For
functional polycentricity at the inter-urban level there is a strong relationship between the level of IO
and OO. As the FURs surrounding the FUR of Verona have high levels of IO and OO investigating the
specific direction of the commute shows for which FUR the employment concentration near and in
Verona is important for job supply. The following table shows the importance of the municipalities of
Verona, San Giovanni Lupatoto and San Martino B.A. for the FURs surrounding them since the LISA gave
significant results for these municipalities:
1991 (%) 2001 (%) Difference
132: Bovolone 44.9 36.9 - 8.0
133: Grezzana 80.5 78.3 - 2.2
134: Legnago 21.8 19.6 - 2.2
135: Malcesini 24.7 16.2 - 8.5
136: San Bonifacio 43.3 37.8 - 5.5
137: San Giovanni Ilarione 10.9 7.3 - 3.6
Table 6.3: Percentage of outgoing commuting to Verona, San Giovanni Lupatoto and San Martino B.A.
J.W. Bruijsten

Polycentricity: In search of the ‘pur-fect’ region
Table 6.3 shows the percentage of outgoing commuting, which is directed outside the FUR, towards
those municipalities for 1991, 2001 and the difference. It shows that especially for Grezzana and to a
lesser extent for Bovolone and San Bonifacio the outgoing commuting is going to the clustering of
employment near and in Verona. This indicates a spatial mismatch between housing and jobs which
makes inter-urban commutes necessary (Giuliano and Small, 1993). This mismatch did decrease for all
FURs implying that the employment concentration near and in the central cities became less important
for job supply.
Furthermore, the high level found in Grezzana corresponds with a high level of N1 at the intra-urban
level. However, the smaller level found in Bovolone and San Bonifacio corresponds with low levels of N1.
Because only the FURs with a small number of municipalities have higher levels of N1, the last
relationship will be further explored. This means that for FURs with (relatively) low levels of N1 (below
25 percent) the direction of outgoing commuting towards the employment concentration near and in
the main central cities the percentage will be calculated. The following table shows this result:
1991 (%) 2001 (%) Difference
139: Arzignano 50.5 43.9 - 6.6
151: Castelfranco Veneto 12.8 9.9 - 2.9
152: Conegliano 16.7 12.8 - 3.9
159: Este 42.2 38.9 - 3.3
160: Montagnana 7.2 6.1 - 1.1
Table 6.4: Percentage of outgoing commuting from FURs with low N1 to main central city
Table 6.4 shows that only for Arzignano and Este the relationship seems to hold and both show the self-
contained system. Furthermore, the FUR of Montagnana has the highest level of IO and OO at the inter-
urban level. The FUR of Este seems to be important for the job supply of commuters from Montagnana
instead of the city of Padova (75 percent for 1991 and 2001). For the commuters coming from Este also
Montagnana is important (80 percent for 1991 and 2001). There thus seems to be exchange commuting
between these FURs. However, the FUR of Montagnana also shows the self-contained system. Hence,
there seems to be no clear relationship between the level of outgoing commuting directed towards the
employment concentration near or in the main central cities and the (low) level of N1. In other words,
the level of functional polycentricity at the inter-urban level does not relate with the level of functional
polycentricity at the intra-urban level.
J.W. Bruijsten
Polycentricity: In search of the ‘pur-fect’ region
6.4 Discussion
The monocentric model indeed seems to be a model from the past with the exception of Venice and
Grezzana. However, Grezzana shows a high level of functional polycentricity at the inter-urban level and
is characterized by a small number of municipalities. Venice is the most cultural city of the Veneto region
and attracts a lot of tourists. It is likely that for this reason Venice attracts a lot of commuters and
employment; the monocentric model is prevailing in Venice. In other words, in the province of Venice
the results support the argument from the central place model that the smaller cities are dependent on
the larger city. Governa and Salone (2005) emphasize that changes in the urban organization in Italy has
developed because of historical processes rather than explicit polycentric policy planning; Venice serves
as a good example of such a process.
Although the concept of the monocentric model is surpassed, it is not the polycentric model that is
getting its grip on the Veneto region. This confirms earlier research from Anderson and Bogart (2001)
who argue that to understand the employment structure of urban regions the polycentric model is
incomplete. Furthermore, a recently published study by Garcia-López and Muñiz (2010, p. 2) argues that
‘polycentricity might be an intermediate spatial stage between monocentricity and scatteration’. The
results of the HHI, Moran’s I and LISA cannot support high or increasing levels of morphological
polycentricity at the intra-urban scale for the majority of the FURs, it can support such levels for the
main central city FURs. For all FURs the results do not support increasing levels of functional
polycentricity at the intra-urban scale. Even more, the decentralized system with multi-directional
commuting flows is only really present in two FURs. Just as in the Netherlands, only between a few FURs
in the Veneto region a polycentric region has developed. Although, the results showed that the systems
which reflects lower levels of functional polycentricity at the intra-urban scale (the exchange commuting
and self contained system) increased in number between 1991 and 2001. However, it seems like that
there is an overall trend towards the self contained system which indicates the existence of a dual
spatial labor market. This is not confirmed with the results from morphological polycentricity at the
intra-urban level; i.e. the LISA did not show the existence of multiple local economic centers. Only for
Vicenza there seems to exist a dual spatial labor market at the inter-urban level.
Overall, polycentricity is only developed to a limited extent in the Veneto region. Where the main
central cities are geographically well-connected, within proximity of each other and no city is the
J.W. Bruijsten
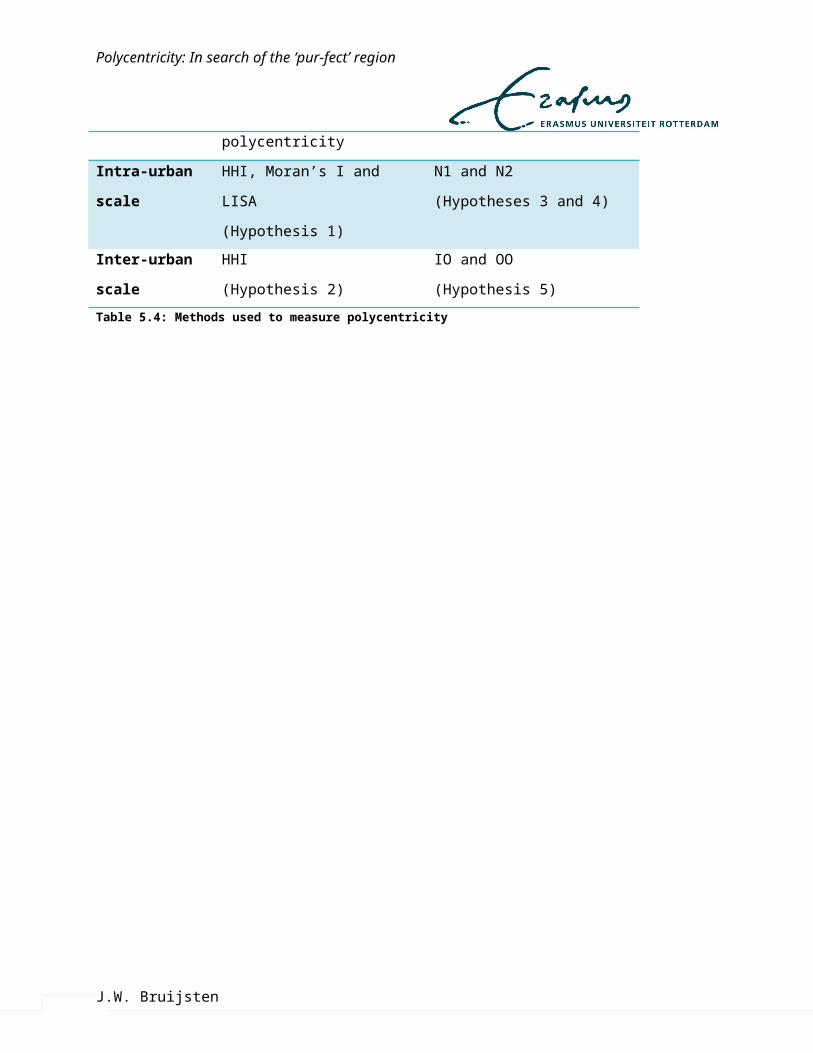
Polycentricity: In search of the ‘pur-fect’ region
dominant one, the results at both the intra- and inter-urban scale showed that polycentricity only
developed within and between some FURs. Furthermore, in the different provinces only a very small
number of local economic centers are present. Only these centers should be able to compete with the
main central city. Furthermore, the commuting flows are only in Venice for the bigger part mono-
directional; i.e. from the suburbs to the central city. The other FURs did show commuting flows in
multiple directions, implying that the CBD is not the most important provider of employment anymore.
However, these commuting flows are not that multi-directional to argue that all FURs can be
characterized as a polycentric region. It is assumed that the province of Verona is the most polycentric
region in Veneto at the inter-urban scale.
Exceptions are found in the FURs surrounding the FUR of Verona and in the FUR of Montagnana
(Padova) where the former shows functional polycentricity at the inter-urban level. This implies a spatial
labor mismatch because of high IO and OO (Giuliano and Small, 1993). It means that for people living in
one FUR the employment opportunities are not enough to employ the local residents. Furthermore, the
province of Verona shows increasing morphological polycentricity at the same scale. However, as the
FUR of Verona has a low level of both IO and OO, the province of Verona is no true polycentric region. It
can although be assumed that at the inter-urban scale the province of Verona is the most polycentric
region in Veneto.
The FUR of Montagnana is also functional polycentric at the inter-urban level. However, the majority is
commuting towards the FUR of Este and vice versa. At the intra-urban level there seems to be a dual
spatial labor market; i.e. between the central city and the suburbs. At the inter-urban level there are
imbalances between employment and residential locations. Hence, on the local level it can be assumed
that the commuter has minimized their commuting cost trough, for example, changing his place of
residence. On the regional level this effect is assumed not to be found. This could be an indication of the
wealth of the region, because ‘long distance travel tends to be more prevalent among people with more
resources’ (Limtanakool et al., 2007a, p. 2128). However, this thesis does not investigate commuting
time and these two assumptions should be interpreted with caution.
Another exception is found in increasing levels of morphological polycentricity at the inter-urban level.
Where the Espon report (2007) states that the north east of Italy has a high level of morphological
polycentricity this thesis finds that morphological polycentricity is unbalanced in terms of the
J.W. Bruijsten
Polycentricity: In search of the ‘pur-fect’ region
distribution of regions (see tables 1 - 5 in the appendix). Meijers (2008) argues that a balanced
distribution of regions is considered polycentric at the spatial scale of the FUR. The results cannot
confirm such polycentricity, although there seems to be an increase towards morphological
polycentricity. Where the provinces of Vicenza and Treviso are well and more balanced, the province of
Venice is not well balanced (although it became less monocentric). The provinces of Verona and Padova
lie in the middle of these two ends. Combining morphological polycentricity at the intra- and inter-urban
level there only seems to be the existence of multiple local economic centers in Vicenza. However,
multiple is overestimated; only one extra center is developed next to the main central city.
Alternative interpretations
Meijers and Burger (2010) argue that cities in smaller FURs are more functionally related than cities in
larger FURs. Figure 8 in the appendix shows the map for the HHI in 1991 and 2001. With some
exceptions, the larger FURs have a higher HHI than the smaller FURs. This more unequal distribution in
terms of size can be supported with lower levels of N1. Capello and Camagni (2000) show that there
seems to be a threshold in the urban size of regions. This means that when cities become too large,
urban overload is expected. This view is supported by Meijers (2008) who finds that more polycentric
regions cannot gain from urban size. For example, high N1 can result in congestion and high commuting
costs. As the smaller FURs have low levels of the HHI and N1, it could be assumed that there is a
relationship between functional polycentricity and urban size.
The correlation coefficient between the HHI and N1 gives 0.84 for 1991 and 0.86 for 2001 which
indicates a strong relationship between the two. However, the HHI does not measure urban size.
Furthermore, there is no relationship between the HHI and N2 (very low R2). As morphological
polycentricity is also measured with two other indices, the weak relationship between morphological
and functional polycentricity, as argued before, seems to hold.
The results of functional polycentricity at the intra-urban level seem to show a slight movement of the
average FURs, in terms of the level of N1 and N2, towards the self-contained system. This includes the
main central city FURs. If anything, this could be an indication of ‘reurbanisation’ or the ‘resurgent city’
(e.g. Glaeser and Gottlieb, 2006; Kabisch et al., 2010). This implies that the population is moving back to
the city, because of ‘advantages of inner-city areas, like the specific housing available, the good location
and diverse amenities, which are becoming increasingly attractive for a wide range of population groups,
J.W. Bruijsten

Polycentricity: In search of the ‘pur-fect’ region
living arrangements and lifestyles’ (Kabisch et al., 2010, p. 970). These groups seem to include the
increase in two-earner households. Changes in the structure of households influence the spatial
behavior of households (Van der Knaap, 2002). However, this is just a cautious attempt to shed some
new light of recent research on the results.
6.5 Limitations
This thesis used commuting flows and employment figures to analyze the development of the urban
spatial structure of the Veneto region. However, as Schwanen et al. (2001) and Bogart (2006) among
others rightly show commuting only accounts for one fifth of all personal trips. Bogart (2006) argues that
accessibility should include other measures such as the cultural and shopping amenities offered.
Furthermore, since FURs ‘encompass multiple functions’ (Limtanakool et al., 2007a, p. 2124) these other
personal trips may reveal another insight of the urban structure. However, this thesis only focused on
commuting because only these flows show the relationship between employment and residential
locations. This is confirmed by Limtanakool et al. (2007b, p. 27) who argue that commuting flows are
‘pertinent to the development of urban systems’ as opposed to other daily journeys. Even more, Parr
(2005) argues that commuting flows do represent the same urban structure other types of interaction
reveal.
There is more to commuting than only the flows. Even more, the used data sets contained more
variables. For example, results of empirical research on the influence of commuting time on the urban
spatial structure are mixed (Schwanen et al., 2001). Changes in the spatial mobility and flexibility of
households and firms can shorten commuting times. This reflects the co-location hypothesis which
states that households change their live- or workplace in order to avoid time penalties, caused by
congestion (Schwanen et al., 2004). However, because of time limits this thesis did not investigate
commuting time. This topic is although important in the field of research regarding commuting.
This thesis did also not investigate the level of specialization of the employment centers near and in the
main central cities. Characteristics of an employment center are argued to tell more about the
interaction patterns (Limtanakool et al., 2007a). This is argued to be an important question (Anderson
and Bogart, 2001). Proper knowledge of the characteristics of the Veneto region or field research is
needed to investigate this manner further. Furthermore, lack of English literature regarding Italian
J.W. Bruijsten

Polycentricity: In search of the ‘pur-fect’ region
development policy and economy limited this thesis in understanding the regional and local structure of
the Italian economy, especially for that of the Veneto region.
J.W. Bruijsten
Polycentricity: In search of the ‘pur-fect’ region
Chapter 7: Conclusion
This thesis analyzed the development of polycentricity in the Veneto region between 1991 and 2001.
Commuting flows are used to determine morphological and functional polycentricity at the intra- and
inter-urban scale, because they are an appropriate measure to determine the location and structure of
employment. Where in the monocentric model commuting is aimed at the CBD, the polycentric model
implies that cities and regions are changing towards a multi-faceted urban structure.
The results of this thesis show that the polycentric model is incomplete in determining the urban
structure of Veneto. This thesis expected however that polycentricity did develop in the Veneto region.
The results showed that polycentricity is only developed to a limited extent.
At the intra-urban scale, hypothesis 1 – increasing levels of morphological polycentricity - cannot be
rejected for the main central city FURs, Conegliano and San Dona’ di Piave. Hence, at the local level only
some morphological polycentricity developed; i.e. the employment distribution became more balanced
between 1991 and 2001 in these FURs. At the inter-urban scale, hypothesis 2 – increasing levels of
morphological polycentricity – cannot be rejected for all provinces. This indicates a more balanced
distribution of employment between 1991 and 2001 within all provinces. However, the levels of
morphological polycentricity did vary in size. Furthermore, for various reasons, this thesis assumes that
morphological polycentricity is better explained with the methods used to measure it at the intra-urban
scale.
Hypothesis 3 – increasing levels of functional polycentricity at the intra-urban scale – is rejected which
means that commuting flows within the FURs in Veneto are not increasing multi-directional as the
theory of polycentricity predicts. However, the results did support hypothesis 4 – presence of the
decentralized system – for some FURs, although it is supported for a decreasing number of FURs
between 1991 and 2001. It also indicated an increase in the presence of a dual spatial labor market
where especially the suburbs within these labor markets are important for employment. At the inter-
urban scale, hypothesis 5 – increasing levels of IO and OO – is only supported for the FURs surrounding
the FUR of Verona and for the FUR of Schio. However, the latter is an outlier, because functional
J.W. Bruijsten

Polycentricity: In search of the ‘pur-fect’ region
polycentricity at the inter-urban scale should be present between FURs. Hence, it can be supported that
the province of Verona is a functional polycentric region and thereby excludes itself from the rest of the
Veneto region. However, the FURs of the province of Verona are not functional polycentric at the intra-
urban scale. This implies a spatial labor mismatch in the province of Verona. Furthermore, such a
mismatch is also found for two neighboring FURs (Este and Montagnana) at the regional level. However,
on the local level there seems to be the presence of a dual spatial labor market for these two FURs.
The results show that the city of Venice is still important for job supply. To clarify this with the example
from the introduction, merchants still move to the market in Venice to sell their products. However,
Venice became less monocentric through the more balanced employment distribution in one
neighboring FUR, San Dona’ di Piave. The province of Venice is although no polycentric region.
Furthermore, the results show that at the local level only some polycentricity developed. Where
morphological polycentricity shows increasing levels for the main central city FURs (except for Venice),
functional polycentricity shows a trend towards the self contained system. The latter implies that
especially the suburbs are complementary to the central city in terms of employment. Additionally, for
the FUR of Conegliano with increasing levels of morphological polycentricity the level of functional
polycentricity actually decreased. This indicates that, as employment becomes more distributed over
the FUR, commuting flows are diminishing multi-directional. This could point to the increasing spatial
mobility and flexibility of households or firms. In other words, the demand for labor is following the
supply of labor or vice versa. However, this should be interpreted with caution as this thesis did not
investigate this specific relationship.
Overall, the deconcentration of employment – a more balanced distribution of employment which
indicates morphological polycentricity - is only found in 25 % of the FURs in the Veneto region (excluding
the main central city FURs). This confirms to a limited extent the trend towards the self contained
system. It means that the suburbs at the province level are becoming more important for job supply.
However, the LISA showed that these suburbs cannot be characterized as local economic centers. This
implies that functional polycentricity at the intra-urban scale is only developed to a limited extent. As
the results showed functional polycentricity at the inter-urban scale is also weakly developed. Only the
FURs surrounding the FUR of Verona can be characterized as polycentric. In other words, for these FURs
the commuting flows are multi-directional. However, this does indicate a spatial labor mismatch.
J.W. Bruijsten
Polycentricity: In search of the ‘pur-fect’ region
So, to answer the research question: commuting flows only weakly support (the development of)
polycentricity as polycentricity is weakly developed in the Veneto region. At both the intra- and inter-
urban level some polycentricity is revealed, morphological as well as functional. The Veneto region can
therefore not be characterized as a PUR. Furthermore, a polynuclear (multi-directional) distribution
(commuting) pattern is only present to a limited extent in the FURs in the Veneto region. The results
revealed only within a few FURs a polycentric structure. This is also, together with the polycentric
structure found in Verona, the only two similarities this thesis finds the Veneto region has with the
Randstad on a polycentric level. However, investigating the specific direction of where all commuting
flows are heading should confirm or reject this. It may be true that the Veneto region is evolving
towards polycentricity although this is not supported with the results of this thesis. This should be
revealed over time as this thesis only used two points in time.
The results imply that the Veneto region is not the Veneto region as one; it is merely the administrative
boundaries that make the different municipalities and provinces one entire region. The argument that
urban regions have become border and centre less does not hold for the Veneto region. It can better be
exemplified as different entities because the different provinces only interact to a small extent with each
other in terms of commuting. However, this implies that there lies a challenge in defining the urban
structure of these regions or even in re-defining the borders of urban regions to investigate the urban
structure. When monocentricity and polycentricity are both surpassed in these regions what does urban
theory than propose? Phelps et al. (2010) put forward ‘postsuburbia’ to begin comparative research.
They put different meanings to the concept itself. Reurbanisation and the resurgent city are two other
concepts developed in urban theory. Gordon and Richardson (1996) propose an alternative view on the
urban spatial structure, one in where employment is increasingly unstructured. However, all these
concepts do not catch the full urban structure of Veneto. Hence, today’s urban theory seems to be
limited in explaining the urban structure in the Veneto region. However, this thesis cannot defend this
as it used commuting flows to measure polycentricity. There is more to commuting and to
polycentricity, at various scales. So, ‘location, location, location’ seems to apply for this thesis in that
sense that all three have different meaning and must be interpreted in a different context within the
Veneto region.
J.W. Bruijsten

Polycentricity: In search of the ‘pur-fect’ region
Policy implications
Giuliano and Small (1993) argue that policy aiming at influencing the urban structure can only reach a
small effect, especially if it is aimed at altering commuting patterns. However, the results from this
thesis do show some policy implications. First of all, the city of Venice remains important for
employment as its cultural value is immense. Attracting tourists should be on top of the list of
policymakers, whether national, regional or local.
Second, regional policy makers ‘often have the explicit intention of economic deconcentration and
urban network formation’ (Van Oort et al., 2010, p. 731). The low level of polycentricity found in this
thesis indicates that the Veneto region as a whole cannot be steered by one general policy. At the local
level (intra-urban) the results show little morphological as well as functional polycentricity. However,
these results did vary in size. For example, for the province of Verona in general there seemed to be a
mismatch between employment and residential locations. Furthermore, at the regional level, only
between a few FURs there is the development of functional polycentricity. Transport planning policy in
Verona therefore should focus on investments in the local transportation network, and not on long
distance commuting. Additionally, building sites for employment and housing should be located more
near to each other. In other words, as the demand for labor is argued to follow the supply for labor, ‘the
planning of population development becomes more steering in the planning process’ (De Goei et al.,
2010, p. 15).
Furthermore, a clear understanding of the urban spatial structure gives political institutions the idea on
how to create more effective governance and better policy (Goetz et al., 2010), which can ‘allow a better
targeting of policies to local needs’ (Rodríguez-Pose, 2008, p. 1035). This can strengthen specialization
and complementarity of regions (see section 2.3). Complementarity can be based on the functional
relationships between regions (Halbert et al., 2006). The results of this thesis show functional
relationships between and within FURs of the Veneto region; these can be ‘hidden’ for urban policy
makers. When these are properly understood, it can lead to better co-operation between local and
regional institutions. This can strengthen the base for increasing regional competitiveness through
economies of scale and agglomeration benefits (see section 2.3). In other words, it can strengthen the
functional relationships between places and thereby enhance their interrelated trade (Kloosterman and
Lambregts, 2001). Additionally, ‘policy measures undertaken in an individual FUR may or may not hinder
J.W. Bruijsten
Polycentricity: In search of the ‘pur-fect’ region
or damage the development process in neighboring FURs’ (Halbert et al., 2006, p. 202). In other words,
the results can lay new foundations for ‘creating new forms of regional governance that better reflects
local realities of cross-county flows of workers and economic activity’ (Goetz et al., 2010, p. 276)
Finally, the European Spatial Development Perspective (ESDP) promotes polycentric spatial planning to
achieve sustainable development (Halbert et al., 2006; Sýkora et al., 2009). However, the results of this
thesis show that polycentricity is only developed to a limited extent and policy makers should question
whether polycentric spatial planning is the best spatial planning. Even more, it is argued in section 2.3
that it is not sure whether the belief that polycentricity leads to regional economic competitiveness and
sustainable development is justified. This is emphasized by Cheshire (2006, p. 1237) who argues that
evidence regarding whether it is possible to stimulate polycentricity is very small; even when it is
possible, it is unknown that ‘doing so would make Europe’s cities more competitive’. These results thus
do not support the European view of promoting polycentricity (Governa and Salone, 2007). A better
view should be that of territorial cohesion, according to Cattan (2007).
Recommendations for future research
There are three directions for future research which this thesis can identify. First of all, commuting time
can be explored. Anderson and Bogart (2001, p. 167) argue that ‘an important finding with implications
for future research is our confirmation of previous research by Anas et al. (1998) that concluded that
less than 50 percent of metropolitan employment is concentrated in employment centers’. Less
employment in employment centers can have different results for commuting time. Moreover,
imbalances between the locations of employment and households have a strong influence on the
commuting pattern of people (Giuliano and Small, 1993). Secondly, as already mentioned in the previous
chapter, future research ‘should concentrate on less frequent types of trips such as leisure or business
trips’ (De Goei et al., 2010, p. 15). Commuting only accounts for one fifth of all personal trips and
therefore another urban structure can be revealed when the remaining trips are included. As the data
contained also trips made for study reasons one possible type of trip should be easily implemented.
Third of all, the benefits related to polycentricity are worth investigating as the results of this thesis
showed little polycentricity. Such research can be performed through, for example, studying business
start-ups (Van Oort et al., 2010) which can show inter-urban trade (De Goei et al., 2010). Inter-urban
J.W. Bruijsten
Polycentricity: In search of the ‘pur-fect’ region
trade is believed to be economically beneficial. Furthermore, it can indicate whether these benefits hold
for the Veneto region or, when they are absent, it could support the findings of this thesis.
J.W. Bruijsten
Polycentricity: In search of the ‘pur-fect’ region
Reference listAlbrechts, L., 1998, the Flemish diamond: Precious gem and virgin area, European Planning Studies, Vol. 6, No. 4, pp. 411-424
Aguilera, A., 2005, Growth in Commuting Distances in French Polycentric Metropolitan Areas: Paris, Lyon and Marseille, Urban Studies, Vol. 42, No. 9, pp. 1537-1547
Anas, A., Arnott, R. and Small, K.A., 1998, Urban Spatial Structure, Journal of Economic Literature, Vol. 36, No. 3, pp. 1426-1464
Anderson, N.B. and Bogart, W.T., 2001, the Structure of Sprawl; Identifying and Characterizing Employment Centers in Polycentric Metropolitan Areas, American Journal of Economics and Sociology, Vol. 60, No. 1, pp. 147-169
Anselin, L., 1993, the Moran Scatterplot as an ESDA Tool to Assess Local Instability in Spatial Association. Paper presented at the GISDATA Specialist Meeting on GIS and Spatial Analysis, Amsterdam, The Netherlands, December 1-5. West Virginia University, Regional Research Institute, Research Paper 9330.
Anselin, L. 1995, Local Indices of Spatial Association – LISA, Geographical Analysis, Vol. 27, No. 2, pp. 93-115
Aujean, L., Castiau, E., Roelandts, M. and Vandermotten, C., 2005, Commuting & the Definition of Functional Urban Regions; Central Belgium. POLYNET Action 1.1, Institute of Community Studies / the Young Foundation and Polynet Partners, London.
Bailey, N. and Turok, I., 2001, Central Scotland as a Polycentric Urban Region: Useful Planning Concept or Chimera?, Urban Studies, Vol. 38, No. 4, pp. 697-715
Batten, D.F., 1995, Network Cities: Creative Urban Agglomerations for the 21 st century, Urban Studies, Vol. 32, No. 2, pp. 313-327
Baumont, C., Ertur, C. and Le Gallo, J., 2004, Spatial Analysis of Employment and Population Density: The Case of the Agglomeration of Dijon 1999, Geographical Analysis, Vol. 36, pp. 146–175.
Berg, van den L. and Klink, van H.A., 1995, Regional Competition, City Marketing and Strategic Urban networks. In: Cheshire, P. C. and Gordon, I. R. Eds. Territorial Competition in an Integrating Europe, Aldershot: Avebury. Ch.10.
Bertaud, A., 2004, the Spatial Organization of Cities: Deliberate outcome or unforeseen consequence? World Development Report 2003, Dynamic Development in a Sustainable World, Background paper
J.W. Bruijsten
Polycentricity: In search of the ‘pur-fect’ region
Besussi, E., Cecchini, A. and Rinaldi, E., 1998, the Diffused City of the Italian North-East: Identification of Urban Dynamics using Cellular Automate Urban Models, Computers, Environment and Urban Systems, Vol. 22, No. 5, pp. 497-523
Bivand, R.S. and Portnov, B.A., 2004, Exploring Spatial Data Analysis Techniques using R: the Case of Observations with no Neighbours. In Anselin, L., Florax, R.J. and Rey, S.J. Eds. Advances in Spatial Econometrics: Methodology, Tools and Applications. Berlin: Springer Verlag, pp. 121-142
Bogart, W.T., 2006. Don’t call it Sprawl: Metropolitan structure in the twenty first century , New York, Cambridge University Press
Bramezza, I., 1996, The Competitiveness of the European City and the Role of Urban Management in Improving the City’s Performance. Amsterdam: Thesis Publishers.
Cattan, N., 2007. Cities and Networks in Europe, a Critical Approach of Polycentrism, John Libbey Eurotext
Camagni, R.P. and Salone, C., 1993, Network Urban Structures in Northern Italy: Elements for a Theoretical Framework, Urban Studies, Vol. 30, No. 6, pp. 1053-1064
Capello, R. and Camagni, R., 2000, Beyond Optimal City Size: an Evaluation of Alternative Urban Growth Patterns, Urban Studies, Vol. 37, No. 9, pp. 1479-1496
Champion,A.G., 2001, a Changing Demographic Regime and Evolving Polycentric Urban Regions: Consequences for the Size, Composition and Distribution of City Populations, Urban Studies, Vol. 38, No. 4, pp. 657-677
Cheshire, P.C., 2006, Resurgent cities, Urban Myths and Policy Hubris: what we need to know, Urban Studies, Vol. 43, No. 8, pp. 1231-1246
Clark, W.A.V. and Kuijpers-Linde, M., 1994, Commuting in Restructuring Urban Regions, Urban Studies, Vol. 31, No. 3, pp. 465-483
Cosgrove, D.E., 2007, From Palladian Landscape to the Città Diffusa: The Veneto and Los Angeles. In: Roca, Z., Spek, T., Terkenli, T., Plienninger, T. and Höchtl, F., Eds. European Landscapes and Lifestyles: The Mediterranean and Beyond, Lisbon: Edições Universitárias. Ch. 2
Cowell, M., 2010, Polycentric Regions: Comparing Complementarity and Institutional Governance in the San Francisco Bay Area, the Randstad and Emilia-Romagna, Urban Studies, Vol. 47, No. 5, pp. 945-965
Cristaldi, F., 2005, Commuting and Gender in Italy: a Methodological Issue, The Professional Geographer, Vol. 57, No.2, pp. 268-284
J.W. Bruijsten
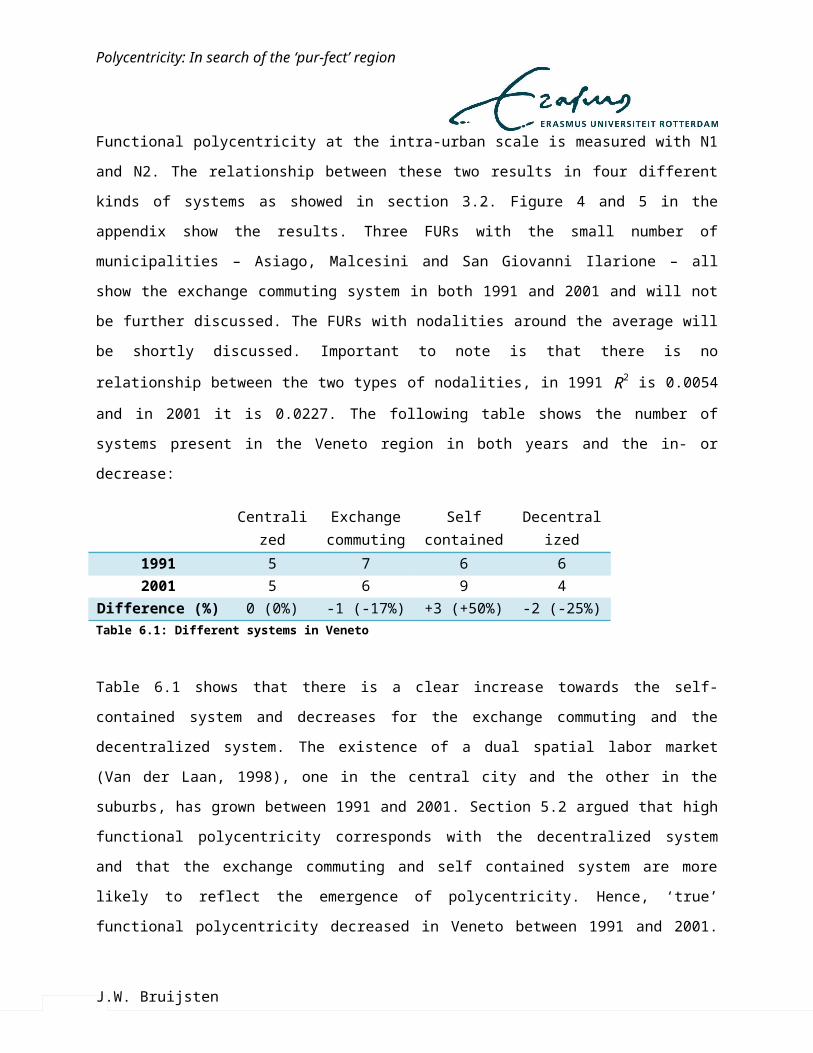
Polycentricity: In search of the ‘pur-fect’ region
De Goei, B., Burger, M.J., Oort, van F.G. and Kitson, M., 2010, Functional Polycentrism and Urban Network Development in the Greater South East, United Kingdom: Evidence from Commuting Patterns, 1981-2001, Regional Studies, pp. 1-22, iFirst article
De Graaff, T., Oort, van F.G. and Boschmann, S., 2008, Woon-werkdynamiek in Nederlandse Gemeenten, Ruimtelijk Planbureau, Den Haag. NAi Uitgevers, Rotterdam
Dieleman, F.M. and Faludi, A., 1998, Polynucleated metropolitan regions in Northwest Europe: Theme of the special issue, European Planning Studies, Vol. 6, No. 4, pp. 365-377
Dominics, L. de, Arbia, G. and Groot, H.L.F. de, 2007, The Spatial Distribution of Economic Activities in Italy, Tinbergen Institute Discussion Paper 2007-094/8
Eck, van J.R., Oort, van F.G., Raspe, O., Daalhuizen, F. and Brussel, van J., 2006, Vele Steden maken nog Geen Randstad, Ruimtelijk Planbureau, Den Haag, NAi Uitgevers, Rotterdam
Eskelinen, H. and Fritsch, M., 2009, Polycentricity in the North-eastern Periphery of the EU Territory, European Planning Studies, Vol. 17, No. 4, pp. 605-619
Eurostat, 1993, Portrait of the Region: Volume 3. Portugal, Spain, Italy, Greece, Luxembourg: Office for Official Publications of the European Communities, UK.
Fischer, M.M., 2006, Spatial Analysis of Geography. In: Fischer, M.M., Spatial Analysis and Geocomputation: Selected Essays. Berlin Heidelberg: Springer.
Garcia-López, M-À and Muñiz, I., 2010, Employment Decentralisation: Polycentricity or Scatteration? The Case of Barcelona, Forthcoming in Urban Studies
Giuliano, G. and Small, K.A., 1991, Subcenters in the Los Angeles Region, Regional Science and Urban Economics, Vol. 21, pp. 163-182
Giuliano, G. and Small, K.A., 1993, Is the Journey to Work explained by Urban Structure, Urban Studies, Vol. 30, No. 9, pp. 1485-1500
Glaeser, E.L. and Gottlieb, J.D., 2006, Urban Resurgence and the Consumer City, Urban Studies, Vol. 43, No. 8, pp. 1275-1299
Goetz, S.J., Han, Y., Findeis, J.L. and Brasier, K.J., 2010, U.S. Commuting Networks and Economic Growth: Measurement and Implications for Spatial Policy, Growth and Change, Vol. 41, No. 2, pp. 276-302
Goodchild, M.F., 1986, Spatial Autocorrelation, 1st ed. Norwich. Geobooks
Gordon, P. and Richardson, H.W., 1996, Beyond Polycentricity: the Dispersed Metropolis, Los Angeles, 1970-1990
J.W. Bruijsten

Polycentricity: In search of the ‘pur-fect’ region
Gordon, P., Richardson, H.W. and Wong, H.L., 1986, the Distribution of Population and Employment in a Polycentric City: the Case of Los Angeles, Environment and Planning A, Vol. 18, pp. 161-173
Governa, F. and Salone, C., 2005, Italy and European Spatial Policies: Polycentrism, Urban Networks and Local Innovation Practices, European Planning Studies, Vol. 13, No. 2, pp. 265-283
Governa, F. and Salone, C., 2007, Networking Italy. Polycentrism and Networks in Italian Regional Policies. In: Cattan, N. Eds. Cities and Networks in Europe, a Critical Approach of Polycentrism. John Libbey Eurotext. Pp. 113-122
Guillain, R. and Le Gallo, J., 2006, Measuring Agglomeration: an Exploratory Spatial Analysis Approach applied to the Case of Paris and its Surroundings, The International Workshop in Spatial Econometrics and Statistics, Rome, May 25-27 2006.
Guillain, R., Le Gallo, J. And Boiteux-Orain, C., 2006, Changes in Spatial and Sectoral Patterns of Employment in Ile-de-France, 1978-97, Urban Studies, Vol. 43, No. 11, pp. 2075-2098
Halbert, L., Pain, K. and Thierstein, Al, 2006, European Polycentricity and Emerging Mega-City Regions: “One Size Fits All Policy”?, Built Environment Special Issue, Reflections on the Polycentric Metropolis, Vol. 32, No. 2, pp. 194-218
Hall, P., Pain, K. and Green, N., 2006, Anatomy of the polycentric metropolis: Eight mega-city regions in overview. In: Hall, P. and Pain, K. Eds. The Polycentric Metropolis: Learning from Mega-city Regions in Europe, Earthscan Publications, London, pp. 19-64
Hincks, S. and Wong, C., 2010, the Spatial Interaction of Housing and Labour Market: Commuting Flow Analysis of North West England, Urban Studies, Vol. 47, No. 3, pp. 620-649
IGEAT (Lead Partner), 2007, ESPON project 1.4.3: Study on Urban Functions, Luxembourg, Available at: http://www.espon.eu/main/Menu_Projects/Menu_ESPON2006Projects/Menu_StudiesScientificSupportProjects/urbanfunctions.html [Accessed 01 June 2010]
Jansen, G.R.M., 1993, Commuting: Home sprawl, job sprawl, traffic jams, In: Salomon, I., Bovy, P. and Orfeuil, J.P., Eds. A Billion Trips a Day: Tradition and Transition in European Travel Patterns , pp. 101-127. Dordrecht: Kluwer Academic Publishers. Ch. 7.
Kabisch, N., Haase, D. and Haase, A., 2010, Evolving Reurbanisation? Spatio-temporal Dynamics as Exemplified by the East German City of Leipzig, Urban Studies, Vol. 47, No. 5, pp. 967-990
Kantor, P., 2006, Regionalism and Reform: a Comparative Perspective on Dutch Urban Politics, Urban Affairs Review, Vol. 41, No. 6, pp. 800-829
Kloosterman, R.C. and Lambregts, B., 2001, Clustering of Economic Activities in Polycentric Urban Regions: The Case of the Randstad, Urban Studies, Vol. 38, No. 4, pp. 717-732
J.W. Bruijsten

Polycentricity: In search of the ‘pur-fect’ region
Kloosterman, R.C., Musterd, S., 2001, the Polycentric Urban Region: Towards a Research Agenda, Urban Studies, Vol. 38, No. 4, pp. 623-633
Knaap, van der G.A., 2002, Stedelijke Bewegingsruimte: Over veranderingen in stad en land, Sdu Uitgevers, Den Haag.
Laan, van der L., 1998, Changing Urban Systems: An Empirical Analysis at Two Spatial Levels, Regional Studies, Vol. 32, No. 3, pp. 235-24
Laan, van der L., Vogelzang, J. and Schalke, R., 1998, Commuting in Multi-Nodal Urban Systems: an Empirical Comparison of Three Alternative Models, Tijdschrift voor Economische and Sociale Geografie, Vol. 89, No. 4, pp. 384-400
Laan, van der L., 2010, the Development of Functional Polycentricity in the Netherlands, Forthcoming.
Lambooy, J.G., 1998, Polynucleation and Economic Development: The Randstad, European Planning Studies, Vol. 6, No. 4, pp. 457-466
Levinson, D. and Wu, Y., 2005, The Rational Locator reexamined: are travel times still stable?, Transportation, Vol. 32, pp. 187-202
Limtanakool, N., Dijst, M. and Schwanen, T., 2007a, a Theoretical Framework and Methodology for Charcatrising National Urban Systems on the Basis of Flows of People: Empirical Evidence for France and Germany, Urban Studies, Vol. 44, No. 11, pp. 2123-2145
Limtanakool, N., Schwanen, T. and Dijst, M., 2007b, Ranking Functional Urban Regions: a Comparison of Interaction and Node Attribute Data, Cities, Vol. 24, No. 1, pp. 26-42
Lipczynski, J., Wilson, J. and Goddard, J., 2005, Industrial Organization – competition, strategy, policy. 2nd
ed. Harlow; England. Financial Times Prentice Hall.
McMillen, D.P. and Smith, S.C., 2003, the Number of Subcenters in Large Urban Areas, Journal of Urban Economics, Vol. 53, pp. 321-338
Meijers, E., 2005, Polycentric Urban Regions and the Quest for Synergy: Is a Network of Cities More than the Sum of the Parts?, Urban Studies, Vol. 42, No. 4, pp. 765-781
Meijers, E., 2007, Synergy in Polycentric Urban Regions; Complementarity, organizing capacity and critical mass, Sustainable Urban Areas, Vol. 13
Meijers, E., 2008, Summing Small Cities Does Not Make a Large City: Polycentric Urban Regions and the Provision of Cultural, Leisure and Sports Amenities, Urban Studies, Vol. 45, No. 11, pp. 2323-2342
Meijers, E. and Burger, M.J., 2010, Spatial Structure and Productivity in US Metropolitan Areas, Environment and Planning A, Vol. 42, No. 6, pp. 1383-1402
J.W. Bruijsten
Polycentricity: In search of the ‘pur-fect’ region
Meijers, E. and Lambregts, 2009, Shifting Fortunes of Neighbouring Cities, Paper to be presented at the North American Regional Science Council Annual Meeting, San Francisco, 18-21 November 2009
Mieszkowski, P. and Mills, E.S., 1993, the Causes of Metropolitan Suburbanization, The Journal of Economic Perspectives, Vol. 7, No. 3, pp. 135-147
Nordregio (Lead Partner) (Ed), 2005, ESPON 1.1.1: Potentials for polycentric development in Europe. Project Report. Stockholm/Luxembourg: Nordregio/ESPON Monitoring Committee. Available at: http://www.espon.eu/main/Menu_Projects/Menu_ESPON2006Projects/Menu_ThematicProjects/polycentricity.html [Accessed 20 May 2010]
Nuffel, van N., 2007, Determination of the Number of Significant Flows in Origin-Destination Specific Analysis: The Case of Commuting in Flanders, Regional Studies, Vol. 41, No. 4, pp. 509-524
Nuffel, van N. and Saey, P., 2005, Commuting, Hierarchy and Networking: the Case of Flanders, Tijdschrijft voor Economische and Sociale Geografie, Vol. 96, No. 3, pp. 313-327
Orfeuil, J.P. and Salomon, I., 1993, Travel Patterns of the Europeans in Everyday Life. In: Salomon, I., Bovy, P. and Orfeuil, J.P., Eds. A Billion Trips a Day: Tradition and Transition in European Travel Patterns, pp. 33–50. Dordrecht: Kluwer Academic Publishers. Ch. 4.
Oort, van F.G., 2004, Urban Growth and Innovation; Spatially Bounded Externalities in the Netherlands , Aldershot: Ashgate
Oort, van F.G. and Ritsema van Eck, J., 2010, De Economische Transformatie van Historische Binnensteden. In: Planbureau voor de Leefomgeving. De Staat van de Ruimte: de Herschikking van Stedelijk Nederland. Den Haag / Bilthoven. Ch. 1
Oort, van F.G. Burger, M. and Raspe, O., 2010, On the Economic Foundation of the Urban Network Paradigm: Spatial Integration, Functional Integration and Economic Complementarities within the Dutch Randstad, Urban Studies, Vol. 47, No. 4, pp. 725-748
Parr, J.B., 2004, The Polycentric Urban Region: A Closer Inspection, Regional Studies, Vol. 38, No. 3, pp. 231-240
Parr, J.B., 2005, Perspectives on the City-Region, Regional Studies, Vol. 39, No. 5, pp. 555-566
Patuelli, R., Reggiani, A., Nijkamp, P. and Bade, F-J., 2009, Spatial and Commuting Networks. In: Reggiani, A. and Nijkamp, P., Eds. Complexity and Spatial Networks, pp. 257-271. Berlin Heidelberg: Springer-Verlag. Ch. 18.
Patuelli, R., Reggiani, A., Nijkamp, P. and Bade, F-J., 2010, the Evolution of the Commuting Network in Germany: Spatial and Connectivity Patterns, Journal of Transport and Land Use, Vol. 2, No. ¾, pp. 5-37
J.W. Bruijsten
Polycentricity: In search of the ‘pur-fect’ region
Phelps, N.A., Wood, A.M. and Valler, D.C., 2010, A Postsuburban World? An Outline of a Research Agenda, Environment and Planning A, Vol 42, No.2, pp. 366-383
Pisati, M., 2001, sg162: Tools for Spatial Data Analysis, Stata Technical Bulletin, Vol. 60, pp. 21-37
Ploeger, R., 2004, Regulating Urban Office Provision: A study off the ebb and flow of regimes of urbanization in Amsterdam and Frankfurt am Main, 1945-2000. Doctoral dissertation. Universiteit van Amsterdam.
Riguelle, F., Thomas, I. and Verhetsel, A., 2007, Measuring Urban Polycentrism: a European case study and its implications, Journal of Economic Geography, Vol. 7, pp. 193-215
Reijs, A.M., Boonstra, B. and Jonkhoff, W., 2008, Benchmark Randstad; Leefomgeving, Economie en Bereikbaarheid Internationaal vergeleken, Netherlands Organization for Applied Scientific Research.
Renkow, M. and Hoover, D., 2000, Commuting, Migration, and Rural-Urban Population Dynamics, Journal of Regional Science, Vol. 40, No. 2, pp. 261-287
Rodríguez-Pose, A., 2008, the Rise of the “City-Region” Concept and its Development Policy Implications, European Planning Studies, Vol. 16, No. 8, pp. 1025-1046
Romein, A. and Verkoren, O., 2007, Polycentric Metropolitan Structures in the Americas: a Preliminary Review, Geographical Studies of Development and Resource Use, Vol. 3, pp. 3-19
Schabenberger, O. and Gotway, C.A., 2005, Statistical Methods for Spatial Data Analysis, New York, Champman & Hall/CRC
Schwanen, T., 2002, Urban Form and Commuting Behaviour: A Cross-European Perspective, Tijdschrift voor Economische en Sociale Geografie, Vol. 93, No. 3, pp. 336-343
Scwhanen, T., Dieleman, F.M. and Dijst, M., 2001, Travel Behaviour in Dutch Monocentric and Policentric Urban Systems, Journal of Transport Research, Vol. 9, pp. 173-186
Schwanen, T., Dieleman, F.M. and Dijst, M., 2004, the Impact of Metropolitan Structure on Commute Behavior in the Netherlands: A Multilevel Approach, Growth and Change, Vol. 35, No. 3, pp. 304-333
Sebastiani, M.R., 2003, Markov Random-field Models for Estimating Local Labour Markets, Applied Statistics, Vol. 52, Part 2, pp. 201-211
Shearmur, R., Coffey, W., Dubé, C. and Barbonne, R., 2007, Intrametropolitan Employment Structure: Polycentricity, Scatteration, Dispersal and Chaos in Toronto, Montreal and Vancouver, 1996-2001, Urban Studies, Vol. 44, No. 9, pp. 1713-1738
Sohn, J., 2005, Are Commuting Patterns a Good Indicator of Urban Spatial Structure?, Journal of Transport Geography, Vol. 13, pp. 306-317
J.W. Bruijsten

Polycentricity: In search of the ‘pur-fect’ region
Sýkora, L., Mulíček, O. and Maier, K., 2009, City regions and polycentric territorial development: concepts and practice, Urban Research and Practice, Vol. 2, No. 3, pp. 233-239
Tobler, W.R., 1970, a Computer Movie Simulating Urban Growth in the Detroit Region, Economic Geography, Vol. 46, Supplement: Proceeding. International Geographic Union. Commission on Quantative Methods (Jun., 1970), pp. 234-240
Travisi, C.M., Camagni, R. and Nijkamp, P., 2010, Impacts of Urban Sprawl and Commuting: a modeling study for Italy, Journal of Transport Geography, Vol. 18, pp. 382-392
Vasiliev, I.R., 1996, Visualization and Spatial Autocorrelation. In: Arlinghaus, S.L., Griffith, D.A., Arlinghaus, W.C., Drake, W.D. and Nystuen, J.D. Eds. Practical Handbook of Spatial Statistics. CRC Press. New York. Ch. 2
J.W. Bruijsten
Polycentricity: In search of the ‘pur-fect’ region
Appendix
Formula Moran’s I:
Im=nS0
∑i=1
n ∑j=1
n
wij (x i−¿ μx)(x j−μx )
∑i=1
n
(¿xi−μx )2 ¿
¿
N = number of communes
i and j are indices for communes
x i= Commune I’s share of employment in m / communes I’s share of total employment
μx is the mean of x i = ∑i=1
n
x i /n
w ijis an element of the spatial weights matrix W, which indicates the way the region is spatially connected to the region j
S0 is a scaling factor equal to the sum of all the elements of W
J.W. Bruijsten

Polycentricity: In search of the ‘pur-fect’ region
Figure 1: Municipalities of Venice. ArcGis output.
J.W. Bruijsten

Polycentricity: In search of the ‘pur-fect’ region
Figure 2: Moran scatterplot for Venice, 1991. Stata output.
J.W. Bruijsten
Polycentricity: In search of the ‘pur-fect’ region
Figure 3: Moran scatterplot for Venice, 2001. Stata output.Notes figure 2 and 3: A circle indicates spatial clustering of high values around a high value location (high-high spatial association), a square indicates low-low spatial association, a triangle means high-low spatial association and a diamond means low-high spatial association (Pisati, 2001).
J.W. Bruijsten
Polycentricity: In search of the ‘pur-fect’ region
Figure 4: Types of systems based on N1 and N2, 1991.
J.W. Bruijsten
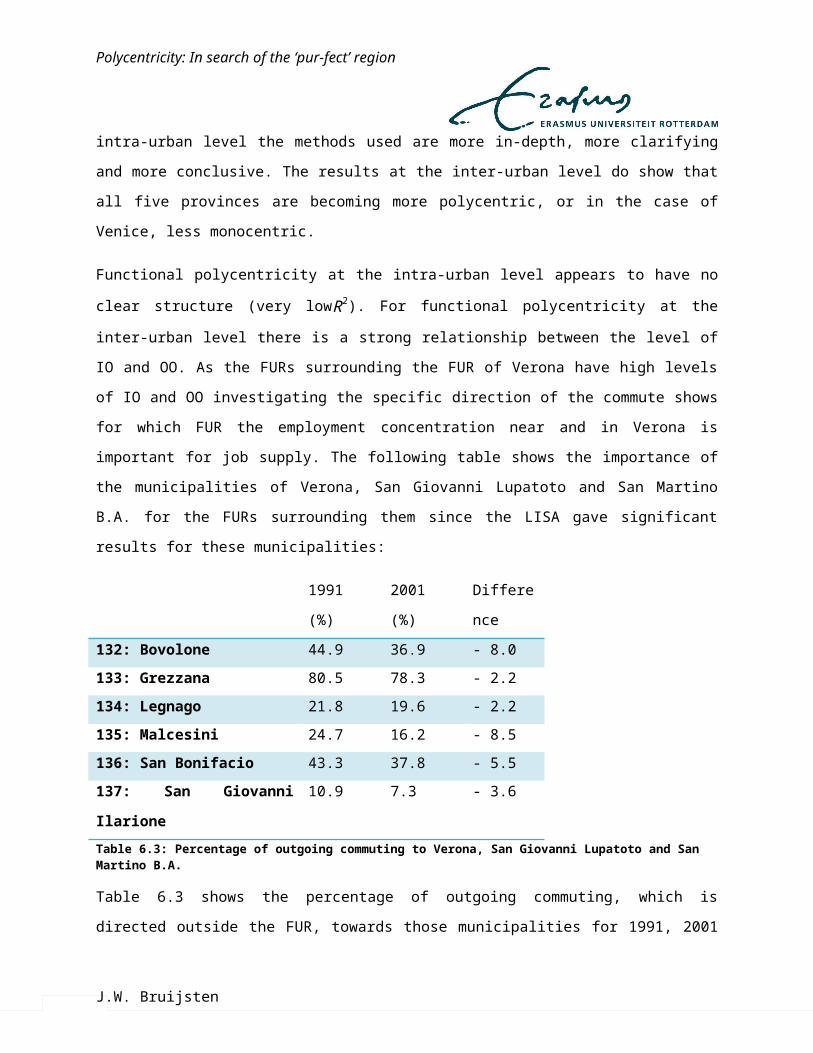
Polycentricity: In search of the ‘pur-fect’ region
Figure 5: Types of systems based on N1 and N2, 2001.
J.W. Bruijsten
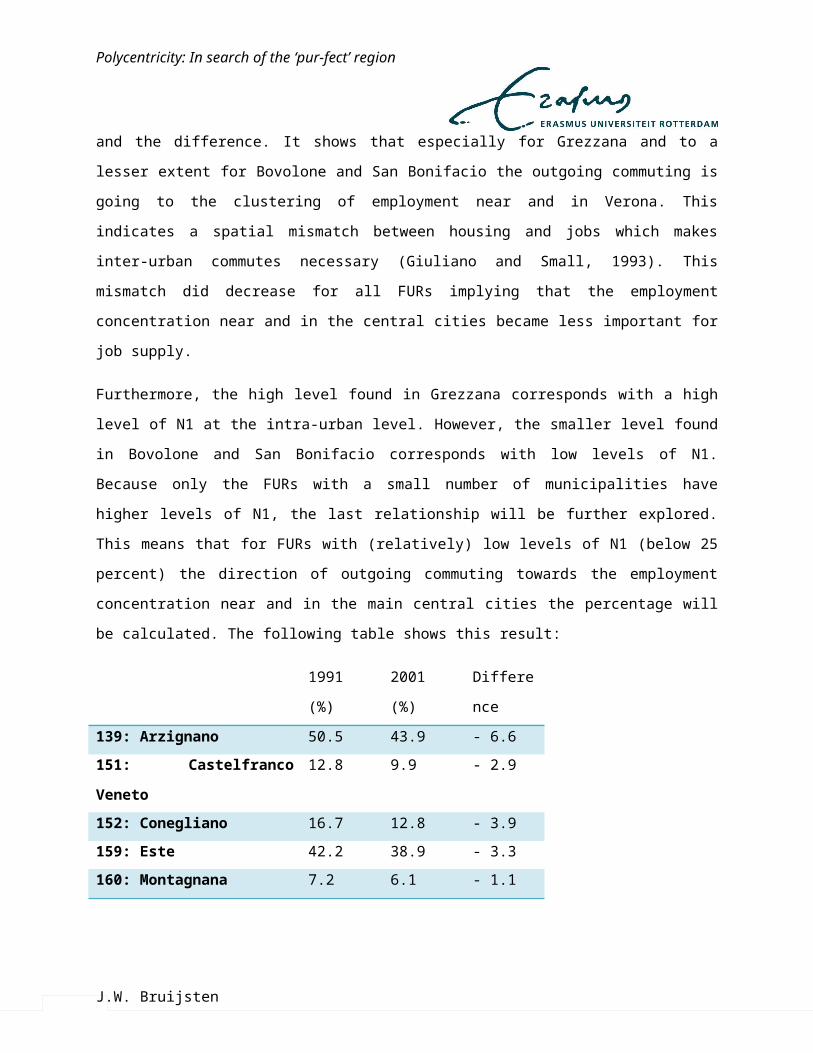
Polycentricity: In search of the ‘pur-fect’ region
Figure 6: Openness of the FURs in Veneto, 1991.
J.W. Bruijsten

Polycentricity: In search of the ‘pur-fect’ region
Figure 7: Openness of the FURs in Veneto, 2001.
J.W. Bruijsten
Polycentricity: In search of the ‘pur-fect’ region
Figure 8: Maps of the HHI for the FURs in Veneto, 1991 and 2001. ArcGis output.
J.W. Bruijsten
Polycentricity: In search of the ‘pur-fect’ region
HHI
FUR 1991 2001 Difference (%)
132: Bovolone 0.124 0.114 - 7.5
133: Grezzana 0.433 0.414 - 4.2
134: Legnago 0.206 0.198 - 4.1
135: Malcesini 0.334 0.406 + 21.5
136: San Bonifacio 0.068 0.068 + 1.3
137: San Giovanni Ilarione 0.287 0.296 + 3.2
138: Verona 0.308 0.277 - 10.1
Table 1: HHI of the FURs in the province of Verona. 1991, 2001 and the difference.
HHI
FUR 1991 2001 Difference (%)
139: Arzignano 0.134 0.128 - 4.2
140: Asiago 0.439 0.443 + 0.8
141: Bassano Del Grappa 0.104 0.106 + 2.0
142: Schio 0.327 0.343 + 5.1
143: Thiene 0.122 0.118 - 3.9
144: Vicenza 0.261 0.224 - 14.1
Table 2: HHI of the FURs in the province of Vicenza. 1991, 2001 and the difference.
HHI
FUR 1991 2001 Difference (%)
151: Castelfranco Veneto 0.064 0.064 - 0.4
152: Conegliano 0.101 0.089 - 12.2
153: Montebelluna 0.094 0.099 + 5.2
154: Pieve Di Soligo 0.145 0.152 + 4.9
155: Treviso 0.168 0.135 - 19.9
Table 3: HHI of the FURs in the province of Treviso. 1991, 2001 and the difference.
J.W. Bruijsten

Polycentricity: In search of the ‘pur-fect’ region
HHI
FUR 1991 2001 Difference (%)
156: Portogruaro 0.129 0.116 - 9.9
157: San Dona’ Di Piave 0.221 0.230 + 4.0
158: Venezia 0.423 0.337 - 20.3
Table 4: HHI of the FURs in the province of Venezia. 1991, 2001 and the difference.
HHI
FUR 1991 2001 Difference (%)
159: Este 0.116 0.125 + 8.1
160: Montagnana 0.077 0.078 + 1.4
161: Padova 0.249 0.222 - 10.9
Table 5: HHI of the FURs in the province of Padova. 1991, 2001 and the difference.
HHI
Province 1991 2001 Difference (%)
Verona 0.048 0.043 - 11.8
Vicenza 0.048 0.043 - 11.8
Treviso 0.031 0.023 - 25.0
Venice 0.263 0.198 - 25.0
Padova 0.162 0.145 - 10.2
Table 6: HHI of the different provinces at the inter-urban scale. 1991, 2001 and the difference.
Notes: An HHI of about 0.20 is assumed to be (relatively) high. Low values of the HHI mean high morphological polycentricity. A decrease of the HHI thus means more morphological polycentricity. The calculated differences can deflect because of rounding errors.
J.W. Bruijsten
Polycentricity: In search of the ‘pur-fect’ region
Distance band
I E (I) Z p-value
Verona1991 12500 0.028 -0.010 3.433 0.000*2001 12500 0.032 -0.010 3.501 0.000*
Vicenza1991 25000 0.006 -0.009 1.224 0.1102001 25000 0.011 -0.009 1.521 0.064**
Treviso1991 9500 0.032 -0.010 1.218 0.1122001 9500 0.041 -0.010 1.325 0.093**
Venice1991 21000 0.000 -0.021 1.789 0.037*2001 21000 0.005 -0.021 1.832 0.033*
Padova1991 10000 0.035 -0.011 4.127 0.000*2001 10000 0.037 -0.011 4.051 0.000*Table 7: Results Moran’s I.
Notes: I = Moran’s I. E (I) = the expected value of Moran’s I, thus indicating a randomly distribution of values. The z-score refers to the normal distribution: 1.65 for the 0.10 level, 1.96 for the 0.05 level and 2.58 for the 0.01 level. * meaning that the p-value is significant at the 0.05 level and ** for the 0.010 level.
Verona:
I E(I) Z p-value1991
San Giovanni Lupatoto 0.408 -0.010 3.338 0.000*San Martino Buon Albergo 0.272 -0.010 2.303 0.011*Verona 0.788 -0.010 6.409 0.000*
2001Bussolengo 0.158 -0.010 1.302 0.096**San Giovanni Lupatoto 0.470 -0.010 3.723 0.000*San Martino Buon Albergo 0.266 -0.010 2.190 0.014*Verona 0.947 -0.010 7.472 0.000Table 8: Results LISA Verona.
J.W. Bruijsten

Polycentricity: In search of the ‘pur-fect’ region
I E(I) Z p-value1991
Arzignano 0.186 -0.009 1.730 0.042Bassano del Grappa -0.335 -0.009 -3.039 0.001*Montecchio Maggiore 0.165 -0.009 1.589 0.056**Vicenza -0.291 -0.009 -3.060 0.001*
2001Arzignano 0.236 -0.009 2.127 0.017*Bassano del Grappa -0.357 -0.009 -3.192 0.001*Montecchio Maggiore 0.195 -0.009 1.835 0.033*Vicenza -0.131 -0.009 -1.328 0.092**Table 9: Results LISA Vicenza.
I E(I) Z p-value1991
Treviso 0.995 -0.010 4.532 0.000*Villorba 0.856 -0.010 3.712 0.000*Vittorio Veneto -0.406 -0.010 -1.763 0.039*
2001Treviso 1.362 -0.010 5.741 0.000*Villorba 0.988 -0.010 3.960 0.000*Vittorio Veneto -0.465 -0.010 -1.879 0.030*Table 10: Results LISA Treviso.
I E(I) Z p-value1991
Venice -0.677 -0.021 -4.239 0.000*
2001Venice -0.512 -0.021 -3.100 0.001*Table 11: Results LISA Venice.
J.W. Bruijsten

Polycentricity: In search of the ‘pur-fect’ region
I E (I) Z p-value1991
Abano Terme 0.325 -0.011 2.732 0.003*Padova 0.916 -0.011 7.810 0.000*Rubano 0.211 -0.011 1.801 0.036*Selvazzano Dentro 0.155 -0.011 1.326 0.092**Vigonza 0.182 -0.011 1.512 0.065**
2001Abano Terme 0.259 -0.011 2.200 0.014*Padova 1.009 -0.011 8.486 0.000*Rubano 0.226 -0.011 1.895 0.029*Vigonza 0.177 -0.011 1.441 0.075**Table 12: Results LISA Padova.
Notes: I = Local Moran’s I. E (I) = the expected value of Moran’s I, thus indicating a randomly distribution of values. * meaning that the p-value is significant at the 0.05 level and ** for the 0.010 level.
The interpretation of the LISA is actually more refined as was set forth in chapter 5; it is therefore possible that the local Moran’s I is larger (smaller) than 1 (-1).
Inward Openness Outward Openness 1991 (%) 2001 (%) Difference 1991 (%) 2001 (%) Difference132: Bovolone 48.1 47.9 -0.2 58.1 58.5 0.4133: Grezzana 66.3 59.8 -6.4 80.4 79.8 -0.7134: Legnago 35.0 35.8 0.8 39.1 40.3 1.2135: Malcesini 64.0 54.1 -9.9 76.6 69.0 -7.6136: San Bonifacio 38.2 40.4 2.1 45.7 43.0 -2.7137: San Giovanni Ilarione 64.2 61.0 -3.2 74.0 80.2 6.3138: Verona 21.3 21.0 -0.4 13.6 13.7 0.1 139: Arzignano 27.3 32.0 4.7 31.9 28.8 -3.1140: Asiago 29.4 18.5 -10.9 37.5 40.9 3.4141: Bassano del Grappa 20.3 21.2 0.9 20.1 21.0 0.9142: Schio 38.0 47.7 9.7 43.9 46.8 2.9143: Thiene 31.7 34.3 2.6 34.4 38.2 3.8144: Vicenza 30.9 32.6 1.7 19.4 23.8 4.4 151: Castelfranco Veneto 37.1 39.6 2.5 45.5 41.2 -4.3152: Conegliano 22.5 23.0 0.5 25.7 24.0 -1.7153: Montebelluna 40.0 39.1 -0.9 36.3 38.3 2.0154: Pieve di Soligo 40.6 38.4 -2.1 37.2 38.0 0.8
J.W. Bruijsten

Polycentricity: In search of the ‘pur-fect’ region
155: Treviso 29.7 31.1 1.5 27.8 29.9 2.1 156: Portogruaro 36.1 37.9 1.8 41.8 40.1 -1.7157: San Dona’ di Piave 29.9 30.0 0.1 47.8 44.7 -3.1158: Venezia 27.2 28.7 1.5 24.0 28.0 4.0 159: Este 34.6 34.6 0.0 53.5 50.1 -3.4160: Montagnana 64.5 63.5 -1.0 72.9 73.3 0.4161: Padova 24.3 28.1 3.8 18.2 19.1 0.9
Aggregated difference 5.5 (4.0) -0.8 (29.5)Table 13: IO and OO of the FURs in Veneto. 1991, 2001 and the difference.
Notes: the calculated difference can deflect because of rounding errors. The number between brackets is the aggregated difference when four small FURs are left out.
J.W. Bruijsten