jvpt-2012_vol11
TRANSCRIPT

8/13/2019 JVPT-2012_Vol11
http://slidepdf.com/reader/full/jvpt-2012vol11 1/108

8/13/2019 JVPT-2012_Vol11
http://slidepdf.com/reader/full/jvpt-2012vol11 2/108

8/13/2019 JVPT-2012_Vol11
http://slidepdf.com/reader/full/jvpt-2012vol11 3/108

8/13/2019 JVPT-2012_Vol11
http://slidepdf.com/reader/full/jvpt-2012vol11 4/108

8/13/2019 JVPT-2012_Vol11
http://slidepdf.com/reader/full/jvpt-2012vol11 5/108
1 Journal of Veterinary Pharmacology and Toxicology/December 2012/Vol.11/Issue 1-2/1-7
Department of Veterinary Pharmacology and Toxicology C.V.A.Sc, G.B.P.U.A & T, Pantnagar-263145.*Corresponding author : E-mail: [email protected]
G-PROTEIN COUPLED RECEPTORS: PAST AND PRESENT STATUS
S.P. SINGH*, A.H. AHMAD, WASIF AHMAD AND N.K. PANKAJ
ABSTRACT
Among membrane-bound receptors, the G protein-coupled receptors (GPCRs) are of most diverse type of receptorswhich might have originated during evolution and are capable of transducing messages through different photons, organicodorants, nucleotides, nucleosides, peptides, lipids and proteins. A general method for understanding the mechanisms ofligand recognition and activation of G protein-coupled receptors has been developed. This is an attempt to update andvisualize overall concepts regarding GPCR including their isoforms, database information, agonist desensitization, couplingmechanism etc.
Key words: Database, GPCR, isoforms, metabotropic, signaling pathways, transduction.
Review Article
INTRODUCTION"G-protein–coupled receptors (GPCRs) form a
remarkable modular system that allows transmission of a wide variety of signals over the cell membrane, between cells and over long distances in the body. Today, we
understand the molecular mechanism of how these receptors work in intricate detail" . Kobilka and Lefkowitz,Nobel Laureates for Chemistry (2012).
GPCRs have been recognised in the genomes ofunicellular organisms like bacteria and yeast tomulticellular like plants, nematodes and other invertebrategroups. This hints towards an early evolutionary origin ofthis group of molecules. The diversity of GPCRs is dictatedboth by the multiplicity of stimuli to which they respond,as well as by the variety of intracellular signaling pathways
they activate. These include light, neurotransmitters,odorants, biogenic amines, lipids, proteins, amino acids,hormones, nucleotides, chemokines and, undoubtedly,many others. In addition, there are at least 18 differenthuman Gα proteins to which GPCRs can couple. TheseGα proteins form heterotrimeric complexes with Gβ
subunits, which have at least 5 types, and Gγ subunits,which have at least 11 types (Hermans, 2003; Wong, 2003).
STRUCTURE OF CPCRs
In a recent analysis of the GPCRs in the humangenome, more than 800 GPCRs have been listed out of
which 701 belong to rhodopsin family (type A) and 241 tonon-olfactory type (Fredriksson et al., 2003). According tothis analysis, there are approximately 460 type A olfactoryreceptors, although estimates range from 322 (Glusmanet al., 2001; Takeda et al., 2002) to 900 (Venter et al.,
2001) out of which 347 have been cloned (Zozulya et al.,2001). This large number of olfactory receptors accountsfor the ability of humans to detect a wide variety ofexogenous olfactory ligands. In an another report, 367human endoGPCRs and 392 mouse endoGPCRs
(Vassilatis et al., 2003) were listed. The term endoGPCRrefers to GPCRs for endogenous (non-olfactory) ligands.
In view of the known existence of alternatively splicedvariants and editing isoforms of GPCRs, it is likely thatthe true number of GPCRs might never be known and ismuch higher than predicted.
The GPCRs, also known as metabotropicreceptors or 7-transmembrane heptahelical receptors thatcouple to intracellular effector systems via a G-protein.They constitute the largest family, and include receptorsfor many hormones and slow transmitters, viz themuscarinic acetylcholine receptor (mAChR), adrenergicreceptors and chemokine receptors (Milligan, 2006). G-proteins comprise a family of membrane-resident proteinswhose function is to recognize activated GPCRs and passon the message to the effector systems that generate acellular response and represent the interlocutor in theexecutive setup, intercepting between the receptors andon the effector enzymes or ion channels. They are calledG-proteins because of their interaction with the guaninenucleotides i.e. GTP and GDP (Offermanns, 2002). G-proteins consist of three subunits: α, β and γ . Guaninenucleotides bind to the α subunit, which has enzymicactivity, catalyzing the conversion of GTP to GDP. The βand γ subunits remain together as a βγ complex (Kostenis,2006). All three subunits are anchored to the membranethrough a fatty acid chain, coupled to the G-protein through
a reaction known as prenylation. G-proteins appear to befreely diffusible in the plane of the membrane, so that singlepool of G-protein in a cell can interact with several differentreceptors and effectors. In the ‘resting’ state, the G-proteinexists as an unattached αβγ trimer, with GDP occupyingthe site on the α subunit. After a GPCR is activated by anagonist molecule, a conformational change occurs incytoplasmic domain of the receptor causing it to acquirehigh affinity for αβγ . Association of αβγ with the receptorcauses the bound GDP to dissociate and to be replaced
8/13/2019 JVPT-2012_Vol11
http://slidepdf.com/reader/full/jvpt-2012vol11 6/108
with GTP (GDP-GTP exchange), which in turn causesdissociation of the G-protein trimer releasing α-GTP andβγ subunits; the ‘active’ forms of the G-protein which diffusein the membrane and can associate with various enzymesand ion channels causing activation of the target. It wasoriginally thought that only the α subunit has a signaling
function and βγ complex serving merely as a chaperoneto keep α subunits out of range of the various effectorproteins to prevent it to get otherwise excited. However,the βγ complexes actually make assignations of their ownand control effectors in much the same way as the αsubunits (Clapham et al., 1997). In general, it appearsthat higher concentrations of βγ complex than ofα subunitsare needed. Thus, βγ -mediated effects occur at higherlevels of receptor occupancy than α-mediated effects.Association of α subunits with target enzymes can causeeither activation or inhibition depending on the involving Gprotein.
ISOFORMS OF THE GPCR RECEPTORSFunctional cDNA clones for two isoforms of the
mouse prostaglandin E receptor EP3 (GPCR) subtype wereobtained from alternative RNA splicing. The two isoformsdiffer in the sequence of the putative cytoplasmic carboxyl-terminal tail and their hydrophobicity; one isoform, namedEP3α, has a hydrophilic tail, and the other, named EP3β,has a hydrophobic tail. On expression, the two receptorsdisplayed identical ligand binding properties but differedin responses to guanosine 5'-O-(3-thiotriphosphate) (GTPgamma S). Without a change in the Bmax value, GTPgamma S increased Kd for prostaglandin E2 EP3β anddecreased that of EP3α. These effects were abolished by
the treatment of membranes with pertussis toxin andrestored by the addition of Gi2. Although both isoformsexerted inhibition of forskolin-induced cAMP accumulation,three orders lower concentrations of agonists were requiredfor EP3α than EP3β for 50% inhibition of cAMP formation.A similar difference in agonist potency was also observedfor agonist-induced stimulation of GTPase activity inmembranes. Thus, the two receptors with differentcarboxyl-terminal tails showed variation in coupling tothe Gi protein leading to the opposite responses to GTPin the ligand binding affinity and to different affinities of theagonist-occupied receptors to the G proteins (Sugimoto,1993).
PHARMACODYNAMICS
GPCRs are present on the plasma membrane asa bundle of 7-α-helices. The biology of GPCRs is highlycomplex, their ultimate importance is depicted by the factthat at least one third (Robas et al., 2003) and perhaps asmany as half (Flower, 1999) of currently marketed drugstarget GPCRs, although only 10% of GPCRs are knowndrug targets (Vassilatis et al., 2003). Agonists bind to a
cleft within the extracellular face of the bundle or to aglobular ligand-binding domain sometimes found at theamino terminus. G proteins bind to the cytoplasmic faceof the receptors. Agonist binding is followed by a changein the conformation of the receptor that may involvedisruption of a strong ionic interaction between the third
and sixth transmembrane helices (Ballesteros et al.,2001; Shapiro et al., 2002) which facilitates activation ofthe G-protein heterotrimer. Depending on the coupling ofthe receptor with type of G proteins, a variety ofdownstream signaling pathways can be activated(Marinissen and Gutkind, 2001; Neves et al., 2002).Signaling is then attenuated by GPCR internalizationfacilitated by arrestin binding. Signalling, desensitizationand eventual resensitization are regulated by complexinteractions of various intracellular domains of the GPCRswith numerous intracellular proteins (Bockaert et al., 2003).
Receptors in this family respond to agonists bypromoting the binding of GTP to the G protein α subunit.
GTP activates the G protein and allows it, in turn, to activatethe effector protein. The G protein remains active until ithydrolyzes the bound GTP to GDP and becomes inactive.G proteins are composed of a GTP-binding α subunit whichconfers specific recognition by receptor and effector andan associated dimer of β and γ subunits that confer bothmembrane localization of the G protein e.g., via myristoylation and direct signaling such as activation ofinward rectifier K+ (GIRK) channels and binding sites forG protein receptor kinases (GRKs). Activation of the G
α
subunit by GTP allows it to both regulate an effector proteinand drive the release of G
βγ subunits which in addition to
regulating their own group of effectors, re-associate with
GDP-liganded Gα, returning the system to the basal state.The major effect of many GPCRs is to release calcium(Ca2+) from intracellular stores. For example, receptorsfor norepinephrine activate G
q specific for the activation of
phospholipase Cb. Phospholipase C
b (PLC
b) is a
membrane-bound enzyme that hydrolyzesphosphatidylinositol-4,5-bisphosphate, a membranephospholipid, to generate inositol-1,4,5-trisphosphate (IP3)and the lipid, diacylglycerol (DAG). IP
3 binds to receptors
on Ca2+ release channels in the IP3-sensitive Ca2+ storesof the endoplasmic reticulum, triggering the release of Ca2+
and rapidly raising [Ca2+]i from approximately 100 nM tothe micromolar range. When Ca2+ levels rise followingrelease from intracellular stores, the elevation of Ca2+ istransient due to reuptake of Ca2+ into these stores. Ca2+
can bind to and directly regulate ion channels e.g., largeconductance Ca2+-activated K+ channels, or Ca2+ can bindto calmodulin and the resulting Ca2+-calmodulin complexthen can bind ion channels e.g., small conductance Ca2+-activated K+ channels or to intracellular enzymes such asCa2+-calmodulin-dependent protein kinases e.g., CaMKII,MLCK, and phosphorylase kinase. While the complexity
Singh et al.
2 Journal of Veterinary Pharmacology and Toxicology/December 2012/Vol.11/Issue 1-2/1-7

8/13/2019 JVPT-2012_Vol11
http://slidepdf.com/reader/full/jvpt-2012vol11 7/108
of receptor signaling through G proteins is clear from theabundance of GPCRs present on a single cell, receptor-ligand interactions alone do not regulate all GPCRsignaling. It is now clear that GPCRs undergo both homo-and heterodimerization and possibly oligomerization(Milligan, 2003).
TERNARY COMPLEX AND DRUG DESIGNKobilka and his coworkers revealed the three-
dimensional (3D) structure of a fully functional ternarycomplex at high resolution: the complex of β2-adrenergicreceptor (βAR) with agonist and G-protein. The ternarycomplex structure and a range of other structures providea basis for pharmacologic development of drugs with highspecificity, efficacy and few side effects. The biochemicalstrategies developed by Kobilka for βAR make it possibleto produce crystals of other 7TM receptors as well(Rasmussen et al., 2011).
Membrane protein crystallization technology and
fragment screening lead to many new X-ray structures ofGPCRs which provide more accurate homology modelsacross the Family A class of GPCRs which are helpful instructure-based drug discovery (SBDB) to GPCRs. In silico screening will be useful to define the three dimensionalstructure and the extent of binding sites of the GPCRreceptors. Hot spot within the binding sites of GPCRs toligands can be used to select virtual hits. Thus homologymodels may be derived from structural information availablefrom closely related proteins (Cavasotto and Phatak,2009). These approaches have been used successfully toidentify antagonists and will be useful in future as well inreducing the attrition rate of drugs targeted at GPCRs for
identification of agonists. Thus, combining the newapproaches like structure-based discovery and in silico screening with advancements in the molecular biology andgenetic engineering of GPCRs will open new vistas ofGPCR targeted drug discovery (Congreve et al., 2011).
PARTIAL AGONISTS AND GPCR DESENSITIZATIONWeak or partial agonists desensitize GPCRs
more efficiently than strong agonists (Clark, 1999).Receptors that mediate their actions by stimulating GTPbinding regulatory G proteins share structural as well asfunctional similarities. Genetic analysis of the β-adrenergicreceptor (β-AR) revealed that the ligand binding domain ofthis receptor, like that of rhodopsin, involves residues withinthe hydrophobic core of the protein (Strader,1989). A modelfor ligand binding to the receptor has been developed inwhich the amino group of an agonist or antagonist isanchored to the receptor through the carboxylate side chainof Asp113 in the third transmembrane helix. Interactionsbetween specific residues of the receptor and functionalgroups on the ligand have also been proposed. Theinteraction between the β-AR and the G protein Gs has
been shown to involve an intracellular region that ispostulated to form an amphiphilic alpha helix. This regionof the β-AR is also critical for sequestration, whichaccompanies agonist-mediated desensitization, to occur(Dixon, 1989). Structural similarities among G protein-linked receptors suggest that the information gained from
the genetic analysis of the β-AR should help definefunctionally important regions of other receptors of thisclass (Sigal,1989).
PROBABLE ARRANGEMENT OF THE HELICES INGPCRs
The probable arrangement of the seven helices,in all receptors, has been deduced. The location, relativeto the centre of the lipid bilayer of each of the seven helicalsequence segments and their probable lengths andorientation are deduced from sequence analysis relativeto the centre of the helix bundle of each helical segmentaround its axis. The packing of the helices in the model is
revealed by the density in a three-dimensional map of frogrhodopsin determined by electron cryo-microscopy(Baldwin,1997). A model proposed for the interactionbetween G proteins and G protein-coupled receptors, isbased on the fact that this interaction shows littlespecificity and conserved parts of the G proteins interactwith conserved parts of the receptors. These parts are aconserved negative residue in the G protein, a fullyconserved arginine in the receptor and a series of residuesthat are not conserved but always hydrophobic like thehydrophobic side of the C-terminal helix of the G proteinand the hydrophobic side of a helix in the C-terminal domainof the receptor. Other, mainly cytosolic, factors determine
the specificity and regulation of this interaction(Oliveira,1999).
MOLECULAR MEDIATORS OF GPCRsG protein-coupled receptors (GPCRs) are
certainly the most diverse among membrane-boundreceptors and are capable of transducing messagesthrough different nucleotides, nucleosides, photons,organic odorants, peptides, proteins and lipids. Two-dimensional crystallization of rhodopsin have led to a usefulmodel of a common ‘central core’, composed of seventransmembrane helical domains and its structuralmodifications during activation. There are at least sixfamilies of GPCRs showing no sequence similarity(Bockaert, 1999). Some GPCRs have been found to formeither homo- or heterodimers with a structurally differentGPCRs but also with membrane-bound proteins havingone transmembrane domain such as nina-A, odr-4 orRAMP, the latter being involved in their targeting, functionand pharmacology (Pin, 1999).
Certain findings provided new insight into G-protein signaling during mammalian development and
GPCRs
Journal of Veterinary Pharmacology and Toxicology/December 2012/Vol.11/Issue 1-2/1-7 3

8/13/2019 JVPT-2012_Vol11
http://slidepdf.com/reader/full/jvpt-2012vol11 8/108
helped to explain how color of hair and skin can becontrolled both coordinately and independently (VanRaamsdonk, 2004). A new class of dominant dark skin(Dsk ) mutations was discovered after screening of~30,000mice with increased dermal melanin. Three out of four suchmutations as hypermorphic alleles of Gnaq and Gna11,
which encode widely expressed Gαq subunits and requireEdnrb in an additive and quantitative manner (Fuchs et
al., 2004).The G-protein-coupled receptors are hijackedby viruses and harness their activated intracellular signalingpathways during the development of the disease (Sodhiet al., 2004).
REGULATORS OF G PROTEIN SIGNALING (RGS)PROTEINS
RGS proteins in drug discovery RGS proteins play an important role in signal
regulation via GPCRs and have shown potential clinicalimportance in CNS and CVS disorders, cancer and
diabetes which thus need to be targeted in drug discovery(Sjogren, 2011). During recent years GPCR signaling hasbeen greatly explored and targeted for drug discovery.Various drugs have been developed that target thesereceptors, and a lot of research has been done tounderstand their physiological and pathophysiologicalfunction.
Now the pathways are well understood thatGPCRs signaling occurs through heterotrimeric G proteinsconsisting of an α and a βγ -subunit. After receptoractivation, the α subunit is exchanged from GDP to GTPresulting in its dissociation from heterotrimer. The signalis turned off upon hydrolysis of GTP to GDP reformingheterotrimeric complex. This process in vitro occurs atfairly slow rate in minutes whereas at a fast rate in vivo inseconds which is due to the missing component identifiedduring early 1990s as regulator of G protein signaling (RGS)proteins. RGS proteins accelerate GTPase activity at active(GTP-bound) Gα subunits causing reduced amplitude andduration of GPCR-mediated signaling (Hollinger and Hepler,2002). RGS proteins have a common domain called theRGS or RH (RGS homology) domain responsible for thecatalytic activity toward Gα proteins. It is now understoodthat RGS proteins are involved in regulating GPCR signalingas well as non GTPase-activating (non-GAP) proteins
mechanisms suggesting a potential role for RGS proteinsas drug targets. Since RGS discovery over 15 years ago,RGS proteins have been characterized in their ability toregulate GPCR signaling, structure, tissue distribution,and physiological function. Albeit much to be worked out,it is evident that RGS proteins are emerging as novel drugtargets in several pathophysiological states (Sjögren et al., 2010; Tesmer, 2009).
Apart from the canonical function as GAPs, manyRGS proteins also have other properties which have been
a research area of great interest in recent years. SeveralRGS proteins contain additional domains to their RGSdomain that can play a role in these functions. However,the presence of additional functional domains is not alwaysnecessary for an RGS protein to have functions that arenot directly related to the GAP activity. The ability to
participate in protein–protein interactions has been welldescribed for members of the R7 family of RGS proteins.Inhibition of RGS protein function
Inhibition of RGS proteins enhance signaling viacertain GPCRs. Many RGS proteins have a very limitedexpression (Gold et al.,1997) and this could increasetissue specificity and enable lower dosage of anendogenous or exogenous agonist (Blazer and Neubig,2009). RGS proteins enhance α2a adrenergic suppressionof hippocampal CA3 epileptiform bursts, for their role inthe treatment of epilepsy (Goldenstein et al., 2009). Themodels using RGS-insensitive Gα proteins can be usedfor understanding the potential of RGS protein inhibitors
in the treatment of CNS disorders.Augmentation of RGS protein function
Enhancer of RGS protein function mediatedthrough RGS-insensitive Gα proteins could be beneficialin the treatment of various hormones andneurotransmitters, such as noradrenaline, angiotensin II,5-HT, endothelin, and acetylcholine associatedcardiovascular disease e.g., hypertension, heart failure,and arrhythmias by reducing signaling via muscarinicreceptors that couple to Gαi2 (Fu et al., 2006; 2007).Identifying the RGS protein(s) responsible for thephenotype will be crucial in developing novel modulatorsof RGS protein function. RGS4 could enhance the
muscarinic responses in the RGS-insensitive Gαi2expression as evident in RGS4 knockout mice exhibitingincreased responses to agonists at the M2 muscarinicreceptor, decreased GIRK channel desensitization (Benderet al., 2008) and altered kinetics of acetylcholine-activatedKþ currents (Cifelli et al., 2008) in the heart whichsuggested the potential for RGS4 enhancement in theregulation of cardiac automaticity.
Beneficial roles of enhancers of RGS proteinfunction was also evident from the phenotype of the RGS2knockout mice, which were hypertensive and prone to earlyheart failure (Heximer et al., 2003; Oliveira-Dos-Santos et
al., 2000) and is related to increased signaling throughseveral receptors responsible vasoconstriction such asPAR- 1 (Tang et al., 2003), noradrenaline, angiotensin II,vasopressin, and endothelin receptors in vascular smoothmuscle cells (VMSCs). RGS2 regulates blood pressurelikely through its actions in the kidney (Gurley et al., 2010).RGS9 enhancers could be beneficial in the treatment ofdrug addiction and side effects of L-DOPA treatment inParkinson’s disease (PD).
G-protein-coupled receptors (GPCRs) have been
Singh et al.
4 Journal of Veterinary Pharmacology and Toxicology/December 2012/Vol.11/Issue 1-2/1-7

8/13/2019 JVPT-2012_Vol11
http://slidepdf.com/reader/full/jvpt-2012vol11 9/108
recently credited as crucial players in tumour growth andmetastasis. Malignant cells often hijack the normalphysiological functions of GPCRs to survive, proliferateautonomously, evade the immune system, increase theirblood supply, invade their surrounding tissues anddisseminate to other organs. Interfering with GPCRs might
provide unique opportunities for cancer prevention andtreatment.
DATABASE ON GPCRA database system and computer programs for
storage and retrieval of information about guaninenucleotide-binding protein (G protein) -coupled receptormutants and associated biological effects have beendeveloped. Data on the GPCRs mutants were collectedfrom the literature to develop a database of mutants andtheir effects. The GPCR, family A, point mutation database(GRAP) provides detailed information on ligand-binding andsignal transduction properties of over 2130 receptor
mutants. The amino acid sequences of receptors for whichmutation experiments have been reported were alignedand mutation data may be retrieved from this alignment.Alternatively, a detailed specification of mutants may besearched, for example, search for specific amino acidsubstitutions, substitutions in specific protein domains orreported biological effects. Furthermore, ligand andbibliographic oriented queries may be performed. GRAPis available on the Internet (URL: http://www-grap.fagmed.uit.no/GRAP/+ +homepage.html) using theWorld-Wide Web system. (Kristiansen, 1996).
CONCLUSION
The GPCRs, also called metabotropic receptors,have been reported in the genomes of unicellular organismslike bacteria and yeast to multicellular like plants,nematodes and other invertebrate groups and arecomprised of seven membrane-spanningα-helices oftenlinked as dimeric structures. One of the intracellular loopsis larger than the others and interacts with the G-protein.The G-protein, a trimeric membrane protein comprisingthree subunits (α, β, γ ) with the α subunit possessingGTPase activity, binds to antagonist-occupied receptor,the α subunit dissociates and activate an effector i.e., amembrane enzyme or ion channel. RGS proteins play animportant role in signal regulation via GPCRs and haveshown potential clinical importance in CNS and CVSdisorders, cancer and diabetes which thus need to betargeted in drug discovery. There are several types of G-protein, which interact with different receptors and controldifferent effectors through second messengers such ascAMP, IP3, DAG etc. Various isoforms have been identifiedin different species. The GPCRs, which is the largest familyof cell-surface molecules involved in signal transmission,have recently credited as crucial players in tumor growth
and metastasis.REFERENCESBaldwin, J., Schertler, G. and Unger,V.(1997). An alpha-
carbon template for the transmembrane helicesin the rhodopsin family of G-protein-coupledreceptors.J Mol Biol Sep 272:144-64.
Ballesteros, J., Jensen, D., Liapakis, G., Rasmussen, G.,Shi, L, Gether, U. and Javitch, J. (2001). Activationof the beta 2-adrenergic receptor involvesdisruption of an ionic lock between thecytoplasmic ends of transmembrane segments 3and 6. J. Biol. Chem. 276 :29171-29177.
Bender, K., Nasrollahzadeh, P., Timpert, M., Liu, B., Pott,L. and Kienitz, M. C. (2008). A role for RGS10 inbeta-adrenergic modulation of G-protein-activatedKþ (GIRK) channel current in rat atrial myocytes.The J.of Physiol . 586: 2049–2060.
Blazer, L. L. and Neubig, R. R. (2009). Small moleculeprotein-protein interaction inhibitors as CNS
therapeutic agents: Current progress and futurehurdles. Neuropsychopharmac . 34: 126–141.Bockaert, J. and Pin, J.P. (1999). Molecular tinkering of G
protein-coupled receptors: an evolutionarysuccess. EMBO J . 18:1723-9.
Bockaert, J., Marin, P., Dumuis, A. and Fagni, L. (2003).The ‘magic tail’ of G protein-coupled receptors:an anchorage for functional proteinnetworks. FEBS Lett. 546, 65-72.
Cavasotto, C. N. and Phatak, S. S. (2009). Homologymodeling in drug discovery: Current trends andapplications. Drug Discovery Today . 14(13–14):676–683.
Cifelli, C., Rose, R. A., Zhang, H., Voigtlaender-Bolz, J.,Bolz, S. S., Back, P. H., and Fu, Y., Huang, X.,Zhong, H., Mortensen, R. M., D’Alecy, L. G. andNeubig, R. R. (2008). Endogenous RGS proteinsand Galpha subtypes differentially controlmuscarinic and adenosine-mediated chronotropiceffects. Circulation Res. 98: 659–666.
Clapham, R., Knoll, B. and Neer, R (1997). Partial agonistsand G protein-coupled receptor desensitization.Trends Pharmacol. Sci. 20: 279-86.
Clark, R.B., Knoll, B. and Barber, R. (1999). Partialagonists and G protein-coupled receptordesensitization.Trends Pharmacol. Sci. 20: 279-86.
Congreve, H., Langmead, C. and Marshall, F. H. (2011).The Use of GPCR Structures in Drug Design. Adv.Pharmacol. 62: 1-36.
Dixon, R., Strader, C. and Sigal, I. (1989). Structural basisof beta-adrenergic receptor function. FASEB J.
3:1825-32.Flower, D. R. (1999). Modelling G-protein-coupled
receptors for drug design. Biochim. Biophys.
GPCRs
Journal of Veterinary Pharmacology and Toxicology/December 2012/Vol.11/Issue 1-2/1-7 5

8/13/2019 JVPT-2012_Vol11
http://slidepdf.com/reader/full/jvpt-2012vol11 10/108
Acta. 1422: 207-234.Fredriksson, R., Lagerstrom, M. C., Lundin, L. G. and
Schioth, H. B. (2003). The G-protein-coupledreceptors in the human genome form five mainfamilies. Phylogenetic analysis, paralogongroups, and fingerprints. Mol. Pharmacol. 63:
1256-1272.Fu, Y. Huang, X. Piao., L., Lopatin, A.N. and Neubig, R.R.(2007). Endogenous RGS proteins and Gαsubtypes differntially control muscarinic andadenosine-mediated chronotropic effects.Circulation Res . 98: 659-666.
Fu, Y. Huang, X. Zhong, H., Mortenson, R.M., D' Alecy,L.G. and Neubig, R.R . (2006). Endogenous RGSproteins modulate SA and Avnodal functions inisolated heart: implications for sick sinussyndorme and AV block. American J. Physiol.Heart Circulatory Physiol. 292: 42532-39.
Fuchs, H., Van Raamsdonk, C., Fitch, K., de Angelis, M.
and Barsh G. (2004). Effects of G-proteinmutations on skin color Nature Genetics 36: 961- 968.
Gold, S.J., Ni, Y.G., Dohlman, H.G. and Nestler, E.J. (1997).Regulators of G-protein signaling (RGS), proteins:Region specific expression of nine subtypes inrats brain. The J. of Neurosc., 17: 8024-37.
Glusman, G., Yanai, I., Rubin, I. and Lancet, D. ( 2001 ).The complete human olfactory subgenome.Genome Res. 11: 685-702.
Goldenstein, B. L., Nelson, B. W., Xu, K., Luger, E. J.,Pribula, J. A., Wald, J. M., et al. (2009).Regulatorof G protein signaling protein suppression of
Galphao protein-mediated alpha2A adrenergicreceptor inhibition of mouse hippocampal CA3epileptiform activity. Mol. Pharmacol . 75: 1222–1230.
Gurley, S. B., Griffiths, R. C., Mendelsohn, M. E., Karas,R. H., & Coffman, T. M. (2010).Renal actions ofRGS2 control blood pressure. J of Americ. Soci.
of Nephrol. 21: 1847–1851.Hermans, E. (2003). Biochemical and pharmacological
control of the multiplicity of coupling at G-protein-coupled receptors. Pharmacol. Ther. 99: 25-44.
Heximer, S. P., Knutsen, R. H., Sun, X., Kaltenbronn, K.M., Rhee, M. H., Peng, N., et al.(2003).Hypertension and prolonged vasoconstrictorsignaling in RGS2-deficient mice. The J of Clinic.Investig. 111: 445–452.
Hollinger, S. and Hepler, J. R. (2002). Cellular regulationof RGS proteins: Modulators and integrators of Gprotein signaling. Pharmacol. Rev. 54: 527–559.
Kobilka, Brian K. and Lefkowitz, Robert J. (2012). Studiesof G-protein–coupled receptors the RoyalSwedish Academy of Sciences. Box 50005 (Lilla
Frescativδgen 4 a), se-104 05 Stockholm, SwedenTEL +46 8 673 95 00, [email protected] ? HTTP:// KVA.SE pp 1-15
Kostenis, E. and Milligan, G. (2006). Heterotrimeric G-proteins: a short history. Br J Pharmacol. 147:46-55.
Kristiansen, K., Dahl, S. and Edvardsen O. (1996 ). Adatabase of mutants and effects of site-directedmutagenesis experiments on G protein-coupledreceptors. Proteins. 26: 81-94.
Marinissen, J. and Gutkind, S. (2001). G-protein-coupledreceptors and signaling networks: emergingparadigms. Trends Pharmacol. Sci. 22, 368-375.
Milligan, G. (2003). Constitutive activity and inverseagonists of G protein-coupled receptors: A currentperspective.Mol. Pharmacol . 64: 1271-1276.
Milligan, G.(2006). G protein-coupled receptor hetero-dimerization:contribution to pharmacology andfunction.Br. J. Pharmacol . 158: 5–14.
Neves, S. R., Ram, P. T. and Iyengar, R. (2002). G proteinpathways. Science. 296: 1636-1639.
Offermanns, S., Kuner, R, Swiercz, J , Zywietz, A. andTappe, A. (2002). Characterization of theexpression of PDZ-RhoGEF, LARG andG(alpha)12/G(alpha)13 proteins in the murinenervous system. Eur. J. Neurosci . 16: 2333-41.
Oliveira, L., Paiva, A. and Vriend, G. (1999).A low resolutionmodel for the interaction of G proteins with Gprotein-coupled receptors. Protein Eng . 12:1087-1090.
Oliveira-Dos-Santos, A. J., Matsumoto, G., Snow, B. E.,Bai, D., Houston, F. P., Whishaw, I. Q., et al.
(2000). Regulation of T cell activation, anxiety,and male aggression by RGS2. Proceedings ofthe National Academy of Sciences, USA. 97:12272–12277.
Pin, J. (1999). Heterotrimeric G-proteins: a short history.Br. J. Pharmacol . 1: 535-45.
Rasmussen, S.G., DeVree, B.T., Zou, Y., Kruse, A.C.,Chung, K.Y., Kobilka, T.S., Thian, F.S., Chae,P.S., Pardon, E., Calinski, D., Mathiesen, J.M.,Shah, S.T., Lyons, J.A., Caffrey, M., Gellman,S.H., Steyaert, J., Skiniotis, G., Weis, W.I.,Sunahara, R.K., Kobilka, B.K. (2011). Crystalstructure of the human beta2 adrenergic receptor-Gs protein complex. Nature. 477: 549-555
Robas, N., O’Reilly, M., Katugampola, S. and Fidock,M. (2003). Maximizing serendipity: strategies foridentifying ligands for orphan G-protein-coupledreceptors. Curr. Opin. Pharmacol. 3: 121-126.
Shapiro, A., Kristiansen, K., Weiner, M., Kroeze, W., K.and Roth, B. (2002). Evidence for a model ofagonist-induced activation of 5-hydroxytryptamine2A serotonin receptors that involves the disruption
Singh et al.
6 Journal of Veterinary Pharmacology and Toxicology/December 2012/Vol.11/Issue 1-2/1-7

8/13/2019 JVPT-2012_Vol11
http://slidepdf.com/reader/full/jvpt-2012vol11 11/108
of a strong ionic interaction between helices 3and 6. J. Biol. Chem. 277:11441-11449.
Sigal I., Dixon, R. and Strader, C,. (1989). Structural basisof beta-adrenergic receptor function. FASEB J . 3:1825-32.
Sjogren, B. and Neubig, R. R. (2010). Thinking outside of
the “RGS box”: New approaches to therapeutictargeting of regulators of G protein signaling. Mol.Pharmacol. 78: 550–557.
Sjögren, B., Blazer, L.L., and Neubig, R.R.(2010).Regulators of G protein signaling proteinsas targets for drug discovery. Prog. in Mol. Biol.
and Translational Sci. 91: 81–119.Sodhi, A., Montaner, S. and Gutkind, J. (2004). Viral
hijacking of G-protein-coupled-receptor signallingnetworks. Nature Rev. Mol. Cell Biol . 5: 998-1012.
Strader, C., Sigal, I. and Dixon, R. (1989). Structural basisof beta-adrenergic receptor function. FASEB J .31: 825-32.
Sugimoto, Y., Negishi, M., Hayashi, Y., Namba, T., Honda,A., Watabe, A., Hirata, M., Narumiya, S. andIchikawa, A. (1993). Two isoforms of the EP3receptor with different carboxyl-terminal domains.Identical ligand binding properties and differentcoupling properties with Gi proteins. J Biol Chem .268: 2712-18.
Takeda, S., Kadowaki, S., Haga, T., Takaesu, H. andMitaku, S. (2002). Identification of G protein-coupled receptor genes from the human genomesequence. FEBS Lett . 520 : 97-101.
Tang, K. M., Wang, G. R., Lu, P., Karas, R. H., Aronovitz,M., Heximer, S. P., et al. (2003). Regulator of G-protein signaling-2 mediates vascular smoothmuscle relaxation and BP. Nature Med. 9: 1506–1512.
Tesmer, J. J. G. (2009). Structure and function of regulator
of G protein signaling homology domains. In R.A. Fisher (Ed.), Mol. Biol. of RGS Proteins (pp.75–113).
Van Raamsdonk, C., Fitch, K., Fuchs, H., de Angelis, M.and Barsh, G. (2004) Effects of G-protein mutationson skin color Nature Genetics. 36:961 - 968
Vassilatis, D. K., Hohmann, J. G., Zeng, H., Li, F.,Ranchalis, J. E., Mortrud, M. T., Brown, A.,Rodriguez, S. S., Weller, J. R., Wright, A. C.,Bergmann, J. E. and Gaitanaris, G. A. (2003).The G protein-coupled receptor repertoires ofhuman and mouse. Proc. Natl. Acad. Sci. USA.100: 4903-4908.
Venter, J. C., Adams, M. D., Myers, E. W., Li, P. W.,Mural, R. J., Sutton, G. G., Smith, H. O., Yandell,M., Evans, C. A., Holt, R. A. et al. (2001). Thesequence of the human genome. Science. 291:1304-1351.
Wong, S. K. F. (2003). G protein selectivity is regulatedby multiple intracellular regions of GPCRs.Neurosignals. 12: 1-12.
Zozulya, S., Echeverri, F. and Nguyen, T. (2001). Thehuman olfactory receptor repertoire. Genome. Biol.2: RESEARCH0018.1-0018.12.
Received on:16-08-2012
Accepted on:26-12-2012
GPCRs
Journal of Veterinary Pharmacology and Toxicology/December 2012/Vol.11/Issue 1-2/1-7 7

8/13/2019 JVPT-2012_Vol11
http://slidepdf.com/reader/full/jvpt-2012vol11 12/108
1Department of Pharmacology & Toxicology, 2Department of Veterinary Public Health, 3Department of Microbiology,
College of Veterinary Science, Assam Agricultural University, Khanapara, Guwahati- 781022, Assam4Department of Pharmacology, Guwahati Medical College, Bhangagarh, Guwahati- 781001, Assam
*Corresponding author: E-mail: [email protected] ; [email protected].
CNS DEPRESSANT AND ANTI-CONVULSANT ACTIVITY OFHYDROETHANOL EXTRACT OF DRYMARIA CORDATA WILLD
C. C. BARUA1*, J. D ROY1, B. BURAGOHAIN1, A. TALUKDAR1, A. G. BARUA2, P. BORAH3, MANGALA LAHKAR4
ABSTRACT
The present study evaluated the CNS depressant and anticonvulsant effects of hydroethanol extract of Drymaria cordata (DCHE) in various behavioral models viz. spontaneous motor activity using actophotometer, anticonvulsant activity(electroconvulsion and chemoconvulsion test) and muscle relaxant activity ( rotarod test). In spontaneous motor activitystudy, DCHE showed significant reduction in spontaneous motor activity in dose dependent manner and the maximumeffect was observed at 200 mg.kg-1 p o was better than the standard drug. Administration of DCHE could partially block tonicand clonic convulsions in dose dependent manner in maximal electroconvulsion and chemoshock convulsion tests in mice.But the extract was devoid of muscle relaxant activity. Phytochemical screening of the extract showed presence of steroids,terpenoids, tannin and diterpenes which might be responsible for the neuropharmacological activity of DCHE.
Key words: Anti-convulsant effects, CNS depressant, Drymaria cordata , hydroethanol.
Research Article
INTRODUCTIONNeuropsychiatric and neurological disorders viz.
depression, schizophrenia, epilepsy, parkinsonism etc areimportant clinical conditions that require serious attention.Drugs currently used in treatment of these disorders areeither refractory, have massive side effects or possesunfavourable drug-drug/drug-food interactions (Danjuma et
al., 2009). Moreover, these synthetic drugsare very expensive to develop (Rakh and Chaudhari,2010). It is therefore essential that efforts should bemade to introduce new drug with fewer side effects andto develop cheaper drugs.
Medicinal herbs constitute the basis of traditionalmedicinal practice worldwide (Amos et al., 2001). TheWorld Health Organization (WHO) has shown that, over80% of the population in traditional medicinal systemdepends on these medicinal plants. Medicinal plants havealso been used in the development of new drugs andcontinue to play an invaluable role in the drug discoveryprocess (Cragg et al., 1997, Farnsworth, 1994).
Drymaria cordata Willd (Caryophyllaceae) locallyknown as “Laijabori ” is one of the traditionally used plants
of North East India used for its analgesic, wound healing,anti-inflammatory activity and is also used as antidote,appetizer, depurative, emollient, febrifuge, laxative andstimulant in both human and animals. The pounded leafis applied to snake bites (Saklani and Jain, 1994). Literaturesurvey revealed that D. cordata have been reported for itsantitussive (Mukherjee et al., 1997), antibacterial(Mukherjee et al., 1998) and antiinflammatory properties(Mukherjee et al., 1998). Our previous studies showedthat methanol extract of D. cordata possessed analgesic
(Barua et al., 2009) and antiinflammatory activities (Baruaet al., 2010) and, in addition, hydroethanol extractexhibited anxiolytic (Barua et al., 2009) and antinociceptiveactivities (Barua et al., 2011). As its effect on CNS has notbeen studied so far, the present study was undertaken forevaluation of hydroethanol extract in D. cordata in variousneuropharmacological behavioral models in laboratoryanimals.
MATERIALS AND METHODS
Experimental animals Swiss Albino mice (20-30 g) and Wistar rats (150-
200 g) were used for the study. The animals had freeaccess to food and water. They were fasted overnight beforethe experiment. They were housed in animal room, withalternating light-dark cycle of 12 hours each. The animalswere acclimatized to the laboratory conditions for at leastfive days prior to the experiments. All the experimentswere conducted between 0900 h – 1800 h. The study wasconducted after obtaining the approval of the InstitutionalAnimal Ethics Committee.Acute toxicity study
Acute toxicity study was carried out according tothe Organization of Economic Corporation Development(OECD) guidelines No. 425. DCHE was administeredorally in doses of 100, 200, 400, 800, 1000 and 2000 mg.kg-
1 to groups of mice (n=3) and percentage mortality wasrecorded for a period of 24 hours (Vogel, 2002).
Based on the above toxicity study, direct limittest was done. Initially, a particular dose on the basis ofthe above study was administered to single female ratand the rat was observed for 48 hours with close
8 Journal of Veterinary Pharmacology and Toxicology/December 2012/Vol.11/Issue 1-2/8-12

8/13/2019 JVPT-2012_Vol11
http://slidepdf.com/reader/full/jvpt-2012vol11 13/108
surveillance up to initial 4 hours (same as in case of firstrat) after 48 hours (of the second administration), samedose was administered in 2 more female rats and theobservation was done same as for previous rats. The ratswere observed for 14 days. The weight of the animals wasrecorded on 7th and 14thday.
Preparation of plant extract The leaves of Drymaria cordata were collectedduring the month of July-Sept, 2010 from the medicinalgarden of the department and identified by Botanical Surveyof India, Shillong, Meghalaya. A voucher specimen (NoAAU/CVSC/PHT/ 07-08/ 03) has been deposited in theHerbarium of Botanical Survey of India, Shillong,Meghalaya. Fresh leaves of Drymaria cordata were cleanedand under shade dried in clean dust free environment,grinded and stored in air-tight container. They were (250g) soaked in 1000 ml of hydroethanol (50:50) for 72 hoursin separate beakers. It was stirred every 18 hours using asterile glass rod. The solvent was filtered every 3rd day
using muslin cloth and What man’s filter paper No 1. Thefiltrate obtained was concentrated in rotary evaporator(Equitron, Roteva) at 50° -60° C under reduced pressureleaving a dark brown residue. The Drymaria cordata hydroethanol extract (DCHE), thus obtained wastransferred to a Petri dish and kept over water bath (50° C-)until the solvent gets completely evaporated. It was storedat 4ÚC for future use. Recovery was 18.06% (w/w).Freshlyprepared DCHE was subjected to standard phytochemicalscreening tests for various constituents by standardmethods (Harborne, 1991).Spontaneous motor activity
The animals were administered with control, DCHE
at the doses 50, 100 and 200 mg.kg-1 p o and standarddrug – diazepam (1 mg.kg-1 p o). After 30 minutes of pre-treatment, the mice were placed individually in the activitycage for 10 minutes and activity score of each animal wasrecorded. The locomotor activity was measured using anactophotometer (Rolex), which operates on photoelectriccells and are connected in circuit with a counter (Finney,1952). Percent reduction/ increase in motor activity in testgroups was calculated and compared with the control andthe standard group.Anti- convulsant activityElectro-convulsion test
In this test, the animals were pre-treated withcontrol, DCHE at the doses 50, 100 and 200 mg.kg-1 p oand standard drug – diazepam (1 mg.kg -1 po). After 30minutes, two electrodes were placed on both the earsand 150 mA current was applied for 0.2 sec and differentphase of convulsions were noted (Swinyard et al., 1952).Reduction/ increase in time or abolition of tonic extensorphase in test groups was recorded and compared withthe control and the standard group using electro-convulsiometer (Rolex).
Chemo-convulsion test In this test, the animals were fed with control,
DCHE at the doses 50, 100 and 200 mg.kg -1 p o andstandard drug – diazepam (1 mg.kg-1 po). After 30 min ofpre-treatment, pentylenetetrazole (80 mg.kg-1 ip) wasinjected and onset and severity of convulsion in test groups
was recorded and compared with the control and thestandard group (Swinyard et al., 1952).Rota-rod test
The animals were placed one by one on therotating rod and the fall-off time was recorded when themouse fell from the rotating rod. The animals wereadministered with control, DCHE at the doses 50, 100and 200 mg.kg-1 p o. and standard drug – diazepam (1mg.kg-1 p o). After 30 minutes of pre-treatment with thetest compound or standard drug, the mice were againplaced over the rotating rod and fall-off time was recorded.Percent reduction/ increase in motor activity in test groupswas calculated and compared with the control and the
standard group (Kinnard and Carr, 1957).
RESULTSOral administration of DCHE up to 2 g/kg did not
produce any toxic effects in the normal behavior of themice. No mortality was observed and the extract was foundto be safe at the given dose. The phytochemical screeningof DCHE showed the presence of tannins by ferric chlorideand gelatin test; diterpenes and triterpenes by Salkowski’sand Liberman Buchardt’s test and steroids by Salkowski’sand Liberman Buchardt’s test.
The locomotor activity is an index of alertnessand a decrease indicates sedative effect. Administration
of DCHE caused significant reduction (P<0.01) inlocomotor activity from 13.30 to 41.02 % at the dose 50 to200 mg.kg-1 po. The effect of DCHE at the dose 200 mg.kg-
1 po was better than the standard drug –diazepam whichshowed a percent reduction of 34.36% (Table 1).
DCHE exhibited a significant reduction (P<0.01)in the duration of tonic phase from 22.13 to 40.96 % at thedoses 50 to 200 mg.kg-1 p o. The standard drug phenytoinon the other hand, showed 96.87% protection (Table 2).DCHE treated group shows significant percent inhibition(P<0.01) in seizures from 38.04 to 95.25% at the doses50 to 200 mg.kg-1 po in a dose dependent manner. In thechemo-convulsion also, the standard drug diazepamshowed 100% protection. DCHE was found to be devoidof muscle relaxant property as none of the animals fell offthe rotarod whereas animals treated with diazepam fell offwithin 3-5 seconds (Table 3).
DISCUSSIONThe present study was undertaken to study the
effect of hydroethanol extract of Drymaria cordata
Journal of Veterinary Pharmacology and Toxicology/December 2012/Vol.11/Issue 1-2/8-12 9
Activity of Drymaria cordata

8/13/2019 JVPT-2012_Vol11
http://slidepdf.com/reader/full/jvpt-2012vol11 14/108
Barua et al.
on central nervous system. DCHE showed CNSdepressant property as there was reduction inspontaneous motor activity. It showed anticonvulsantactivity by exhibiting significant protection against electricaland chemical induced seizures but was devoid of musclerelaxant activity. The locomotor activity is an index of
alertness and a decrease indicates sedative effect.Decrease in locomotion reveals depressant effect of CNSdrugs (Goloubkova et al., 1998). The increase in motoractivity gives an indication of the level of excitability of theCNS and decrease may be related to sedation resultingfrom depression of CNS (Leewanich et al., 1996). DCHEshowed significant reduction in spontaneous motor activitywhich might be closely related to sedation resulting fromCNS depressant activity.
The maximal electro convulsion test is consideredto be a predictor of likely therapeutic efficacy againstgeneralized tonic-clonic seizures (Vijayalakshmi et al.,2011). The MES induced convulsion in animals represent
grandmal type of epilepsy. In electro-convulsion test, DCHEwas able to reduce the duration of tonic phase. Thereduction in time to recover from electrically inducedconvulsions by DCHE indicates anticonvulsant effect ofthe plant extract. This activity might be due to the inhibition
of excitatory mechanisms in the CNS (Radhakrishnan et al., 2001) Maximal electro shock (MES) causes significantincrease in the level of norepinephrine, dopamine andacetylcholine activity in the brain (Shafiuddin et al., 2009).It has been also reported that there may be an increase inthe turnover of norepinephrine by MES induced seizures.
An excitatory effect on the cerebellum, to activate inhibitorypathways that extend to the cerebral cortex, has beensuggested to contribute to the anticonvulsant effects ofphenytoin ( Syed et al., 2010) The anticonvulsant effect ofDCHE might be similar to the phenytoin. Hence it can besaid that DCHE might follow the similar mechanism ofanticonvulsant activity as that of phenytoin and might beeffective in grandmal type of epilepsy.
Pentylenetetrazole (PTZ) induced clonicconvulsion test is a valuable model for studying the effectof putative anticonvulsant drugs on the propagation ofseizure activity (Goodman et al., 1953). The PTZ inducedclonic convulsion resemble petit mal type of convulsions
in man. It has been demonstrated that a neuronal pathwaysub-serving clonic PTZ convulsion is located in the forebrainwhile the brainstem is involved in the network of tonic PTZconvulsion (Browning et al., 1981; Browning and Nelson,1986). Since DCHE specifically suppresses clonic PTZ
TABLE 1:
Effect of DCHE on spontaneous motor activity.
Treatments Dose(mg/kg p.o) Before treatment Aftertreatment % reduction
Control - 154.66±0.49 147.50±0.56* 4.62DCHE 50 142.16±1.49* 123.16±1.30 13.30
100 138.50±0.67* 95.00±1.50 31.30200 148.16±1.49* 87.33±0.49 41.02
Diazepam 1 185.66±1.25 121.83±0.87 34.36
Values are given as Mean ± S.E.M.; n=6; *P< 0.01 as compared to control.
TABLE 2:
Effect of DCHE on maximal electro convulsion.
Treatments Dose(mg/kg p.o). Duration of tonic phase (seconds) % inhibition
Control - 27.88±1.29 0.00DCHE 50 21.71±0.26* 22.13
100 18.43±0.04* 33.89200 16.46±0.10* 40.96
Phenytoin (i.p.) 25 0.87±0.278 96.87
Values are given as Mean ± S.E.M.; n=6; *P< 0.01 as compared to control.
TABLE 3:
Effect of DCHE on chemoshock convulsion test.
Treatments Dose (mg/kg p.o). Reaction time (seconds) % inhibition
Control - 17.48± 0.47 0.00DCHE 50 10.83± 0.30* 38.04
100 5.66± 0.49 67.62200 0.83± 0.04 95.25
Diazepam 1 0.00±0.00 100.00
Values are given as Mean ± S.E.M.; n=6; *P< 0.01 as compared to control.
10 Journal of Veterinary Pharmacology and Toxicology/December 2012/Vol.11/Issue 1-2/8-12

8/13/2019 JVPT-2012_Vol11
http://slidepdf.com/reader/full/jvpt-2012vol11 15/108
convulsion, thus it can be suggested that DCHE containsactive compound(s) that inhibit the propagation ofconvulsive seizure activity in the forebrain implicated bythe inhibition of clonic PTZ convulsion. Gammaaminobutyric acid (GABA) is a major inhibitoryneurotransmitter has shown to attenuate the convulsion.
PTZ might be exerting its convulsive effect by inhibitingthe activity of Gamma aminobutyric acid at the GABAA
receptors, the major inhibitory neurotransmitter which isimplicated in epilepsy (Vijayalakshmi et al., 2011).Diazepam, a benzodiazepine is reported to antagonizePTZ induced seizure by enhancing GABAneurotransmission (Thomas et al., 1994). In our study,DCHE could prevent PTZ induced seizure was significantlyhigher at the dose 100 (67.62 %) and 200 mg/kg p.o.(95.25 %) than electro shock induced convulsion Hence,diazepam was employed as a standard drug in PTZ model.It has been indicated that PTZ induced seizures can beprevented by drugs that reduce T-type Ca2+currents such
as ethosuximide and also by drugs that enhance GABAA
receptor mediated inhibitory neurotransmission such asbenzodiazepines (De Sarro et al., 2003). Hence, it mightbe possible that DCHE might prevent PTZ inducedseizures by decreasing T-type Ca2+ currents and/ or byenhancing GABA
Areceptor mediated
inhibitory
neurotransmission and might be effective in petit mal typeof convulsions.
The study clearly demonstrated that the DCHEis devoid of muscle relaxant activity as indicated bynegative results obtained in the rotarod test.
Phytochemical analysis of the extract showed thepresence of steroids, terpenoids, tannin and
diterpenes..Various phytoconstituents such as terpenoidsparticularly triterpenoids are reported for anticonvulsantactivity (Medina et al., 1990, Avallone et al., 2000). Similaranticonvulsant activity was observed in the rhizome of theSmilax china Linn. in mice. The neuropharmacologicaleffects of DCHE might be attributed to these compoundspresent therein. These findings revealed CNS depressantand anticonvulsion activities of DCHE in addition to itsanxiolytic (Barua et al., 2009) and analgesic activity (Baruaet al., 2011) which might be due to various mechanismssuch as decreased serotonergic and dopaminergictransmission and increased cholinergic transmission andvice versa. From the present findings, it can be concludedthat the hydroethanol extract of DCHE possessed CNSdepressant and anticonvulsant activity.
ACKNOWLEDGEMENT
The authors are grateful to National MedicinalPlant Board, Govt. of India, New Delhi for providing financialassistance to carry out this work. Physical facility providedby the Director of Research (Vety), C.V.Sc is also gratefullyacknowledged.
REFERENCESAmos, S., Kolawole, E., Akah, P., Wambebe. C. and
Gamaniel, K. (2001). Behavourial effects of theaqueous extract of Guiera senegalenesis in miceand rats. Phytomed . 8: 356-361.
Avallone, R., Zanoli, P. and Puia, G., (2000)
Pharmacological profile of apigenin, a flavonoidisolated from Matricaria chamomilla. Biochem.
Pharmacol . 1: 1387-1394Barua, C.C., Barua, A.G, Roy, J.D., Buragohain, B., and
Borah P. (2010). Anti-inflammatory properties onDrymaria cordata Willd. Indian J. Ani. Sci . 80:1268-1270.
Barua, C.C., Barua, A.G., Roy, J.D., Buragohain, B., andBorah, P. (2011). Analgesic and anti- nociceptiveactivity of hydroethanolic extract of Drymaria cordata Willd. Indian J. Pharm . 43: 121-125
Barua, C.C., Pal, S.K., Barua, A.G., Roy, J.D., Buragohain,B., Bora. R.S. and Lahon, L.C. (2009). Analgesic
activity of methanolic extract of Drymaria cordata Willd Cayophyllaceae. Phamacologyonline . 2:470-476.
Barua, C.C., Roy, J.D., Buragohain, B., Barua, A.G.,Borah, P. and Lahkar, M. (2009). Anxiolytic activityof hydroethanolic extract of Drymaria cordata Willd. Indian J. Exp Biol .47: 969-97.
Browning, R.A. and Nelson, O.K. (1986). Modification ofelectroshock and pentylenetetrazol seizurepatterns in rats after precouicular transection.Exp.
Neuro 93: 546-556.Browning, R.A., Simonton, R.L. and Turner, F.J. (1981).
Antagonism of experimentally-induced tonic
seizures following a lesion of the midbraintegmentum. Epilepsia . 22: 595-601.
Cragg, G.M., Newman, D.J. and Snader, K.M. (1997).Natural products in drug discovery anddevelopment. J. Nat. Pro . 60: 52-60.
Danjuma, N. M., Abdu-Aguye, I., Anuka, J. A., Hussaini,I., Zezi, A, U., Yaro, A. H., Maiha, B. B. andDabo, I. (2009). Central nervous systemdepressant effect of the hydroalcoholic extractsof leaves, stem and root barks of Randia nilotica Stapf. (Rubiaceae). Eur. J. Sci. Res. 25: 353-361.
De Sarro, A., Cechetto, V., Fravolini, V., Naccari, F.Tabarrini, O., De Sarro, G. (2003). Effects of novela- desfluroquinolines and classic quinolines onpentylenetetrazole induced seizures in mice.Antimicrob Agents Chemother . 43: 1729-1736.
Farnsworth, N.R. (1994). Ethnopharmacology and drugdevelopment. In Prance, G.T. and Marsh. J.Ethnobotany and The Search for New Drugs , CibaFoundation Symposium 185, pp. 42-59 John Wileyand Sons, Chichester.
Activity of Drymaria cordata
Journal of Veterinary Pharmacology and Toxicology/December 2012/Vol.11/Issue 1-2/8-12 11

8/13/2019 JVPT-2012_Vol11
http://slidepdf.com/reader/full/jvpt-2012vol11 16/108
Finney, D.J. (1952). Probit analysis. Cambridge UniversityPress, Cambridge.
Goloubkova, T.D., Heckler, E., Rates, S.M.K., Henriques,J.A.P. and Henriques, A.T., (1998). Inhibition ofcytochorme P
450 dependent monooxygenases by
and alkaloid fraction from Helietta apiculata
markedly potentiate the hypnotic action ofpentobarbital. J. Ethnopharmacol. 60: 141-148.Goodman, L.S., Grcwal, M.S., Brown, W.C. and Swinyard,
E.A (1953) Comparison of maximal seizuresevoked by penetylenetetrazol (metrazol) andelectroshock in mice, and their modification byanticonvulsants. J. Pharmacol. Exptl. Therap. 108:168-176.
Harborne, J.B. (1991). Phytochemical Screening –Guideto modern techniques of plant analysis. pp. 653.Chapman and Hall, NewYork.
Kinnard, W.J. and Carr, C. J. (1957). A preliminaryprocedure for the evaluation of CNS depressant.
J. Pharmacol. Exptl. Therap. 121: 354.Leewanich, P., Tohda, M., Matsumoto, K., Subhadhirsakul, S., Takayama, H.,Watanbe, H. (1996).Behavioural studies on alkaloids extracted fromleaves of Hunteria zeylanica . Biol. Pharmaceut.Bull. 19: 394–399.
Medina, J.H., Paladini, A.C., Wolfman, C., Levi de Stein,M., Calvo, D. and Diaz, L.E. (1990). Chyrsin (5,7-di-flavone, a naturally occuring ligand of thebenzodiapeines receptors with anticonvulsantproperties. Biochem Pharmacol . 40: 2227-2231.
Mukherjee, P.K., Bhattacharya, S., Saha, K., Giri, S.N.,Pal, M. and Saha, B. P. (1997). Studies on anti-
tussive activity of Drymaria cordata Willd(Caryophylaceae). J. Ethnopharmacol. 56: 74-77.
Mukherjee, P.K., Mukherjee, K., Bhattacharya, S.,Saha,B.P. and Pal, M. ( 1998). Studies on theanti- inflammatory effects of Drymaria cordata Willd. Nat. Prod. Sci. 4:.91-94.
Mukherjee, P.K., Saha, K., Bhattacharya, S., Giri, S.N.,Pal, M., Saha, B.P.(1998) Studies on anti bacterialactivity of Drymaria cordata Willd(Caryophylaceae).Phytother. Res . 11: 249-250.
Radhakrishnan R., Zakaria M.N.M., Islam M.W., ChemH.B., Kamil M., chan K., Al-Attas A., (2001).
Neuropharmacological actions of Portulaca oleraceae L.V. Sativa (Hawk). J. Ethnopharmacol.76: 171-176.
Rakh, M. S. and Chaudhuri, S. R. (2010). Evaluation ofCNS depressant activity of Momordica dioica Willdfruit pulp. Int. J. Pharm. Pharmaceu. Sci. 2: 124-126.
Saklani, A. and Jain, S.K. (1994). Cross cultural ethnobotany of North East India. pp. 97. Deeppublishers, New Delhi.
Shafiuddin, M.D., Liyakat Ahmed, M.D., Taranalli, A.D andKhaja Pasha (2009). Influence of cyclohexanoylthiosemicarbazide and some anticonvulsant drugs
on neurotransmitter levels in rat-brain. Int.J.Chem. Sci ., 7: 264-272.
Swinyard, E.A, Brown, W.C. and Goodman, I.S. (1952).Comparative Assays of antiepileptic drugs in miceand rat. J. Pharmacol. Exptl. Therap. 319: 166.
Syed, K. M., Liyakha,T., Ahmed, M.D. and Paramjyothi,S. (2010). Neuropharmacological Effects ofEthanolic Extract of Portulaca quadrifida Linn. InMice. Int. J. Pharm. Tech. Res. 2: 1386-1390,
Thomas, C. P. and Kevin, D. A. (1994). MedicalNeuroscience, USA Rochester: Mayo Foundation;p.307-312.
Vijayalakshmi, A., Ravichandran, V., Anbu, J., Veraj, M.
and Jayakumari, S. (2011). Anticonvulsant andneurotoxicity profile of the rhizome of Smilax china Linn. in mice 43: 27-30.
Vogel, H.G. (2002). Drug discovery and evaluation:Pharmacological Assay. Berlin Heidelberg, NewYork, 385.
Received on: 21-1-2012 Accepted on: 23-4-2012
12 Journal of Veterinary Pharmacology and Toxicology/December 2012/Vol.11/Issue 1-2/8-12
Barua et al.

8/13/2019 JVPT-2012_Vol11
http://slidepdf.com/reader/full/jvpt-2012vol11 17/108
Department of Veterinary Physiology and Biochemistry,†Department of Veterinary Pharmacology and Toxicology, College of Veterinary and Animal Sciences;
G. B. Pant University of Agriculture & Technology, Pantnagar, PIN: 263145, INDIA.*Corresponding author; E-mail: [email protected].
HOMOLOGY MODELING OF CANINE PROSTAGLANDIN G/H SYNTHASE-2
BHASKAR GANGULY*, SUDHIR KUMAR, TANUJ AMBWANI AND S.P. SINGH†
ABSTRACT
Prostaglandin G/H synthase-2 is an oxidoreductase involved in the synthesis of several inflammatory mediators. Itis an important target for many anti-inflammatory agents. Our study describes an in silico derived 3D model for the canineprostaglandin G/H synthase-2. Structure-activity features of the enzyme were characterized, and active site was identified.Also, its interactions with inhibitor molecules and involvement in other biochemical pathways were elucidated. The studyshall facilitate the designing of novel anti-inflammatory agents for canids.
Key words: COX-2, Diclofenac, Homology modeling, inhibition, Prostaglandin G/H synthase-2; PTGS-2.
INTRODUCTIONProstaglandin G/H synthase-2 (PTGS-2) is a
member of the oxidoreductase family (EC 1.14.99.1). Alsoknown as cyclooxygenase-2 (COX-2), prostaglandin-endoperoxide synthase-2 (PES-2), Prostaglandin H2Synthase 2 (PGHS-2/PHS II), glucocorticoid-regulatedinflammatory cyclooxygenase (GRIPGHS), TIS10 proteinor macrophage activation-associated marker protein P71/ 73, it catalyzes in a two-step reaction the cyclization ofarachidonate to prostaglandin H2, the parent substancefor the prostaglandins, prostacyclins, and thromboxanes,using up O
2 during the process (Koolman and Roehm,
2005) making it an important target for various mediators.
Futuristic drug design and development rely heavily onthe availability of molecular models of the enzyme. Ourstudy describes an in silico derived 3D model for the caninePTGS-2; to the best of the knowledge of the authors, it isthe first ever molecular model for this enzyme obtainedfrom a canine source. In addition, studies on the structure-activity features, including active site identification andinteractions with inhibitors, were also performed.
MATERIALS AND METHODS
Sequence retrieval and 3D modeling of PTGS-2 The amino acid sequence of the complete canine
PTGS-2 enzyme was retrieved from GenBank databaseat NCBI (Accession ADO27661.1; Benson et al., 2007).
The amino acid sequence of the complete caninePTGS-2 enzyme, retrieved from GenBank, was used as aquery in PSI-BLAST (Altschul et al., 1997) to find a suitabletemplate for homology modeling. Default parameters wereused in PSI-BLAST and the search was performed againstthe Protein Data Bank (PDB) database. The template,hence identified, was used for homology modeling usingthe modeling package MODELLER9v10 (Sali et al., 1995).
Research Article
Model optimization, quality assessment and visualization
Hydrogen addition, and clash reduction wasperformed in Swiss-Pdb Viewer 4.0.4 (Guex and Peitsch,1997). Energy minimization was also performed usingGROMOS96 (van Gunsteren et al., 1996) force field in Swiss-Pdb Viewer. The errors in the model were, further, fixed usingthe tools at What IF Web Interface (Vriend, 1990). Forstructural evaluation and analysis of stereo-chemical quality,the 3D model was submitted to PDBsum (Laskowski et al.,1997) and RAMPAGE (Lovell et al., 2002). Overall quality ofthe structure was determined by ERRAT (Colovos and Yeates,1993). Protein dimerization, visualization of 3D structures,
and superposition, alignment and RMSD determination ofquery and template structure were performed in YASARAview (Krieger et al., 2002). For structural alignment of modeland template, MUSTANG implementation (Konagurthuet al.,2006) of YASARA view was used.Protein structure-activity and accession number
The final 3D structure of canine PTGS-2 wassubmitted to the Protein Model Database (PMDB;Castrignanò et al., 2006). The structure-functioncharacteristics of the enzyme were inferred from the NCBI-CDD output. NCBI-CDD is a protein annotation resourceconsisting of a collection of well-annotated multiplesequence alignment models for ancient domains and full-length proteins (Marchler-Bauer et al., 2011). To determinethe involvement of the enzyme in the bio-chemicalpathways, KEGG automatic annotation server (KAAS) wasused (Moriya et al., 2007).
RESULTS AND DISCUSSIONThe present study focused on the structural and
functional analysis of canine PTGS-2. The completecanine PTGS-2 enzyme was found to be a homo-dimeric
Journal of Veterinary Pharmacology and Toxicology/December 2012/Vol.11/Issue 1-2/13-15 13

8/13/2019 JVPT-2012_Vol11
http://slidepdf.com/reader/full/jvpt-2012vol11 18/108
Ganguly et al.
protein made up of two identical chains A and B. Thesequence corresponding to one monomeric chain, madeup of 604 amino acids, was identified and used forcomparative modeling. The 3D model of a protein providesus invaluable insights into the structural basis of itsfunction. Comparative or homology modeling is the most
common structure prediction method. Numerous onlineservers and tools are available for homology modeling ofproteins. Upon a PSI-BLAST search against the ProteinData Bank (PDB), 1PXX_A was identified as the besttemplate (100% sequence coverage and 90% sequenceidentity) available for the homology modeling of the caninePTGS-2. 1PXX_A is the X-ray diffraction model of chain Aof murine COX-2 at a resolution of 2.9 Å. The querysequence and template structure were then provided asinputs in MODELLER9v10 to generate the 3D model ofcanine PTGS-2. The homo-dimeric structure was obtainedby dimerization of the output from MODELLER in YASARAview (Fig. 1). model, were reasonably accurate.
The RMSD value indicates the degree to whichtwo 3D structures are similar; the lower the value, themore similar the structures. Both template and querystructures were superimposed for the calculation of RMSD.The RMSD value obtained from superimposition of ourmodel and 1PXX in YASARA View was found to be 0.067Å over a total of 1102 aligned residues. The overall qualityfactor, Ramachandran plot characteristics and RMSDvalues confirm the quality of the homology model of theCanine Prostaglandin G/H synthase-2. Structuralalignment of query and template also allowed the dockingof diclofenac, pre-docked to the template, with the querystructure (Fig. 3).
The final protein structure was deposited in PMDBand is available under the Accession ID: PM0078233.
The structure of a protein determines its function.The complete sequence of monomeric canine PTGS-2 is604 amino acids long and consists of three functionaldomains and one dimerization interface. The first domainis the calcium binding domain spanning from residue 20to 34. Both the terminal residues of this domain, i.e., 20
Fig. 1:3D model of Canine Prostaglandin G/H synthase-2; A helix
rich structure is evident (Visualized in YASARA View).
The model generated by MODELLER wassubjected to energy minimization and assessed forgeometric and energy aspects using Swiss-Pdb Viewerand refined using What If Web Interface. The correctedmodel showed a quality factor of 93.601 % in ERRAT. Thepositioning of secondary structural elements was generatedfrom PDBsum. 4 sheets, 4 α hairpins, 8 strands, 32helices, 56 helix-helix interactions, 38 α turns, 8 β turnsand 5 disulphide linkages were predicted in the 3D structureof each chain.
Several structure assessment methods includingRamachandran plots and RMSD were used to check thereliability of the predicted 3D model. Ramachandran plotswere obtained from RAMPAGE server for qualityassessment. No residues were present in the disallowedregion whereas 52 (4.7 %) residues were present in thegenerously allowed regions. All other (95.3 %) residueswere in the most favored regions (Fig. 2). This indicatedthat the backbone dihedral angles, phi and psi, in the 3D
Fig. 2:
Ramachandran plot of Canine Prostaglandin G/H synthase-2; no outlier residue is present (Generated from RAMPAGE).
Fig. 3:Docking of Diclofenac in the active site of Canine
Prostaglandin G/H synthase-2.
14 Journal of Veterinary Pharmacology and Toxicology/December 2012/Vol.11/Issue 1-2/13-15

8/13/2019 JVPT-2012_Vol11
http://slidepdf.com/reader/full/jvpt-2012vol11 19/108
and 34 comprise the functional site of the domain. Thesecond domain in the canine PTGS-2 is the substratebinding site spanning from residue 103 to residue 520.The functional residues of this site were identified as 103,191, 331, 334, 335, 339-41, 367, 504, 508, 512, 513, 516,517 and 520. The third domain in the canine PTGS-2 is
the heme binding site spanning from residue 134 to residue436. The functional residues of this site were identified as134, 185, 189, 193, 196-98, 281, 368, 371-74, 377, 394,430, 432, 433 and 436. The dimerization interface wasformed of residues 111, 113-15, 122, 123-26, 128, 215,305-09, 312, 313, 316, 319, 320, 323, 353-60, 367, 371,373, 523, 524, 527-31, 533-35, 537 and 538.
Based on a KEGG search to identify theinvolvement of the enzyme in other biological processes,performed via KAAS, canine PTGS-2 was identified to alsoparticipate in biological pathways involving vascularendothelial growth factor (VEGF) signaling, NF-kappa Bsignaling, serotonergic synapse, retrograde
endocannabinoid signaling, and in the pathogenesis ofLeishmania and cancers. In the VEGF signaling pathwayPTGS-2 increases PGI2 production, promoting angiogenesis– this is of importance in the neo-vascularization ofneoplasms. At serotonergic synapses, it exertsneuroprotective role by inhibiting adenylate cyclase anddecreasing amyloid beta protein. In retrogradeendocannabinoid signaling, it favours PGG synthesis from2-arachydonoil glycerol (2AG), thereby reducing 2 AG levels.The family of endocannabinoids includes at least fivederivatives of arachidonic acid; the two best characterizedare arachydonoyl ethanolamide (anandamide, AEA) and 2-arachydonoil glycerol (2AG). They are released from
postsynaptic neurons upon postsynaptic depolarization and/ or receptor activation. The released endocannabinoids thenactivate the CB1 receptors (CB1R) at presynaptic terminalsand suppress the release of inhibitory transmitter GABA.Therefore, PTGS-2 indirectly promotes the release of GABA.In leishmaniasis, PTGS-2 increases PGE2 production underthe influence of the parasite glycoproteins.
In this study, comparative modeling approach hasbeen used to propose probably the first 3D structure forthe Canine Prostaglandin G/H synthase-2. With theassistance of a well-defined structure and annotations,we can predict protein functional and binding sites, whichcan help in understanding the mechanism of bio-molecularfunctioning.
REFERENCES
Altschul, S.F., Madden, T.L., Schaeffer, A.A., Zhang, J.,Zhang, Z., Miller, W. and Lipman, D.J. (1997).Gapped BLAST and PSI-BLAST: a new generationof protein database search programs. Nucleic
Acids Res. 25:3389-3402.Benson, D.A., Karsch-Mizrachi, I., Lipman, D.J., Ostell,
J. and Wheeler D.L. (2007). GenBank. Nucleic.
Acids Res. 35:21-25.Castrignanò, T., De Meo, P.D., Cozzetto, D., Talamo, I.G.
and Tramontano, A. (2006). The PMDB ProteinModel Database. Nucleic. Acids Res. 34(Database issue): D306-309.
Colovos, C. and Yeates, T.O. (1993). Verification of proteinstructures: patterns of nonbonded atomicinteractions. Protein. Sci. 2:1511-1519.
Guex, N. and Peitsch, M.C. (1997). SWISS-MODEL andthe Swiss-PdbViewer: An environment forcomparative protein modelling. Electrophoresis.18: 2714-2723.
Konagurthu, A.S., Whisstock, J.C., Stuckey, P.J. and Lesk,A.M. (2006). MUSTANG: A multiple structuralalignment algorithm. Proteins. 64: 559-574.
Koolman, J. and Roehm, K.H. (2005). Color Atlas ofBiochemistry. 2nd edn. Georg Thieme Verlag,Stuttgart.
Krieger, E., Koraimann, G. and Vriend, G. (2002). Increasingthe precision of comparative models with YASARANOVA - a self-parameterizing force field. Proteins
47: 393-402.Laskowski, R.A., Hutchinson, E.G., Michie, A.D., Wallace,
A.C., Jones, M.L. and Thornton, J.M. (1997).PDBsum: a Web-based database of summariesand analyses of all PDB structures. Trends
Biochem. Sci. 22: 488-490.Lovell, S.C., Davis, I.W., Arendall III, W.B., de Bakker,
P.I.W., Word, J.M., Prisant, M.G., Richardson J.S.and Richardson, D.C. (2002). Structure validationby C alpha geometry: phi, psi and C beta
deviation. Proteins: Structure, Function &Genetics . 50: 437-450.
Marchler-Bauer, A. et al. (2011). CDD: a Conserved DomainDatabase for the functional annotation of proteins.Nucleic Acids Res. 39(Database issue):D225-229.
Moriya, Y., Itoh, M., Okuda, S., Yoshizawa, A.C. andKanehisa, M. (2007). KAAS: an automaticgenome annotation and pathway reconstructionserver. Nucleic. Acids. Res. 35(Web Server issue):W182-185.
Sali, A., Potterton, L., Yuan, F., van Vlijmen, H. andKarplus, M. (1995). Evaluation of comparativeprotein modeling by MODELLER. Proteins. 23:
318-326.van Gunsteren W.F. et al. (1996). In Biomolecular
simulation: the GROMOS96 manual and userguide. Vdf Hochschulverlag ETHZ.
Vriend, G. (1990). WHAT IF: A molecular modeling anddrug design program. J. Mol. Graph. 8: 2-56.
Received on: 12-03-2012 Accepted on: 15-05-2012
Homology modeling of canine PTGS-2
Journal of Veterinary Pharmacology and Toxicology/December 2012/Vol.11/Issue 1-2/13-15 15

8/13/2019 JVPT-2012_Vol11
http://slidepdf.com/reader/full/jvpt-2012vol11 20/108
1Scientist, 3Head, Division of Pharmacology and Toxicology,Indian Veterinary Research Institute, Izatnagar-243122, Uttar Pradesh, India
2Dean, College of Veterinary Science & Animal Husbandry,Pandit Deen Dayal Upadhyaya Veterinary University & Go-Anusandhan Sansthan (DUVASU),
Mathura, Uttar Pradesh, India1Corresponding author E-mail: [email protected]
EFFECT OF DOCOSAHEXAENOIC ACID ON CONCENTRATION-RESPONSE RELATIONSHIP OF 5-HT AND REVERSAL OF 5-HT
CONTRACTION IN SHEEP CORONARY ARTERY
THAKUR UTTAM SINGH1, SUBHASHREE PARIDA1, SATISH KUMAR GARG2, SANTOSH KUMAR MISHRA3
ABSTRACT
Present study was done to investigate the effect of docosahexaenoic acid (DHA) on concentration-response rela-tionship of 5-HT, reversal of 5-HT contraction and basal tone in sheep coronary artery. Pretreatment of tissues with DHA (100µM) for 30 minutes caused significant (p<0.05) inhibition of contractions elicited with 5-HT (n=5). To assess the vasodilatorresponse of DHA on coronary artery, endothelium-denuded arterial rings were constricted with 5-HT. At the plateau of 5-HTcontraction, DHA was added in a cumulative manner at 0.5 log unit. DHA (0.1-100µM) produced concentration-dependent
relaxation. The Emax was 38.52±7.03% at 100 µM concentration of the DHA. DHA (10–7
-10–4
M) added cumulatively at anincrement of 0.5 log unit caused a concentration-dependent contraction of coronary arterial rings with an E max of 20.42±3.76(n=4).
Key words: Coronary artery, Docosahexaenoic acid, 5-HT, Sheep.
Research Article
INTRODUCTIONN-3 Polyunsaturated fatty acids (PUFAs) are
known to protect the cardiovascular system and improveblood pressure (Wang et al., 2011). 17S-HDHA, anendothelium-derived docosahexaenoic acid (DHA) productvia lipooxygenase, activates BK(Ca) channels in coronaryarterial smooth muscle cells, leading to coronaryvasodilation, which may represent an important mechanismmediating the beneficial actions of DHA in coronarycirculation (Li et al., 2011). Vasorelaxation effects of DHAon vascular smooth muscle cells are mainly due to itsactivation of BK(Ca) channels (Lai et al., 2009). DHA andeicosapentaenoic acid (EPA) are the major n-3 fatty acidsin fish oils. Dietary supplements with fish oils have beenconsidered as indirectly cardioprotective because of theirantithrombotic, antiatherosclerotic, and antihypertensiveproperties. Some studies show that DHA may be the activeagent in dietary fish oils responsible for lowering systemicblood pressure. Daily ingestion of fish oil was shown toreduce the blood pressure of patients with essential
hypertension (Knapp and FitzGerald, 1989). Diets enrichedin DHA, a major n-3 fatty acid in fish oil, have hypotensiveproperties (Ye et al., 2002). Omega-3 fatty acids areclassed as essential fatty acids and common omega-3fatty acids in the human body are DHA and EPA (Leesand Karel, 1998). However, there is no report on the effectof DHA on 5-HT-induced contraction, reversal of 5-HTcontraction and basal tone in sheep coronary artery.Therefore, the first objective of the present study was toevaluate the effect of DHA on 5-HT-induced contraction in
sheep coronary artery. The second and third question wasthat whether DHA would affect reversal of 5-HT contractionand basal tone in this vessel.
MATERIALS AND METHODSChemicals
Acetylcholine chloride and 5-Hydroxytryptaminehydrochloride (Sigma Chemicals, St Louis, MO) and DHA(Cayman Chemicals, Ann Arbor, MI, USA) were used inthis study. DHA was dissolved in absolute alcohol. All otherdrugs were dissolved in distilled water.Tissue Collection
Heart from freshly slaughtered sheep wascollected from local slaughterhouse in cold (4-6oC)oxygenated modified Krebs-Henseleit solution (MKHS),pH 7.4. Coronary artery was dissected from heart, clearedof connective tissue, and cut into rings of about 2-3 mmlength.Tension Experiments
Arterial rings of 2-3 mm were prepared from sheep
coronary artery. Rings were mounted between two “L”-shaped stainless steel hooks under a resting tension of1.5 g in a thermostatically controlled (37.0±0.5 °C) organbath of 10 ml capacity containing MKHS and continuouslyaerated with carbogen (95% O
2+5% CO
2). Experiments
were done in endothelium-denuded coronary arterial rings.Endothelium was removed by mechanical rubbing with acotton swab. Endothelium removal was confirmed bydemonstrating the absence of relaxation to ACh (10 µM).The arterial rings were equilibrated for 90 min with a
16 Journal of Veterinary Pharmacology and Toxicology/December 2012/Vol.11/Issue 1-2/16-18

8/13/2019 JVPT-2012_Vol11
http://slidepdf.com/reader/full/jvpt-2012vol11 21/108
repeated replacement of bath solution every 15-20 min. Ahigh sensitivity force displacement transducer (ModelMLT0202/D; Power Lab, Castle Hill, Australia) was usedto measure the change in tension, and the data wererecorded in a PC using chart version 4.1.2 software program(Power Lab).
Effect of DHA on the concentration-response relationship of 5-HT in sheep coronary artery To study the effects of DHA on the vasoconstrictor
responses of 5-HT, coronary artery was used. Afterequilibration for 90 min, the coronary arterial rings wereconstricted with 5-HT (1 µM), and when the contractionreached the plateau, ACh (10 µM) was added to examinethe endothelial integrity. Once the tissue viability wasconfirmed, the tissue was washed off drugs and allowedto relax for a period of 30 min. Then, a concentration-response curve (10–9-10–5M) to 5-HT agonist was elicited.The same tissue was used to plot a second concentration-response curve following pre-treatment with DHA for 30
min.Effect of DHA on reversal of 5-HT contraction in sheep
coronary artery To assess the vasodilator response of DHA on
coronary artery, endothelium-denuded arterial rings wereconstricted with 5-HT (5.0 µM; mean absolute tension0.29±0.08 g (n=5). At the plateau of 5-HT contraction, DHAwas added in a cumulative manner at 0.5 log unit.Direct effect of DHA on basal tone in sheep coronary
artery To find out the direct effect of DHA on basal tone
in the coronary artery, DHA (10–7-10–4M) were addedcumulatively at an increment of 0.5 log unit to induce a
concentration-dependent contraction of coronary arterialrings.
Statistical analysis Results are expressed as Means±S.E.M and
multiple comparisons were done using two-way ANOVAfollowed by Bonferroni post hoc test. P<0.05 wasconsidered statistically significant. Emax
was determined
using non linear regression analysis of Graphpad Prism.
pD2 is expressed as –log EC50 of the agonist.RESULTS
Cumulatively added 5-HT (10–9-10–5M) at 0.5 loginterval elicited concentration-dependent contractions insheep coronary artery. In control arterial rings, themaximum contraction achieved was 80.58±18.29% of80mM KCl-induced contraction and pD2 value was4.50±0.62. Pretreatment of tissues with DHA (100 µM)caused significant (p<0.05) inhibition of contractions
Journal of Veterinary Pharmacology and Toxicology/December 2012/Vol.11/Issue 1-2/16-18 17
Effect of DHA on sheep coronary artery
Fig. 1.Effect of DHA on the concentration-response relationship
of 5-HT in sheep coronary artery .
Fig. 2.Effect of DHA on reversal of 5-HT-induced contraction in
sheep coronary artery.
Fig. 3.Effect of DHA on basal tone in sheep coronary artery.

8/13/2019 JVPT-2012_Vol11
http://slidepdf.com/reader/full/jvpt-2012vol11 22/108
elicited with 5-HT (n=4-5). The Emax and pD2 values of 5-HT were 26.10±4.53% and 3.06±0.41 in presence of DHA,respectively (Fig. 1). Figure 2 shows that DHA (0.1-100µM)produced concentration-dependent relaxation. The Emax was38.52±7.03% at 100 µM concentration of the DHA. DHA(10–7-10–4M) added cumulatively at an increment of 0.5 log
unit caused a concentration-dependent contraction ofsheep coronary arterial rings with an Emax
of 20.42±3.76(n=4) (Fig. 3).
DISCUSSIONPresent study shows that DHA inhibited 5-HT-
induced concentration-dependent contraction in coronaryartery. DHA caused a significant relaxation in 5-HT-contracted coronary arterial rings and also caused amarginal increase in basal tone. The relaxant effects ofomega-3 fatty acids may contribute to hypotensive effectsby modulating vascular tone (Engler et al., 1990). To gainan understanding of the omega-3 fatty acids and their
vascular relaxant properties, the current investigation wasperformed to examine the vascular effects of this fattyacid in ovine coronary artery. Cumulative concentration-response curves was generated for DHA in vesselsprecontracted with 5-HT. A significant relaxant effect wasobserved for DHA in coronary artery (38%) at 100 µMconcentration. Our findings are strengthened by the reportof Engler (1992) who showed relaxant effect of this fattyacid in rat aorta in a concentration range of 1-255 µM. At31 µM concentration, the maximal relaxation observed inthis tissue was 20% for DHA. Increasing the concentrationto 255 µM, a corresponding increase in the magnitude ofrelaxation was evident with DHA (63%). DHA also
antagonized concentration-dependent contractions elicitedby 5-HT in coronary artery. The relaxant effect of DHA wasendothelium-independent. Similar observation has beenmade in aorta where removal of endothelium did not alterDHA-induced relaxations (Engler et al., 1987). EPA,however, caused endothelium-dependent relaxation ofporcine coronary artery (Shimokawa and Vanhoutte, 1989).Another possible mechanism of action of omega-3 fattyacids such as epoxydocosapentaenoates (EDPs)-inducedrelaxation in coronary microvessels is due to activation ofBKCa channels directly (Ye et al., 2002). Thus theobservation made in the present study demonstrating DHA-induced relaxation of coroonary artery may be relevant toits beneficial effect in hypertension.
REFERENCESEngler, M.B., Karanian, J.W. and Salem, N. Jr. (1987).
Doco-sahexaenoic acid (22:6w3) induces aconcentration-dependent relaxation of rat aorticrings. Eur. J. Pharmacol. 185: 223-226.
Engler, M.B., Karanian, J.W. and Salem, N. Jr. (1990).
Docosahexaenoic acid (22:6n3)-inducedrelaxation of the rat aorta. Eur. J. Pharmacol. 185:223-226.
Engler, M.B. (1992). Effects of omega-3, omega-6 andomega-9 fatty acids on vascular smooth muscletone. Eur. J. Pharmacol. 215: 325-328.
Knapp, H.R. and FitzGerald, G.A. (1989). Theantihypertensive effects of fish oil. A controlledstudy of polyunsaturated fatty acid supplementsin essential hypertension. N. Engl. J. Med. 320:1037–1043.
Lees, R.S. and Karel, M.D. (1998). Health effects ofomega-3 fatty acids in health and disease edt.
Lees, R.S. and Karel, M.D. Part I Printed in USA.Li, X., Hong, S., Li, P.L. and Zhang, Y. (2011).Docosahexanoic acid-induced coronary arterialdilation: actions of 17S-hydroxy docosahexanoicacid on K+ channel activity. J. Pharmacol. Exp.Therap. 336(3): 891-899.
Lai, L.H., Wang, R.X., Jiang, W.P., Yang, X.J., Song, J.P.,Li, X.R. and Tao, G. (2009). Effects ofdocosahexaenoic acid on large-conductance Ca2+-activated K+ channels and voltage-dependent K+
channels in rat coronary artery smooth musclecells. Acta Pharmacol. Sin. 30(3): 314-320.
Shimokawa, H. and Vanhoutte, P.M. (1989). Dietary omega
3 fatty acids and endothelium-dependentrelaxations in porcine coronary arteries. Am. J.Physiol. 256: H968-973.
Wang, R.X., Chai, Q., Lu, T. and Lee, H.C. (2011).Activation of vascular BK channels bydocosahexaenoic acid is dependent oncytochrome P450 epoxygenase activity.Cardiovasc. Res. 90(2): 344-352.
Ye, D., Zhang, D., Oltman, C., Dellsperger, K., Lee, H.C.and Rollins, M. (2002). Cytochrome P-450Epoxygenase Metabolites of DocosahexaenoatePotently Dilate Coronary Arterioles by ActivatingLarge-Conductance Calcium-Activated PotassiumChannels. J. Pharmacol. Exp. Therp . 303(2): 768-76.
Received on: 11-04-2012
Accepted on: 22-06-2012
Singh et al.
18 Journal of Veterinary Pharmacology and Toxicology/December 2012/Vol.11/Issue 1-2/16-18

8/13/2019 JVPT-2012_Vol11
http://slidepdf.com/reader/full/jvpt-2012vol11 23/108
1MVSc Scholar, 2Professor and Head, Department of Veterinary Gynecology and Obstetrics, 3Professor,4
Professor and Head, Veterinary Medicine, and5
PhD scholar, College of Veterinary and Animal Sciences,G.B. Pant University of Agriculture & Technology, Pantnagar - 263 1452Corresponding author: E-mail: [email protected]
PROGESTERONE PROFILE AND CONCEPTION RATE FOLLOWING INSULINTREATMENT DURING LUTEAL PHASE OF ESTROUS CYCLE IN BUFFALOES
Q. I. HUQ1, H.P. GUPTA2, SHIV PRASAD3, V.S. RAJORA4 AND ASAD HUSSAIN5
ABSTRACT
The present study was conducted to evaluate the response of insulin treatment (Human Mixtard®, @ 0.25 I.U/kgbody weight) during luteal phase of estrous cycle on serum progesterone and conception rate in buffalo (Bubalus bubalis ).Estrus was induced using 2 ml. (263 µg/ml) Cloprostenol Sodium (i/m) and the animals were bred naturally. The buffaloes(n=20) were grouped as control (n=10, PBS) and treatment group (n= 10). Insulin was given on day 12 of estrous cycle intreatment group. The conception rate was 50% in both groups . The serum progesterone concentration was significantly(p<0.05) higher 4.710±0.342, 3.249 ±0.541 and 3.755±0.576 ng/ml on days 14, 18 and 30 in treatment group vs 4.580±0.249,2.904±0.681 and 3.471±0.420 ng/ml, respectively, in control group. Comparison of data on progesterone profile betweenpregnant and non-pregnant (within group) animals of treatment and control groups showed higher levels of serum
progesterone in pregnant animals from day 14 to 30 in treatment group. Present study concluded that insulin administrationduring luteal phase of estrous cycle increased progesterone secretion without any effect on conception rate in buffaloes.
Key words: Bubalus bubalis , conception rate, insulin, progesterone
INTRODUCTION
Numerous causes of pregnancy loss in bovineinclude body condition score, disease, high milk yield,heat stress, oocyte quality, insemination protocol,synchronization method, concentration of progesteroneand the uterine environment (Santos et al., 2004).Lalthazualiet al. (2010) suggested that luteal deficienciesfollowing AI may be a major cause of embryonic mortalityin buffaloes. High proportion of embryonic and early fetallosses in dairy cattle are associated with low peripheralconcentrations of progesterone, which could result fromincreased catabolism, decreased production, or both(Lemley et al., 2008). Lemley et al. (2007, 2008)demonstrated that, in the cow, either providing agluconeogenic feed stuff or treatment with insulindecreased the abundance of mRNA for enzymesresponsible for hepatic progesterone catabolism. Thus,the present study was under taken to study the effect ofinsulin on serum progesterone profile and conception ratein buffalo.
MATERIALS AND METHODS
Normal cyclic buffaloes (n=20) were selectedon the basis of their previous health records and per-rectalexamination of their genital organs. The experimentalbuffaloes aged 4-7 years were divided into two groups(Treatment group, n=10 and control group, n=10).Theanimals having mature corpus luteum (CL) were given 2ml intramuscular injection of Cloprostenol sodium(Cyclix®, Intervet India Pvt. Ltd., India) to synchronize the
Research Article
estrus. The estrus was detected at every morning andevening by close observation for external signs, such asbellowing, mucus discharge from vulva, mounting, frequentmicturition, swollen and edematous vulva and later onconfirmed by per-rectal palpation. All the animals oftreatment and control groups detected in heat were bredby bull.
Insulin (Human Mixtard ® , TorrentPharmaceutiscals Ltd., India) was given @ 0.25 IU / kgbody weight by subcutaneous route to the animals of thetreatment group on day 12, and PBS was givensubcutaneously to the animals of the control group. HumanMixtard ® is a mixture of dissolved insulin (30 %) andisophane insulin (70 %). It contains both fast acting (Insulin)and long acting insulin (Isophane insulin). Blood sampleswere taken by jugular venipuncture as per the scheduleon day 0, 12, 14, 18 and 30 in all groups. About 4-5 mlblood without anticoagulant was collected in sterilizedglass tubes and kept at room temperature as a slant for6-8 hours for separation of blood serum. Blood serum was
separated, centrifuged at 3000 rpm for 15 minutes andwas transferred into sterilized serum vials. All sampleswere stored at -20°C till analysis. Progesterone wasestimated in blood serum by radioimmunoassay (RIA)using RIA kits (Immunotech, France). Pregnancy waschecked by per-rectal examination of the genital organsafter 60 days of service. The data obtained in the presentstudy was analyzed statistically and compared forsignificant difference using t-test (Snedecor and Cochran,1994).
Journal of Veterinary Pharmacology and Toxicology/December 2012/Vol.11/Issue 1-2/19-21 19

8/13/2019 JVPT-2012_Vol11
http://slidepdf.com/reader/full/jvpt-2012vol11 24/108
Huq et al.
RESULTS AND DISCUSSION
In the present study the serum progesteroneconcentration remained higher 4.710±0.342, 3.249 ±0.541and 3.755±0.576 ng/ml on days 14, 18 and 30 in treatmentgroup vs control group 4.580±0.249, 2.904±0.681 and3.471±0.420 ng/ml respectively, irrespective of pregnancystatus of animals (Table 1). However, the differences were
not significant.Comparison of data on progesterone profile
between pregnant and non-pregnant animals of treatmentgroup showed higher levels of serum progesterone inpregnant animals from day14 to 30 in treatment group(Table 2). But, difference was significant only on day 18(P< 0.05). The significant difference on day 18 might bedue to effect of luteolysis (Ahmad, 2001). The higher serum progesterone on different daysafter insulin administration in different treatment groupsmay be possibly due to effect of insulin on progesteronemetabolism, or progesterone release from corpus luteumor due to effect of insulin on steroidogenesis, however, in
this study slight increase in progesterone concentrationmay be because of giving single insulin injection. Lemley et al. (2009) found that, cows consuming ahigh starch diet had elevated insulin concentrations, lowerhepatic cytochrome P450 activity and a longer progesteronehalf-life compared to cows consuming a high fiber diet.Lemley et al. (2007, 2008) demonstrated that, in the cow,either providing a gluconeogenic feed stuff or treatmentwith insulin decreased the abundance of mRNA forenzymes responsible for hepatic progesterone catabolism.Lalthazuali et al. (2010) reported higher (P<0.05) plasmaprogesterone concentration in insulin-treated buffaloes onday 12, 15, and 21 post-AI. Suguna et al. (2009) observedsignificantly increased progesterone concentrationsfollowing insulin administration in insulin treated goats thancontrol during gestation indicating its favourable effect onsteroidogenesis. Increase in progesterone might be dueto direct effect of insulin on CL or by increasing the ovulationrate. Selvaraju et al. (2002) recorded significantly higherplasma progesterone concentrations in insulin treatedrepeat breeding cows than control. Sarath (2005) alsoreported similar findings in acyclic goats. Lucy et al. (1993)
also reported the direct effect of insulin and/or IGF-I onthe follicles and corpus luteum resulting in increasedperipheral concentration of progesterone. In vitro studiesutilizing bovine luteal cell culture also recorded insulin-induced increase in progesterone secretion (Saurwein et
al., 1992). Lalthazuali et al. (2010) found that there was no
improvement in corpus luteum diameter in insulin treatedbuffaloes as compared to control and suggested thatincrease in conception rate in treatment group may bedue effect of insulin on progesterone synthesis/releasefrom corpus luteum, which resulted in increase inprogesterone concentration.
The conception rate in control and treatment groupwas 50 %. Thus, there was no difference in conceptionrate between treatment group and control. Kharche et al.(2003) reported that single subcutaneous injection of longacting purified bovine insulin @ 0.2 IU/kg body weight onday 10 had no beneficial effect on conception rate. However,Lalthazuali et al. (2010) injected long acting purified bovine
insulin @ 0.2 IU/kg body weight subcutaneously duringpost-insemination mid-luteal phase (days 8-12) in buffaloesand found significantly (P<0.05) higher first serviceconception rate (58% vs. 20%) in treatment group ascompared to control group. In this study lack of differencemay be due to use of single injection (Kharche et al. 2003)or due to small sample size (Lalthazuali et al., 2010) ordue to injecting insulin late in luteal phase. Thus, it maybe concluded that insulin administration on day 12 resultedin the increase in serum progesterone concentration,however, conception rate remained unaffected.
ACKNOWLEDGEMENT
Financial help from the National Fund for Basicand Strategic Research in Agriculture (NFBSRA), ICAR,New Delhi, under the project “Antiluteolytic strategies- anovel approach to enhance fertility in buffalo” is thankfullyacknowledged.
REFERENCES
Ahmad, N. (2001). Reproduction in buffaloes. In: Noakes,D.E., Parkinson, T.J. and England, G.C.W.
20 Journal of Veterinary Pharmacology and Toxicology/December 2012/Vol.11/Issue 1-2/19-21
TABLE 1:
The effect of single insulin treatment @ 0.25 IU/ kg b.wt., im, on day 12 of estrous cycle on concentration of serumprogesterone (ng/ml) in buffaloes.
S. No. Days of Mean ± SE of progesterone (ng/ml) Mean ±SE of progesterone (ng/ml; within group)
estrous cycle Control, (n=10) Treatment (n=10) Pregnant (n=05) Non-pregnant (n=05)
1. Day-0 0.296±0.048 0.273±0.046 0.238±0.062 0.312±0.053
2. Day-12 4.220±0.324 4.079 ±0.199 4.216±0.786 3.862±.02833. Day-14 4.580±0.249 4.710±0.342 4.968±0.646 4.552±0.3324. Day-18 2.904±0.681 3.249 ±0.541 4.558±0.646* 1.940±0.2185. Day -30 3.471±0.420 3.755±0.576 4.558±0.661 2.922±0.843*Significant at 5% level of significance within group.
8/13/2019 JVPT-2012_Vol11
http://slidepdf.com/reader/full/jvpt-2012vol11 25/108
Arthur’s Veterinary Reproduction and Obstetrics.8th edn. New Delhi, India, Harcourt Publisherslimited. pp. 789-799.
Kharche, S.D., Majumdar, A.C and Srivastava, S.K. (2003).Influence of exogenous insulin on conception ratein crossbred cattle. Indian J. Animal Sc. 73(8):
890-891.Lalthazuali, Singh, J., Ghuman, S.P.S., Pandey, A.K. andDhaliwal, G.S. (2010). Impact of insulin treatmentduring post-insemination mid-luteal phase onluteal profile and conception rate in buffalo. Indian
J. Anim. Sc. 80 (9): 854-856.Lemley, C.O., Butler, S.T., Butler, W.R. and Wilson, M.E.
(2007). Insulin reduces the mRNA abundance ofthe progesterone catabolic enzymes cytochromeP450 2C and 3A in the dairy cow. Biol. Repr.
77:146.Lemley, C.O., Butler, S.T., Butler, W.R. and Wilson, M.E.
(2008). Insulin alters hepatic progesterone
catabolic enzymes Cytochrome P450 2C and 3Ain dairy cows. J. Dairy Sci. 91: 641-645.Lemley, C.O., Koch, J.M., Blemings, K.P. and Wilson,
M.E. (2009). Alteration of progesterone catabolicenzymes, CYP2C and CYP3A, in hepatocyteschallenged with Insulin and Glucagon. J. Anim.
Vet. Adv. 8(1): 39-46Lucy, M.C., De La Sota, R.L., Staples, C.R. and Thatcher,
W.W. (1993). Ovarian follicular populations inlactating dairy cows treated with recombinantbovine somatotrophin or saline and fed dietsdiffering in fat content and energy. J. Dairy Sc.
Progesterone in insulin treated buffaloes
Journal of Veterinary Pharmacology and Toxicology/December 2012/Vol.11/Issue 1-2/19-21 21
76: 1014-1027.Santos, J.E.P., Thatcher, W.W., Chebel, R.C., Cerri,
R.L.A. and Galvao, K.N. (2004). The effect ofembryonic death rates in cattle on the efficacy ofoestrous synchronization programs. Anim. Repr.Sc. 82: 513-535.
Sarath, T. (2005). Follicular dynamics, endocrine and nitricoxide profiles in cyclic and insulin administeredacyclic goats. Thesis, IVRI, Izatnagar (U.P).
Sauerwein, H., Miyamoto, J., Gunther, J., Meyer, H.H.D.and Schams, D. (1992). Binding and action ofinsulin like growth factors and insulin in bovineluteal tissue during the oestrous cycle. J. Repr.
Fert. 96: 103-15.Selvaraju, S., Agarwal, S.K., Karche, S.D., Srivastava,
S.K., Majumdar, A. C. and Shanker, U. (2002).Fertility responses and hormonal profiles in repeatbreeding cows treated with insulin. Anim. Repr.
Sc. 73: 141-49.
Snedecor, G.W. and Cochran, W.G. (1994). StatisticalMethods, 8th Edn. Ames, Iowa State UniversityPress. p 503.
Suguna, K., Mehrotra, S., Agarwal, S.K., Hoque, M.,Shanker, U., Singh, S. K. and Varshney, V.P.(2009). Effect of exogenous insulin administrationon ovarian function, embryo/fetal developmentduring pregnancy in goats. Anim. Repr. Sc. 111:202-213.
Received on: 17-02-2012 Accepted on: 22-05-2012

8/13/2019 JVPT-2012_Vol11
http://slidepdf.com/reader/full/jvpt-2012vol11 26/108
Department of Pharmacology and ToxicologyCollege of Veterinary Science and Animal Husbandry,J. N.K.V.V., Jabalpur- 482001, India
1
Corresponding author: E-mail: [email protected]
PHARMACOKINETICS OF CEFEPIME IN FEBRILE BUFFALO CALVES
SHWETA JAIN1, NEETU RAJPUT AND Y. P. SAHNI
ABSTRACT
The present study was planned to investigate the effect of Brewer’s yeast-induced fever on the pharmacokineticsand dosage regimen of cefepime in buffalo calves (n = 4) following a single intravenous dose of 10 mg.kg -1 body weight.Fever was induced by subcutaneous administration of Brewer’s yeast at a dose of 20 mg.kg-1 body weight. The drugconcentration in plasma was estimated by microbiological assay. At 1 min, the peak plasma concentration of cefepime was42.9 ± 0.40 µg.ml-1 and the drug was detected upto 24 h. The apparent volume of distribution and area under the concentration-time curve were 0.63 ± 0.006 L.kg -1 and 70.1 ± 0.59 µg.ml-1.h, respectively. The elimination half-life was 3.05 ± 0.01 h and totalbody clearance was 0.143 ± 0.001 L.kg-1.h-1. Based on the results a satisfactory dosage regimen of cefepime in febrilebuffalo calves was calculated as 9.55 mg.kg-1 followed by 8.92 mg.kg-1 at 12 h intervals.
Keywords: Buffalo calves, cefepime, dosage, fever, pharmacokinetics.
INTRODUCTIONCefepime, a novel fourth generation cephalosporin,
has potent bactericidal activity against a wide range ofgram-negative and gram-positive micro-organismsincluding Pseudomonas aeruginosa and methicillin-susceptible Staphylococcus spp. It is highly active againstPneumococci, Streptococcus pneumoniae, Enterobactor cloacae and many members of the familyEnterobacteriacea. It has several advantages over earliergeneration cephalosporins and is highly stable tohydrolysis by β-lactamases. Pharmacokinetics of
cefepime has been investigated in rats (Brindley et al.,1991), dogs (Stampley et al., 1992), monkeys (Forgue et
al., 1987), neonatal foals (Gardner and Papich 2001),horses (Guglick et al., 1998), ewes (Ismail, 2005), goats(Patani et al., 2006), cow calves (Pawar and Sharma,2008) and human beings (Barbhaiya et al., 1990). Febrileconditions are known to markedly alter thepharmacokinetics of antimicrobials (Burrows, 1985). Feveris one of the most common manifestations of manyinfectious diseases and is reported to induce biochemicaland physiological alterations in cells (Lohuis et al., 1988).In view of the paucity of such pharmacokinetic data, thepresent study was undertaken to determine thepharmacokinetics of cefepime in febrile buffalo calves.
MATERIALS AND METHODSFour male buffalo calves of 6-12 months age and
weighing between 70-100 kg, were housed in an animalshed with a concrete floor and adequate ventilation. Aconstant supply of water was maintained in the shed. Theanimals were healthy at the time of experiment. All theanimals were acclimatized to the animal shed under
uniform conditions and were maintained on green fodder,wheat straw and water ad libitum . Fever was induced bysubcutaneous injection of Brewer’s yeast (SiscoLaboratories, Mumbai, India) at the dose rate of 20 mg.kg-
1body weight. Rise in body temperature was monitored byfrequent recording of rectal temperatures. Cefepime (Sefdin,Unichem Laboratories, Mumbai, India) was administeredas a single intravenous injection into the jugular vein of allthe animals at the dose rate of 10 mg.kg-1 body weightwhen there was a 2oC rise in the rectal temperature of theanimals.
Blood samples (5 ml) were withdrawn fromcontralateral jugular vein into heparinized glass centrifugetubes before and at 1, 2.5, 5, 7.5, 10, 15, 30, 45 min and1, 2, 3, 4, 5, 6, 8, 10, 12, 16, 24 and 36 h after cefepimeadministration. Plasma was separated by centrifugationat 3000 rpm for 15 min at room temperature and kept at –20ºC until analysis, which usually took place on the dayafter collection and was used for estimation of the drugconcentrations.
The concentration of cefepime in plasma wasestimated by a standard microbiological assay technique(Arret et al., 1971) using Escherichia coli (MTCC 739) astest organism. Based on diameter of zone of inhibition ofthe reference concentrations, the plasma levels of cefepimewere calculated and expressed as µg.ml -1 .Pharmacokinetic parameters were calculated manually bythe least square regression technique (Gibaldi and Perrier,1982). Using the values of α and Vdarea obtained afterintravenous injection in febrile calves, the maintenancedose of cefepime was calculated using the formula D / =Cp (min)α.Vd
(area).(eαπ – 1). Where, Cp (min)α is the
minimum inhibitory concentration of cefepime. Initial dose
Research Article
22 Journal of Veterinary Pharmacology and Toxicology/December 2012/Vol.11/Issue 1-2/22-24

8/13/2019 JVPT-2012_Vol11
http://slidepdf.com/reader/full/jvpt-2012vol11 27/108
was calculated by deleting “– 1” from the above equation.
RESULTS AND DISCUSSIONIn all the animals there was significant rise in body
temperature within 20-21 of administration of Brewer’syeast. The elevated body temperature attained its peak
value of 102.6 ± 0.07o
F (2-3o
F above normal) at 24 h ofinjection of Brewer’s yeast. The body temperature ofanimals then declined slowly but remained above thenormal range upto 26-28 h and thereafter became normal.
Evaluation of the data revealed that thepharmacokinetics of cefepime was best described by atwo-compartment open model. Initially there was a rapidfall in plasma concentration during the distribution phaseand then a gradual fall during the elimination phase. Thevarious pharmacokinetic parameters of cefepime in febrilebuffalo calves are given in Table 1. At 1 min following singleintravenous administration, the peak plasma levels ofcefepime in febrile animals was 42.9 ± 0.40 µg.ml-1, which
rapidly declined to 9.74±0.16 µg.ml-1 at 1 h. The levels ofcefepime above the therapeutic plasma concentration weremaintained from 1 min to 10 h of administration. Similar tothe present findings, the plasma concentration of cefepimeat 1 min following intravenous administration in febrile cross-bred calves was reported as 50.0 ± 0.48 µg.ml-1 (Pawarand Sharma, 2008).
Kinetics of cefepime in calves
The pattern of disappearance of drug from plasmaof febrile buffalo calves followed two-compartment openmodel. Similarly, the disposition pattern of cefepime infebrile cross-bred calves (Pawar and Sharma, 2008) andcefpirome in buffalo calves (Rajput et al., 2008) alsofollowed two-compartment open model.
The high value of distribution rate constant (9.50± 0.14 h-1) indicated that cefepime was rapidly distributedinto various body fluids and tissue compartments of febrilebuffalo calves. This correlated well with the rapid declineof drug in plasma in the early phase. The high value of K
12 /
K21
ratio (1.71 ± 0.02) also indicated the rapid transfer ofdrug from central to peripheral compartments in febrilebuffalo calves. The high value of AUC (70.1± 0.59 µg.ml-1-.h) and AUMC (295.8 ± 2.90 µg.ml-1-.h
2) showed that vastarea of the body was covered by cefepime concentrations.In contrast to our findings much higher value of AUC (101.0µg.ml-1
-.h) and AUMC (414.2 ± 2.90 µg.ml-1
-.h2) for cefepime
in febrile calves (Joshi, 2005) has been reported. Extensive
tissue distribution was reflected by the high value of Vd(area)
(0.63 ± 0.006 L.kg-1) and P/C ratio (1.84 ± 0.03) establishedin the present study indicated that cefepime is present ingreater concentration in peripheral than the centralcompartments in febrile buffalo calves.
The elimination half-life of 3.05 ± 0.01 h and ClBof
0.143 ± 0.001 L.kg-1.h-1 in febrile buffalo calves, reflected
TABLE 1:
Pharmacokinetic parameters of cefepime in febrile (20 % Brewer’s yeast @ 20 mg.kg-1, subcutaneous) buffalo claves
after a single intravenous dose of 10 mg.kg-1 body weight (n = 4).
Parameter Unit Mean ± SE
A µg.ml-1 30.0 ± 0.53α h-1 9.50 ± 0.14B µg.ml-1 15.2 ± 0.15β h-1 0.226 ± 0.001t½α
h 0.07 ± 0.001t½β
h 3.05 ± 0.01K12 h-1 5.74 ± 0.07K21 h-1 3.35 ± 0.07K12 /K21 ratio 1.71 ± 0.02AUC µg.ml-1.h 70.1 ± 0.59AUMC µg.ml-1.h2 295.8 ± 2.90Vd(area) L.kg-1 0.63 ± 0.006ClB L.kg-1h-1 0.143 ± 0.001Kel h-1 0.64 ± 0.007MRT h 4.21 ± 0.02P/C ratio 1.84 ± 0.03Td h 10.1 ± 0.04
A and B, zero-time plasma concentration intercepts of regression lines of distribution and elimination phases, respectively;α and β, distribution and elimination coefficients, respectively, in the biexponential equation that describes the plasmaconcentration-versus-time data; t1/2α and t1/2β, half-lives of distribution and elimination phases, respectively; K 12 and K21, rateconstants defined in the two compartment model; AUC, area under the plasma concentration-time-curve; AUMC, area underthe first moment of the plasma concentration-time-curve; Vdarea, volume of distribution from AUC; ClB, total body clearance ofthe drug; Kel, elimination rate constant from the central compartment; MRT, mean residence time of drug in body; T/P, ratio ofthe drug present in the peripheral to central compartment; td, total duration of pharmacological effect.
Journal of Veterinary Pharmacology and Toxicology/December 2012/Vol.11/Issue 1-2/22-24 23

8/13/2019 JVPT-2012_Vol11
http://slidepdf.com/reader/full/jvpt-2012vol11 28/108
Jain et al.
24 Journal of Veterinary Pharmacology and Toxicology/December 2012/Vol.11/Issue 1-2/22-24
rapid elimination and body clearance of the drug. Inagreement to our findings high value elimination half-life(3.0 h) was also reported in calves (Joshi, 2005). Low valueof Cl
B (114.2 ml.kg-1h-1) was also reported in cow calves
(Pawar and Sharma, 2008). The high value of eliminationhalf-life (1.97 h) and ClB (327 ml.kg-1.h-1) was also reported
for ceftizoxime in febrile cow calves (Chaudhary et al.,2002). The value of Kel, MRT and td of cefepime in febrilebuffalo calves were 0.64±0.007 h-1, 4.21 ± 0.02 h and 10.1± 0.04 h, respectively. Comparable values of MRT (4.15 h)have been reported for cefepime in febrile buffalo calves(Joshi, 2005). However, a higher value of K
el (2.58 h-1) was
reported for ceftizoxime in febrile cow calves (Chaudharyet al., 2002).
Taking a convenient dosage interval of 12 h, thepriming and maintenance doses of cefepime to maintainan MIC of 1 µg.ml-1- were calculated to be 9.55 and 8.92mg.kg-1, respectively. However, under field conditions asuitable intravenous dosage regimen of cefepime in febrile
buffalo calves would be 9.5 mg.kg-1 to be repeated at 12 hintervals.
REFERENCES
Arret, B., Johnson, D.P. and Krishbaum, A. (1971). Outlineof details for microbiological assay of antibiotics.Res. Vet. Sci ., 49: 34-38.
Barbhaiya, R. H., Forgue, S. T., Gleason, C. R., Knupp,C.A., Pittman, K. A., Weidler D. J. and Martin, R.R. (1990). Safety, tolerance and pharmacokineticevaluation of cefepime after administration ofsingle intravenous doses. Antimicrob. Agents Chemother. 34: 1118-1122.
Brindley, C. J., Brodie, R. R., Cook, S. C. , Oldfield, P.R., Chasseaud, L. F. and Barbhaiya, R. H.(1991). Dose proportional pharmacokinetice ofcefepime in rats. Eur. J. Drug Metab.
Pharmacokinet. 3: 9-14.Burrows, G.E. (1985). Effect of experimentally induced P.
haemolytica pneumonia on the pharmacokinetics
of erythromycin in calf. Am. J. Vet. Res. 46: 798-803.
Chaudhary R.K., Srivastava, A.K. and Rampal, S. (2002).Pharmacokinetics and dosage regimen ofceftizoxime in normal and febrile calves. Indian J. Ani. Sci. 72 (2): 133-135.
Gardner, S. Y. and Papich, M. G. (2001). Comparison ofcefepime pharmacokinetics in neonatal foals andadult dogs. J. Vet. Pharmacol. Ther. 24: 187-192.
Gibaldi, M., and Perrier, D.(1982) Methods of residuals.In: Pharmacokinetics, 2nd ed. Marcel and DekkerInc. New York, 433-444.
Joshi, B. (2005). Pharmacokinetics of cefepime in healthyand febrile buffalo calves (Babulus bubalis)M.V.Sc. Thesis, Punjab Agriculture University,Ludhiana, India.
Lohuis, J.A.C.M., Varheijden, J.H.M., Burvenich, C. andVan Miert, A.S.J.P.A.M.(1988).
Pathophysiological effects of endotoxin inruminants . Vet. Quart. 10: 109-125.Patani, K., Patel, U. , Bhavsar, S., Thaker, A. and Sarvaiya,
J.(2006). Single dose pharmacokinetics ofcefepime after intravenous and intramuscularadministration in goats. Turk. J. Vet. Ani. Sci.
32(3): 159-162.Pawar, Y. G. and Sharma, S. K. (2008). Influence of E.
coli lipopolysaccharide induced fever on theplasma kinetics of cefepime in cross-bred calves.Vet. Res.Commun. 32(2): 123-130.
Rajput, N., Dumka, V. K. and. Sandhu, H. S. (2008).Influence of experimentally induced fever on the
disposition of cefepirome in buffalo calves.Environ. Toxicol. Pharmacol. 26(3): 305-308.
Stampley, A. R., Brown, M. P., Gronwell, R. R., Castro, L.and Ston, H. W. (1992). Serum concentration ofcefepime (BMY 28142), a broad-spectrumcephalosporin, in dogs. Cornell. Vet . 82: 69-77.
Received on: 15-11-2011Accepted on: 12-02-2012

8/13/2019 JVPT-2012_Vol11
http://slidepdf.com/reader/full/jvpt-2012vol11 29/108
Department of Veterinary Pharmacology and Toxicology
College of Veterinary Science, Guru Angad Dev Veterinary and Animal Sciences UniversityLudhiana - 141 004
*Corresponding author: E-mail: [email protected]
IMPACT OF SUB-CHRONIC ORAL EXPOSURE OF IMIDACLOPRID ON
BIOCHEMICAL PROFILE OF CROSSBRED CALVES
BARINDERJIT KAUR, RAJDEEP KAUR* AND H.S. SANDHU
ABSTRACT
In the present investigation, oral administration of imidacloprid, a neonicotinoid insecticide, at a dose rate of 0.5mg/kg/day for 150 consecutive days did not produce any toxic symptoms but significantly elevated the levels of plasma AST(11.8-22.0%), ALT (22.0-34.0%) and alkaline phosphatase (18.0-27.7%) without affecting the activity of plasma acidphosphatase and cholinesterase enzymes. A significant increase in the levels of serum globulins (15.1%), creatinine(23.3%), glucose 14.1-17.0% and cholesterolemia (16.9%) were observed, however, it did not change the levels of totalserum proteins, albumin and blood urea nitrogen. Thus, on the basis of long-term oral toxicity study, imidacloprid was foundto be a low risk insecticide cross bred cows.
Keywords: : Biochemical parameters, cow calves, imidacloprid, oral toxicity.
INTRODUCTIONIn the present world scenario of insect pest
management, newer and safer compounds are beingdeveloped for various agricultural and veterinary practices.Imidacloprid is a recently introduced insecticide belongingto the group – neo-nicotinoids which have outstandingpotency and systemic action for crop protection againstpiercing-sucking pests with high efficacy against flea incats and dogs (Tomizawa and Casida, 2005). Itsinsecticidal activity is attributed to its complete and virtuallyirreversible blockage of post-synaptic nicotinergic
acetylcholine receptors in the central nervous system ofinsects (Phua et al., 2009). Imidacloprid was introducedin India in 1997-98 due to its high efficacy against insect-pests of agriculture and animal importance. However,following to its repeated use, it may enter into food chainand cause residual toxicity in man and animals. As thereis scarcity of reports on the toxicological aspects of thiscompound in livestock, the present study was designedto evaluate toxic effects of imidacloprid in crossbred cowcalves.
MATERIALS AND METHODSEight healthy male crossbred cow calves (6-
12months; 70-120kg) were randomly divided into twogroups of four animals, each. All the animals weredewormed and maintained on seasonal green fodder andwater was provided ad libitum . Group I served as control,to which no insecticide was administered. The animals ingroup II were administered imidacloprid at a dose rate of0.5 mg/kg/day for 150 consecutive days. The requisiteamount of insecticide was suspended in about 50 ml ofwater and drenched to the animals daily between 9.00
a.m. – 10.00 a.m. The animals were weighed weekly anddoses of imidacloprid corrected according to the changein body weight. To study the biochemical parameters, bloodsamples were collected weekly in heparin containing testtubes via jugular vein puncture. Plasma was separatedand stored for analysis of biochemical parameters.Heparinized blood was also used for blood glucoseestimation (Frankel et al , 1970). Plasma enzymes viz.aspartate aminotransferase (AST), alanineaminotransferase (ALT), alkaline phosphatase (ALP) andacid phosphatase (ACP), and blood urea nitrogen (BUN),
plasma creatinine and plasma cholesterol levels wereestimated using the standard methods as described byWootton (1964). Plasma cholinesterase activity wasestimated according to the method of Voss and Sachsse(1970) as modified by Moroi et al (1976). Level of totalserum proteins in blood without any anticoagulant wasdetermined (Reinhold, 1953). Data was analysedemploying statistical method as per Snedecor andCochran (1967).
RESULTS AND DISCUSSIONDaily oral administration of 0.5 mg/kg/day of
imidacloprid in male cow calves did not produce anyapparent clinical signs associated with toxicosis. However,long-term administration of imidacloprid producedsignificant elevation in the levels of both plasma aspartateaminotransferase and plasma alanine aminotransferase(Table 1). The levels of plasma aspartate aminotransferasewere significantly enhanced from day 90 (11.8%) throughday 135 (22%). Similarly, imidacloprid produced asignificant elevation in the levels of plasma alanineaminotransferase to the extent of 22% from day 90th to
Research Article
Journal of Veterinary Pharmacology and Toxicology/December 2012/Vol.11/Issue 1-2/25-28 25

8/13/2019 JVPT-2012_Vol11
http://slidepdf.com/reader/full/jvpt-2012vol11 30/108

8/13/2019 JVPT-2012_Vol11
http://slidepdf.com/reader/full/jvpt-2012vol11 31/108
34% rise till day 135th. These findings are in agreementwith results of experiments conducted by USEPA (1998)on rats treated with imidacloprid which showed an elevationin the levels of ALT. Although damage to any particularorgan cannot be cited as a cause of increased levels ofaminotransferases, the moderate increase in AST and ALT
levels in blood in the present study suggests hepatocellularinjury. Repeated oral administration of imidacloprid @
0.5 mg/kg/day for 150 days produced no significantalterations in the plasma levels of acid phosphatase (ACP)enzyme, but a significant elevation to the extent of 27.7%was observed in the levels of plasma alkaline phosphatase(ALP) on 135th day of study (Table 1). An elevation in theplasma levels of ALP in rats upon administration ofimidacloprid has also been documented by USEPA (1998).Alkaline phosphatase has high activity in kidneys, intestine,liver, biliary tracts, lungs, etc. in many species (Clampittand Hart, 1978), howeve, r elevated ALP level is
encountered usually where there is hepatobiliaryinvolvement and as documented by USEPA (1998), liveris the principal target organ in imidacloprid toxicity, theelevated ALP levels in the present study could be due toits harmful effect on hepatocytes.
Imidacloprid @ 0.5 mg/kg/day for 150 days didnot produce any significant alteration in the levels of plasmacholinesterase enzyme (Table1). No change in activity ofcholinesterase enzymes by imidacloprid on repeated oralexposure are in agreement with the data generated byUSEPA (1998) in experimental adult wistar rats whererepeated oral administration of imidacloprid produced noinhibition of cholinesterase activity in brain, plasma orerythrocytes.
The effect of repeated oral administration ofimidacloprid on total serum proteins, albumin and globulinsis depicted in Table 1 and 2. There was no significantalteration in the level of total serum proteins and albuminafter repeated drenching of imidacloprid @ 0.5 mg/kg/dayfor 150 days, however, serum globulins showed a significantelevation to the extent of 15% on 120 th day of treatmentand then returned to normal. The findings of total serumproteins and albumin are in agreement with work ofPremlata (2002) who reported no significant changes inrats. Although liver plays vital role in protein metabolism
yet total protein concentration is of little value inassessment of liver functions (Brar et al., 2000). It is difficultto substantiate the temporary rise in serum globulin levelswith repeated oral administration of imidacloprid from theavailable data.
No significant alterations in the level of blood ureanitrogen were produced in cow calves exposed to repeatedoral administration of imidacloprid, however, it produced asignificant hypercreatininemia (Table 2). The plasmacreatinine was elevated to the extent of 28% in imidacloprid
Impact of imidacloprid in crossbred calves
Journal of Veterinary Pharmacology and Toxicology/December 2012/Vol.11/Issue 1-2/25-28 27
treated calves. The present findings of hypercreatininemiaare in contrast to the work of Premlata (2002) who reportedno change and a non-significant decrease in plasmacreatinine levels after i.p. imidacloprid 28 days. Thecreatinine levels help in evaluating the renal functionsespecially the glomerular function because after filtration
by glomerulli, it is excreted in urine. Increase in creatininelevels indicates nephron damage (Brar et al., 2000). Thehypercreatininemia observed in the present studysuggested damage to the renal clearance pathwaysfollowing repeated oral administration of imidacloprid incalves.
In addition, imidacloprid produced hyperglycemiaand hypercholesterolemia in cow calves (Table 2). Theblood glucose levels were elevated to the extent of 17%.Hyperglycemia induced by toxicants has been related tothe increased secretion of catecholamines from adrenalmedulla following stress conditions and subsequently anincrease in circulating glucocorticoids which decrease
peripheral glucose (Munck et al., 1984; Clement, 1985).The cholesterol levels were increased to the extent of17.3%. Alterations in cholesterol levels are not liver specificbut elevated level of total cholesterol and its ester can beobserved in domestic animals having biliary obstruction(Cornelius, 1989). Therefore, on the basis of the presentinvestigation it can be suggested that imidacloprid is alow-risk insecticide which can be safely used in therecommended concentrations in crossbred cow calves.
REFERENCES
Brar, R.S, Sandhu, H.S. and Singh, A. (2000). Veterinary Clinical Diagnosis by Laboratory Methods . KalyaniPublishers, Ludhiana-New Delhi.
Cornelius, C.E. (1989). Liver function. In: Clinical
Biochemistry of Domestic Animals. Kaneko , J J(Ed). 4th edn. Academic Press. San Diego. pp 364-97.
Clampitt, R.B. and Hart, R.J. (1978). The tissue activitiesof some diagnostic enzymes in ten mammalianspecies. J. Com. Pathol . 88: 607-21.
Clement, J.G. (1985). Hormonal consequences oforganophosphate poisoning. Fund. Appl. Toxicol.5: 561-77.
Frankel, S., Reitman, S. and Sonnerwirtha, A.C. (1970).
Gradwhol’s Clinical Laboratory Methods and Diagnosis . Vol. I. The C.V Mosby Co., St. Louis.pp- 82-83.
Moroi, K., Usbiyama, S., Satoh, T. and Kuga, T. (1976).Enzyme induction of repeated administration oftetrachlorvinphos in rats. Revue d’Elevage et de
Medicine Veterinaire des Pays Tropicaure , 43:431-34.
Munck, A., Guyre, M.P. and Holbrook. (1984).Physiological functions of glucocorticoids in stress

8/13/2019 JVPT-2012_Vol11
http://slidepdf.com/reader/full/jvpt-2012vol11 32/108
Kaur et al.
and their relation to pharmacological action.Endocrine Rev. 5: 25.
Phua, D.H., Lin, C.C., Wu, M.L., Deng, J.F. and Yang,C.C. (2009). Neonicotinoid insecticides: anemerging cause of acute pesticide poisoning. Clin.Toxicol. 47(4): 336-41.
Premlata. (2002) Pharmacological and Toxicological Studies of Imidacloprid: A Nitroguanidine
Insecticide . M.V.Sc. Thesis, CCS HaryanaAgricultural University, Hisar.
Reinhold, J.G. (1953). Total Proteins: Reiner M (ed).Standard Methods of Clinical Chemistry . Vol 1 pp88. Academic Press, New York.
Snedecor, G.W. and Cochran, W.G. (1967). StatisticalMethods. 6th ed Allied Pacific, Bombay.
Tomizawa, M. and Casida, J.E. (2005). Neonicotinoidinsecticide toxicology: mechanisms of selectiveaction. Annu. Rev. Pharmacol. Toxicol. 45:247-68.
USEPA. (1998) Imidacloprid, Pesticide Tolerance.Federal Register 63(57): 14363-71.
Voss, S. and Sachsse, K. (1970). Red cell and plasmacholinesterase activities in microsamples ofhuman and animal blood determinedsimultaneously by a modified acetylcholine/DTNBprocedures. Toxicol. Appl. Pharmacol . 16: 764-72.
Wootton, I.D.P. (1964) Microanalysis. In MedicalBiochemistry, 4th edn, J and A Churchill Ltd,London.
Received on: 27-02-2012
Accepted on: 22-04-2012
28 Journal of Veterinary Pharmacology and Toxicology/December 2012/Vol.11/Issue 1-2/25-28
INDIAN SOCIETY OF VETERINARY PHARMACOLOGY & TOXICOLOGY(Registered under the Societies Registration Act .XXI of 1860)
APPLICATION FOR MEMBERSHIP
To,The TreasurerISVPT
Kindly enroll me/us as Individual/Corporate (Annual/Life) Member of the Indian Society ofVeterinary Pharmacology and Toxicology. I/we hereby agree to abide by the Rules of the Society.*Name (In block letters)_______________________________________________________
(Surname) (First) (Middle)**Date of Birth _____________________________________________________________**Education (Scientific degrees) ________________________________________________**Field (S) of Specialization ____________________________________________________**Designation and Organization _________________________________________________Mailing Address____________________________________________________________
__________________________PIN Code ____________________________Telephone: (O)_______________________________(R) __________________________Fax : ____________________________ Email_______________________________Proposed by_________________ Signature of Applicant
Seconded by__________________ Date: __________________MEMBERSHIP FEE
1. Annual Membership fee is Rs.100/- and Life Membership is Rs.2000/-.2. Annual Membership for students is Rs. 50/-.3. Annual Membership for scientists from abroad is US $50 and Life Membership is US $5004. Industries can enroll themselves as Corporate Members by paying Annual membership fee of Rs. 600/- and Life Time Membership fee of Rs. 6000/-5. Membership fee along with Admission fee of Rs.20/- be sent by Bank Draft drawn in favour of Indian Society of Veterinary Pharmacology & Toxicology
payable at the Central bank of India, Anand Branch. Personal cheques are not acceptable. The completed Application form along with the draft be sent toDr. A. M. Thaker, Treasurer, ISVPT, Department of Pharmacology, Veterinary College, Anand Agricultural University, Anand-388001 (Gujarat).
*The full name of the Organization should be indicated by the Industries.**Not applicable to Industries.

8/13/2019 JVPT-2012_Vol11
http://slidepdf.com/reader/full/jvpt-2012vol11 33/108
Research Article
1Asstt. Prof.,Department of Pharmacology and Toxicology, 3Dean, C.V. Sc. & A. H., U.P. Pandit Deen Dayal Upadhyaya
Pashu Chikitsa Vigyan Vishwavidyalaya Evam Go-Anusandhan Sansthan, Mathura - 281 0013Scientist, 4Head, Division of Pharmacology and Toxicology, I.V.R.I.Izatnagar-243 122, U.P., India1Corresponding author: [email protected]
NITRIC OXIDE AND C-GMP-INDEPENDENT βββββ2-ADRENOCEPTORS
MEDIATED TOCOLYSIS IN BUFFALOES
SOUMEN CHOUDHURY1*, THAKUR UTTAM SINGH2, SATISH KUMAR GARG3 AND SANTOSH KUMAR MISHRA4
ABSTRACT
Control of myometrial excitability employing β2 -adrenoceptor agonists has important therapeutic applications in the
management of preterm labour and threatened abortion. Present study was undertaken to unravel the possible involvementof nitric oxide and c-GMP and c-AMP as second messengers, if any, in regulating β2-adrenoceptor mediated myometrialrelaxation in buffalo uterus. Albuterol produced concentration- dependent relaxation of myometrial spontaneity with pD
2 and
Rmax value of 8.55 and 101.1 ± 6.3%, respectively. Pre-treatment of myometrial strips with L-NAME (1mM) or ODQ (1mM) failedto alter the potency and efficacy of albuterol compared to control. Exposure of myometrial strips to albuterol (10 nM and 100nM) although increased tissue c-AMP accumulation to 3.49 ± 0.28 and 4.89 ± 0.58 pmol/mg tissue protein (n=6) respectively,in a dose dependent manner in comparison to basal level of 3.23 ± 0.48 pmol/mg tissue protein but this rise in c-AMP levelwas not statistically significant. Based on these findings it may be inferred that tocolytic effect of albuterol on buffalo
myometrium seems to be nitric oxide and c-GMP-independent. But the involvement of c-AMP in regulating beta 2-adrenoceptormediated relaxation cannot be ruled out.
Key words : Albuterol, β2 -adrenoceptor agonists, buffalo, cAMP, cGMP, nitric oxide, tocolytic, uterine myometrium.
INTRODUCTIONUse of β2-adrenoceptor stimulants as tocolytics
is a common practice in veterinary medicine to treatgynaecological and obstetrical disorders like uterineprolapse, delay parturition during odd hours, duringfoetotomy and caesarean sections in cows, sheep andother domestic animals and also in embryo transfertechnology (Salmanoglu et al., 1990). However, theunderlying signalling pathways in special reference to theinvolvement of nitric oxide and second messengersresponsible for inducing β2-adrenoceptor agonist-mediatedmyometrial relaxation in buffalo is not known. Thus thepresent study was designed to unravel the possibleinvolvement of nitric oxide (NO) and cyclic nucleotides (c-GMP and c-AMP), in mediating albuterol-induced tocolysisin buffaloes.
MATERIALS AND METHODSMyometrial strips from midcornual region of
diestrous stage uterus of cyclic non-descript buffaloes
were collected from local abattoir and mounted in athermostatically controlled (37.0 ± 0.5 ºC) organ bath (UgoBasile, Italy) of 10 ml capacity containing continuouslyaerated (95% O2 + 5% CO2) Ringer Locke solution (RLS,pH 7.4). Isometric tension was recorded under 2g restingtension using Chart V5.4.1 software programme (Powerlab,AD Instruments, Bella Vista, NSW, Australia). In order toevaluate the involvement of NO and c-GMP pathway, thecumulative concentration response of albuterol wererecorded alone on spontaneous myometrial contractility
was recorded and presence of L-NAME (L-nitro –argininemethyl ester, Sigma, USA), a non-selective nitric oxidesynthase (NOS) inhibitor and ODQ (1H [1, 2,4]oxodiazole[4,3-a] Quinoxaline, Cayman, USA), a solubleguanylate cyclase (sGC) inhibitor, respectively. Tissue c-AMP levels in absence (control) and presence of albuterol(10nM and 100nM) were estimated using EIA assay kit(Cayman Chemicals, USA). Rolipram (10µM, Santa Cruz,USA) was used as phosphodiesterase (PDE4) inhibitor.Tissue protein was estimated by employing Lowry’smethod (1951) and concentrations of c-AMP wereexpressed as pmol/mg tissue protein. Multiple meanvalues of relaxation response were analysed using two-way ANOVA followed by Bonoferroni post hoc test whereasbiochemical parameters were analyzed by one-wayANOVA followed by Tukey’s post-hoc test using GraphPad Prism 4.0 (Graph Pad, La Jolla, USA). pD2 is definedas –logEC50 value.
RESULTS AND DISCUSSION
After an equilibration period of about 2hrs in RLS,myometrial strips exhibited regular pattern of spontaneitywith average amplitude and frequency/min of 2.11 ± 0.15g (n = 25) and 1.72 ± 0.15 (n = 25), respectively. Albuterol(3x10⁻¹⁰ M to 3x10⁻⁸ M at 0.5 log dose units) producedconcentration-dependent relaxant effect on myometrialspontaneity with pD2 and Rmax value of 8.55 and 101.1 ±6.3%, respectively. L-NAME (1mM) had no direct effecton myometrial spontaneity and pre-treatment of tissue withL-NAME did not produce any significant effect on albuterol-
Journal of Veterinary Pharmacology and Toxicology/December 2012/Vol.11/Issue 1-2/29-32 29

8/13/2019 JVPT-2012_Vol11
http://slidepdf.com/reader/full/jvpt-2012vol11 34/108
Choudhuryet al.
induced myometrial relaxation (Fig.1). The pD2and R
max
values of albuterol (n=6) in the presence of L-NAME werefound to be 8.41 and 92.71 ± 5.35%, respectively. Further,pre-incubation of myometrial strips with ODQ (1mM) failedto produce any significant effect either on myometrialspontaneity or relaxation effect of albuterol. The
corresponding values of pD2 and Rmax of albuterol in presenceof ODQ were recorded as 8.33 and 99.38 ± 0.32%,respectively (n = 6). The DRCs of albuterol in absenceand presence of ODQ were depicted in Fig.2
Considering the EC50
value of albuterol, tissue c-AMP level was determined in the presence of 10 and 100nM of albuterol. Fig. 3 illustrates the basal (control) andalbuterol-induced c-AMP accumulation in myometrialstrips of buffaloes. Treatment with 10 nM albuterol slightlyincreased the level of c-AMP (3.49 ± 0.28 pmol/mg tissueprotein, n=6) while at higher concentration (100 nM) therewas marked increase in the tissue concentration of c-AMP (4.89 ± 0.58 pmol/mg tissue protein; n=6) in
comparison to control (3.23 ± 0.48 pmol/mg tissue protein,
n=6) as shown in fig. 4. However, the changes in c-AMPlevels following treatment with albuterol were found to bestatistically non-significant.
Albuterol, a selective β2 agonist, produced
concentration dependent inhibitory effect on myometrialspontaneity, thus, suggesting its potent tocolytic effect
on buffalo myometrium. This observation is in conformitywith similar reports on ewes (Crankshaw and Ruzycky,1984), goats and cows (Matsuda et al., 2002) and alsofrom our laboratory on buffalo myometrium contracted withdifferent spasmogens (Garg et al., 2004).
Nitric oxide has been reported to be involved inmyometrial relaxation both in animals (Kuenzli et al., 1998)and human beings (Bradley et al., 1998) and its use inpreterm labour has been suggested by Lees and co-workers (1994). In human myometrium, NO has beenreported to induce myometrial relaxation in laboring andnon-laboring stage either directly or through secondmessenger by stimulating guanylyl cyclase (Buxton et
Fig. 2:Cumulative concentration response curves of albuterolalone and in the presence of L-NAME (1mM) on isolatedmyometrial strips of buffaloes (n=6). Vertical bars representSEM.
Fig. 1:Spontaneous contractility of isolated myometrial strips ofbuffaloes.
Fig. 3:Cumulative concentration response curves of albuterolalone and in the presen ce of ODQ (1 mM) on isolatedmyometrial strips of buffaloes (n=6). Vertical barsrepresentSEM.
Fig. 4:c-AMP levels in the isolated buffalo myometrium under basalcondition (control) and after treatment with albuterol (10 nMand 100 nM).
30 Journal of Veterinary Pharmacology and Toxicology/December 2012/Vol.11/Issue 1-2/29-32

8/13/2019 JVPT-2012_Vol11
http://slidepdf.com/reader/full/jvpt-2012vol11 35/108
al., 2001). β2-adrenoceptors are reported to mediaterelaxation by releasing nitric oxide from epithelial and non-epithelial source of rat trachea (Montalvo et al., 2010) andby promoting eNOS phosphorylation in mouse pulmonaryartery (Banquet et al., 2011). Pre-treatment of myometrialstrips with L-NAME (1mM) did not produce any significant
shift in dose response curve of albuterol in comparison tocontrol. There was no change in the potency (pD2) and
efficacy (Rmax
) of albuterol following pre-treatment of L-NAME compared to control. Thus, it may be inferred thatNO does not seem to modulate β
2- adrenoceptor agonist-
induced myometrial relaxation in non-pregnant buffaloes.Pal (2010) has also observed similar effect of L-NAME onpregnant buffalo myometrium. ODQ did not produce any significant effect onalbuterol-induced tocolysis and the dose-response curvesof albuterol alone and in the presence of ODQsuperimposed over each other and the pD
2value of albuterol
alone (8.55) did not differ from the value of albuterol in the
presence of ODQ (8.33 ). These observations suggest thatblockade of sGC did not influence the tocolytic effect ofalbuterol thus evidently suggesting that albuterol-inducedtocolysis is c-GMP-independent. Effect of albuterol in thepresent study in buffalo myometrium is similar to that ofnitric oxide-induced relaxation in guinea pig (Kuenzli et al., 1996), monkey (Kuenzli et al., 1998) and humanmyometrium (Bradley et al., 1998) which is reported to bec-GMP independent and possible involvement of ionchannels or pump regulation by nitric oxide has beensuggested (Buxton et al., 2001). Involvement of K
ATP and
BKCa channels has also been reported in mediatingalbuterol-induced tocolysis in non-pregnant buffaloes
(Choudhury et al., 2010)Garg and co-workers (2005) have reported a
promising potential of papaverine and caffeine as tocolyticsin buffaloes which act through the inhibition ofphosphodiesterase, thereby resulting in increasedintracellular levels of c-AMP and also by causing blockadeof Ca2+ and β
2-adrenergic receptors are also known to relax
smooth muscles by increasing the intracellular levels ofc-AMP (Rang et al., 2003). Thus, in the present study anattempt was undertaken to elucidate the possibleinvolvement of c-AMP in regulating albuterol-inducedtocolytic effect on buffalo myometrium. Pre-treatment ofuterine strips with albuterol although dose dependentlyincreased c-AMP accumulation in myometrial strips butthis change was statistically non-significant. Thus, thepossible involvement of c-AMP in mediating albuterol-induced tocolysis in buffaloes cannot be ruled out.Observations of this study are in agreement with the resultsof Hughes et al. (1997). Both the c-AMP-dependent andc-AMP-independent pathways for the action ofβ-adrenergic receptors agonists have been documented(Khac et al., 1996).
In conclusion, albuterol-induced myometrialrelaxation in buffaloes is independent of NO and c-GMPand possible involvement of c-AMP in mediating albuterol-induced tocolysis cannot fully be ruled out.
REFERENCES
Banquet, S., Delannoy, E., Agouni, A., Dessy, C.,Lacomme, S., Hubert, F., Richard, V., Muller, B.and Leblais, V. (2011). Role of G(i/o)-Src kinase-PI3K/Akt pathway and caveolin-1 in α‚ -adrenoceptor coupling to endothelial NO synthasein mouse pulmonary artery. Cell Signal.23(7):1136-1143.
Bradley, K.K., Buxton, I.L.O., Barber, J.E., McGaw, T.and Bradley, M.E.(1998). Nitric oxide relaxeshuman myometrium by a cGMP independentmechanism. Am. J. Physiol. 44: C1668-C1673.
Buxton, I.L.O., Kaiser, R.A., Malmquist, N.A. and Tichenor,S. (2001). NO-induced relaxation of labouring and
non-labouring human myometrium is not mediatedby cyclic GMP. . Br.J. Pharmacol . 134: 206-214.
Choudhury, S., Garg, S.K., Singh, T.U. and Mishra, S.K.(2010). Cellular coupling of potassium channelswith α
2 adrenoceptors in mediating myometrialrelaxation in buffaloes (Bubalus bubalis). J. Vet.Pharmacol. Therap. 33: 22–27.
Crankshaw, D.J. and Ruzycky, A.L. (1984)Characterization of putativeβ-adrenoceptors in themyometrium of the pregnant ewes: correlationbetween the binding of [3H] dihydroalprenolol andthe inhibition of myometrial contractility in vitro.Biol. Reprod. 30: 609–618.
Garg, K.M., Garg, S.K. and Sabir, M. (2005).Pharmacological inhibition of phosphodiesteraseinhibitors as potential tocolytic agents in buffaloes(Bubalus bubalis ). Ind. J. Anim. Sc . 75: 212-214.
Garg, S.K., Garg, K.M. and Sabir, M. (2004). Evaluationof tocolytic efficacy of selective β
2 adrenoceptoragonist on buffalo uterus. Ind. J. Exp. Pharmacol .42: 913-918.
Hughes, S.J., Hollingsworth, M. and Elliot, K.R.F. (1997).The role of cAMP-independent pathway in theuterine relaxant action of relaxin in rats. J.Reprod.
Fert . 109:289-296.Khac, L.D., Arnaudeau, S., Lepretre, N., Mironneau, J.
and Harbon, S. (1996). β−Adrenergic ReceptorsActivation Attenuates the Generation of InositolPhosphates in the Pregnant Rat Mypmetrium.Correlation with Inhibition of Ca++ influx, a cAMP-independent mechanism. J. Pharmacol. Exp.
Therap. 276: 130-136.Kuenzli, K.A., Bradley, M.E. and Buxton, I.L.O. (1996).
Cyclic GMP independent effects on nitric oxideon guineapig uterine contractility. Br. J.
β2-adrenoceptors mediated tocolysis in buffaloes
Journal of Veterinary Pharmacology and Toxicology/December 2012/Vol.11/Issue 1-2/29-32 31

8/13/2019 JVPT-2012_Vol11
http://slidepdf.com/reader/full/jvpt-2012vol11 36/108
Pharmacol . 119: 737-743.Kuenzli, K.A., Buxton, I.L. and Bradley, M.E. (1998). Nitric
oxide regulation of monkey myometrialcontractility. Br. J. Pharmacol . 124: 63-68.
Lees,C., Campbell,S., Jauniaux, E., Brown, R, Ramsay,B., Gibb,D. and Moncada, S. (1994). Arrest of
preterm labour of gestation with glyceryl trinitrate,a nitric oxide donor. Lancet . 343: 1325-1326.Lowry, O.H., Rosenbrough, N.J., Farr, A.L. and Randall,
RJ. (1951). Protein measurement with folin phenolreagent. J. Biol. Chem. 193: 265-275.
Matsuda, Y., Kouno, S., Sakamoto, H. and Ikenoue, T.(2002). Effects of meluadrine tartrate and ritodrinehydrochloride on oxytocin-induced uterinecontraction, uterine arterial blood flow and maternalcardiovascular function in pregnant goats. Jap. J.
Pharmacol. 90: 107–113.Montalvo, F., Cantres-Fonseca, O., Santos, G., Vega, M.,
Torres, I., Carmona, J., Dexter, D. and Santacana,
G. (2010). Nitric oxide is involved in the responseof the isolated intact and epithelium-denuded rattrachea to the β
2 adrenergic receptor agonist
salbutamol. Respiration. 80(5):426-432.Pal, S. (2010). Pharmacological characterization of ATP-
dependent potassium channels and signaling
pathways of terbutaline and forskolin-inducedmyometrial relaxation in pregnant buffaloes.M.V.Sc. Thesis. U.P. Pt. D.D. Upadhyaya Pashu-Chikitsa Vigyan Vishwavidyalaya Evam GoAnusandhan Sansthan, Mathura , India.
Rang, H.P., Dale, M.M., Ritter, J.M. and Moore, P.K.(2003). In: Pharmacology. 5th ed. Church HillLivingstone Publishers. pp. 22-48.
Salmanoglu, M.R., Bekyllrek, T. and Kilieoglu, C. (1990).Use of sympathomimetic (ritodine) to produceuterine relaxation in cows, sheep and goats.Veterinary Fakultesi Deraisi Universitesi , Ankara(Turkey). 37: 10-19.
Received on : 14-03-2012 Accepted on : 20-06-2012
Choudhury et al.
32 Journal of Veterinary Pharmacology and Toxicology/December 2012/Vol.11/Issue 1-2/29-32

8/13/2019 JVPT-2012_Vol11
http://slidepdf.com/reader/full/jvpt-2012vol11 37/108
Research Article
1Ph.D. Scholar, Deptt. of Pharmacology and Toxicology, IVRI, Izatnagar, Bareil ly, 2Director, NDRI, Karnal, 3Professor,Division of Pharmacology and Toxicology, F.V.Sc. & A.H., SKUAST-J, R.S. Pura, Jammu-181102, 4Asstant Professor,
Division of Pharmacology and Toxicology, F.V.Sc. & A.H., SKUAST-J, R.S. Pura, Jammu-181102,5Ph.D scholar, Department of Pharmacology and Toxicology, C.V.&A.Sc, G. B. P. U. A. & T, Pantnagar- 263145, India,
6M.V.Sc. Scholar, Livestock Product Technology, F.V.Sc. & A.H., SKUAST-J, R.S. Pura, Jammu-181102, 7AssociateProfessor, Department of Clinic and VEterinary Services, GADVASU, Ludhiana
1Corrosponding author : E-mail: [email protected]
THRESHOLD PLASMA FLUORIDE LEVELS IN GOATS FOR SUBACUTE
ORAL TOXICITY OF FLUORIDE AND EFFICACY OF ALUMINIUM
SULPHATE AS AN AMELIORATIVE AGENT
VINAY KANT1, A. K. SRIVASTAVA2, R. RAINA3, P.K. VERMA4, N.K. PANKAJ5, P. SINGH6 AND S.K. UPPAL7
ABSTRACT
Fluorine intoxication is an important global public health concern in humans and animals. In present study, sodiumfluoride alone and with aluminium sulphate (ameliorative agent) was administered orally daily for 30 days in healthy goatsof group 1 and 2 respectively to access the threshold plasma fluoride levels for appearance of clinical symptoms in subacute
toxicity and ameliorative effect of aluminium sulphate. Signs of toxicity, like inappetance, lethargy, weight loss, decreasedruminal motility, decreased milk production, muscle weakness and decreased movement appeared only in group 1 within7-10 days of exposure. Significant (P < 0.01) increase in plasma and milk fluoride levels was observed in both the groupsduring the experiment. Finally, it could be concluded that the plasma fluoride level >1.50 ± 0.14 mg/L was associated with theclinical symptoms of subacute toxicity of fluoride in goats and aluminium sulphate may be effectively employed as amelio-rative agent.
Key words: Aluminium sulphate, goats, milk, sodium fluoride, subacute toxicity.
INTRODUCTIONFluorine is highly reactive and most electronegative
element, due to which it combines directly or indirectlywith other elements, except oxygen and nitrogen under
ordinary temperature and pressure (Banks and Goldwhite,1966), to form complexes called fluorides. These arereleased into environment via both human as well as naturalactivities and exposed to animals and humans mainly viaair, drinking water and food. Kidneys are the primary routefor the removal of absorbed fluoride from the body andother routes of excretion are sweat, feces, saliva and milk(Mellberg et al., 1983; Whitford, 1996; WHO, 2002).
Although, fluorine is one of the essential traceelements required for human or animal body but excessintake produces deleterious effects on the body andcauses a disease called “Fluorosis”; which is one of theimportant public health problems all over the world. So,the concentration of fluoride in the body is critical andplasma is the biological fluid into which fluoride must passfor its distribution in the body as well as its eliminationfrom the body; therefore, plasma is often referred to asthe central compartment of the body (Fejerskov et al.,
1996). So, the aim of the present study was to determinethe threshold plasma fluoride levels for the appearance ofclinical symptoms in subacute toxicity and ameliorativeeffect of aluminium sulphate in goats.
MATERIALS AND METHODS
Experimental design Eight healthy cross bred goats of age 1.5-2 years
of 25-30 kg body weight were procured from local farmers
of R.S. Pura, Jammu. They were acclimatized for twoweeks in the divisional animal shed under standardconditions before the commencement of experiment. Theanimals were maintained on ad lib feed and water. Theexperimental protocol was approved by institutional ethicscommittee. The animals were divided into two groups of 4each. Group 1 was used to induce the subacute toxicityof F to determine the threshold plasma F levels to induceclinical symptoms and in this group sodium fluoride (NaF,SD Fine- Chem. Ltd.) alone was administered orally bydrenching at the dose rate of 20 mg/kg b.wt. (providing 9mg/kg b.wt. fluorine) daily for 30 days. Where as group 2was used to study the ameliorative efficacy of aluminiumsulphate and in this group same dose of sodium fluoridealong with aluminium sulphate [Al2(SO4)3.16H2O, SD Fine-Chem. Ltd.] at the dose rate of 150 mg/kg b.wt. wereadministered orally by drenching daily for 30 days.Aluminium sulphate
was administered 30 minutes before
the administration of sodium fluoride. Both the salts weredissolved separately in 100 ml of distilled water anddrenched to the animals daily between 9.00 to 10.00 a.m.All the animals were weighed weekly and doses of salts
Journal of Veterinary Pharmacology and Toxicology/December 2012/Vol.11/Issue 1-2/33-36 33

8/13/2019 JVPT-2012_Vol11
http://slidepdf.com/reader/full/jvpt-2012vol11 38/108
Kant et al.
were administered accordingly. The body weight andruminal motility of the goats of both the groups weredetermined on day 0, 7, 14, 21, 28, 30 of exposure and onday 7, 14 after termination of exposure of fluoride. Allanimals were closely observed for clinical signs andmortality.
Sample collection Blood samples were collected in a thoroughly cleanfluoride free glass vial containing heparin (Himedia, Mumbai)@ 5-10 IU/ml blood on day 0, 1, 3, 7, 14, 21, 28, 30 oftreatment and on day 3, 7, 14 after termination of treatmentby jugular vein puncture. The heparinized blood sampleswere centrifuged at 3000 rpm (revolution per minute) for15 min. Plasma samples were separated and stored inpolyethylene plastic vials at – 20oC until analysis. Milksamples were also collected in polyethylene plastic vialson day 0, 1, 3, 7, 14, 21, 28, 30 of exposure and stored at- 20oC until analysis.Fluoride estimation
Plasma fluoride estimation was carried out bySener et al. (2007) method by using ion selective electrode(ISE) of Orion Fluoride Analyzer (microprocessor based 4star model) using 96-09 combination fluoride electrode.Equal volume of plasma sample and TISAB III (Total ionic
strength adjustment buffer III) was added in a beaker, wellmixed and fluoride was estimated by putting 96-09combination fluoride electrode in beaker. The electrodewas washed with distilled water and cleaned before theestimation of the next sample. Similarly, milk fluoride levelswere also estimated.
Statistical analysis Mean plasma fluoride levels on different days ofexposure and after termination of exposure were comparedto pre-exposure (0 day) value of the same group and aprobability level of P < 0.05 and P < 0.01 was consideredstatistically significant (Snedecor and Cochran, 1989).
RESULTSThe toxic symptoms appeared within 7-10 days
of oral administration of fluoride. All the animals of group 1showed signs of toxicity, like inappetance, lethargy, weightloss (Table 1), decreased ruminal motility (Table 1),decreased milk production, muscle weakness and
decreased movement. They sat and stayed at one placeduring grazing. Two animals out of the four animals in thegroup showed haemorrhagic diarrhea intermittently after24 day onwards of the treatment. There was loss ofcondition and goats on an average lost 7 kgs in body weight
34 Journal of Veterinary Pharmacology and Toxicology/December 2012/Vol.11/Issue 1-2/33-36
TABLE 1:Effect on body weight and ruminal motility of goats on different days of exposure of sodium fluoride alone (group 1) andalong with aluminium sulphate (group 2) (n=4 and values are expressed as mean ± SE)
Parameter Group Treatment days Post Treatment days
0 7 14 21 28 30 7 14
1 31.75 29.75 28.5 26.75 b 24.75 b 24.00 b 23.75 b 25.00 b
Body weight ±1.65 ±1.65 ±1.85 ±1.84 ±1.44 ±1.47 ±1.11 ±1.08(Kilograms) 2 32.0 32.5 33.25 33.0 31.75 31.25 31.75 32.25
±1.08 ±1.04 ±1.03 ±0.91 ±0.75 ±0.48 ±0.75 ±0.63Ruminal motility 1 2.75 1.50 b 1.25 b 1.50 b 1.25 b 1.50 b 2.00 b 2.25 a
(per 2 minutes) ±0.25 ±0.29 ±0.25 ±0.29 ±0.25 ±0.29 ±0.00 ±0.252 3.0 2.5 2.75 2.5 2.75 2.75 2.75 2.5
±0.00 ±0.29 ±0.25 ±0.29 ±0.25 ±0.25 ±0.25 ±0.29aSignificantly (P < 0.05) different as compared to pre-exposure (0 day) value of the same group.bSignificantly (P < 0.01) different as compared to pre-exposure (0 day) value of the same group.
TABLE 2:Fluoride levels (mg/L) in plasma and milk on different days of exposure of sodium fluoride alone (group 1) and along withaluminium sulphate (group 2) (n=4 and values are expressed as mean ± SE)
Parameter Group Treatment days Post Treatment days
0 1 3 7 14 21 28 30 3 7 14
Plasma Fluoride 1 0.058 0.541 b 1.191 b 1.500 b 1.595 b 1.493 b 1.913 b 1.850b 0.513 b 0.346 b 0.310 b
levels (mg/L) ±0.01 ±0.08 ±0.15 ±0.14 ±0.20 ±0.23 ±0.30 ±0.32 ±0.02 ±0.02 ±0.032 0.03 0.459 b 0.666 b 0.949 b 1.065 b 0.878 b 1.116 b 0.759 b 0.470 b 0.202 a 0.185 a
±0.01 ±0.05 ±0.20 ±0.15 ±0.14 ±0.14 ±0.25 ±0.27 ±0.11 ±0.07 ±0.05Milk Fluoride 1 0.04 0.447 b 0.507 b 0.711 b 0.774 b 0.829 b 0.875 b 0.878 b NE NE NElevels (mg/L) ±0.01 ±0.07 ±0.09 ±0.19 ±0.16 ±0.13 ±0.12 ±0.08
2 0.039 0.169 b 0.216 b 0.257 b 0.305 b 0.344 b 0.379 b 0.428 b NE NE NE±0.01 ±0.02 ±0.01 ±0.01 ±0.02 ±0.02 ±0.03 ±0.03
aSignificantly (P < 0.05) different as compared to pre-exposure (0 day) value of the same group.bSignificantly (P < 0.01) different as compared to pre-exposure (0 day) value of the same group.NE: not estimated

8/13/2019 JVPT-2012_Vol11
http://slidepdf.com/reader/full/jvpt-2012vol11 39/108
after 30 days of daily administration. The toxic symptomswere not prominant in animals of group 2.
The plasma fluoride levels of goats on differentdays are presented in Table 2 and the graphicalrepresentation is shown in the Figure 1. In group 1, theplasma fluoride (mg/L) increased significantly (P < 0.01)
on day 1 of exposure from the pre exposure levels andremained increased significantly (P < 0.01) during the wholeexperiment. The plasma fluoride level was maximum onday 28 of exposure. Similarly, in group 2, the plasmafluoride levels (mg/L) increased significantly (P < 0.01) onday 1 of exposure and the levels were also maximum onday 28 of exposure. After termination of exposure, theplasma fluoride showed decreasing trend in both thegroups, but remained significantly higher than the normalpre exposure levels.
The milk fluoride levels on different days are alsopresented in Table 2 and the graphical representation isshown in the Figure 2. The levels of milk fluoride (mg/L)
increased significantly (P < 0.01) on different days ofexposure from the pre exposure levels in dose responsemanner. The maximum milk fluoride levels in both thegroups were on day 30 of exposure.
DISCUSSIONThe fluoride toxicity is directly correlated to the
level of fluorine in blood and tissues. The tolerance of fluoridevaries with the species, concentration of fluoride in water,feed and soil, and solubility of fluoride. The normal safelevels of fluorine in livestock are considered to be lessthan 0.2 ppm in plasma (Aiello, 1997). The toxic symptomsobserved in the present study are in concurrence with the
findings in sheep (Tiwary et al., 1979) and buffalo calves(Gujarathi et al., 1991; Marconi, 2000). Poor growthperformance of experimental animals is probably due todisturbance of some nutrient utilization, which is inaccordance with the findings of Guenter and Hahn (1986)in hens.
In present study, the plasma fluoride levelsincreased significantly on different days of exposure andthe appearance of toxic symptoms within 7-10 daysrevealed that the concentration of >1.50 ± 0.14 mg/L offluoride in plasma may be taken as threshold forappearance of clinical symptoms of subacute toxicity offluoride in goats. But Marconi (2000) reported that
121.0±10.6 ng/ml (0.121 mg/L) may be taken as thresholdfor appearance of clinical symptoms of subacute toxicityof fluoride in buffalo calves. As the buffaloes are mostsusceptible and goats are most resistant animals to fluoridetoxicity among the ruminants, so, the toxic effects wereobserved at lower levels in buffalo calves as compared toour study in goats. Also the dose of sodium fluoride usedby Marconi in buffalo calves was 6 mg/kg which was about3.5 times lesser to our used dose in the goats. Kristinssonet al., (1997) also reported that plasma concentration of F> 500 ng/ml (0.5 mg/L) after short term exposure may beconsidered as potentially toxic in lambs. Our toxic levelsare three times higher to the toxic levels observed by the
Kristinsson et al. (1997) in lambs and this may be due theage difference, as the young animals are more susceptibleto fluoride toxicity as compared to adults.
On the other hand, the toxic symptoms were notobserved in group 2 and the plasma fluoride levels increasedsignificantly on different days of exposure, but to a lesserextent as compared to group 1. This may be due to theformation of insoluble complexes by aluminium with thefluoride in the gastrointestinal tract and decreases itsabsorption. Therefore, it could be concluded that thealuminium sulphate has ameliorative effects on the increasein plasma fluoride levels, which is in accordance with thefindings in buffalo calves (Marconi, 2000) and cow calves(Mehra, 1981). In both the groups, the plasma fluoridelevels showed decline on day 21 and 30 as compared today 14 and 28 of exposure, respectively, and this may bedue to manual error in the sampling time or it may be dueto that during those days the body elimination of fluoridewas more. But the levels on day 21 and 30 are very muchsignificantly higher as compared to pre-exposure valuesand they have not showed significant decline on thesedays as compared to the day 14 and 28, respectively.
Fluoride levels and its amelioration in goats
Journal of Veterinary Pharmacology and Toxicology/December 2012/Vol.11/Issue 1-2/33-36 35
Fig. 2.Figure 2. Milk fluoride levels (mg/L) of group 1 and 2 on differentdays of exposure.
Fig. 1.Plasma fluoride levels (mg/L) on different days in group 1 (only NaF)and 2 [NaF along with Al2(SO4)3].

8/13/2019 JVPT-2012_Vol11
http://slidepdf.com/reader/full/jvpt-2012vol11 40/108
The milk fluoride levels were also increased ondifferent days of exposure from pre-exposure levels in boththe groups and the levels were within the ranges reportedby Samal and Naik (1995) in cows (0.19 to 1.15 ppm) andin buffaloes (0.31 to 1.21 ppm). Recording of decreasedmilk yield in present study is in accordance with the findings
in cattle (Murray, 1967; Jones, 1972; Sobocinski et al.,1984). This increase of fluoride levels in milk revealed thatmilk is one of the routes of excretion.
On the basis of results, it could be concludedthat the plasma fluoride level >1.50 ± 0.14 mg/L wasassociated with the clinical symptoms of subacute toxicityof fluoride in goats and aluminium sulphate may beeffectively employed for alleviation of toxic symptoms ofsubacute toxicity of fluoride in goats and also milk is oneof the routes of excretion of fluoride.
ACKNOWLEDGEMENTThe authors are thankful to Vice Chancellor, Sher-
e-Kashmir University of Agriculture Sciences andTechnology, Jammu for providing necessary facilities.
REFERENCES
Aiello, S.E. (1997). The Merck Veterinary Manual, pp.2038-39. 8th edn, Merck and Co. Inc WhitehouseStation, N J, USA.
Banks, R.E. and Goldwhite, H. (1966). Fluoride chemistry.In: Smith FA (Ed) Handbook of ExperimentalPharmacology. Vol. 20 Part 1, pp. 608. New YorkSpringer-Verlag.
Fejerskov, O., Ekstrand, J. and Burt, B.A. (1996). Fluoridein Dentistry. 2nd edn. Copenhagen: Munsksgaard.
Guenter, W. and Hahn, P.H.B. (1986). Fluorine toxicityand laying hen performance. Poult. Sci. 65: 769-778.
Gujarathi, S.R., Singh, B. and Bhikane, A.U. (1991). Effectof acute experimental fluorine poisoning onhematological and biochemical indices in buffalo
36 Journal of Veterinary Pharmacology and Toxicology/December 2012/Vol.11/Issue 1-2/33-36
Kant et al.
calves (Bubalus bubalis ). Ind. J. Vet. Med. 11:80-82.
Jones, W.G. (1972). Fluorosis in dairy herd. Vet. Rec. 90:503-507.
Kristinsson, J., Gunnarson, E., Johannesson, P. andPalsson, P.A. (1997). Experimental fluoride
poisoning in Icelandic sheep. Buvisindi. 11: 107-112.Mehra, U.R. (1981). Effect of ameliorative measures
against fluorosis on certain blood constituents ofcattle. Ind. J. Nutr .Dietet. 18: 372-374.
Marconi, N. (2000). Studies on experimental fluorosis andits amelioration in buffalo M.V.Sc. Thesis, PunjabAgricultural University, Ludhiana, India.
Mellberg, J.R., Ripa, L.W. and Leske, G.S. (1983). Fluoridein Preventive Dentistry. Chicago: QuintessencePublishing.
Murray, M. (1967). Fluorosis in a herd of cattle in Kenya.Bull. Epizoot. Dis. Afr. 15: 259-262.
Samal, U.N. and Naik, B.N. (1995). Fluoride levels in milkand blood serum of cattle. Environ. Ecol. 13: 415-417.
Senedecor, G.W. and Cochran, W.J. (1989). StatisticalMethods, Oxford IBH Co., pp. 61. Bombay.
Sener, Y., Tosun, G., Kahvecioglu, F., Gokalp, A. and Koc,H. (2007). Fluoride levels of human plasma andbreast milk. Eur. J. Dent. 1: 21-24.
Sobocinski, R., Ewy, R. and Ewy, Z. (1984). Ten yearsstudy of fluorosis in cattle. Medyeyna Veterynaria.
40: 67-71.Tiwary, S.N., Singh, C.D.N. and Jha, G.J. (1979).
Pathology of acute fluorine poisoning in sheep.
Ind. Vet. J. 56: 638-640.Whitford, G. (1996). The Metabolism and Toxicity of
Fluoride. 2nd ed. Switzerland: Karger.WHO. (2002). Environmental health criteria, pp. 227.
Geneva.
Received on: 16-03-2012
Accepted on: 22-06-2012

8/13/2019 JVPT-2012_Vol11
http://slidepdf.com/reader/full/jvpt-2012vol11 41/108
Research Article
Deptt. of Pharmacology and Toxicology,College of Veterinary Sciences
Pt. Deen Dayal Upadhyaya Veterinary Science University (DUVASU),Mathura - 281 001 (Uttar Pradesh).*Corresponding author: E-mail: [email protected]
PHARMACOKINETICS OF LEVOFLOXACIN FOLLOWING SUBCUTANEOUS
ADMINISTRATION IN CATTLE CALVES
ARVIND KUMAR, ANU RAHAL*, RAM RAGVENDRA, RAJESH MANDIL, ATUL PRAKASH AND SATISH K. GARG
ABSTRACT
Disposition kinetics of levofloxacin following a single subcutaneous administration was determined in cattle calvesat a dose rate of 10mg/kg body weight. Plasma concentrations of levofloxacin were determined using HPLC assay and weresubjected to compartmental pharmacokinetic analysis using a computer software program ‘Pharmkit’. Following SCadministration of levofloxacin, the peak plasma concentration of approximately 3µg.ml -1 was observed at 1 h. Levofloxacinwas detectable in plasma (0.21±0.05 µg.ml-1) up to 12 h following SC administration. The plasma concentration time data oflevofloxacin for SC route was best conformed to one-compartment open model with first order absorption rate constant.Almost cent percent bioavailability values demonstrated the superiority of subcutaneous route over other nonvascularroutes. Levofloxacin may be administered to cattle calves @ 10 mg/kg body weight and repeated at 24 h interval by SC route
for treating majority of the susceptible microbial infections of veterinary importance.Key words: Cattle calves, pharmacokinetics, subcutaneous.
INTRODUCTIONLevofloxacin, a fluorinated 4-quinolone containing
a six-member (pyridobenzoxazine) ring, is active againstmost aerobic Gram-positive and Gram-negative organismswith moderate activity against anaerobes (Davis andBryson, 1994) and potent bactericidal activity againstorganisms such as Pseudomonas , Enterobacteriaceae and Klebsiella (Klesel et al., 1995). It distributes well totarget tissues and fluids in the respiratory tract, skin,urinary tract, prostate, other soft tissues and its uptakeby cells make it suitable for use against intracellularpathogens. Based on the pharmacological profile,levofloxacin can be a promising tool for the treatment ofbacterial infections in cattle calves which form an importantcomponent of the Indian livestock. In view of easyadministration, slow absorption and maintenance oftherapeutic concentrations for a longer duration, thepresent study was undertaken to determine thepharmacokinetic profile of levofloxacin followingsubcutaneous administration in cattle calves.
MATERIALS AND METHODS
Experimental animals Six healthy female cattle calves, 3-6 months (47-85 kg) old, were quarantined and maintained followingstandard managemental practices and providedconcentrate, green fodder and wheat- straw with ad libitum fresh water at the Dairy Farm of University. The animalswere dewormed using albendazole (5 mg/kg) 21 daysbefore the start of actual experiment. The experimentalprotocol was approved by the Institutional Animal EthicsCommittee (IAEC).
Drugs For preparation of the standard curves of
levofloxacin, pure levofloxacin was purchased from Sigma-Aldrich. Injectable formulation of levofloxacin (Meriflox ® ;Wockhardt Limited., Mumbai) was injected in female cattlecalves in subcutaneous (SC) space on the lateral aspectof neck at the dose rate of 10 mg/kg body weight.Collection of blood samples
Blood samples were collected into heparinisedtubes by jugular venipuncture before drug administrationand at predetermined time intervals i.e. 2.5, 5, 10, 15, 30,45 minutes, 1, 1.5, 2, 3, 4, 6, 8, 12, 18 and 24 hours postdrug administration. The blood samples were centrifugedat 3000 rpm for 20 min to separate plasma which werestored in storage vials at -20°C until further assay.Extraction of levofloxacin from plasma
Extraction of levofloxacin from plasma was carriedout as per the modified method of Neilson and Gyrd-Hansen(1997). Plasma (0.5 ml) was deproteinized by adding of100 µl perchloric acid (0.6M), vortexed at high speed for 1minute and then centrifuged at 10,000×g for 5 min. Theclear supernatant (200 µl) was collected in a
microcentrifuge tube and 100 µl of HPLC grade water wasadded. This mixture was then filtered through Millipore0.22 µm cellulose acetate membrane filter, and an aliquotof 20 µl of the sample was injected into HPLC system foranalysis.Chromatographic conditions
For determination of levofloxacin levels in plasma,modified HPLC method of Gao et al. (2007) was used.The HPLC system (Waters, USA) comprised of two Waters515 HPLC pump, rheodyne manual loop injector with a 20
Journal of Veterinary Pharmacology and Toxicology/December 2012/Vol.11/Issue 1-2/37-40 37

8/13/2019 JVPT-2012_Vol11
http://slidepdf.com/reader/full/jvpt-2012vol11 42/108
µl loop, Waters 2996 photodiode array detector andEmpower software. C18 reverse phase column (particlesize 5 µm; 4.6 x 100 mm, Waters XBridgeTM) was usedas a stationary phase. The mobile phase consisted ofacetonitrile, water, phosphoric acid and triethylamine(16:83:0.6:0.45, v/v/v/v) with pH adjusted to 2.34. The flow
rate was 0.6 ml/min and the run time was 5 min. Thesamples were quantified at a wavelength of 294 nm.Calibration curves
Levofloxacin stock solution (100 µg/ml) wasprepared in 0.1 N NaOH in HPLC grade water. The standardcurve of levofloxacin was prepared from the stock solutionof levofloxacin by diluting with pooled plasma from theuntreated cattle calves. The standard curve of levofloxacinwas linear in the range of 0.05 to 6.4 µg/ml. These methodswere found to be linear and reproducible and the correlationcoefficient (R^2) was 0.999, the intra-day and inter-daycoefficient of variance was less than 5 per cent, meanrecovery was more than 90 per cent. These standard
curves were used for determination of levofloxacinconcentrations in the unknown plasma samples. Cattlecalf blank plasma produced no endogenous interferencesat the retention time of levofloxacin.Pharmacokinetic analysis of data
The plasma levofloxacin concentration time profileof each animal following drug administration were used todetermine the pharmacokinetic variables describing theabsorption, distribution and elimination characteristics incattle calves with the help of a non-linear iterative curvefitting computer programme (Pharmkit) and otherparameters were determined using the equationsdescribed by Gibaldi and Perrier (1982) and Baggot (1977).
The best compartment model was selected on the basisof sum of squares, positive and negative residualscorrelation coefficient values and Akaike Informationcriterion.
The dosage regimens of levofloxacin weresuggested using pharmacokinetic and pharmacodynamicindices of antimicrobial (Walker, 2000; Dudley, 1991).
RESULTS AND DISCUSSIONMean plasma concentrations of levofloxacin at
different time intervals following the drug administrationby subcutaneous route are presented in Fig. 1. Anappreciable and clinically effective concentration oflevofloxacin (1µg.ml-1) in plasma could be detected withinat 0.04 h and the peak plasma concentration oflevofloxacin was observed at 1 h following SCadministration. Levofloxacin could be detected in plasmaup to 12 h after drug administration.
Evaluation of the results of observed plasma levelsof levofloxacin indicated that the data could be best fittedto a one compartment open model with the first orderabsorption and adequately described by the equation:
Cp = Be-βt - A2 e-kat
Where Cp is the plasma concentration oflevofloxacin at time t, A2 and B is zero time plasma drugconcentration intercepts of the disposition curves, Ka andβ are the first order rate constant for absorption andelimination phases, respectively and e is the base of natural
logarithm. The resulting kinetic parameters have beenpresented in Table 1.Following SC injection of levofloxacin, absorption
of the drug was slow perhaps due to low vascularity of thesubcutaneous tissue but elimination was apparently fast.This might be due to the limited entry of the drug to theperipheral compartment due to low initial plasma levels.This contention is also supported by significant reductionin the apparent volume of distribution of levofloxacinfollowing SC administration.
The absorption half-life (t1/2Ka
) following SCadministration was longer (0.75±0.18h) than 0.34±0.07 hin buffalo calves (Ram et al., 2010), thus suggesting
species variation in absorption kinetics. Elimination half-life (t1/2ke) of levofloxacin (2.57±0.29 h) was almostcomparable to that of 3.05±0.17 h in cross bred calves(Kumar et al., 2009), 3.27±0.31 h in buffalo calves (Ramet al., 2008), 3.47±0.86 h in camel (Goudah, 2008) and2.94 ± 0.78 h in stallions (Goudah et al., 2008).
The AUC values are indicative of the systemicbioavailability of the drug. In cattle calves, the AUC values(µg.mL-1h) were higher to that of 21.31 ±1.24 in lactatinggoats (Goudah and Abo-El-Sooud, 2008), 7.66± 0.72 incross bred calves (Dumka and Srivastava, 2006), 8.81 ±
TABLE 1:Pharmacokinetic parameters of levofloxacin following asingle subcutaneous administration at a dose of 10 mg/kgin cattle calves.
Parameters(units) Mean±SE
B’ (µg.mL-1) 8.39± 1.63Ka ( h-1) 1.24± 0.28Ke ( h-1) 0.29± 0.03T
1/2ka(h) 0.75± 0.18
T1/2ke (h) 2.57± 0.29AUC (µg.mL-1 h ) 28.61± 6.40AUMC (µg.mL-1 h2) 93.71±16.19MAT ( h ) 0.59± 0.62MRT ( h ) 3.46±0.39Vd/F (mL.kg-1 ) 1.47±0.20C
max(µg.mL-1) 3.44±0.32
Tmax (h) 1.59±0.29CL/F (mL.kg-1. h-1) 0.41±0.06F (%) 97.50±19.66
B=Zero time intercept of elimination slope in the one compartmentmodel, Ka =absorption rate constant, T1/2Ka = absorption half-life, T1/2e
= elimination half-life, Cl/F = Clearance of drug, Vd/F=Apparent volumeof distribution, AUC = Total area under the concentration time-curve,AUMC = Total area under the first moment concentration time-curve,MRT = Mean residence time, MAT = Mean absorption time, Tmax =time post drug administration at which peak concentration is achieved,Cmax = observed peak plasma concentration, F = bioavailability
Kumar et al.
38 Journal of Veterinary Pharmacology and Toxicology/December 2012/Vol.11/Issue 1-2/37-40

8/13/2019 JVPT-2012_Vol11
http://slidepdf.com/reader/full/jvpt-2012vol11 43/108
0.37 in buffalo calves (Ram et al., 2008) and 13.63±3.11 incamels (Goudah, 2008).
Bioavailability (F) is one of the importantdeterminants of drug therapeutic efficacy. Now a days,subcutaneous route of administration is becoming morepopular in clinical practice for several reasons includingease of administration and the pharmacokinetic variablesafter intramuscular and subcutaneous administration havebeen found to be almost comparable, and even sometimes,slightly better in favour of SC route. Therefore, subcutaneousroute should be preferred over the intramuscular route forbetter availability, ease of administration and being lesspainful to the animal. In the present study, The overallbioavailability (calculated on the basis of IV data beingpublished elsewhere) was much higher and was almost100 % following SC administration . Lower bioavailabilityvalues have been reported in calves (44.3-56.6%) in earlierstudies (Ram et al., 2010; Dumka and Srivastava, 2006).Cent percent bioavailability along with lower Vd
area values
implies that minimal amount of the drug reaches the sink/ reservoir and more of the levofloxacin remains available tothe central compartment for exerting the antibacterial actionin the body following the SC route of administration.
Due to concentration–dependent bactericidal andpost-antibiotic effect of fluoroquinolones (Castelli et al.,
1989), blood concentrations of these drugs are not requiredto be maintained above the minimum inhibitoryconcentration values throughout the duration of therapy. Ithas been established that for concentration dependentfloroquinolones, the AUC/MIC ratio is the most importantpredictor of efficacy with a clinical cure rate greater than80% when this ratio is higher than 100-125 (Lode et al.,1998). A second predictor of efficacy for concentration-dependent antibiotics is the Cmax /MIC ratio, consideringthat values>10 lead to better clinical results (Toutain et
al., 2002). High Cmax /MIC values are necessary in order toavoid the emergence of bacterial resistance (Walker,2000). The critical breakpoints that determine the efficacyof floroquinolones are suggested as C
max /MIC >10 and
AUC/MIC> 125 (Toutain et al., 2002; Walker, 2000). TheMIC of levofloxacin has not yet been determined for bacteria
isolated from cattle calves. To cover most of the susceptibleorganism, in the cattle population, the MIC90 of 0.06 to0.12 µg/ml of levofloxacin has been taken into consideration(Marshall and Jones, 1993). Based on the pharmacokineticdata generated in this study and taking the extremes ofMIC
90as 0.06-0.12µg.ml -1, a dosage of 10 mg/kg
levofloxacin SC in cattle calves would result in followingAUC/MIC and C
max /MIC ratios in the range of 238.4-476.8
and 28.7-57.3 for SC administration.Based on the calculated C
max /MIC and AUC/MIC,
a levofloxacin dose of 10 mg/kg once daily can effectivelybe used by subcutaneous route of administration.Considering the first pharmacodynamic index and
bioavailability, the subcutaneous route is almost at parwith the intravenous administration. So, taking into theaccount the advantages of subcutaneous administration,it may be proposed that levofloxacin be preferentially usedby subcutaneous route of administration at a dose of10mg.kg-1 repeated at 24h intervals.
REFERENCESBaggot, J. D. (1977). Principles of drug disposition in
domestic animals. The basis of veterinary clinicalpharmacology. Ist Edn., W.B. Saunders Co.,Philadelphia, U. S.A. pp.144-189.
Castelli, M., Bertolini, A., Baggis, G., Aresca, P., Bossa,
R. and Galatulas, I. (1989). Bactericidal andcytotoxic effects of combination of norfloxacin and5-fluorouracil. Anticancer Res . 9: 49-52.
Davis, R. and Bryson, H. M. (1994). Levofloxacin. A reviewof its antibacterial activity, pharmacokinetics andtherapeutic efficacy. Drugs. 47(4): 677-700.
Dudley, M. N. (1991). Pharmacodynamics andpharmacokinetics of antibiotics with specialreference the fluoroquinolones. American J. Med.
91 (Suppl 6A): 45-50.Dumka, V. K. and Srivastava, A. K. (2006).
Pharmacokinetics, urinary excretion and dosing
regimen of levofloxacin following a single intramuscular administration in cross bred calves.
J. Vet. Sci. 7(4): 333-337.Gao, X., Yao, G., Guo, N., An, F. and Guo, X. (2007). A
simple and rapid high performance liquidchromatography method to determine levofloxacinin human plasma and its use in a bioequivalencestudy. Drug Discovery and Therap. 1(2): 136-140.
Gibaldi, M. and Perrier, D. 1982. Pharmacokinetics, 2nd
Edn. Marcel Dekker Inc. New York.
kinetics of levofloxacin in calves
Journal of Veterinary Pharmacology and Toxicology/December 2012/Vol.11/Issue 1-2/37-40 39

8/13/2019 JVPT-2012_Vol11
http://slidepdf.com/reader/full/jvpt-2012vol11 44/108
Goudah, A. (2008). Pharmacokinetics of levofloxacin inmale camels (Camelus dromedarius ). J Vet.
Pharmacol. Therap. 32: 296-299.Goudah, A. and Abo-El-Sooud, K. (2008).
Pharmacokinetics, urinary excretion and milkpenetration of levofloxacin in lactating goats. J.
Vet. Pharmacol. Therap. 32: 101-104.Goudah, A., Abo El-Sooud, K., Shim, J. H., Shin, H. C.and Abd El-Aty, A.M. (2008). Characterization ofthe pharmacokinetic disposition of levofloxacin installions after intravenous and intramuscularadministration. J. Vet. Pharmacol. Ther . 31 (5):399-405.
Klesel, N., Geweniger, K. H., Koletzki, P., Isert, D.,Limbert, M., Markus, A., Riess, G., Schramm, H.and Iyer, P. (1995). Chemotherapeutic activity oflevofloxacin (HR 355, DR 3355) against systemicand localized infections in laboratory animals. J.
Antimicrob. Chemother. 35: 805-819.
Kumar, S., Kumar, S., Kumar, V., Singh, K.K. and Roy,B. K. (2009). Pharmacokinetic studies oflevofloxacin after oral administration in healthy andfebrile cow calves. Vet. Res. Commun. DOI10.1007/s 11259-009-9237-0.
Lode, H., Borner, K. and Koeppe, P. (1998).Pharmacodynamics of fluoroquinolones. Clinical Infect. Dis. 27: 33-39.
Marshall, S.A. and Jones, R.N. (1993). In vitro activity ofDU-6859a, a new florocyclopropyl quinolone.Antimicrobial Agents and Chemotherapy 37: 2747-2753.
Nielsen, P. and Gyrd-Hansen, N. (1997). Bioavailability ofenrofloxacin after oral administration to fed and
fasted pigs. Pharmacology and Toxicology 80:246–250.Ram, D., Dumka, V.K., Sandhu, H.S. and Raipuria, M.
(2010). Pharmacokinetics and dosage regimenof levofloxacin in buffalo calves after singlesubcutaneous administration. Vet. Arhiv 80 (2):
195-203.Ram, D., Dumka, V.K., Sharma, S.K. and Sandhu, H.S.
(2008). Pharmacokinetics, dosage regimen andin vitro plasma protein binding of intramuscularlevofloxacin in buffalo calves. Iranian Journal of Veterinary Resarch, Shiraz University 9(2): 23.
Toutain, P. L., Del Castillom J. R. E. and Bousquet-Melou
A. (2002). The pharmacokinetic pharmaco-dynamic approach to a rational dosage regimenfor antibiotics. Res Vet Sci 73: 105-114.
Walker, R. D. (2000). The use of Fluoroquinolones forcompanion animal antimicrobial therapy.Australian Veterinary Journal. 78: 84–90.
Received on: 12-1-2012 Accepted on: 23-3-2012
Kumar et al.
40 Journal of Veterinary Pharmacology and Toxicology/December 2012/Vol.11/Issue 1-2/37-40

8/13/2019 JVPT-2012_Vol11
http://slidepdf.com/reader/full/jvpt-2012vol11 45/108
Research Article
Department of Veterinary Pharmacology and Toxicology
College of Veterinary Science, Assam Agricultural University, Khanapara ,Guwahati -781 022, India*Corresponding author: Email: [email protected]
PHARMACOKINETICS OF PEFLOXACIN IN E.COLI (K88
STRAIN)
ENDOTOXIN INDUCED FEBRILE GOATS
A. K. NATH, R.K.ROY, D.C.ROY* AND R. GOGOI
ABSTRACT
The present investigation was carried out to determine the disposition kinetics of pefloxacin in endotoxin inducedfebrile goats. Six clinically healthy male local goat of Assam were taken for the study. Pefloxacin (5mg/kg) was administeredas single i.v. dose. Fever was induced experimentally by i.v administration of E.coli (K88 strain) endotoxin solution at a doserate of 0.25 µg/Kg body weight. Fever condition decreased the therapeutic persistence of pefloxacin in plasma from 600 min(10h) to 480 min (8h). Induced fever increased the values of Cp
0, ClB, β, α, Kel and T/C ratio but lowered the values of t½α, t½β,AUC and V
d(area) of pefloxacin. The T/C ratio was higher in febrile (3.81) than afebrile (3.23) goats which indicated an increase
in distribution of pefloxacin into extravascular tissues.
Key words: Assam, endotoxin, goat, kinetics, pefloxacin.
INTRODUCTIONPefloxacin is a fluoroquinolone antimicrobial agent
used against wide range of both gram positive and gramnegative microorganisms. Although a few of studies onpharmacokinetics of pefloxacin in cattle (Patil etal ., 1996),sheep (Moutafchiva and Djouvinov, 1997), goat (Roy et al.,1997; Malik et al., 2002) are available yet the reports ofits disposition kinetics during febrile condition are scarcelyavailable. Therefore, the present study was undertaken toinvestigate disposition kinetics of pefloxacin in both afebrileand endotoxin induced febrile state of local goat of Assam.
MATERIALS AND METHODSExperimental animals
Six clinically healthy male local goats of Assam,weighing between 9.2 to 11.7 kg of 8 to 9 months old wereused for the study. The animals were procured locally,housed in the departmental animal shed, dewormed andacclimatized for 15 days prior to the start of the experiment.The animals were maintained on grazing, concentrate andgram feeding and water ad libitum . The same animalswere used in cross over design to study both febrile andafebrile condition but not earlier than a gap period of two
weeks of the last administered dose.Experimental design Pefloxacin (5mg/kg) was administered as single
i.v. dose into the right jugular vein of healthy goats. Priorto the i.v. injection of pefloxacin, a blood sample (2.5ml)was collected in a dried heparinised (0.2mg/ml blood) testtube which was considered as blank. Similar samples (2.5ml) from each animal were collected in heparinised testtubes by left jugular vein puncture after pefloxacinadministration at 2, 5, 10, 20, 30, 45, 60, 120, 240, 360,
480, 600 and 720 min.For febrile condition, fever was induced
experimentally by i.v administration of E.coli (K88strain)
endotoxin solution at a dose rate of 0.25 µg/kg body weight.Pefloxacin was given intravenously after 1h of endotoxinadministration through right jugular vein. Blood sampleswere collected prior to and after administration of pefloxacinat different predetermined time intervals as mentionedabove.
The plasma fractions were separated bycentrifugation (3000 rpm for 30 min) and stored at –5 0Cuntil analysed within 24h. For quantitative determinationof pefloxacin concentration in plasma, thespectrophotometric method as described by Jha et al.
(1996) was followed. Plasma pefloxacin concentrationversus time profile of each goat was used to calculate thevarious pharmacokinetic determinants of pefloxacin, usingthe methods of Gibaldi and Perrier (1982).
RESULTS AND DISCUSSIONThe plasma concentrations of pefloxacin persisted
in afebrile and febrile goats till 10h (0.80±0.04µg/ml) and8h (0.82±0.04µg/ml) of post administration, respectively.
Mean plasma concentrations were plotted on asemilogarithmic scale as a function of time, exhibiteddistinct distribution and elimination phases. Initially thepefloxacin concentration declined rapidly followed by aslow disappearance, indicating that data could be bestdescribed by a two compartment open model inconsonance with the first order kinetics. Pefloxacin hasbeen reported to follow two compartment open model incows (Patil et al., 1996), sheep (Moutafchiva and Djouvinov,1997), goats (Roy et al., 1997). The various
Journal of Veterinary Pharmacology and Toxicology/December 2012/Vol.11/Issue 1-2/41-42 41

8/13/2019 JVPT-2012_Vol11
http://slidepdf.com/reader/full/jvpt-2012vol11 46/108
pharmacokinetic determinants (Mean ± SE) of afebrile andfebrile goats were calculated with standard proceduresand are presented in Table 1.
Fever altered pharmacokinetic determinants ofpefloxacin. The mean zero time plasma concentration of
pefloxacin in febrile goat was 20 percent higher than inafebrile one. A similar observation was made by Jha andco-workers (1996) using norfloxacin in goats. On thecontrary, lower oxytetracycline plasma concentrations werereported in febrile goats (48.30 ±1.60µg/ml) than in afebrileone (83.60±0.80 µg/ml. Manna et al., 1993).
Induced fever increased the values of total bodyclearance, elimination rate constant, distribution rateconstant and the ratio of T/C and K
12 /K
21. This results in
corresponding lower values of t½α , t
½α, AUC and t
½kel.
This indicates that pefloxacin persisted in plasma for ashorter period of time in febrile goats than in afebrile one.A significant increase in AUC value but decrease in Cl
Bvalue of norfloxacin was observed by Jha et al. (1996).Fever caused shorter persistence of pefloxacin in
plasma. Fever alters the physiological status of the bodyby increasing the basal metabolic rate, heart rate and bloodflow to both kidney and liver and consequently glomerularfiltration rate (GFR) (Miert et al.,1976). So there is apossibility of rapid excretion of pefloxacin through urine
and bile, leading to lesser persistence of pefloxacin inplasma in febrile goats.
It is concluded from this investigation that febilecondition decreased the therapeutic persistence ofpefloxacin in plasma from 600 min (10h) to 480 min (8h) inafebrile goats than healthy one. Induced fever increased
the values of Cp
0
, ClB, β, α, Kel and T/C ratio but loweredthe values of t½α, t½β, AUC and Vd(area) of pefloxacin. The
high T/C ratio indicated its higher distribution inextravascular tissues in febrile (3.81) than afebrile (3.23)goats.
ACKNOWLEDGEMENTAuthors are thankful to the Dean, Faculty of
Veterinary Science and Head, Department. ofPharmacology and Toxicology, AAU, Khanapara, Guwahati-781 022 for providing necessary facilities.
REFERENCES
Gibaldi, M. and Perrier, D. (1982). Pharmacokinetics.2nd
edn.Marcel Dekker Inc. New York.Jha, K., Roy, B.K. and Singh, R.C.P. (1996). The effect of
induced fever on the bio-kinetics of Norfloxacinand its interaction with Probenecid in Goats. Vet.Res. Commun . 20: 473.
Malik, J.K., Rao, G.S., Ramesh, S., Muruganandan, S.,Tripathi, H.C. and Schukla, D.C. (2002).Pharmacokinetics of Pefloxacin in Goats afterintravenous or oral administration. Vet Res Commun.26:141.
Manna, S., Mandal, T.K. and Chakravarty, A.K. (1993).Modification of disposition kinetics of
oxytetracycline by paracetamol and endotoxininduced fever in goats. Indian J.Pharmacol . 25:199.
Miert, Van A.S.J.P.A.M., Gogh, Van H. and Wit, J.G.(1976).The influence of pyrogen induced fever onabsorption of sulpha drugs. Vet.Rec .11:480.
Moutafchiva, R. and Djouvinov, D. (1997).Pharmacokinetics of pefloxacin in sheep. J.Vet.Pharmacol. Therap . 20: 405.
Patil, R.V., Gatne, M.M., Somkuwar, A.P. and Ranade,V.V. (1996). Pharma-cokinetics of milk conc. ofpefloxacin injection (pelwin) in lactating cows.
Indian vet. J. 73: 1130.Roy, B.K., Pandey, S.N., Sinha, K.P., Thakur, D.K. andSingh, K.K. (1997). Pharmacokinetics ofPefloxacin in Goats. Indian J. Pharmacol . 29 :435.
Received on: 11-12-2011Accepted on: 22-02-2012
TABLE 1:Pharmacokinetic determinants of pefloxacin in
afebrile and febrile goats following a singleintravenous dose of 5mg/kg body weight (Mean±SE).
Determinants Afebrile febrile
C0P (µg/ml) 25.14 ± 1.52 30.03 ± 1.46
A (µg/ml) 19.63 ± 1.37 24.41 ± 1.23α (min-1) 0.2652 ± 0.0212 0.3195 ± 0.0204t½α (min) 2.70 ± 0.23 2.21 ± 0.15B (µg/ml) 5.51 ± 0.18 5.61 ± 0.25β (min-1) 0.0049 ± 0.0002 0.0080 ± 0.0004t½β (min) 140.27 ± 5.98 87.98 ± 5.06AUC (µg.min/ml) 1194.73 ± 76.09 781.67 ± 17.29Vd(area) (L/kg) 0.8528 ± 0.0248 0.8095 ± 0.0359Vc (L/kg) 0.216 ± 0.022 0.168 ± 0.008Kel (min-1) 0.0210 ± 0.0005 0.0385 ± 0.0023t½kel (min) 33.04 ± 0.7987 18.69 ± 1.23K12 /K21 (ratio) 2.97 ± 0.17 3.35 ± 0.07Cl
B (ml-1.kg-1.min) 4.27 ± 0.26 6.41 ± 0.13
T/C (ratio) 3.23 ± 0.17 3.81 ± 0.09
A= zero time intercept of distribution phase; B = zero time interceptof elimination phase; α = Distribution/absorption rate constant; β =Elimination rate constant; t
½α = Distribution/absorption half life;
t½β=Elimination half life; Vd
area= Apparent volume of distribution; Cl
B=
Total body clearance, AUC = Total area under the time concentrationcurve, C0
P = Zero time plasma concentration, MRT = Mean residence
time.
Nath et al.
42 Journal of Veterinary Pharmacology and Toxicology/December 2012/Vol.11/Issue 1-2/41-42

8/13/2019 JVPT-2012_Vol11
http://slidepdf.com/reader/full/jvpt-2012vol11 47/108
Research Article
Department of Pharmacology and Toxicology, LLR University of Veterinary and Animal Sciences
Hisar - 125 004, Haryana, India*Corresponding author e-mail: [email protected]
ACUTE TOXICITY AND NEUROBEHAVIOURAL EFFECTS OF
ACETAMIPRID IN MICE
V. KARTHIKEYAN, S. K. JAIN* AND J. S. PUNIA
ABSTRACT
The maximum tolerated dose of acetamiprid, a pyridyl methylamine nicotinoid insecticide was found to be 46 mg/ kg, i.p. in Swiss albino male mice by conducting pilot dose range finding studies. Various gross behavioural profiles viz.spontaneous motor activity, forced locomotor activity, cocaine induced locomotor activity and amphetamine induced locomotoractivity were deteimined. Acetamiprid decreased spontaneous motor activity and forced locomotor activity in dose dependentmanner and antagonized cocaine and amphetamine induced locomotor behaviour. The findings indicated that acetamipridalters the normal behaviour of mice having moderate toxic potential in mice.
Key words: Acetamiprid, amphetamine, mice, neurobehaviour.
INTRODUCTIONAcetamiprid, pyridyl methylamine is a new
nicotinoid insecticide that has been recently introducedfor use. It acts in a different manner by mimicingacetylcholine and induces abnormal excitement in theinsect by interrupting the normal synaptic transmission,consequently to excitation and paralysis followed by deathof the insects (Bai et al., 1991). Acetamiprid is highlyselective and provides outstanding control over suckingpests such as aphids and white flies in vegetables.Especially, it has shown excellent activity against peachfruit moth, and apple leaf miners, and citrus leaf minersand highly effective for flea control in cats and dogs(Tomizawa and Casida, 2005). Therefore, this compoundis widely used in agricultural practices and thus there aremore chances that the persons handling it or animals mayaccidentally come in contact with this compound fromrecently applied fields or through its residues leading totoxicity.
The purpose of studying acute toxicity is to obtaininformation on the biologic activity of a chemical and gaininsight into its mechanism of action. Behaviour is the finalintegrated expression of nervous function. Locomotoractivity has been suggested as behavioural endpoint(Lawrence, 1978). Therefore, the present study was
undertaken to investigate the acute toxicity andneurobehavioural changes induced by acetamiprid in mice.
MATERIALS AND METHODSExperimental design
Swiss albino male mice weighing 20-25g wereprocured from Disease Free Small Animal House, LLRUniversity of Veterinary And Animal Sciences, Hisar andhoused in the polyacrylic cages in groups of six animalsper cage and maintained at room temperature with a natural
light-dark cycle. The animals were provided feed and waterad libitum . All the experiments were conducted in noisefree laboratory conditions. The prior approval of InstitutionalAnimal Ethical Committee for the protocol of this studywas obtained. Technical grade Acetamiprid was procuredfrom Topical Agrosystem (India) Pvt. Limited, Chennai.Maximum tolerated dose
Maximal tolerated dose (MTD) of acetamiprid byintraperitoneal route was determined conducting pilot doserange findings studies. Small groups of animals (n=6/dose)were administered a single dose of acetamiprid andobservations were recorded at various time intervals. Arange of doses was used initially, including a few lethaldoses and then several iterations were selected todetermine dose that would produce clear signs of toxicitybut not result in lethality.Gross observable behaviour
The effect of acetamiprid on gross observablebehavioural profiles was studied using Irwin schedule asdescribed by Turner (1965). The mice were distributedrandomly in 3 groups (n = 6). The control group wasadministered 10 ml/kg of gum acacia solution (2%) andtreatment groups received acetamiprid at the dose rate of1/5 th or 2/5 th of MTD i.p. The procedure involvedmanipulative phase in which animals were subjected to
least provoking stimuli. Animals were observed forbehavioural activity profiles at various time intervals (2,10, 20, 40, 60, 120, 240, 360 and 1440 min) and scoreswere assigned as per Irwin schedule as described by Turner(1965).Spontaneous motor activity (SMA)
It is a measure of exploratory behaviour of animal.The SMA was monitored using a Any-Maze AdvancedVideo Tracking Software of Stoelting Co., USA forbehavioural experiments. This tracks the animal
Journal of Veterinary Pharmacology and Toxicology/December 2012/Vol.11/Issue 1-2/43-49 43

8/13/2019 JVPT-2012_Vol11
http://slidepdf.com/reader/full/jvpt-2012vol11 48/108
movements according to the manual setting. Animals weredivided randomly in three groups of six animals each.Control group received 10 ml/kg of gum acacia solution(2%), while treatment groups received 1/5th or 2/5th of MTDof acetamiprid i.p. Immediately after the treatment, animalswere placed in a cage with suitable background to allow
clearly visibility of the animals. Each animal was recordedfor about 4 to 5 minutes and Any-Maze was set to trackthe animal for 250 seconds each and record variouscomponents of locomotor behaviour viz. total distancetravelled (m), total distance travelled by animal head (m),average speed (m/s), total time mobile (s), total timeimmobile (s), total mobile episodes, total immobileepisodes, maximum speed (m/s), rotations of animal body,path efficiency.Forced locomotor activity
It is a measure of strength and co-ordinatedmovements of animal. The effect of acetamiprid on forcedlocomotor activity (FLA) was studied using rota rod
(Acceler, Rota rod 7750, UGO Basile, Italy) as describedby Dunham and Miya (1957). The mice were randomlydivided in three groups of six animals each and trained toremain on the horizontal rod of rota rod apparatus rotatingat twenty five revolutions per minute. As soon as mice felloff the rota rod, they were immediately placed back onthe rod. The training session was terminated when miceremained on the rod continuously for two minutes. Nextday, the effect of acetamiprid was studied thirty min afterthe treatment. Control group received 10 ml/kg of gumacacia solution (2%), while treatment groups received 1/ 5th or 2/5th of MTD of acetamiprid i.p. Thirty min after thetreatment, the mice were given three consecutive trials of
two min each on the rota rod. The cumulated time spenton the rota rod was recorded.Cocaine induced increased locomotor activity
The effect of acetamiprid on cocaine inducedincreased locomotor activity was studied in mice. Micewere randomly divided in three groups each having sixanimals. Control group received 10ml/kg of gum acaciasolution (2%), while treatment groups received 1/5 th or 2/ 5th of MTD of acetamiprid i.p. thirty min prior to cocaine(15.0 mg/kg, s.c.) administration. Then the animals wereobserved for various components of locomotor behaviourusing Any- maze Advanced Video Tracking software forbehavioural experiments.Amphetamine induced increased locomotor activity
Mice were randomly divided in three groups eachhaving five animals. Control group received 10 ml/kg ofgum acacia solution (2%), while treatment groups received1/5th or 2/5th of MTD of acetamiprid i.p. thirty min prior toamphetamine (0.7 mg/kg, s.c,) administration. Thenanimals were observed for various components oflocomotor behaviour using Any - maze Advanced VideoTracking software for behavioural experiments.
RESULTSVarious iterations of acetamiprid (50, 48, 46, 44,
42, 40 mg/kg, i.p.) were used while determining themaximum tolerated dose and was determined to be 46mg/kg by intraperitoneal route in adult Swiss albino malemice. It produced dose dependent onset and severity of
toxic symptoms in mice. The major gross observablesymptoms induced by acetamiprid were decrease inalertness and grooming, continued restlessness, ataxia,tremors, complete change in body and limb posture. Athigher dose (50 mg/kg), animals also showed writhing andexophthalmia. In some animals open mouth breathing andvocalization was observed. In terminal stage, some animalsshowed clonic convulsions followed by tonic extension ofhind limbs before death. However, stereotypy and straubtail were not observed in mice at any of the dose levelsused in the study.
Mice started showing symptoms of toxicity asearly as 5 to 10 min following i.p. administration of
acetamiprid. Mortality, if any, was recorded in 30 min upto 90 min. Animals which showed severe sign andsymptoms for more than 2 h, survived and slowly becamenormal.
Effects of 9.2 mg/kg and 18.4 mg/kg (1/5th and 2/ 5th of MTD), i.p. of acetamiprid were observed and grossobservable behavioural profiles were noted. The treatedanimals did not show significant change in behaviouralprofiles at any dose level either by manipulating or withoutmanipulating the animal (Tables 1 and 2). The time of onset,peak effect and duration of acetamiprid effect in treatedmice was found to be 5 -10 min, 20-30 min and 2 h,respectively.
Acetamiprid decreased the spontaneous motoractivity in mice. Various components of locomotorbehaviour were affected by both lower (9.2 mg/kg) andhigher (18.4 mg/kg), i.p. dose levels of acetamiprid ( Table3, Fig. 1 and 2). Forced locomotor activity was alsodecreased at both the doses (Table 4).
Acetamiprid antagonised the cocaine andamphetamine induced effect on various components oflocomotor behaviour in a dose dependent manner (Tables5 and 6, Fig. 3 and 4). However, the antagonistic effectwas significant for cocaine induced behaviour.
DISCUSSION
The rapid absorption of acetamiprid from theperitoneum of mice probably resulted in the rapid onset ofsevere toxic symptoms in mice and death occurred dueto respiratory failure. It has been reported that inimidacloprid toxicity, respiratory failure in mice might bedue to both central paralysis and peripheral blockade ofmuscles of respiration (Hardman et al., 1996). Variousgross observable sign and symptoms produced byacetamiprid in mice viz. decrease in alertness,
44 Journal of Veterinary Pharmacology and Toxicology/December 2012/Vol.11/Issue 1-2/43-49
Karthikeyan et al.

8/13/2019 JVPT-2012_Vol11
http://slidepdf.com/reader/full/jvpt-2012vol11 49/108
Fig. 1: Track plots showing the position of the centre of the animal –SMA
Journal of Veterinary Pharmacology and Toxicology/December 2012/Vol.11/Issue 1-2/43-49 45
Behavioural effect f acetamiprid
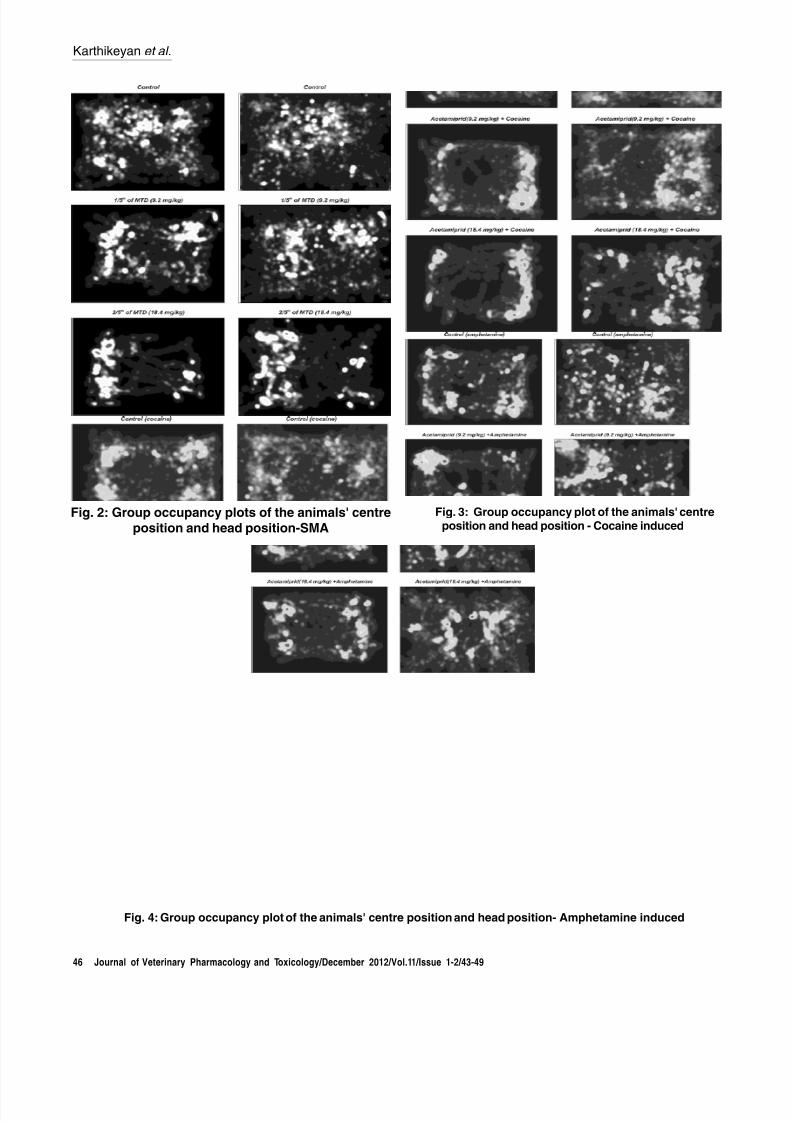
8/13/2019 JVPT-2012_Vol11
http://slidepdf.com/reader/full/jvpt-2012vol11 50/108
Fig. 3: Group occupancy plot of the animals' centreposition and head position - Cocaine induced
Fig. 2: Group occupancy plots of the animals' centre
position and head position-SMA
Fig. 4: Group occupancy plot of the animals' centre position and head position- Amphetamine induced
46 Journal of Veterinary Pharmacology and Toxicology/December 2012/Vol.11/Issue 1-2/43-49
Karthikeyan et al.

8/13/2019 JVPT-2012_Vol11
http://slidepdf.com/reader/full/jvpt-2012vol11 51/108

8/13/2019 JVPT-2012_Vol11
http://slidepdf.com/reader/full/jvpt-2012vol11 52/108
Karthikeyan et al.
TABLE 3:Effect of acetamiprid on spontaneous motor activity (SMA) in mice.
Components Dose (mg/kg, i.p.)
Control 1/5th of MTD (9.2) 2/5th of MTD (18.4)
Total distance travelled (m) 3.39±0.61 2.12±0.58 1.32±0.43Total distance travelled by animal head (m) 6.67±1.06 4.32±0.43 2.29±0.35Average speed (m/s) 0.01±0.00 0.00±0.00 0.00±0.00
Total time mobile (s) 235.55±11.84A 188.23±18.49A 143.53±18.35B
Total time immobile (s) 2.37±2.37B 61.77±18.49A 102.32±17.34A
Total mobile episodes 1.17±0.17B 3.83±0.91A 4.50±0.50A
Total immobile episodes 0.17±0.17B 3.00±0.89A 4.00±0.68A
Maximum speed (m/s) 0.18±0.03 0.25±0.12 0.15±0.04Rotations of animal body 6.17±0.75A 5.00±1.03A 2.17±0.98B
Path efficiency 0.04±0.01 0.04±0.00 0.05±0.02
Values are Mean±SEM of six observations and means bearing different superscripts differ significantly (P<0.05).
TABLE 4:Effect of acetamiprid on forced locomotor activity
Dose (mg/kg, i.p.) Time (sec) spent on rotarod
Control 113.86±4.64A
9.2 78.59±19.60B
18.4 41.99±8.08C
Values are Mean±SEM of six observations and means bearing different superscripts differ significantly (P<0.05).
TABLE 5:Effect of acetamiprid on cocaine (15 mg/kg, s.c.) induced locomotor activity
Components Dose (mg/kg, i.p.)
Control (cocaine) 1/5th of MTD+cocaine 2/5th of MTD+cocaine
Total distance travelled (m) 9.58±2.19A 7.72±1.70A 2.04±0.90B
Total distance travelled by animal head (m) 17.59±3.01A 15.79±4.05A 4.78±1.15B
Average speed (m/s) 0.04±0.00A 0.03±0.00A 0.00±0.00B
Total time mobile (s) 228.46±14.65A 202.40±19.88A 142.66±21.52B
Total time immobile (s) 8.86±0.86B 47.24±19.68B 107.36±21.51A
Total mobile episodes 1.60±0.60B 3.20±0.86B 4.80±0.80A
Total immobile episodes 0.60±0.60B 2.20±0.86B 3.80±0.80A
Maximum speed (m/s) 0.31±0.06 0.53±0.23 0.22±0.06
Rotations of animal body 14.20±4.55A 6.20±1.85A 2.20±0.58B
Path efficiency 0.03±0.01B 0.04±0.00B 0.09±0.02A
Values are Mean±SEM of six observations and means bearing different superscripts differ significantly (P<0.05).
TABLE 6:Effect of acetamiprid on amphetamine (0.7 mg/kg, s.c) induced locomotor activity.
Components Dose (mg/kg, i.p.)
Control(amphetamine) 1/5th of MTD+ amphetamine 2/5th of MTD+ amphetamine
Total distance travelled (m) 2.17±0.53 1.70±0.37 2.09±0.28Total distance travelled by animal head (m) 5.19±1.03 4.16±0.63 4.69±0.49Average speed (m/s) 0.00±0.00 0.00±0.00 0.00±0.00Total time mobile (s) 175.12±16.01 150.22±5.68 162.70±10.62Total time immobile (s) 73.94±16.37 99.20±12.20 87.02±10.84Total mobile episodes 4.80±0.37 4.00±0.71 4.80±0.73
Total immobile episodes 3.80±0.37 3.60±0.51 3.80±0.73Maximum speed (m/s) 0.20±0.03 0.16±0.02 0.15±0.01Rotations of animal body 4.00±2.00 3.40±1.17 4.00±0.45Path efficiency 0.07±0.02 0.07±0.01 0.03±0.01
Values are Mean±SEM of six observations
restlessness, ataxia, tremor and convulsions could be dueto the agonist action of acetamiprid on nAChR or due todirect action on autonomic ganglia or neuromuscular
junction. Tomizawa and Casida (2005) reported that themammalian toxicity of neonicotinoids is centrally mediated
since the symptoms of poisoning are similar to that ofnicotine and agonist action in the vertebrate α
4β
2 nAChR,the primary target in brain. Except urination, no muscariniceffect was observed in mice indicating that acetamiprid isnot active on the atropine blocking sites and urination might
48 Journal of Veterinary Pharmacology and Toxicology/December 2012/Vol.11/Issue 1-2/43-49

8/13/2019 JVPT-2012_Vol11
http://slidepdf.com/reader/full/jvpt-2012vol11 53/108
be probably due to irritation in the urinary tract caused byacetamiprid. Exophthalmia in mice could be due tosympathetic stimulation by direct acting action onautonomic ganglia and writhing due to irritation to tissuesor stimulation of the sensory receptors.
Activation of mesencephalic dopamine pathway
results in increase in locomotor activity ( Robbins andEveritt, 1982). Disruption of normal activity of dopaminecells in the ventral tegmental area or substantia nigra,with lesions or pharmacological manipulation, can inhibitlocomotor activity ( Koob et al ,. 1981). Nicotine is knownto pass through the blood brain barrier readily (Oldendorf,1971). Acute administration of nicotine activates thecortical region and diminishes locomotor activity in animals(Schechter and Rosecrans, 1972). Similar motorincoordination and decrease in SMA have been reportedin isoproturon toxicity in mice ( Sarkar, 1990) suggestingthat reduction in spontaneous motor activity and effect onmotor coordination may be through involvement of distinct
inhibitory action on motor performances.Administration of cocaine leads to increasedambulatory activity and dopaminergic system plays animportant role in mediating the ambulatory and rewardingactivities of cocaine (Roy et al., 1978). One of the neuralsubstrate mediating these ambulation-accelerationactivities of cocaine like psychostimulants as well asamphetamine is increase in the dopamine level in nucleusaccumbens ( Bradberry and Roth, 1989; Kuczenski andSegal, 1989). Therefore, phenomenon of enhancement ofdopamine receptor sensitivity can be regarded as a kindof possible mechanism of behaviour sensitization topsychomotor stimulatory drugs. Acetamiprid acts on
nicotinic receptors in insects. Nicotine is known topotentiate the effect of amphetamine induced behaviour (Bhatwadekar et al., 1999) and has been attributed todopamine releasing effect of nicotine. However, in thepresent study, acetamiprid produced antagonistic effectindicating that it did not behave exactly like nicotine inmammals.
The results of this study suggested thatacetamiprid alters the normal behaviour of mice and alsodoes not behave exactly like nicotine in mice having toxicpotential and is a moderate risk insecticide.
REFERENCES
Bai, D., Lummis, S.C.R., Leicht, H.W., Breer and Sattelle,D.B. (1991). Actions of imidacloprid and relatednitromethylene on cholinergic receptors of anidentified insect motor neuron. Journal of Pesticide
science . 33: 197-204.Bhatwadekar, N.A., Logade, N.A., Shirsat, A.M., Kasture,
V.S. and Kasture, S.B. (1999). Effect of nicotineon behaviour mediated via monoamineneurotransmitters. Indian Journal of Pharmacology .
31: 410-415.Bradberry, C.W. and Roth, R.H. (1989). Cocaine increases
extracellular dopamine in rat nucleus accumbensand ventral tegmental area as shown by in vivo microdialysis. Neuroscience Letters . 103: 97-102.
Dunham, M.W. and Miya, T.S. (1957). A note on simple
apparatus for detecting neurological deficit in ratsand mice. Journal of the American Pharmacist
Association . 46: 208-209Hardman. G.L., Limbird, L.E., Molinoof, P.B., Ruddon, R.W.
and Gilman, A.G. (1996). Goodman and Gilman’sThe Pharmacological basis of therapeutics. 9th ed.McGraw-Hill, New York.
Koob, G.F., Stinus, L. And Lemoal, M. (1981). Hyperactivityand hypoactivity produced by lesions to themesolimbic dopamine system. Behavioural Brain Research . 3:341-359.
Kuczenski, R. and Segal, D. (1989). Concomitantcharacterisation of behavioural and striatal
neurotransmitter response to amphetamine usingin vivo microdialysis. Journal of Neuroscience. 372:21-30.
Lawrence, R. (1978). Use of activity measures inbehavioural toxicology. Environmental Health
Perspective . 26: 9-20.Oldendorf, W. (1971). Brain uptake of metabolites and
drugs following carotid arterial injections.Transactions of the American neurological Association. 96:46-50.
Robbins, T.W. and Everitt, B.J. (1982). Functional studiesof the central catecholamines. Review of
.Neurobiology . 23: 303-365.
Roy, S.N., Bhattacharya, S. and Pradhan, S.N. (1978).Behavioural and neurochemical effects of repeatedadministration of cocaine in rats.Neuropharmacology . 17: 559-564.
Sarkar, S.N. (1990). Toxicological investigation ofisoproturon with special reference to fetal toxicity.Ph.D. Dissertation, Indian Veterinary ResearchInstitute, Izatnagar, U.P.
Schechter, M.D. and Rosecrans, J.A. 1972. Behaviouraltolerance to an effect of nicotine in the rat. Archives of International Pharmacodynamics and
Theapeutics . 195:52-56.Tomizawa, M. and Casida, J. E. (2005). Neonicotinoid
insecticide toxicology: mechanism of selectiveaction. Annual Review of Pharmacology and
Toxicology . 45:247-268.Turner, R.A. (1965). Screening methods in pharmacology.
Academic Press, New York, London. pp 22-41.
Received on: 27-06-2012
Revised on: 12-09-2012 Accepted on: 22-12-2012
Behavioural effect f acetamiprid
Journal of Veterinary Pharmacology and Toxicology/December 2012/Vol.11/Issue 1-2/43-49 49

8/13/2019 JVPT-2012_Vol11
http://slidepdf.com/reader/full/jvpt-2012vol11 54/108
Department of Veterinary Pharmacology and ToxicologyGuru Angad Dev Veterinary and Animal Sciences University, Ludhiana - 141 004
*Corresponding author: E-mail: [email protected]
COMPARATIVE ANALYSIS OF PESTICIDE RESIDUES IN FODDER AND
BUFFALO PLASMA COLLECTED FROM THREE DIFFERENT DISTRICTSOF PUNJAB
V. K. DUMKA, H. S. SANDHU, S. RAMPAL, RAJDEEP KAUR* AND KAMALPREET KAUR
ABSTRACT
The use of pesticides is comparatively more in certain crops while in some it is negligible. The farmers usepesticides more frequently and in increased doses than the recommended doses or procedures which leads to the presenceof high amount of residues in food commodities including animal fodder. As a result there is persistence of pesticideresidues in food chain which further poses serious threat to animal and human health. In this study, comparative analysisof pesticide residues was done in three different districts of Punjab and results revealed maximum use of pesticides inBathinda district among three.
Key words: Pesticides, Punjab, residues, survey.
INTRODUCTIONIn the present scenario of global food crises, the
extensive use of agrochemicals including pesticides andfertilizers is unavoidable for increasing and sustaining cropproduction. Even the pesticides with longer persistencecharacteristics are also being used, which endanger ourhuman and animal health through the pesticidecontamination of food stuff and environment (Muhammadet al., 2009). The large-scale use of pesticides in modernagriculture has caused serious concern due to the presenceof their residues in the environment. Besides combatinginsect pests, insecticides also get accumulated in manyparts of the ecosystem and exert toxic effects on organismsincluding animals and human. Animals are exposed to thesehazardous chemicals through consumption of contaminatedfodder and water. Increasing incidence of cancer, chronickidney diseases, suppression of the immune system,sterility in male and females, endocrine disruption,neurological disorders, have been attributed to chronicpesticide poisoning (Hosie et al. 2000). Currently, there areabout 165 pesticides registered for use in India, of which40% are organochlorines (FAO, 2005).
Pesticides have become integral part ofagronomic practices in Punjab. Bathinda and Moga
districts of Punjab constitute an important cotton belt ofthe country, grows largely cotton and rice crop –the twocrops known for excessive use of pesticides. Pesticideresidues persist in field soils and can enter other cropsincluding maize, sorghum etc which are used as animalfodder. Consequently pesticide residues enter food chainand affect animal and human health. Therefore, the presentstudy was conducted to analyze the pesticide residueconcentration in animal blood samples and fodder beingfed to such animals in various districts of Punjab.
MATERIALS AND METHODSThe survey was undertaken in three districts of
Punjab viz Bhatinda, Moga and Ludhiana. Amongst these,Bathinda and Moga districts fall under the high-pesticide-use areas whereas Ludhiana district was kept as control(low-pesticide-use area). In each district, five villages wererandomly selected and from each village five samples offodder and buffalo blood were collected in sterilizedcontainers. Therefore, total of twenty-five samples fromfive villages of each district was collected and analysis ofpesticide residues was done in laboratory.
Fodder samples were first grinded properly and50g of each sample was taken for extraction which wasdone in organic solvents including acetone,dichloromethane and hexane followed by clean-upprocedure using column chromatography that included useof florisil and anhydrous sodium sulphate. Final volume of10ml was prepared in acetone and hexane and stored inclosed vials at -200C till further analysis. Blood sampleswere centrifuged at 3000 rpm for 15 min to obtain plasma.Plasma samples were processed by the protocoldeveloped by Gill et al. (1996) with some modifications.The gas chromatograph, Perkin Elmer (Clarus 500)equipped with nitrogen phosphorus detector and electron
capture detector was used for the detection of variouspesticide residues. Concentrations obtained werecompared with standard curve prepared by using specificconcentration of different pesticide standards and resultswere obtained by using following formula-
RESULTS AND DISCUSSIONPesticides were identified from their respective
Research Article
Concentration (ppm) = Pesticide standard injected(ng)
xArea of sample
xArea of the standard Sample extract injected(µl)
Final vol of sample extract(ml)Initial vol (ml)
50 Journal of Veterinary Pharmacology and Toxicology/December 2012/Vol.11/Issue 1-2/50-52

8/13/2019 JVPT-2012_Vol11
http://slidepdf.com/reader/full/jvpt-2012vol11 55/108
retention time and confirmed by comparison with authenticstandards. The results of reproducibility of recovery,suggested that extraction and cleanup procedure couldbe considered reliable enough for the analysis of plasmaand fodder. Analysis of pesticide residues in fodder samplescollected from three different districts revealed that
maximum concentration of pesticide residues was foundin fodder collected from villages of Bathinda followed byMoga and Ludhiana (Table 1). This indicates maximumuse of pesticides in fields of Bathinda district to raise cropyield. In recent years, many people residing in villages ofBathinda district are facing problem of cancer and as aresult the area has earned the dubious name of being the
TABLE 1:Pesticide residues (ppm) in the fodder samples collected from Bathinda, Moga and Ludhiana districts of Punjab.
S. No. Pesticides ADI (ppm) Bathinda Moga Ludhiana
1 α- HCH 0.10 0.0222 ± 0.004 0.02014 ± 0.019 0.02559 ± 0.0162 β- HCH 0.10 0.0099 ± 0.005 0.07001 ± 0.03 0.00563 ± 0.0043 γ - HCH 0.10 0.0107 ± 0.003 0.00486 ± 0.002 0.01022 ± 0.0044 δ- HCH 0.10 0.2264 ± 0.107 0.12865 ± 0.04 0.25733 ± 0.0625 Heptachlor 0.0001 0.5592 ± 0.144 0.74471 ± 0.05 0.37333 ± 0.2136 Fenitrothion 0.005 1.1333 ± 0.521 0.05625 ± 0.002 0.63050 ± 0.4667 Fipronil 0.0002 0.6155 ± 0.549 0.69125 ± 0.28 0.02417 ± 0.005
8 Dieldrin 0.0001 0.1542 ± 0.043 0.07042 ± 0.03 0.13334 ± 0.0429 Aldrin 0.0001 0.0093 ± 0.003 0.14720 ± 0.11 0.00757 ± 0.00410 p,p-DDD 0.01 0.0036 ± 0.001 0.21575 ± 0.03 -11 o,p-DDD 0.01 0.0245 ± 0.002 0.03167 ± 0.02 0.00275 ± 0.00112 p,p-DDT 0.01 0.0024 ± 0.001 0.00847 ± 0.004 0.00145 ± 0.00113 p,p-DDE 0.01 0.0026 ± 0.002 0.01750 ± 0.007 -14 Endosulphan-SO4 0.006 0.0500 ± 0.003 0.16117 ± 0.104 -15 Butachlor 0.05 0.0436 ± 0.003 0.29520 ± 0.11 0.00361 ± 0.00216 Endrin 0.0002 0.0779 ± 0.030 0.00392 ± 0.002 0.00667 ± 0.00317 L-cyalothrin 0.002 0.0383 ± 0.020 0.11625 ± 0.02 0.01361 ± 0.00318 Fenvalerate 0.02 0.0231 ± 0.002 0.13667 ± 0.021 -19 Deltamethrin 0.01 0.0156 ± 0.001 0.20375 ± 0.04 -
Fig 1:
Distribution of pesticide residues (ppm) in the foddersamples from Bathinda district of Punjab
‘Cancer Belt’ and studies are going on to ascertain thatuse of indiscriminate pesticides can be the initiating factorfor the dreadly disease. Residues of pesticides includingHeptachlor, Fipronil, Fenitrothion, dieldrin, aldrin, endrin,δ- HCH, o,p-DDD, endosulphan, L-cyalothrin, fenvalerateand deltamethrin were found in concentration above the
Accetable Daily Intake (ADI) limits (Fig 1). Serum collectedfrom buffaloes also contain similar residues, but in lesserconcentrations. In the state of Punjab, buffalo whichcontributes to its 70% milk production is an importantdairy animal. Quality of its milk and contamination of milkwith various toxicants would have a lot of bearing on humanhealth.
In fodder samples of Moga district, pesticideresidues of α- HCH, β- HCH, δ- HCH,fipronil, heptachlor,fenitrothion, aldrin, dieldrin, p,p-DDD, o,p-DDD, p,p-DDE,endosulphan, butachlor, endrin, L-cyalothrin, fenvalerateand deltamethrin were found to be above the AcceptableDaily Intake limits (Fig 2). Fipronil is a highly effective,
broad-spectrum insecticide used for the control of a widerange of agricultural, public health and veterinary pests(Rhone-Poulenc, 1996). Organochlorine pesticides(including accompanying residues and metabolites) areubiquitous in the environment because of their widespreaduse.
On the other hand, the samples collected fromLudhiana, a less-pesticide-use area, revealed a lessernumber of residues, of which, only heptachlor and butachlorwere found to above ADI limits in serum of animals whereasin fodder samples levels of δ- HCH, heptachlor, fenitrothion,fipronil, dieldrin, aldrin and endrin were above the ADI limits(Fig 3) but in a significantly lower concentration in
comparison to Bathinda and Moga districts. -
Journal of Veterinary Pharmacology and Toxicology/December 2012/Vol.11/Issue 1-2/50-52 51
Pesticide residues in fodder and blood

8/13/2019 JVPT-2012_Vol11
http://slidepdf.com/reader/full/jvpt-2012vol11 56/108
REFERENCESFAO. (2005). Proceedings of the Asia regional
Workshop.Regional Office for Asia and the Pacific,Bangkok.
Gill, U. S., Schwartz, H. M. and Wheatley B. (1996).Development of a method for the analysis of PCBcongeners and organochlorine pesticides in blood/ serum. Chemosphere 32: 1055-1061.
Hosie, S., Loff, S., Witt, K., Niessen, K., and Waag, K.L(2000). Is there a correlation between
organochlorine compounds and undescended
Fig 3:
Distribution of pesticide residues (ppm) in the foddersamples from Ludhiana district of Punjab
Fig 2:
Distribution of pesticide residues (ppm) in the foddersamples from Moga district of Punjab
testes? Euro. J. Pediatric Surgery 10: 304–309.Muhammad, S. Z., Muhammad, J. K., Muhammad, Q.
and Abdul, R. (2009). Pesticide residue in the foodchain and human body inside Pakistan J. Chem Soc. Pak., 31(2): 284-291
Rhone-Poulenc. (1996). Fipronil Worldwide TechnicalBulletin. Rhone-Poulenc.
Received on: 09-01-2012
Accepted on: 16-06-2012
52 Journal of Veterinary Pharmacology and Toxicology/December 2012/Vol.11/Issue 1-2/50-52
Dumka et al.

8/13/2019 JVPT-2012_Vol11
http://slidepdf.com/reader/full/jvpt-2012vol11 57/108
Research Article
1,2Assistant Professor, Department of Veterinary Pharmacology and Toxicology, Post Graduate Institute of
Veterinary and Animal Science, Akola -444104, M.S., India;3Principle Scientist, Division of Veterinary Pharmacology & Toxicology, IVRI, Izatnagar-243122, U.P., India:1Corresponding Author: E-mail: [email protected]
PARALYTIC EFFECT OF PEGANUM HARMALA LINN. ALCOHOLIC
EXTRACT ON FASCIOLA GIGANTICA
S. W. HAJARE1, M. K. LONARE2 AND DINESH KUMAR3
ABSTRACT
Peganum harmala Linn (Harmal) is an herb native to arid and semiarid regions of Central Asian deserts. The effectof P. harmala alcoholic extract (PHAE) seed was investigated in vitro on the spontaneous muscular activity and AChE activityof Fasciola gigantica . The extract induced flaccid paralysis at 300µg/ml concentration in isometrically mounted liver flukes intissue organ bath. However, extract did not markedly modify the AChE activity of the liver flukes following 4h incubation. It isAchE independent paralytic effect on liver fluke in vitro .
Key words: AChE activity, Fasciola gigantica , Peganum harmala , spontaneous muscular activity.
INTRODUCTION
Fasciolosis mainly caused by Fasciola gigantica in Indian sub-continent (Bhatia et al., 1989) is responsiblefor heavy economic loss to livestock owners. Syntheticsanthelmintic are currently used as the most effective meansfor the control of fasciolosis. But these anthelmintics arenot available in some of the rural areas of developingcountries or have some serious disadvantages such asrisk of misuse, development of drug resistant (Singh et
al., 2002), adverse drug reactions, high cost, environmentalpollution and residual effect. Plant based anthelminticsoffer an alternative that can overcome some of theseproblems and are sustainable and environmentallyacceptable (Hammond et al., 1997). A large number ofmedicinal plants in India have been reported to possessanthelmintic activity and they have been used traditionally(Nadkarni, 1954).
Peganum harmala Linn. (Rutaceae) is a commonplant used traditionally to treat several diseases and hasmany medicinal properties such as antioxidant,hepatoprotective, antidepressant and anthelminticactivities. (Khaliq et al., 2008 & 2009; Hamden et al., 2009;Herraiz et al., 2010). There is no study reported on theeffect of P. harmala seeds on liver flukes F. gigantica andon fluke acetyl cholinesterase (AChE) activity. Therefore,the present study was undertaken to evaluate the effect of
P. harmala alcoholic extract on in vitro spontaneousmuscular activity and AChE activity of F. gigantica .
MATERIALS AND METHODS
Plant material and preparation of extract P. harmala seeds were collected from the local
market and were identified botanically for their authenticitybefore use. The seeds were dried under shade and groundto fine powder. Further, it was extracted with 70% ethanolunder reflux. Yield of P. harmala alcoholic extract (PHAE)
of seeds was found 7.06%. Stock solutions of the extract
having strength of 10 mg/ml in tween-80 and distilled waterwere prepared.Parasites
Mature and healthy flukes were collected fromthe bile ducts of the freshly slaughtered buffaloes fromlocal abattoir in insulated container containing sterilemodified and warm Hedon-Fleig (H.F.) solution (NaCL-119.82mM; KCL-4.01mM; MgSO
4-0.29mM; CaCl
2-0.40mM;
NaHCO3-17.8mM; Glucose-22.3mM; Streptomycin
sulphate-6900 units @ 10mg/liter and benzyl penicillin-9900 units/liter). Flukes were maintained at 38±1ºC in BODincubator until use.in vitro muscular activity of Fasciola gigantica
Spontaneous muscular activity (SMA) of matureflukes was recorded by mounting it isometrically in thetissue bath, using force displacement transducerconnected to a pen writing recorder (Polyrite, Medicare,India) as per the method of (Fairweather et al., 1983) forF. hepatica and modified by (Kumar et al., 1995) for F.gigantica . The SMA was recorded, 30 min after equilibrationunder the resting force of 0.5g. After 15 min of equilibrationperiod, the fluke was exposed to different cumulativeconcentration (30, 100 and 300µg/ml) of PHAE andresponse was recorded. Each concentration was allowedto act for a period of 15 min. Six flukes were mounted
isometrically to examine effect of cumulative concentrationof PHAE. Isometrically mounted flukes were also exposedto Tween-80 (Final concentration 0.1%) at an interval of15 min and for a period of 1h to eliminate the possibility ofits effect on SMA of the flukes.Estimation of acetyl cholinesterase activity of F.
gigantica The F. gigantica were incubated in different
concentrations (30 and 100µg/ml) of PHAE in H-F solutionfor 4h. The control group was also taken with only normal
Journal of Veterinary Pharmacology and Toxicology/December 2012/Vol.11/Issue 1-2/53-55 53

8/13/2019 JVPT-2012_Vol11
http://slidepdf.com/reader/full/jvpt-2012vol11 58/108
Hazare et al.
H-F solution. Following 4h incubation, flukes were usedfor estimation of AChE activity (Fishman and Green, 1961).Minimum six observations were made for each of the fourgroups.Statistical analysis
All the values are expressed as Mean ± SE. Thestatistical analysis of the data was carried out by oneway ANOVA with Studentized Range Post-Hoc test. Aprobability level of P<0.05 was considered significant.
RESULTS AND DISCUSSION The alcoholic extract cause statistically significantconcentration dependent increase in frequency of SMA at30 (4.46±0.20 conc./min) and 100 (4.80±0.17 contractions/ min) µg/ml concentrations as compared to the controlfrequency (4.36±0.11 contractions/min). At 300µg/mlconcentration, the frequency became nil. The amplitudeof contractions was increased significantly and inconcentration dependent manner (0.49±0.02g at 30µg/mland 0.64±0.06g at 100µg/ml conc.) as compared to control(0.37±0.02g). Irreversible flaccid paralysis was producedat 300µg/ml concentration of PHAE (Table 1). At thisconcentration, flukes did not recover from the paralysisfor period of 30 min of recording with two successive washeswith normal H-F solution at 15 min interval. In earlier studiesacetylcholine (ACh) has been shown to produce inhibitoryeffect on the rhythmicity of F. gigantica at higherconcentrations (10-4 and 10-3M) (Tripathi and Kumar, 1997)and caused flaccid paralysis of many flatworm parasites(Ribeiro et al., 2005). Similarly, in the present study, theextract flaccidly paralyzed the fluke. In the absent ofsubstantial information on the effect on neurotransmitterson the spontaneous muscular activity of trematodes, itcan be speculated that the paralytic effect of the P. harmala
extract might be due to the presence of some cholinergicagent and/or an agent possessing the activity to inhibitAChE activity of the fluke. Because, Harmine, a beta-carboline amine alkaloid isolated from P. harmala hasshown its antileishmanial properties both in vitro and in
vivo (Lala et al., 2004). Total alkaloid of P. harmala showeda marked effect as a treatment for haemosporidian namely,T. sergenti , T. annulata and B. bigemina infection in cattle(Hu et al., 1997).
SMA of isometrically mounted F. hepatica (Holmes
and Fairweather, 1984) has been used as an index ofneuromuscular activity to evaluate the role ofneurotransmitter in neuromuscular physiology ofhelminthes. In the present study we have used this indexto examine concentration dependent inhibitory effect ofthe PHAE on SMA of F. gigantica to ascertain itsanthelmintic action in vitro . The SMA of F. gigantica isgrossly similar to that of whole S. mansoni (Mellin et al.,1983) and F. hepatica (Fairweather et al., 1983). The
changes produce on SMA of isometrically mounted flukesby drugs/chemical/extracts demonstrate the involvementof neuromuscular system on account of rapidity of action.The SMA can be quantified in terms of frequency andamplitude of rhythmic contractions. It can be comparedbefore and following drug treatment. SMA of F. gigantica shows full (excitatory) and dull phases similar to that of F.
hepatica (Fairweather et al., 1983) with apparent changein baseline tension and amplitude of SMA. However, Seedsof P. harmala have been shown to be efficacious in naturalcystodal infection in goat (Akhter and Riffat, 1986) and in vitro against E. granulosus (Kang, 1994). Its constituenttetrahydroharmine has been found effective in nematodeinfection in goats (Akhter and Ahmad, 1991). P. harmala seed powder caused significant decrease in schistosomalcercarial production recorded in snail treated with its sublethal concentrations (El-Ansary et al., 2001).
Extract did not show any marked effect on AChEactivity of treated flukes as compared to that of controlflukes (71.34±5.51mM ACh hydrolyzed/g wet tissue /hr)following four hour incubation (Table 2). AChE activity hasearlier been reported in F. hepatica and F. gigantica (Probert and Durrani, 1997) as well and inhibitors of theenzyme have been reported to markedly reduce rhythmicactivity of flatworm parasites (Ribeiro et al., 2005). Many
conventional anthelmintic including those used against F.hepatica and against F. gigantica . viz., oxyclozanide andrafoxanide act through inhibiting AChE enzyme of theparasite (Durrani, 1977). As higher concentration of AChcause flaccid paralysis, inhibition of AChE might also causeincrease in concentration of endogenous ACh which mightfinally cause flaccid paralysis. Surprisingly, the extractdid not inhibit the activity of AChE enzyme of the fluke.Thus, it is interpreted that PHAE might possess somecholinomimetic constituent which could not be hydrolyzed
TABLE 1:Effect of cumulative doses of PHAE on SMA of F.gigantica.
Groups Dose Frequency / Amplitude/ minute tension (g)
Control Tween-80 (1%) 4.36±0.11 0.37±0.02P. harmala 30 µg/mL 4.46±0.20 0.49±0.02**
100 µg/mL 4.80±0.17 0.64±0.06**
300 µg/mL 0.00 0.00n=6; values are expressed as Mean±SEM; tension 0.5 g.**= p>0.05 as compared with control.
TABLE 2:Effect of different doses PHAE on AChE activity (mM of AChhydrolyzed/g wet weight/h) of F. gigantica.
Groups Dose AChE activity
Control Tween-80 (1%) 71.34±5.51Hexachlorophene 10-5 M 72.80±5.84P. harmala 30 µg/mL 71.73±6.54
100 µg/mL 65.21±3.91n=6; values are expressed as Mean±SEM
54 Journal of Veterinary Pharmacology and Toxicology/December 2012/Vol.11/Issue 1-2/53-55

8/13/2019 JVPT-2012_Vol11
http://slidepdf.com/reader/full/jvpt-2012vol11 59/108
by fluke AChE. Thus, it is concluded that the alcoholicextract of P. harmala seeds has paralytic effect on liverfluke in vitro and the effect appear to be independent of itseffect on AChE activity of the fluke.
ACKNOWLEDGEMENT
The authors are thankful to the Director, IndianVeterinary Research Institute, Izatnagar for providingnecessary facilities to carry out research work.
REFERENCESAkhtar, M.S. and Ahmad, I. (1991). Evaluation of
antinematodal efficacy of tetrahydroharmine ingoats. Veterinarski Archive 61: 307-311.
Akhtar, M.S. and Riffat, S. (1986). A field trial of Paganum harmala Linn. seeds (Harmal) against naturalcestodal infection in Betel goats. J. Pharmacol.Univ. Karachi Pakistan. 4: 79–84.
Bhatia, B.B., Upadhaya, D.S. and Juyal, P.D. (1989).
Epidemiology of Fasciola gigantica in sheep intarai region of Uttar Pradesh. J. Vet. Parasitol. 3:25-29.
Derakhshanfar, A. and Mirzaei, M. (2008). Effect ofPeganum harmala (wild rue) extract onexperimental ovine malignant theileriosis:pathological and parasitological findings.Onderstepoort J. Vet. Res. 75: 67-72.
Durrani. M.S. (1977). Fasciola hepatica and Fasciola
gigantica : Total cholinesterase, characteristic andeffect of specific inhibitors. Expt. Parasitol. 42:203-210.
El-Ansary, A., Sammour, E.M., Soliman, M.S. and Gawish,A. (2001). In vivo , attenuation of schistosomecercarial development and disturbance of egglaying capacity in Biomphalaria alexandrina usingsublethal concentrations of plant molluscicides.J. Egyptian Soc. Parasitol. 31: 657-669.
Fairweather, I., Holmes, S.D. and Threadgold, L.T. (1983).Fasciola hepatica ; a technique for monitoring in vitro motility. Expt. Parasitol. 56: 369-380.
Fishman, W.H. and Green, S. (1961). Calorimetricestimation of Acetylcholine esterase activity. In:Methods Med. Research 9: 73-75.
Hamden, K., Masmoudi, H., Ellouz, F., ElFeki, A. and
Carreau, S. (2008). Protective effects of Peganum harmala extracts on thiourea induced diseasesin adult male rat. J. Environ. Biol. 29:73-75.
Hamden, K., Carreau, S., Ayadi, F., Masmoudi, H. andEl-Feki, A. (2009). Inhibitory effect of estrogens,phytoestrogens and caloric restriction on oxidativestress and hepato toxicity in aged rats. Biomed.
Environ. Sci. 22:381-387.Hammond, J.A., Fielding, D. and Bishop, S.C. (1997).
Prospects for plant Anthelmintics in tropical
veterinary medicine. Vet. Res. Com.. 21: 213-228.
Herraiz, T., González, D., Ancín-Azpilicueta, C., Arán, V.J.and Guillén, H. (2010). Beta- Carboline alkaloidsin Peganum harmala and inhibition of humanmonoamine oxidase (MAO). Food and Chem.
Toxicol. 48: 839-45.Holmes, S.D. and Fairweather, I. (1984). Fasciola hepatica : the effects of neuropharmacologicalagents on in vitro motility. Expt. Parasitol. 58:194–208.
Hu, T., Fan, B., Liang, J., Zhao, S., Dang, P., Gao, F. andDong, M. (1997). Observations on the treatmentof natural haemosporidian infections by totalalkaloid of Peganum harmala L. in cattle. Trop.Anim. Hlth. Prod. 29(4): 72S–76S.
Kang, J.F. (1994). In vitro cidal effect of ten Chinesmedicinal herbs against Echinococcus granulosus protscolices. Endemic Dis. Bull. 9: 22-24
Khaliq, T., Misra, P., Gupta, S., Reddy, K.P., Kant, R.,Maulik, P.R., Dube, A. and Narender, T. (2009).Peganine hydrochloride dihydrate an orally activeantileishmanial agent. Bioorganic and Med. Chem.
Let. 19: 2585-2586.Kumar, D., Chandra, S. and Tripathi, H.C. (1995). In vitro
motility recording of Fasciola gigantica . J. Vet.
Parasitol. 9: 31-36.Lala, S., Pramanik, S., Mukhopadhyay, S.,
Bandyopadhyay, S. and Basu, M.K. (2004).Harmine: Evaluation of its antileishmanialproperties in various vesicular delivery systems.J. Drug Target. 12: 165-175.
Mellin, T.N., Busch, R.D., Wang, C.C. and Kath, G. (1983).Neuropharmacology of the Parasitic Trematode,Schistosoma Mansoni. Am. J. Trop. Med. Hyg.
32: 83-93.Nadkarni, K.M. (1954). Indian Meteria Medica. 3rd ed.
Popular Prakashan, Bombay p. 242.Probert, A.J. and Durrani, M.S. (1977). Fasciola gigantica
and Fasciola hepatica : Total cholinesterase,characteristic and effects of specific inhibitors.Expt. Parasitol. 42: 203-210.
Ribeiro, P., El-Shehabi, F. and Patocka, N. (2005).Classical transmitters and their receptors inflatworms. Parasitol. 131:S19-S40.
Singh, D., Swarnkar, C.P. and Khan, F.A. (2002).Anthelmintic resistance in gastrointestinalnematodes of livestock in India. J. Vet. Parasitol.16(2):115-130.
Tripathi, S.C. and Kumar, D. (1997). Effect of cholinergicdrugs on rhythmic motility of Fasciola gigantica .J.Vet. Parasitol. 11:31-36.
Received on: 01-10-2012
Accepted on: 12-11-2012
Effect of P. harmala on F. gigantica
Journal of Veterinary Pharmacology and Toxicology/December 2012/Vol.11/Issue 1-2/53-55 55

8/13/2019 JVPT-2012_Vol11
http://slidepdf.com/reader/full/jvpt-2012vol11 60/108
Research Article
Department of Veterinary Pharmacology and Toxicology, 1Department of Veterinary Medicine,
Bihar Veterinary College, Patna 800 014, India*Corresponding author: E-mail: [email protected]
HAEMATO-BIOCHEMICAL PROFILE AFTER REPEATED ADMINISTRATION
OF PEFLOXACIN IN GOATS
NIRBHAY KUMAR*, BIPIN KUMAR1, S.D. SINGH AND C. JAYACHANDRAN
ABSTRACT
In the present study, pefloxacin was assessed for its adverse effects in goats when given at the dose rate of 10 mg/ kg, i.v. daily for seven consecutive days. Among hematological parameters, hemoglobin and differential leukocyte countdiffered non-significantly while total leucocyte count increased significantly (p<0.01) from day 0 onwards till day 10. However,the increase was within the physiological limit. Biochemical parameters like blood glucose, serum cholesterol, blood ureanitrogen, total protein, albumin, globulin and A/G ratio showed non-significant changes while alanine aminotransferase(ALT) and aspartate aminotransferase (AST) differed significantly (p<0.01) between pre-treatment and post-treatment. Thechanges in ALT and AST values were also within the normal physiological limits. The study revealed that the drug is quietsafe to be used for clinical trials of a week.
Key words: Goat, hematological parameters, pefloxacin.
INTRODUCTIONFluoroquinolones are synthetic antimicrobial
agents with an established position as highly effective groupof drugs in modern veterinary medicine. They have broadspectrum of activity with excellent pharmacokinetic profile.Pefloxacin, a member of third generation fluoroquinoloneis a broad spectrum, antibacterial agent having potentbactericidal activity against a wide range of gram-negativeand gram-positive organisms. It is effective against variousdiseases such as gastro-intestinal, respiratory, urinary,genital, skin, soft tissues, bone and joint infections etc.
The drug is metabolized in the body into its activemetabolite, norfloxacin. Pefloxacin like other quinoloneshas toxic potentials in the muscle, tendon and synovialmembrane (Kashida and Kato, 1997). One of the mostcommon problems is the gastrointestinal disturbance (likenausea, vomiting, diarrhoea etc). Pefloxacin also inducesarthropathy in juvenile animals (Machida et al., 1990).Thrombocytopenia at very high doses on prolongedadministration in human has also been reported(Chichmanian et al., 1992). Photosensitivity andphotoallergenicity of norfloxacin in some cases of guineapigs has also been described (Horio et al., 1994).
Although many reports of toxicity of pefloxacin
are available, studies regarding safety of the drug in clinicaltrials in animals especially goats are scanty. Hence, thepresent study was undertaken to evaluate its toxicity, ifany, on the hematological and biochemical parameters ingoats after repeated intravenous administration at doubleof the therapeutic dose for a week.
MATERIALS AND METHODSThe present study was conducted on five clinically
healthy female goats of non-descript breed of 1.5 to 2
years of age and weighing about 20–25 kg body weight.All the goats were dewormed with albendazole immediatelyafter procurement. They were maintained under standardmanagemental conditions and acclimatized in the CollegeAnimal House for a period of 15 days prior to theexperiments.
Pefloxacin (Pelox ® infusion as pefloxacin methanesulfonate dihydrate equivalent to 4 mg/ml of pefloxacinbase in 5% dextrose solution) manufactured by M/s.Wockhardt Limited, Mumbai was used for the study. Thedrug was administered intravenously at the dose rate of
10 mg/kg body weight (double of the therapeutic dose) for7 consecutive days.Blood samples were collected routinely on 0, 2,
4, 8 and 10th day during the study. For determining differenthaematological values, blood was collected from theexperimental animals from the jugular vein by venepuncturein small sterile vials having the anticoagulant EDTA @ 1.5mg/ml of blood. Blood was collected from the ear vein ofgoat for total leucocyte count (TLC) and differentialleucocyte count (DLC) estimation. Fluoride – oxalatemixture was used as an anticoagulant for blood sugarestimation. Other biochemical parameters like bloodglucose (Frankel et al., 1970), BUN (Wootton, 1964), total
protein and albumin (Reinhold, 1953), ALT and AST(Reitman and Frankel, 1957) were estimated usingcommercially available kits from Nice and SpanDiagnostics Co. The data were expressed as Mean ± S.E.and subjected to Student’s t–test (Snedecor and Cochran,1976).
RESULTS AND DISCUSSIONTable 1 shows the effect of pefloxacin on
haematological parameters when given at the dose rate of
56 Journal of Veterinary Pharmacology and Toxicology/December 2012/Vol.11/Issue 1-2/56-58

8/13/2019 JVPT-2012_Vol11
http://slidepdf.com/reader/full/jvpt-2012vol11 61/108
TABLE 1:Effect of pefloxacin (10 mg/kg i.v. daily for 7 days) on haematological parameters in goat (Mean +S.E.M., n=5)
Parameter (Unit) Day 0 Day 2 Day 4 Day 8 Day 10
Hb (g/dl) 8.50++0.20 8.48+0.21 8.52+0.22 8.52+0.19 8.50+0.20TLC (x103 /mm3) 9.80a+0.218 10.30ab+0.21 10.785bc+0.24 11.325c+0.18 11.30c+0.18Neutrophil (%) 39.57 39.47 40.00 39.66 39.74Lymphocyte (%) 52.47 52.10 53.02 53.10 52.90
Monocyte (%) 4.22 4.05 3.99 3.64 4.28Eosinophill (%) 3.00 3.62 2.62 3.14 2.47Basophill (%) 0.79 (n=2) 0.60 (n=1) 0.40 (n=1) 0.50 (n=1) 0.50 (n=2)
Different superscripts denote significance at p<0.01.
TABLE 2:Effect of pefloxacin (10 mg/kg i.v. daily for 7 days) on biochemical parameters in goat (Mean+S.E.M., n=5)
Parameter (Unit) Day 0 Day 2 Day 4 Day 8 Day 10
Blood sugar (mg/dl) 59.34+0.87 59.13+2.17 63.35+1.42 62.20+0.83 62.90+0.67BUN (mg/dl) 17.7+0.76 17.40+0.94 18.11+1.06 18.47+0.99 17.82+0.67Serum cholesterol (mg/dl) 81.92+2.86 77.26+2.51 78.03+4.50 80.01+4.44 79.44+3.76Total protein (g/dl) 7.22+0.08 7.19+0.06 7.16+0.05 7.16+0.05 7.23+0.13Albumin (g/dl) 2.43+0.09 2.38+0.08 2.40+0.10 2.36+0.06 2.41+0.06Globulin (g/dl) 4.79+0.06 4.81+0.06 4.76+0.06 4.81+0.06 4.82+0.08A/G ratio 0.504 0.494 0.503 0.491 0.499
ALT (IU/L) 11.80a
+0.56 15.40b
+0.66 19.60c
+0.76 26.80d
+0.66 25.60d
+0.43AST (IU/L) 66.80a+3.39 84.90b+3.80 112.10c+3.69 150.40d+3.99 146.40d+3.90
Different superscripts denote significance at p<0.01.
10 mg/kg i.v. for seven consecutive days in goats. Thestudy revealed that there was no significant change inhaemoglobin (gm/dl). Value of TEC significantly increasedfrom day 2 onwards till day 10 without a significant changein DLC. The TLC and DLC values remained within thenormal range during the study.
Following repeated administration of pefloxacinat double of the therapeutic dose (i.e. 10 mg/kg b.wt.) for7 consecutive days, the alterations recorded in thehaematological parameters were non-significant betweenpretreatment and post treatment values. Similar findingsin haematological parameters were also noted by Sachanet al. (2000) in broiler chicken when pefloxacin wasadministered to at doses of 5, 10 and 40 mg/kg orally.Another fluoroquinolone, ofloxacin also produced similarchanges in haematological values when it was given @10 mg/kg twice daily for 10 days treatment in healthy malevolunteers
(Stein et al., 1991). Pallavacini et al. (1989)
observed that pefloxacin and ofloxacin in concentrationsof 0.5 to 50 µg/ml did not induce inhibition of humanmyelopoiesis in vitro .
Table 2 represents the biochemical values whenpefloxacin was given at double of the therapeutic dose forseven days. Pefloxacin did not reveal any effect on valuesof blood sugar, BUN and serum cholesterol on differentintervals in comparison to values on day 0. Pefloxacinwas found to have non-significant effect on total protein,albumin, globulin and A/G ratio and the values of totalprotein, albumin, globulin and A/G ratio remained aroundnormal on different days during the study. The value ofALT and AST increased significantly on day 2, 4 and 8
showing its mild hepatotoxic effects. The findings of the biochemical parameters likeALT, AST, BUN and total bilirubin in the present studywere in agreement with the results found in day old chicksby Sachan et al. (2002). Increased levels of AST mighthave been due to some muscle damaging effects ofpefloxacin like other fluoroquinolones. Since the increasein AST level is not very pronounced, it can be evaluated asa relatively safer drug. Sridevi et al. (2002) reported thatpefloxacin at the high dose rate of 15 and 20 mg/kg b.wt.produced toxic symptoms in pups following prolonged (4weeks) administration while 10 mg/kg b.wt. wascomparatively safer. Chondrotoxicity, athropathy, muscledamage etc. have been reported only after prolongedadministration of pefloxacin by several authors (Kashidaand Kato, 1997; Machida et al., 1990). Thus , it isconcluded that pefloxacin @ 10 mg/kg, i.v for 7 days isquiet safe for clinical uses in goats.
ACKNOWLEDGEMENTSThe authors are thankful to Associate Dean-cum-
Principal, Bihar Veterinary College, Patna for providingfacility and necessary help for this study.
REFERENCES
Chichmanian, R.M., Spreux, A., Bernard, E., Garraffo, R.and Fuzibet, J.G. (1992). Thrombocytopenia dueto pefloxacin (peflacine): dose dependent toxicity.Therapie. 47: 419-21.
Frankel, S., Reitman, S. and Sonnerwirtha, A.C. (1970).Gradiwhol’s Clinical Laboratory Methods and
Biochemical profile of pefloxacin in goats
Journal of Veterinary Pharmacology and Toxicology/December 2012/Vol.11/Issue 1-2/56-58 57

8/13/2019 JVPT-2012_Vol11
http://slidepdf.com/reader/full/jvpt-2012vol11 62/108
Diagnosis (The C V Inospby Co, St Louis): 82-83.Horio, T., Miyauchi, H., Asada, Y., Aoki, Y. and Harada,
M. (1994). Phototoxicity and photoallergenicityof quinolones in guinea pigs. J. Dermatol. Sci. 7:130-35.
Kashida, Y. and Kato, M. (1997). Toxic effects of quinolone
antibacterial agents on the musculskeletal systemin juvenile rats. Toxicol. Pathol. 25: 635-43.Machida, M., Kusajima, H., Aijima, H., Maeda, A., Ishida,
R. and Uchida, H. (1990). Toxicokinetic study ofnorfloxacin induced arthropathy in juvenile animals.Toxicol. Appl. Pharmacol. 105: 403-12.
Pallavicini, F., Antinori, A., Federico, G., Fantomi, M. andNervo, P. (1989). Influence of two quinolones,ofloxacin and pefloxacin, on human myelopoiesisin vitro. Antimicrobial Agents Chemother., 33: 122-23.
Reinhold, J.G. (1953). Total proteins, albumins andglobulins. In Standard methods of clinical
chemistry , edited by Reine M (Academic Press,New York) : 88.Reitman, S. and Frankel, S.A. (1957). Colorimetric method
for the determination of serum glutamic oxalaceticand glutamic pyruvic transaminases. Am. J. Clin.Path. 28: 56.
Sachan, A., Jayakumar, K., Honnegowda, Gowda, R.N.S.and Narayana, K. (2000). The effect of pefloxacinon haematological parameters in clinical toxicitystudy in broiler chickens. Ind. Vet. J. 77: 307-309.
Sachan, A., Jayakumar, K., Honnegowda, Umesh, M.H.,
Venkatesha Udupa and Narayana, K. (2002).Safety evaluation of pefloxacin in day old broilderchicken. Ind. Vet. J. 79: 387-88.
Snedecor, W.G. and Cochran, W.G. (1976). Statistical Methods (Oxford and IBH Publishing Company,Calcutta).
Sridevi, V., Reddy, K.S., Kalakumar, B. and Reddy, G.(2002). Evaluation of experimentally inducedpefloxacin toxicity in pups. Ind. Vet. J. 79: 385-86.
Stein, G.E., Flor, S.C. and Beals, B.S. (1991). Safety ofmultiple doses of ofloxacin in healthy volunteers.Drugs Exp. Clin. Res. 17: 525-29.
Wootton, J.D.P. (1964). Microanalysis in Medical Biochemistry (J & A Churchill Ltd, London): 83-84, 91-92, 101-105.
Received on: 12-06-2012 Accepted on: 16-11-2012
Kumar et al.
58 Journal of Veterinary Pharmacology and Toxicology/December 2012/Vol.11/Issue 1-2/56-58

8/13/2019 JVPT-2012_Vol11
http://slidepdf.com/reader/full/jvpt-2012vol11 63/108
1PhD Scholar, 2Professor and Head, 3Professor; Department of Veterinary Pharmacology and Toxicology,
C.V.A.Sc., Pantnagar-263145, Uttarakhand (India).1Corresponding author : [email protected]
EVALUATION OF TOXICITY OF ENDOSULFAN FOLLOWING MULTIPLE
ORAL ADMINISTRATION IN POULTRY
LATA GAYAL1, S.P.SINGH2 AND A.H.AHMAD3
ABSTRACT
The present study was carried out to evaluate haemato-biochemical profile following multiple oral dose @16 mg/ kg bwt (1/5th of oral LD50) administration of endosulfan at an interval of 24h for five days in poultry birds. A significant(P<0.05) reduction in haematological values up to 24h post administration and thereafter gradual increase observedapproaching normal values 96h post administration of endosulfan. The total serum proteins, albumin and globulin significantly(P<0.05) decreased upto 48h post administration gradually returned to normal value after 96h. The serum AST and ALTactivities increased upto 24h gradually decreased to normal value after 96h post administration. A significant (P<0.05)increase in the values of serum creatinine and cholesterol upto 24h post administration and gradual decrease upto 96hpost administration of endosulfan was observed. A significant reduction in serum glucose level upto 24h post administrationwas observed, however , the level increased gradually reaching to normal value upto 96 h post administration of thepesticide. It is concluded from this study that endosulfan produced mild to moderate haemotoxic, hepatotoxic and nephrotoxiceffects in poultry birds.
Keywords: Biochemical, endosulfan, haematological, hepatotoxic, nephrotoxic, poultry birds.
INTRODUCTIONEndosulfan is a member of organochlorine group
which mainly affects central nervous system, kidney, liverand blood chemistry. It is classified as a persistent organicpollutant (POP). It persists in the environment for extendedperiods of time. It volatilizes easily after application and istransported to areas distant from the application site. Ithas been detected in ice and snow samples of the arctic
region and has a high potential for bioaccumulation andbiomagnification. In animal husbandry, it is used againstexternal parasites of domestic animals and poultry birds.This study was undertaken to evaluate the haematologicaland biochemical effects of endosulfan after 5 days multipleoral dose administration.
MATERIALS AND METHODS
Experimental design 20 male RIR birds weighing 1±0.5kg were divided
into five groups namely Group I, II, III, IV and V comprising4 birds in each group. Group I served as control free frompesticide. Birds of Group II, III, IV and V were administered0.1ml of endosulfan (prepared by mixing 1ml of 35% ECwith 1ml of olive oil) as multiple oral (the formulation wasadministered using thin plastic tube attached to a syringe)dose@16 mg/kg bwt (1/5th of LD50; 80mg/kg) for five daysat an interval of 24h. The birds were reared under uniformmanagement and husbandry conditions, maintained onpoultry feed (as per NRC). The birds were fed commercialbroiler ration free from any antibiotic. Fresh water wasprovided ad libitum during the entire period of experiment.
The birds were observed daily morning and evening forassessing their health status and other signs of clinicaltoxicity. Following multiple (5) oral dose administration ofendosulfan@16 mg/kg bwt in poultry birds, blood sampleswere collected at 24, 48, 72 and 96 h after last dose fromthe left brachial vein or jugular vein.Biochemical analysis
The blood samples were divided into two parts,
one part was collected in heparinized tubes forhematological studies while second part in sterilized vialsfor collection of serum for analysis of biochemicalparameters. Blood was collected from each bird in cleanheparinized microcenrifuge tube (eppendorf ® ) andhematological parameters such as packed cell volume(Jain, 1986), haemoglobin (Jain, 1986), total erythrocytecount (Natt and Herric, 1952) and total leucocyte count(Natt and Herric, 1952) were estimated immediately afterthe collection of blood samples. 0.1N-HCl was used forestimating the blood haemoglobin concentration while,Natt-Herric diluting fluid was used for TEC and TLCestimation.Statistical analysis
Statistical analysis of data was done by usingone way ANOVA technique followed by Tukey’s MultipleComparison Test by using Graph pad prism statisticalsoftware. Statistically significant difference was consideredat 5 and 1percent level.
RESULTSA significant (p<0.05) decrease in Hb (g/dl) and
Research Article
Journal of Veterinary Pharmacology and Toxicology/December 2012/Vol.11/Issue 1-2/59-61 59

8/13/2019 JVPT-2012_Vol11
http://slidepdf.com/reader/full/jvpt-2012vol11 64/108
PCV (%) was observed in Group II as compared to controlwhereas there was a significant (p<0.05) increase in valuein group V as compared to group II. A significant (p<0.05)decrease in the values of TEC (X106 / µl) and TLC (X103 / µl)in Group II and III were observed as compared to controlwhereas a significant (p<0.05) increase in the values of
TEC and TLC in groups IV and V was observed ascompared to groups II and III. There was a time dependentincrease in the hematological parameters in endosulfantreated groups (Table 1).
As given in Table1, a significant (p<0.05) decreasein value of serum proteins (g/dl) was observed in groups II,III and IV as compared to control whereas a significant(p<0.05) increase in serum proteins was observed in groupV as compared to group II, III and IV. There was nosignificant difference observed in the values of serumalbumin, globulin levels and A:G ratio of control ascompared to test groups. A significant (p<0.05) increasein the value of ALT (U/L) and AST (U/L) in group II was
observed as compared to control. ALT activity in group IIIwas significantly higher than control. A significant (p<0.05)decrease in the value of ALT was observed in Group III, IVand V as compared to Group II. A significant (p<0.05)decrease in value of AST in Group V was observed ascompared to Group II. A significant (p<0.05) decrease inthe value of ALT in Group V was observed as compared toGroup III. A significant (p<0.05) decrease in the values ofglucose (mg/dl), urea (mg/dl) and uric acid (mg/dl) wasobserved in groups II and IV as compared to control. Valuesof glucose and urea in groups III and V were significantly(p<0.05) lower than control. A significant (p<0.05) decreasein the values of glucose (mg/dl), urea (mg/dl) and uric acid
(mg/dl) was observed in group II and IV as compared tocontrol. Values of glucose and urea in groups III and V
were significantly (p<0.05) lower than control. A significant(p<0.05) increase in the value of cholesterol (mg/dl) wasobserved in Group II, IV and V as compared to control.Value of cholesterol in group IV was significantly (p<0.05)higher than group III.
DISCUSSIONHematological parameters Hb, PCV, TEC and TLCsignificantly decreased in endosulfan treated groups after24 h post administration and gradually increased after 48,72 and 96 h post administration of endosulfan as theresidue concentration of pesticide gradually declined inthe body in the present study. The reduction in Hb valueindicated that the birds suffered from a mild degree ofanemia. The anemic condition might have occurred dueto interference in erythropoiesis, hemosynthesis andosmoregulatory dysfunction or due to an increase in therate of erythrocyte destruction in haematopoetic organs(Varshaneya, 1983; Siddiqui et al., 1987).
Khurana et al. (1996) observed significantreduction in total leucocyte count and absolute lymphocytecount in broiler chicken fed 30 ppm endosulfan for 8 weeks.The toxic effects of endosulfan in albino rat were alsoobserved by Das et al. (2010) who reported a decline inRBC and and Hb count. In the present study, leucopeniamight have been due to direct cytotoxic effects ofpesticides on lymphocytes. Girdhar and Singhal (1989)reported decreased total leukocyte count in goats givenlindane for 30 days. Earlier study with lindane, quinalphos,carbaryl, Fenvalerate, butachlor and isoproturon revealedleucopenia and lymphopenia in chickens (Garg, 2000;Gupta, 2001; Chauhan, 2003).
The serum AST and ALT activities were increasedsignificantly following multiple oral dose administration of
TABLE 1:Effect on hemato-biochemical parameters at different intervals following multiple (5) oral dose of endosulfan @ 16mg/
kg in poultry.
Groups I (Control) II (24 h) III (48 h) IV (72 h) V (96 h) One Way ANOVA
CD d.f F
Hb (g/dl) 12.20±0.26 7.85±0.65a 9.85±0.83 10.03±1.44 11.50±0.51b 1.89 15 7.24PCV (%) 35.80±0.94 23.70±2.44a 28.95±2.56 30.0±1.68 35.0±1.29b 5.74 15 6.78TEC(106 /¼l) 2.75±0.10 1.61±0.15a 2.24±0.09ab 2.52±0.06b 2.62±0.16b 0.35 15 14.88TLC(103 /¼l) 21.25±0.77 14.01±0.58a 11.45±0.33a 17.82±0.68bc 19.27±1.40bc 2.51 15 22.81
Cholesterol (mg/dl) 99.1±2.97 150.30±13.35a
114.6±10.22 163.4±8.08ac
152.3±10.34a
29.02 15 8.19Glucose(mg/dl) 380±12.42 188.3±6.47a 211.8±13.44a 187.8±19.67a 195.1±18.66a 44.94 15 30.97Uricacid(mg/dl) 5.39±0.20 3.43±0.19a 3.76±0.48 2.91±0.27a 6.20±0.76bcd 1.32 15 10.11Urea (mg/dl) 7.21±0.26 3.26±0.29a 3.14±0.70a 3.13±0.42a 4.12±0.60a 1.46 15 12.94Creatinine (mg/dl) 0.48±0.03 0.76±0.04a 0.28±0.02ab 0.42±0.08b 0.41±0.02b 0.14 15 15.6T.P. (g/dl) 3.69±0.18 2.50±0.19a 2.29±0.34a 2.61±0.19a 3.49±0.17bc 0.68 15 7.91Albumin(g/dl) 1.89±0.29 1.23±0.21 1.09±0.19 1.32±0.13 1.87±0.1 0.59 15 3.69Globulin(g/dl) 1.81±0.25 1.27±0.14 1.21±0.22 1.28±0.18 1.62±0.17 0.59 15 1.79ALT (U/L) 11.66±1.18 38.23± 4.11a 27.22±3.09ab 16.57± 1.42b 11.23± 0.65bc 7.41 15 22.23AST (U/L) 64.01±2.26 144.7± 20.33a 104.8± 5.55 105.2± 6.19 89.52± 2.45b 29.94 15 8.72
Values in table are Mean ± SE (n=4); a significant (P<0.05) Vs group I; b significant (P<0.05) Vs group II;c significant (P<0.05) Vs group III; d significant (P<0.05) Vs group IV
Gayal et al.
60 Journal of Veterinary Pharmacology and Toxicology/December 2012/Vol.11/Issue 1-2/59-61

8/13/2019 JVPT-2012_Vol11
http://slidepdf.com/reader/full/jvpt-2012vol11 65/108
endosulfan. These enzymes are used as an indicator ofdamage of vital organs in the body (Cornelius, 1989) andthus suggested that administration of these insecticidescaused necrotic changes in the liver leading to leakage ofthe enzymes into the blood. Choudhary and Joshi (2002)also reported dose dependent increase in the activities of
AST, ALT and acid and alkaline phosphatases afterexposure of rats orally @ 5, 10 and 15 mg/kg of endosulfanfor 15 to 30 days.
A significant (p<0.05) decrease in value of serumproteins (g/dl) was observed after 24, 48 and 72 h postadministration of endosulfan whereas no significantdifference could be observed in the values of serum albuminand globulin levels. Khurana et al. (1996) have alsoobserved significant suppression in total serum proteinsin broiler chickens fed 30 ppm endosulfan for 8 weeks.Similarly, decline in the values of total serum proteins wasalso reported in endosulfan exposed carp Cyprinus carpio by Jenkins et al. (2003). A significantly higher level of
creatinine at 24 h post administration of endosulfan wasobserved in poultry birds which indicated its nephrotoxiceffect as creatinine is considered as one of the importantbiomarkers for nephrotoxicity. Similar results were alsoreported in endosulfan intoxicated poultry birds (Rawat,2002; Kumar et al., 2010).
The cholesterol level was significantly increasedat 24 h post administration of endosulfan.Hypercholesterolaemia reported in this study might beattributed to the fact that endosulfan being lipophilic hastendency to interact with lipids and have inhibitory actionon their metabolism resulting in an increase in the levelsof cholesterol in the serum.A reduction in serum glucose
levels was observed in this study following endosulfanexposure in birds. Reduction in glucose levels was alsoreported for endosulfan in the carp Cyprinus carpio Jenkinset al. (2003).
It is concluded from this investigation thatendosulfan following multiple (5) oral dose @ 16 mg/kgadministration produce mild to moderate degree ofhepatotoxic and nephrotoxic effects in poultry birds.
REFERENCESChauhan, P.P.S. (2003). Effect of chlorpyrifos and
endosulfan on the production performance andimmunity in chickens. M.V.Sc, thesis submittedto G.B.P.U.A.& T, Pantnagar, India.
Choudhary, N. and Joshi, S.C. (2002). Effect of short termendosulfan exposure on haematology and serumanalysis of male rats. Ind. J. Toxicol . 9 : 83-87.
Cornelius, C.E. (1989). Liver function. In Kaneko, J.J. ed
Clinical Biochemistry of Domestic Animals.Academic Press Sandiego, New York, pp-386.
Das, B., Pervin, K., Roy, A.K., Ferdousi, Z. and Saha,A.K. (2010). Toxic effects of prolonged endosulfanexposure on some blood parameters in Albino rat.J. Life Earth Sci. 5 : 29-32.
Garg, S. (2000). Immunopathological effects of gamma-BHC and Quinolphos in Chicken. M.V.Sc Thesissubmitted to G.B.P.U.A&T.; Pantnagar, India.
Girdhar, N. and Singhal, K.K. (1989). Subacute toxicity oflindane (gamma-benzene hexachloride) inruminants. Indian J. Nutr . 62 : 133-139.
Gupta, N. (2001). Impact of butachlor and isoprptoron onthe immunity of chicken. M.V.Sc Thesis submittedto G.B.P.U.A & T.; Pantnagar, India.
Jain, N.C. (1986). Schalm’s Veterinary Haematology. 4th
Edn. Lea and Febringer, Philadeiphia.Jenkins, F., Smith, J., Rajanna, B.; Shameem, U.,
Umadevi, K., Sandhya, V. and Madhavi, R. 2003.
Effect of Sub-Lethal Concentrations of Endosulfanon Hematological and Serum BiochemicalParameters in the Carp Cyprinus carpio. Bull.
Environ. Contam. Toxicol . 70: 993–997.Khurana, R., Chauhan, R.S. and Mahipal, S.K. (1996).
Insecticide induced biochemical alteration insheep. Indian J. Vet. Res . 8 : 31-38.
Kumar, A., Singh, S.P. and Sharma, L.D. (2010).Immunotoxicological evaluation of chlorpyrifosfollowing medication with Withania Somnifera incockerels. J. Vety. Pharmacol. Toxicol. 9: 34-37.
Natt, M.P. and Herrick, C.A. (1952). A new blood diluentfor counting the erythrocytes and leucocytes of
the chicken. Poult. Sci. 31: 735-778.Rawat, D. (2002). Survey on residues of different pesticides
in Garhwal region of Uttaranchal and theirtoxicological evaluation in poultry. M.V.Sc. thesissubmitted to G.B.P.U.A.& T. Pantnagar, India.
Siddiqui, M.K.J., Anjum, F., Mahboob, M. and Mustafa,M. (1987). Effect of dimethoate on hepaticcytochrome P-450 and Glutathion-s-transferaseactivity in pigeon and rat. Indian. J. Exp. Biol. 29:1071-1073.
Varshaneya, C. (1983). Toxicological evaluation ofmalathion, lindane and endosulfan in Gallusdomesticus with special reference to hepaticmicrosomal drug metabolizing systems. Ph.DThesis submitted to G.B.P.U.A & T.; Pantnagar,India.
Received on: 23-04-12 Accepted on: 26-06-12
Toxicity of endosulfan in poultry
Journal of Veterinary Pharmacology and Toxicology/December 2012/Vol.11/Issue 1-2/59-61 61

8/13/2019 JVPT-2012_Vol11
http://slidepdf.com/reader/full/jvpt-2012vol11 66/108
1Professor, 2,4Asstt Prof., 3Professor and Head, Division of Pharmacology and Toxicology,FVSc & AH, R.S Pura, SKUAST -Jammu-181102.
5PhD Scholar, Division of Pharmacology and Toxicology, GADVASU, Punjab.*Corrosponding author: E mail: [email protected]
SUB ACUTE DERMAL TOXICITY OF BIFENTHRIN WITH SPECIAL
REFERENCE TO HAEMATO-BIOCHEMICAL CHANGES IN RAT
MUNEER AHMAD DAR*, RAJINDER RAINA1, NRIP KISHORE PANKAJ2 , MUDASIR SULTANA 3, PAWAN KUMARVERMA4 AND AADIL MEHRAJ5
ABSTRACT
The study was carried out to investigate the toxic effects of bifenthrin on hematology and biochemistry in rats afterrepeated dermal application for a period of 30 days. Twenty four rats were randomly divided into four groups of six rats each.Group I and Group III served as control for Group II and Group IV to which bifenthrin was applied (1/100 th LD50), respectively,for 20 and 30 days. Repeated dermal application of bifenthrin caused significant (P<0.01) decrease of Hb, PCV and TECafter 30 days of treatment. The value of TLC increased significantly (P<0.05) after 20 and 30 days. There was a significant(P<0.05) increase in MCV with marginal changes in values of MCH and MCHC. The AST activity increased significantly(P<0.01) only after 30 days of exposure. ALT and alkaline phosphate activities were increased both at 20 and 30 days with no
changes in values of acid phosphate, BUN, creatinine and plasma proteins. The results of present study indicated potentialof bifenthrin dermal application to alter haemato-biochemical indices in rats.
Key words: Bifenthrin, haematobiochemical, rat, subacute toxicity.
INTRODUCTIONPyrethroids account for 30 per cent of insecticides
used globally (Prasanthi et al., 2000). Though severetoxicity of pyrethroids has been uncommon in developedcountries, it appears common in developing countriesbecause of their extensive and intensive use for agriculturaland domestic purposes (Kakko et al., 2003). Availableliterature suggests pyrethroids exposure is of greatmagnitude throughout the (Narashi, 2000). The presentstudy was therefore undertaken to evaluate sub acutedermal toxicity of bifenthrin-type I pyrethroid on haemato-biochemical indices in Wistar rats.
MATERIALS AND METHODS
Experimental design Bifenthrin ( Biflex R 2.5% EC), available
commercially was obtained from local market for thisstudy. Adult wistar rats (150-250 gm b.wt) of either sexwere procured from Indian Institute of Integrative Medicine(CSIR), Jammu and acclimatized in the laboratoryconditions for a period of 2 weeks. The animals were
provided with standard pelleted food and water ad libitum .The protocol for conducting the experiments was dulyapproved by IAEC. Rats were randomly divided into fourgroups of six each. Group I and III served as control andwere applied with water. Group II and IV were topicallyapplied on interscapular region with bifenthrin (Biflex R
2.5% EC; FMC India Pvt. Limited, Tamil Nadu) @ 45mg/ kg for 20 and 30 days, respectively. Collection and processing of samples
The rats were anaesthetized with diethyl ether
and two sets of blood samples-1 ml(EDTA added @ 2 mg/ ml) for haematological and 3 ml (heparin @ 5-10 IU/ml)for separation of plasma for biochemical analysis. Hb, PCV,TLC, TEC, MCV, mean corpuscular haemoglobin (MCH)and mean corpuscular haemoglobin concentration (MCHC)were determined by using standard reference methods(Benjamin, 2001). Biochemical parameters like AST, ALT,alkaline phosphate and acid phosphate (Srivastava andBal,1994), creatinine and total plasma proteins(Hawk,1988) were determined after completion of trial.Statistical analysis
The significance of difference between two meanswas determined by unpaired Student’s t-test at levels of1(P < 0.01) and 5 (P < 0.05) percent (Snedecor andCochran, 1967).
RESULTS AND DISCUSSIONApplication of bifenthrin did not induce any
prominent toxic signs in exposed rats. However, ratsshowed loss of body weight, signs of nervousness andabnormal gait after 15-18 days of dermal application. Dermal
application of bifenthrin on skin caused scratching, lickingand biting in rats and these signs lasted for 15-20 min.The skin in and around application site showed burn typewound after 3 weeks of daily application of bifenthrin.
Repeated dermal application of bifenthrin did notproduce significant changes in values of Hb and PCV after20 days. However, both these indices were significantlydecreased in bifenthrin exposed animals after 30 days oftreatment. After 20 day of dermal exposure of bifenthrin,no significant alteration was observed in TEC which got
Research Article
62 Journal of Veterinary Pharmacology and Toxicology/December 2012/Vol.11/Issue 1-2/62-64

8/13/2019 JVPT-2012_Vol11
http://slidepdf.com/reader/full/jvpt-2012vol11 67/108
Dar et al.
decreased significantly after 30th day of treatment.Compared to control group, there was a significant increaseof TLC both after 20 and 30 days of exposure. Bifenthrintreated animals @ 45 mg/Kg/day as compared to controlshowed significant increase of MCV after 30 days oftreatment with no change in MCH and MCHC after both ofthese exposure periods (Table 1).
The daily dermal application of bifenthrin causedsignificant increase in the value of aspartateaminotransferase and a significant increase from controlafter 30 days of dermal exposure (Table 1). The activitiesof alanine aminotransferase and alkaline phosphatasewere significantly increased in comparison to control after20 days and onwards till 30th day of dermal exposure. Nosignificant alteration was observed in concentration of acidphosphate in bifenthrin treated animals as compared tocontrol after both of these exposure periods. Marginal andnon-significant increase of BUN and creatinine in treatedanimals as compared to control group were observed.Animals exposed to dermal treatment of bifenthrin revealednon-significant change in protein concentration of plasma(Table1).
The fall in haemoglobin could be due to interferencewith heme synthesis as has been reported for certaintoxins and drugs (Turk and Casted, 1997). Decline in
values of Hb and PCV have also been reported in dermaltoxicity of fenvalerate and decamethrin in rats (Mohamed,1988) and deltamethrin, fenvalerate and cypermethrintreated mice (Tosluty et al., 2001 and Haratym-Maj, 2002).Significant decreased value of TEC are in concurrencewith results of Mohamed (1988) who reported significantdecreased value of TEC after dermal application offenvalerate and decamethrin in rats. Low TLC value couldbe due corticosteroid mediated leucocytosis
Liver plays important role in metabolism to
maintain energy level and structural stability of body(Guyton and Hall, 2002). Aspartate transaminase amitochondrial enzyme plays a role in the metabolism ofamino acid aspartate and is predominantly found in theliver, skeletal muscles and kidneys. Alanineaminotransferase is a cytosolic enzyme which is morespecific for the liver than aspartate transaminase (Paliwalet al., 2009). The increase in transaminase activity inpresent study could be due to damage caused by ROSafter treatment with bifenthrin. Significant increase ofalkaline phosphatase activity was observed both after 20and 30 days of bifenthrin application. However, no suchalteration in acid phosphatase concentration was seen ateither time periods in treated animals. Similar to ourfindings Yousef et al. (2006) has also reported significantincrease in both alkaline and acid phosphatases indeltamethrin treated rats. The increase in phosphatasesdue to bifenthrin toxicity may be an adaptive sign againstpyrethroids poisoning. Non-significant and inconsequentialincrease of both BUN and creatinine in plasma wasobserved after 20 and 30 days of dermal application ofbifenthrin. Similar results of non-significant increase in BUNhave been reported by Shah and Gupta (2001) in ratsfollowing oral administration of permethrin for 30 days.Garg et al. (2004) also reported similar trend in fenvalerate
treated broiler chicks. The results revealed non-significantincrease in proteins of blood, both after 20 and 30 days ofdermal exposure. These results are in concurrence to thefindings of Shah and Gupta (2001) reporting non-significantalteration in total protein level in permethrin treated rats.Raina et al. (2009) observed significant increase in totalprotein in cypermethrin treated rats. It is concluded fromthis study that of bifenthrin dermal application @ 45 mg/ kg revealed potential to alter haemato-biochemical indicesin rats.
TABLE 1:Effect of repeated dermal application of bifenthrin on haematobiochemical parameters in rats.
Days of dermal application
Parameters 20 days 30 days
Group I Group II Group III Group IV
Haemoglobin (Hb) (g/dl) 11.33±0.71 10.07±0.26 11.40±0.26 9.73±0.0.40b
Packed cell volume (PCV) (%) 39.55±1.97 36.92±1.43 40.96±1.10 37.05±0.63b
Total erythrocytic count (TEC) (×106 /mm3) 8.38±0.49 7.59±0.41 8.72±0.66 6.50±0.29b
Mean corpuscular volume (MCV) (fl) 47.39±1.26 48.10±1.86 47.94±2.76 57.38±1.65a
Mean corpuscular haemoglobin MCH) (pg) 13.53±0.43 13.40±0.65 13.43±1.01 15.06±0.93Mean corpuscular haemoglobin concentration (MCHC) ( %) 28.56±0.41 27.84±0.71 27.92±0.46 26.27±1.48Plasma Aspartate aminotransferase (nmol pyruvate formed/min/ml) 35.24±2.71 39.71±2.19 33.46±3.11 43.93±1.23b
Plasma alanine aminotransferase (nmol pyruvate formed/min/ml) 21.29±2.11 30.64±2.04b 28.99±1.74 42.92±3.06b
Plasma Alkaline phosphatase (nmol pyruvate formed/min/ml) 121.64±2.80 134.92±4.32a 125.85±3.88 144.84±4.74b
Plasma Acid phosphatase (nmol pyruvate formed/min/ml) 4.01±0.42 5.04±0.52 3.12±0.36 4.04±0.40BUN (mg/dl) 12.36±0.62 14.16±0.73 11.82±0.72 13.81±0.86Creatinine (mg/dl) 1.02±0.03 1.11±0.07 1.08±0.05 1.19±0.06Protein (g/dl) 6.38±0.56 6.64±0.46 6.47±0.55 7.45±0.61
Values given are Mean ± SE of the results obtained from 6 animals unless otherwise stateda,b significantly different as compared to control values at 5% (P<0.05) and 1% (P<0.01) level of significance, respectively.
Journal of Veterinary Pharmacology and Toxicology/December 2012/Vol.11/Issue 1-2/62-64 63

8/13/2019 JVPT-2012_Vol11
http://slidepdf.com/reader/full/jvpt-2012vol11 68/108
REFERENCEBenjamin, M. M. (2001). Outline of Veterinary Clinical
Pathology. Kalyani Publishers, New Delhi-Ludhiana.
Garg, U. K., Pal, A. K., Jha, G. J. and Jadhao, S. B.(2004). Haemato-biochemical and
immunopathological effects of chronic toxicitywith synthetic pyrethroid, organophosphateand chlorinated pesticides in broiler chicks.Internat. Immunopharmacol. 4:1709-22.
Guyton, A. C. and Hall J. E. (2002). Text book of MedicalPhysiology, 9th ed. Prism Book (Pvt) Ltd.,Bangalore, India, pp Xliii+ 1148.
Haratym-Maj, A. (2002). Hematological alterations afterpyrethoid poisoning in mice. Ann. Agric.Environ. Med. 9: 199-206
Hawk, O. S. (1988). Practical Physiological Chemistry.13th edn, pp: 555.
Kakko, I., Toimela, T and Tahti, H. (2003). The
synaptosomal membrane bound ATPase on atarget for neurotoxic effects of pyrethroids ,permethrin and cypermethrin. Chemosphere .51: 475-480.
Mohamed, Z. A. (1988). Changes in rat blood profile andblood chemistry after repeated dermalapplication of fenvalerate and decamethrin.Egyptian J. Food Sci . 16: 79-86.
Narashi, T.(2000). Neuroreceptors and ion channel as thebasis for drug action: Past, present and future.J. Pharmacol. Exp. Therap . 294 (1):1-26.
Paliwal, A., Gurjar, R. K. and Sharma, H. N. (2009).Analysis of liver enzymes in albino rat under
stress of ë-cyhalothrin and nuvan toxicity.Toxeminar 12: 70-73.
Prasanthi, K., Muralidharan and Rajini, P. S. (2000).Fenvalerate induced oxidative damage in rattissue and its attenuation by dietary sesameoil. Food Chem. Toxicol . 43: 299-306.
Raina, R., Verma, P. K., Pankaj, N. K. and Vinay Kant.(2009). Ameliorative effect of á-tocopherol on
cypermethrin induced oxidative stress and lipidperoxidation in wistar rats. Internat.J.Med.Med.Sc. 1(9): 396-399.
Shah, M. A. A. and Gupta, P. K. (2001). Subacute toxicitystudies on permethrin-a synthetic pyrethoidinsecticide with particular reference tobiochemical changes in rats. Indian J. Toxicol.8 (1): 61-67.
Snedecor, G. W. and Cochran, W. G. (1967). StatisticalMethods. 6th ed. Ames: Iowa State UniversityPress.
Srivastava, A.K. and Bal, M.S. (1994) Microanalysis inPharmacology. 1st edn. Ludhiana. Punjab
Agricultural University.75-80.Tos-luty, S., Haratym-May, A., Latuszynska, J.,Obuchowska, P. D., Tokaska-Rodak, M. (2001).Oral toxicity of deltamethrin and fenvalerate inswiss mice. Ann. Agric. Environ. Med . 8: 245-254
Turk, J. R. and Casted, S. W. (1997). Clinical biochemistryin Toxicology. In: Kaneko, J. J., Harvey, J. W.and Brus, M. L. (ed). Clinical Biochemistry ofDomestic Animals. 5 th edn. pp 829-44.Academic Press, San Diego.
Yousef, M. I., Awad, T. I. and Mohamed, E. H. (2006)Deltamethrin induced oxidative damage and
biochemical alterations in rat and its attenuationby vitamin E. Toxicology. 227 (3): 240-247.
Received on : 15-07-2012 Accepted on : 12-09-2012
Toxicity of bifenthrin in rat
64 Journal of Veterinary Pharmacology and Toxicology/December 2012/Vol.11/Issue 1-2/62-64

8/13/2019 JVPT-2012_Vol11
http://slidepdf.com/reader/full/jvpt-2012vol11 69/108
Department of Pharmacology and Toxicology,College of Veterinary Sciences and Animal Husbandry
U.P. Pandit Deen Dayal Upadhyaya Pashu Chikitsa Vigyan Vishwavidyalaya EvamGau Anusandhan Sansthan, Mathura- 281 001, U.P., India.
*Corresponding author: E-mail: [email protected]
PREGNANCY-DEPENDENT ALTERATIONS IN FREQUENCY AND
AMPLITUDE OF MYOMETRIAL SPONTANEITY IN BUFFALOES
ABHISHEK SHARMA, SOUMEN CHOUDHURY, UDAYRAJ P NAKADE, RAJKUMAR SINGH YADAV ANDSATISH KUMAR GARG*
ABSTRACT
Myometrial autorhythmicity regulates physiology of pregnancy and labour. Present study revealed that buffalo uteriexhibit consistent pattern of myogenic spontaneity irrespective of the stages of pregnancy, however, the nature of uterineautorhythmicity differed between cycling non-pregnant (diestrous) and different stages of pregnant uterus. The amplitude ofspontaneous contractions was found to be increased as the pregnancy advanced and the late pregnant (6-8 months) uteriexhibited maximum spike heights (9.67 ± 0.67 g; n=30) compared to non-pregnant (1.95 ± 0.25 g; n=20), early pregnant(2.25 ± 0.45 g; n=18) and mid pregnant (3.83 ± 0.47 g; n=22) uteri. But the frequency (BPM) of myogenic spontaneitysignificantly (P<0.05) decreased with advancement of pregnancy and it was calculated as 0.71 ± 0.05 in non-pregnant(n=12), 0.43 ± 0.04 in early pregnant (n= 13), 0.30 ± 0.02 in mid pregnant (n= 33) and 0.11 ± 0.006 in late pregnant (n= 33)uterus. Based on our observation, it may be inferred that pregnancy-dependent alterations in the pattern of buffalo myometrialspontaneity help the uterus to be in almost quiescent state during most of the gestation period so as to accommodate thegrowing fetus and maintain pregnancy and possible reversal of this characteristics is responsible for induction of labour andparturition.
Key words: Autorhythmicity, buffalo, myometrium, pregnant.
Research Article
INTRODUCTIONMolecular and cellular signaling mechanisms
controlling uterine activity during pregnancy andreproductive disorders is not well understood both in humanbeings and animals. Human uterine muscle remains in
relatively quiescent state for majority of the pregnancystate and towards the end term series of events result ininitiation of pre-term labour and development of powerfulrhythmic contractions during delivery (Tribe, 2001).Combinations of hormonal, chemical and mechanicalsignals interact to down- or up regulate different contractilepathways during different stages of pregnancy.Myometrium is a phasic smooth muscle that exhibitsspontaneous and agonist-induced contractions. Therhythmicity and generation of such contractions isintimately related to oscillations in [Ca2+]
I(Wray, 2002)
and its excitability, in part, is governed by the restingmembrane potential which is determined by opposinginward (Na+, Ca2+) and outward (K+, Cl-) ionic fluxes andgeneration of slow waves and superimposed actionpotentials (Inoue et al., 1990).
The resting membrane potential graduallybecomes more depolarised as term approaches.Parkington et al. (1999) reported that the resting membranepotential increased from around –70 mV at 29 weeks to –55 mV at term and during labour and these changes areassociated with an increased frequency of contractions
and excitability of the myometrium is enhanced. In view ofpaucity of any information on uterine activity of buffaloesduring different stages of pregnancy, the present studywas undertaken to evolve effective therapeutic strategy fortreatment or prevention of preterm labour or other patho-
physiological states of myometrium in buffaloes.
MATERIALS AND METHODSTissue collection and preparation
Complete uteri along with the ovaries from cyclic(non-pregnant) and pregnant buffaloes were collected fromthe local abattoir of Mathura. The uteri were cut open incase of mid-or late stage pregnancy and foetus were takenout to determine the stage of pregnancy by measuringthe curved-crown versus rump (CRV) length of foetus byapplying the formula as suggested by Soliman et al. (1970).Uterine strips were dissected out from the midcornualregion of buffalo uterus and the myometrial strips of about3 mm x 1cm were prepared and transferred to a petri dishcontaining Ringer Locke solution (RLS). Both the ends oftissue strip were tied with thread and mounted in athermostatically controlled (37.0 ± 0.5OC) organ bath (UgoBasile) of 10 ml capacity containing continuously aeratedphysiological salt solution (RLS).
Calibration of physiograph and recording of
spontaneous myogenic activity
Journal of Veterinary Pharmacology and Toxicology/December 2012/Vol.11/Issue 1-2/65-68 65

8/13/2019 JVPT-2012_Vol11
http://slidepdf.com/reader/full/jvpt-2012vol11 70/108
Sharma et al.
Tissue tension changes were measured with the help ofhighly sensitive isometric force transducer and recordedin a PC using Lab Chart Pro V5.41 software programme(AD Instruments, Australia). After calibration, individualmyometrial strips were subjected to a constant restingtension of 2 gm and allowed to equilibrate for at least 1.5
to 2 hrs before recording the isometric tension in the tissue.Absolute tension of spontaneous myogenic activity(amplitude in gm) and frequency (beats per min; BPM) inmyometrial strips from non-pregnant and different stages(early, mid, late) of pregnant animals were calculated usingLab Chart Pro V5.41 software. Results were expressedas mean ± SEM.Multiple mean values among different groups were analysedby one-way ANOVA followed by Tukey’s post hoc testusing Graph pad prism 4.0 software and significancedifference at 5% level were considered.
RESULTS AND DISCUSSION
The pattern of spontaneous motility of isolatedmyometrial strips of non-pregnant (diestrous stage) anddifferent stages of pregnant buffaloes are illustrated in Fig.1. Following equilibration for about 2 hr, myometrial stripsexhibited a regular pattern of spontaneity which wascharacterized by consistent amplitude and frequency. Theaverage amplitude of myogenic spontaneity in non-pregnant and early pregnancy (1-3 months) stage wasfound to be 1.95 ± 0.25 g (n=20) and 2.25 ± 0.45 g (n=18),
respectively. However, as the pregnancy advanced, therewas increase in the height of spikes of spontaneouscontractions and it was calculated to be 3.83 ± 0.47 g(n=22) in mid pregnancy (3-6 months) and 9.67 ± 0.67 g(n=30) in late pregnancy (6-8 months) stages (Table.1 andFig.2).
Frequency (BPM) of myometrial spontaneityduring early pregnancy stage (1-3 months) and non-pregnant (Fig. 2) was found to be 0.43 ± 0.04 BPM (n=13) and 0.71 ± 0.05 BPM (n= 12), respectively. But as thepregnancy advanced towards mid stage (3-6 months), therewas decrease in the frequency of myogenic spontaneity(Fig. 2) and it was found to be 0.30 ± 0.02 BPM (n= 33)while towards the later stage of pregnancy (6-8 months),time interval between the consecutive spikes of myometrialcontractions further increased and it was found to be 0.11± 0.006 BPM (n= 33) as shown in Fig. 2 and Table 1.Thus, the present study on buffalo myometrium revealedthat the average amplitude (gm) and frequency (BPM) of
myometrial spontaneity are differed during different stagesof pregnancy.Like other phasic smooth muscles uterus also
exhibits autorhythmicity and the rhythmic electrical andmechanical activity regulate the physiology of pregnancyand labour. Interstitial cells of Cajal (ICC) like specializedpacemaker cells are considered to be responsible forgeneration of spontaneous rhythmicity in variety of smoothmuscles. Recently presence of similar cells resembling
Fig 1:Representative physiograph recordings of the spontaneous myometrial contraction of non pregnant (A), early pregnant
(B), mid pregnant (C) and late pregnant (D) buffaloes.
66 Journal of Veterinary Pharmacology and Toxicology/December 2012/Vol.11/Issue 1-2/65-68

8/13/2019 JVPT-2012_Vol11
http://slidepdf.com/reader/full/jvpt-2012vol11 71/108
to ICC has been demonstrated in rat and human uterus(Duquette et al., 2005). However, these cells did not showthe spontaneous electrical activity and thus the uterinepacemaking was suggested to be an intrinsic featureregulated by some other mechanisms (Shmygol et al.,2004).
Hyperpolarization of myometrial cells duringpregnancy makes the uterus less excitable and contributesto its quiescence, whereas when the tissue becomes moredepolarised towards the term, the excitability ofmyometrium is enhanced. It is now well established that
the resting membrane potential (RMP) of tissues isprimarily determined by opposing inward (Na+, Ca2+) andoutward (K+, Cl-) ionic fluxes (Tribe, 2001) and changes inexpressions of ion channels regulate these inward andoutward currents during different stages of pregnancy inmyometrial cells (Yoshino et al., 1997).
Increased Na+ current density towards the termin pregnant rat myometrium (Inoue and Sperelakis, 1991;
Yoshino et al., 1997) has been reported and the enhancedinward sodium current with faster kinetics is responsiblefor frequent repetitive spike generation to facilitatesimultaneous excitation and contractions in parturientuterus while reduction in both sodium and calcium inwardcurrent was observed in postpartum rat myometrial cells
(Yoshino et al., 1997). Therefore, the possibility of similarchanges in the ionic currents during different stages ofpregnancy and cycling buffaloes and their involvement inregulating myometrial spontaneity cannot be ruled out.
Calcium oscillatory mechanisms are welldocumented in number of smooth muscles (McHal et al.,2006). Intracellular release of Ca2+ was reported to beresponsible for this oscillation in urethra and ryanodine-sensitive, rather than IP3-sensitive store, is suggested asprime oscillator. Probable involvement of sodium/calciumexchange mechanism to trigger the intracellular Ca2+
release and thereby activating T- and L-type voltage –operated calcium channels to promote membrane
depolarization was documented as underlying mechanismsfor Ca2+-oscillation in smooth muscle (McHale et al., 2006).Withdrawl of Ca2+ from the physiological salt solution oraddition of L-type Ca2+ channel blockers consistentlyattenuated or abolished the spontaneous contraction inmyometrium (Parkington et al., 1999; Tribe, 2001); thusthe involvement of these Ca2+ channels/exchangersmechanisms in generating myometrial spontaneity andtheir regulation by pregnancy needs further investigations.
Regulation of myometrial spontaneity by BKCa
channels were reported earlier in rat and humanmyometrium (Anwer et al., 1993) and the decrease in Ca2+
sensitivity of BKCa
channels was considered to be the
underlying mechanism for enhancing membraneexcitability in laboring human myometrium (Khan et al.,1993; 2001). However, K
v channels, rather than BK
Ca
channels, were suggested to play crucial role in regulatingbasal rhythmicity in rat myometrium especially during midand late pregnancy (Aaronson et al., 2006). Involvementof K
ATP, K
v and BK
Ca channels in regulating myometrial
spontaneity in non-pregnant cyclic diestrous buffaloes wereTABLE 1:
Amplitude and frequency of myometrial spontaneity in non-pregnant and pregnant buffaloes.
Group Amplitude (g) % change in amplitude Frequency (BPM) % change in frequency
Non-pregnant 1.95 ± 0.25 ——- 0.71 ± 0.05 ———
(20) (12)Early pregnant 2.26 ± 0.45 15.9 0.43 ± 0.04* 39.44(0-3 months) (18) (13)Mid pregnant 3.83 ± 0.47 96.41 0.30 ± 0.02*# 57.75(3-6 months) (22) (33)Late pregnant 9.67 ± 0.67*#ψ ψ ψ ψ ψ 395.9 0.11 ± 0.006*#ψ ψ ψ ψ ψ 84.51(6-8 months) (30) (33)
Values expressed are Mean ± SEM. Figures in parentheses indicate the number of observations.Data were analysed by one-way ANOVA followed by Tukeys post-hoc tests. *P< 0.05 vs non-pregnant, #P<0.05 vs earlypregnant and ψ ψ ψ ψ ψ P< 0.05 vs mid pregnant.
Fig 2:
Representative physiograph recordings of the
spontaneous myometrial contraction of non pregnant (NP),early pregnant (EP), mid pregnant (MP) and late pregnant
(LP) buffaloes.
Myometrial spontaneity in buffaloes
Journal of Veterinary Pharmacology and Toxicology/December 2012/Vol.11/Issue 1-2/65-68 67

8/13/2019 JVPT-2012_Vol11
http://slidepdf.com/reader/full/jvpt-2012vol11 72/108
previously documented by Choudhury et al., (2010, 2011).We have shown that in the presence of glybenclamide, 4-AP and iberiotoxin, myometrial membrane is excited andeither there was change or increase in spontaneity in buffalouterus. Thus changes in the expression of these channelsmay be the underlying mechanism for alterations in
myogenic spontaneity of buffalo myometrium.Based on the results of the present study it maybe inferred that the pregnancy-dependent alterations inamplitude and frequency of myometrial spontaneity maybe regulated by altered characteristics and expressionsof ion channels governing the membrane potentials. Asuterine function are greatly influenced by reproductivehormones, thus possible endocrine regulation of these ionchannels in maintaining uterine rhythmicity cannot be ruledout. With the advancement of pregnancy stages, increasein the spike height of myometrial spontaneity may facilitateforceful uterine contractions required for expulsion ofgrowing fetus during parturition while feeble contractions
(low height contractions) are responsible for keeping theuterus in quiescent state during early and mid pregnancystates. However, the precise mechanism(s) responsiblefor these alterations in myogenic spontaneity during non-pregnant and different stages of pregnant buffalo uterusneeds further investigations.
REFERENCESAaronson, P. I., Sarwar, U., Gin, S., Rockenbauch, U.,
Connolly, M., Tillet, A., Watson, S., Liu B. andTribe R.M. (2006). A role for voltage-gated, butnot Ca2+-activated, K+ channels in regulatingspontaneous contractile activity in myometrium
from virgin and pregnant rats. Br. J. Pharmacol.147: 815–824.
Anwer, K., Oberti, C., Perez, G.J., Perez-Reyes, N.,Mcdougall, J.K., Monga, M., Sanborn, B.M.,Stefani, E. and Toro, L. (1993). Calcium-activatedK+channels as modulators of human myometrialcontractile activity. Am. J. Physiol. 265: C976–C985.
Choudhury, S., Garg, S.K., Singh, T.U., and Mishra, S.K.(2010). Cellular coupling of potassium channelswith α
2- adrenoceptors in mediating myometrialrelaxation in buffaloes (Bubalus bubalis) . J. Vet.Pharmacol. Therap. 33: 22-27.
Choudhury, S., Garg, S.K., Singh, T.U., and Mishra, S.K.(2011). Functional and molecular characterizationof maxi-K+ channels (BKCa) in buffalomyometrium. Anim. Reprod. Sci. 126(3-4): 173-178.
Duquette, R.A., Shmygol, A., Vaillant, C., Mobasheri, A.,Pope, M., Burdyga, T. and Wray, S. (2005).
Vimentin-positive, c-kit-negative interstitial cellsin human and rat uterus: a role in pacemaking.Biol. Reprod. 72: 276–283.
Inoue, Y., Nakao, K., Okabe, K., Izumi, H., Kanda, S.,Kitamura, K. and Kuriyama, H. (1990). Someelectrical properties of human pregnant
myometrium. Am. J. Obstet. Gynecol . 162:1090–1098.Inoue,Y. and Sperelakis, N. (1991). Gestational change in
Na+ and Ca+2 channel current densities in ratmyometrial smooth muscle cells. Am. J. Physiol.
260: C658-662.Khan, R.N., Matharoo-Ball, B., Arulkumaran, S. and
Ashford, M.L. (2001). Potassium channels in thehuman myometrium. Exp. Physiol. 86: 255–264.
Khan, R.N., Smith, S.K., Morrison, J.J. and Ashford, M.L.(1993). Properties of large conductanceK+channels in human myometrium duringpregnancy and labour. Proc. R. Soc. Lond. Ser.
B. 251: 9–15.McHal, N., Hollywood, M., Sergeant, G. and Thornbury,K. (2006). Origin of spontaneous rhythmicity insmooth muscle. J. Physiol. 570(1): 23–28.
Parkington, H.C., Tonta, M.A., Brennecke, S.P. andColeman, H.A. (1999). Contractile activity,membrane potential and cytoplasmic calcium inhuman uterine smooth muscle in the thirdtrimester of pregnancy and during labor. Am. J.Obstet. Gynecol. 81: 1145-1151.
Shmygol, A., Burdyga, T., Duquette, R., Mobasheri, A.,Vaillant, C. and Wray, S.(2004). Spontaneouselectrical activity in subpopulation of freshly
isolated rat uterine myometrial cells. J. Physiol.555: C167.
Soliman, M.K. (1970). Studies on the physiologicalchemistry of the allantoic, amniotic fluids ofbuffaloes at the various periods of pregnancy. Ind.Vet. J. 52: 106-112.
Tribe, R.M. (2001). Regulation of human myometrialcontractility during pregnancy and labour: arecalcium homeostatic pathways important. Exp.
Physiol. 86(2): 247–254. Wray, S. (2002). Role of the sarcoplasmic reticulum in
uterine smooth muscle. In: What is the Role ofthe SR in Smooth Muscle. Chichester, UK: WileyPress for the Novartis Foundation. pp: 6-25.
Yoshino, M., Wang, S.Y. and Kao, C.Y. (1997). Sodiumand calcium inward currents in freshly dissociatedsmooth myocytes of rat uterus. J. Gen. Physiol.110: 565–577.
Received on: 16-08-2012 Accepted on: 22-12-2012
Sharma et al.
68 Journal of Veterinary Pharmacology and Toxicology/December 2012/Vol.11/Issue 1-2/65-68

8/13/2019 JVPT-2012_Vol11
http://slidepdf.com/reader/full/jvpt-2012vol11 73/108
1Dept.of Pharmacology & Toxicology, 3Dept. of Microbiology, College of Veterinary Science College of Veterinary Science,Rajendranagar, Hyderabad; 2Assistant Director, Dept. of Pathology, NIN, Hyderabad (A.P.);
4Dept. of Pharmacology & Toxicology, College of Veterinary Science, Proddatur, A.P.*Corresponding author: [email protected]
PROTECTIVE ROLE OF VITAMIN E AND PHENYTOIN IN
CHLORPYRIFOS INDUCED DELAYED NEUROPATHY IN HEN
K. KAVITHA1, B. KALA KUMAR1,. S.S.Y.H QUADRI2, Y.N REDDY3 AND M. ALPHA RAJ4
ABSTRACT
The present study was carried out to evaluate the protective effect of vitamin E, an antioxidant and phenytoin, acalcium channel blocker against chlorpyrifos (CPF) induced oxidative damage . A total 72 adult white leghorn birds of 56weeks age were divided into four groups randomly. Group 1 served as control, Group 2, 3 and 4 were administered singledose of CPF @ 350mg/kg s/c divided over a period of 24 hrs. Vitamin E @ 50 mg/kg p.o as prior treatment for 10 days andphenytoin @50 mg/kg p.o as prior treatment for 4 days were given in groups 3 and 4, respectively. Blood was collected on3rd,7th,10th and 14th days of the treatment. Albumin, total protein in serum, GSHP
x and GSHR in RBC lysate and SOD, CAT, GSH
in spinal cord were assayed. Oxidative stress with CPF was manifested in terms of a significant (P<0.05) decrease in thelevels of serum albumin, total protein, GSH and inhibition of GSH-Px and GSH-R activities and an increase in SOD and CATactivities, however, reversal of these parameters occured by vitamin E without any effect of phenytoin. It is concluded that
oxidative stress could be one of the mechanisms of OP toxicity and antioxidants might provide a viable therapeutic regimen.Key words: Chlorpyrifos, OPIDN, oxidative stress, phenytoin, vitamin E, white leghorn,
Research Article
INTRODUCTIONOrganophosphate insecticides are the most widely
used in agriculture, public health and animal husbandryveterinary practices. Treatment of acute toxicity rescuesthe patient most often but this is followed by delayed neuro-toxicity in susceptible species and human beings.Previously, it was assumed that neuro target esterase(NTE) is target for producing delayed neurotoxicity(Richardson, 1995) but now, it is hypothesized thatincreased intracellular calcium and reactive oxygen species(ROS) are involved in developing organophosphosphateinduced delayed neurotoxicity (OPIDN) (Uchendu et al.,2012). Toxicity due to pesticides also produces cognitivealterations (Lopez-Granero et al., 2012) besides oxidativestress. Due to the involvement of oxidative stress, in thedevelopment of delayed neuropathy, the present study wasaimed at assessing the role of free radicals in developingOPIDN in hen and its alleviation using an antioxidant vitaminE and phenytoin, a calcium and sodium channel blocker.
MATERIALS AND METHODSWhite leghorns (layers) of 56 weeks age were
acclimatized to the laboratory conditions for a period of 1week. Permission was obtained from IAEC before performingthe experiment. The birds of approximately equal weightswere divided into, 4 groups of 18 birds each. Group 1 servedas control; Group 2 served as chlorpyrifos (CPF) control@350mg/kg s/c; group 3 as vitamin E+CPF (Vitamin Eprior treatment for about 10 days @ 50 mg/kg per orally)and group 4 as phenytoin + CPF (phenytoin prior treatment@50 mg/kg for 4 days per orally). Blood was collectedfrom the wing vein on 3, 7, 10 and 14 days for estimating
serum albumin (BCG Dye binding method), total protein(Lowry et al.,1951) employing kits supplied by Qualigens,Mumbai, India. Glutathione peroxidase (GSH-Px) (Pagliaand Valentine, 1967) and glutathione reductase (GSH-R)(Raghuramulu, 1983) were estimated in the RBC lysate.Spinal cord was collected in 10% Tris -HCl, pH 7.4,homogenized and centrifuged at 10,000 g for 15 min andthe supernatant was used for the estimation of GSH (Moronet al., 1979), superoxide dismutase(SOD) (Marklund, 1974)and catalase (CAT) activity (Caliborne, 1985). The data was analysed using SPSS 15.0 V softwareby one way ANOVA and tested for significant (P<0.05)differences by Duncan’s multiple comparison test.
RESULTS AND DISCUSSIONSerum albumin is a bio–marker, whose estimation
is in vogue recently, for exposure to OP compounds. OPcompounds covalently bind to albumin. In this experiment,there was a significant (P<0.05) fall in serum albumin inCPF treated groups 2,3 and 4 from 3rd day of the experiment(Table 1). The decrease in serum albumin was attributedto the binding of CPF to albumin. Added to decreased
availability of albumin for binding, hepatotoxicity at supracritical LD50
dose might have also affected protein synthesiscontributing to decreased albumin levels in this study.Group 2 recorded a sgnificant fall in serum albuminthroughout the study. The results comply with the findingsof Peeples et al. (2005).
Total proteins were estimated to assess thehepatotoxicity of CPF which undergoes oxidative de-sulfuration to yield chloryrifos oxon (CPO) by hepaticmicrosomal enzymes (Richardson, 1995). In the present
Journal of Veterinary Pharmacology and Toxicology/December 2012/Vol.11/Issue 1-2/69-71 69

8/13/2019 JVPT-2012_Vol11
http://slidepdf.com/reader/full/jvpt-2012vol11 74/108
study, the serum total proteins concentration was reducedin the CPF treated groups 2, 3 and 4, however, level ingroup 3 was significantly higher than groups 2 and 4 (Table1). Similar damage to the liver was observed by Osman(1999) who suggested increased production of ROS withCPF initiating oxidative damage and cytotoxic effects on
all organs including liver. Further, Bebe (2003) postulatedthat oxidative stress in liver occurred due to decreasedendogenous antioxidants leading to hepatic injury andinterference with the full expression of hepatocyte proteinsynthesis.
CPF is a xenobiotic that hastens up generationof super oxide anions. Superoxide dismutase and catalaseenzymes were estimated as an indirect indicator ofsuperoxide anion generation. Group 2 and 4 both registeredan increase in the activities of the SOD and CAT indicatingincreased generation of super oxide anion under theinfluence of CPF. In contrast, prior administration of vitaminE followed by CPF injection resulted in a significant (P<
0.05) decrease in SOD and CAT activities compared to
CPF control group (Tables 1). The findings of the presentstudy coincide with earlier investigations on vitamin E anddimethoate (John, 2001), ginger and malathion (Ahmed,2004), melatonin, vitamin C and E against CPF in lungs(Karaoz, 2002), kidney (Oncu, 2002) and rat erythrocytes(Gultekin, 2001). Similar results of attenaution of CPF
induced toxicity on liver and hematology was also reported(Acker et al., 2012).Glutathione, a tri-peptide thiol is the most
important free radical scavenger playing a major role inantioxidant defense mechanism of the body. Glutathionewith -SH group acts as a nucleophile donating electronsto electrophilic free radicals. Loss of electron would oxidizereduced GSH to oxidized (GSSG) form. This oxido-reduction inter play is under the aegis of GSHPxand GSHRenzyme system. In the present study, the GSH contentwas significantly (P<0.05) decreased in groups 2 and 4on day 3 and 7 which recovered by day 10 (Table 1). Ingroup 3, there was a significant (P<0.05) decrease in
glutathione concentration though the percent decrease was
TABLE 1:Serum protein levels (mg/dl) and antioxidative parameters following oral administration of Vit E and phenytoin for 14-daysin chlorpyrifos(350mg/kg, s/c) intoxicated layers.
Group 3rd day 7th day 10th day 14th day
Serum albumin concentration (g/dl)I (Control) 2.15 + 0.05 b 2.07 + 0.03b 2.13 + 0.05 b 2.20 + 0.08 b
II (CPF alone) 1.40 + 0.07 a 1.58 + 0.03 a 1.63 + 0.01 a 1.82 + 0.07 a
III (Vit. E + CPF) 1.88 + 0.30 a 1.93 + 0.03 ab 1.95 + 0.05 ab 2.05 + 0.04 b
IV (Phenytoin + CPF) 1.63 + 0.10 a 1.68 + 0.07 a 1.90 + 0.07 ab 1.95 + 0.08 ab
Serum total protein level (mg/dl)I (Control) 447.24 + 0.13d 443.88 + 0.89d 447.93 + 0.29d 450.59 + 0.51b
II (CPF alone) 323.36 + 0.35a 317.35 + 0.59a 348.61 + 0.28a 378.06 + 0.23a
III (Vit. E+CPF) 395.04 + 0.14c 406.40 + 0.52c 407.85 + 0.67c 405.21 + 0.32a
IV (Phenytoin+CPF) 328.04 + 0.11b 343.59 + 0.56b 385.21 + 0.68b 386.31 + 0.37a
Superoxide dismutase (SOD)activity (U/mg protein)I (Control) 07.59 + 0.36 a 08.42 + 0.33 a 07.41 + 0.45 a 07.49 + 0.34 a
II (CPF alone) 15.47 + 0.76 c 12.86 + 0.62 b 10.69 + 0.60 b 10.20 + 0.63 b
III (Vit. E + CPF) 11.40 + 0.77 b 09.12 + 0.38 a 08.15 + 0.30 a 08.46 + 0.33 ac
IV (Phenytoin + CPF) 14.22 + 0.34 c 12.07 + 0.84b 10.90 + 0.36 b 09.80 + 0.29 bc
Catalase (CAT) activity (µ moles/min/mg protein)I (Control) 2.12 + 0.84 --
a 2.43 + 0.84 a 2.33 + 0.16 a 2.24 + 0.18 a
II (CPF alone) 4.50 + 0.30 c 4.02 + 0.98 c 3.57 + 0.12 b 3.04 + 0.25 c
III (Vit. E + CPF) 3.84 + 0.32 b 3.14 + 0.98 b 2.95 + 0.14 a 2.42 + 0.12 ab
IV (Phenytoin + CPF) 4.39 + 0.39 c 3.95 + 0.13 c 3.49 + 0.21b 2.89 + 0.13 bc
Glutathione (GSH) concentration ( µg/g of protein)I (Control) 5.41 + 0.26 c 5.14 + 0.87 c 5.22 + 0.99 c 5.08 + 0.16 c
II (CPF alone) 2.49 + 0.50 a 2.59 + 0.13 a 3.33 + 0.15 a 3.33 + 0.10 a
III (Vit. E + CPF) 3.60 + 0.15 b 4.10 + 0.15 b 4.53 + 0.19 b 4.41 + 0.27 b
IV (Phenytoin + CPF) 2.61 + 0.11a 2.61 + 0.89 a 3.48 + 0.35 a 3.84 + 0.13 a
Glutathione peroxidase (GSHPX)activity (U/ml)
I (Control) 80.39 + 0.44 c 80.82+ 0.18 d 79.67 + 0.60 d 82.35 + 0.87 d
II (CPF alone) 49.77 + 0.87 a 45.42 + 0.15 a 50.39 + 0.13 a 52.15 + 0.14 a
III (Vit. E + CPF) 65.45 + 0.11b 70.09 + 0.58 c 73.32 + 0.66 c 75.71 + 0.89 c
IV (Phenytoin +CPF) 52.50 + 0.90 a 55.05 + 0.12 b 56.20 + 0.12 b 59.94 + 0.18 b
Glutathione reductase (GSHR) activity (units/ml)I (Control) 40.97 + 0.63 c 41.98 + 0.11 c 41.56 + 0.10 c 42.12 + 0.11 d
II (CPF alone) 21.97 + 0.12 a 20.32 + 0.82 a 25.31 + 0.75 a 27.27 + 0.90 a
III (Vit. E + CPF) 28.13 + 0.67 b 30.43 + 0.84 b 32.32 + 0.83 b 34.07 + 0.13 b
IV (Phenytoin + CPF) 22.88 + 0.10a 22.42 + 0.88 a 26.72 + 0.10 a 28.25 + 0.42 a
Values are Mean + S.E. (n=4); Means with different superscripts are statistically significant (p<0.05)
Kavitha et al.
70 Journal of Veterinary Pharmacology and Toxicology/December 2012/Vol.11/Issue 1-2/69-71

8/13/2019 JVPT-2012_Vol11
http://slidepdf.com/reader/full/jvpt-2012vol11 75/108
less compared to group 2 indicating protective role ofvitamin E in quenching the free radical and thus decreasingglutathione consumption. The present findings are inaccordance with Salama et al. (2005) who reported similarresults with glutathione.
GSHR and GSHPx enzyme activity serve as bio-
markers to assay regeneration of GSH and also forconversion of H2O2 formed from super oxide anion to water.CPF inhibited the activities of both the enzymes in group2,3 and 4 on the third day. However, the percent inhibitionin group 3 was less compared to groups 2 and 4 (Table 1).GSHP
x activity was never restored to normal till the end of
the experiment in all the three groups. GSHR activity wasalso inhibited in similar fashion, except for group 3 whichranged between groups 1and 2, manifesting the protectionprovided by vitamin E against CPF induced free radicals.Oncu (2002) with CPF and Bebe (2003) also observed fallin GSHP and GSHR activities in liver with CPF exposedrats. From the present study, it is concluded that CPF
impairs antioxidant defenses, thus favoring the progressionof stress due to ROS. Vitamin E could offer significantprotection in CPF induced oxidative stress in hens,whereas phenytoin was not effective.
REFERENCES
Acker,C.I., Souza, A.C.G., dos Sanos, M.P., Mazzanti,C.M. and Nogueira, C.W. (2012). Diphenyldiselenide attenuates hepatic and hematologictoxicity induced by chlorpyrifos acute exposurein rats. Environ. Sc. Poll. Res., doi.:10.1007/ s11356-012-0882-4.
Ahmed, M. and Hollingworth, R.M. (2004). Synergism of
insecticides provides evidence of metabolism ofmechanisms of resistance in the obliquebandedleaf roller Choristoneura arosaceana (Lepidoptera;Tortricidae). Pest-Manag.Sc . 60 : 465-473.
Bebe, F.N. and Panemangalore, M. (2003). Exposure tolow doses of endosulfan and chlorpyrifos modifiesendogenous antioxidants in tissues of rats.Journal
of Environ. Sc. Hlth. 38: 349-363.Caliborne, A.L. (1985). Assay of Catalase. In: Hand Book
of Oxygen Radical Research; Greenwald RA (Ed),CRC press, Baco- Raton.
John, S., Kale, M., Rathore,N., Bhatnagar, D., Kale, M.O.,Rathoxe, N. and Bhatnagar, D.2001. Protectiveeffect of vitamin E in dimethoate and malathioninduced oxidative stress in rat erythrocytes.School of Bio Chem. 12: 500-504.
Karaoz, E., Gultekin, F., Dogan, M., Oncu, M. andGokcimen A. (2002). Protective role of melatoninand a combination of vitamin C and Vit. E on lungtoxicity induced by chlorpyrifos ethyl in rats. Exptl and Toxicol. Pathol. 54: 97-108.
Lopez-Granero, C., Canadas, F., Diana, C., Yu, Y.,Gimenez, E. Luzano, R., Silva, A.D., Asclves, M.and Sanchez-santed, F. (2012). Chlorpyrifos –Diisopropylphosphorofluoridate and Parathion –induced behavioural and oxidative stress effects:Are they mediated by analogus mechanisms of
ction? Toxicological Sciences , Sep.17. Epubahead of publication.Lowry, O.H., Rosenbrough, M.J., Farr, A.L. and Randell,
R.A. (1951). Protein mesasurement with the folinphenol reagent. J. Biol. Chem. 193: 265-275.
Marklund, S.L. and Marklund, G.(1974). Involvement ofsuper oxide anion radical in the auto oxidation ofpyrogallol and a convenient assay for super oxidedismutase. European J. Bioche. 47: 469 – 474.
Moron, M.S., Depierre, J.W. and Mannervik, B. (1979).Levels of glutathione, glutathione reductase andglutathione - s- transferase in rat lung and liver.Biochem Biophy. Acta. 582: 67-68.
Oncu, M., Gultekin, F., Karaoz, E., Altuntas, I. and Delibas,N. (2002). Nephrotoxicity in rats induced bychlorpyrifos ethyl and ameliorating effects ofantioxidants. Human Exptl.l Toxicol. 21: 223-230.
Paglia, D.E. and Valentine, W.N. (1967). Studies on thequantitative and qualitative characterization oferythrocyte glutathione peroxidase. J. Lab. Clin.Med. 70: 158 –159.
Peeples, E.S., Lawrence, M.S., Ellen, G.D., Reggie, S.,Troy, V., Charles, M.T. and Oksana, L. (2005).Albumin, a new biomarker of organophosphorustoxicant exposure, identified by massspectrometry. Toxicological Sciences , 83: 303-
312Raghuramulu, M. (1983). Manual of Laboratory Techniques.
National Institute of Nutrition, ICMR Jamai-Osmania, Hyderabad pp. 204-206.
Richardson, R.J. (1995). Assesment of neurotoxic potentialof chlopyrifos relative to other organophosphoruscompounds: A critical review of the literature.Toxicology and Environmental Health , 44:135-65.
Salama, A.K., Osman, K.A., Saber, N.A. and Soliman,S.A. (2005). Oxidative stress induced by differentpesticides in the land snails, Helix aspersa.Pakistan Journal of Biological Sciences , 8: 92-96.
Uchendu, C., Suleiman, F.A. and Joseph, O.A. (2012).The organophosphorus pesticides, chlorpyrifos,oxidative stress and the role of some antioxidants:A review. African Journal of Agricultural Research ,7: 2720-28.
Received on: 16-11-2012 Accepted on: 22-12-2012
Vitamin E in CPF induced neuropathy
Journal of Veterinary Pharmacology and Toxicology/December 2012/Vol.11/Issue 1-2/69-71 71

8/13/2019 JVPT-2012_Vol11
http://slidepdf.com/reader/full/jvpt-2012vol11 76/108
1Assistant Director, Division of Toxicology, Krish Biotech Research Pvt Ltd, Kalyani, Nadia, West Bengal-741235.2Prof. & Head, VPT and Dean, C.V.Sc. & A.H., A.A.U. Anand, Gujarat-388001.
1Corresponding author: Email- [email protected]
STUDY ON IMMUNOTOXIC POTENTIAL OF ALPHACYPERMETHRIN IN
WLH CHICKS
NAVNEET KUMAR PANDEY1 AND A.M.THAKER2
ABSTRACT
The effect of repeated oral administration of alphacypermethrin on immune system of day old White Leghorn (WLH)chicks was assessed. Day old, 125 White Leghorn (WLH) chicks were randomly divided equally in five groups C
1, C
2, T
1, T
2
and T3. Birds of all the groups were administered New castle Disease (NCD) vaccine on day 7. Group C 1 and C2 served asuntreated control as well as vehicle control (corn oil), respectively. Birds of group T1, T2 and T3 were administered withalphacypermethrin at 14.0625 mg/kg, 18.725 mg/kg and 28.125 mg/kg body weight, respectively, for 28 days through oralgavage in corn oil. Blood samples were collected at two week intervals for evaluation of humoral and cell mediatedresponse. Lymphoid organs like thymus, spleen, bursa and liver were weighed at the time of necropsy for estimation ofabsolute and relative organ weight. Repeated oral administration of aphacypermethrin decreased New Castle Disease(ND) vaccine antibody titer, total protein, serum globulin and albumin. Organ weight and body weight were significantlyreduced but relative organ weight was unaffected. It is concluded that alphacypermethrin altered the immunological responsein white leghorn cockerels after 28 days repeated oral exposure.
Key words: Alphacypermethrin, cytotoxic, immunotoxicity, WLH chicks.
Research Article
INTRODUCTIONThe lowered immunocompetence in animals and
birds due to environmental pollutants my lead to increasedsusceptibility to infections, epidemics of disease andvaccine failures (Chauhan et al.1995). Immunotoxic effectof alphacypermethrin has been reported in animals,however, the information available in the literature regardingimmunopathological effects of alphacypermethrin in birdsis scanty. Therefore, the present investigation was plannedto study the effects of alphacypermethrin on immuneresponse of the birds.
MATERIALS AND METHODS
Experimental animals A total of 125, day old WLH chicks were procured
and housed at Central Poultry Research Station, AnandAgricultural University, Anand, Gujarat-388001.Experimental Design
Day old chicks were randomly divided into fivegroups (C
1, C
2, T
1, T
2 and T
3) of 25 each. All the chicks
were vaccinated with Marek’s disease vaccine (Georgiastrain) 0.2ml on zero day through subcutaneous route.On day 7 all the birds were vaccinated with New CastleDisease vaccine (Lasota strain). Chicks were givenstandard chick ration and water ad libitum. All standardmanagemental procedures were adopted to keep the birdsfree from stress.
LD50
of alphacypermethrin (Technical grade;Meghmani Corporation Pvt Ltd, Ahmedabad) , taken in toconsideration for this study was 562.5 mg/kg body weight
(Singh and Sharma, 2003). Group C1 and group C
2 were
untreated control and vehicle (corn oil) control respectively.Dose volume was administered at the rate of 1ml/kg bodyweight. Three different dose levels of alphacypermethrinin ascending order, i.e., 14.0625 (LD50/40), 18.725 (LD50/ 30) and 28.125 (LD50/20) mg/kg were formulated daily incorn oil and administered to group T
1, T
2 and T
3 for a period
of 28 days. Birds were observed for any toxic signs duringentire period of experimentation.Immunological Parameters
Six birds from each group were sacrificed after 14days and 28 days of completion of experimentation. Bloodsample was collected to separate serum, which was usedfor estimation of serum total protein, albumin and globulinlevels and New Castle Disease (NCD) vaccine antibodytiter by enzyme linked immunosorbent assay (ELISA)(Synder et al., 1984), Absolute and relative organ weightswere also estimated. Cell mediated immune response wasevaluated with DNCB dye dermal sensitization test(Khurana et al., 2000).
Statistical analysis All the values were expressed as mean ± S.E.M.Statistical analysis was done by using SPSS 7.5 software.Statistical significance (P<0.05) of differences betweentwo mean was assessed by one way ANOVA test.
RESULTS AND DISCUSSIONIn the present study, after exposure of
alphacypermethrin total serum protein, albumin andglobulin were decreased significantly in treatment groups
72 Journal of Veterinary Pharmacology and Toxicology/December 2012/Vol.11/Issue 1-2/72-75

8/13/2019 JVPT-2012_Vol11
http://slidepdf.com/reader/full/jvpt-2012vol11 77/108
as compared to control group expressed in Table 1. Thefall in total serum protein could be due to the stressogeniceffect of alphacypermethrin, or general toxic action thatalso leads to decrease in weight gain in the insecticidestreated birds. Significant decrease in total protein andalbumin content in serum indicating that alphacypermethrin
caused significant damage to vital organs and alsointerfered with protein metabolism. Reduction in total serumprotein has also been reported in cockerels followingprolong feeding of fenvalerate-medicated ration at the rateof 4000 ppm (Singh et al., 2001). Serum globulin level wasdecreased in all treated groups following feeding of broilerchicks with 20 ppm fenvalerate (Garg et al., 2004).
Globulin content in serum was also significantlydecreased on day 28 of study indicating thatalphacypermethrin affects the antibody production in dosedependent manner. Albumin to globulin ratio wassignificantly increased in T
3 group on day 28 of experiment
depicting the effect of alphacypermethrin on immune
response. Chauhan and Mahipal, (1994) reportedimmunotoxicity of cypermethrin in poultry and was notedthat when birds were fed with cypermethrin there was asignificant reduction in serum globulin and gammaglobulins, which is indicative of non-specific and generalreduction in immunity. No effect on serum albumin wasnoticed due to cypermethrin in chickens (Khurana et al.,1996a). Premlata et al. (2006) and Garg et al. (2004)reported decreased serum globulin levels in all fenvaleratetreated broiler chicks as compared to control, but therewas no change in serum albumin level. Fenvalerate (20
mg/kg body weight) oral administration in male rats resultedin significant (P<0.05) alterations in plasma proteins(Demerdash et al., 2004).
There was significant decrease in absolutethymus, liver, spleen and bursa weight as compared tocontrol birds on 28 day of study as expressed in Table 1.
Reduction in thymus weight also supported by hypotrophyof individual thymic lobes but the histopathologicalexamination did not show any decrease in lymphocytepopulations. Prater (2003) observed decrease in splenicand thymic organ weight and cellularity in dose-relatedmanner in mice, when 220-1100 mg/kg body weightpermethrin was dermally applied. The highest dose (55.4mg/kg) of cypermethrin resulted in a significant increaseof the relative liver weight (Institoris et al., 1999).
Decrease in liver and bursa weight was significantand supported by gross and histopathological observationof these organs. Liver showed fatty changes, necrosis andvaccuolations, may be the cause of decreased liver weight.
Rupture of bursal follicles and also decrease in folliculardensity was suggestive of decreased bursa weight due toalphacypermethrin toxicity in lymphoid organs.
In the present study antibody titre against NDVwas measured by ELISA to monitor humoral immuneresponse and DNCB dye test was done to monitor cell-mediated immunity. The results indicate significantdecrease (P<0.05) in antibody titres against ND vaccineon both day 14 and 28 of study in alphacypermethrintreated groups as compared to control group of birdsexpressed in Table 1. There was dose dependent decrease
TABLE 1:Effect of alphacypermethrin on antibody titer and absolute organ weight in WLH chicks (Mean ± SE; n=6).
Group/Dose (mg/kg b.wt) C1 Control) C
2(Vehicle control) T
1(14.0625) T
2(18.725 ) T
3(28.125)
14 days after treatmentTotal Protein (gm/dl) 2.48±0.04a 2.47±0.04a 2.18±0.14ab 2.14±0.09ab 2.09±0.11 b
Albumin (gm/dl) 1.30±0.03a 1.31±0.09a 1.15±0.07b 1.19±0.03ab 1.21±0.04 ab
Globulin (gm/dl) 1.183±0.061a 1.164±0.117a 1.043±0.087a 0.978±0.191a 0.876±0.108a
Alb : Glb 1.12±0.08a 1.23±0.21a 0.99±0.19a 1.49±0.11a 2.00±0.84a
NDV Antibody Titer 7595.17±411.37a 7439.83±787.94a 6658.00±296.44b 6141.64±581.20 bc 5641.64±392.32c
Liver (gm) 2.64±0.08a 2.65±0.24a 2.16±0.13a 2.55±0.26 a 2.36±0.18 a
Spleen (gm) 0.12±0.01a 0.12±0.02a 0.11±0.02a 0.13±0.01a 0.11±0.01a
Thymus (gm) 0.19±0.01a 0.21±0.02a 0.19±0.03a 0.19±0.01a 0.17±0.02a
Bursa (gm) 0.63±0.04a 0.61±0.06a 0.46±0.01a 0.51±0.04ab 0.44±0.05b
28 days after treatment
Total Protein (gm/dl) 2.86±0.19ab 2.64±0.07a 2.38±0.18b 2.30±0.12ab 2.24±0.06 b
Albumin (gm/dl) 1.38±0.08ab 1.59±0.13a 1.16±0.11bc 1.21±0.15ab 1.28±0.08 c
Globulin (gm/dl) 1.381±0.085ab 1.597±0.130a 1.208±0.155ab 1.102±0.109bc 0.978±0.085c
Alb : Glb 0.94±0 08a 0.82 ±0. 09a 0.77±0.05a 1.04±0 .12a 1.34±0.13 b
NDV Antibody Titer 3430.50±352.84a 3372.33±422.78 a 3169.50±131.43 a 3040.17±275.57ab 2958.67±212.35 b
Liver (gm) 6.97± 0.51a 6.54±0.59a 4.63±0.32b 4.13±0.36 b 3.87±0.48b
Spleen (gm) 0.46±0.03a 0.47±0.02a 0.26±0.02b 0.28±0.02b 0.23±0.02b
Thymus (gm) 0.49±0.02a 0.48±0.03 a 0.30±0.03b 0.26±0.03b 0.23±.03b
Bursa (gm) 1.18±0.17a 1.15±0.16a 0.87±0.04ab 0.95±0.08ab 0.68±0.07b
Data in the column having different superscript differ significantly (p< 0.05).
Journal of Veterinary Pharmacology and Toxicology/December 2012/Vol.11/Issue 1-2/72-75 73
Imunotoxicity of alphacypermethrin in chicks

8/13/2019 JVPT-2012_Vol11
http://slidepdf.com/reader/full/jvpt-2012vol11 78/108
in antibody titer of ND vaccine in all the treatment groups.Reduction in antibody titers against vaccine antigen wasan indication of suppression of humoral immune responseand diminished antibody synthesis.
The results indicated that alphacypermethrin wasfound to be immumnotoxic at the dose levels tested. Inother studies, humoral immune response of chicks was
judged by estimating HI titre against Lasota strain of NDVat the end of 11 week with highest titre (1600+/- 319) incontrol and lowest (906+/- 207) in chicks of high dosetreatment group. Siroki et al. (1994) also reported theimmunotoxicological effect of pyrethroid pesticides in mice.Suppression of humoral immune response was alsoobserved by alphamethrin in chickens (Singh et al., 1997).
There was significant difference in DTH responseto DNCB dye between treatment and control groups onday 14 after 24 and 48 hrs following primary sensitization
but on secondary sensitization on day 28, there was nosignificant increase in dermal thickness as expressed inTable 2. As upon secondary sensitization there was nosignificant change in skin thickness among treatmentgroup as compared to control, which indicates thatalphacypermethrin seems to be least deleterious as forthe cell mediated immune response is concerned. Theresults indicated that alphacypermethrin was found to beleast toxic or non toxic to cell mediated immune responseat dose rate administered in this study. Suhash (2004)reported that DNCB skin sensitivity test did not show anysignificant difference in skin thickness on cypermethrintreatment at dose rate of 3 mg/kg, 9 mg/kg and 30 mg/kgfor 28 days.
Fenvalerate (Singhal et al., 2001), cypermethrin(Khurana et al., 2000) and alphamethrin (Singh et al.,1997) caused suppression of CMI in chickens. Khuranaand Chauhan, (2000) reported suppression of CMI in lambsdue to fenvalerate exposure. Patel et al. (1996) reportedsignificant depression of cell mediated immunity andhumoral immune responses in cypermethrin treatedcrossbred male calves at the dose rate of 60 mg/kg body
weight for 30 days.An immune system is one of the most sensitive
target of pesticides owing to continuous proliferation anddifferentiation. The day old chicks are more susceptible
to toxicity on immune system as the lymphoid organsremains in growing phase. It was evident thatalphacypermethrin produced necrosis hemorrhages andfatty changes in liver. Spleen showed condensation andvacuolation. Thymus showed reticuloendothelial cellhyperplasia. Bursa showed rupture and atrophy of bursalfollicles. It is concluded from this study thatalphacypermethrin altered the immunological responsefollowing 28 days repeated oral exposure in white leghornchicks.
ACKNOWLEDGEMENTMeghmani Corporation Pvt Ltd, Ahmedabad, for
providing technical grade of alphacypermethrin for conductof the experiment.
REFERENCESChauhan, R.S. and Mahipal, S.K. (1994). Immunotoxicity
of pesticides in Poultry: Advances in VeterinaryResearch and Their impact on Animal Health andProduction. IVRI, Bareiley.
Chauhan, R.S., Bhushan, B., Khurana, S.K. and Mahipal,S.K. (1995). Effect of pesticide onimmunocompetence of animal and there publichealth significance in proceding of Indo-Germanconference on impact of Modern agriculture onEnvironment. pp. 169-178.
Demerdash, A., Yousef, M.I., Kedwany, F.S. andBaghdadi, H. (2004). Fenvalerate inducedchanges in oxidative stress: Hematobiochemicalparameters of male rats. J. Env. Sc and Hlth . 39
: 443 – 459.Garg, U.K., Pal, A.K., Jha, G.J. and Jadhao, S.B. (2004).
Haemato-biochemical and immuno-pathophysiological effects of chronic toxicity with
TABLE 2:
Effect of alphacypermethrin on DTH response (skin thickness, mm) in WLH chicks (Mean ± SE; n=6).
Group/Dose C1 (Control) C
2T
1T
2T
3
(mg/kg b.wt) (Vehicle control) (14.0625) (18.725 ) (28.125)After 14 days of treatment
Skin thickness (mm) At 24 hrs Lt side 0.22± 0.04a 0.18±0.03ab 0.15±0.01 b 0.12±0.01 b 0.09±0.02c
Rt side 0.15±0.02a 0.13±0.02 ab 0.09±0.02b 0.09±0.01b 0.09±0.20b
At 48 hrs Lt side 0.07±0.01 a 0.06±0.01 a 0.06±0.01 a 0.05±0.01 a 0.05±0.01a
Rt side 0.04±0.01 a 0.04±0.01 a 0.05±0.01 a 0.04±0.01a 0.03±0.01a
After 28 days of treatment
Skin thickness (mm) At 24 hrs Lt side 0.54±0.12a 0.50±0.11 a 0.42±0.07 ab 0.42±0.07 ab 0.36±0.05 b
Rt side 0.51±0.12 a 0.50±0.12 a 0.37±0.12a 0.39±0.08a 0.36±0.09 a
At 48 hrs Lt side 0.44±0.17a 0.44±0.16a 0.26±0.07a 0.36±0.09 a 0.27±0.08 a
Rt side 0.41±0.06 a 0.33±0.07 a 0.23±0.08 a 0.29±0.06 a 0.27±0.09 a
Data in the column having different superscript differ significantly (p< 0.05).
Pandey and Thaker
74 Journal of Veterinary Pharmacology and Toxicology/December 2012/Vol.11/Issue 1-2/72-75

8/13/2019 JVPT-2012_Vol11
http://slidepdf.com/reader/full/jvpt-2012vol11 79/108
synthetic pyrethroid, organophosphate andchlorinated pesticides in broiler chicks.International. Immunopharmacol. 4:1709–1722.
Institoris, L., Siroki, O., Undeger, U., Desi, I. andNagymajtenyi, L. (1999). Immunotoxicologicaleffects of repeated combined exposure by
cypermethrin and the heavy metals lead andcadmium in rats. Intern. J. Immunopharmacol .21(11): 735-743.
Khurana, R., Chauhan, R.S., Sharma, R. and Mahipal,S.K. (2000). Immunotoxic effects of cypermethrinon cell mediated immune response in chickens.Intern. J. Ani. Sci. 15: 33-38.
Khurana, R. and Chauhan, R.S. (2000).Immunopathological effects of fenvalarate on cellmediated immune response in sheep. J. Immunol.
Immunopathol . 2: 56-59Patel, B.J., Singh, S.P., Sharma, L.D. and Joshi, D.V.
(1996). In vivo immunosupression by cypermethrin
toxicity in crossbred calves. Indian J. Toxicol. 3(2):1-7.
Prater, M.R. (2003). Immunotoxicity of dermal permethrinand cis-urocanic acid: Effects of chemicalmixtures in environmental health. Dissertationsubmitted to the faculty of the Virginia PolytechnicInstitute and State University in partial fulfillmentof the requirements for the degree of Doctor ofPhilosophy in Veterinary Medical Sciences.
Premlata., Jain, S.K. and Punia, J.S. (2006).Hematologiclal and biochemical changes insubacute fenvalerate toxicity. Indian J. Ani. Sci.76(3): 233-235.
Singh, S.P., Sharma, L.D. and Chauhan, R.S. (1997).Immunotoxic effect of acute toxic effect ofalphamethrin in chicks .In: Proc. Nat. Symp. Adv.Vet. Path. Post Independence Era and XIV Ann.Conf. IAV, Izatnagar. 157-159.
Singh, B.P., Singhal, L.K. and Chauhan, R.S. (2001).
Fenvalerate induced cell-mediated and humoralimmune alterations in chickens. J. Immunol.Immunopathol . 3: 59-62.
Singh, S.P. and Sharma, L.D. (2003). Evaluation of medianlethal dose alphacypermethrin in 8 week old WLHcockerels. J .Vety. Pharmacolo and Toxicol. 3:90-93.
Singhal, L.K., Singh, B.P. and Chauhan, R.S. (2001).Fenvalerate induced stress and its effect on cell-mediated immunity ion chickens. Int. Symp. EndTech. Sec. CIGR Anim. Welf. Consider.
Siroki, O., Institoris, L., Tatar, E. and Desi, I. (1994).Immunotoxicological investigationn of SCMF, a
new pyrethroid pesticides in mice. Human and Exp. Toxicol. 13: 337-343.
Suhash, P. (2004). Studied sub acute toxicological effectof cypermethrin in wistar male and female rats.Ph.D Thesis submitted to University of Agriculturalsciences, Bangalore.
Synder, D .B., Marquadt, W.W., Mallinson, E.T., Savage,P.K. and Allen, D.C. (1984). Rapid serologicalprofiling by enzyme linked immunosorbent assay.III. Simultaneous measurement of antibody titreto infectious bronchitis, infectious bursal diseaseand New castle disease in single serum dilution.Avian Diseases . 28: 12 -24.
Received on: 12-08-2012
Accepted on: 16-11-2012
Imunotoxicity of alphacypermethrin in chicks
Journal of Veterinary Pharmacology and Toxicology/December 2012/Vol.11/Issue 1-2/72-75 75

8/13/2019 JVPT-2012_Vol11
http://slidepdf.com/reader/full/jvpt-2012vol11 80/108
1Ph.D.scholar IVRI, Izatnagar, 2Prof & Head, Department of Veterinary Pharmacology and Toxicology,
C.V.A.Sc. Pantnagar, Distt-U.S. Nagar, Uttarakhand, India.1Corresponding author: [email protected]
DEVELOPMENT OF THERAPEUTIC MODULE FOR JATROPHA CURCAS
SEED AND SEED OIL TOXICITY IN GOATS
AMIT SHUKLA1 AND S.P. SINGH2
ABSTRACT
The present study was designed to evaluate acute toxicity of Jatropha curcas seed and seed oil and to develop itstherapeutic module in goats. Acute toxicity study of Jatropha curcas seed and seed oil was evaluated using 15 goats equallyand randomly divided in five groups. Group I served as control. Group II and IV were given single oral dose of Jatropha curcas
seed @ 4 seed /kg b.wt. and seed oil @ 4ml/kg b.wt., respectively, followed by the therapeutic module comprising of sodiumthiosulphate ( 0.1565 gm/kg ) and glutathione ( 0.5 mg/kg ) in for 14 days. Groups III and V were given only single oral doseof seed and seed oil at the similar doses, respectively. Mild to moderate diarrhoea, dullness, depression and letharginesswere observed in groups III and V, whereas mild clinical signs were observed in few cases in treatment groups II and IV. Asignificant (P<0.05) decline in Hb, PCV, TEC ,TLC, total serum protein, albumin and globulin values in groups withouttreatment and an increase in serum creatinine, serum urea, cholesterol, AST , ALT and ALP were observed in all groups ,
however, the 14 days treatment with glutathione and sodium thiosulphate ameliorated hemato-biochemical parametersindicating the protective efficacy of therapeutic module in seed and seed oil intoxicated goats.
Key words: Acute toxicity, glutathione, goats, Jatropha curcas , sod, thiosulphate.
Research Article
INTRODUCTIONJatropha curcas Linn (Greek:-iatros-doctor, trophe-
food), known as Ratanjyot, Barbados nut, Purgeer boontjieetc. and popularly called diesel plant, is a member of theEuphorbiaceae family. Jatropha seed kernel contains 40-60% oil with a fatty acid composition similar to that of oilsused for human nutrition. However, the oil contains irritantphorbol esters which are the complex mixture of esters oftetracyclic diterpene phorbol, responsible for purgative , skin
irritant and tumorogenic actions. The seeds from J. curcas have been reported to produce toxicity due to the toxincurcin ,a ricin like toxalbumin characterized by burningand pain in mouth and throat, vomiting, delirium, decreaseof visual capacity and increased pulse with a high mortalityrate in rodents and domestic animals (Singh et al., 2010).A number of efforts have been made to explore the therapyof Jatropha toxicity in man and animals without satisfactoryoutcome. In view of this fact, this study was undertakento develop a therapeutic module for the treatment of acutetoxicity of seed and seed oil in goats.
MATERIALS AND METHODS
Experimental design The Jatropha seed and seed oil were collected
from Medicinal Plant Research and Developmental Centre(MRDC), G.B.P.U.A & T, Pantnagar. All the chemicalsrequired for this study were procured from Hi Media. 15goats of 16 to 18 months old weighing 28-32kg, were dividedrandomly and equally into five groups and experiment wasdesigned as mentioned in Table1.Hemato-biochemical parameters
4.0 ml of blood will be collected from each goat inclean heparinized microcentrifuge tube and hematologicalparameters such as packed cell volume, hemoglobin, totalerythrocyte count and total leucocytes count wereestimated immediately after the collection of bloodsamples. 0.1N-HCl was used for estimating the bloodhemoglobin concentration while Hayem’s RBC diluting fluidand Thomas’s WBC diluting fluid were used for TEC andTLC estimation (Jain, 1986). The serum total proteins
albumin, globulin, total cholesterol, creatinine and ureawere estimated by using ERBA diagnostic kits. Serumenzymes viz. aspartate aminotransferase, alanineaminotransferase (Moss and Henderson, 1994) and alkalinephosphatase were estimated by ERBA diagnostics kits.
RESULTS
Mild to moderate diarrhoea was observed in goatswithin 7 days post exposure in the group IV and V whereasit occurred after 10 days post administration of seeds intreatment groups II and III. Goats appeared dull anddepressed with reduction in the appetite in all groups 5days post exposure to seed and seed oil without anymortality. The effect of single dose of Jatropha curcas seedand seed oil with or without treatment on Hb, PCV,TEC andTLC values are presented in the Table2. There was asignificantly (P<0.05) higher value of Hb, PCV, TEC andTLC in both of the seed and seed oil plus treatment groupII and IV in comparison to seed and seed oil withouttreatment groups III and V at 14 th day of study.
As depicted in Table 3, there was no significant
76 Journal of Veterinary Pharmacology and Toxicology/December 2012/Vol.11/Issue 1-2/76-79

8/13/2019 JVPT-2012_Vol11
http://slidepdf.com/reader/full/jvpt-2012vol11 81/108
change on total serum proteins after 7 and 14 days exposurein all treated groups as compare to the control. The totalprotein values in seed and seed oil with treatment groups IIand IV were non significantly higher than the seed and seedoil without treatment group III and V after 14 days. Albuminlevel in seed oil plus treatment group was non significantlyhigher than the seed oil group without treatment. A significant increase in serum urea and creatininelevels in groups without treatment as compared to controlafter 14 day (Table 3), however, the serum urea levels in seedand seed oil plus treatment groups were significantly (P<0.05)lower than without treatment groups at both 7 and 14 dayinterval. A significant increase was also observed bloodcholesterol on 14th day in all treated groups as compareto the 0 day reading, however, a significant decline(P<0.05) in serum cholesterol value in seed and seed oilplus treatment groups (II and IV) was observed on 7th day.
As shown in Table 3, a significant (P<0.05) declinein the activity of the AST and ALT in treatment groups (II andIV) in comparison to the without treatment groups (III andV) was observed on 7th day interval indicating the efficacyof the therapeutic module. A significant (P<0.05) increasewas observed in all the groups as compare to control atboth 7 and 14 days interval, however, activity was less(P<0.05) in treatment groups (II and IV) in comparison towithout treatment groups (III and V) on both 7th and 14th
day interval.
DISCUSSIONEarlier appearance of the clinical signs in seed oil
than seed intoxicated goats in acute study indicated thatseed oil is more toxic than seed . This might be due to thehigher concentration of phorbol and diterpenes in Jatropha curcas seed oil . Seed and seed oil contains phorbol estersknown for its purgative effect (Gandhi et al., 1995) that occursdue to its stimulating effect on kinase-C enhancingintracellular signal transduction process (Makkar and Becker,1997). Jatropha seed also contain various other toxicprinciples i.e. curcin, phorbol esters, tannins etc (Ahmadand Adam, 1979; Lin et al., 2010) which cause direct GIT
TABLE1:
Therapeutic module for Jatropha curcas toxicity in goats
(n=3).
Groups Treatment Dose Day of dosing
I Control -_ _II Seed (T) 4 seed /kg 1st
Treatment* - 2-13III Seed (WT) 4 seed /kg 1st
IV Seed oil (T) 4ml/kg 1st
Treatment* - 2-13V Seed oil (WT) 4ml/kg 1st day
* Treatment was comprised of sodium thiosulphate @0.1565gm/kg bw IV route and glutathione @ 0.5 mg/kg bw via IMroute. T=with treatment; WT= without treatment.
T A B L E S 2 :
E f f e c t o n h a e m a t o l o g i c a l p
a r a m e t e r s f o l l o w i n g s i n g l e o r a l a d m i n i s t r a t i o n o f J a t r o p h a s e e d a n d s e e d o i l w i t h a n d w i t h o u t t r e a t m e n t f o r 1 4 d a y s i n g o a t s
( M e a n v a l u e ± S . E . , n = 3 ) .
H
b ( g / d l )
P C
V ( % )
T E C x 1 0 6 / µ l
T L C ( x 1
0 3 / µ l )
G R O U P S /
0
7
1 4
0
7
1 4
0
7
1 4
0
7
1 4
D A Y S
I
8 . 4
9 9 ±
8 . 4 6 ±
8 . 4
4 ±
2 5 . 3
3 ±
2 5 . 2
3 ±
2 5 . 4
0 ±
1 0 . 7
7 ±
1 0 . 7
2 ±
1 0 . 7
3 ±
1 0 . 4
3 ±
1 0 . 4
1 ±
1 0 . 4
0 ±
0 . 0
1 6
0 . 0
2 1 A
0 . 0
1 5 A
0 . 2
4
0
. 0 5 A
0 . 0
1 2
0 . 6
5 2
0 . 5 6 7 A
0 . 5
5 4 A
0 . 0
1 5
0 . 0 3
8 A
0 . 0
5 4 A
I I
8 . 4
9 ±
7 . 4 4 ±
7 . 0
3 ±
2 5 . 4
1 ±
2 3 . 7
3 ±
2 1 . 3
5 ±
1 0 . 6
9 ±
1 1 . 0
7 ±
1 0 . 0
6 ±
1 0 . 8
3 ±
9 . 9
2 ±
9 . 4
4 ±
0 . 0
2 6
0 . 0 3
0 a b A B
0 . 0
0 3 a b A B
0 . 0
4 6
0 . 2 3 a b A B
0 . 1
5 6 a b A B
0 . 4
5 6 a
0 . 5 6 2
a b A B
0 . 4
7 8 a b A B
0 . 4
3 6
0 . 2 3 1
a b A B
0 . 1
5 6 a b A B
I I I
8 . 4
6 ±
7 . 6 8 ±
6 . 4
7 ±
2 5 . 4
6 ±
2 2 . 3
7 ±
1 8 . 6
6 ±
1 0 . 6
9 ±
1 1 . 0
7 ±
1 0 . 0
6 ±
1 0 . 4
2 ±
9 . 4
7 ±
8 . 6
5 ±
0 . 1
0 6
0 . 0 1
7 a b A B G
0 . 0
0 2 a b A B G
0 . 0
7 1
0 . 0 2
8 a b A B G
0 . 0
1 2 a b A B G
0 . 3
4 4 a
0 . 3 4 9
a b A B
0 . 9
7 8 a b A B C
0 . 0
2 4
0 . 0
4 9 a b A B G
0 . 0
7 8 a b A B G
I V
8 . 4
8 ±
7 . 4 8 ±
7 . 1
6 ±
2 5 . 2
2 ±
2 1 . 6
9 ±
2 0 . 2
1 ±
1 0 . 6
5 ±
1 0 . 5
8 ±
8 . 8
4 ±
1 0 . 3
4 ±
8 . 4
8 ±
1 0 . 4
0 ±
0 . 1
1 6
0 . 0 1 7
a b A B G D
0 . 0
2 4 a b A B G D
0 . 0
6 9
0 . 0 3
9 a b A B G D
0 . 1
9 a b A B G D
0 . 7
5 6 a
0 . 9
3 4
a b A B D
0 . 0
7 6 a b A B C D
0 . 5
4 6
0 . 5
3 4 a b A B G D
0 . 5
7 6 a b B G D
V
8 . 4
6 ±
7 . 6 5 ±
6 . 7
4 ±
2 5 . 5
4 ±
2 5 . 1
5 ±
2 0 . 6
6 ±
1 0 . 6
7 ±
1 0 . 4
4 ±
8 . 7
3 ±
1 0 . 3
3 ±
9 . 4
6 ±
8 . 2
0 ±
0 . 0
3 6
0 . 0 4 9
a b A B C D
0 . 0
0 1 a b A B C D
0 . 1
7 4
0 . 1 8
2 a b A B C D
0 . 1
7 2 a b A B C D
0 . 0
8 9 a
0 . 0
7 5
a b A B D
0 . 1
2 8 a b A B C D
0 . 2
3 9
0 . 3
1 7 a b A B D
0 . 4
1 2 a b A B C D
•
T r e a t m e n t w i t h G l u t a t h i o
n e @ 0 . 5 m g / k g B W a
n d S o d i u m
t h i o
s u l p h a t e @ 0 . 1
5 6 5 g m / k g B W
•
M e a n b e a r i n g c o m m o n s u p e r s c r i p t w i t h s m a l l l e t t e r s d i f f e r s i g
n i f i c a n t l y ( P < 0 . 0
5 ) w h e n c o m p a r e d v e r t i c a l l y w i t h i n t h e s a m e c o l u m n & m
e a n v a l u e b e a r i n g
c a p i t a l a l p h a b e t s d i f f e r s
i g n i f i c a n t l y ( P < 0 . 0
5 ) w h e n c o m p a r e d h
o r i z o n t a l l y w i t h i n t h e s a m e r o w .
Journal of Veterinary Pharmacology and Toxicology/December 2012/Vol.11/Issue 1-2/76-79 77
Therapeutic module for Jatropha toxicity in goats

8/13/2019 JVPT-2012_Vol11
http://slidepdf.com/reader/full/jvpt-2012vol11 82/108
Shukla and Singh
irritation and cellular toxicity (Lin et al., 2003) which mightbe responsible for toxicity manifestation such ashepatotoxicity and nephrotoxicity in goats in this study. Lowlevel of clinical manifestation in groups treated with glutathionereveals the therapeutic potential of the therapeutic module.Glutathione plays a vital role in neutralizing the oxidativeradical and remove the electrophiles ,thus diminishes theirtoxic effect on the cells.
Hematological parameters such as Hb, PCV, TEC
and TLC decreased in seed and seed oil intoxicated groupsin acute toxicity. Fall in Hb, PCV, TEC and TLC might bedue to hemolytic activity of curcin. Furthermore, damage tothe GIT could also have resulted in poor digestion andabsorption of nutrients required for erythropoiesis (Chivandiet al., 2006). Leucopenia might be correlated with the stresscaused by anti nutritional factors as tannins, saponins,phytates etc present in the Jatropha meal (Feldman et al.,2000). Reduction in the total protein, albumin and globulin
TABLE 3:
Effect on different biochemical parameters following daily oral administration of Jatropha seed and seed oil with andwithout treatment for 14days in goats (Mean ±S.E. , n=3).
Parameter/groups I II III IV V
Total serum proteins (TSP, g/dl)
0 days 6.83±0.571 6.98±0.834 7.31±0.343 7.53±0.458 a
7.53±0.6457 6.81±0.475 6.49±0.767 7.24±0.178 5.94±0.057 a b 5.61±0.64814 6.79±0.605 8.65±0.417 7.35±0.414 7.08±1.946b 6.73±1.582Albumin (g/dl) 0 3.25±0.721 2.60±0.324 2.64±0.343 2.32±0.238 3.03±0.9457 3.81±0.925 2.70±0.627 2.70±0.178 2.82±0.451 2.45±0.04814 3.17±0.126 3.20±0.417 3.20±0.414 2.94±0.236 3.29±1.212Globulin (g/dl )
0 20.23±0.088 21.7±2.804a 24.66±1.898a 25.23±0.829 a 21.46±0.617 a
7 20.20±0.024A 33.40±0.692 a A,B 42.94±2.416 a A,BC 31.15±0.421 a ACD 47.26±0.581 a A,BCD
14 20.24±0.05A 33.60±1.191A B 46.73±1.421A BC 33.02±1.231 ACD 48.29±0.716 a A BD
Urea (mg/dl)
0 20.23±0.088 21.7±2.804a 24.66±1.898a 25.23±0.829 a 21.46±0.617 a
7 20.20±0.024A
33.40±0.692 a A,B
42.94±2.416 a A,BC
31.15±0.421 a ACD
47.26±0.581 a A,BCD
14 20.24±0.05A 33.60±1.191A B 46.73±1.421A BC 33.02±1.231 ACD 48.29±0.716 a A BD
Creatinine (mg/dl)
0 1.20±0.057 0.766±0.145a 1.066±0.133a 1.233±0.088 1.066±0.185 a
7 1.18±0.005 1.300±0.057b 1.366±0.088b 1.200±0.057 1.166±0.145 b
14 1.170±0.005 4.430±1.457a,b 6.376±1.214a,b 4.423±1.894 5.185±1.782 a, b
Cholestrol (mg/dl)0 66.32±0.761 68.85±0.432 a 66.96±1.01 a 66.99±0.896 a 66.69±1.32 a
7 66.76±0.612 80.73±0.03 ab 88.14±0.379 ab 84.87±1.604 ab 89.12±0.438 ab
14 66.73±0.634 96.87±1.20 ab 100.17±1.981 ab 94.04±2.261 ab 100.39±1.296 ab
Aspartate aminotransferase
(AST, U/L) 0 31.826±0.298 33.506±2.589a 30.05±0.723 a 41.24±3.805 a 32.06±1.926 a
7 31.79±0.338A 77.60±3.594 a A B 93.18±2.710 a ABC 61.10±4.066 ABC 70.54±7.475 a AC
14 32.14±0.008
A
98.220±5.831
a
102.57±10.85
a
72.34±9.663
a
69.05±5.981
a
Alanine aminotransferase (AST, U/L)
0 16.76±0.088 16.6±04.96 16.93±1.814 16.93±1.059 16.18±0.437 16.65±0.129 25.48±7.86 37.66±7.581 42.50±6.944 34.06±6.15514 16.38±0.07 42.92±6.78 49.72±12.232 54.46±4.364 51.64±12.322Alkaline phosphatase (ALP , U/L)
0 55.70±0.657 56.36±0.184 a 55.34±0.163a 56.01±0.768 a 56.75±0.175 a
7 55.62±0.405A 64.53±0.757 a b AB 69.92±0.078b ABC 56.45±0.057 abBCD 81.22±0.048 a b ABCD
14 55.44±0.605 A 68.18±1.457a,bB 79.70±1.434a,bBC 66.18±1.878 abBCD 91.22±1.582 a, bBCD
Mean bearing common superscript with small letters differ significantly (P<0.05) when compared vertically within the samecolumn & mean value bearing capital alphabets differ significantly(P<0.05)when compared horizontally within the same rowof the same parameter.
78 Journal of Veterinary Pharmacology and Toxicology/December 2012/Vol.11/Issue 1-2/76-79

8/13/2019 JVPT-2012_Vol11
http://slidepdf.com/reader/full/jvpt-2012vol11 83/108
were observed in the seed and seed oil intoxicated groups inacute toxicity study of Jatropha seed and seed oil. Alterationin protein profile indicates hepatorenal dysfunction andgastroenteritis which might have resulted due to presenceof curcin and phytates in Jatropha seed and seed oil. Similarfindings were reported by following Jatropha intoxication in
rats (Awasthy et al., 2010; Abdel safy et al., 2011). Therewas an increase in urea and serum creatinine level in seedand seed oil intoxicated groups indicating the nephrotoxicpotential of Jatropha as urea and creatinine act as indicatorsof the kidney damage. In addition, increased hepatic ureaproduction from amino acid metabolism could also beresponsible for an increase in urea concentration in the serum.Treatment significantly reduced the level of urea andcreatinine in both seed and seed oil with treatment groups IIand IV. Our results are in agreement with the findings ofGadir et al. (2003) in goats following oral administration ofJatropha seed at the dose of 1 and 0.25g/kg/day and Awasthyet al. (2010) in rats. A significant increase in serum
cholesterol level was observed in both seed and seed oilintoxicated groups in acute toxicity study . Liver is the majorsite of cholesterol synthesis and metabolism. Hepaticcholesterol homeostasis is maintained by equilibriumbetween the activities of the hydroxyl methyl glutarylCoenzyme A reductase and acyl coenzyme A cholesterolacyl transferase . The rise in activity of serum AST , ALT andALP enzymes could be attributed to damaged structural andcellular integrity of the hepatocytes and due to centrilobularnecrosis which in turn increased the leakage of the liverspecific enzymes . Being cytoplasmic in location, theseenzymes are released into systemic blood circulation aftercellular damage of hepatocytes (Ahmed and Khater, 2001).
It is concluded from the above study that the seed oil wasmore toxic than seed and the therapeutic modulecomprising sodium thiosulphate and glutathione revealedprotective efficacy against their toxicity in goats.
ACKNOWLEDGEMENTThe LSRB, DRDO, NEW Delhi duly acknowledged
for financial assistance for conducting this study.
REFERENCESAbdel-safy, S., Nasr, S. , Abdel, R. and Habeeb, S. (2011).
Effect of various levels of dietary Jatropha curcas seed meal on rabbits infested by the adult ticksof Hyalomma marginatum marginatum I. Animalperformance, anti-tick feeding and haemogram.Trop. Anim. Hlth. Prodn . 43(2): 347
Ahmed, M.B. and Khater, M.R. (2001).The evaluation ofthe protective potential of Ambrosia maritima extract on acetaminophen-induced liver damage.J. Ethnopharmacol . 75: 69-174.
Ahmed, O.M. and Adam, S.E. (1979). Effects of Jatropha
curcas on calves. Vet. Pathol . 16: 476-82.Awasthy, V., Vadlamudi, V., Koley, K., Awasthy, B. and
Singh, P.. 2011. Biochemical changes after short-term oral exposure of Jatropha curcas seeds inwistar rats. Toxicology international. 17 (2): 67-
70.Chivandi, E., Erlwanger, K.H., Makuza, S.M., Read, J.S.and Mtimuni, J.P. (2006). Effects of dietaryJatropha curcas meal on percent packed cellvolume, serum glucose, cholesterol andtriglyceride concentration and alpha-amylaseactivity of weaned fattening pigs. Res. J. Anim.Vet. Sci. 1: 18–24.
Feldman, B., Joseph, G., Zinkl, J. and Jain, N.C. (2000).Schalm’s Veterinary Hematology, 5th ed.,Lippincott Williams & Wilkins Co. Philadelphia.
Gadir, A., Onsa, T.O., Ali, W.E.M., El Badwi, S.M. andAdam, S.E.I. (2003). Comparative toxicity of
Croton macrostachys , Jatropha curcas , Piper abyssinica seeds in Nubian goats. Small Rum.Res. 48: 61–67.
Gandhi, V., Cherian, K. and Mulky, M. (1995). Toxicologicalstudies on Ratanjyot oil. Food Chem. Toxicol. 33:39–42.
Jain, N. (1986). Schalm’s Veterinary Haematology. 4th Ed.Philadeiphia, Lea and Febringer.
Lin, J., Yan, F., Tang, L., and Chen, F. (2003). Antitumoreffects of curcin from seeds of Jatropha curcas .Acta Pharmacol. Sinica . 24: 241–246.
Lin, J., Zhou, X., Wang, J., Jiang, P. and Tang, K. (2010).Purification and characterization of curcin, a toxic
lectin from the seed of Jatropha curcas. Prep.Biochem. Biotechnol. 40(2): 107-18.
Makkar, H.P.S. and Becker, K. (1997). Potential ofJatropha curcas seed meal as a proteinsupplement to livestock feed, constraints to itsutilization and possible strategies to overcomeconstraints to its utilization. In ProceedingsJatropha 1997: International symposium onBiofuels and Industrial Products from Jatropha curcas and other tropical oil seed plants, February23–27, Managua, Mexico
Moss, D. and Henderson, A. (1994). Clinical enzymology,In Tietz Textbook of clinical chemistry, 3rd ed.,C.A. Burtis and E.R. Ashwood, Eds. W.B.Saunders, Philadelphia. 617-721.
Singh, R., Singh, D. and Mahendrakar, A. (2010). Jatropha poisoning in children. Med. J. Armed Forces India.66: 80–81.
Received on: 16-07-2012 Accepted on: 28-10-2012
Journal of Veterinary Pharmacology and Toxicology/December 2012/Vol.11/Issue 1-2/76-79 79
Therapeutic module for Jatropha toxicity in goats

8/13/2019 JVPT-2012_Vol11
http://slidepdf.com/reader/full/jvpt-2012vol11 84/108
1Department of Veterinary Pharmacology & Toxicology, College of Veterinary Science, Tirupati - 517 5022Department of Veterinary Pharmacology & Toxicology, College of Veterinary Science, Proddatur - 516 360;
3Dean of Veterinary Science, Sri Venkateswara Veterinary University, Tirupati - 517 502. Corresponding Author:E-mail- [email protected]
PROTECTIVE EFFECT OF TRIANTHEMA PORTULACASTRUM ON
CADMIUM INDUCED TOXICITY IN RATS
Y. PAVAN KUMAR1, K. ADILAXMAMMA2, U. VENKATESWARLU1, T.S. CHANDRASEKHARA RAO3
AND M. ALPHA RAJ2
ABSTRACT
The protective role of alcoholic extract of T. portulacastrum was studied in cadmium induced toxicity in rats. Fiftymale albino Wister rats weighing (160-180) g were divided into five groups of ten each. Group I served as control; Groups II,III, IV and V received CdCl2 @ 8 mg/kg b. wt. per orally from Day 1 to Day 15. Groups III, IV and V also received alcoholic extractof T. portulacastrum @ 200 mg/kg b. wt, Nefroliv @ 100mg/kg b. wt. and Vitamin E @ 50 mg/kg b. wt. respectively by intragastric intubation from Day 1 to Day 30. The serum biochemical parameters (ALT, AST, BUN, Creatinine, GSH), erythrocyteantioxidant enzymes (GPx, GR, CAT) were monitored on Day 15 and on Day 30. At the end of Day 30 animals were sacrificed
and liver and kidney samples were collected for estimation of lipid peroxidation, superoxide dismutase and histopathologicalexamination. Administration of CdCl2 resulted in increase of serum enzymes (ALT, AST, BUN, Creatinine) and lipid peroxidationin liver and kidney. The erythrocyte antioxidant enzymes (GPx, GR, CAT), SOD, GSH were decreased. Treatment with alcoholicextract of T. portulacastrum , Nefroliv and vitamin E significantly ameliorated (P<0.01) toxic effects of CdCl2 by restoringbiochemical and histopathological changes to normal. It is concluded that alcoholic extract of T. portulacastrum exhibitedprotective property in CdCl2 induced toxicity, which was comparable to Nefroliv and Vitamin E.
Key words: Cadmium, nephrotoxicity, rats, trianthema portulacastrum .
Research Article
INTRODUCTIONCadmium, a heavy metal well known to be highly
toxic to both human and animals, distributed widely in theenvironment and is responsible for multiple pathologies(Hall et al., 2012). The metal is widely distributed both bynatural and anthropogenic sources, of which anthropogenicsources adds 3-10 time more to the contamination (Patraet al., 2011). Some of the toxic effects of cadmiumexposure include testicular atrophy, renal dysfunction,hepatic damage, hypertension, central nervous systeminjury and anemia including high blood pressure, braindamage, diarrhea, infertility, immune suppression, anddevelopment of cancer including generation of reactiveoxygen species (ROS) (Bagachi et al., 2000). Chronicexposure to cadmium (Cd) causes hepatotoxicity andnephrotoxicity (Sarkar et al., 1995) through accumulation
mainly in the liver and kidney. Further, the role of cadmiumin carcinogenesis, inhibition of DNA repair and apoptosiswas also reported (Hanahan and Weinberg, 2000).Cadmium has strong affinity for biological structurescontaining -SH groups with indirect effects on multiplecellular and enzymatic systems resulting in poor health(Helbig et al., 2008). Indigenous medicinal plant Trianthema portulacastrum Linn. (Family: Aizoaceae) has been usedin the treatment of edema of liver and spleen (Stohs et al.,
2000) and is also reported to have antioxidant property
(Kumar et al., 2005), therefore, it was evaluated for itspotential to mitigate the oxidative stress, hepatotoxicityand nephrotoxicity induced by cadmium in this study.
MATERIALS AND METHODSExperimental animals
Male albino rats of Wistar strain weighing 160 –180 g were obtained from the department of LaboratoryAnimal Medicine, Tamil Nadu Veterinary and AnimalSciences University, Madhavaram milk colony,Madhavaram, Chennai. and acclimatized for 15 days beforethe conduct of the experiment. Approval was obtained fromIAEC for conducting this study.Drugs and chemicals
Cadmium chloride was procured from SRL Pvt.Ltd, Mumbai, India. Nefroliv was procured from Indian Herbs
Research and Supply Co. Ltd. Darra Shivpuri, Saharanpur,UP, India. All chemicals were of analytical grade (AR)and procured from Qualigens , S R L Pvt. Ltd and S DFine Chemicals Ltd.Plant materials and preparation of extract
Whole plant of T. portulacastrum was collectedfrom the local market and surrounding areas of Tirupati,Andhra Pradesh, India and authenticated by theDepartment of Botany, S. V. University, Tirupati.
Whole plant of T. portulacastrum was dried in
80 Journal of Veterinary Pharmacology and Toxicology/December 2012/Vol.11/Issue 1-2/80-84

8/13/2019 JVPT-2012_Vol11
http://slidepdf.com/reader/full/jvpt-2012vol11 85/108
shade. Later it was powdered and extracted (1.5 kg) with6 L of 70 % alcohol in a soxhlet extractor for 18-20 hours.The extract was distilled and concentrated to dryness underreduced pressure and controlled temperature (40-50oc) andfinally freeze-dried. The ethanolic extract yielded a weightof 150 g (10 % w/w).
Experimental design Fifty rats were randomly divided into five groups,each containing 10 rats. Group I received 0.5 % carboxymethyl cellulose (CMC) p.o. for 30 days as the vehicle.Group II to V received aquous solution of CdCl2 @ 8 mg/ kg b.wt. /day p.o. for 15 days. Feed and water waswithdrawn 6 hrs before the administration of drug. GroupIII was given alcoholic extract of T. portulacastrum @ 200mg/kg b.wt./day, p.o., from day 1 to day 30. SimilarlyNefroliv in 0.5 % CMC and Vitamin E (in olive oil) wereadministered to groups IV and V @100 mg/kg b. wt. and50 mg/kg b.wt., respectively, from day 1 to day 30.
Blood was collected from retro-orbital sinus under
ether anesthesia on Day 15 and Day 30 in both EDTAadded and non-EDTA added vials. Serum was used for theanalysis of biochemical parameters like ALT, AST, BUN,Creatinine (Span Diagnostic Ltd) and total glutathione(Moron et al., 1979) where as erythrocytes were used forthe analysis of oxidative parameters, viz. glutathioneperoxidase (GPx) (Paglia and Valentine, 1967), glutathionereductase (GR) (Raghuramulu, 1983), catalase (CAT)(Aebi, 1984). At the end of experiment animals wereeuthanized and liver and kidney were collected forhistopathology (Singh and Sulochana, 1997) and assayof superoxide dismutase (SOD) (Marklund and Marklund,1974) and lipid peroxidation (LPO) (Yagi and Rastogi, 1979).
The data was subjected to statistical analysis byapplying two way ANOVA using SPSS 15.0 v software.Significant differences between groups and days weretested using Duncan’s multiple comparison test andsignificance was set at P<0.05.
RESULTS AND DISCUSSIONThe serum enzymes AST and ALT were reported
to serve as biomarker indices of the extent of tissuedamage, especially liver, kidney and heart (Kaneko et al.,2008). The concentrations of AST and ALT in the plasmaof rats fed with CdCl2 were significantly (P<0.01) elevatedindicating cadmium related injury to the liver, kidney andheart (Hu et al., 1991). The levels of BUN and creatinine inthe plasma of rats are indicators for kidney functions (Huet al., 1991). In the present study, the serum creatinineand BUN levels were significantly increased in CdCl
2 control
group as compared to the remaining groups, suggestingimpairment of renal function (Hwang et al., 2001). Thedecreased serum values of ALT and AST in ameliorationgroup suggest the protective role of alcoholic extract of T.portulacastrum on liver (Mandal et al., 1997) and decreased
levels of BUN andcreatinine suggestnephroprotection. Thenephroprotection couldbe attributed to itsdiuretic activity of the
constituents namely,potassium nitrate andpunarnavine (Khan,2003).
The antioxidantdefense profile wasstudied in order toassess the extent ofcadmium induced freeradical damage in thebiological system.Cadmium was reported toinhibit the activities of
most of the anti-oxidantenzymes including thiols(Helbig et al., 2008),leading to the intracellular accumulation ofreactive oxygen specieswith subsequent damageto liver and kidney.Cadmium depletesglutathione and proteinbound sulfhydryl groupsresulting in enhancedproduction of reactiveoxygen species such assuperoxide ions,hydroxyl radicals andhydrogen peroxides.These reactive oxygenspecies result inincreased lipidperoxidation (Stohs et al., 2000). Theperoxidative damage tothe cell membrane maycause injury to cellular
components due to theinteraction of metal ionswith the cell organelles(Sarkar et al., 1995).
The results ofGSH, GPx, GR and CATactivities were shown inTable 1 and 2, whichshowed a significantlyreduced (P<0.01) in
T A B L E 1 :
E f f e c t o f T . P o r t u l a c a s t r u m
o n b i o c h e m i c a l s p a r a t m e t e r s i n c a d m i u m i n d u c e d t o x i c i t y i n r a t s .
G r o u p s
A L T ( U / L )
A S T ( U / L )
B U N
( m g / d l )
C r e a t i n i n e ( m g / d l )
G S H
( m g / 1 0 0 m l )
D a y 1 5
D a y 3 0
D a y 1 5
D a y 3 0
D a y 1 5
D a y 3 0
D a y 1 5
D a y 3 0
D a y 1 5
D a y 3 0
I
3 0 . 8 3 + 0 . 8 2 a A
3 0 . 6 7 + 0 . 6 1 a A
1 1 4 . 5 0 + 1 . 7 2 b A
1 1 4 . 5 0 + 1 . 2 9 b A
2 0 . 3 1 + 0 . 4 5 a A
2 0 . 1 3 + 0 . 3 5 a A
0 . 6
3 8 + 0 . 0 1 5 a A
0 . 6 3 2
+ 0 . 0 0 7 b A 3 5 . 9 8 + 1
. 2 0 c A
3 5 . 4 4 + 1 . 0 1 b c A
I I
6 2 . 8 3 + 1 . 5 1 d A
5 7 . 6 7 + 1 . 3 2 c B
1 6 6 . 1 7 + 1 . 9 1 e A
1 6 2 . 3 3 + 2 . 1 7 e B
4 5 . 5 4 + 1 . 1 3 e A
4 3 . 1 4 + 0 . 9 3 d B
0 . 8
0 8
+ 0 . 0 1 9 c A
0 . 7 9 3
+ 0 . 0 2 1 c A 1 4 . 8 3 + 1 . 0 9 a A
1 7 . 1 1 + 1 . 2 3 a B
I I I
3 3 . 3 3 + 1 . 1 2 b A
3 2 . 3 3 + 0 . 4 6 a A
1 2 1 . 6 7 + 2 . 4 4 c A
1 2 0 . 5 0 + 1 . 3 2 c A
2 2 . 4 1 + 0 . 4 3 b A
2 0 . 3 2 + 0 . 3 5 a B
0 . 6
2 5 + 0 . 0 1 3 a A
0 . 6 0 0
+ 0 . 0 1 3 a b B 3 3 . 7 3 + 0
. 9 5 c A
3 7 . 3 3 + 1 . 8 8 c B
I V
4 4 . 3 3 + 1 . 8 7 c A
3 5 . 6 7 + 1 . 3 2 b B
1 3 7 . 5 0 + 1 . 7 6 d A
1 2 5 . 8 3 + 1 . 7 1 d B
2 5 . 4 4 + 0 . 4 8 c A
2 2 . 0 6 + 0 . 6 7 b B
0 . 7
0 3 + 0 . 0 1 9 b A
0 . 6 1 5
+ 0 . 0 2 0 a b B 2 9 . 1 7 + 1 . 0 8 b A
3 2 . 2 4 + 0 . 8 9 b B
V
3 2 . 6 7 + 1 . 9 1 a b A
3 0 . 1 7 + 0 . 8 2 a B
1 0 5 . 1 7 + 2 . 5 1 a A
9 9 . 0 0 + 1 . 6
0 a B
2 7 . 5 1 + 0 . 3 4 d A
2 5 . 5 2 + 0 . 4 2 c B
0 . 6
5 2 + 0 . 0 1 1 a A
0 . 5 9 0
+ 0 . 0 0 9 a B 3 3 . 5 8 + 1
. 1 3 c A
3 7 . 1 5 + 1 . 8 5 c B
V a l u e s a r e M e a n + S . E . ( n = 6 ) T w o w a y A N O V A f o l l o w e d b y D u n c a n ’ s m u l t i p l e c o m p a r i s o n t e s t u s i n g S P S S 1 5 . 0 v
V a l u e s w i t h d i f f e r e n t s u p e r s c r i p t s a r e s i g n i f i c a n t l y d i f f e r e n t ( p < 0 . 0 1 )
L o w e r c a s e a l p h a b e t s f o r v e r t i c
a l c o m p a r i s o n ; U p p e r c a s e a l p h a b e t s f o r
h o r i z o n t a l c o m p a r i s o n .
Cadimum toxicity in rats
Journal of Veterinary Pharmacology and Toxicology/December 2012/Vol.11/Issue 1-2/80-84 81

8/13/2019 JVPT-2012_Vol11
http://slidepdf.com/reader/full/jvpt-2012vol11 86/108
TABLE 2:Effect of T. Portulacastrum on erythrocyte antioxidant enzymes in cadmium induced toxicity in rats
Groups GPx (U/ml) GR (U/ml) CAT (KU/g Hb)
Day 15 Day 30 Day 15 Day 30 Day 15 Day 30
I 25.14 + 0.86dA 25.00 + 0.96bA 21.28 + 0.33dA 20.91 + 0.91cA 23.25 + 0.98dA 22.67 + 0.51bA
II 14.57 + 0.30aA 15.80 + 0.26aB 7.14 + 0.11aA 9.10 + 0.41aB 14.89 + 0.51aA 14.83 + 0.46aA
III 23.21 + 0.60cA
24.78 + 0.66bB
17.21 + 0.18cA
19.71 + 0.30cB
21.14 + 0.82cA
22.89 + 0.63bB
IV 20.59 + 0.51bA 23.92 + 0.29bB 13.39 + 0.19bA 17.97 + 0.69bB 19.37 + 0.58bA 21.62 + 0.67bB
V 21.13 + 0.81bA 24.81 + 0.57bB 21.70 + 0.18dA 23.72 + 0.56dB 21.99 + 0.80cdA 23.12 + 0.52bB
Values are Mean + S.E. (n=6) Two way ANOVA followed by Duncan’s multiple comparison test using SPSS 15.0 vValues with different superscripts are significantly different (p<0.01)Lowercase alphabets for vertical comparison; Uppercase alphabets for horizontal comparison.
TABLE 3:
Effect of T. Portulacastrum on LPO and SOD in Liver and Kidney in Cd induced toxicity in rats
Groups LPO (n mol of MDA formed/g tissue) SOD (units/mg protein)
Day 30 (Liver) Day 30 (Kidney) Day 30 (liver) Day 30 (kidney)
I 34.60 + 1.18a 32.62 + 0.51a 6.717 + 0.154bc 5.372 + 0.130c
II 87.14 + 1.80b 44.15 + 1.35b 3.897 + 0.171a 2.612 + 0.073a
III 32.55 + 0.49a 32.01 + 0.73a 6.607 + 0.131bc 5.040 + 0.075bc
IV 32.71 + 0.93a 33.74 + 0.90a 6.342 + 0.180b 4.997 + 0.057b
V 32.53 + 0.79a 32.52+ 0.52a 6.925 + 0.115c 5.788 + 0.112d
Values are Mean + S.E. (n=6) Two way ANOVA followed by Duncan’s multiple comparison test using SPSS 15.0 vValues with different superscripts are significantly different (p<0.01)Lowercase alphabets for vertical com parison; Uppercase alphabets for horizontal comparison.
cadmium treated group II when compared to control group.GSH is a tri-peptide, non enzymatic antioxidant involvedin the detoxification of heavy metals as well as reactivemetabolites of xenobiotics by forming conjugates.Cadmium was reported to bind exclusively to thiol groupsthereby decreasing the GSH levels and interfering withthe antioxidant activity (Helbig et al., 2008). Cadmiuminduced oxidative damage has been demonstrated by theincrease in lipid peroxidation and inhibition of enzymesrequired to prevent such oxidative damage ( Patra et al.,2011 and Jurczuk et al., 2004) viz., GSH, SOD and CAT.These changes seem to be due to the generation of ROS( Wang et al., 2004 and Gobe and Crane, 2010). GPx, aselenium dependent antioxidant enzyme, removes bothH2O2 and lipid peroxides by catalyzing the conversion oflipid hydroperoxide to hydroxy acids in the presence ofGSH. Decreased GPx activity observed in this study couldbe due to attributed to the exhaustion or inactivation of
the enzyme due to excessive free radicals (Prasad et al.,2003). The oxidative stress induced by cadmium, favourslipid peroxidation and further leads to the depletion of GSHin tissues (El-Maraghy et al., 2001) and decreasedactivities of SOD and CAT (Ognjanovic et al., 1995).
With the supplementation of the alcoholic extractof T.portulacastrum, Nefroliv and Vitamin E, the antioxidantconstituents were significantly increased (P<0.01) on bothDay 15 and Day 30 when compared to II group suggestingantioxidant role of the plant. LPO and SOD concentrations
in liver and kidney were assayed and tabulated in Table 3.The concentration of MDA was assayed in liver and kidneyon Day 30. The MDA concentration was significantly(P<0.01) increased in liver and kidney suggesting theoxidative damage to lipids in cell membranes. In liver andkidney, SOD concentration was decreased significantly(P<0.01) when compared to control group suggesting anoxidative damage to the organs. Treatment with alcoholicextract of T. portulacastrum , Nefroliv and Vitamin Erestored the values of LPO and SOD to normal. Thedecreased LPO levels might be due to the active flavonoidsand other ingredients of Nefroliv (Chatterjee and Agarwala,2003). Decreased levels of LPO suggest the antioxidativeproperty of alcoholic extract of T. portulacastrum .
SOD constitutes an important link in the biologicaldefense mechanism through disposition of endogenouscytotoxic superoxide radicals, which are deleterious toPUFA and structural proteins of plasma membrane. SOD
catalytically scavenges the superoxide radicals and thusrenders cytoprotection against free radical induceddamage. It is reported that accumulated cadmium in thetissues, interacts with metal moieties of SOD (Cu, Zn,Mn) and inhibits the enzyme activity (Nagaraj et al., 2000).The increased concentration of GR, GPx, CAT and SODin rats that received alcoholic extract of T. portulacastrum is by virtue of its antioxidative properties that acted onROS liberated during the oxidative stress induced by theCdCl
2(Moron et al., 1979). Vitamin E protects critical
Kumar et al.
82 Journal of Veterinary Pharmacology and Toxicology/December 2012/Vol.11/Issue 1-2/80-84

8/13/2019 JVPT-2012_Vol11
http://slidepdf.com/reader/full/jvpt-2012vol11 87/108
cellular structures against damage caused by free oxygenradicals and reactive products of LPO. Vitamin E (α-tocopherol) inhibits peroxidation of membrane lipids byscavenging lipid peroxyl radicals, as a consequence ofwhich it is converted into a tocopheroxyl radical (Arita et
al., 1998).
The gross lesions in kidney of cadmium treatedgroup II rats were areas of congestion and paleness.Following treatment, the above changes were mild to normalsuggesting the protective role of Trianthema
portulacastrum , Vitamin E and Nefroliv in cadmium inducednephrotoxicity. Degenerative changes were observed inthe histopathological examination of the liver and kidneyof group II rats (Brzoska et al., 2003). The histopathologicalsections of liver and kidney in groups III, IV and V showedvery mild areas of congestion with normal histologicalappearance in liver and kidney suggesting the role ofTrianthema portulacastrum, Vitamin E and Nefroliv inpreserving functional integrity of membranes by preventing
the alteration of their phospholipid structure by free radicalinduced cadmium toxicity. Treatment with T.
portulacastrum , Vitamin E and Nefroliv countered the toxiceffect of cadmium suggesting nephroprotective role.However, the possible mechanism by which alcoholicextract of T. portulacastrum exerts nephroprotection couldbe attributed to its free radical scavenging property alongwith its diuretic property (Kumar et al., 2005).
It is concluded from this study that CdCl2producedsignificant nephrotoxicity as evinced by increased BUNand creatinine levels along with degenerative changes inthe kidneys due to free radical generation i.e., oxidativestress which is evident by the increase in LPO and
decrease in SOD, CAT, GSH, GPx and GR. Co-administration of alcoholic extract of T. portulacastrum along with CdCl
2 prevented both functional and histological
renal changes induced by CdCl2 in rats.
ACKNOWLEDGEMENTS
The authors would like to thank College ofVeterinary Science, Tirupati and Sri VenkateswaraVeterinary University for providing the infrastructure andnecessary financial support for carrying out this research.
REFERENCESAebi, H. (1984). Catalase invitro: In: Packer, L. editor
Methods in Enzymology. New York AcademicPress. 105: 21-26.
Arita, M., Sato, Y.,Arai, H. and Inoue, K. (1998). Bindingof α-tocopheryl quinone, an oxidized form of α-tocopheryl, to glutathione –S- transferase in theliver cytosol. FEBS Letters . 436:424-426.
Bagchi, D., Bagchi, M., Stohs, S. J., Ray, S. D.,Kuszynski, C. A. and Pruess, H. G. (2000). Freeradicals and grape seed proanthocyanidin
extract: importance in human health anddisease prevention. Toxicol. 148: 187- 97.
Brzoska, M. M., Jakoniuk, M., Marcinkiewicz, P. andSawicki, B. (2003). Liver and Kidney function andhistology in rats exposed to cadmium and ethanol.Alcohol and Alcoholism. 38: 2-10.
Chatterjee, S. and Agrawala, S. K. (2003). Effect of ELKP-1 on experimental diabetic Nephropathy.Phytomedicine , 4: 43-49.
El-Maraghy, Gad, M. Z., Fahim, A. T. and Hamdy, M. A.(2001). Effect of cadmium and aluminium onthe antioxidant status and lipid peroxidation inrat tissues. J. Biochem. Mol. Toxicol. 15: 207-214.
Gobe, G. and Crane, D. (2010). Mitochondria, ROS andCadmium toxicity in kidney. Toxicol. Letters.198:49-55.
Hall., J. Haas, K. and Freedman, J.C. (2012). Role of MTL-1, MTL-2 and CDR-1 in mediating cadmium
sensitivity in C.elegans . Toxicologcal Science,128: 418-26.
Hanahan, D. and Weinberg, R.A. (2000). The hall marksof cancer. Cell. 100:57-70.
Helbig, K., Grosse, C. and Nies, D.H. (2008). Cadmiumtoxicity in glutathione mutants of Escherichia coli .J. Bacteriol. 190:5439-54.
Hu, C.C., Yem, C.J., Jang, M. L., Liu, C.B., Chen, W.K.and Chung, C. (1991). Cadmium induced serumbiochemical changes in subchronically exposedrats. Chung Shah Medical Journal , 2: 97-101.
Hwang, D. F. and Wang, L.C. (2001). Effect of taurine ontoxicity of cadmium in rats. Toxicology , 167: 173-
180.Jurczuk, M., Brzoska, M.M., Jakoniuk, J.M., Sidorczuk,
M.G. and Karpinska, E.K. (2004). Antioxidantenzymes activity and lipid peroxidation in liver andkidney of rats exposed to cadmium and ethanol.Food and Chemical Toxicol. 42: 429-438.
Kaneko, J.J., Harvey, J.W. and Bruss, M. (2008). Clinicalbiochemistry of domestic animals 6th edition;Academic Press, New York.
Khan, S. A. (2003). Characterization and standardizationof some traditional plant drugs. Ph.D thesissubmitted to Jamia Hamdard University. Availableat http://www.jamiahamdard.edu/thesis_traditionalplantdrugs.asp
Kumar, G., Banu, G. S. and Pandian, M. R. (2005).Evaluation of the antioxidant acitivity of Trianthema
portulacastrum Linn. Indian J. Pharmacol. 37: 331-33.
Mandal. A., Bandyopadhyay, S. and Chatterjee, M. (1997).Trianthema portulacastrum Linn reverses hepaticlipid peroxidation, glutathione status and activitiesof related antioxidant enzymes in carbon
Cadimum toxicity in rats
Journal of Veterinary Pharmacology and Toxicology/December 2012/Vol.11/Issue 1-2/80-84 83

8/13/2019 JVPT-2012_Vol11
http://slidepdf.com/reader/full/jvpt-2012vol11 88/108

8/13/2019 JVPT-2012_Vol11
http://slidepdf.com/reader/full/jvpt-2012vol11 89/108
Journal of Veterinary Pharmacology and Toxicology/December 2012/Vol.11/Issue 1-2/85-87 85
1MVSc Scholar, 2University Professor and Chairman, 3Senior Research Fellow, 1,2,3Department of Pharmacology and
Toxicology, College of Veterinary Science and A.H., BAU, Ranchi- 834006, Jharkhand;4,5
Department Pharmacology andToxicology College of Veterinary and Animal Sciences, U.S. Nagar, Pantnagar-263145, Uttarakhand, India.1Corresponding author: E-mail: [email protected]
DISPOSITION KINETICS OF CEFTRIAXONE AFTER INTRAMUSCULAR
ADMINISTRATION IN GOATS
NAVEEN KUMAR1, B.K. ROY2, VIJAY KUMAR3, WASIF AHMAD4 AND N. K. PANKAJ5
ABSTRACT
Plasma concentrations and pharmacokinetics of ceftriaxone were determined in Black Bengal goats afterintramuscular administration at a single dose of 50 mg/kg body weight. Blood samples were drawn from the jugular vein atpredetermined time intervals after drug injection. Plasma was separated and analyzed for ceftriaxone by reverse-phase highperformance liquid chromatography (HPLC). The plasma concentration-time data for ceftriaxone were best described bytwo-compartment open pharmacokinetic model. The elimination half-life (t1/2β), area under the plasma concentration-timecurve (AUC), volume of distribution (Vdarea), mean residence time (MRT) and total systemic clearance (ClB) were 2.38±0.19 h,163.40±5.43 µg/h/ml, 0.15±0.07 L.kg-1, 3.27±0.10 h and 5.08±0.14 L.h-1.kg-1, respectively. The plasma concentration ofceftriaxone was detected 4.48±0.21 µg/ml for upto 8 h. Ceftriaxone appears to be useful for the treatment of animal diseases
associated with pathogens sensitive to this drug.Key words: Ceftriaxone (CTA), goats, HPLC, pharmacokinetics.
INTRODUCTIONCeftriaxone is a third generation cephalosporins,
bactericidal agent, inhibits synthesis of bacterial cell wallthrough binding to the transpeptidase enzyme (Stoeckelet al., 1981) and shows a time- dependent bactericidaleffect. It has total elimination through urine and bile withreciprocal compensation if one of the routes is faulty.Ceftriaxone reportedly well tolerated locally andsystemically even after repeated administration. This drugis safe to use during pregnancy and there is no sign ofvisceral or skeletal abnormalities are found in fetus(Teelman et al., 1982; Blaise et al., 1985). It has highantimicrobial activity against a broad spectrum of Gram-negative and Gram-positive bacteria. The potentialantimicrobial properties and favorable pharmacokineticproperties of ceftriaxone, including its excellent tissuepenetration make this drug a suitable antibacterial. Themarked species variation in the pharmacokinetics of thisdrug limits the extrapolation of data from other species togoat. The present study was undertaken to determine theplasma concentrations and pharmacokinetic data forceftriaxone after single intramuscular administration in
Black Bengal goat.
MATERIALS AND METHODS
Five adult healthy female Black Bengal goats(weighing 10-12 kg) were procured from Instructional SmallRuminant Farm, College of Veterinary Sciences and A.H.,Kanke, Ranchi. They were reared under routine grazingand were provided fodder. Water was given ad libitum .The goats were kept under constant observation beforecommencement of experiment.
Ceftriaxone was obtained from M/S WockhardtPvt. Ltd. Mumbai. It was dissolved in pyrogen free steriledistilled water as a solution for intramuscular injection intogoats. The drug was given as a single intramuscular at adose rate of 50 mg/kg body weight. The quantitativeanalysis of drug in plasma and urine were done as per asmodified method of United State Pharmacopeia (USP,2007). The samples were stored at -200C till the time ofprocessing. The CTA concentrations in plasma and urinewere estimated by high performance liquidchromatography (HPLC) method.Chromatographic quantification
The standard acetonitrile (HPLC grade) and allchemicals and solvents of analytical grades and ultrapurewater (Millipore) were used for this investigation. Theconcentration of CTA was determined using an HPLCsystem (Cecil 4100), equipped with a reverse-phase anda UV/vis detector, and operated at 280 nm.
The samples were separated on an RP-C18 column(4.6 X 250 mm, 5µm) and eluted with a mobile phaseconsisting of a mixture of acetonitrile, tetraheptylammonium bromide, phosphate buffer (pH 7.0) and citrate
(pH
5.0). A flow rate of 1 ml.min-1
was used and columnoven temperature was kept at 350C ceftriaxone wasquantified from the peak areas and the concentrations inplasma samples were determined by means of calibrationcurve obtained on analysis of blank goat plasma samplefortified with ceftriaxone (external standard) and assayedas described for the experimental samples. The recoveryof ceftriaxone was >90%.Drug extraction
Blood samples were collected by puncturing
Research Article

8/13/2019 JVPT-2012_Vol11
http://slidepdf.com/reader/full/jvpt-2012vol11 90/108
Kumar et al.
DISCUSSIONIn the present study, HPLC assay was used to
determine the concentrations of CTA and its activemetabolite in plasma of goats. The commonly usedantimicrobial assay does not distinguish parent drug fromthe active metabolite. The pharmacokinetics of CTA in goatswas best described by a two-compartment open model ofdrug with passage of time following intramuscularadministration.
The mean residence time (MRT) obtained for CTAin goats in present study was 3.27±0.10 h, which is slightlyhigher than the value (2.63±0.20 h) reported by Gohil et al. (2009) following intramuscular dose of CTA in buffalocalves. However, lower AUC (26.67±2.2 µg.h/ml) valueshave been reported after intramuscular administration ofCTA. Following intramuscular administration of CTA ingoats, the peak plasma concentration was achieved at0.75 h. It is in agreement with the peak plasmaconcentration of 15.3±2.4 µg/ml observed in cow calves(Maradiya, 2004). Short absorption half-life of CTA showedthat the drug absorbed faster from the injection site. Rapidabsorption following intramuscular injection has also beenreported for cefotaxime (Sharma et al., 2004) and
cefoperazone (Goyal et al., 2005) in buffalo calves. Theelimination of CTA was rapid followed by fast clearance(5.08±0.14 ml/min.kg) of drug in the present study. It hasbeen in agreement to the earlier report in cow calves (Johaland Srivastava, 1998). Rapid elimination of cefotaxime(Sharma et al., 2004) and cefoperazone (Goyal et al., 2005)following intramuscular administration in buffalo calves
justifies the observations made in the present study.The drug is extensively distributed following
intramuscular injection as evidenced by high Vdarea
jugular vein into EDTA containing vial at 5, 10, 15, 20, 30,45 minutes and 1, 2, 3, 4, 5, 6, 8 and 12 h. In brief, theplasma was separated from blood by centrifugation at 3000rpm for 20 minutes. The clear supernatant was separatedgently. To 0.5 ml of plasma, 0.5 ml distill water and 1 mlacetonitrile was added in the ratio of 1:2 and after vortex
mixing at high speed for 60 sec the tube was subjected tocentrifugation at 5000 rpm for 30 min. The supernatantwas collected and transferred to a tube after passingthrough a filter paper (Whatman No-1). The whole aliquotwas vacuum filtered through a 0.45 µm cellulose acetatemembrane filter and 20 µl of fluid was injected in HPLCsystem.
RESULTS
The disposition of CTA following single doseintramuscular administration in goat is depicted in Figure-1. The semi-logrithmic plot of the plasma drugconcentration following intramuscular administration of CTA
exhibited biexponential decline in the plasma could bebest fitted to two-compartment open model. The drug wasdetected in plasma up to 8 h following intramuscularadministration. The plasma concentration of CTA increasesgradually from 0.08 h to 0.75 h. After that the plasma leveldiminished up to 8 h and peak plasma concentration at0.75 h.
The pharmacokinetic determinants which describedisposition kinetics of ceftriaxone in goats followingintramuscular administration are presented in table. Theelimination half-life (t1/2
β) of ceftriaxone after intramuscularadministration was 2.30±0.19h with an elimination rateconstant 0.30±0.02h-1, while distribution half-life (t1/2
α) was
0.14 h with a distribution rate constant (α) of 0.30±0.02h1. The drug was calculated to have an apparent volume ofdistribution (Vdarea) of 0.15±0.07 L/kg. The total bodyclearance which represents the sum of metabolic andexcretory clearance processes was 5.08±0.14 ml/kg/min.
Fig 1:
Semilogarithmic plot of CTA concentration in plasma versustime in healthy goats after intramuscular administration
of CTA. Each point represents mean ± SE of five goats.
TABLE 1:Pharmacokinetic profile of ceftriaxone in plasma followingsingle dose (50 mg/kg) i.m. administration in healthy goats(n=5).
Kinetic Parameters Mean±S.E.
A (µg/ml) 48.18±0.40B (µg/ml) 50.54±5.60Co
p (µg/ml) 43.81±0.75α(h-1) 4.96±0.22β (h-1) 0.30±0.02t1/2α (h) 0.14±00t1/2β (h) 2.30±0.19AUC(mg/L.h) 163.40±5.43MRT (h) 3.27±0.10ClB(ml/kg/min) 5.08±0.14Vdarea (L/kg) 0.15±0.07
A= zero time intercept of distribution phase; B = zero time interceptof elimination phase; α = Distribution/absorption rate constant; β =Elimination rate constant; t½
α = Distribution/absorption half life;t½β=Elimination half life; Vd area = Apparent volume of distribution; ClB=Total body clearance, AUC = Total area under the time concentrationcurve, C0
P = Zero time plasma concentration, MRT = Mean residence
time.
86 Journal of Veterinary Pharmacology and Toxicology/December 2012/Vol.11/Issue 1-2/85-87

8/13/2019 JVPT-2012_Vol11
http://slidepdf.com/reader/full/jvpt-2012vol11 91/108
(0.15±0.07 L/kg). High apparent volume of distribution ofCTA (1.40±0.07 L/kg; Dardi et al., 2004) and cefotaxime(1.30 L/kg; Sharma et al., 2004) in buffalo calves supportsour observation. However, moderate distribution of the drug(Vd
area; 0.55 L/kg) has also been reported following
intramuscular administration of CTA in cow calves (Soback
and Ziv, 1988).In the present study a single dose (50 mg/kg)i.m. administration of CTA produced therapeuticallyeffective concentration within 0.08 h, indicative of quickrate of absorption by this route and drug concentrationwas higher than minimum inhibitory concentrations (MIC)remain maintained up to 8 h. The MIC of CTA againstsusceptible bacteria ranges between 0.06 and 0.25µg/ml(Beam, 1985).
The elimination half-life (2.30±0.19 h) following i.madministration obtained in goats in present study wasslightly longer than cattle calves (116.8 min, Soback andZiv. 1988), however much lower t
1/2 â values have been
reported in dogs (1.17 h, Rebuelto et al., 2002). The plasmaconcentration and pharmacokinetic characteristics of CTAin goats following intramuscular administration indicatesfavorable pharmacokinetic profile, therefore, the drug bythis route may be used to treat susceptible bacterialinfections in goats.
ACKNOWLEDGEMENTThe authors express their gratitude to the Dean,
College of Veterinary Science & A.H, Kanke and the Vice-chancellor, BAU, Ranchi (Jharkhand), for providingnecessary facilities during this study.
REFERENCESBeam Jr., T.R.(1985). Ceftriaxone: a beta-lactamase-
stable, broad-spectrum cephalosporinpharmacology. Br. J. Clin. Pharmac . 8:237-253.
Blaise, L., Tasmee, C., Tamara, A. R. and Quellant, T. B.(1985). Once daily ceftriaxone therapy for seriousbacterial infection in children. Antimicrob. Agent
Chemother. 27(2): 181-1 83.Dardi, M.S., Sharma, S.K. and Srivastava, A.K. (2004).
Pharmacokinetics and dosage regimen ofceftriaxone in buffalo calves. Vet. Res. Commun.,28: 331-338.
Gohil, P.V., Patel, U.D., Bhavsar, S.K. and Thakur, A. M.(2009). Pharmacokinetics of ceftriaxone in buffalocalves (Bubbalus bubalis ) following intravenousand intramuscular administration: Irani. J. Vet.
Res. 10: 33-37.
Goyal, S., Chaudhary, R.K. and Srivastava, A.K. (2005).Pharmacokinetics following intramuscularadministration and dosage regimen forcefoperazone in buffalo calves. Indian J. Anim.
Sci. 75: 31-32.Johal, B. and Srivastava, A.K. (1998). Pharmacokinetics,
urinary excretion and dosage regimen ofceftriaxone in crossbred cow calves followingsingle intramuscular administration. Indian J.
Anim. Sci. 68:1017-1019.Mardiya, J. J., Gohil, P. V., Goriya, H. V., Bhavsar, S. K.
and Thakur, A. M. (2004). Ceftriaxonepharmacokinetics following single doseintravenous administration in crossbred cowcalves. Indian Soc.Vet. Pharmacol. Toxicol. 4(IV):50-51.
Rebuelto, M., Albarellos, G., Ambros, L., Kreil, V.,Montoya, L., Bonafiner, R., Otero, P. and Hallu,R. (2002). Pharmacokinetics of ceftriaxone
administered by the intravenous, intramuscularor subcutaneous routes to dogs. J. Vet.
Pharmacol. Therap. 25(1): 73-76.Sharma, S.K., Srivastava, A.K. and Deore, M.D. (2004).
Pharmacokinetic disposition of cefotaxime inbuffalo calves (Bubalus bubalis ) following singleintramuscular administration. Indian J. Anim. Sci.74: 590-593.
Soback, S. and Ziv, G. (1988). Pharmacokinetics andbioavailability of ceftriaxone administeredintravenously and intramuscularly to calves. Am.
J. Vet. Res . 49: 535-538.Stoeckel, K., McNamara. P. J., Brandt, R. and Ziegler, W.
H. (1981). The influence of protein binding on thepharmacokinetics of Rocephin (Roche). Paper –12th International Congress of Chemotherapy,Florence,19-24.7.
Teelman, K., Scharer, K., and Udaka, K. (1982).Experimentall toxicologic von ceftriaxone. Inceftriaxone (Rocephin) ein neves parenteralcephalosporins. Hapmenklee Symposium(1981). L. Detti (ed.) Basel. Grenzach; EditioneRoche 91-111 .
United States Pharmacopoeial Convention (2007). BritishPharmacopoeia: Ceftriaxone sodium injection, Vol.1: 423-424.
Received on: 27-07-2012 Accepted on: 25-11-2012
Kinetics of ceftriaxone in goats
Journal of Veterinary Pharmacology and Toxicology/December 2012/Vol.11/Issue 1-2/85-87 87

8/13/2019 JVPT-2012_Vol11
http://slidepdf.com/reader/full/jvpt-2012vol11 92/108
1PhD Scholar, 2Professor and Head, 3Professor; Department of Veterinary Pharmacology and Toxicology,
C.V.A.Sc., Pantnagar-263145, Uttarakhand (India).1Corresponding author : [email protected]
HAEMATO-BIOCHEMICAL PROFILE FOLLOWING MULTIPLE ORAL DOSE
ADMINISTRATION OF CHLORPYRIFOS IN POULTRY
LATA GAYAL1, S.P. SINGH2, A.H. AHMAD3 AND WASIF AHMAD1
ABSTRACT
The present study was carried out to evaluate haemato-biochemical profile following multiple oral dose @15 mg/ kg bwt (1/3rd of LD50) administration of chlorpyrifos (CPF) at an interval of 24h for seven days in poultry birds. A significant(P<0.05) reduction in haematological values up to 24h post administration and thereafter gradual increase observedapproaching normal values 96h post administration of chlorpyrifos.The total serum proteins, albumin and globulin significantly(P<0.05) decreased upto 48h post administration gradually returned to normal value after 96h. The serum AST and ALTactivities increased upto 24h gradually decreased to normal value after 96h post administration. No significant differencewas observed in the value of serum urea and uric acid whereas significant (P<0.05) increase in the values of serumcreatinine and cholesterol upto 24h post administration and gradual decrease upto 96h post administration of chlorpyrifoswas observed. A significant reduction in serum glucose level upto 24h post administration was observed, however , the level
increased gradually reaching to normal value upto 96 h post administration of the pesticide. It is concluded from this studythat chlorpyrifos produced mild to moderate haemotoxic, hepatotoxic and nephrotoxic effects in poultry.
Keywords: Biochemical, chlorpyrifos, haematological, hepatotoxic, nephrotoxic, poultry.
INTRODUCTIONChlorpyrifos is a broad–spectrum insecticide
widely used in agriculture and animal husbandary. It iswidely used to control vector responsible for spreadingdiseases in domestic animals and plants. It is also foundto be effective against pests, insects, termites andmosquitoes. In animal husbandry, it is used againstexternal parasites of domestic animals and poultry birds.However, very meager information is available ontoxicological aspects of chlorpyrifos in poultry birds. Thisstudy was, therefore, undertaken to evaluate thehaematological and biochemical effects of chlorpyrifos after7 days multiple oral dose administration of chlorpyrifos.
MATERIALS AND METHODS
Experimental design 20 male RIR birds weighing 1±0.5kg were divided
into five groups namely Group I, II, III, IV and V comprising4 birds in each group. Group I served as control free frompesticide. Birds of Group II, III, IV and V were administered0.08 ml of chlorpyrifos (prepared by mixing 1ml of 20%
EC chlorpyrifos (CPF) with 1ml of olive oil) as multiple oral(the formulation was administered using thin plastic tubeattached to a syringe) dose@15mg/kg bwt (1/3rd of LD50;40mg/kg) for seven days at an interval of 24h. The birdswere reared under uniform management and husbandryconditions, maintained on poultry feed (as per NRC). Thebirds were fed commercial broiler ration free from anyantibiotic. Fresh water was provided ad-libitum during theentire period of experiment. The birds were observed dailymorning and evening for assessing their health status and
other signs of clinical toxicity.Following multiple (7) oral dose administration of
chlorpyrifos@15 mg/kg bwt in poultry birds, blood sampleswere collected at 24, 48, 72 and 96 h after last dose fromthe left brachial vein or jugular vein. The blood sampleswere divided into two parts, one part was collected inheparinized tubes for hematological studies while secondpart in sterilized vials for collection of serum for analysisof biochemical parameters. Blood was collected from eachbird in clean heparinized microcenrifuge tube (eppendorf ® )and hematological parameters such as packed cell volume(Jain, 1986), haemoglobin (Jain, 1986), total erythrocytecount (Natt and Herric, 1952) and total leucocyte count(Natt and Herric, 1952) were estimated immediately afterthe collection of blood samples. 0.1N-HCl was used forestimating the blood haemoglobin concentration while,Natt-Herric diluting fluid was used for TEC and TLCestimation.Statistical analysis
Statistical analysis of data was done by usingone way ANOVA technique followed by Tukey’s Multiple
Comparison Test by using Graph pad prism statisticalsoftware. Statistically significant difference was consideredat 5 and 1percent level.
RESULTSA significant (p<0.05) decrease in Hb (g/dl) and
PCV (%) was observed in Group II as compared to control.Other groups, however, did not reveal any significantchange in comparison to control. A significant (p<0.05)decrease in TEC (X106 / µl) value was observed in Group II,
Research Article
88 Journal of Veterinary Pharmacology and Toxicology/December 2012/Vol.11/Issue 1-2/88-90

8/13/2019 JVPT-2012_Vol11
http://slidepdf.com/reader/full/jvpt-2012vol11 93/108
III and IV as compared to control whereas a significant(p<0.05) increase in the values of TEC in Group IV and Vwas observed as compared to Group II. A significant(p<0.05) increase in the values of TEC in Group V wasalso observed in comparison to Group III. A significant(p<0.05) decrease in the values of TLC (X103 / µl) in GroupII was observed as compared to control whereas asignificant (p<0.05) increase in the values of TLC in GroupIV and V was observed as compared to Group II. There isa time dependent increase in the hematological parametersin chlorpyrifos treated groups (Table 1).
As shown in Table 2, no significant difference wasobserved in the values of serum proteins (g/dl) of controlas well as test groups except Group III in which significant(p<0.05) decrease was observed in comparison to control.A significant (p<0.05) decrease in value of serum albuminlevel and A:G ratio was observed in Group II, III, IV and Vas compared to control whereas no significant difference
was observed in serum globulin level in comparison tocontrol. A significant (p<0.05) decrease in AST activity (U/ L) was observed in Group V as compared to Group I, II andGroup III. Activity of AST declined significantly (p<0.05) inGroup IV as compared to Group II. No significant differencewas observed in the value of ALT of control as well as testgroups. A significant (p<0.05) decrease in the value ofglucose (mg/dl) in Group II and III was observed ascompared to control. There was no significant differencein the values of urea (mg/dl) and uric acid (mg/dl) in controlas well as test groups. A significant (p<0.05) increase inthe value of creatinine (mg/dl) in Group II was observed ascompared to control. However, significant (p<0.05)decrease in the value of creatinine in Group V was observedas compared to Group II. No significant (p<0.05) differencewas observed in value of cholesterol (mg/dl) in control aswell as test groups except Group V in which significant(p<0.05) decrease in the value of cholesterol was observed
TABLE 1:Effect on hematological parameters at different intervals following multiple (7) oral dose of CPF @ 15mg/kg in poultry.
Groups Dose (mg/kg) Hb (g/dl) PCV (%) TEC (106 / µµµµµl) TLC (103 / µµµµµl)
I (Control) — 12.15±0.33 36.85±0.74 2.40±0.08 14.51±0.65II (24 h) 15 10.5±0.24a 31.7±1.03a 1.64±0.09a 10.42±0.32a
III (48 h) 15 11.2±0.22 33.35±0.95 1.82±0.07a 12.45±0.30IV (72 h) 15 11.65±0.25 33.8±1.14 2.02±0.07ab 13.73±0.76b
V (96 h) 15 11.7±0.35 34.85±1.18 2.29±0.09bc
14.71±0.48b
One Way ANOVA CD 0.85 3.09 0.25 1.61d.f 15 15 15 15F 4.89 3.49 15.06 11.05
TABLE 2:Effect on serum enzymatic and protein profiles at different intervals following multiple (7) oral dose of CPF @ 15mg/kg inpoultry.
Groups Dose (mg/kg) Total protein (g/dl) Albumin (g/dl) Globulin(g/dl) ALT (U/L) AST (U/L)
I (Control) —- 3.70±0.19 2.42±0.16 1.28±0.06 5.01± 0.37 128.3± 3.04II (24 h) 15 3.17±0.15 1.76±0.09a 1.41±0.08 6.87± 0.87 139.1± 4.92III (48 h) 15 2.74±0.20a 1.41±0.06a 1.33±0.15 5.8± 0.62 125± 4.78IV (72 h) 15 3.02±0.20 1.68±0.14a 1.34±0.10 5.87± 0.63 116.2± 7.29b
V (96 h) 15 3.42±0.21 1.87±0.10a 1.55±0.18 5.55± 0.41 100.3± 3.85abc
One Way ANOVA CD 0.58 0.35 0.37 1.83 15.02d.f 15 15 15 15 15F 3.65 10.2 0.76 1.25 8.49
TABLE 3:Effect on biochemical parameters at different intervals following multiple (7) oral dose of chlorpyrifos @15mg/kg inpoultry.
Groups Dose (mg/kg) Cholesterol Glucose Uric acid Urea (mg/dl) Creatinine (mg/dl) (mg/dl) (mg/dl) (mg/dl)
I (Control) —- 134±8.69 245±12.42 5.81±0.21 6.98±0.38 0.48±0.03II (24 h) 15 121.5±9.22 182.7±7.58a 7.01±0.57 6.46±0.27 0.92±0.12a
III (48 h) 15 128.3±3.64 187.4±5.51a 6.47±0.22 6.21±0.24 0.79±0.08IV (72 h) 15 119.3±4.67 210.3±13.79 6.21±0.22 6.32±0.21 0.62±0.05V (96 h) 15 99.9±3.40ac 229.6±16.94 5.98±0.21 6.61±0.23 0.54±0.02b
One WAY ANOVA CD 19.40 36.14 0.96 0.82 0.21d.f 15 15 15 15 15F 4.04 4.97 2.19 1.21 6.39
Values in Table 1, 2 and 3 are Means ± SE (n=4), a significant (P<0.05) Vs group I, b significant (P<0.05) Vs group II, c significant (P<0.05) Vsgroup III.
Journal of Veterinary Pharmacology and Toxicology/December 2012/Vol.11/Issue 1-2/88-90 89
Chlorpyrifos toxicity in poultry

8/13/2019 JVPT-2012_Vol11
http://slidepdf.com/reader/full/jvpt-2012vol11 94/108
as compared to control as well as Group III (Table 3).
DISCUSSIONHematological parameters Hb, PCV, TEC and TLC
significantly decreased in chlorpyrifos treated groups after24 h post administration and gradually increased after 48,
72 and 96 h post administration of chlorpyrifos as theresidue concentration of pesticide gradually declined inthe body in the present study. Anemia may be the majorreason for decline in the Hb and PCV values.Krishnamoorthy et al. (2006) also studied the effect ofchlorpyrifos in broiler chicken and observed significantdecrease in PCV and Hb levels indicating anaemia.
A significant (p<0.05) decrease in the values ofTEC and TLC was observed in the present study inchlorpyr i fos fed birds init ia l ly af ter 24 h postadministration which increased gradually as chlorpyrifosresidues decreased gradually. Rawat (2002) has alsoreported a decrease in TEC and PCV values after single
oral dose of 10 mg/kg of chlorpyrifos in birds. In anotherstudy, hematological picture of cockerels treated with25 mg/kg of chlorpyrifos for 24 weeks revealed asignificant decrease in TEC and TLC values (Kumar et al., 2010).
Non significant augmentaion was observed in thevalue of AST and ALT of birds after 24h post administrationof chlorpyrifos which indicated mild degree of damage toliver as compared to endosulfan in this study. Thesusceptibility of the liver to toxic compounds is due to thecentral role it plays in the biotransformation and dispositionof xenobiotics (Murray et al., 1999). Krastav et al. (1995)also reported an increase in the activities of AST and ALT
following chlorpyrifos toxicity.No significant difference was observed in the
values of serum proteins whereas a significant (p<0.05)decrease in values of serum albumin level occurred at 24,48, 72 and 96 h post administration of chlorpyrifos.Krishnamoorthy et al. (2006) also observed similar effectof chlorpyrifos and observed significant decrease in serumalbumin level in broiler chickens. Oral exposure tochlorpyrifos (25 mg/kg) in feed for 24 week also declinedlevels of total serum proteins in cockerels (Kumar et al.,2010).
There was a significant (p<0.05) increase in thevalue of creatinine after 24 h post administration ofchlorpyrifos where as non significant difference observedin value of urea and uric acid. It might have occurred dueto mild nephrotoxic effect of chlorpyrifos in birds. Ambaliet al. (2007) evaluated the effect of subchronic chlorpyrifospoisoning and also observed a significant increase increatinine values in mice.
There was no significant difference in cholesterolvalue after 24 h post administration of chlorpyrifos in poultry
birds whereas significant (p<0.05) decrease in the valueof cholesterol after 96 h was observed in comparison tocontrol. Similar effects showing significant decrease incholesterol values were also reported in chlorpyrifosintoxicated broiler chicken by Krishnamoorthyet al. (2006).
A significant (p<0.05) decrease in the value of
glucose after 24 and 48 h post administration and a nonsignificant difference was observed at 72 and 96 h postadministration of chlorpyrifos due to gradual decline in thelevel of pesticide residues. Similar results were reportedby Kumar et al., (2010) after 24 week of oral exposure ofchlorpyrifos (25 mg/kg) where serum glucose levels weredecreased in chicks. It is concluded from this investigationthat chlorpyrifos following multiple (7) oral dose @ 15 mg/ kg administration produce mild to moderate degree ofhepatotoxic and nephrotoxic effects in poultry birds.
REFERENCES
Ambali, S., Dayo, A., Igbokwe, N., Shittu, M., Kawu M.,
Ayo, J. (2007). Evaluation of subchronicchlorpyrifos poisoning on haematological andserum biochemical changes in mice and protectiveeffect of Vit C. J. Toxicol. Sci. 32: 111-120.
Jain, N.C. (1986). Schalm’s Veterinary Haematology. 4th
Edn. Lea and Febringer, Philadeiphia.Krishnamoorthy, P., Vairamuthu S., Balachandran2, C. and
Muralimanohar, B. (2006). Chlorpyriphos and T-2Toxin Induced Haemato-Biochemical Alterationsin Broiler Chicken. International J. Poultry Sci. 5:173-177.
Kumar, A.; Singh, S.P. and Sharma, L.D. (2010).Immunotoxicological evaluation of chlorpyrifos
following medication with Withania Somnifera incockerels. J. Vety. Pharmacol. Toxicol. 9: 34-37.
Krastev, A.R., Sengalevic, G., Kuzmanov, N. and Abdulaziz,M. (1995). Study on the effect of some insecticideson forage cultures and their influences in thehomeostasis in rumen animals. Selekeija-I- Seenaralvo. 2: 353-358.
Murray, R. K., Granner, D. K., Mayes, P. A., and Rodwell,V. W. (1999). Harper’s Biochemistry, 22nd ed.USA, Prentice Hall.
Natt, M.P. and Herrick, C.A. 1952. A new blood diluent forcounting the erythrocytes and leucocytes of thechicken. Poult. Sci. 31: 735-778.
Rawat, D. (2002). Survey on residues of different pesticidesin Garhwal region of Uttaranchal and theirtoxicological evaluation in poultry. M.V.Sc. thesissubmitted to G.B.P.U.A.&T. Pantnagar, India.
Received on: 18-08-2012
Accepted on: 25-11-2012
90 Journal of Veterinary Pharmacology and Toxicology/December 2012/Vol.11/Issue 1-2/88-90
Gayal et al.

8/13/2019 JVPT-2012_Vol11
http://slidepdf.com/reader/full/jvpt-2012vol11 95/108
Journal of Veterinary Pharmacology and Toxicology/December 2012/Vol.11/Issue 1-2/91-94 91
1Assistant Director, Division of Toxicology, Krish Biotech Research Pvt Ltd, Kalyani, Nadia, West Bengal-741235,2Professor & Head, Department of Pharmacology and Toxicology, College of Veterinary Science and Animal Husbandry,
A.A.U. Anand, Gujarat-388001*Corresponding author: E-mail: [email protected]; [email protected]
TOXICO-PATHOLOGICAL STUDY OF ALPHACYPERMETHRIN IN DAY OLD
WLH CHICKS
NAVNEET KUMAR PANDEY1 AND A.M.THAKER2
ABSTRACT
The present study was conducted in day old White Leghorn chicks. An approximate medium lethal dose (ALD50
) ofalphacypermethrin used for the study was 562.5 mg/kg body weight. One hundred twenty five birds were randomly dividedinto five different groups, C1, C2, T1, T2 and T3. Alphacypermethrin was administered at dose rates of 14.0625 mg/kg, 18.725mg/kg and 28.125 mg/kg for 28 days daily in corn oil. Blood sample was collected on day 15 and day 29 to study effect onvarious hematological and biochemical parameters. Alphacypermethrin, a synthetic pyrethroid insecticide increased theactivities of serum transaminases (ALT, AST), alkaline phosphatase (ALP), lactate dehydrogenase (LDH), creatinine (CRT)and serum glucose level, while it decreased the total serum protein (TP), albumin (ALB) and globulin (GLB) level, but no
alteration on hematology in white leghorn (WLH) chicks. The insecticide also produced adverse effects on kidney, lung, liver,thymus, spleen and bursa. It is concluded that alphacypermethrin altered biochemical parameters and histopathology ofvital organ tissues in white leghorn chicks after repeated oral exposure.
Key words: Alphacypermethrin, biochemical, hematological, transaminases, white leghorn chicks,
INTRODUCTIONPesticide plays one of the important role in
agricultural breakthrough. All the pesticides are goodinsecticides and are also randomly used for the control ofectoparasite infestataions in domesticated animals. Atpersent, specially synthetic pyrethroids replaces all otherpesticides. Alphacypermethrin a synthetic pyrethroid typeII insecticide is extensively used as ectoparasiticide inanimals, agriculture crop production and public healthprogramme. Though some of the toxic action ofalphacypermethrin has been described in EHC-91, but thereport on effect after oral administration ofalphacypermethrin on hematology, serum biochemistryparameters and histopathology of tissue in WLH chicksis scarcely available. Therefore, the present study hasbeen undertaken to study the effect on hematology,biochemical parameters and histopathology followingrepeated oral dosing of alphacypermethrin.
MATERIALS AND METHODS
Experimental design A total of 125, day-old WLH chicks were procuredand housed at Central Poultry Research Station (CPRS),Anand Agricultural University, Anand. Chicks wererandomly divided into five groups (C
1, C
2, T
1, T
2 and T
3) of
25 each. Chicks were maintained on standard chick rationand husbandry practices as followed by the researchstation. Water was provided ad libitum. All standardmanagemental procedures were adopted to keep the birdsfree from stress. Technical grade of alphacypermethrin was
procured from Meghmani Corporation Pvt Ltd, Ahmedabad,Gujarat. LD50 of alphacypermethrin taken in to considerationfor this study was 562.5 mg/kg body weight (Singh andSharma, 2003). Group C
1 and group C
2 were untreated
control and vehicle (corn oil) control respectively. Threedifferent dose levels of alphacypermethrin in ascendingorder, i.e., 14.0625, 18.725 and 28.125 mg/kg body weightwere formulated in corn oil and administered daily to groupT1, T2 and T3 for a period of 28 days through oral gavaging.Clinical signs
Birds were observed for any signs of toxicologicalsignificance during entire period of experimentation andweekly body weight was also recorded.Hemato-biochemical paratmeter
Six birds from each group were sacrificed after 14days and 28 days of experimentation. Blood sample wascollected in 1% EDTA coated volex tubes for estimation ofHemoglobin, Packed cell volume, Total erythrocyte countand Total leukocyte count. Blood samples were also
collected in glass test tubes for serum separation, whichwas utilized for estimation of serum amino transaminase(AST and ALT), alkaline phosphatase (ALP), lactatedehydrogenase (LDH), creatinine (CRT), total protein (TP),albumin (ALB), globulin (GLB) and serum glucose bydiagonistic kits.Histopathology
At the end of the study tissue of liver, kidney,lung, thymus, spleen and bursa were collected forhistopathological examination. Tissue were trimmed in to
Research Article

8/13/2019 JVPT-2012_Vol11
http://slidepdf.com/reader/full/jvpt-2012vol11 96/108
92 Journal of Veterinary Pharmacology and Toxicology/December 2012/Vol.11/Issue 1-2/91-94
TABLE 1:Effect of daily oral administration of alphacypermethrin on body weight (gm) in WLH chicks
Group& Dose Body Weight (gm)
0 day 7day 14day 21 day 28 day
C1 (Control) 35.20±0.76a 54.60±1.57 a 78.63±2.811 a 124.63±5.70 a 175.68±8.01 a
C2 (Vehicle Control) 35.48±0.57 a 53.24±1.50 a 77.57±3.42 a 116.0±6.74 ab 159.89±11.08 ab
T1 (14.0625 mg/kg) 34.60±0.60 a 51.32±1.19 a 72.60±3.24 ab 105.5±5.54ab 140.20±8.07 bc
T2 (18.725 mg/kg) 35.08±0.79 a 52.24±1.30 a 69.20±4.09 ab 104.3±6.09b 148.33±8.91 b
T3
(28.125mg/kg) 35.48±0.58 a 50.76±1.35 a 65.93±3.09 a 98.06±5.54 b 121.53±5.95 c
Note: Data in the column having different superscript differ significantly (p< 0.05).
TABLE 2a:Effect on hematological parameters after 14 days of oral exposure of alphacypermethrin in WLH chicks (n=6)
Group& Dose Hematological parameters (Mean ± SE ) (n=6)
Hb (gm/dl) PCV (%) TLC (x103 /µlit) TEC (mi llion / µli t)
C1 (Control) 9.66±0.42 a 29.50± 1.54 a 1946.17± 34.29a 1.94±0.03a
C2 (Vehicle Control) 9.46 ± 0.49a 29.00 ± 1.32 a 1959.67±37.01 a 1.80± 0.03a
T1 (14.0625 mg/kg) 8.83± 0.33a 29.50 ± 0 .99 a 1918.00±22.11 a 1.88± 0.06a
T2
(18.725 mg/kg) 8.83±0.16a 30.66 ± 1.23 a 1939.17±20.78 a 1.85 ± 0.05a
T3
(28.125mg/kg) 9.33±0.42a 30.00 ± 1.24 a 1908.83±44.52 a 1.86± 0.04a
Note: Data in the column having different superscript differ significantly (p< 0.05).
TABLE 2b:Effect on hematological parameters after 28 days of oral exposure of alphacypermethrin in WLH chicks (n=6)
Group& Dose Hematological parameters (Mean ± SE ) (n=6)
Hb (gm/dl) PCV (%) TLC (x103 /µlit) TEC (mi llion / µli t)
C1 (Control) 9.40± 0.36a 28.00 ± 0 .57 a 1938.50±16.99 a 1.90±0.048a
C2 (Vehicle Control) 9.73± 0.35a 27.50 ± 0 .76 a 1982.50±9.50 a 1.88±0.04 a
T1 (14.0625 mg/kg) 10.00± 0.23a 30.16 ± 1.19 a 1945.00±20.54 a 1.91±0.05 a
T2
(18.725 mg/kg) 10.16±0.18a 29.00 ±0 .96 a 1956.333±25.65a 1.88±0.04a
T3
(28.125mg/kg) 10.00±0.14a 28.66 ±0 .88 a 1925.00±29.25 a 1.84±0.05a
Note: Data in the column having different superscript differ significantly (p< 0.05).
TABLE 3a:Effect of daily oral administration after 14 days exposure of alphacypermethrin on biochemical parameters in WLH chicks
(n=6)Group& Dose Biochemical parameters
ALT (U/Lit) AST (U/Lit) ALP (U/Lit) LDH (U/Lit) CRT (mg/dl) GLU (mg/dl)
C1 (Control) 17.57± 1.26a 119.36±5.12 a 37.16± 2.87a 949.33± 50.89a 0.23±0.02 a 134.90±4.07 a
C2 (Vehicle Control) 15.58± 1.02a 124.43±4.94 a 36.95± 2.45a 908.66± 89.29a 0.24±0.03 a 138.70±13.36 a
T1 (14.0625 mg/kg) 23.63± 1.72b 163.90±10.35 b 53.26± 1.22b 932.66± 63.36a 0.24±0.03 a 150.33±10.66 a
T2
(18.725 mg/kg) 27.35± 0.84c 194.15±4.75 b 57.32± 3.52b 1069.10± 77.62a 0.32±0.03 ab 196.60±16.48 b
T3
(28.125mg/kg) 31.07± 0.95d 203.41±6.58 b 62.73± 4.74b 1329.60± 85.03b 0.36±0.03 b 274.66±22.84 c
Note: Data in the column having different superscript differ significantly (p< 0.05).
TABLE 3b:Effect of daily oral administration after 28 days exposure of alphacypermethrin on biochemical parameters in WLH chicks(n=6)
Group& Dose Biochemical parameters
ALT (U/Lit) AST (U/Lit) ALP (U/Lit) LDH (U/Lit) CRT (mg/dl) GLU (mg/dl)
C1 (Control) 17.89± 0.80a 121.55 ± 8.27 a 37.46± 3.25a 1084.15±77.82a 0.28±0.03 a 153.53±10.52 a
C2 (Vehicle Control) 16.16± 0.99a 123.65 ± 4.08 a 38.46± 2.69a 947.66±177.15a 0.33±0.04 a 150.83±11.66 a
T1 (14.0625 mg/kg) 27.22± 2.15b 157.35 ± 14.93 b 56.84± 2.96b 1252.65±186.75a 0.58±0.09 ab 179.71±8.14 a
T2
(18.725 mg/kg) 29.78± 1.09b 200.65 ± 6.88 c 62.00± 1.27b 1250.73±119.88a 0.89±0.15 bc 211.40±5.58 b
T3
(28.125mg/kg) 41.99± 1.90c 262.24± 13.25 d 70.01± 2.03c 1834.00±142.13b 1.28±0.35 c 153.53±10.52 a
Note: Data in the column having different superscript differ significantly (p< 0.05).
Pandey and Thaker
10-15 mm thickness and fixed in 10% neutral bufferedformalin and processed by standard methods and
embedded in paraffin wax. Section of 3-5 micron thicknesswere taken and stained with haematoxylin and eosin (H&E)

8/13/2019 JVPT-2012_Vol11
http://slidepdf.com/reader/full/jvpt-2012vol11 97/108
Journal of Veterinary Pharmacology and Toxicology/December 2012/Vol.11/Issue 1-2/91-94 93
for histopathological evaluation (Luna, 1968).Statistical analysis
All the values were expressed as mean ± S.E.M(Standard error of mean). Statistical analysis was doneby using SPSS 7.5. Statistical significance of differencesbetween two mean was assessed by one way ANOVA
test. Means having different superscripts at a particularperiod of treatment differs significantly (P<0.05).
RESULTS AND DISCUSSIONAlphacypermethrin did not produce any gross
effect at dose rate of 14.0625 mg/kg body weight. Howeverat higher doses ranging from 18.725 and 28.125 mg/kgbody weight it exerts sign of toxicity followed by prolongeddepression, licking and salivation. Significant decrease inbody weight (Table-1) was observed in treatment groupsas compared to control group on day 14 onwards till theend of the observation period.
There was no significant alteration noticed inhematological parameters in treatment group as comparedto concurrent control birds as it is summarized in Table-2a and 2b.
The effect of alphacypermethrin on biochemicalparameters is summarized in Table-3a, 3b & 3c.Alphacypermethrin significantly increased the levels ofserum AST, ALT, ALP, LDH, CRT and glucose in treatedbirds as compared to control. On the other hand significantdecrease in serum ALB, GLB and TP was observed inalphacypermethrin treated birds as compared to controlgroups.
It was evident that alphacypermethrin produced
hemorrhages and odema in lungs; necrosis, hemorrhagesand fattty changes in liver; intertubular hemorrhages andnecrosis in kidney; condensation and vacuolations inspleen; reticuloendothelial cell hyperplasia in thymus andatrophy of bursal follicles.
In present investigation, alphacypermethrinadministration did not influence hemoglobin, packed cellvolume, total erythrocyte count and total leukocyte count.Similarly, no changes were observed in hemoglobin andPCV on administration of different insecticides in poultry
(Gupta and Paul, 1972; Mohiuddin and Ahmed, 1986;Thaker and Garg, 1993).
The acivities of serum enzymes like AST, ALT,ALP, LDH and CRT were increased significantly inalphacypermethrin treated chicks. Chemically inducedcellular alterations varies from simple increase of
metabolism to death of cell and the increase or decreaseof enzyme activities correlated with the intensity of cellulardamage. The increase of transaminase activity was theconsequence of alphacypermethrin induced pathologicalchanges of tissues. Similar findings were also reportedby Manna et al., 2004. Alphacyno group of pyrethroidsincreases the glucose utilization in the brain tissues (Lockand Berry, 1981). Inorganic phosphorus, thus required forthe phosphorylation may be met from increased alkalinephosphatase (ALP). Alphacypermethrin causeshyperglycemia in the present experiment which was alsoreported by Kaur and Sandhu, 2006. Hyperglycemia maybe due to involvement of adrenal medulla in treated birds.Insecticides stimulate catecholamines that are known toinhibit the insulin secretion by activation of alpha-receptorof pancreas (Weiner, 1985). The decreased insulin levelhas been reported in certain insecticide poisoning wherehyperglycemia was observed (Coore and Randle, 1964;Tyler et al., 1972; Giri et al.,1983). Decreased TP, ALBand GLB were observed in the present study. Similarfindings of decrease in total protein and albumin has alsobeen observed in birds by different insecticides (Bhushan,1993; Khurana et al., 1996; Singh et al., 2001).
Histopathological findings reported in this studywere similar to histopathological changes of liver, kidney,
lungs, thymus and spleen reported in mice treated withalphamethrin (Luty et al., 2000).
ACKNOWLEDGEMENTMeghmani Corporation Pvt Ltd, Ahmedabad, for
providing technical grade of alphacypermethrin for conductof the experiment.
REFERENCESBhushan, B. (1993). Study on immunotoxicological effects
Alphacypermethrin toxicity in chicks
TABLE 3c:Effect of daily oral administration after 14 and 28 days exposure of Alphacypermethrin on Biochemical parameters in WLHcockerel (n=6)
Group& Dose Biochemical parameters
After 14 Days of exposure After 28 Days of exposure
Total Protein Albumin Globulin Total Protein Albumin Globulin(gm/dl) (gm/dl) (gm/dl) (gm/dl) (gm/dl) (gm/dl)
C1 (Control) 2.48±0.04 a 1.30±0.03 a 1.183±0.061a 2.86±0.19 ab 1.38±0.08ab 1.381±0.085ab
C2 (Vehicle Control) 2.47±0.04 a 1.31±0.09 a 1.164±0.117a 2.64±0.07 a 1.59±0.13 a 1.597±0.130 a
T1 (14.0625 mg/kg) 2.18±0.14 ab 1.15±0.07 b 1.043± 0.087a 2.38±0.18 b 1.16±0.11 bc 1.208±0.155 ab
T2
(18.725 mg/kg) 2.14±0.09 ab 1.19±0.03 ab 0.978± 0.191a 2.30±0.12 ab 1.21±0.15 ab 1.102±0.109 bc
T3
(28.125mg/kg) 2.09±0.11 b 1.21±0.04 ab 0.876± 0.108a 2.24±0.06 b 1.28±0.08 c 0.978±0.085c
Note: Data in the column having different superscript differ significantly (p< 0.05)

8/13/2019 JVPT-2012_Vol11
http://slidepdf.com/reader/full/jvpt-2012vol11 98/108
of malathion and carbaryl in chickens. M. V. Sc.Thesis submitted to CCS Haryana AgricultureUniversity, Hisar, India.
Coore, H.C. and Randle, P.J. (1964). Regulation of insulinsecretion studied with pieces of rabbit pancreasincubated in vitro. Biochem. J . 93: 66-78.
Giri, S.N., Curry, D.L., Stabenfeldt, Q., Spangler, W. L.,Chandler, D. B. and Schiedt, M. J. (1983). Effectsof parquet on plasma glucose, cortisol,catecholamines and insulin in the beagle. Environ.Res . 30: 80-88.
Gupta, P.K. and Paul, B.S. (1972). Influence of dietaryintake of malathion on the haematology andplasma electrolytes in chickens. Poult. Sci. 51:
1574-1577.Khurana, R., Chauhan, R. S. and Mahipal, S. K (1996).
Immunopathology of chronic cypermethrin toxicityin poultry. In: Proceedings of XIII Annualconference of IAVR and National Syposium on
Impact of Environmental Pollution on Health andproduction of livestock, Poultry and Wild Life.Pantanagar, pp-71(body weight).
Kaur, A. and Sandhu, H.S. (2006). Dermal toxicity ofalphamethrin and fenvalerate in cross bred cowcalves. Indian Vet. J . 83: 25-28.
Luna, L.G. (1968). Manual of histologic staining methodsof the Armed Forces Institute of Pathology. 3 rd
ed., McGraw Hill Book Co., New York.Luty, S., Latuszynska, J., Obuchowska-Przebirowska,
D., Tokarska, M. and Haratym-Maj, A. (2000). Subacute toxicity of orally applied alpha-cypermethrinin Swiss mice. Ann. Agric. Environ. Med . 7(1):33-
41.
Lock, A. and Berry, N. (1981). Biochemical changes in ratcerebellum following cypermethrin administration,Toxicol. Appl.Pharmacol . 59: 508-514.
Mohiuddin, S.M. and Ahmed, M.N. (1986). Effect of feedingekalux (Quinalphos) pesticide in poultry. Indian Vet. J . 63: 796-798.
Manna, S., Bhattacharya, D., Mandal, T.K. and Das, S.(2004). Repeated dose toxicity of deltamethirn inrats. Indian J. Pharmacol . 37(3): 161-164.
Singh, B.P., Singhal, L.K. and Chauhan, R.S. (2001).Fenvalerate induced cell-mediated and humoralimmune alterations in chickens. J. Immunol.Immunopathol. 3: 59-62
Singh, S.P and Sharma, L.D. (2003). Evaluation of medianlethal dose alphacypermethrin in 8 week old WLHchicks. J .Vet. Pharmacol. Toxicol. 3: 90-93.
Thaker, A.M. and Garg, B.D. (1993). Biochemicalalteration in chicks following long term exposureto endosulfan and malathion. Indian J. Poult. Sci.
28(1): 51-55.Tyler, J.M., Kajinuma, H. and Mialhe, P. (1972). Stimulation
of pancreatic glucagon secretion by epinephrinein vivo. Fed. Proc . 31: 26-30.
Weiner, N. (1985). Norepinephrine, epinephrine and thesympathomimetic amines. In: ThePharmacological Basis of Therapeutics. 9th Edn.(A.G. Goodman, L.S.Goodman, T.W.Rall andF.Murad). MacMillan Publishing Co. Inc. New York.pp.145-180.
Received on: 16-09-2012 Accepted on: 20-12-2012
Pandey and Thaker
94 Journal of Veterinary Pharmacology and Toxicology/December 2012/Vol.11/Issue 1-2/91-94

8/13/2019 JVPT-2012_Vol11
http://slidepdf.com/reader/full/jvpt-2012vol11 99/108
1, 2Department of Veterinary Pathology;3Department of Veterinary Pharmacology and toxicology, CVASc, Pantnagar.
1Corrosponding Author: Email: [email protected]
CHRONIC TOXICITY STUDY OF ZINC SULPHATE IN COCKERELS
MIR MUDASIR1, A.K. THATHOO2 AND S.P. SINGH3
ABSTRACT
The present experiment was carried out to assess the toxico-pathological effects of zinc sulphate in cockerels. Atotal of 80 WLH cockerels (one month old) were randomly divided into four groups (C, G1, G2 and G3) of 20 birds each. Zincsulphate was incorporated via drinking water @ 15000 ppm, 25000ppm and 35000ppm to group G1, G2 and G3 respectively,for a period of 12 weeks. The birds of group C served as control. Birds were sacrificed for study of gross (macroscopic)lesions if any. In each slaughter, blood and serum samples were collected to assess the haematological and biochemicalparameters. A significant decrease in haemoglobin (Hb), packed cell volume(PCV), total erythrocyte count(TEC) and totalleucocyte count (TLC) were observed. However, a significant increase in haemoglobin and PCV in group G2 on 90 th day andgroup G3 on 60 th and 90th day of experiment were observed. The results of biochemical tests presented a significantdecrease (P<0.01) in glucose and total cholesterol in all the experimental groups as compared to control. The levels of totalprotein, albumin and globulin were significantly decreased in group G1 from 20 th to 90th day of experiment, while in group G2and G3 a significant linear decrease in total protein, albumin and globulin were observed from 20 th to 60th day of experiment whileon 90th day a significant (P<0.05) increase was observed in group G2. In group G3 a significant (P<0.05) increase was observedon 60th and 90th day of experiment as compared to 20 th day of experiment. A significant (P<0.05) increase in creatinine, alaninetransaminase (ALT), aspartate transaminase (AST) and alkaline phosphatase(ALP) levels were found in all the experimentalbirds as compared to control. It is concluded from this study that zinc sulphate above 15000 ppm produced hepatotoxic andnephrotoxic effects after oral administration for 90 days in drinking water in cockerels.
Key words: Chronic toxicity, cockerels, haemaoto-biochemical, toxicity, zinc sulphate.
Research Article
INTRODUCTIONAmongst various trace minerals, zinc (Zn) is an
essential element by being an integral part of more than200 enzymes and participates in many metabolic andenzymatic functions in the body. Zn is also essential inthe proper functioning of the immune system by virtue ofits role in the functioning of B and T-cells (Sahin et al.,2005).One of the most significant functions of Zn is relatedto its antioxidant role and its participation in the antioxidantdefense system (Powell, 2000). Proper concentration is ofkey importance to the proper functioning of heterophils,mononuclear phagocytes and T lymphocytes (Hengmin et
al., 2004). As Zn has high bioavailability from zinc sulfate(ZnSO
4), this study was undertaken to evaluate its chronic
toxicity following its administration at high levels in drinkingwater in cockerels.
MATERIALS AND METHODS
Experimental design The experiment was carried out on eighty, one monthold white leghorn cockerels. After one week of acclimatization,the chicks were randomly divided into four groups viz control(C), G1, G2 and G3 with 20 birds each. Zinc sulphate wasadded in drinking water @ 15000, 25000 and 35000 ppm togroup G1, G2 and G3 for a period of 12 weeks. Feed andwater was provided in ad libitum throughout the study. Birdswere sacrificed to examine gross lesions, if any. On eachslaughter blood and serum samples were collected to
record haematological and biochemical parameters.Haemato-biochemical examination
Total erythrocyte count (TEC, × 106 /mm3) and totalleucocyte count (TLC, × 103 / mm3) were done according tothe method of Natt and Herric (1952) using a diluentscontaining 0.1M Nacl, 0.008M Na
2
HPO4.
.12 H2
O, 0.002MKH2PO4, 0.017M Na2SO4, 7.5ml formaldehyde and 0.1 gmethyl violet 2 B. Packed cell volume (PCV, %),haemoglobulin (Hb, g/dl) (Jain, 1986) and differential leucocytecount (DLC, %) were done by preparing thin blood smearsfrom a drop of blood without anticoagulant (Lucas andJamroz,1961). Blood samples were collected from the wingvein of each bird at 20, 40, 60 and 90thday for haematologicalparameters like total protein, albumin, globulin and totalcholesterol, glucose by and creatinine were estimated bydiagonistic kits. Serum enzymes AST and ALT wereestimated by method of Moss and Henderson (1994). Thedata were expressed as Mean±S.E and statistically
analyzed by two way ANOVA described by Snedecor andCochran (1989).
RESULTS AND DISCUSSION
In the present study, a significant decrease(p<0.05) in Hb and PCV was observed in all theexperimental groups (G1, G2 and G3) in comparison tocontrol. In group G2 a significant increase (P<0.05) inPCV and Hb level was observed on 90th day in comparisonto 60th day of experiment. In group G3 a significant increase
Journal of Veterinary Pharmacology and Toxicology/December 2012/Vol.11/Issue 1-2/95-98 95

8/13/2019 JVPT-2012_Vol11
http://slidepdf.com/reader/full/jvpt-2012vol11 100/108
(p<0.05) in PCV concentration was observed on 60th and 90th day incomparison to 20th and 40th day of experiment (Table 1).The decreasein Hb and PCV might be due to the interference of high zinc levels withiron and copper absorption leading to anemia..Smith and Larson (1946)reported that high levels of dietary zinc results in copper deficiencywhich leads to macrocytic hypochromic anemia. This may be a cause
of decreased Hb and PCV levels in this study. Mulhern et al. (1956)reported decrease in hematocrit in second generation mice onadministration of excess dietary zinc @ 2000 ppm in maternal diet for8 weeks. Ott et al. (1966) observed decrease in Hb and PCV in cattlefollowing higher doses of ZnO @ 2.1g and 3.1 g. Hilmy et al. (1987)also reported decrease in hemoglobin and haematocrit values at highlevel of zinc in Catfish. Increase in PCV and Hb concentration in groupG2 and G3 on 60th and 90th day of experiment may be due to decreasein water intake by experimental birds that might have led tohaemoconcentration.
A significant decrease (P<0.05) in TEC was observed inexperimental groups (G2 and G3) throughout the study in comparisonto control group. However, in group G1 a significant decrease on 60th
day and 90th day was observed as compared to 20th and 40th day ofexperiment (Table 1).The decrease of TEC might be due to either alterederythropoiesis or hemolysis. In the present study, a significant decrease(P<0.05) in TLC was observed in all the experimental groups (G1, G2and G3) in comparison to control group (C).Group G3 had significantdecrease (P<0.05) as compared to G2 and G1 as shown (Table 1). Inthe present study, the differential leucocyte count (DLC) did not differsignificantly in experimental and control birds (Table 2). Haematologicalfindings of this study are in agreements with the findings of Maita et al.(1981) who reported a significant decrease (P<0.05) in haematocrit,Hb, PCV, TEC without a significant in DLC after administration of highdoses of zinc sulphate (ZnSO4) @ 3000 ppm and 30000 ppm in a 13week study in rats. Nurcan Donmez et al. (2001) also reported
insignificant variation in DLC of broiler chicks fed 1000 ppm in drinkingwater for a period of 8 weeks.
In the present experiment a linear significant decrease (P<0.05)in serum glucose and cholesterol concentration was observedthroughout the experiment in comparison to control (Table 3).Similarfindings were also reported by Levengood et al. (2000) and Maitaet al.(1981) who also found a significant decrease in glucose concentrationin zinc dosed ducks and rats. During the present study a significantdecrease in total protein , albumin and globulin was observed in allthe experimental groups G1, G2 and G3 after 90 days, however, ingroup G2 and G3 a significant increase was observed on 60th and 90th
day as compared to 20th and 40th day of experiment (Table 3) whichcould be attributed to less intake of water due to reduced feed intake.Decrease in plasma protein, albumin and globulin could be attributed torenal excretion or impaired protein synthesis or due to liver disorder (Kori-Siakpere, 1995). Results are in accordance to the findings of other worker(Maita et al.,1981; Levengood et al.,2001).
During the present study, a significant increase (P<0.05) in serumcreatinine was observed on 90th day as compared to 20, 40 and 60th day ofexperiment in group G1 and G2. In group G3, a linear significant increase(P<0.05) in creatnine was observed from 20th to 90th day of experiment.(Table 3). An increase in the serum creatinine levels gave an indication
Mudasir et al.
96 Journal of Veterinary Pharmacology and Toxicology/December 2012/Vol.11/Issue 1-2/95-98
T A B L E 1 :
H a e m a t o l o g i c a l p a r a m e t e r s f o l l o w i n g o r a l a d m i n i s t r a t i o n o f z
i n c s u l p h a t e @ 1
5 0 0 0 , 2 5 0 0 0 a n d 3 5 0 0 0 p p m f o r 9 0 d a y s ( M e a n ± S E ) i n
c o c k e r e l s .
G r o u p s /
C
G 1
G 2
G 3
C
G 1
G 2
G 3
T i m e I n t e r v a l
( d a y s )
H e m o g l o b i n ( g / d l )
P C V ( % )
2 0
1 0 . 6
6 ± 0 . 4
4 0 a , w
9 . 9
1 ± 0 . 0
7 6 a , x
9 . 4
3 ± 0 . 1
2 0 a , y
8 . 5
0 ± 0 . 4
7 8 a , z
3 6 . 8
3 ± 1 . 0
1 a , w
3 3 . 8
3 ± 0 . 6
a , x
3 0 . 0
0 ± 0 . 5
7 7 a , y
2 7 . 6
6 ± 1 . 4
5 a , z
4 0
1 0 . 5
1 ± 0 . 2
4 6 a , w
9 . 5
3 ± 0 . 0
6 8 b , x
8 . 4
0 ± 0 . 0
5 7 b , y
6 . 9
3 ± 0 . 2
9 6 c , z
3 7 ± 0 . 5
7 7 a , w
3 0 ± 0 . 5
7 7 b , x
2 7 ± 0 . 5
7 7 b , y
2 2 . 3
3 ± 0 . 8
8 1 b , z
6 0
1 0 . 4
9 ± 0 . 4
5 2 a , w
9 . 3
3 ± 0 . 1
3 9 b , x
8 . 0
4 ± 0 . 0
5 c , y
7 . 9 ± 0 . 2
0 8 b , z
3 6 ± 0 . 5
7 7 a , w
2 7 . 3
3 ± 1 . 2
0 c , x
2 3 ± 0 . 5
7 7 c , z
2 5 . 3
3 ± 0 . 8
8 1 c . y
9 0
1 0 . 4 ± 0 . 3
2 1 a , w
9 . 2
3 ± 0 . 0
3 3 c , x
8 . 4
3 ± 0 . 1
2 0 b , x
8 . 6
6 ± 0 . 1
2 0 a , z
3 6 ± 1 . 0
0 a , w
2 4 . 3
3 ± 0 . 8
8 1 d , , z
2 6 . 3
3 ± 0 . 8
8 1 d , y
2 8 ± 0 . 5
7 7 d , x
T E C X 1 0 6
c e l l s / µ l
T L
C X 1 0 3 c e l l s / µ l
2 0
2 . 6
0 ± 0 . 0
2 8 a , w
2 . 4
9 ± 0 . 0
2 3 a , w
2 . 4
4 ± 0 . 0
1 7 a , x
2 . 4
0 ± 0 . 0
2 a , x
2 5 . 1
5 ± 0 . 5
9 6 a . w
2 3 . 2
8 ± 0 . 3
5 a , x
2 1 . 9
5 ± 0 . 0
3 3 a , y
1 8 . 3
2 ± 0 . 1
9 6 a , z
4 0
2 . 6
1 ± 0 . 0
2 a , w
2 . 4
3 ± 0 . 0
0 5 a , x
2 . 3
2 ± 0 . 0
1 1 b , y
2 . 2
7 ± 0 . 0
1 5 b , y
2 4 . 8
5 ± 0 . 5
0 9 a , w
2 1 . 6
6 ± 0 . 3
3 b , x
1 8 . 7
4 ± 0 . 2
1 1 b , y
1 6 . 4
6 ± 0 . 2
6 4 b , z
6 0
2 . 6
2 ± 0 . 0
5 a , w
2 . 2
2 ± 0 . 0
1 1 b , x
2 . 0
8 ± 0 . 0
9 4 c , y
1 . 8
9 ± 0 . 0
9 8 c , z
2 4 . 5
0 ± 0 . 1
8 1 a , w
1 9 . 9
8 ± 0 . 3
3 8 c , x
1 7 . 4
5 ± 0 . 2
5 9 c , y
1 5 . 5
9 ± 0 . 1
6 3 c , z
9 0
2 . 6
1 ± 0 . 0
2 a , w
1 . 8
9 ± 0 . 1
4 c , x
1 . 6
3 ± 0 . 1
9 d , y
1 . 4
6 ± 0 . 0
9 7 d , z
2 4 . 8
8 ± 0 . 5
6 3 a . w
1 7 . 7
6 ± 0 . 1
4 5 d , x
1 5 . 4
6 ± 0 . 2
5 7 d . y
1 2 . 8
6 ± 0 . 1
3 1 d , z
a , b , c , d - m e a n v a l u e s i n c o l u m n s w i t h n o c o m m o n s u p e r s c r i p t s d
i f f e r s i g n i f i c a n t l y ( p < 0 . 0
5 ) , w , x , y , z - m e a n v a l u e s i n r o w s w i t h n o c o m m o n
s u p e r s c r i p t s d i f f e r
s i g n i f i c a n t l y ( p < 0 . 0
5 )

8/13/2019 JVPT-2012_Vol11
http://slidepdf.com/reader/full/jvpt-2012vol11 101/108

8/13/2019 JVPT-2012_Vol11
http://slidepdf.com/reader/full/jvpt-2012vol11 102/108
of probable kidney damage. Histopathological changes inkidneys were also reported by authors which could becorrelated with the above biochemical findings. Similarresults were observed by Llobet et al. (1988) with asignificantly increased creatnine in rats on administrationof high levels of dietary Zn @ 640mg/kg-day for a period of
12 weeks.There was a significant increase in ALT and ASTactivities in all the experimental groups G1, G2 and G3 atall intervals as compared to control (Table 4). Similarly,ALP had a significant increase in group G1 and G2 on 20,40 and 60th day of experiment with a non-significantincrease on 90th day as compared to 60th day of experiment.In group G3, a significantly increased ALP was observedfrom 20th to 90th day of experiment (Table 4).Increasedactivities of serum AST and ALT enzymes indicate possiblehepatic damage. These enzymes being cytoplasmic inlocation are released into general circulation afterhepatocytes degeneration (Ahmed and Khater, 2001). This
finding was further supported by histopathological changesof liver reported earlier by the authors. Change in theenzymic activities is in agreements with the findings ofother repots by Maita et al. (1981) in rats and Levengoodet al. (2000) in Zn intoxicated mallards. It is concludedfrom this investigation that oral administration of zinc sulphateabove 15000 ppm for 90 days in drinking water producedhepatotoxic and nephrotoxic effects in cockerels
ACKNOWLEDGEMENTThe authors are thankful to Span Diagnostic Limited andERBA Limited for providing kits for this study and Directorof Instructional Poultry Farm Nagla for providing the
experimental birds.
REFERENCESAhmed, M.B. and Khater, M.R. (2001).The evaluation of
the protective potential of Ambrosia maritima extract on acetaminophen-induced liver damage.J.
Ethnopharmacol . 75: 69-174.Hengmin Cui, Peng Xi, Deng Junliang, Li Debing and Yang
Guang. (2004).Pathology of Lymphoid organs inchickens fed a diet deficient in zinc. Avian Pathol.
33 (5):519-524.Hilmy, A.M., El-Domiaty, N.A., Dadbees, A.Y. and Latife.
H. A.A. (1987). Toxicity in Tilapia zil l i
andClariaslazera (Pisces) induced by zinc,seasonally. Comparative Biochemistry and
Physiol. 86: 263-265.Jain, N.C. (1986). Schalm’s Veterinary Haematology. 4th
Ed. Philadeiphia, Lea and Febringer.Kori- Siakpere, O., (1995). Some alterations in
haematological parameters in Clariasisheriensis
(Sydenham) exposed to sublethal concentration ofwater borne lead. Bioscience Res. Commun.8(2):
93-98.Leavengood, J.M., Sanderson, G.C., Anderson, W.L.,
Foley, G.L., Brown, P.W. and Seets, J.W.(2000).Influence of diet on the hematology andserum biochemistry of zinc-intoxicatedmallards.Journal of Wildlife Diseases . 36: 111–
123.Llobet, J.M., Domingo, J.L. and Colomina, M.T.(1988).Subchronic oral toxicity of zinc in rats. Bull.Environ. Contam.Toxicol.,41: 36-43.
Lucas,A.M. and Jamroz, C. (1961).Atlas of AvianHematology, Govt. Printer, Washington, D.C.
Maita, K., Hirano, M., Mitsumori, K., Takahashi, K. andShirasu, Y.(1981).Subacute toxicity studies withzinc sulfate in mice and rats. J. Pestic. Sci.6:327-336.
Moss, D.W. and Henderson, A.K. (1994). Clinicalenzymology, In Tietz Textbook of clinicalchemistry, 3rd ed., C.A. Burtis and E.R. Ashwood,
Eds. W.B. Saunders, Philadelphia. pp 617-721.Mulhern, S.A.,Stroube, W.B. and Jacobs.R.M. (1956).Alopecia induced in young mice by exposure toexcess dietary zinc. Biomedical and Life Sciences Cellular and Molecular Life Sc. 42(5): 551-553
Natt, M.P. and Herrick, C.A. (1952).A new blood diluentfor counting the erythrocytes and leucocytes inthe chicks.Poult. Sci.31: 735-778.
NurcanDonmez, HüseyinDönmez, H., Ercankeskin andilhamiCelik, (2001).Effects of ZincSupplementation to Ration on SomeHematological Parameters in Broiler Chicks. Biol.
Trace Elem. Res. 87:125-131.
Ott, E. A., Smith, W.H., Harrington, R.B. and Beeson,W.M. (1966).zinc toxicity in ruminants I. Effect ofhigh level of dietary zinc on gains, feedconsumption and feed efficiency of lambs.J. Ani.Sci. 25: 414-418.
Powell S.R.( 2000). The antioxidant properties of zinc. J.
Nutr. 130: 1447S-1454S.Prasad, A.S. and Kucuk, O. (2002).Zinc in cancer
prevention. Cancer Metastasis Rev.21:291–295.Sahin, K., Smith, M.O., Onderci, M., Sahin, N., Gursu,
M.F. and Kucuk, O., (2005).Supplementation ofzinc from organic or inorganic source improvesperformance and antioxidant status of heat-distressed quail. Poult. Sci .84: 882-887.
Smith, S.E. and Larson, E.J. (1946). Zinc toxicity in rats:antagonistic effects of copper and liver. J. Biol Chem.163: 29-38.
Snedecor, G.W. and Cochran, W.G. (1989).StatisticalMethods.8th ed. Ames, Iowa State UniversityPress.
Received on : 22- 09-2011Accepted on: 12-02-2012
Mudasir et al.
98 Journal of Veterinary Pharmacology and Toxicology/December 2012/Vol.11/Issue 1-2/95-98

8/13/2019 JVPT-2012_Vol11
http://slidepdf.com/reader/full/jvpt-2012vol11 103/108
Short Communication
1Asstt.Prof., 2Professor and Head, Department of Pharmacology & Toxicology, 2Dean, DGCNCOVAS, CSKHPKVV,
Palampur-176062 (H.P.); 3Veterinary officer Central research institute (CRI) Kasauli (H.P)1Corresponding author: Email: [email protected]
ANTIBACTERIAL ACTIVITIES OF MEDICINAL PLANTS OF NORTH-WEST
HIMALAYAN REGION
D.K. SHARMA1, C. VARSHNEYA2 AND C. SHEKHAR3
ABSTRACT
The present study was designed to screen the antibacterial activities of methanolic extracts of Bauhinia Variegata (Bark) , Glycyrrhiza glabra (stem) , Murraya Koenigii (leaves) and Hippophae rhamnoides (leaves ) by invitro disc diffusionmethod. The antibacterial activity of the medicinal plants was tested against Staphylococcus aureus (S.aureus), Escherichia
coli (E.coli), Pseudomonas aeruginosa (P.aeruginosa), Bacillus subtilis (B.subtilis), Proteus mirabilis (P.mirabilis) andKlebsiella pneumonia (K.pneumonia). The results revealed that methanolic extract of H. rhamnoides (leaves ) showedmaximum zone of inhibition against all the bacterial strains. The maximum zone of inhibitions of B. Variegata (bark) and G.glabra (stem) were observed against S. aureus ). M.koenigii and H. rhamnoides (leaves ) extract showed maximum activityagainst P. aeruginosa when compared with other bacterial species. It is concluded from this study that the plant extracts ofB. variegata, G. glabra, M.Koeni gii and Hippophae rhamnoides (leaves ) possessd good antibacterial activity.
Key words: Bauhinia Variegata , Glycyrrhiza glabra , Murraya Koenigii, Hippophae rhamnoides
The development of drug resistance as well asappearance of undesirable side effects of certain antibiotics(WHO, 2002) has led to the search of new antibacterialagents including medicinal plants. A number of reportsconcerning the antibacterial screening of plant extracts ofmedicinal plants notably have appeared in the literature(Salvat et al., 2001). The present study was designed toscreen the antibacterial activities of four medicinal plantextracts; Bauhinia Variegata (B.Variegata) , Glycyrrhiza
glabra (G.glabra) , Murraya Koenigii (M.Koenigii) andHippophae rahmnoides (H . rahmnioides)
The medicinal plant parts, Bauhinia Variegata (bark), Glycyrrhiza glabra (stem), Murraya Koenigii (leaves) were collected locally from Palampur (H.P.).The leaves ofHippophae rahmnoides were brought from Lahaul regionof H.P. The medicinal plant parts were shade dried andgrounded to fine powder. The powder was extracted withmethanol and lyophilized and stored for further use.
The antibacterial activity of the medicinal plantswas tested against Staphylococcus aureus (S.aureus),
Escherichia coli (E.coli), Pseudomonas aeruginosa (P.aeruginosa), Bacillus subtilis (B.subtilis) , Proteus
mirabilis (P.mirabilis) and Klebsiella pneumonia (K.pneumonia). The screening of antibacterial activity wascarried out by disc diffusion method (Bauer et al.,1966).McFarland 0.5 standardized suspension of bacteria (108
CFU/ml) was used to lawn Muller Hinton agar plates (MHA)evenly using a sterile swab.10µl of each extract (5mg/ml)was added to separate sterile filter paper discs (6mm)and then allowed to dry. The discs were placed by sterileforceps on to the MHA plate at a distance of 24mm. Theampicillin disc (10µg) was used as positive control. The
plates were incubated at 370c for 18-24h. After theincubation, the plates were examined for zone of inhibition.The inhibition zones were then measured in triplicate usingvernier callipers.
The antibacterial activities of all the plant extractsagainst the bacterial strains were examined and wereassessed by the presence or absence of inhibition zones(Table1). Antibiotic Ampicillin was used as referencecontrol. On comparison, H . rahmnoides showed maximumzone of inhibition against all the bacterial strains.(Upadhyay et al., 2010) reported that H . rahmnoides leafextracts had growth inhibiting effect against Bacillus
cereus , Pseudomonas aeruginosa , Staphylococcus aureus and Enterococcus faecalis . The maximum zone ofinhibitions of B. Variegata (bark) and G. glabra (stem)were observed against S. aureus (13±0.58 & 10.67±0.33,mm in diameter,respectively). M.koenigii and H .rahmnoides leaves extract showed maximum activityagainst P. aeruginosa .( 11.67±0.33 & 16.33±0.33,mm indiameter,respectively) when compared with other bacterialspecies. No activity was observed byM.koenigii against
P. mirabilis . This could be due to the distinctive feature ofgram-negative bacteria, which is the presence of a doublemembrane surrounding each bacterial cell. In case of gram-negative bacteria this outer membrane excludes certaindrugs and antibiotics from penetrating the cell. Theactivities of all the plant extracts used were however lesswhen compared to the standard antibioticampicillin(Table1). From these studies it could beconcluded that extracts of B. variegata, G. glabra,M.Koeni gii and H . rahmnoides have antibacterial activity.
Journal of Veterinary Pharmacology and Toxicology/December 2012/Vol.11/Issue 1-2/99-100 99

8/13/2019 JVPT-2012_Vol11
http://slidepdf.com/reader/full/jvpt-2012vol11 104/108
The antibacterial properties of the plant extracts may bedue to their phytochemical constituents. Further studiesare needed to isolate and characterize the bioactivecompounds responsible for the antibacterial activity.
REFERENCESBauer, R.W., Kirby, M.D.K., Sherris, J.C. and Turck M.
(1966). Antibiotic susceptibility testing bystandard single disc diffusion method. American
J. Clinical Pathol . 45: 493-496.Salvet, A., Antonnacci,L., Fortunado, R.H., Suarez, E.Y.
and Godoy, H.M. (2001). Screening of some
TABLE 1.Antibacterial activity of different plant extracts against pathogenic bacterial strains.
Name of Bacteria Zone of inhibition (mm)
Ampicillin* B. Variegata G. glabra M. Koenigii H.rhamnoides (bark) (stem) (leaves) (leaves)
S.aureus (G+ve) 18.67±0.33 13±0.58 10.67±0.33 9.5±0.29 14.67±0.33E.coli (G-ve) 21±0.58 12.5± 0.29 8.5±0.29 8.67±0.44 16±0.58
P. aeruginosa (G-ve) 16.67±0.33 10.33±0.88 9.33±0.33 11.67±0.33 16.33±0.33B. subtilis (G+ve) 10.33± 0.88 9.33±0.44 8.83±0.17 9.33±0.33 15±0.58P. mirabilis (G-ve) 21.67±0.44 9±0.58 9.17±0.17 ———- 16±0.58K. pneumonia (G-ve) 19±0.58 9.33±0.33 8.5±0.29 8.67±0.33 15.5±0.29
Values are triplicate mean ± Standard error; Amp* - Standard antibiotic disc of Ampicillin (10 µg /disc)G +ve= Gram positive, G-ve = Gram negative
plants from northern Argentina for theirantimicrobial activity J. Ethnopharmacol. 32: 293-297
Upadhyay, N.K., Kumar, M.S. and Gupta, A. (2010). food
Chem Toxicol. Antioxidant, cytoprotective andantibacterial effects of Sea buckthorn (Hippophaerhamnoides L) leaves. 48: 3443-3448.
WHO (2002) Traditional Medicine Strategy, 2002-2005.WHO Publication 1-6.
Received on: 15-11-2012
Accepted on: 20-12-2012
Antibacterial activities of medicinal plants
President : Dr. Anil Kumar Srivastava (Karnal)Vice President : Dr (Mrs) Mudasir Sultana (Jammu)Secretary General : Dr. N. Gopa Kumar (Thrissur)Finance Secretary : Dr. S.K. Bhavsari (Navsari)Joint Secretary : Dr. Thakur Uttam Singh (lzatnagar)Chief Editor, JVPT : Dr. S.P. Singh ( Pantnagar)Secretary International Relations : Dr. A.H. Ahmad (Pantnagar)Secretary (HQ) : Dr. A M Thaker (Anand)Immediate Past Secretary General : Dr. C. Varshneya (Palampur)Executive Body Members :
Dr. Raju Prasad (Ranchi)
Dr. Nitesh Kuinar (MHOW)Dr. Shahid Prawej (Jammu)Dr. Vinod Kumar Dumka (Ludhiana)Dr. Dhirendra K.umar (Izatnagar)Dr. Jagadeesh Sanganal (Bangalore)
Executive Committee of ISVPT for 2014-15
100 Journal of Veterinary Pharmacology and Toxicology/December 2012/Vol.11/Issue 1-2/99-100

8/13/2019 JVPT-2012_Vol11
http://slidepdf.com/reader/full/jvpt-2012vol11 105/108
Short Communication
Department of Pharmacology and Toxicology, College of Veterinary Sciences and Animal HusbandryUP Pandit Deen Dayal Upadhyaya Pashu Chikitsa Vigyan Vishwavidyalaya Evam Gau Anusandhan Sansthan,
Mathura, U.P. (281 001), India.*Corresponding Author: email: [email protected]; Phone: +91-9456054995
PREGNANCY-DEPENDENT ALTERATIONS IN SENSITIVITY OF
SEROTONERGIC RECEPTORS IN BUFFALO MYOMETRIUM
ABHISHEK SHARMA, SOUMEN CHOUDHURY, UDAYRAJ P NAKADE, RAJKUMAR SINGH YADAV ANDSATISH KUMAR GARG*
ABSTRACT
5-HT (serotonine) is known to be an important amine and involved in regulating several physiological processesincluding maintenance of pregnancy. But it almost failed to produce any marked contractile effect on buffalo myometrium(pregnant) and even with highest concentration of 10-5 M, the contractile effect (Emax) was found to be only 0.25 ± 0.03g (earlypregnancy) and 0.08 ± 0.01g (mid pregnancy). Preliminary observations revealed that buffalo myometrium was almostinsensitive to 5-HT which further decreased with an increase in the stage of pregnancy and such an effect might have beeneither due to lack of serotonergic receptors or required sensitization by some regulator (s), however, it needs furtherinvestigations.
Key words: Buffalo myometrium, serotonin, pregnancy.
Serotonin (5-hydroxytryptamine, 5HT) is a well-known neurotransmitter in the central nervous systemapart from being present in cells of many other systems-enterochromaphin cells of stomach and small intestinesand intestinal neurons, uterine mast cells and uterinetubes, ovaries and uterine cervix. The function of serotoninis complex, probably due to diversity of serotonin receptorslocated directly on smooth muscle cells, on nerve endingsand within the central nervous system. It has beendiscovered that serotonin, in various animal species, has
stimulating or inhibiting influence on the motor activity ofalimentary tract (Ford et al., 1992). It also producesdifferential effects on the motor activity of uterine smoothmuscles in human and animal species. But despite itspresence in uterine tissues of buffaloes (Sharma et al.,2003), no information is available on its effect on buffalomyometrium, therefore, the present study was undertaken.
Myometrial strips from pregnant uteri of non-descript buffaloes were collected from local abattoir. Uteriwere cut open to ascertain the stage of pregnancy (earlyor mid) based on the presence of foetus and its curvedcrown versus rump length (Soliman et al., 1970).Myometrial strips were prepared and mounted in
thermostatically controlled (37.0 ± 0.5 ºC) organ bath (UgoBasile, Italy) of 10 ml capacity containing continuouslyaerated (95% O
2 + 5% CO
2) Ringer Locke solution (RLS,
pH 7.4). Isometric tension was recorded under 2g restingtension using Chart V5.4.1 software programme (Powerlab,AD Instruments, Bella Vista, NSW, Australia).
Following stabilization of tissues, myometrialstrips were exposed to cumulative concentrations of 5-HTat 1.0 log dose unit and the effect of increasingconcentrations of 5-HT on myometrial spontaneity of
different stages of pregnant buffaloes uteri are shown inFig 1. 5-HT exhibited concentration-dependent contractileeffect on early (0-3 months; Fig. 1A) and mid stagepregnant uteri (3-6 months; Fig. 1B).
The minimum threshold concentration of 5-HTrequired to initiate contractile effect was 10-9 M and themaximal effect on early pregnancy was observed at 10-5
M concentration. On mid-pregnancy stage uterus (3-6months), 5-HT initially exhibited dose-dependent excitatoryeffect with maximal contractile effect at 10-6 M but with
further addition of higher dose, 5-HT produced slightlyinhibitory effect as shown in Fig. 1B. On mid-pregnancymyometrium, there was significant (P<0.05) reduction in5-HT-induced contraction at all the dose levels comparedto that on early-pregnant uterus.
Fig. 2 illustrates the cumulative concentrationsresponse curves of 5-HT on myometrial strips from uteri ofduring different stages of pregnancy (early and mid). pD2
and the maximal response (Emax
) values revealed that therewas significant (P<0.05) reduction in the maximumcontraction in mid stage (0.08 ± 0.01 g; n=5) of pregnancycompared to that on early pregnancy (0.25 ± 0.03 g; n=5)but without appreciably affecting the potency as the pD2
values ranged between 9.59 and 9.65.5-HT is known to be potent spasmogen on uteriof human (Rudolph et al., 1993), rats (Helton and Colbert,1994), and rabbit myometrium (Sohorova et al., 1991),but produces inhibitory effect on pig uterus through 5HT7
receptors (Kitazawa et al., 1998).Emax value of just 0.25 ± 0.03 g in early pregnancy
and 0.08 ± 0.01 g in mid pregnant uteri suggested thatbuffalo myometrium was almost insensitive to the effectof 5-HT. Our results on buffalo myometrium are in
Journal of Veterinary Pharmacology and Toxicology/December 2012/Vol.11/Issue 1-2/101-102 101

8/13/2019 JVPT-2012_Vol11
http://slidepdf.com/reader/full/jvpt-2012vol11 106/108
agreement with the electrophysiological studies on sheepmyometrium where serotonin failed to produce anycontractile effect unless sensitized with stilboestrol(Zawadzki et al., 1999). Therefore, the possibility adequateserotonergic receptors or their sensitization by differentregulator (s) including estrogen in buffalo myometrium can’tbe ruled out, but it requires further investigation.
REFERENCESFord, A.P.D.W., Baxter, R.M., Eglen, R.M. and Clarke,
D.E. (1992). 5-Hydroxytryptamine stimulatecyclic AMP formation in the tunica muscularismucose of the rat oesophagus via 5-HT
4 receptors.
Eur. J. Pharmacol. 211: 117.Helton, D.R. and Colbert, W.E. (1994). Alterations of in–
vitro 5-HT receptor pharmacology as a function of
Fig. 1 :Physiographic recordings showing concentration-dependent effect of 5-HT (10-11 – 10-5 M ) on spontaneity of myometrial
strips of early pregnant (A) and mid pregnant (B) buffaloes.
multiple treatment with 5-hydroxytryptamine or 8-hydroxy-2-(di-N-propylamino) tetralin in rat isolatedaorta, uterus and fundus, and guinea-pig isolatedtrachea. J. Pharm. Pharacol. 46(11): 902.
Kitazawa, T., Kubo, O., Satoh, M. and Teneike, T. (1998).Involvement of 5-hydroxytryptamine 7 receptorsin inhibition of porcine myometrial contractility by5-hydroxytryptamine. Br. J. Pharmacol . 123: 173.
Rudolph, M.I., Reinicke, K., Cruz, M.A., Gallardo, V.,Gonzalez, C. and Bardisa, L. (1993). Distributionof mast cells and the effect mediators oncontractility in human myometrium. Brit. J. of
Obst. and Gynaecol. 100: 1125.Sharma, R. K., Pant, H.C., Sabir, M. and Garg, S. K.
(2003). Concentration of 5-HT (serotonine) inplacenta and uterus of buffaloes during pregnancy.Indian J. Animal Sci. 72:185-186.
Sohorova, R., Mosnarova, A., Huzulikova, I. and Babel, P.(1991). Comparison of changes in uterine reactivityto endogenous substances in rabbits and theeffects of in-vivo and in-vitro administration ofestradiol and testosterone. Bratisl. Lek. Listy. 92:346.
Soliman, M.K. (1970). Studies on the physiologicalchemistry of the allantoic, amniotic fluids of
buffaloes at the various periods of pregnancy.Indian Vet. J. 52: 106-112.Zawadzki, W., Zieba, D. and Dejneka, J. (1999). Changes
of uterus myoelectrical activity under influence ofserotonin in sheep sensitised and non-sensitisedwith stilboestrol, EJPAU. 2(2): 02.
Received on: 16-12-2012 Accepted on : 28-12-2012
Sharma et al.
Fig. 2:Cumulative concentration response curves of 5-HT onmyometrial strips from early pregnant (0-3 months; n=5)
and mid pregnant (3-6 months; n=5) buffaloes. Vertical barsrepresents SEM. Data were analyzed by two-way ANOVA
followed by Bonferoni post-hoc tests
102 Journal of Veterinary Pharmacology and Toxicology/December 2012/Vol.11/Issue 1-2/101-102

8/13/2019 JVPT-2012_Vol11
http://slidepdf.com/reader/full/jvpt-2012vol11 107/108
JOURNAL OF VETERINARY PHARMACOLOGY AND TOXICOLOGY
ISSN 0972-8872
Official Publication of the Indian Society of Veterinary Pharmacology & Toxicology
December 2012 Volume 11 Issue 1-2
CONTENTS
Research Review
1. G-PROTEIN COUPLED RECEPTORS: PAST AND PRESENT STATUS 1-7S.P. SINGH, A.H. AHMAD, WASIF AHMAD AND N.K. PANKAJ
Research Articles
2. CNS DEPRESSANT AND ANTI-CONVULSANT ACTIVITY OF HYDROETHANOL EXTRACT OF 8-12DRYMARIA CORDATA WILLD
C. C. BARUA, J. D. ROY, B. BURAGOHAIN, A. TALUKDAR, A. G. BARUA, P. BORAH AND MANGALA LAHKAR
3. HOMOLOGY MODELING OF CANINE PROSTAGLANDIN G/H SYNTHASE-2 13-15BHASKAR GANGULY, SUDHIR KUMAR, TANUJ AMBWANI AND S.P. SINGH
4. EFFECT OF DOCOSAHEXAENOIC ACID ON CONCENTRATION-RESPONSE RELATIONSHIP OF 16-185-HT AND REVERSAL OF 5-HT CONTRACTION IN SHEEP CORONARY ARTERY
THAKUR UTTAM SINGH, SUBHASHREE PARIDA, SATISH KUMAR GARG, SANTOSH KUMAR MISHRA
5. PROGESTERONE PROFILE AND CONCEPTION RATE FOLLOWING INSULIN TREATMENT DURING 19-21LUTEAL PHASE OF ESTROUS CYCLE IN BUFFALOES
Q. HUQ, H.P. GUPTA, SHIV PRASAD, V.S. RAJORA AND ASAD HUSSAIN
6. PHARMACOKINETICS OF CEFEPIME IN FEBRILE BUFFALO CALVES 22-24SHWETA JAIN, NEETU RAJPUT AND Y. P. SAHNI
7. IMPACT OF SUB-CHRONIC ORAL EXPOSURE OF IMIDACLOPRID ON BIOCHEMICAL PROFILE OF 25-28CROSSBRED CALVESBARINDERJIT KAUR, RAJDEEP KAUR AND H.S. SANDHU
8. NITRIC OXIDE AND C-GMP-INDEPENDENT β2-ADRENOCEPTORS MEDIATED TOCOLYSIS IN BUFFALOES 29-32SOUMEN CHOUDHURY, THAKUR UTTAM SINGH, SATISH KUMAR GARG ANDSANTOSH KUMAR MISHRA
9. THRESHOLD PLASMA FLUORIDE LEVELS IN GOATS FOR SUBACUTE ORAL TOXICITY OF FLUORIDE 33-36AND EFFICACY OF ALUMINIUM SULPHATE AS AN AMELIORATIVE AGENT
VINAY KANT, A. K. SRIVASTAVA, R. RAINA, P.K. VERMA, N.K. PANKAJ, P. SINGH AND S.K. UPPAL
10. PHARMACOKINETICS OF LEVOFLOXACIN FOLLOWING SUBCUTANEOUS ADMINISTRATION IN 37-40CATTLE CALVES
ARVIND KUMAR, ANU RAHAL, RAM RAGVENDRA, RAJESH MANDIL, ATUL PRAKASH ANDSATISH K. GARG
11. PHARMACOKINETICS OF PEFLOXACIN IN E.COLI (K88
STRAIN) ENDOTOXIN INDUCED FEBRILE GOATS 41-42A. K. NATH, R.K.ROY, D.C.ROY AND R. GOGOI
12. ACUTE TOXICITY AND NEUROBEHAVIOURAL EFFECTS OF ACETAMIPRID IN MICE 43-49V. KARTHIKEYAN, S. K. JAIN AND J. S. PUNIA
Journal of Veterinary Pharmacology and Toxicology/December 2012/Vol.11/Issue 1-2

8/13/2019 JVPT-2012_Vol11
http://slidepdf.com/reader/full/jvpt-2012vol11 108/108
13. COMPARATIVE ANALYSIS OF PESTICIDE RESIDUES IN FODDER AND BUFFALO PLASMA COLLECTED 50-52FROM THREE DIFFERENT DISTRICTS OF PUNJAB
V. K. DUMKA, H. S. SANDHU, S. RAMPAL, RAJDEEP KAUR AND KAMALPREET KAUR
14. PARALYTIC EFFECT OFPEGANUM HARMALA LINN. ALCOHOLIC EXTRACT ON FASCIOLA GIGANTICA 53-55
S. W. HAJARE, M. K. LONARE AND DINESH KUMAR15. HAEMATO-BIOCHEMICAL PROFILE AFTER REPEATED ADMINISTRATION OF PEFLOXACIN IN GOATS 56-58
NIRBHAY KUMAR, BIPIN KUMAR, S.D. SINGH AND C. JAYACHANDRAN
16. EVALUATION OF TOXICITY OF ENDOSULFAN FOLLOWING MULTIPLE ORAL ADMINISTRATION IN POULTRY 59-61LATA GAYAL, S.P. SINGH AND A.H. AHMAD
17. SUB ACUTE DERMAL TOXICITY OF BIFENTHRIN WITH SPECIAL REFERENCE TO HAEMATO- 62-64BIOCHEMICAL CHANGES IN RAT
MUNEER AHMAD DAR, RAJINDER RAINA, NRIP KISHORE PANKAJ, MUDASIR SULTANA ,PAWAN KUMAR VERMA AND AADIL MEHRAJ
18. PREGNANCY-DEPENDENT ALTERATIONS IN FREQUENCY AND AMPLITUDE OF MYOMETRIAL 65-68SPONTANEITY IN BUFFALOES
ABHISHEK SHARMA, SOUMEN CHOUDHURY, UDAYRAJ P NAKADE, RAJKUMAR SINGH YADAV ANDSATISH KUMAR GARG
19. PROTECTIVE ROLE OF VITAMIN E AND PHENYTOIN IN CHLORPYRIFOS INDUCED DELAYED 69-71NEUROPATHY IN HEN
K. KAVITHA, B. KALA KUMAR, S.S.Y.H. QUADRI, Y.N. REDDY AND M. ALPHA RAJ
20. STUDY ON IMMUNOTOXIC POTENTIAL OF ALPHACYPERMETHRIN IN WLH CHICKS 72-75NAVNEET KUMAR PANDEY AND A.M.THAKER
21. DEVELOPMENT OF THERAPEUTIC MODULE FOR JATROPHA CURCAS SEED AND SEED OIL TOXICITY 76-79IN GOATS
AMIT SHUKLA AND S.P. SINGH
22. PROTECTIVE EFFECT OF TRIANTHEMA PORTULACASTRUM ON CADMIUM INDUCED TOXICITY IN RATS 80-84Y. PAVAN KUMAR, K. ADILAXMAMMA, U. VENKATESWARLU, T.S. CHANDRASEKHARA RAOAND M. ALPHA RAJ
23. DISPOSITION KINETICS OF CEFTRIAXONE AFTER INTRAMUSCULAR ADMINISTRATION IN GOATS 85-87NAVEEN KUMAR, B.K. ROY, VIJAY KUMAR, WASIF AHMAD AND N. K. PANKAJ
24. HAEMATO-BIOCHEMICAL PROFILE FOLLOWING MULTIPLE ORAL DOSE ADMINISTRATION OF 88-90
CONTENTS