justice data lab analysis: re-offending behaviour after ... · introduction by the clink of a...
TRANSCRIPT
This document is released under the Open Government Licence 1
The Clink Restaurant programme provides vocational training in catering, front of house and
cleaning aiming to give prisoners skills and qualifications which will help them to secure
employment on release, with the intention that this will reduce the rate of reoffending.
This analysis of the Clink Restaurant training programme measured proven re-offences in a one-
year period for a 'treatment group' of 89 offenders who took part in the programme and for a much
larger 'control group' of similar offenders who did not take part. These measurements were used
to estimate the impact that the programme would be expected to have on the re-offending
behaviour of any people who are similar to those in the analysis.
The 89 people who were eligible to be included in the main analysis were from a group of 178
records submitted to the Justice Data Lab. The effects of the programme on those who were not
analysed may be different to the effects on those who were.
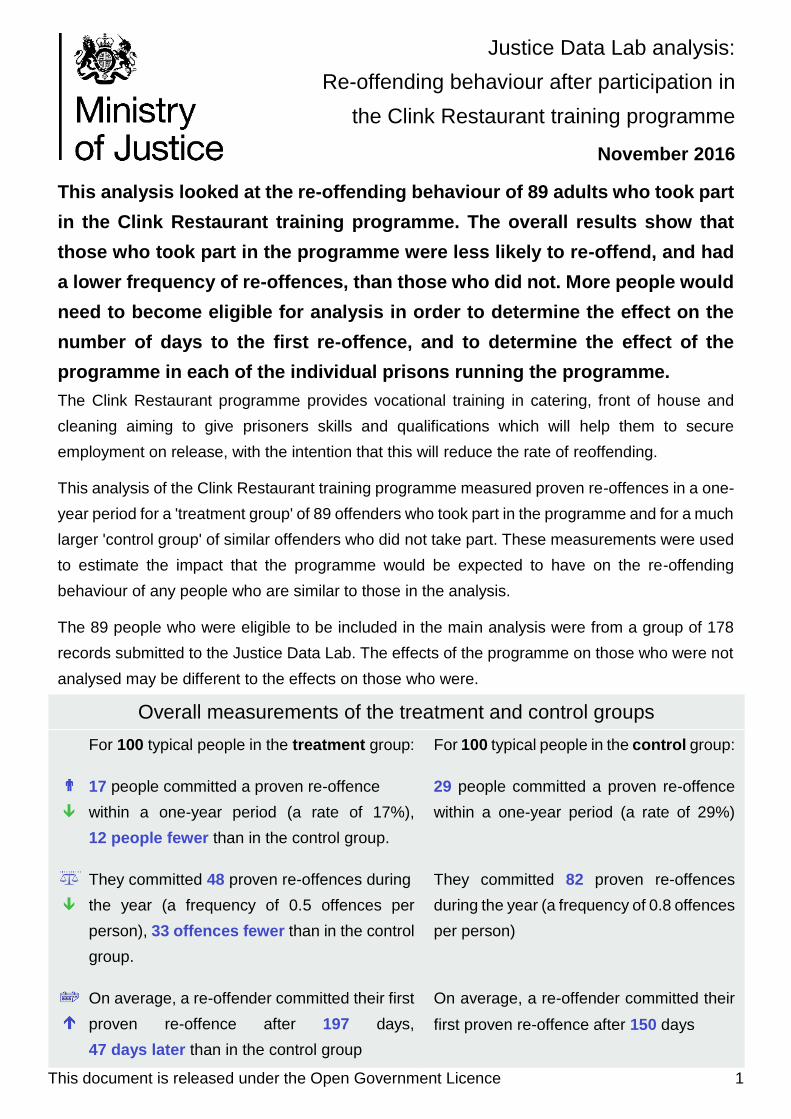
Justice Data Lab analysis:
Re-offending behaviour after participation in
the Clink Restaurant training programme
November 2016
This analysis looked at the re-offending behaviour of 89 adults who took part
in the Clink Restaurant training programme. The overall results show that
those who took part in the programme were less likely to re-offend, and had
a lower frequency of re-offences, than those who did not. More people would
need to become eligible for analysis in order to determine the effect on the
number of days to the first re-offence, and to determine the effect of the
programme in each of the individual prisons running the programme.
For 100 typical people in the control group:
29 people committed a proven re-offence
within a one-year period (a rate of 29%)
They committed 82 proven re-offences
during the year (a frequency of 0.8 offences
per person)
On average, a re-offender committed their
first proven re-offence after 150 days
Overall measurements of the treatment and control groups
For 100 typical people in the treatment group:
17 people committed a proven re-offence
within a one-year period (a rate of 17%),
12 people fewer than in the control group.
They committed 48 proven re-offences during
the year (a frequency of 0.5 offences per
person), 33 offences fewer than in the control
group.
On average, a re-offender committed their first
proven re-offence after 197 days,
47 days later than in the control group

This document is released under the Open Government Licence 2
What you can say about the one-year re-offending rate:
"This analysis provides evidence that, for every 100 participants, the Clink programme may
decrease the number of proven re-offenders during a one-year period by between 4 and 20
people."
What you cannot say about the one-year re-offending rate:
"This analysis shows that the Clink programme increases/has no effect on the one-year
proven re-offending rate of its participants."
What you can say about the one-year re-offending frequency:
"This analysis provides evidence that, for every 100 participants, the Clink programme may
decrease the number of proven re-offences during a one-year period by between 4 and 63
offences."
What you cannot say about the one-year re-offending frequency:
"This analysis shows that the Clink programme increases/has no effect on the one-year
proven re-offending frequency of its participants."
What you can say about the time to first re-offence:
"This analysis provides evidence that, for participants who re-offend during a one-year period,
the Clink programme may shorten the average time to first proven re-offence by up to 22 days
or lengthen it by up to 116 days."
What you cannot say about the time to first re-offence:
"This analysis shows that, for participants who re-offend during a one-year period, the Clink
programme decreases/increases/has no effect on the average time to first proven re-offence."
For 100 typical people who would receive the intervention, compared with 100 similar people
who would not receive it:
The number of people who would commit a proven re-offence during one year after release
could be lower by between 4 and 20 people. This is a statistically significant result.
The number of proven re-offences committed during the year could be lower by between 4
and 63 offences. Again, this is a statistically significant result.
On average, the time before a re-offender committed their first proven re-offence could be
shorter by as many as 22 days, or longer by as many as 116 days. More people would
need to be analysed in order to determine the direction of this difference.
Overall estimates of the impact of the intervention
This document is released under the Open Government Licence 3
Contents
Key findings 1
Charts 4
The Clink Restaurant training programme: in their own words 6
The Clink's response to the Justice Data Lab analysis 7
The results in detail 8
Profile of the treatment group 11
Matching the treatment and control groups 12
Numbers of people in the treatment and control groups 13
Contacts 14
This document is released under the Open Government Licence 4
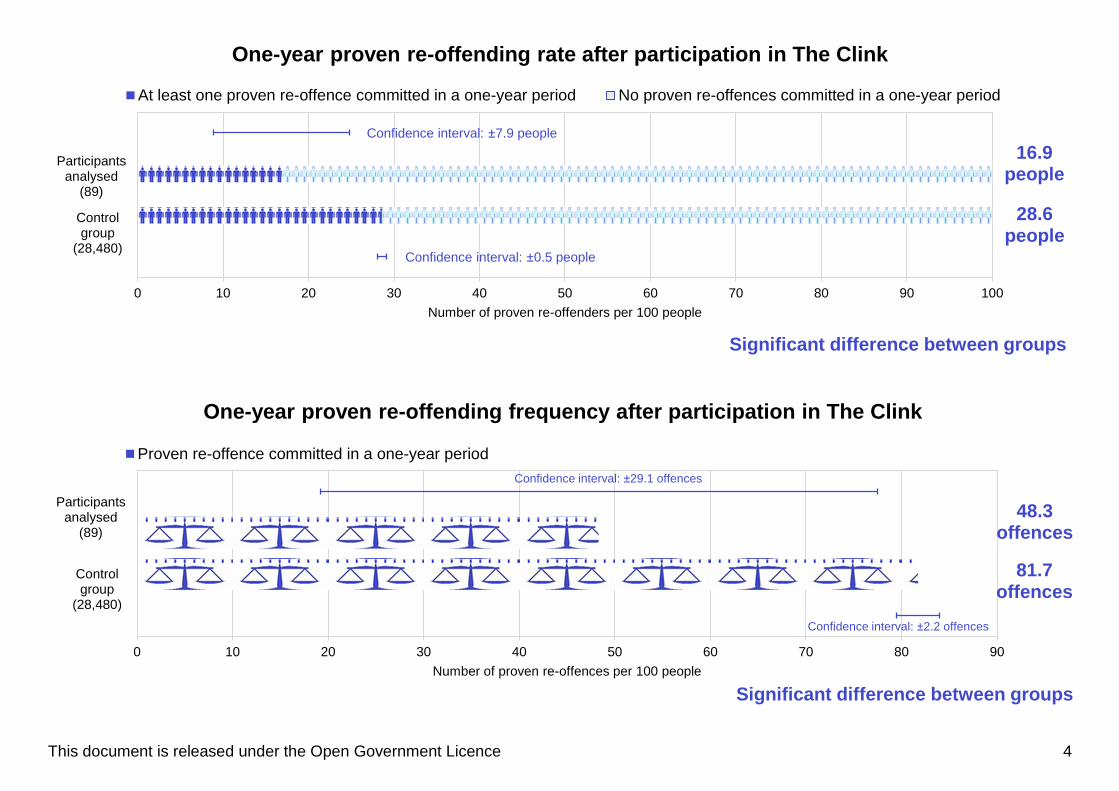
Significant difference between groups
28.6people
16.9people
One-year proven re-offending rate after participation in The Clink
Confidence interval: ±0.5 people
Confidence interval: ±7.9 people
0 10 20 30 40 50 60 70 80 90 100
Controlgroup
(28,480)
Participantsanalysed
(89)
Number of proven re-offenders per 100 people
At least one proven re-offence committed in a one-year period No proven re-offences committed in a one-year period
Significant difference between groups
81.7offences
48.3offences
One-year proven re-offending frequency after participation in The Clink
Confidence interval: ±2.2 offences
Confidence interval: ±29.1 offences
0 10 20 30 40 50 60 70 80 90
Controlgroup
(28,480)
Participantsanalysed
(89)
Number of proven re-offences per 100 people
Proven re-offence committed in a one-year period
This document is released under the Open Government Licence 5
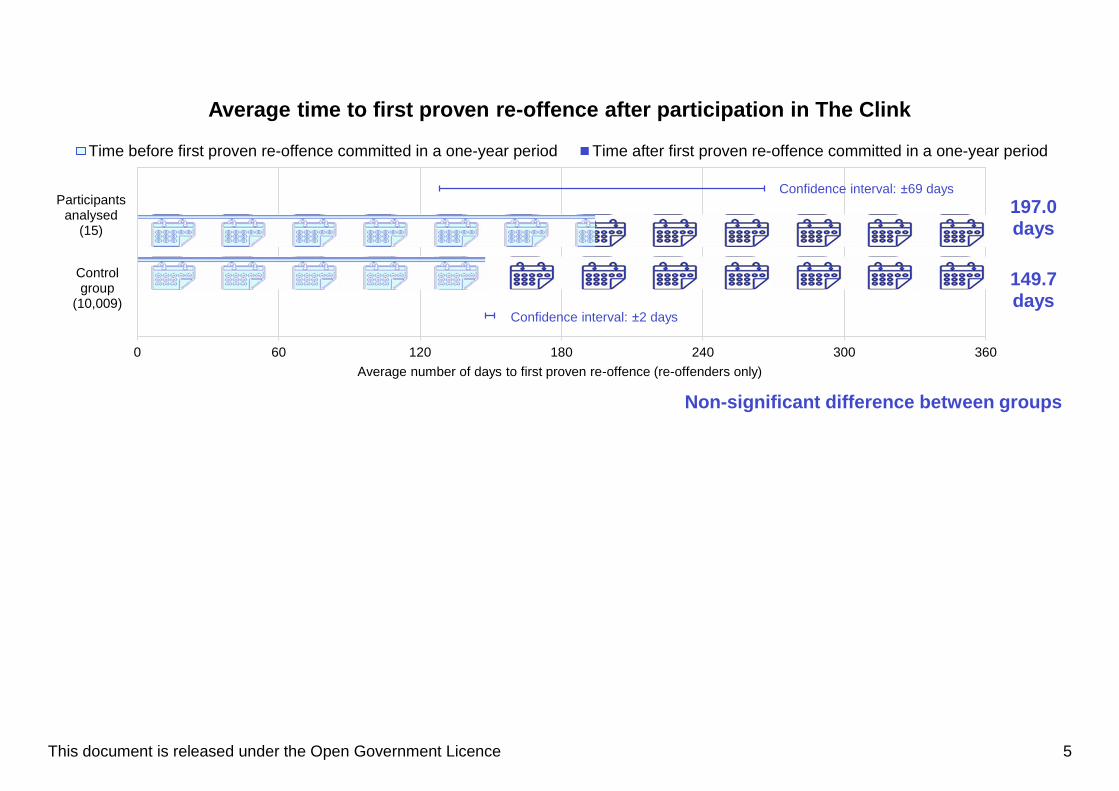
Non-significant difference between groups
149.7days
197.0days
Average time to first proven re-offence after participation in The Clink
Confidence interval: ±2 days
Confidence interval: ±69 days
0 60 120 180 240 300 360
Controlgroup
(10,009)
Participantsanalysed
(15)
Average number of days to first proven re-offence (re-offenders only)
Time before first proven re-offence committed in a one-year period Time after first proven re-offence committed in a one-year period

This document is released under the Open Government Licence 6
“ The Clink provide vocational training in catering, front of house, cleaning and horticulture. The
service aims to give prisoners skills and qualifications that will enable them to secure employment
on release, with the intention that this will reduce the rate of reoffending.
There are training restaurants in HMP High Down, HMP Cardiff, HMP Brixton and HMP Styal,
and a horticulture project in HMP Send. For the purpose of this analysis, the cohort includes
individuals from the High Down, Cardiff and Brixton restaurants, as the programme at HMP Styal
has not been running long enough for a valid one-year reoffending rate to be calculated. Data on
the individuals at HMP Send was not provided.
Our objective is to develop life and employment skills in preparation for release and provide
specialist training to facilitate prisoners’ future employment in the hospitality industry. We provide
an intensive support package on release into the community, including help with accommodation,
debts, substance misuse, employment, budgeting and life skills.
The programme works with prisoners for between 6 and 18 months immediately prior to their
release. The restaurants are a live working environment with a busy customer service. Trainees
learn to take responsibility as individuals and to work as part of a team. They learn time keeping,
team work, customer service and they develop their self-esteem and confidence. The length of
prisoners’ sentences does not determine the likelihood of their being selected for the programme,
as long as they have a minimum of 6 months remaining to complete their training.
The charity has been running for 6 years in HMP High Down and has more recently opened in
Cardiff, then Brixton, Send and Styal. ”
The Clink Restaurant training programme: in their own words

This document is released under the Open Government Licence 7
The Clink's response to the Justice Data Lab analysis
“ The Clink Charity welcome the findings of The Justice Data Lab (JDL) report into the
effectiveness of the Restaurant’s integrated training program.
We are delighted that the findings have shown a 12 percentage point reduction in re-offending
against a comparative control group and that the JDL identify that “prisoners who took part in the
programme were less likely to re-offend, and had a lower frequency of re-offences than those
who did not”. We note that very few interventions have achieved such a positive outcome in a
JDL analysis (The Justice Data Lab Synthesis and Review of Findings, September 2016,
Middlesex University, London).
Notwithstanding the above, an up-to-date audit of more complete and recent data set has a very
exciting outcome that is even better than that reported by the JDL. The Clink is working to prepare
this latest data for a follow up JDL analysis. The reasons behind these continued successes and
the further improvements are as follows:-
The JDL report shows a continued improvement from 2013 – this coincided with the
introduction by The Clink of a holistic approach to treatment of offenders. In 2013 The
Clink introduced an integrated program whereby we apply a complete package of
measures. The offender not only is formally trained to work towards gaining their
accredited City and Guilds NVQ level 2 qualifications in Food Preparation and Food
Service and Horticulture (in Send), but also receives soft skills training in gaining
confidence and learning to work as part of a team. They also receive support with CV
writing, disclosure statements, interview training, introduction to employers through our
network and mentoring for one year post-release. This is achieved with an integrated
approach focussing upon the individual.
We have further improved this program and are looking forward to auditing.
We are confident that future analyses will show an even greater impact on reoffending than has
already been demonstrated by the JDL. ”
This document is released under the Open Government Licence 8
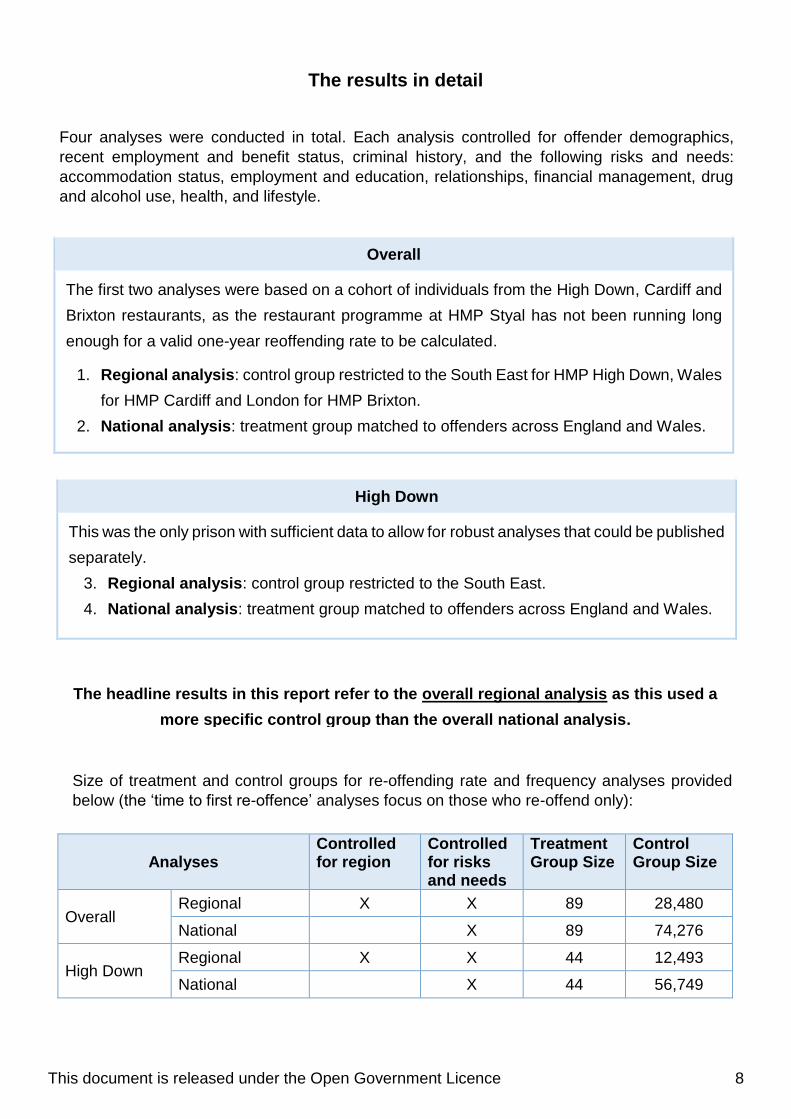
The results in detail
Overall
The first two analyses were based on a cohort of individuals from the High Down, Cardiff and
Brixton restaurants, as the restaurant programme at HMP Styal has not been running long
enough for a valid one-year reoffending rate to be calculated.
1. Regional analysis: control group restricted to the South East for HMP High Down, Wales
for HMP Cardiff and London for HMP Brixton.
2. National analysis: treatment group matched to offenders across England and Wales.
The headline results in this report refer to the overall regional analysis as this used a
more specific control group than the overall national analysis.
High Down
This was the only prison with sufficient data to allow for robust analyses that could be published
separately.
3. Regional analysis: control group restricted to the South East.
4. National analysis: treatment group matched to offenders across England and Wales.
Four analyses were conducted in total. Each analysis controlled for offender demographics,
recent employment and benefit status, criminal history, and the following risks and needs:
accommodation status, employment and education, relationships, financial management, drug
and alcohol use, health, and lifestyle.
Analyses Controlled for region
Controlled for risks and needs
Treatment Group Size
Control Group Size
Overall Regional X X 89 28,480
National X 89 74,276
High Down Regional X X 44 12,493
National X 44 56,749
Size of treatment and control groups for re-offending rate and frequency analyses provided
below (the ‘time to first re-offence’ analyses focus on those who re-offend only):

This document is released under the Open Government Licence 9
Significant results
One measure shows a significant result in both overall analyses. A further measure
shows a significant result in the overall regional analysis.
The estimates for measures in the overall analyses show the following results:
Both overall analyses provide significant evidence that the intervention decreases the
number of people who re-offend (Table 1).
The overall regional analysis provides significant evidence that the intervention
decreases the number of re-offences committed (Table 2). The overall national
analysis also shows a decrease, but this are not statistically significant.
High Down is the most established prison and results are beginning to indicate a number
of improvements to reoffending measures. It is estimated that a treatment group of 8,192
people would need to be analysed in order to determine the direction of the effect on the
one-year reoffending rate (which currently could be lower by as many as 16 people, or
higher by as many as 12 people).
Cardiff is a newer restaurant and currently the treatment group numbers are too small for
robust comparisons, though the initial results look promising.
Brixton and Styal restaurants are too new for analysis.
A follow-up Justice Data Lab analysis in the future can look to evaluate individual prisons
once treatment group numbers allow for robust comparisons at this level.
Prison overview
In each analysis, the three headline measures of one-year re-offending were analysed (see
results in Tables 1-3):
1. One-year re-offending rate
2. Frequency of re-offences
3. Time to first re-offence.
Further measures regarding the severity of re-offending and of re-offences resulting in custody
have not been included in this report. This is because the numbers within each category were
too small to make reliable estimates for these measures.

This document is released under the Open Government Licence 10
Table 1: Number of participants in The Clink training programme who committed a proven re-offence
in a one-year period, compared with control groups
Treatment
group rate
(%)
Control
group rate
(%)
Estimated
difference (%
points)
Significant
difference?p-value
Regional 89 28,480 16.9 28.6 -19.7 to -3.8 Yes 0.00
National 89 74,276 16.9 26.7 -17.8 to -1.9 Yes 0.02
Regional 44 12,493 29.5 31.9 -16.4 to +11.7 No 0.74
National 44 56,749 29.5 33.7 -18.2 to +9.8 No 0.55
Overall
High Down
Analysis Area
Number in
treatment
group
Number in
control
group
One-year proven re-offending rate
Table 2: Number of proven re-offences committed in a one-year period by participants in The Clink
training programme, compared with control groups
Treatment
group
frequency
Control
group
frequency
Estimated
difference
Significant
difference?p-value
Regional 89 28,480 0.5 0.8 -0.6 to -0.04 Yes 0.03
National 89 74,276 0.5 0.8 -0.6 to +0.01 No 0.06
Regional 44 12,493 0.9 1.0 -0.6 to +0.5 No 0.80
National 44 56,749 0.9 1.1 -0.7 to +0.4 No 0.66
Overall
High Down
Analysis Area
Number in
treatment
group
Number in
control
group
One-year proven re-offending frequency (offences per person)
Treatment
group
frequency
Control
group
frequency
Estimated
difference
Significant
difference?p-value
Regional 89 28,480 0.5 0.8 -0.6 to -0.0 Yes 0.03
National 89 74,276 0.5 0.8 -0.6 to +0.0 No 0.06
Regional 44 12,493 0.9 1.0 -0.6 to +0.5 No 0.80
National 44 56,749 0.9 1.1 -0.7 to +0.4 No 0.66
Overall
High Down
Analysis Area
Number in
treatment
group
Number in
control
group
One-year proven re-offending frequency (offences per person)
Table 3: Average time to first proven re-offence in a one-year period for participants in The Clink
training programme who committed a proven re-offence, compared with control groups
Treatment
group time
Control
group time
Estimated
difference
Significant
difference?p-value
Regional 15 10,009 197.0 149.7 -21.7 to +116.3 No 0.16
National 15 24,314 197.0 150.0 -22.0 to +116.0 No 0.17
Regional 13 3,992 175.8 142.0 -38.8 to +106.5 No 0.33
National 13 18,934 175.8 148.2 -45.0 to +100.3 No 0.42
Overall
High Down
Average time to first proven re-offence within a one-year period,
for re-offenders only (days)
Analysis Area
Number in
treatment
group
Number in
control
group
Tables 1-3 show the results of the three measures of reoffending, for the overall programme
analyses (across High Down, Cardiff and Brixton prisons combined) and for High Down separately.
Rates are expressed as percentages and frequencies expressed per person. The average time to
first re-offence includes reoffenders only. Significant results are highlighted.
This document is released under the Open Government Licence 11
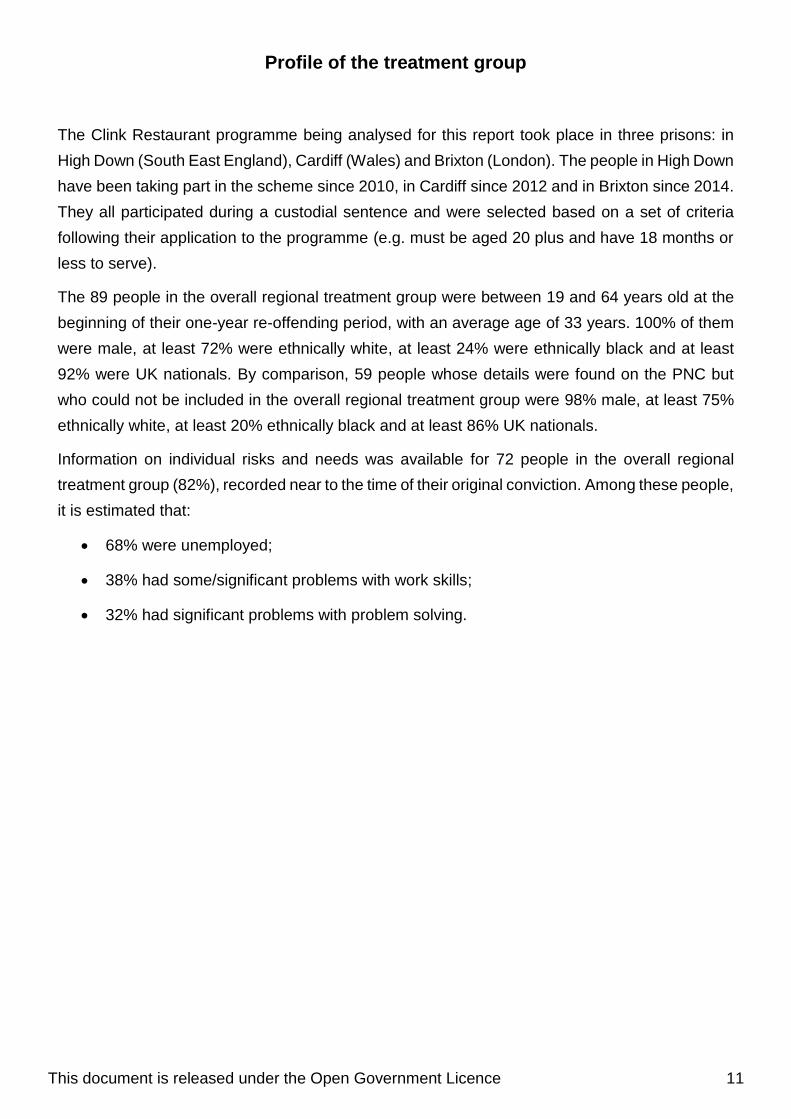
The Clink Restaurant programme being analysed for this report took place in three prisons: in
High Down (South East England), Cardiff (Wales) and Brixton (London). The people in High Down
have been taking part in the scheme since 2010, in Cardiff since 2012 and in Brixton since 2014.
They all participated during a custodial sentence and were selected based on a set of criteria
following their application to the programme (e.g. must be aged 20 plus and have 18 months or
less to serve).
The 89 people in the overall regional treatment group were between 19 and 64 years old at the
beginning of their one-year re-offending period, with an average age of 33 years. 100% of them
were male, at least 72% were ethnically white, at least 24% were ethnically black and at least
92% were UK nationals. By comparison, 59 people whose details were found on the PNC but
who could not be included in the overall regional treatment group were 98% male, at least 75%
ethnically white, at least 20% ethnically black and at least 86% UK nationals.
Information on individual risks and needs was available for 72 people in the overall regional
treatment group (82%), recorded near to the time of their original conviction. Among these people,
it is estimated that:
68% were unemployed;
38% had some/significant problems with work skills;
32% had significant problems with problem solving.
Profile of the treatment group

This document is released under the Open Government Licence 12
Matching the treatment and control groups
Each of the four analyses matched a control group to the relevant treatment group. A summary
of the matching quality is as follows:
Further details of group characteristics and matching quality, including risks and needs recorded
by the Offender Assessment System (OASys), can be found in the Excel annex accompanying
this report.
This report is also supplemented by a general annex, which answers frequently asked questions
about Justice Data Lab analyses and explains the caveats associated with them.
Both the regional and national overall analyses showed good matching on most variables
used, with reasonable matching when control for temper control issues.
High Down national: the model showed good matching on most of the variables, with a small
number being reasonably well matched. These were the proportion of individuals with a drug-
related index offence, the proportion with a non-white ethnicity, and the proportion with a non-
British or unknown nationality.
High Down regional: the model showed good matching on most of the variables, with some
being reasonably well matched. These were the age at index date, the mean number of
previous convictions and the type of previous convictions.

This document is released under the Open Government Licence 13
1 person (<1%) was excluded from the analyses, because they could not be matched to any
suitable individuals in the control groups.
The overall treatment groups contained 52% of the people originally submitted.
1 person (<1%) was excluded because they had committed at least one proven sexual offence
before starting the programme. They were excluded because the re-offending patterns of sex
offenders are generally very different to those of non-sex offenders.
178 records, corresponding to 172 individuals (of which 96 were from HMP High Down) were
submitted for analysis by the Clink.
6 duplicate records were removed.
3 people (2%) were excluded from the overall treatment group as they could not be identified on
the Police National Computer (PNC).
78 people (45%) were excluded because they did not have a record in the re-offending database
that corresponded to their time period of participation on the Clink programme.
Numbers of people in the treatment and control groups
89 89 44 44
Overall national
treatment group
(control group:
74,276 records)
Overall regional
treatment group
(control group:
28,480 records)
High Down national
treatment group
(control group:
56,749 records)
High Down regional
treatment group
(control group:
12,493 records)
Overall: 172
High Down: 96
Overall: 90
High Down: 45
Overall: 169
High Down: 94
Overall: 91
High Down: 46
This document is released under the Open Government Licence 14
National standard
treatment group
(control group:
46,892 records)
90 89
Press enquiries should be directed to the Ministry of Justice press office:
Tel: 020 3334 3555
Other enquiries about the analysis should be directed to:
Sarah French
Justice Data Lab Team
Justice Statistical Analytical Services
Ministry of Justice
7th Floor
102 Petty France
London
SW1H 9AJ
Tel: 07967 592428
E-mail: [email protected]
General enquiries about the statistical work of the Ministry of Justice can be e-mailed to:
General information about the official statistics system of the United Kingdom is available from
www.statistics.gov.uk
© Crown copyright 2016
Produced by the Ministry of Justice
You may re-use this information (not including logos) free of charge in any format or medium,
under the terms of the Open Government Licence. To view this licence, visit
http://www.nationalarchives.gov.uk/doc/open-government-licence/ or email:
Where we have identified any third party copyright material you will need to obtain permission
from the copyright holders concerned.
Contact points