just markets · 1-8-19 just markets webcast announcements 2019 webcast schedule available on rising...
TRANSCRIPT

333 S. Grand Ave., 18th Floor || Los Angeles, CA 90071 || (213) 633-8200
Live Webcast Hosted By:
Jeffrey Gundlach Chief Executive OfficerDoubleLine Capital
January 8, 2019
Just Markets

21-8-19 Just Markets
Webcast Announcements
2019 Webcast Schedule available on www.doubleline.com
Rising Rates Webcast – February 26, 2019 Portfolio Managers, Philip Barach and Robert Cohen will discuss DoubleLine’s Low Duration and Floating Rate Go to www.doubleline.com, Home page under “Webcasts”1:15 pm PDT/4:15 pm EDT
Total Return Webcast – March 12, 2019 Jeffrey Gundlach will discuss DoubleLine’s Total Return BondGo to www.doubleline.com, Home page under “Webcasts”1:15 pm PDT/4:15 pm EDT
To Receive Today’s Presentation Slides:In the player, click on “Slides” tab or email [email protected]
Follow Us:https://twitter.com/DLineCap

31-8-19 Just Markets
Other Announcements
Intellectual Property of DoubleLine – This presentation represents DoubleLine’s intellectual
property. No portion of this webcast may be published, reproduced, transmitted or rebroadcast in any media in any form without the express written permission of DoubleLine. To receive permission from DoubleLine please contact [email protected]
Sherman Show Podcasts – Available on doubleline.com, iTunes, Sound Cloud and Google Play

41-8-19 Just Markets
TAB I

51-8-19 Just Markets
World Growth in Sync
EU = European Union. q/q = quarter-over-quarter. You cannot invest directly in an index.

61-8-19 Just Markets
Source: Bloomberg, DoubleLineMSCI ACWI = A market-capitalization-weighted index designed to provide a broad measure of stock performance throughout the world, including both developed and emerging markets. BOJ = Bank of Japan, ECB = European Central Bank, Fed = Federal Reserve. BOE = Bank of England.You cannot invest directly in an index.
Central Bank Balance Sheets vs. MSCI ACWI

71-8-19 Just Markets
“The Year No One Made Money”
Source: The Reformed Broker “The Year No one Made Money” 11-25-18Universe is comprised of 71 asset classes: 30 equities, 30 bonds, 5 commodities, 4 credit, 1 home price and cash. YTD excludes home prices.

81-8-19 Just Markets
Fed Funds with Shadow Rate and Fed Balance Sheet
Source: DB Research, Bloomberg

91-8-19 Just Markets
0
0.5
1
1.5
2
2.5
3
3.5
4
4.5
1/2
9/2
01
6
3/2
9/2
01
6
5/2
9/2
01
6
7/2
9/2
01
6
9/2
9/2
01
6
11
/29
/20
16
1/2
9/2
01
7
3/2
9/2
01
7
5/2
9/2
01
7
7/2
9/2
01
7
9/2
9/2
01
7
11
/29
/20
17
1/2
9/2
01
8
3/2
9/2
01
8
5/2
9/2
01
8
7/2
9/2
01
8
9/2
9/2
01
8
11
/29
/20
18
Nu
mb
er
of
25
bp
s H
ike
s
Number of 25bps Hikes in 2018(based on Fed Fund futures and Fed 'Dots')
Market Fed Dots
Fed Dots vs. Market Expectations 2018 and 2019
Source: Bloomberg; DoubleLineThe Dot plot is a survey of Federal Open Market Committee members expectations for future policy. Market participants belong to CME Group.
0
0.5
1
1.5
2
2.5
3
3.5
Nu
mb
er
of
25
bp
s H
ike
s
Number of 25bps Hikes in 2019(based on Fed Fund futures and Fed 'Dots')
Market Fed Dots

101-8-19 Just Markets
December Survey – Global Economic WeaknessAs of December 19, 2018
• Only 10% of respondents think there will be a global recession in 2019
• Yet the lowest net percentage of fund managers since 2008 think real global growth will improve in the next 12 months.
Source: BofA Merrill Lynch Global Fund Manager SurveyMerrill Lynch BofA fund manager’s survey canvasses and views 200 institutional, mutual and hedge fund managers.

111-8-19 Just Markets
Source: Bloomberg, DoubleLineKOSPI Index is a capitalization weighted index of all common shares on the Korean stock exchanges. SMAV = Moving average for days indicated. You cannot invest directly in an index.
KOSPI Indicate Strong Global Economy

121-8-19 Just Markets
Economic Data Change: U.S., Global, Europe, and Emerging Markets
Source: Bloomberg, DoubleLine

131-8-19 Just Markets
U.S. Housing and Real Estate Market Economic Data
• Source: Bloomberg; DoubleLine
-3
-2
-1
0
1
2
3
1/1/
200
1
6/1/
200
1
11
/1/2
00
1
4/1/
200
2
9/1/
200
2
2/1/
200
3
7/1/
200
3
12
/1/2
00
3
5/1/
200
4
10
/1/2
00
4
3/1/
200
5
8/1/
200
5
1/1/
200
6
6/1/
200
6
11
/1/2
00
6
4/1/
200
7
9/1/
200
7
2/1/
200
8
7/1/
200
8
12
/1/2
00
8
5/1/
200
9
10
/1/2
00
9
3/1/
201
0
8/1/
201
0
1/1/
201
1
6/1/
201
1
11
/1/2
01
1
4/1/
201
2
9/1/
201
2
2/1/
201
3
7/1/
201
3
12
/1/2
01
3
5/1/
201
4
10
/1/2
01
4
3/1/
201
5
8/1/
201
5
1/1/
201
6
6/1/
201
6
11
/1/2
01
6
4/1/
201
7
9/1/
201
7
2/1/
201
8
7/1/
201
8
12
/1/2
01
8
Housing and Real Estate Economic DataBased on z-scores
Recession Existing Home Sales Housing Starts Building Permits
NAHB Housing Pending Home Sales New Home Sales Average
Source: Bloomberg, DoubleLineNAHB = NAB/Wells Fargo Housing Market index is based on a monthly survey of members belonging to the National Association of Home Builders. Z-Score is a numerical measurement of a value’s relationship to the mean in a group of values.

141-8-19 Just Markets
The Conference Board Leading Economic Indicator
Source: Bloomberg, DoubleLineConference Board U.S. Leading Index = Leading indicators include economic variables that tend to move before change in the overall economy. These indicators give a sense of the future state of an economy. YoY = year-over-year. Red shading indicates recessionary periods. You cannot invest directly in an index.

151-8-19 Just Markets
Unemployment Rate and NFIB Planned Hiring (3 Month Lead)
Source: Bloomberg, DoubleLineNFIB = National Federation of Independent Business. U-3 = Official unemployment rate per the ILO definition occurs when people are without jobs and they have actively looked for work within the past four weeks. ILO = International Labor Organization. Red shaded areas indicate recessionary periods.

161-8-19 Just Markets
ISM Manufacturing and Services PMI
Source: Bloomberg, DoubleLinePMI = Purchase Managers Index is an indicator of the economic health of the manufacturing sector. The PMI is based on five major indicators: new orders, inventory levels, production, supplier deliveries and the employment environment. ISM = Institute of Supply Management. NMI = Non-Manufacturing Index is a composite of four indicators with equal weights: Business activity, New Orders, Employment and Supplier Deliveries. Red shaded areas indicate recessionary periods. You cannot invest directly in an index.

171-8-19 Just Markets
U.S. Industrial Production
Source: Bloomberg, DoubleLineRed shaded areas indicate recessionary periods.

181-8-19 Just Markets
Measures of U.S. Business and Consumer SentimentNormalized based on z-scores since Oct 2002
Source: Bloomberg; DoubleLineConsumer confidence (CCI) is the degree of optimism on the state of the economy expressed through consumers activities and savings. CEO Confidence is a survey conducted by the Conference Board as a guage or outlook of CEOs. Home Builders is National Home Builders (NAHB)/Wells Fargo monthly survey of members belonging to the National Association of Home Builders (NAHB) designed to measure sentiment. Small Business (SLBI) is an index of business lending that is published by Thompson Reuters/Paynet that is generally considered a leading indicator. You cannot invest directly in an index. Z-score is a numerical measurement of a z-value or relationship to the mean in the group of values.
-4
-3
-2
-1
0
1
2
3
z-sc
ore
Measures of Business and Consumer Sentiment
Recession Consumer Conf. CEO Conf. Home Builders Conf. Small Business Opt. Average

191-8-19 Just Markets
Consumer Expectations
Source: Bloomberg, DoubleLineConsumer Confidence Index® measures consumer confidence defined as the degree of optimism on the state of the U.S. economy. You cannot invest directly in an index.Red shaded areas indicate recessionary periods.

201-8-19 Just Markets
U.S. Corporate High Yield Heading into Recessions(includes False Positives of 2011 and 2016)
• Source: Bloomberg; DoubleLine
0
2
4
6
8
10
12
14
16
18
20
-52
1-5
02
-48
3-4
64
-44
5-4
26
-40
7-3
88
-36
9-3
50
-33
1-3
12
-29
3-2
74
-25
5-2
36
-21
7-1
98
-17
9-1
60
-14
1-1
22
-10
3-8
4-6
5-4
6-2
7 -8 11
30
49
68
87
10
61
25
14
41
63
18
22
01
22
02
39
25
82
77
29
63
15
33
43
53
37
23
91
41
04
29
44
84
67
48
65
05
Trading Days to Recession
US HY Spread Heading into Recession
2001 2007 Now (6mo to Recession) Now (1yr to Recession) 2016 "False Positive" 2011 "False Positive"
Source: DoubleLine, BloombergBloomberg Barclays US High Yield Bond Index measures the USD high yield fixed rate corporate bond market. Securities are classified as high yield if Moody’s, Fitch and S&P rating is Ba1/BB+/BB+ or below. False positives did not widen enough to indicate a recession. You cannot invest directly in an index.
%

211-8-19 Just Markets
U.S. T-Bill Yields vs. Global Bond Market Yield
Source: BAML As of December 14, 2018

221-8-19 Just Markets
Citi Global Inflation Surprise Index with Constituents
Source: Bloomberg; DoubleLineNote: The Inflation Surprise Indices measure accumulation of headline of monthly CPI, PPI and wage surprises relative to median expectations of professional forecasters. BRIC = Brazil, Russia, India and China. CEEMEA = Central & Eastern Europe, Middle East & Africa. You cannot invest directly in an index.

231-8-19 Just Markets
U.S. Inflation
CPI = Consumer Price index measures the average price for a basket of goods and services, such as transportation, food and medical care., YoY = year-over-year. You cannot invest directly in an index.

241-8-19 Just Markets
New York Fed UIG and Core Inflation
Source: Bloomberg, DoubleLineGDP = Gross Domestic Product is the measure of goods and services with in a given country. UIG = Underlying Inflation Gauge. CPI = Consumer Price Index is a measure that examines the weighted average of prices of a basket of goods and services, such as transportation, food and medical care. Red shaded areas indicate recessionary periods. You cannot invest directly in an index.

251-8-19 Just Markets
Upward Pressure on Wages Continues
NFIB = National Federation of Independent Business. ECI = Effectively Connected Income is when a foreign person engages in a trade/business in the U.S., all income from sources within the U.S.

261-8-19 Just Markets
U.S. Hourly Earnings – Long Term
Source: Bloomberg, DoubleLineNFP =Non-Farm Payroll. YoY – year-over-year. SA = Seasonally adjusted. Red shaded areas indicate recessionary periods.

271-8-19 Just Markets
Employment Cost Index
Source: Bloomberg, DoubleLineYoY – year-over-year. NSA = Non-Seasonally adjusted

281-8-19 Just Markets
MSCI Emerging Markets (MXEF)
Source: BloombergMSCI EM Index is a free-float weighted equity index that captures large and mid-cap representation across Emerging Markets (EM) countries. You cannot invest directly in an index.

291-8-19 Just Markets
S&P 500 vs. MSCI EM Normalized to 1/26/18
Source: BloombergS&P 500 is Standard & Poor’s 500 Index is a capitalization-weighted index of 500 U.S. stocks. MSCI Emerging Markets Index is a free-float weighted equity index designed to measure the equity market performance across Emerging market countries. You cannot invest directly in an index.

301-8-19 Just Markets
S&P 500/MSCI Emerging Markets and DXY
Source: Bloomberg; DoubleLineS&P 500 is Standard & Poor’s 500 Index is a capitalization-weighted index of 500 U.S. stocks. MSCI EM Index is a free-float weighted equity index that captures large and mid-cap representation across Emerging Markets (EM) countries. DXY = U.S. Dollar Index measures the value of the U.S. Dollar versus a basket of currencies. You cannot invest directly in an index.

311-8-19 Just Markets
S&P 500 / MSCI Europe
Source: BloombergS&P 500 is Standard & Poor’s 500 Index is a capitalization-weighted index of 500 U.S. stocks. MSCI Europe (MXEU) Index is a free-float weighted equity index designed to measure the equity market performance of the developed markets in Europe. You cannot invest directly in an index.

321-8-19 Just Markets
S&P 500 vs. MSCI ACWI (ex-US) Normalized 1/26/18
Source: BloombergS&P 500 is Standard & Poor’s 500 Index is a capitalization-weighted index of 500 U.S. stocks. MSCI ACWI ex-U.S. Index is a market-capitalization weighted equity index designed to measure the equity market performance throughout the world ex-U.S.. You cannot invest directly in an index.

331-8-19 Just Markets
EEM / ACWI
Most Overbought since ’16 peak
MSCI Emerging Markets Index ETF Tracker/ MSCI ACWI Index ETF Tracker
Source: DoubleLine, BloombergMSCI Emerging Markets Index is a free float-adjusted market capitalized index used to measure equity market performance in emerging markets. MSCI ACWI Index is a market capitalization weighted index designed to provide a broad measure of equity market performance globally.

341-8-19 Just Markets
U.S. Dollar Index (DXY)
Source: DoubleLine, BloombergDXY = The U.S. Dollar Index is an index that values the dollar relative to a basket of foreign currencies. You cannot invest directly in an index.
Most Overbought since ’16 peak

351-8-19 Just Markets
U.S. Dollar Bulls at Same Level as 2016
Source: DoubleLine, Bloomberg
Most Overbought since ’16 peak

361-8-19 Just Markets
Bloomberg Commodity Index (BCOM)
Source: BloombergBCOM Index= Bloomberg Commodity Index is calculated on an excess return basis and reflects commodity futures price movements with monthly rebalancing. SMAVG = Moving average. You cannot invest directly in an index.

371-8-19 Just Markets
Bloomberg Industrial Metals (BCOMIN)
Source: BloombergBCOMIN Index= Bloomberg Industrial Metals Sub-index of the Bloomberg Barclays Commodity Index and includes futures contracts on aluminum, copper, nickel and zinc. SMAVG = Moving average. You cannot invest directly in an index.

381-8-19 Just Markets
WTI Crude Oil (CL1) – Last 1 Year
Source: BloombergWTI = West Texas Intermediate Crude oil. CL1 = Current Futures contract.

391-8-19 Just Markets
WTI Crude Oil (CL1) – Last 5 Years
Source: BloombergWTI = West Texas Intermediate Crude oil. CL1 = Current Futures contract.

401-8-19 Just Markets
Source: Bloomberg, DoubleLineSpot price of gold quoted in Troy ounces. SMAV = standard moving average. You cannot invest directly in an index.
Gold Spot

411-8-19 Just Markets
Source: Bloomberg, DoubleLineSMAV = Moving Average
Bitcoin

421-8-19 Just Markets
Commodity Prices vs. Recessions
Source: Bloomberg, DoubleLineS&P GSCI Total Return CME Index = Is an index widely recognized as a leading measure of general commodity price movements and inflation in the world economy. Red shaded areas indicate recessionary periods. You cannot invest directly in an index.

431-8-19 Just Markets
Source: Bloomberg Financial Services, DoubleLine Capital LPGT10 = US 10 Year Treasury Bond.
U.S. 10-Year Treasury

441-8-19 Just Markets
Copper/Gold Ratio and 10-Year U.S. Treasury Yield
Source: BloombergUSGG10Yr Index = 10-year U.S. treasury index. HG1 COMB Comdty = the 1st generic futures contract. .

451-8-19 Just Markets
2s10s and RecessionsDecember 31, 1986 to January 4, 2019
Source: Bloomberg, DoubleLine*Current as of January 4, 2019

461-8-19 Just Markets
Japan 1s10s Spread Hasn’t Inverted Since Late 1980s
-2
-1
0
1
2
3
4
5
6
7
8
9
10
/1/8
7
10
/1/8
8
10
/1/8
9
10
/1/9
0
10
/1/9
1
10
/1/9
2
10
/1/9
3
10
/1/9
4
10
/1/9
5
10
/1/9
6
10
/1/9
7
10
/1/9
8
10
/1/9
9
10
/1/0
0
10
/1/0
1
10
/1/0
2
10
/1/0
3
10
/1/0
4
10
/1/0
5
10
/1/0
6
10
/1/0
7
10
/1/0
8
10
/1/0
9
10
/1/1
0
10
/1/1
1
10
/1/1
2
10
/1/1
3
10
/1/1
4
10
/1/1
5
10
/1/1
6
10
/1/1
7
10
/1/1
8
Japan 1s10s and Japan Recessions
OECD Japan Recession 1s10s 10y JGB
OECD = Organization for Economic Co-Operation and Development. JGB = Japanese Government Bonds.

471-8-19 Just Markets
S&P 500 / Nikkei
Source: BloombergS&P 500 is Standard & Poor’s 500 Index is a capitalization-weighted index of 500 U.S. stocks. Nikkei (NKY) Index is a price-weighted average of 225 top-rated Japanese companies listed in the First Section of the Tokyo Stock Exchange. You cannot invest directly in an index.

481-8-19 Just Markets
Currency Hedged U.S. Treasury Yields
Source: Bloomberg Financial Services, DoubleLine Capital LPJPY = Japanese Yen, EUR = Euro.

491-8-19 Just Markets
Fed Treasury Holdings vs. 10-Year UST (Inverted)
Source: DB Research, BloombergSOMA = System Open Market Account

501-8-19 Just Markets
10-Year Bund vs. German CPI
Source: BloombergCPI measures prices paid by consumers for a market basket of consumer goods and services. The yearly growth rates represent the inflation rate. You cannot invest directly in an index.

511-8-19 Just Markets
Source: Bloomberg Financial Services, DoubleLine Capital LPGT30 = US 30 Year Treasury Bond.
U.S. 30-Year Treasury

521-8-19 Just Markets
Leverage Problems
Source: Goldman SachsGDP = Gross Domestic Product is the measure of goods and services with in a given country. Quarterly data. You cannot invest directly in an index
531-8-19 Just Markets
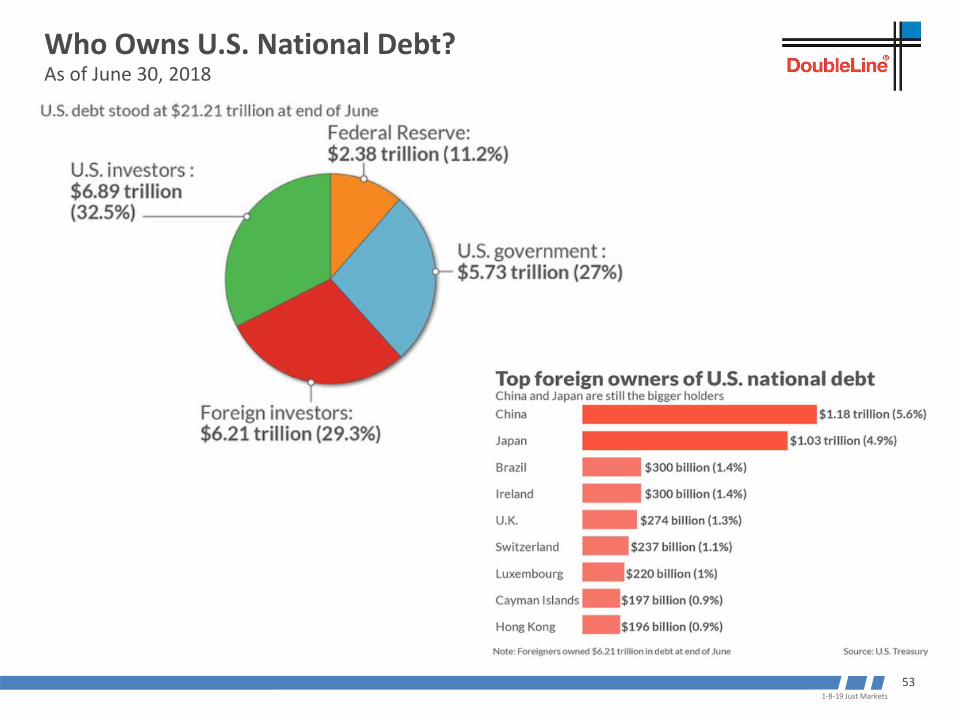
Who Owns U.S. National Debt?As of June 30, 2018

541-8-19 Just Markets
Annual Change in Total Public Debt vs. Official Budget Deficit
$463
$596
$1,471
$1,612
$1,714
$1,198 $1,210
$919
$789 $781
$1,055
$516
$1,359
$209 $188
$680
$1,471
$1,275 $1,250
$1,061
$560$488 $478
$582
$681
$816
$0
$200
$400
$600
$800
$1,000
$1,200
$1,400
$1,600
$1,800
2006 2007 2008 2009 2010 2011 2012 2013 2014 2015 2016 2017 2018
bill
ion
s
Yearly Change in Public Debt Outstanding vs. Official Budget Deficit
Yearly Change in Public Debt Budget Balance Deficit
$254
$408
$790
$140
$439
-$52
$149
$360$302 $303
$473
-$165
$543
-$400
-$200
$0
$200
$400
$600
$800
$1,000
2006 2007 2008 2009 2010 2011 2012 2013 2014 2015 2016 2017 2018
bill
ion
s
Diff.
Source: DoubleLineDiff = Difference

551-8-19 Just Markets
Interest Costs Rising for U.S. Government
GDP = Gross Domestic Product is the measure of goods and services with in a given country. Quarterly data. CBO = Congressional Budget Office. You cannot invest directly in an index.

561-8-19 Just Markets
All U.S. State Pension Funds are Underfunded
GDP = Gross Domestic Product is the measure of goods and services with in a given country. Quarterly data. Core inflation: Monthly data. You cannot invest directly in an index.

571-8-19 Just Markets
U.S. Corporate Credit as % GDP
Source: Bloomberg, DoubleLineGDP = Gross Domestic Product is the measure of goods and services with in a given country. Quarterly data. Red shaded areas indicate recessionary periods. You cannot invest directly in an index.

581-8-19 Just Markets
Downgrades Could be Significant Come Cycle Turn
BBB or higher (AAA-BBB) is a Standard and Poor’s Baa3/BBB rating. They are rated likely to meet debt obligations. HY = High Yield. Fallen Angel stocks are stocks that have fallen substantially from their all-time highs. Implied Fallen angel stocks are stocks that potentially have an implied upside.

591-8-19 Just Markets
U.S. Corporate BBB Debt
US Investment Grade Corporate debt is rated by major rating agencies. BBB or higher (AAA-BBB) is a Standard and Poor’s Baa3/BBB rating. They are rated likely to meet debt obligations. Non-Financial BBB-Rated Debt refers to non-financial corporate bonds rated by S&P as BBB investment grade. IG = Investment Grade.Current =October 31, 2018.

601-8-19 Just Markets
Investment Grade has Shorter Maturity than High Yield
Source: Goldman Sachs As of November 28, 2018.Bloomberg Barclays US High Yield Bond Index measures the USD high yield fixed rate corporate bond market. Securities are classified as high yield if Moody’s, Fitch and S&P rating is Ba1/BB+/BB+ or below. You cannot invest directly in an index.

611-8-19 Just Markets
Bonds Downgraded From A into BBB, by Quarter
Source: DoubleLine, Goldman SachsS&P/LSTA Leveraged Loan Index is designed to reflect the performance of the largest facilities in the leveraged loan market. A-BBB are credit ratings by Standard & Poor’s.

621-8-19 Just Markets
U.S. vs. Europe High Yield Corporate CDS
HY = High yield, IG = Investment Grade. You cannot invest directly in an index.ITRX XOVER = European High Yield credit default swap generic 5-year. CDX HY = U.S. High Yield credit default swap generic 5-year You cannot invest directly in an index.

631-8-19 Just Markets
U.S. High Yield vs. Emerging Markets Corporate Credit Spreads
Source: DoubleLine, BloombergBloomberg Barclays US High Yield Bond Index measures the USD high yield fixed rate corporate bond market. Securities are classified as high yield if Moody’s, Fitch and S&P rating is Ba1/BB+/BB+ or below. Bloomberg Barclays Emerging Markets Investment Grade Corporate Index measures performance of investment grade corporate bonds issued in U.S. dollars within emerging market countries. You cannot invest directly in an index.

641-8-19 Just Markets
Bank Loan Prices
Source: DoubleLine, BloombergS&P/LSTA Leveraged Loan Index is designed to reflect the performance of the largest facilities in the leveraged loan market. BB/B is the credit rating by Standard & Poor’s.
651-8-19 Just Markets
S&P 500 vs. High Yield ETF (JNK)
Source: Bloomberg, DoubleLineS&P 500 is Standard & Poor’s 500 Index is a capitalization-weighted index of 500 U.S. stocks. Bloomberg Barclays SPDR High Yield ETF is an exchange-traded fund that seeks to track the investment results of an index composed of U.S. You cannot invest directly in an index.

333 S. Grand Ave., 18th Floor || Los Angeles, CA 90071 || (213) 633-8200
Live Webcast Hosted By:
Jeffrey Gundlach Chief Executive OfficerDoubleLine Capital
January 8, 2019
Just Markets

671-8-19 Just Markets
SPDR® Bloomberg Barclays High Yield Bond ETF (JNK)As of September 30, 2018
Investment Objective & SummaryThe investment objective of the SPDR® Bloomberg Barclays High Yield Bond ETF seeks to provide investment results that, before fees andexpenses, corresponds generally to the price and yield performance of the Bloomberg Barclays High Yield Very Liquid Index. The ETF invests inU.S. high yield bonds.
Performance quoted represents past performance, which is no guarantee of future results. Investment return and principal value will fluctuate, so you may have a gain or losswhen shares are sold. Current performance may be higher or lower than that quoted. Visit spdrs.com for most recent month-end performance. Performance of an index is notillustrative of any particular investment. It is not possible to invest directly in an index.Important Risk Information - In general, ETFs can be expected to move up or down in value with the value of the applicable index. Although ETF shares may be bought and soldon the exchange through any brokerage account, ETF shares are not individually redeemable from the Fund. Investors may acquire ETFs and tender them for redemptionthrough the Fund in Creation Unit Aggregations only. Please see the prospectus for more details.Bond funds contain interest rate risk (as interest rates rise bond prices usually fall); the risk of issuer default; issuer credit risk; liquidity risk; and inflation risk.Investing in high yield fixed income securities, otherwise known as "junk bonds" is considered speculative and involves greater risk of loss of principal and interest than investingin investment grade fixed income securities. These lower-quality debt securities involve greater risk of default or price change due to potential changes in the credit quality of theissuer.The Fund invests by sampling the Index, holding a range of securities that, in the aggregate, approximates the full Index in terms of key risk factors and other characteristicswhich may cause the fund to experience tracking errors relative to performance of the Index.Distributor: State Street Global Markets, LLC, member FINRA, SIPC, a wholly owned subsidiary of State Street Corporation. References to State Street may include State StreetCorporation and its affiliates. Certain State Street affiliates provide services and receive fees from the SPDR ETFs.
Before investing, consider the funds' investment objectives, risks, charges and expenses. To obtain a prospectus or summary prospectus whichcontains this and other information, call 1-866-787-2257 or talk to your financial advisor. Read it carefully before investing.JNK is distributed by State Street Global Markets, LLC

681-8-19 Just Markets
iShares MSCI Emerging Markets ETF (EEM)As of September 30, 2018
Investment ObjectiveThe iShares MSCI Emerging Markets Bond ETF seeks to track the investment results of an index composed of large and mid-cap emerging market equities.

691-8-19 Just Markets
SPDR® S&P 500 ETF (SPY) As of September 30, 2018
Investment Objective & SummaryThe investment objective of the SPDR® S&P 500 ETF Trust seeks to provide investment results that before expenses, correspond generally to theprice and yield performance of the S&P 500 Index.

701-8-19 Just Markets
iShares MSCI ACWI ETF (ACWI)As of September 30, 2018
Investment ObjectiveThe iShares MSCI Emerging Markets Bond ETF seeks to track the investment results of an index composed of large and mid-cap developed and emerging market equities.

711-8-19 Just Markets
iShares MSCI ACWI ETF (ACWI)As of September 30, 2018

721-8-19 Just Markets
Bloomberg Barclays Capital US Aggregate Index - The Barclays Capital US Aggregate Index represents securities that are SEC-registered, taxable, and dollar denominated. The index covers the US investment grade fixed rate bond market, with index components for government and corporate securities, mortgage pass-through securities, and asset-backed securities. These major sectors are subdivided into more specific indices that are calculated and reported on a regular basis.Bloomberg Barclays Capital US MBS Index - The Barclays Capital US MBS Index represents the MBS component of the Bloomberg Barclays US Aggregate Index.Bloomberg Barclays Capital US Treasury Index - This index is the US Treasury component of the US Government index. Public obligations of the US Treasury with a remaining maturity of one year or more.Bloomberg Barclays Capital US Treasury 10 Year Index - This index is the 10 year component of the US Government index.Bloomberg Barclays Capital Capital US Treasury 30 Year Index - This index is the 30 year component of the US Government index.Bloomberg Barclays Capital US High Yield Index - The Barclays Capital US High Yield Index covers the universe of fixed rate, non-investment grade debt. Eurobonds and debt issuerfrom countries designated as emerging markets (e.g. Argentina, Brazil, Venezuela, etc.) are excluded, but Canadian and global bonds (SEC registered) of issuers in non-EMG countries are included. Original issue zereos, step-up coupon structures, 144-As and pay-in-kind (PIK, as of October 1, 2009) are also included.BofA Merrill Lynch US Government Index (GOAO) - The Merrill Lynch US Government Index tracks the performance of US government (i.e. securities in the Treasury and Agency indices.)BofA Merrill Lynch US Corporate Index (COAO) “Investment Grade”- The Merrill Lynch Corporate Index tracks the performance of US dollar denominated investment grade corporate debt publicly issued in the US domestic market. Qualifying securities must have an investment grade rating (based on an average of Moody’s, S&P and Fitch) and an investment grade rated country of risk (based on an average of Moody’s, S&P and Fitch foreign currency long term sovereign debt ratings). Securities must have at least one year remaining term to final maturity, a fixed coupon schedule and a minimum amount outstanding of $250MM.CRB Commodity Index (CRY)- An unweighted geometric average of some important commodities. It averages prices across 17 commodities and across time. The index tracks energy, grains, industrials, livestock, precious metals, and agriculturals.S&P 500 (SPX)- S&P 500 is a free-float capitalization-weighted index published since 1957 of the prices of 500 large-cap common stocks actively traded in the United States.Standard Deviation – Sigma = standard deviation. It shows how much variation there is from the “average” (mean, or expected/budgeted value). A low standard deviation indicated that the data point tend to be very close to the mean, whereas high standard deviation indicated that the date is spread out over a large range of values.Dow Jones – UBS DJ Commodity Index - The Dow Jones UBS – Commodity index is composed of commodities traded on U.S. exchanges, with the exception of aluminum, nickel and zinc, which trade on the London Metal Exchange (LME).“Copper”= Copper Spot Price (HGI) Copper is the world’s third most used metal behind iron and aluminum primarily used in highly cyclical industries including construction and industrial machinery manufacturing. Spot price quoted in USD/lb.“Gold”= Gold Spot Price (Golds) The Gold Spot price is quoted as US Dollar per Troy Ounce.Crude Oil= Crude oil varies greatly in appearance depending on its composition. West Texas intermediate (WTI )= Texas light sweet crude is used as a benchmark in oil pricing. It’s “light” because of the low density and sweet because of low sulfur. Brent crude = Is a major trading classification of sweet light crude. Brent is the oil maker also known as Brent Blend.Volatility Index (VIX) -The VIX shows the market's expectation of 30-day volatility. It is constructed using the implied volatilities of a wide range of S&P 500 index options. This volatility is meant to be forward looking and is calculated from both calls and puts. The VIX is a widely used measure of market risk and is often referred to as the "investor fear gauge". Spread – Spread is the percentage point difference between yields of various classes of bonds compared to treasury bonds.Basis Point- A basis point is a unit that is equal to 1/100th of 1%, and is used to denote the change in a financial instrument.Duration – Duration is a commonly used measure of the potential volatility of the price of a debt security, or the aggregate market value of a portfolio of debt securities, prior to maturity. Securities with a longer duration generally have more volatile prices than securities of comparable quality with a shorter duration.
Definitions

731-8-19 Just Markets
MSCI USA Large Cap Index is a free float weighted large- cap equity index.MSCI US Small Cap Index is a free float weighted index of U.S. small cap equity stocks.ACWI = MSCI ACWI Index - is a free-float weighted equity index that includes both emerging and developed worlds markets.Switzerland = SMI Index is the Swiss Market Index of the largest and most liquid stocks on the Zurich and Basel Stock Exchange.Italy = FTSE MIB Index consists of the 40 most liquid and capitalized stocks listed on the Borsa Italiana Stock exchange.Spain = IBEX 35 is the official index of the Spanish Continuous Market or the most liquid stocks traded on the market.Canada = S&P/TSX Composite Index is the capitalization-weighted index of the Canadian stock market.Hang Seng = The Hang Seng index is a free-float capitalization-weighted index of the Stock Exchange of Hong Kong.Australia = The Australian Securities Exchange.Sensex = The S&P BSE Sensex is a free-float market weighted stock market index of 30 well established companies on the Bombay Stock Exchange.Mexico = The Mexican Stock Exchange.Brazil = Bovespa index tracks around 50 stocks traded on the Sao Paulo Stock Mercantile & Futures exchange.Argentina = Argentina’s stock market is price-weighted index calculated as the market value of a portfolio of stocks selected based on their market share.Chile = Santiago Stock Exchange is the premier stock exchange of Chile and trades stocks, bonds, investment funds, derivatives and gold and silver Chilean coins.Columbia = COLCAP is the main stock exchange index of the Columbia Stock Exchange and consists of the 20 most actively traded shares of the market.Taiwan = The Taiwan Stock Exchange.India = The Indian Stock Exchange Singapore = Singapore Exchange is the marketplace for many of Singapore’s leading companies and is one of the primary markets for equities and various derivatives in south-east Asia.BofA Merrill Lynch US Dollar Emerging Markets Sovereign Plus Index (IGOV) This index tracks the performance of US dollar denominated emerging market and cross-over sovereign debt publicly issued in the eurobond or US domestic market. Qualifying countries must have a BB1 or lower foreign currency long-term sovereign debt rating (based on an average of Moody’s, S&P, and Fitch).BofA Merrill Lynch U.S. High Yield Cash Pay Index (J0A0) “Below Investment Grade”- The Merrill Lynch High Yield Index tracks the performance of US dollar denominated below investment grade corporate debt, currently in a coupon paying period, that is publicly issued in the US domestic market. Qualifying securities must have a below investment grade rating (based on an average of Moody’s, S&P and Firth foreign currency long term sovereign debt ratings). Must have one year remaining to final maturity and a minimum outstanding amount of $100MM.BofA Merrill Lynch U.S. High Yield Index (H0A0) The Merrill Lynch High Yield Index tracks the performance of US dollar denominated below investment grade corporate debt publicly issued in the US domestic market. Qualifying securities must have a below investment grade rating (based on average of Moodys, S&P and Fitch) at least 18 months to final maturity at time of issue of issuance, a final maturity, a fixed coupon schedule and a minimum amount outstanding of $100 MM.BofA Merrill Lynch International Government Index (NOGO) The Merrill Lynch International Index tracks the performance of Australia, Canadian, French, German, Japan, Dutch, Swiss
and UK investment grade sovereign debt publicly issued and denominated in the issuer’s own domestic market and currency. Qualifying securities must have at least one year remaining term to final maturity, a fixed coupon schedule and a minimum amount outstanding.BofA Merrill Lynch Mortgage-Backed Securities Index (MOA0)This index tracks the performance of US dollar denominated fixed rate and hybrid residential mortgage pass-through securities publicly issued by US agencies in the US domestic market. 30-year, 20-year, 15-year and interest only fixed rate mortgage pools are included in the Index provided they have at least one year remaining term to final maturity and a minimum amount outstanding of at least $5 billion per generic coupon and $250MM per production year within each generic coupon.Bloomberg Barclays Capital Global Emerging Markets Index - The Barclays Capital Global Emerging Markets Index represents the union of the USD-denominated US Emerging Markets index and the predominately EUR-denominated Pan Euro Emerging Markets Index, covering emerging markets in the following regions: Americas, Europe, Middle East, Africa, and Asia. As with other fixed income benchmarks provided by Barclays Capital, the index is rules-based, which allows for an unbiased view of the marketplace and easy replicability.Draw Down - The peak-to-trough decline during a specific record period of an investment, fund or commodity. A drawdown is usually quoted as the percentage between the peak and the trough.
Definitions

741-8-19 Just Markets
Thailand = The Stock Exchange of Thailand which has 584 listed companies with combined market capitalization of 15.03 trillion baht or 460 billion USD.Indonesia = Indonesian: Bursa Efek Indonesia is a stock exchange base din Jakarta and has 537 listed companies.Philippines = Manila Stock Exchange and is composed of 30 listed companies based on a specific set of criteria.Poland = The Warsaw Stock Exchange.Czech = Prague Stock Exchange is the largest and oldest securities market organizer in Czech Republic.Hungary = Budapest Stock Eschange is the 2nd largest stock exchange in Central and Eastern Europe by market capitalization and liquidity.Turkey = The Borsa Istanbul stock exchange.S. Africa = Johannesburg Stock Exchange is the oldest and largest stock exchange in Africa with 472 listed companies.Russia = Moscow Exchange is the largest group in Russia and trades equities, bonds, derivatives and foreign exchange market along with precious metals.BofA/Merrill Lynch High Yield Cash Pay CCC –rated Index (JOA3) – .A component of the BofA/Merrill Lynch High Yield Cash Pay Index concentrating on CCC rated High Yield credit only. BofA/Merrill Lynch High Yield Cash Pay BB–rated Index (JOA1) – .A component of the BofA/Merrill Lynch High Yield Cash Pay Index concentrating on BB rated High Yield credit only.BofA/Merrill Lynch High Yield Cash Pay B–rated Index (JOA2) – .A component of the BofA/Merrill Lynch High Yield Cash Pay Index concentrating on B rated High Yield credit only.BofA/Merrill Lynch Credit Index BBB-rated Index (COA4) – .A component of the BofA/Merrill Lynch Credit Index concentrating on the lower rated BBB investment grade credits.BofA/Merrill Lynch Credit Index A–rated Index (COA3) – . A component of the BofA/Merrill Lynch Credit Index concentrating on the A rated investment grade credits.BofA Merrill Lynch US Treasury Index (G0Q0) -The Merrill Lynch US Treasury Index tracks the performance of US dollar denominated sovereign debt publicly issued by the US government in its domestic market. Qualifying securities must have at least one year remaining term to final maturity, a fixed coupon schedule and a minimum amount outstanding of $1 billion.BofA Merrill Lynch Current 10 year UST Index –- This index is the 10 year component of the US Government index.BofA Merrill Lynch Current 30 year UST Index –- This index is the 30 year component of the US Government index.Shanghai Index - The Shanghai Stock Exchange Composite is a capitalization-weighted index tracking daily price performance of all A and B-shares listed on the Shanghai Stock Exchange. This index was developed December 19, 1990 with a base value of 100.S&P/Case-Shiller Composite Home Price Index - The Case-Shiller Home Price Indices, one comprised of price changes within all 20 metropolitan markets, and another comprised of price changes within the following subset of 10 metropolitan markets: Boston, Chicago, Denver, Las Vegas, Los Angeles, Miami, New York, San Diego, San Francisco and Washington DC. In addition to those 10 markets, the 20-Home Price index reflects price changes for Atlanta, Charlotte, Dallas, Detroit, Minneapolis, Phoenix, Portland, Seattle and Tampa.NASDAQ- A computerized system that facilitates trading and provides price quotations on more than 5,000 of the more actively traded over the counter stocks. Created in 1971, the Nasdaq was the world's first electronic stock market.ISM = ISM Manufacturing Index is based on a survey of 300 manufacturing firms by the Institute of Supply Management. DXY = U.S. dollar spot index indicates the general international value of the US dollar by averaging the exchange rates between the USD and major world currencies. PE = price/ earnings ratio is the ratio of valuing a company that measures its current share price relative to tis per-share earningsMSCI Europe Index - The MSCI Europe Index is a free-float weighted equity index designed to measure the equity market performance of the developed markets in Europe. The Bloomberg U.S. Financial Conditions Index - This index tracks the overall level of financial stress in the U.S. money, bond, and equity markets to help assess the availability and cost of credit. A positive value indicates accommodative financial conditions, while a negative value indicates tighter financial conditions relative to pre-crisis norms.Correlation - A statistical measurement of the relationship between two variables. Possible correlations range from +1 to -1. A zero correlation indicates that there is no relationship between the variables. A correlation of -1 indicates a perfect negative correlation and +1 indicates a perfect positive correlation.Market Capitalization – The market value of a company's outstanding shares. This figure is found by taking the stock price and multiplying it by the total number of shares outstanding.Yield curve - Is a line that plots the interest rates, at a set point in time, of bonds having equal credit quality but differing maturity dates.
Definitions

751-8-19 Just Markets
Russell 2000 – measures the performance of the small-cap segment of the US equity universe. Russell 2000 is a subset of the Russell 3000 index representing approximately 10% of the total market capitalization of that index.S&P GSCI – is a composite index of commodity sector return representing an unleveraged, long-only investment in commodity futures that is broadly diversified across the spectrum of commodities. Barclays Capital US 30 Year TIPS Index - . Barclays Capital 30-year TIPS on-the-run index quoted in US Dollars traded intradayCitigroup Economic Surprise Index - . The Citigroup Economic Surprise Indices are objective and quantitative measures of economic news. They are defined as weighted historical standard deviations of data surprises (actual releases vs Bloomberg survey median). A positive reading of the Economic Surprise Index suggests that economic releases have on balance beating consensus. The indices are calculated daily in a rolling three-month window. The weights of economic indicators are derived from relative high-frequency spot FX impacts of 1 standard deviation data surprises. The indices also employ a time decay function to replicate the limited memory of markets.DAX - This index is the German Stock Index is a total return index of 30 selected German blue chip stocks traded on the Frankfurt Stock Exchange.CAC 40 – This index the most widely-used indicator of the Paris market, reflects the performance of the 40 largest equities listed in France, measured by free-float market capitalization and liquidity.FTSE 100 – Is a capitalization-weighted index of the 100 most highly capitalized companies traded on the London Stock Exchange.Nikkei 225 – The Nikkei-225 Stock average is a price-weighted average of 225 top-rated Japanese companies listed in the First Section of the Tokyo Stock Exchange.ESTX50 – EuroSToxx 50 index is Europe’s leading blue-chip index for the Eurozone, provides a blue-chip representation of supersector leaders in the Eurozone.Bloomberg Barclays U.S. High Yield Index – An index that is composed of fixed-rate, publicly issued, non-investment grade debt. Bloomberg Barclays Euro Corporate Index – A subset of the Barclays EuroAgg measures the investment grade, euro-denominated, fixed rate bond market, including treasuries, government-related, corporate and securitized issues.Bloomberg Barclays Euro High Yield Index – Measures the market of non-investment grade, fixed-rate corporate bonds denominated in Euro. Inclusion is based on the currency of issue, and not the domicile of the issuer.Bloomberg Barclays U.S. Corporate Index – Is a subset of the Barclays U.S. Aggregate index which is a broad-based flagship benchmark that measures the investment grade, U.S. dollar-denominated, fixed rate taxable bond market. IT includes Treasuries, government-related and corporate securities, MBS, ABS and CMBS. This subset represents the investment grade portion of that index.
Definitions

761-8-19 Just Markets
Treasuries are represented by BofA Merrill Lynch US Treasury Index (G0Q0) -The Merrill Lynch US Treasury Index tracks the performance of US dollar denominated sovereign debt publicly issued by the US government in its domestic market. Qualifying securities must have at least one year remaining term to final maturity, a fixed coupon schedule and a minimum amount outstanding of $1 billion.Mortgage-Backed Securities are represented by BofA Merrill Lynch Mortgage-Backed Securities Index (MOA0) - This index tracks the performance of US dollar denominated fixed rate and hybrid residential mortgage pass-through securities publicly issued by US agencies in the US domestic market. 30-year, 20-year, 15-year and interest only fixed rate mortgage pools are included in the Index provided they have at least one year remaining term to final maturity and a minimum amount outstanding of at least $5 billion per generic coupon and $250MM per production year within each generic coupon.Corporate Bonds are represented by BofA Merrill Lynch US Corporate Index (COAO) “Investment Grade”- The Merrill Lynch Corporate Index tracks the performance of US dollar denominated investment grade corporate debt publicly issued in the US domestic market. Qualifying securities must have an investment grade rating (based on an average of Moody’s, S&P and Fitch) and an investment grade rated country of risk (based on an average of Moody’s, S&P and Fitch foreign currency long term sovereign debt ratings). Securities must have at least one year remaining term to final maturity, a fixed coupon schedule and a minimum amount outstanding of $250MM.Two-Year Treasury is represented by U.S. Generic Gov’t 2-Year Index – Index that tracks U.S. Generic on-the-run government bill/note/bond indices.High Yield is represented by BAML High Yield Index - An index that tracks the performance of U.S. dollar denominated below investment grade corporate debt, currently in a coupon paying period, that is publicly issued in the U.S. domestic market. Qualifying securities must have a below investment grade rating (based on an average of Moody’s, S&P and Firth foreign currency long term sovereign debt ratings). Must have one year remaining to final maturity and a minimum outstanding amount of $100MM.Emerging Markets is represented by BofA Merrill Lynch US Dollar Emerging Markets Sovereign Plus Index (IGOV) - This index tracks the performance of US dollar denominated emerging market and cross-over sovereign debt publicly issued in the eurobond or US domestic market. Qualifying countries must have a BB1 or lower foreign currency long-term sovereign debt rating (based on an average of Moody’s, S&P, and Fitch).Japanese Bonds are represented by Japanese Government Bond (JGB)German Bonds are represented by German BundMunis are represented by BofA Merrill Lynch U.S. Municipal Securities Index (UOA0) - An index that tracks the performance of U.S. dollar denominated investment grade tax-exempt debt publicly issued by U.S. states and territories, and their political subdivisions, in the U.S. domestic market. Qualifying securities must have at least one year remaining term to final maturity, a fixed coupon schedule and an investment grade rating (based on Moody’s, S&P and Fitch). Minimum size vary based on the initial term to final maturity at time of issuance.
You cannot invest directly in an index.
Definitions

771-8-19 Just Markets
Important Information Regarding This ReportThis report was prepared as a private communication and was not intended for public circulation. Clients or prospects may authorize distribution to their consultants or other agents.
Issue selection processes and tools illustrated throughout this presentation are samples and may be modified periodically. Such charts are not the only tools used by the investment teams, are extremely sophisticated, may not always produce the intended results and are not intended for use by non-professionals.
DoubleLine has no obligation to provide revised assessments in the event of changed circumstances. While we have gathered this information from sources believed to be reliable, DoubleLine cannot guarantee the accuracy of the information provided. Securities discussed are not recommendations and are presented as examples of issue selection or portfolio management processes. They have been picked for comparison or illustration purposes only. No security presented within is either offered for sale or purchase. DoubleLine reserves the right to change its investment perspective and outlook without notice as market conditions dictate or as additional information becomes available. This material may include statements that constitute “forward-looking statements” under the U.S. securities laws. Forward-looking statements include, among other things, projections, estimates, and information about possible or future results related to a client’s account, or market or regulatory developments.
Important Information Regarding Risk FactorsInvestment strategies may not achieve the desired results due to implementation lag, other timing factors, portfolio management decision-making, economic or market conditions or other unanticipated factors. The views and forecasts expressed in this material are as of the date indicated, are subject to change without notice, may not come to pass and do not represent a recommendation or offer of any particular security, strategy, or investment. All investments involve risks. Please request a copy of DoubleLine’s Form ADV Part 2A to review the material risks involved in DoubleLine’s strategies. Past performance is no guarantee of future results.
Important Information Regarding DoubleLineIn preparing the client reports (and in managing the portfolios), DoubleLine and its vendors price separate account portfolio securities using various sources, including independent pricing services and fair value processes such as benchmarking.
To receive a complimentary copy of DoubleLine Capital’s current Form ADV (which contains important additional disclosure information, including risk disclosures), a copy of the DoubleLine’s proxy voting policies and procedures, or to obtain additional information on DoubleLine’s proxy voting decisions, please contact DoubleLine’s Client Services.
Disclaimer

781-8-19 Just Markets
Important Information Regarding DoubleLine’s Investment StyleDoubleLine seeks to maximize investment results consistent with our interpretation of client guidelines and investment mandate. While DoubleLine seeks to maximize returns for our clients consistent with guidelines, DoubleLine cannot guarantee that DoubleLine will outperform a client's specified benchmark or the market or that DoubleLine’s risk management techniques will successfully mitigate losses. Additionally, the nature of portfolio diversification implies that certain holdings and sectors in a client's portfolio may be rising in price while others are falling; or, that some issues and sectors are outperforming while others are underperforming. Such out or underperformance can be the result of many factors, such as but not limited to duration/interest rate exposure, yield curve exposure, bond sector exposure, or news or rumors specific to a single name.DoubleLine is an active manager and will adjust the composition of client’s portfolios consistent with our investment team’s judgment concerning market conditions and any particular sector or security. The construction of DoubleLine portfolios may differ substantially from the construction of any of a variety of bond market indices. As such, a DoubleLine portfolio has the potential to underperform or outperform a bond market index. Since markets can remain inefficiently priced for long periods, DoubleLine’s performance is properly assessed over a full multi-year market cycle.
Important Information Regarding Client ResponsibilitiesClients are requested to carefully review all portfolio holdings and strategies, including by comparing the custodial statement to any statements received from DoubleLine. Clients should promptly inform DoubleLine of any potential or perceived policy or guideline inconsistencies. In particular, DoubleLine understands that guideline enabling language is subject to interpretation and DoubleLine strongly encourages clients to express any contrasting interpretation as soon as practical. Clients are also requested to notify DoubleLine of any updates to Client’s organization, such as (but not limited to) adding affiliates (including broker dealer affiliates), issuing additional securities, name changes, mergers or other alterations to Client’s legal structure.
DoubleLine® is a registered trademark of DoubleLine Capital LP.
© 2018 DoubleLine Capital LP
Disclaimer

333 S. Grand Ave., 18th Floor || Los Angeles, CA 90071 || (213) 633-8200
Live Webcast Hosted By:
Jeffrey Gundlach Chief Executive OfficerDoubleLine Capital
January 8, 2019
Just Markets