jurnal teknologi full papereprints.utm.my/id/eprint/52467/1/jaysumanpusppanathan... ·...
TRANSCRIPT
69:8 (2014) 31–34 | www.jurnalteknologi.utm.my | eISSN 2180–3722 |
Full paper Jurnal
Teknologi
Edge Detection Algorithm For Enhancement of Linear Back Projection Tomographic Images Jaysuman Pusppanathana, Mahdi Faramarzia, Fazlul Rahman Yunusa, Nor Muzakkir Nor Ayoba, Ruzairi Abdul Rahima*, Fatin Aliah Phangb, Usman Ullah Sheikha, Leow Pei Linga, Khairul Hamimah Abasa, Mohd Hafiz Fazalul Rahimanc, Shafishuaza Sahlana aProcess Tomography Research Group (PROTOM), Faculty of Electrical Engineering, Universiti Teknologi Malaysia, 81310 UTM Johor Bahru, Johor, Malaysia bCentre of Engineering Education (CEE), Universiti Teknologi Malaysia, 81300 UTM 81310 UTM Johor Bahru, Johor, Malaysia cTomography Imaging Research Group, School of Mechatronic Engineering, Universiti Malaysia Perlis, 02600 Arau, Perlis, Malaysia
*Corresponding author: [email protected]
Article history
Received :5 February 2014
Received in revised form : 7 April 2014
Accepted :30 April 2014
Graphical abstract
Abstract
Process tomography (PT) is a leading technique for multiphase flow measurement and flow monitoring
systems in various fields. PT has the advantage of interpreting acquired measurement data and transforming it into visual tomographic images. The most common method of image reconstruction uses the linear back
projection algorithm which often results in blurry images. This paper proposes an enhancement of the
reconstructed images using an edge detection image processing technique to convolve with the original image. This filtering technique calculates approximation changes of the horizontal and vertical image
derivatives, thus further enhancing image accuracy. Several ultrasonic tomography images were put into a
simulation test to validate it. Hence, the image results are being assessed for its performance.
Keywords: Process tomography; ultrasonic tomography; image reconstruction; edge detection; convolution;
multiphase flow measurement
© 2014 Penerbit UTM Press. All rights reserved.
1.0 INTRODUCTION
Process tomography (PT) has forged a successful path as a well-
known and important technique for multiphase flow
measurements in real-time process monitoring systems. The
efficiency of such a system is closely related to the accuracy of
the measurements and the image quality.
A PT system concept can be built by mounting several
sensors on a pipe’s circumference invasively or non-invasively.
The basic block diagram of ultrasonic tomography (UT) is
illustrated as below in Figure 1.
Ultrasound
SensorsDAQ
Signal Conditioning
Circuit
Software
program
Tomograpic
Image
Figure 1 Ultrasonic tomography basic block diagram
1.1 Ultrasonic Tomography
UT has been employed non-invasively in this research. An
ultrasonic transducer propagates acoustic waves within the range
of 315–330 kHz through an acrylic pipe with a wall thickness of
5 mm before the transmitting signal wave penetrates through the
liquid-gas medium inside the pipe. The basic principle of UT and
its hardware setup is further discussed in [1–3].
The UT system has the advantage of imaging two-phase
flow composition in the form of a tomographic image. To
transform the acquired data into these images, the linear back
projection (LBP) image reconstruction technique was applied. It
is advantageous in that it requires little computation processing,
thus LBP is computationally straightforward and easy to
implement [4]. For this reason, LBP has been preferred by many
previous researchers [3, 5–7] in their research fields.
Although LBP is simple and fast in performance, its
accuracy is lower than that of iterative reconstruction methods
such as that of Landweber and others. This is due to the smearing
effect of each normalized measurement along its sensing zone

32 Ruzairi Abdul Rahim et al. / JurnalTeknologi (Sciences & Engineering) 69:8 (2014) 31–34
which causes blurring in the reconstructed image [8]. Therefore,
an image filtering technique, such as the edge detection method,
could contribute to reducing the blurred effect, thus further
enhancing the image quality.
2.0 EDGE DETECTION
Edge detection (ED) methods are based on the information of
each image’s pixel edge by evaluating the adjacent pixel value.
This method detects varying grey-level changes in the adjacent
pixels. ED is a fundamental step in image analysis and image
processing in the areas of feature detection of operators such as
the Sobel operator.
2.1 Sobel Edge Detection Method
Sobel edge detection (SED) is one of the ED methods. It is a grey
weighted algorithm of adjacent point pixels of Omni direction,
which detects edges according to the phenomenon that it can
reach extreme values in the edge points. SED is formed by two
convolution kernels or mask operators as in the matrix Equations
(1) and (2) as follows:
𝑀𝑥 = [−1 −2 −10 0 01 2 1
] (1)
𝑀𝑦 = [−1 0 1−2 0 2−1 0 1
] (2)
where Mx and My are the kernel masks in the horizontal (x) and
vertical (y) directions of each convolved image pixel point which
is represented as f(x,y) by the size of the 3x3 matrix [9].
In the partial derivatives of x and y, the direction can be
represented in Equations (3) and (4) [10, 11].
𝐺𝑥 = 𝑆1 − 𝑆2 (3)
𝐺𝑦 = 𝑆3 − 𝑆4 (4)
where:
𝑆1 = {𝑓(𝑥 + 1, 𝑦 − 1) + 2𝑓(𝑥 + 1, 𝑦) + 𝑓(𝑥 + 1, 𝑦 + 1)}
𝑆2 = {𝑓(𝑥 − 1, 𝑦 − 1) + 2𝑓(𝑥 − 1, 𝑦) + 𝑓(𝑥 − 1, 𝑦 + 1)}
𝑆3 = {𝑓(𝑥 − 1, 𝑦 + 1) + 2𝑓(𝑥, 𝑦 + 1) + 𝑓(𝑥 + 1, 𝑦 + 1)}
𝑆4 = {𝑓(𝑥 − 1, 𝑦 − 1) + 2𝑓(𝑥, 𝑦 − 1) + 𝑓(𝑥 + 1, 𝑦 − 1)}
The Sobel operator is the magnitude of the gradient computed by
Equation (5).
𝐺(𝑥,𝑦) = |𝐺𝑥| + |𝐺𝑦| (5)
The advantage of this method is that it is insensitive to noise
compared to other types of operator, thus it has certain smoothing
effects on noise [10]. Therefore, the blurry image caused by the
smearing effect of the LBP could be reduced for image
reconstruction processes. Figure 2 shows the Sobel filtering
process.
Horizontal gradient
calculation (Gx)Vertical gradient
calculation (Gy)
Gradient
combine, G(x,y)
Input Image
(UT reconstructed
tomographic images)
Sobel Filtered
Image
Figure 2 Sobel filtering process diagram
3.0 RESULT AND ANALYSIS
The proposed SED algorithm was tested by employing it on
simulated UT input images using Matlab software. The
simulation analysed images are presented in Figure 3.
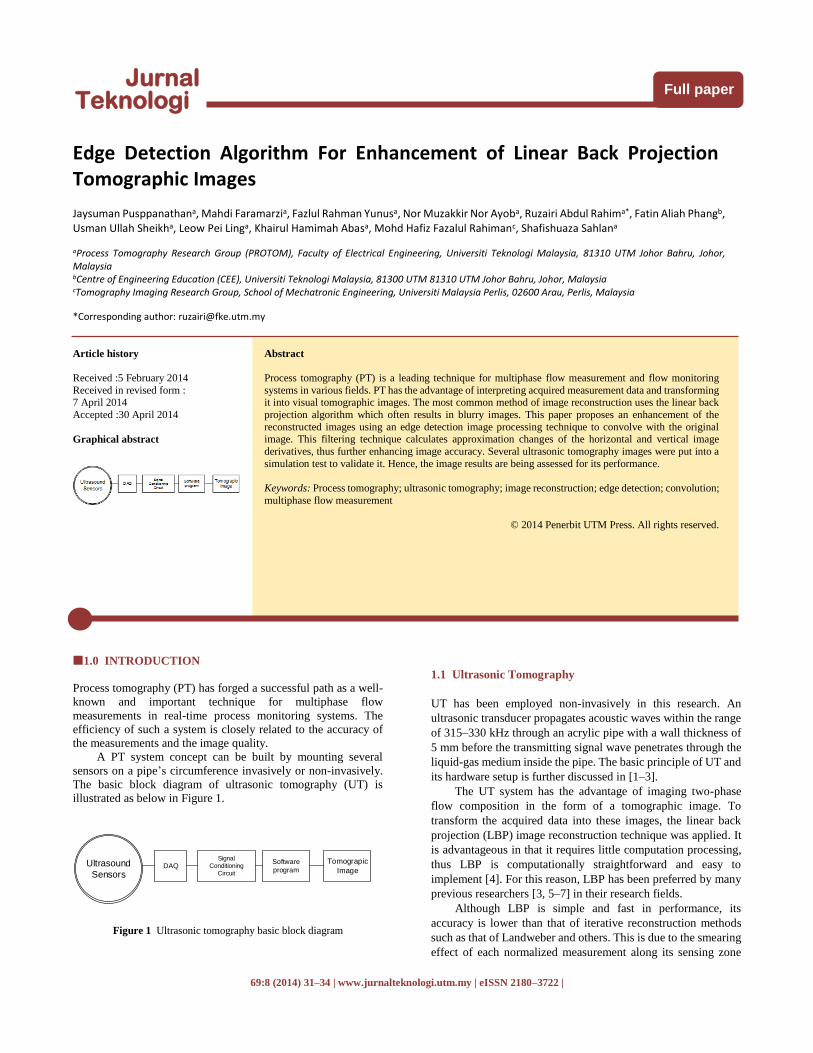
Three test profiles for the centre bubble profile, single
bubble profile and two bubbles profile were generated as the
reference images for image analysis and comparison purposes.
The simulated input image of these test profiles was reconstructed
using the LBP method as in Figure 3. The smearing effect of each
projection beam, which causes the image to be blurred, is obvious
in the LBP reconstructed images. After applying the Sobel filter,
the result shows that the filtered input images are smoother and
the smearing effect is further reduced.
Somehow, the quality of the filtered images has to be
evaluated and analysed to validate their accuracy and
performance.
33 Ruzairi Abdul Rahim et al. / JurnalTeknologi (Sciences & Engineering) 69:8 (2014) 31–34
Test
profile Centre bubble Single bubble Two bubbles
Phantom
LBP
Sobel
filtered
(a)
Test
profile Centre bubble Single bubble Two bubbles
Phantom
LBP
Sobel filtered
(b)
Figure 3: Simulated test profile images for: (a) 2D tomographic results (b) 3D tomographic results
3.1 Image Quality Assessment
To verify the performance of the output image, the linearity
between the reconstructed image and the reference phantom
image has to be measured. This can be done by assessing the
correlation coefficient (r) method, as in Equation (6), of the
output image.
𝑟 =∑ ∑ (𝐴𝑚𝑛−�̅�)(𝐵𝑚𝑛−�̅�)𝑛𝑚
√(∑ ∑ (𝐴𝑚𝑛−�̅�)2𝑛𝑚 )(∑ ∑ (𝐵𝑚𝑛−𝐵 ̅)2
𝑛𝑚 ) (6)
where A is the reference phantom image, �̅� is the mean of the
reference phantom image, B is the filtered output image and �̅� is
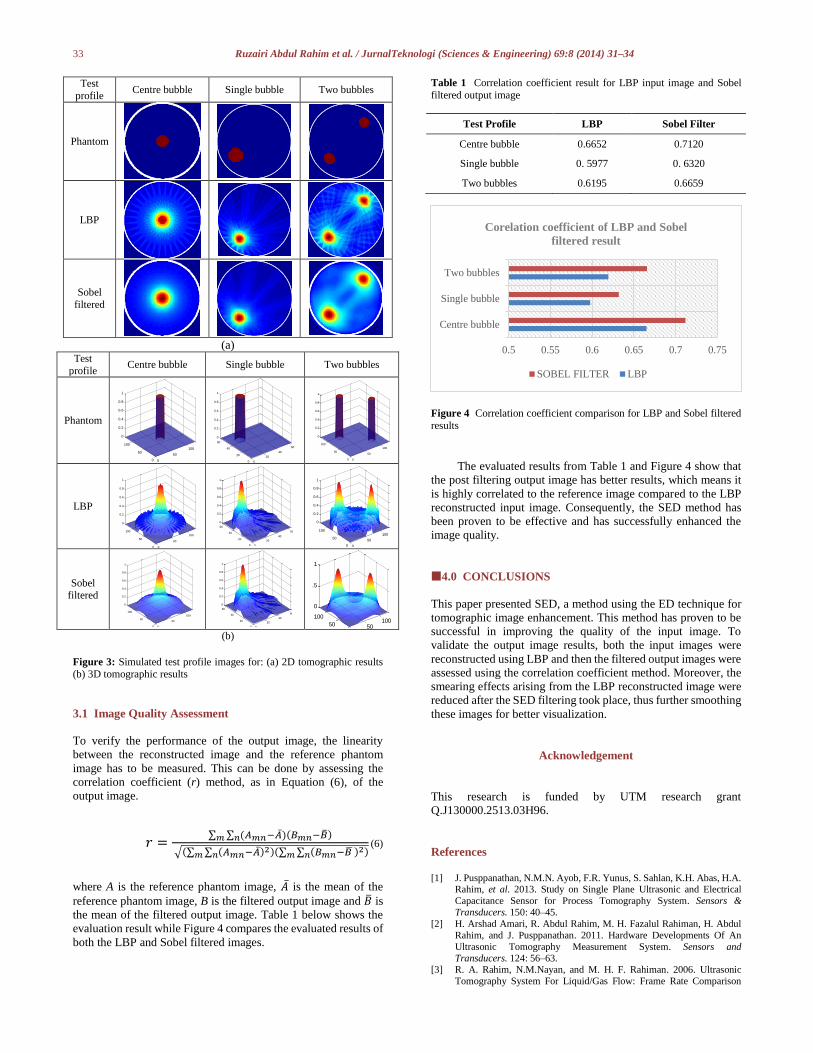
the mean of the filtered output image. Table 1 below shows the
evaluation result while Figure 4 compares the evaluated results of
both the LBP and Sobel filtered images.
Table 1 Correlation coefficient result for LBP input image and Sobel
filtered output image
Test Profile LBP Sobel Filter
Centre bubble 0.6652 0.7120
Single bubble 0. 5977 0. 6320
Two bubbles 0.6195 0.6659
Figure 4 Correlation coefficient comparison for LBP and Sobel filtered
results
The evaluated results from Table 1 and Figure 4 show that
the post filtering output image has better results, which means it
is highly correlated to the reference image compared to the LBP
reconstructed input image. Consequently, the SED method has
been proven to be effective and has successfully enhanced the
image quality.
4.0 CONCLUSIONS
This paper presented SED, a method using the ED technique for
tomographic image enhancement. This method has proven to be
successful in improving the quality of the input image. To
validate the output image results, both the input images were
reconstructed using LBP and then the filtered output images were
assessed using the correlation coefficient method. Moreover, the
smearing effects arising from the LBP reconstructed image were
reduced after the SED filtering took place, thus further smoothing
these images for better visualization.
Acknowledgement
This research is funded by UTM research grant
Q.J130000.2513.03H96.
References
[1] J. Pusppanathan, N.M.N. Ayob, F.R. Yunus, S. Sahlan, K.H. Abas, H.A.
Rahim, et al. 2013. Study on Single Plane Ultrasonic and Electrical
Capacitance Sensor for Process Tomography System. Sensors &
Transducers. 150: 40–45.
[2] H. Arshad Amari, R. Abdul Rahim, M. H. Fazalul Rahiman, H. Abdul
Rahim, and J. Pusppanathan. 2011. Hardware Developments Of An
Ultrasonic Tomography Measurement System. Sensors and
Transducers. 124: 56–63. [3] R. A. Rahim, N.M.Nayan, and M. H. F. Rahiman. 2006. Ultrasonic
Tomography System For Liquid/Gas Flow: Frame Rate Comparison
LBP
Sobel Gxy
050
100
0
50
100
0
0.5
1
0
50
100
0
50
100
0
0.2
0.4
0.6
0.8
1
0
20
40
60
0
20
40
60
0
0.2
0.4
0.6
0.8
1
0
0.1
0.2
0.3
0.4
0.5
0.6
0.7
0.8
0.9
1
0
50
100
0
50
100
0
0.2
0.4
0.6
0.8
1
0
50
100
0
50
100
0
0.2
0.4
0.6
0.8
1
0
20
40
60
0
20
40
60
0
0.2
0.4
0.6
0.8
1
LBP 3D
0
50
100
0
50
100
0
0.2
0.4
0.6
0.8
1
0
50
100
0
50
100
0
0.2
0.4
0.6
0.8
1
0
20
40
60
0
20
40
60
0
0.2
0.4
0.6
0.8
1
LBP 3D
050
100
0
50
100
0
0.5
1
0.5 0.55 0.6 0.65 0.7 0.75
Centre bubble
Single bubble
Two bubbles
Corelation coefficient of LBP and Sobel
filtered result
SOBEL FILTER LBP

34 Ruzairi Abdul Rahim et al. / JurnalTeknologi (Sciences & Engineering) 69:8 (2014) 31–34
Between Visual Basic And Visual C++ Programming. Jurnal Teknologi
131–150.
[4] N. M. Nor Ayob, M. J. Pusppanathan, R. Abdul Rahim, M. H. Fazalul
Rahiman, F. R. Mohd Yunus, S. Buyamin, et al. 2013. Design
Consideration for Front-End System in Ultrasonic Tomography. Jurnal Teknologi (Special Edition). 64: 53–58.
[5] E. J. Mohamad, R. A. Rahim, P. L. Leow, M. H. Fazalul Rahiman, O.
M. F. Marwah, N. M. Nor Ayob, et al. 2012. An Introduction of Two
Differential Excitation Potentials Technique in Electrical Capacitance
Tomography. Sensors and Actuators A: Physical. 180: 1–10.
[6] S. Z. M. Muji, R. A. Rahim, M. H. F. Rahiman, Z. Tukiran, N. M. N.
Ayob, E. J. Mohamad, et al. 2013. Optical Tomography: Image Improvement Using Mixed Projection of Parallel and Fan Beam Modes.
Measurement. 46: 1970–1978.
[7] J. Pusppanathan, N.M.N. Ayob, F.R. Yunus, R.A. Rahim, F. A. Phang,
H. A. Rahim, et al. 2013. A Novel Electrical Capacitance Sensor Design
For Dual Modality Tomography Multiphase Measurement. Jurnal
Teknologi. 64.
[8] J. C. Gamio, C. Ortiz-Alemán, and R. Martin. 2004. Electrical
Capacitance Tomography Two-phase Oil-gas Pipe Flow Imaging by the
Linear Back-projection Algorithm. Geofísica Internacional. 44: 265–273.
[9] G. Yang and F. Xu. 2011. Research and Analysis of Image Edge
Detection Algorithm Based on the MATLAB. Procedia Engineering.
15: 1313–1318.
[10] D. Caixia, M. Weifeng, and Y. Yin. 2011. An Edge Detection Approach
of Image Fusion Based on Improved Sobel Operator. In Image and
Signal Processing (CISP), 2011 4th International Congress on. 1189–1193.
[11] I. Yasri, N. H. Hamid, and V. V. Yap. 2008. Performance Analysis of
FPGA Based Sobel Edge Detection Operator. In Electronic Design,
2008. ICED 2008. International Conference on. 1–4.