june ijmie volume 2, issue 6 issn: 2249-0558 2012 doc/ijmie_june2012/ijmra-mie1066.pdf · ijmie...
TRANSCRIPT

IJMIE Volume 2, Issue 6 ISSN: 2249-0558 ___________________________________________________________
A Monthly Double-Blind Peer Reviewed Refereed Open Access International e-Journal - Included in the International Serial Directories Indexed & Listed at: Ulrich's Periodicals Directory ©, U.S.A., Open J-Gage as well as in Cabell’s Directories of Publishing Opportunities, U.S.A.
International Journal of Management, IT and Engineering http://www.ijmra.us
58
June 2012
A STUDY OF NEWSPAPER READERSHIP PATTERNS
AMONG URBAN POPULATION OF PUNJAB
Kanwal Gurleen Singh*
Rajneesh Arya*
__________________________________________________________
ABSTRACT:
Newspapers have been a source of information to one and all from various years. However, with
the proliferation of TV News Channels, Readers' choice of getting news and information has
changed. The evolution of new media has expanded the horizons for news and information
gatherers, the focus of this study is on identification of habits and preferences of Newspaper
readers. This study has been conducted to identify the Newspaper readership patterns among
urban population of Punjab. The study also identifies the Language preferences and time spent on
reading newspaper by urban population of Punjab. Further, the study attempts to gain insight of
the various reasons that motivates urban population to read the newspaper. This study has been
conducted in 3 cities of Punjab (a prime state in India), a sample of 250 urban respondents were
selected from the Jalandhar, Amritsar and Patiala cities. Some of the analysis techniques used
includes Chi square and Factor analysis.
Keywords: Newspaper Reading Preferences, Readership Patterns, Factor analysis, Langauage
preferences, category preferences, Reader survey
* Assistant Professor, Apeejay Institute of Management, Jalandhar.

IJMIE Volume 2, Issue 6 ISSN: 2249-0558 ___________________________________________________________
A Monthly Double-Blind Peer Reviewed Refereed Open Access International e-Journal - Included in the International Serial Directories Indexed & Listed at: Ulrich's Periodicals Directory ©, U.S.A., Open J-Gage as well as in Cabell’s Directories of Publishing Opportunities, U.S.A.
International Journal of Management, IT and Engineering http://www.ijmra.us
59
June 2012
INTRODUCTION:
A newspaper is a publication that is issued daily or weekly and includes local and international
news stories, advertisements, announcements, opinions, cartoons, sports news and television
listings etc. It is an important method to make the people aware of the latest happenings in their
local area and around the world. Since last decade, the availability of news via 24-hour television
channels and Internet posed an ongoing challenge to most newspapers. Paid circulation has seen a
downward trend, while advertising revenue — which makes up the bulk of most newspapers’
income — has been shifting from print to the new media, resulting in a general decline in profits.
Newspaper publishers now a days emphasis mainly on how to sell as many copies as possible.
Many newspapers around the world launched online editions to stay in the competition and to
cater to their virtual audience. Newspaper readership is on continuous decline. Although online
availability of newspapers has improved the readership of newspaper, but the print form of
newspaper has seen a significant decline. According to Mark Choate, "Newspaper circulation is in
decline, but if you combine readership between the print and online version of a newspaper you'll
find that net readership has increased. Despite this, there is a widespread perception that the
decline in print newspaper circulation represents a shrinking market for local news."
REVIEW OF LITERATURE:
Amankwah, Adwoa Sikayena (2010) in their study of the newspaper readership habits of the
residents of the Adenta SSNIT Flats, Adenta, Accra accessed newspapers readers by examining
particular newspapers they read as well as the subject items that they considered most important
in a newspaper and so read first. It also looked at the factors that influenced newspaper reading as
well as which newspapers respondents considered credible and those they regarded as not
credible. Credibility was matched against the level of readership of the selected newspapers to
determine whether there was a correlation between the two variables.The results indicate that
most respondents bought the newspapers they read or accessed them through supplies at work,
from public libraries, universities and colleges, co-tenant and friends because primarily, they
considered them informative and credible sources of information. It was obvious from the study
that respondent buy more of newspapers they consider credible and less of those considered not
credible. The study also discovered that physical features such as headlines, well written stories as

IJMIE Volume 2, Issue 6 ISSN: 2249-0558 ___________________________________________________________
A Monthly Double-Blind Peer Reviewed Refereed Open Access International e-Journal - Included in the International Serial Directories Indexed & Listed at: Ulrich's Periodicals Directory ©, U.S.A., Open J-Gage as well as in Cabell’s Directories of Publishing Opportunities, U.S.A.
International Journal of Management, IT and Engineering http://www.ijmra.us
60
June 2012
well as even newspaper review programmes boosted newspaper reading. Demographic variables
such as education, gender and age were noted to influence respondents’ newspaper reading
habits.According to the NBT survey (2009) —with a sample of over 311,431 literate youth
(102,021 rural and 209,410 urban) covering 432 villages in 207 districts as rural and 753 urban
blocks in 199 towns as urban— India’s youth population grew at over 2% to 459 million in 2009
from 390 million in the 2001 census, while the literate youth population grew at a more rapid
2.5% to 333 million from 273 million. Growth was faster in urban India (3.15% a year) than in
rural India (2.11%) 77% of the 333 million literate, or 259 million, youth are exposed to TV.
However, newspapers too are able to maintain their dominance, with over half (53%) of all
literate youth, or 177 million, exposed to them. Mahmood, Malik Tariq (2009) in their study
investigated the different patterns of academicians' of print media. Information obtained by using
a wide variety of both informal and formal sources; i.e. human sources, internet and Mass Media.
Keeping in view its nature and requirement to explore and examine news-seeking patterns of
academicians of AIOU by newspapers. The news-seeking patterns studied with respect to the
selected aspects, namely; educational development, national and international affairs, politics, as
well as articles and editorials in relation to the selected variables of gender, age, and qualification
under the following hypothesis: The academicians are more interested in the news related;
national and International affairs, economics, politics and education with relation of development
and some how sports sector. Considering the latest global developments in news provision by the
newspapers and the recent increased focus on this region, AIOU has momentous responsibility
and a latent opportunity to improve its academician's newspaper reading interest. In the Pew
Research Center's news media consumption survey (2008) found that 39% said they read a
newspaper - either print or online - down from 43% in 2006. The proportion reporting that they
read just the print version of a newspaper fell by roughly a quarter, from 34% to 25% over the
two-year period. Overall newspaper readership declined in spite of an increase in the number of
people reading online newspapers: 14% of Americans said they read a newspaper online
yesterday, up from 9% in 2006. This includes those who said they read only a newspaper online
(9% in 2008), as well as those who said they read both print and Web versions of a newspaper
(5%). These numbers may not include the number of people who read content produced by
newspapers, but accessed through aggregation sites or portals such as Google or Yahoo.
Robinson (1990) states that the decline in newspaper reading stands in marked contrast to an

IJMIE Volume 2, Issue 6 ISSN: 2249-0558 ___________________________________________________________
A Monthly Double-Blind Peer Reviewed Refereed Open Access International e-Journal - Included in the International Serial Directories Indexed & Listed at: Ulrich's Periodicals Directory ©, U.S.A., Open J-Gage as well as in Cabell’s Directories of Publishing Opportunities, U.S.A.
International Journal of Management, IT and Engineering http://www.ijmra.us
61
June 2012
overall increase in free time and to the increase in the public’s overall use of mass media. College
students are part of the elusive 18- to 34-year-old demographic segment that is the least likely to
read a daily newspaper and that newspaper publishers have sought for years to attract. Often
electronic media are blamed for the decrease in print use. Newspapers have been experiencing
declining circulation figures and advertising revenues for several years. Declining advertising
figures, in particular, pose a threat to newspapers – this is especially severe in the U.S. where 73%
of newspapers' revenues are generated through advertising. Many companies have expanded their
advertising expenditures to online. Consequently, there are concerns about online advertising
substituting newspaper advertising – much the same as has long been feared with regard to
readership. Both possible effects might pose a threat to the continuing existence of (print)
newspapers. However, though the internet – compared to newspapers – offers a variety of
advantages for advertising companies, substitution tendencies cannot be generalized.
RESEARCH OBJECTIVES:
The study has been conducted to identify the Newspaper readership patterns among urban
population of Punjab. The specific objectives of the study are:
To identify the Language preferences and time spent on reading newspaper by
urban population of Punjab.
To identify the various reasons for reading the newspaper by urban respondents.
To gain an insight into the categories of pages being preferred and ranking of
various newspaper by urban population of Punjab.
DATA BASE AND METHODOLOGY:
This study has been conducted in 3 cities of Punjab (a prime state in India), a sample of urban
respondents were selected from the Jalandhar, Amritsar and Patiala. An effort had been made to
select the respondents evenly. The survey was carried out on 300 respondents. However, 44
Questionnaires were found to be incorrect or irrelevant, so a total of 50 questionnaires were

IJMIE Volume 2, Issue 6 ISSN: 2249-0558 ___________________________________________________________
A Monthly Double-Blind Peer Reviewed Refereed Open Access International e-Journal - Included in the International Serial Directories Indexed & Listed at: Ulrich's Periodicals Directory ©, U.S.A., Open J-Gage as well as in Cabell’s Directories of Publishing Opportunities, U.S.A.
International Journal of Management, IT and Engineering http://www.ijmra.us
62
June 2012
deliberately rejected. Hence, the study sample was reduced to 250 respondents. The data was
collected personally (and via emails) in the months of December 2010 to June 2011.
Around 56.8% of the respondents were in the middle age group of 26 to 45 years; with 23.2% less
than 26 years and 20.0% of respondents were above 45 years of age (Table 9). Of the total
respondents 65.6% were male and only 34.4% were females. Most of the selected respondents
were well educated with 81% being either graduate or post graduate, only 17% of the respondents
were undergraduates. As expected most of the urban people being well educated were into good
paying jobs with 65.2% of them having monthly income in the range of Rs.10,000 to Rs.30,000
around 15.6% of the respondents earn less then Rs.10,000 per month and around 14% have
monthly income more than Rs.30,000. For the purpose of research convenience sampling
technique was used. The questionnaire comprised of a rank question, close-ended questions, a 5
point likert scale questions. The data collected through questionnaires was coded and tabulated
keeping in context with the objective of the study. It was further suitably analyzed by calculating
percentages, frequencies and Cross-tabulation techniques.The data was analyzed using SPSS
throughout the study.
DATA ANALYSIS AND INTERPRETATION:
Language preference of urban respondents for Newspapers
The respondents were asked about their preferred language for Newspaper and responses were
collected and analysed. For coding and analysis purposes the responses were collected on 4
pointer scale of ‘English only’, ‘Hindi only’, ‘Punjabi only’, ‘More than one language’ with
weightages of 4,3,2 and 1 respectively. It can be seen from table 1 that most of the respondents
prefer Hindi Newspaper(37.2%) followed by Punjabi Newspaper(31.2%). The English dailies
were read by 16.4% of the respondents and 15.2% of the respondents read more than one
language newspaper.
Gender wise analysis in Table 1 indicates that there is no signficant difference in the Language
preference of the newspaper between Males and Females. Although a difference was seen as
males mostly prefered(39.0%) to read punjabi newspaper and females mostly prefered(48.8) to
read Hindi newspapers, however the preferences for english and more than one language refelects
similar trends henceforth averaging out the differential impact of the above. This was also

IJMIE Volume 2, Issue 6 ISSN: 2249-0558 ___________________________________________________________
A Monthly Double-Blind Peer Reviewed Refereed Open Access International e-Journal - Included in the International Serial Directories Indexed & Listed at: Ulrich's Periodicals Directory ©, U.S.A., Open J-Gage as well as in Cabell’s Directories of Publishing Opportunities, U.S.A.
International Journal of Management, IT and Engineering http://www.ijmra.us
63
June 2012
confirmed by t-value (0.66), which shows no significant difference among males and females
with respect to mean values for language preferences.
Age wise analysis in Table 1 indicates the differential trend across all the age groups for langauge
preferences.29.3% of respondents in age group 18-26 read english newspapers,30.4% of the
respondents in age group 26-35 prefer to read Hindi newspaper,53.4% of the respondents in age
group 36-45 also prefered to read Hindi newspaper.However, above 45 age group respondents
mostly prefered(84.0%) to read Punjabi newspaper. It was seen that Youngsters prefered English
newspapers, the middle age group prefered Hindi newspaper and older persons prefer Punjabi
newspapers. The F-ratio (1.04) also confirmed that average mean scores of language preferences
of reading newspaper for different age groups differ significantly.
The education wise analysis shows that Hindi newspaper was prefered by most of the Under
graduates (44.1%) and graduates(45.1%) while most of the post graduates(34.6%) prefer to read
more than one langauge newspaper. The F-ratio (0.23) shows that average mean scores of
language preference for different education groups do not differ significantly.
The income wise analysis has F-ratio of 0.34 which shows no significant difference of average
mean scores of langauge preferences for different income groups. Most of the respondents in
various income groups prefer to read Hindi newspapers.
Table 1: Language preference of urban respondents for Newspapers
Respondents Read
English
Newspaper
Only
Read Hindi
Newspaper
Only
Read
Punjabi
Newspaper
only
Read More
than one
Language
newspaper
Total Mean
GENDER
Male 24(14.6) 51(31.0) 64(39.0) 25(15.2) 164 2.11
Female 17(19.7) 42(48.8) 14(16.2) 13(15.1) 86 2.69
Overall 41(16.4) 93(37.2) 78(31.2) 38(15.2) 250 2.53
t-value = 0.66
(Not significant)
AGE
18-26 17(29.3) 06(10.3) 02(3.4) 16(27.5) 58 2.98
26-35 05(7.2) 21(30.4) 11(15.9) 10(14.4) 69 2.67
36-45 13(17.8) 39(53.4) 23(31.5) 11(15.0) 73 2.24
45 and above 06(12.0) 27(54.0) 42(84.0) 01(2.0) 50 2.12
Overall 41(16.4) 93(37.2) 78(31.2) 38(15.2) 250 2.53

IJMIE Volume 2, Issue 6 ISSN: 2249-0558 ___________________________________________________________
A Monthly Double-Blind Peer Reviewed Refereed Open Access International e-Journal - Included in the International Serial Directories Indexed & Listed at: Ulrich's Periodicals Directory ©, U.S.A., Open J-Gage as well as in Cabell’s Directories of Publishing Opportunities, U.S.A.
International Journal of Management, IT and Engineering http://www.ijmra.us
64
June 2012
F-ratio = 1.04
(at 1% significance level)
EDUCATION
Under
Graduate
11(25.5) 19(44.1) 12(27.9) 01(2.3) 43 3.01
Graduate 16(12.9) 56(45.1) 42(33.8) 10(8.0) 124 2.92
Post Graduate 13(16.6) 15(19.2) 23(29.4) 27(34.6) 78 1.89
Any other 01(20.0) 03(60.0) 01(20.0) 00(0.0) 5 3.03
Overall 41(16.4) 93(37.2) 78(31.2) 38(15.2) 250 2.53
F-ratio = 0.23
(Not significant)
INCOME
Under 10,000 09(23.0) 14(35.8) 10(25.6) 06(15.3) 39 3.05
10,000-20,000 11(14.1) 32(41.0) 27(34.6) 08(10.2) 78 2.71
20,000-30,000 12(14.1) 23(27.0) 31(36.4) 19(22.3) 85 2.45
Above 30,000 09(25.7) 17(48.5) 05(14.2) 04(11.4) 35 2.96
Not Employed 00(0.0) 07(53.8) 05(38.4) 01(7.6) 13 2.87
Overall 41(16.4) 93(37.2) 78(31.2) 38(15.2) 250 2.53
F-ratio = 0.34*
(Not significant)
Time spent on Reading Newspaper
Regarding the time spent on reading newspaper by the urban respondents, it was seen that most of
the respondents(36.4%) read newspaper for less than 15 minutes in a day.About 35.2% of the
respondents spend 15-20 minutes in reading newspaper and 18.0% of the respondents spend 20-
30 minutes. Only 10.4% of the total respondents spend more than 1 hour in reading newspaper.
It can be seen from Table 2 that males usually spend more time in reading newspaper than
females, although the averages shows only a marginal difference. The chi-square value of 8.78 at
5% significance level also reveals significance association between gender and duration of
reading newspaper. The chi-square test was only applied after clubbing the ‘less than 15 minutes’
category with ‘15-20 minutes’ and ‘20-30 minutes’ category with ‘more than 1 hour’ category.
The age wise analysis shows that most of the respondents (53.4%) with age group 18-26 years
and about 40.5% of the respondents with age group 26-35 years spend 15-20 minutes in reading
the newspaper. It was seen that most of the respondents with age group above 45 years spend
more than 1 hour in reading newspaper. This shows that as age increases the respondents begin to

IJMIE Volume 2, Issue 6 ISSN: 2249-0558 ___________________________________________________________
A Monthly Double-Blind Peer Reviewed Refereed Open Access International e-Journal - Included in the International Serial Directories Indexed & Listed at: Ulrich's Periodicals Directory ©, U.S.A., Open J-Gage as well as in Cabell’s Directories of Publishing Opportunities, U.S.A.
International Journal of Management, IT and Engineering http://www.ijmra.us
65
June 2012
spend more time in reading newspaper. This can be explained by the fact that older person due to
thier less participation in other household activities prefer to read full newspaper article. The chi-
square value of 5.24 at 5% significance level confirms that when respondents get older they spend
more time in reading newspaper. It was seen (Table 2) that no association is found between the
education level of the respondents and the time of reading newspaper, it was confirmed by the
chi-square value of 2.56 at 5% significance level. Income level analysis reflects that 41.0% of
respondents with income less than Rs.10,000 read newspaper for 15-20 minutes,34.6% of
respondents with income Rs.10,000-Rs.20,000 read newspaper for 20-30 minutes, 45.8% of
respondents with income Rs.20,000-Rs.30,000 read newspaper for 15-20 minutes and 62.8% of
respondents with income more than Rs.30,000 read newspaper for less than 15 minutes.The chi-
square value of 1.53 also confirms that there is no significant association between income levels
and time spend on reading newspaper by the respondents.
Table 2 : Time spent on Reading Newspaper
Respondents Less than
15
Minutes
15-20
Minutes
20-30
Minutes
More than
1 Hour
Total
GENDER
Male 59(35.9) 68(41.4) 22(13.4) 15(9.1) 164
Female 32(37.2) 20(23.2) 23(26.7) 11(12.7) 86
Overall 91(36.4) 88(35.2) 45(18.0) 26(10.4) 250
Chi Square = 8.78
(at 5% significance level and clubbing first 2 and last 2 categories)
AGE
18-26 19(32.7) 31(53.4) 06(10.3) 02(3.4) 58
26-35 25(36.2) 28(40.5) 11(15.9) 05(7.2) 69
36-45 33(45.2) 19(26.0) 17(23.2) 04(5.4) 73
45 and above 14(28.0) 10(20.0) 11(22.0) 15(30.0) 50
Overall 91(36.4) 88(35.2) 45(18.0) 26(10.4) 250
Chi Square = 5.24
(at 5% significance level)
EDUCATION
Under
Graduate
13(30.2) 15(34.8) 08(18.6) 07(16.2) 43
Graduate 46(37.0) 41(33.0) 23(18.5) 14(11.2) 124
Post Graduate 31(39.7) 29(37.1) 13(16.6) 05(6.4) 78
Any other 01(20.0) 03(60.0) 01(20.0) 00(0.0) 5

IJMIE Volume 2, Issue 6 ISSN: 2249-0558 ___________________________________________________________
A Monthly Double-Blind Peer Reviewed Refereed Open Access International e-Journal - Included in the International Serial Directories Indexed & Listed at: Ulrich's Periodicals Directory ©, U.S.A., Open J-Gage as well as in Cabell’s Directories of Publishing Opportunities, U.S.A.
International Journal of Management, IT and Engineering http://www.ijmra.us
66
June 2012
Overall 91(36.4) 88(35.2) 45(18.0) 26(10.4) 250
Chi Square = 2.56
(at 5% significance level)
INCOME
Under 10,000 11(28.2) 16(41.0) 08(20.5) 04(10.2) 39
10,000-20,000 17(21.7) 20(25.6) 27(34.6) 14(17.9) 78
20,000-30,000 29(34.1) 39(45.8) 10(11.7) 07(8.0) 85
Above 30,000 22(62.8) 12(34.2) 00(0.0) 01(2.8) 35
Not employed 12(92.3) 01(7.6) 00(0.0) 00(0.0) 13
Overall 91(36.4) 88(35.2) 45(18.0) 26(10.4) 250
Chi Square =1.53
(at 5 % significance level)
Reasons for reading newspaper
The factor analysis was applied on the responses provided by respondents. Factor analysis is a
good way of identifying latent or underlying factors from an array of seemingly important
variables. In a more general way, factor analysis is a set of techniques, which, by analyzing
correlations between variables, reduces their number into fewer factors, which explain much of
the original data, more economically.(Malhotra,2002). In the present study, the factor analysis
was applied in order to identify the various reasons for reading newspaper by urban respondents
of Punjab,the responses obtain were put to factor analysis and the result so obtain were subject to
Kaiser- Meyer- Olkin (KMO) measure of sampling adequacy and Bartlett’s Test of Sphericity.
The approximate chi-square value is 840.981 with df 170, which is significant at 0.001
level.(Table 4).The value of KMO statistics (0.913) is also large (> 0.5). Hence, all factors are not
considered equally important for reading newspaper. An eigen value represents the amount of
various associated with the factors. From table 4, it is evident that the first three variables
represent the 77.121 % of variance. Therefore, only these three factors with the variance greater
than 1.0 are retained and the other factors are not included in the model. Thus, from eigen values
in table 4, we extract only 3 factors from the 14 variables.

IJMIE Volume 2, Issue 6 ISSN: 2249-0558 ___________________________________________________________
A Monthly Double-Blind Peer Reviewed Refereed Open Access International e-Journal - Included in the International Serial Directories Indexed & Listed at: Ulrich's Periodicals Directory ©, U.S.A., Open J-Gage as well as in Cabell’s Directories of Publishing Opportunities, U.S.A.
International Journal of Management, IT and Engineering http://www.ijmra.us
67
June 2012
Table 3: KMO and Bartlett’s test
Kaiser-Meyer-Olkin Measure of Sampling
Adequacy.
.913
Bartlett's Test of Sphericity Approx. Chi-Square 840.981
Degree of Freedom 170
Significance .001
Table 4: Total Variance explained
Initial Eigenvalues Extraction Sums of Squared
Loadings
Rotation Sums of Squared
Loadings
Component Total % of
Variance
Cumulati
ve %
Total % of
Variance
Cumulati
ve %
Total % of
Variance
Cumulativ
e %
1 4.320 28.210 28.210 4.320 28.210 28.210 4.320 28.210 28.210
2 3.443 25.390 53.600 3.443 25.390 53.600 3.443 25.390 53.600
3 2.451 23.521 77.121 2.451 23.521 77.121 2.451 23.521 77.121
4 0.915 6.156 83.277
5 0.832 5.128 88.405
6 0.801 4.130 92.535
7 0.780 3.001 95.536
8 0.611 1.902 97.438
9 0.592 0.910 98.348
10 0.415 0.613 98.961
11 0.339 0.478 99.439
12 0.291 0.390 99.829
13 0.230 0.170 99.999
14 0.140 0.001 100.00
Extraction Method: Principal Component Analysis
Factor loadings are simple correlations between the variables and factors. The most commonly
used method is the Varimax rotation procedure. This is an orthogonal method of rotation that
IJMIE Volume 2, Issue 6 ISSN: 2249-0558 ___________________________________________________________
A Monthly Double-Blind Peer Reviewed Refereed Open Access International e-Journal - Included in the International Serial Directories Indexed & Listed at: Ulrich's Periodicals Directory ©, U.S.A., Open J-Gage as well as in Cabell’s Directories of Publishing Opportunities, U.S.A.
International Journal of Management, IT and Engineering http://www.ijmra.us
68
June 2012
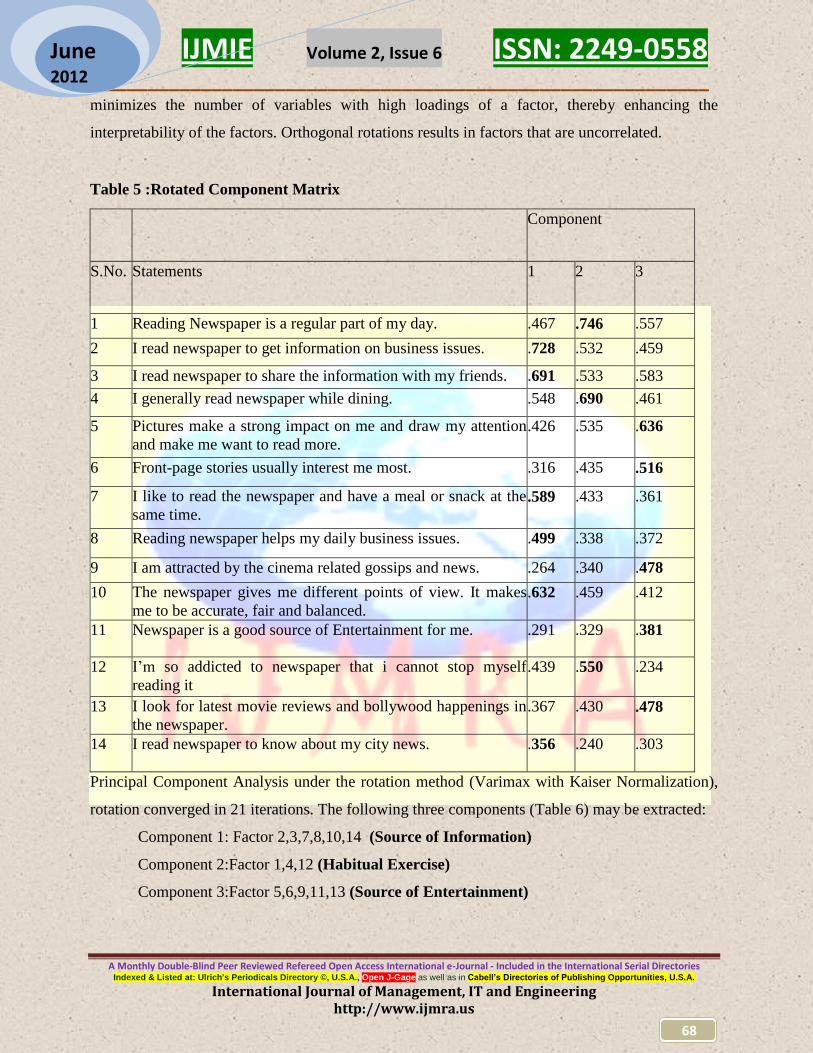
minimizes the number of variables with high loadings of a factor, thereby enhancing the
interpretability of the factors. Orthogonal rotations results in factors that are uncorrelated.
Table 5 :Rotated Component Matrix
Component
S.No. Statements 1 2 3
1 Reading Newspaper is a regular part of my day. .467 .746 .557
2 I read newspaper to get information on business issues. .728 .532 .459
3 I read newspaper to share the information with my friends. .691 .533 .583
4 I generally read newspaper while dining. .548 .690 .461
5 Pictures make a strong impact on me and draw my attention
and make me want to read more.
Front-page stories usually interest me
most.Further
.426 .535 .636
6 Front-page stories usually interest me most. .316 .435 .516
7 I like to read the newspaper and have a meal or snack at the
same time. .589 .433 .361
8 Reading newspaper helps my daily business issues.
.499 .338 .372
9 I am attracted by the cinema related gossips and news. .264 .340 .478
10 The newspaper gives me different points of view. It makes
me to be accurate, fair and balanced.
.632 .459 .412
11 Newspaper is a good source of Entertainment for me. .291 .329 .381
12 I’m so addicted to newspaper that i cannot stop myself
reading it
.439 .550 .234
13 I look for latest movie reviews and bollywood happenings in
the newspaper.
.367 .430 .478
14 I read newspaper to know about my city news. .356 .240 .303
Principal Component Analysis under the rotation method (Varimax with Kaiser Normalization),
rotation converged in 21 iterations. The following three components (Table 6) may be extracted:
Component 1: Factor 2,3,7,8,10,14 (Source of Information)
Component 2:Factor 1,4,12 (Habitual Exercise)
Component 3:Factor 5,6,9,11,13 (Source of Entertainment)

IJMIE Volume 2, Issue 6 ISSN: 2249-0558 ___________________________________________________________
A Monthly Double-Blind Peer Reviewed Refereed Open Access International e-Journal - Included in the International Serial Directories Indexed & Listed at: Ulrich's Periodicals Directory ©, U.S.A., Open J-Gage as well as in Cabell’s Directories of Publishing Opportunities, U.S.A.
International Journal of Management, IT and Engineering http://www.ijmra.us
69
June 2012
The rotated component matrix suggests presence of the Three interrelated factors.
Table 6: Naming of Factors
Factor
No.
Name of
Dimension
Item
No.
Variables Factor
loading
F1 Source of
Information
2 I read newspaper to get information on business
issues. .728
3 I read newspaper to share the information with my
friends .691
7 I like to read the newspaper and have a meal or
snack at the same time .589
8 Reading newspaper helps my daily business issues.
.499
10 The newspaper gives me different points of view.
It makes me to be accurate, fair and balanced. .632
14 I read newspaper to know about my city news. .356
F2 Habitual
Exercise
1 Reading Newspaper is a regular part of my day. .746
4 I generally read newspaper while dining. .690
12 I’m so addicted to newspaper that i cannot stop
myself reading it .550
F3
Source of
Entertainmen
t
5 Pictures make a strong impact on me and draw my
attention and make me want to read more.
.636
6 Front-page stories usually interest me most. .516
9 I am attracted by the cinema related gossips and
news. .478
11 Newspaper is a good source of Entertainment for
me. .381
13 I look for latest movie reviews and bollywood
happenings in the newspaper. .478
Source of Information: It is the most significant factor with 28.210 percent of total variance
explained. This explains the fact that after television, newspaper is still seen as a good source of
information.The urban people still find that the detail news of their city can only be known

IJMIE Volume 2, Issue 6 ISSN: 2249-0558 ___________________________________________________________
A Monthly Double-Blind Peer Reviewed Refereed Open Access International e-Journal - Included in the International Serial Directories Indexed & Listed at: Ulrich's Periodicals Directory ©, U.S.A., Open J-Gage as well as in Cabell’s Directories of Publishing Opportunities, U.S.A.
International Journal of Management, IT and Engineering http://www.ijmra.us
70
June 2012
through newspaper city editions. It is evident that clutter of various news channels on television
gives people a hint of the news, which they prefer to read in detail in Newspaper at their ease.
Habitual Exercise: It is the second most significant factor with 25.390 percent of total variance
explained. Reading newspaper with bed tea is still the first activity in the morning for many urban
people. Some of the respondents have developed it as a habit of reading newspaper and eating
side by side. Many of the older person cannot live a day without looking at the day’s newspaper.
Newspaper has deeply rooted itself into the day to day activities of many urban families that a day
seems incomplete without reading the newspaper.
Source of Entertainment: It is the third most significant factor with 23.521 percent of total
variance explained. As compared with television, internet and radio, the newspaper looks to be a
boring source of entertainment but the newspaper publishers have been working hard to portray
interesting content into their columns to increase and attract more readership. The bollywood
news, gossips, cricket analysis, television show ratings, book reviews, stories, cartoons, Sunday
editions etc are proven to be a good source of entertainment for many households.
Preferences for different categories of Newspaper pages
The respondents were asked to express their preferences with respect to various category of
newspaper pages. Seven type of page choices were given to respondent to choose from.Overall
there were three choices (I,II and III) for ranking preferences for newspaper pages. The weighted
average score of preferences were computed by allocating weights of 3,2 and 1 to 1st Preference,
2nd Preference and 3rd Preference respectively. The Sports page with weighted average
score(WAS) of 2.41 was rated as Number 1 by respondents, followed by City news with
WAS=2.30 at Number 2 and Supplement with WAS=2.22 at Number 3. The pages least prefered
by respondents were Editorial page at Number 7 with lowest WAS=1.42 and Classifieds at
Number 6 with WAS=1.58.
Table 7: Preferences for different pages/news
Page/News Preferences Weighted
Average
Score
(WAS)
Overall
Preferences
1 2 3
Main Page 112(44.8) 76(30.4) 62(24.8) 2.20 IV
Business Page 64(25.6) 89(35.6) 97(38.8) 1.86 V

IJMIE Volume 2, Issue 6 ISSN: 2249-0558 ___________________________________________________________
A Monthly Double-Blind Peer Reviewed Refereed Open Access International e-Journal - Included in the International Serial Directories Indexed & Listed at: Ulrich's Periodicals Directory ©, U.S.A., Open J-Gage as well as in Cabell’s Directories of Publishing Opportunities, U.S.A.
International Journal of Management, IT and Engineering http://www.ijmra.us
71
June 2012
Sports Page 145(58.0) 63(25.2) 42(16.8) 2.41 I
City News 136(54.4) 55(22.0) 59(23.6) 2.30 II
Classifieds 39(15.6) 67(26.8) 144(57.6) 1.58 VI
Supplement 98(39.2) 110(44.0) 42(16.8) 2.22 III
Editorial Page 31(12.4) 45(18.0) 174(69.6) 1.42 VII
Ranking of various leading newspaper
The respondents were asked to rank the newspaper of their choice. They were given a mix of
Hindi, English and Punjabi newspapers and asked to rate irrespective of the language. It is evident
from table 8 that Punjab Kesri is rated as Number 1 by most of the respondents followed by The
Tribune rated as Number 2 and Dainik Jagran & Times of India jointly at Number 3. Jagbani and
Hindustan Times were rated jointly at Number 4. Ajit was rated at Number 5 and Dainik Bhaskar
was rated at last at Number 6.
Table 8: Ranking by respondents of various Leading Newspapers
S.No. Rank\
Newspaper
1 2 3 4 5 6 7 8 9 10 Mode
1 The Tribune 43 57 22 16 28 31 18 17 11 07 2
2 Times of India 24 19 47 34 29 33 41 11 05 07 3
3 Hindustan Times 35 13 21 49 14 16 22 20 16 44 4
4 Ajit 49 15 24 17 54 24 32 14 19 02 5
5 Jagbani 42 09 11 53 22 33 14 18 29 19 4
6 Dainik Jagran 51 16 58 14 24 13 26 19 14 15 3
7 Dainik Bhaskar 46 23 21 09 12 65 14 26 19 15 6
8 Punjab Kesri 55 42 31 13 18 23 15 21 05 27 1

IJMIE Volume 2, Issue 6 ISSN: 2249-0558 ___________________________________________________________
A Monthly Double-Blind Peer Reviewed Refereed Open Access International e-Journal - Included in the International Serial Directories Indexed & Listed at: Ulrich's Periodicals Directory ©, U.S.A., Open J-Gage as well as in Cabell’s Directories of Publishing Opportunities, U.S.A.
International Journal of Management, IT and Engineering http://www.ijmra.us
72
June 2012
CONCLUSION:
The findings of the study reveals that most of the respondents prefer to read Hindi Newspaper
followed by Punjabi Newspaper. It can be further concluded from the study that there is no
signficant difference in language preferences between Males and Females, as shown by t-values.
Age wise analysis reveals that Youngsters prefered English newspapers, the middle age group
prefered Hindi newspaper and older persons prefer Punjabi newspapers. The education wise
analysis shows that Hindi newspaper was prefered by most of the Under graduates and graduates
while most of the post graduates prefer to read more than one langauge newspaper. The income
wise analysis shows no significant difference of average mean scores of langauge preferences for
different income groups. Most of the respondents in various income groups prefer to read Hindi
newspapers.
The study also highlights the various reasons for urban population of punjab to read newspaper,
mainly three factors emerged as most significant which includes,Source of Information, Habitual
Exercise and Source of Entertainment.It can be concluded that that after television, newspaper is
still seen as a good source of information.The urban people still find that the detail news of their
city can only be known through newspaper city editions. Reading newspaper with bed tea is still
the first activity in the morning for many urban people. Some of the respondents have developed
it as a habit of reading newspaper and eating side by side. Many of the older person cannot live a
day without looking at the day’s newspaper. Newspaper has deeply rooted itself into the day to
day activities of many urban families that a day seems incomplete without reading the newspaper.
As compared with television, internet and radio, the newspaper looks to be a boring source of
entertainment but the newspaper publishers have been working hard to portray interesting content
into their columns to increase and attract more readership.
The study also revealed the page preferences of the urban population of Punjab. The Sports page
was rated as Number 1 by respondents, followed by City news at Number 2 and Supplement
Number 3. The pages least prefered by respondents were Editorial page at Number 7 and
Classifieds at Number 6. Also, the ranking of various leading newspapers were asked from the
respondents and results revealed that Punjab Kesri is rated as Number 1 by most of the
respondents followed by The Tribune rated as Number 2 and Dainik Jagran & Times of India
jointly at Number 3. The study can prove helpfull for Marketers and advertisers to identify the
best-fit slot for putting their advertisement on various Newspapers. In addition, Marketers
IJMIE Volume 2, Issue 6 ISSN: 2249-0558 ___________________________________________________________
A Monthly Double-Blind Peer Reviewed Refereed Open Access International e-Journal - Included in the International Serial Directories Indexed & Listed at: Ulrich's Periodicals Directory ©, U.S.A., Open J-Gage as well as in Cabell’s Directories of Publishing Opportunities, U.S.A.
International Journal of Management, IT and Engineering http://www.ijmra.us
73
June 2012
according to their target segments can advertise their products on those Newspaper and pages,
which their audience prefers to read.
REFERENCES:
Aftab Associates (Pvt) Ltd, "Newspaper Readership Survey (NRS) 2006 and MEMRB, (NRS)
2007. Available online: http://issuu.com/ibilu/docs/national_readership_survey
Amankwah, Adwoa Sikayena, A Review of Newspaper Reading Habits of Residents of the
Adenta SSNIT Flats (August 9, 2010). Available at SSRN: http://ssrn.com/abstract=1655740
or doi:10.2139/ssrn.1655740
Al-Sulami, 2003, 'The West and Islam', Routledge Curzon, London, p- 104.
Article "Newspaper Readership Decline" by Mark Choate. Available online:
http://choate.info/2008/03/03/Isnewspaperreadershipindecline/ ,(Downloaded : June 8, 2010).
Curran and Seaton, 1991, 'Power without Responsibility', 4th edition, Routledge, London, p-
229.
Definition of Newspaper, Available online:
http://www.google.com.pk/search?hl=en&defl=en&q=define:newspaper&sa=X&ei=lHE8TO
_vGYTmsQOqtLzaCg&ved=0CBMQkAE
The Pew Research Centre for the People & the Press, "Online Papers Modestly Boost
Newspaper Readership". Available online: http://people-press.org/report/282/online-papers-
modestly-boost-newspaper-readership
Lindstädt, Nadine and Budzinski, Oliver, Newspaper vs. Online Advertising – Is There a
Niche for Newspapers in Modern Advertising Markets? (October 24, 2011). Available at
SSRN: http://ssrn.com/abstract=1948487 or doi:10.2139/ssrn.1948487
Malhotra, Naresh, K. (2002), Marketing Research -An Applied Orientation, 3rd Edition,
Pearson Education: New Delhi
Mahmood, Malik Tariq, News-Seeking Patterns of Academician of Allama IQBAL Open
University (April 22, 2009). Available at SSRN: http://ssrn.com/abstract=1393087
National Book Trust (NBT) Survey 2009, undertaken by National Council of Applied
Economic Research on behalf of National Book Trust, "National Youth Readership Survey",

IJMIE Volume 2, Issue 6 ISSN: 2249-0558 ___________________________________________________________
A Monthly Double-Blind Peer Reviewed Refereed Open Access International e-Journal - Included in the International Serial Directories Indexed & Listed at: Ulrich's Periodicals Directory ©, U.S.A., Open J-Gage as well as in Cabell’s Directories of Publishing Opportunities, U.S.A.
International Journal of Management, IT and Engineering http://www.ijmra.us
74
June 2012
Available online: http://india.foreignpolicyblogs.com/2010/03/26/youth-readership-survey-
india-some-trends/
The Pew Research Centre for the People & the Press, "Newspapers Face a Challenging
Calculus: Online Growth, but Print Losses are Bigger". Available online:
http://pewresearch.org/pubs/1133/decline-print-newspapers-increased-online-news
Wilson & Brenda, "Factors that predict Newspaper reading habits in College Students".
http://www.allacademic.com//meta/p_mla_apa_research_citation/2/0/2/9/0/pages202904/p202
904-3.php
APPENDIX
Table 9: Demographic profile of urban respondents
Demographics No. of Respondents Percentage of Respondents
Age:
18-26
26-35
36-45
45 and above
58
69
73
50
23.2
27.6
29.2
20.0
Total 250 100
Gender:
Female
Male
86
164
34.4
65.6
Total 250 100
Education: Under Graduate
Graduate
Post Graduate
Any Other
43
124
78
5
17.2
49.6
31.2
2.0
Total 250 100
Monthly Income: Under Rs.10000
Rs.10000-Rs.20000
Rs.20000-Rs.30000
More than Rs.30000
Not Employed
39
78
85
35
13
15.6
31.2
34.0
14.0
5.2
Total 250 100