june edition: market update - founders...
TRANSCRIPT

1
June Edition: Market UpdatePrepared by:
Duane [email protected]
John [email protected]
John [email protected]
Vaughn [email protected]
Jackson [email protected]
Figure A: Oil Price Projections
Short-Term Price Forecasts
A turbulent 2016 has seen oil prices free fall to $27 in mid-January, then recover to $50 byJune, all the while oil price forecasts running the gamut. Now that prices have settled inaround the $45-$50 mark over the last few months consensus has tightened aroundforecasts, but a few outliers remain. Among the analysts forecasts (Figure A), Raymond Jamesleads the bullish predictions with a $75 target by Q1 2017, whereas Goldman Sachs, UBS andCredit Suisse are more bearish with a $45-$48 target. Citigroup, Jefferies and ThompsonReuters are targeting the $52 - $55 range. Most longer term projections are calling for pricesto settle between $60-$70 in 2020 (Figure B).
Market Snapshot
After nearly a year of declining rig counts, the past three weeks saw an increase of 20 U.S.onshore rigs. The increase in rig count has put a halt on rising oil prices but prices are still upby more than 80% from a decade low earlier this year. The rise has been attributed toproduction outages in Nigeria and Canada as well as falling output in the U.S. Although theseprice increases are positive, the rally could entice producers to ramp up production, againswamping markets. As it stands now, the remaining producers have significantly increasedproductivity, resulting in a production decline much slower than the rig count decline. TheU.S. oil rig count is down nearly 50%, while production is off just 9% over the same period. Rigcount typically lags behind prices and the spring price rally could spur rig count increases forthe next few months. With an increase in rig count and increased productivity, the marketruns the risk of furthering the supply imbalance by the fall barring any additional supplydisruptions.
“ The big fear in the energy patch is that higher prices
will just entice drillers to do what they do – drill –
ramping back up the supply, and driving the whole supply and demand
equation out of whack again” – Nicholas Colas,
Convergex’s Chief Market Strategist
Analyst Q3 – 2016 Q4 -2016 Q1 - 2017
Raymond James $ 60.0 $ 65.0 $ 75.0
Thompson Reuters $ 48.2 $ 51.7 $ 54.7
Citi Group $ 51.0 $ 50.0 $ 53.0
Jefferies $ 42.0 $ 48.0 $ 52.0
Credit Suisse $ 38.0 $ 42.3 $ 47.5
UBS $ 41.0 $ 46.0 $ 47.0
Goldman Sachs $ 49.0 $ 51.0 $ 45.0
Source: Analyst Reports

2
Figure B: Oil Price Projections
Exploration and Production Implications
Producers responded to the downturn by gradually stacking rigs, resulting in a record low onMay 20th of 404 rigs nationwide, but the decline in production did not follow (Figure C). Theincreased productivity signals a large change for the future of the O&G industry astechnological developments continue to create efficiencies, but it may continue to provideheartburn in the near-term as supply remains elevated. The recent increase in rig count maytemporarily worsen the oversupply problem but in the long-term it is a strong indicator thatproducers believe oil prices will remain at a price for profitable drilling. Even with the recentuptick in rig count, most believe that rig counts will not rise quickly due to the remaininguncertainty for the future and E&P’s need to continue rebuilding balance sheets beforeinvesting heavy dollars in drilling. However, the outlook continues to brighten as MorganStanley recently upgraded its U.S. E&P outlook to “attractive” from “in-line”.
Need to add something to this graph
Source: EIA; Baker Hughes
"While we continue to believe the near-term
commodity path will be volatile and a pullback is
likely, we have confidence the oil market recovery is
occurring and oil prices will need to be higher ($80) to
deliver the production growth the world will need,"
– Morgan Stanley on the Exploration and Production
Sector
Forecast 2016 2017 2018 2019 2020
World Bank $41.0 $50.0 $53.3 $56.7 $60.4
Deloitte $44.0 $49.0 $55.0 $62.5 $70.0
Mean Analyst Forecast $42.0 $54.4 $61.9 $65.7 $67.7
Max Analyst Forecast $50.0 $75.0 $78.0 $80.0 $80.0
Min Analyst Forecast $32.0 $41.5 $46.5 $51.5 $50.0
Source: Deloitte; World Bank; Analyst Reports
Figure C: Production vs Rig Count
0
500
1,000
1,500
2,000
2,500
0
2,000
4,000
6,000
8,000
10,000
12,000
Rig
s
Bar
rels
(th
ou
san
ds)
U.S. Field Production of Crude Oil (Thousand Barrels per Day)
Baker Hughes Rig Count

3
Oil-Field Services Implications
A good recovery signal is when producers resume drilling. Work-starvedservice companies continue to standby for this recovery as they continue tobattle the massive capital expenditure cuts in the E&P sector. During thedownturn, service companies began offering steep discounts to producers.But, if a recovery begins and demand increases, service companies will beginattempting to raise prices. James Sullivan, a Senior Equity Research Analystfrom Alembic Global Advisors with over 10 years experience covering the E&Psector commented on the number of rigs necessary for service companies toregain pricing power, saying “If producers sent just another 200 to 300 rigsback to the market, the service companies would regain some of their powerto raise prices”. With that said, E&P capital expenditures are expected toremain depressed in 2016, but are projected to pick back up in 2017 accordingto Bloomberg consensus estimates (Figure D). Given this, it should take sometime for service companies to regain pricing power, but depending on theramp in demand and the level of remaining competition, surviving companiesshould be well-positioned to capitalize.
Source: Bloomberg2016 based on company guidance.2017 based on Bloomberg consensus estimates.
“We maintain our view that there will be a noticeable lag between higher oil prices and higher E&P
investments given the fragile financial state of our customer
base, which means that there will be no meaningful improvement in
our activity until 2017” – PaalKibsgaard, Schlumberger Chairman
and CEO
“While we are not planning for a recovery in 2016, we are
encouraged by reports from some customers that they are beginning to think about a potential upturn in the second half of the year, as oil
production is finally begun to rollover and demand continues to march upward” – Clay Williams,
NOV Chairman and CEO
Figure D: Estimated YoY Change in U.S. Independent E&P Cap Ex
29.2%
18.6%
(6.3%)
25.5%
(41.6%)
(56.3%)
24.8%
(60%)
(40%)
(20%)
%
20%
40%
60%
2011 2012 2013 2014 2015 2016* 2017**

As of 12/31/2013
As of 12/31/2014
As of 12/31/2015
$30
$40
$50
$60
$70
$80
$90
$100
2014 2015 2016 2017 2018
Co
ntr
act
Pri
ce
Delivery
4Source: BOE/d found in companies’ 4Q15 earnings notes
Word of Caution on Futures Market Pricing
Futures markets are not necessarily market forecasts because there are countless variables that affect them, so it isusually best to take the numbers with a grain of salt. They failed to see the oil price collapse in 2014 and failed to see afurther decline in 2015. On the other hand, they are useful in measuring general market sentiment. Graphed below(Figure E) are the futures prices as of the end of 2013, 2014 and 2015 that show how expectations have steadily faded.
Figure E: Historical Crude Oils Futures Contract Price
Price as of 6/23/16: $50.11
Conclusion
Oil prices are incredibly difficult to forecast as they are affected by countless industry variables including interest rates,politics, economics, technology and more. Most forecasters believe that oil prices will gradually rise over the next severalyears, but the pace of the recovery remains elusive.
Source: Capital IQ
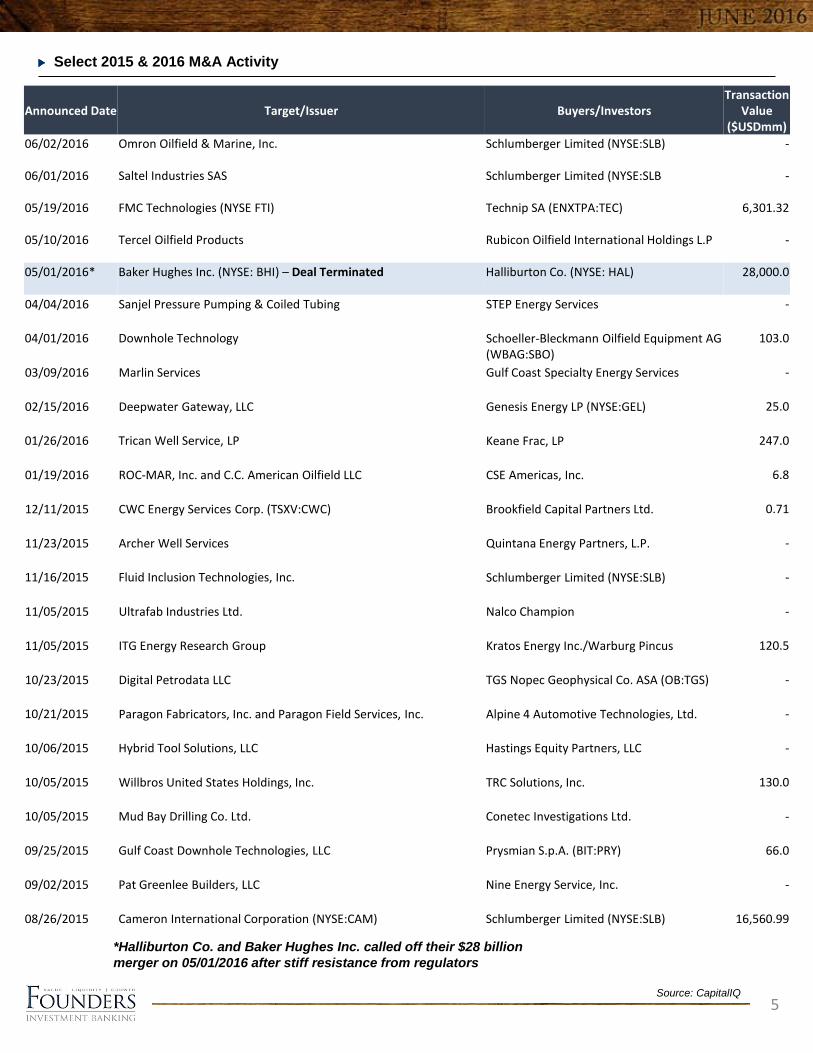
Announced Date Target/Issuer Buyers/InvestorsTransaction
Value ($USDmm)
06/02/2016 Omron Oilfield & Marine, Inc. Schlumberger Limited (NYSE:SLB) -
06/01/2016 Saltel Industries SAS Schlumberger Limited (NYSE:SLB -
05/19/2016 FMC Technologies (NYSE FTI) Technip SA (ENXTPA:TEC) 6,301.32
05/10/2016 Tercel Oilfield Products Rubicon Oilfield International Holdings L.P -
05/01/2016* Baker Hughes Inc. (NYSE: BHI) – Deal Terminated Halliburton Co. (NYSE: HAL) 28,000.0
04/04/2016 Sanjel Pressure Pumping & Coiled Tubing STEP Energy Services -
04/01/2016 Downhole Technology Schoeller-Bleckmann Oilfield Equipment AG (WBAG:SBO)
103.0
03/09/2016 Marlin Services Gulf Coast Specialty Energy Services -
02/15/2016 Deepwater Gateway, LLC Genesis Energy LP (NYSE:GEL) 25.0
01/26/2016 Trican Well Service, LP Keane Frac, LP 247.0
01/19/2016 ROC-MAR, Inc. and C.C. American Oilfield LLC CSE Americas, Inc. 6.8
12/11/2015 CWC Energy Services Corp. (TSXV:CWC) Brookfield Capital Partners Ltd. 0.71
11/23/2015 Archer Well Services Quintana Energy Partners, L.P. -
11/16/2015 Fluid Inclusion Technologies, Inc. Schlumberger Limited (NYSE:SLB) -
11/05/2015 Ultrafab Industries Ltd. Nalco Champion -
11/05/2015 ITG Energy Research Group Kratos Energy Inc./Warburg Pincus 120.5
10/23/2015 Digital Petrodata LLC TGS Nopec Geophysical Co. ASA (OB:TGS) -
10/21/2015 Paragon Fabricators, Inc. and Paragon Field Services, Inc. Alpine 4 Automotive Technologies, Ltd. -
10/06/2015 Hybrid Tool Solutions, LLC Hastings Equity Partners, LLC -
10/05/2015 Willbros United States Holdings, Inc. TRC Solutions, Inc. 130.0
10/05/2015 Mud Bay Drilling Co. Ltd. Conetec Investigations Ltd. -
09/25/2015 Gulf Coast Downhole Technologies, LLC Prysmian S.p.A. (BIT:PRY) 66.0
09/02/2015 Pat Greenlee Builders, LLC Nine Energy Service, Inc. -
08/26/2015 Cameron International Corporation (NYSE:CAM) Schlumberger Limited (NYSE:SLB) 16,560.99
5Source: CapitalIQ
Select 2015 & 2016 M&A Activity
*Halliburton Co. and Baker Hughes Inc. called off their $28 billion
merger on 05/01/2016 after stiff resistance from regulators

6Source: CapitalIQ
Commodity Prices
Price per Barrel Change from
Current Prior Month Prior Year Prior Month Prior Year
Crude Oil $49.13 $48.41 $60.38 1.5% (18.6%)
Price per MmBtu Change from
Current Prior Month Prior Year Prior Month Prior Year
Natural Gas $2.72 $2.21 $2.78 23.4% (1.9%)
20.00
30.00
40.00
50.00
60.00
70.00
80.00
90.00
100.00
Crude Oil - WTI
0.00
1.00
2.00
3.00
4.00
5.00
6.00
Natural Gas - Henry Hub
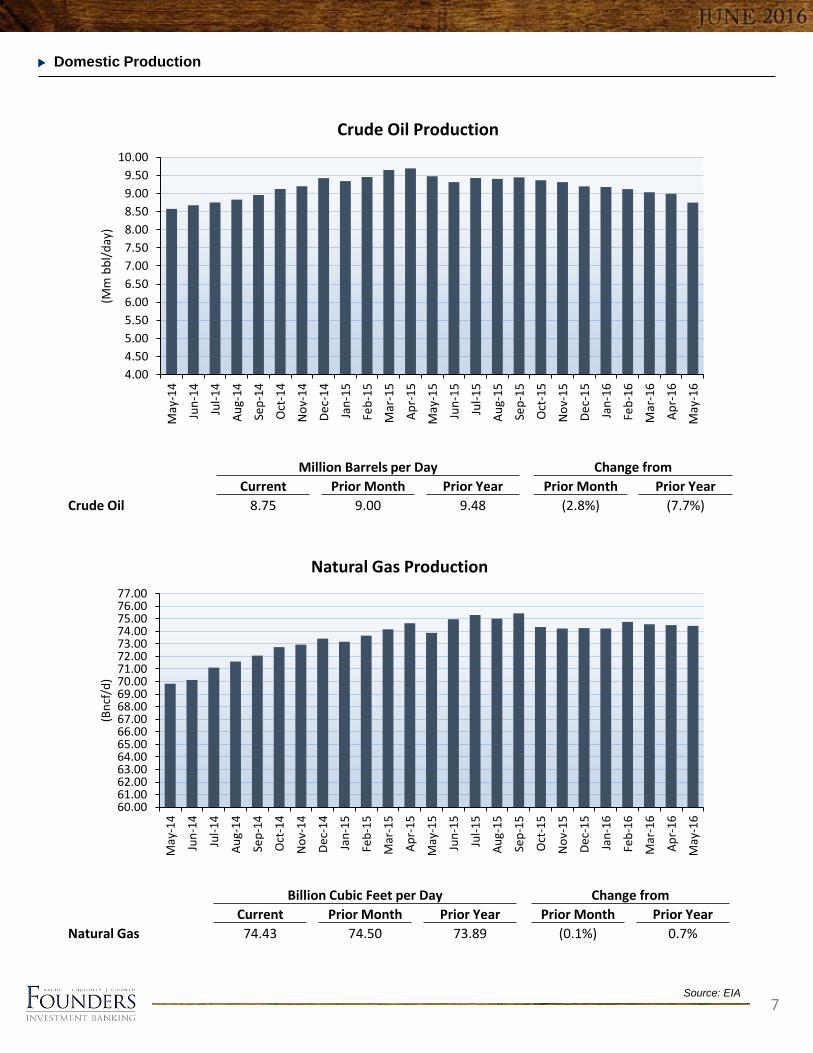
Million Barrels per Day Change from
Current Prior Month Prior Year Prior Month Prior Year
Crude Oil 8.75 9.00 9.48 (2.8%) (7.7%)
Billion Cubic Feet per Day Change from
Current Prior Month Prior Year Prior Month Prior Year
Natural Gas 74.43 74.50 73.89 (0.1%) 0.7%
7Source: EIA
Domestic Production
60.0061.0062.0063.0064.0065.0066.0067.0068.0069.0070.0071.0072.0073.0074.0075.0076.0077.00
May
-14
Jun
-14
Jul-
14
Au
g-1
4
Sep
-14
Oct
-14
No
v-1
4
De
c-1
4
Jan
-15
Feb
-15
Mar
-15
Ap
r-1
5
May
-15
Jun
-15
Jul-
15
Au
g-1
5
Sep
-15
Oct
-15
No
v-1
5
De
c-1
5
Jan
-16
Feb
-16
Mar
-16
Ap
r-1
6
May
-16
(Bn
cf/d
)
Natural Gas Production
4.00
4.50
5.00
5.50
6.00
6.50
7.00
7.50
8.00
8.50
9.00
9.50
10.00M
ay-1
4
Jun
-14
Jul-
14
Au
g-1
4
Sep
-14
Oct
-14
No
v-1
4
De
c-1
4
Jan
-15
Feb
-15
Mar
-15
Ap
r-1
5
May
-15
Jun
-15
Jul-
15
Au
g-1
5
Sep
-15
Oct
-15
No
v-1
5
De
c-1
5
Jan
-16
Feb
-16
Mar
-16
Ap
r-1
6
May
-16
(Mm
bb
l/d
ay)
Crude Oil Production

8Source: Baker Hughes
Rig Counts
Rig Count Change from
Current Prior Month Prior Year Prior Month Prior Year
U.S. Offshore 21 24 27 (12.5%) (22.2%)
Rig Count Change from
Current Prior Month Prior Year Prior Month Prior Year
U.S. Onshore 403 380 830 6.1% (51.4%)
-
250
500
750
1,000
1,250
1,500
1,750
2,000
2,250
Onshore Rig Count
-
250
500
750
1,000
1,250
1,500
1,750
2,000
2,250
U.S. Onshore Rig Count
-
20
40
60
80
100
120
140
160
180
200
U.S. Offshore Rig Count

9Source: Baker Hughes
Rig Counts (continued)
-
250
500
750
1,000
1,250
1,500
1,750
2,000
2,250
2,500
U.S. Rig Count by Basin Permian
Eagle Ford
Williston
Marcellus
Mississippian
Granite Wash
Haynesville
DJ Niobrara
Utica
Cana Woodford
Barnett
Fayetteville
Arkoma Woodford
Ardmore Woodford
Others
146
34
24
24
4
7
17
12
12
27
7
0
2
1
107
Permian
Eagle Ford
Williston
Marcellus
Mississippian
Granite Wash
Haynesville
DJ - Niobrara
Utica
Cana Woodford
Barnett
Fayetteville
Arkoma Woodford
Ardmore Woodford
Others
U.S. Rig Count by Basin
(87)
(70)
(53)
(40)
(18)
(9)
(9)
(17)
(10)
(5)
1
(5)
(4)
(7)
(100)
Permian
Eagle Ford
Williston
Marcellus
Mississippian
Granite Wash
Haynesville
DJ - Niobrara
Utica
Cana Woodford
Barnett
Fayetteville
Arkoma Woodford
Ardmore Woodford
Others
U.S. Rig Count by Basin YTD Change

Rig Count Change from
Current Prior Month Prior Year Prior Month Prior Year
Oil 17 18 19 (5.6%) (10.5%)
Natural Gas 4 5 8 (20.0%) (50.0%)
Rig Count Change from
Current Prior Month Prior Year Prior Month Prior Year
Oil 337 318 631 6.0% (46.6%)
Natural Gas 86 85 223 1.2% (61.4%)
10Source: Baker Hughes
Rig Counts (continued)
-
250
500
750
1,000
1,250
1,500
1,750
U.S. Oil vs. Natural Gas Rig Count
Oil Natural Gas
-
20
40
60
80
100
120
140
Gulf of Mexico: Oil Rig vs. Natural Gas Rig Count
GOM Oil Rig Count GOM Natural Gas Rig Count

11
In order to provide securities-related services discussed herein, certain principals of Founders are licensed with M&A Securities Group, Inc.
or Founder M&A Advisory, LLC, both members FINRA & SiPC. Founders M&A Advisory is a wholly owned subsidiary of Founders. M&A
Securities Group and Founders are not affiliated entities. For more information, visit www.foundersib.com.
FOUNDERS INVESTMENT BANKING IS A MERGER AND ACQUISITION FIRM
WITH AN OIL AND GAS SERVICES PRACTICE THAT BRINGS A WALL
STREET-LEVEL OF SOPHISTICATION TO THE WELL SITE. ITS TEAM'S
PROVEN EXPERTISE AND PROCESS-BASED SOLUTIONS HELP COMPANIES
AND BUSINESS OWNERS ACCESS CAPITAL AND PREPARE FOR AND
EXECUTE LIQUIDITY EVENTS TO ACHIEVE SPECIFIC FINANCIAL GOALS.
O&G SERVICES LEAD ADVISORS:
DUANE DONNER
MANAGING DIRECTOR
205‐423-2548
JOE BRADY
DIRECTOR
205‐503-4023
JOHN SULLIVAN
VICE PRESIDENT
205-503-4010
JOHN ORTSTADT
BUSINESS DEVELOPMENT
205-503-4030
VAUGHN MCCRARY
ANALYST
JACKSON POE
ANALYST
FOUNDERS INVESTMENT BANKING, LLC
BIRMINGHAM OFFICE
2204 LAKESHORE DRIVE
BIRMINGHAM, AL 35223
205.949.2043
Founders Opens Dallas Office
Select Transactions:
DALLAS OFFICE
5606 N MCARTHUR BLVD
IRVING, TX 75038
214.295.1055
FOUNDERS INVESTMENT BANKING RECENTLY ANNOUNCED ITS NEW DALLAS
OFFICE. THE NEW OFFICE, THE FIRST FOUNDERS OFFICE OUTSIDE THE
BIRMINGHAM AREA, WILL FOCUS ON MIDDLE-MARKET COMPANIES IN TEXAS
AND OKLAHOMA, AND INDUSTRIAL TECHNOLOGY COMPANIES NATIONWIDE.
THE DALLAS OFFICE WILL BE LED BY NEW HIRE EUGENE “GENE” BAZEMORE
JR. AN INVESTMENT BANKER WITH SIGNIFICANT TRANSACTION EXPERIENCE,
INCLUDING SEVERAL YEARS AS A SENIOR BANKER AT HOULIHAN LOKEY.