june 2020 - autorité des marchés financiers
TRANSCRIPT

JUNE 2020
OPPORTUNITIES AND RISKS IN THE FINANCIAL INDEX MARKET LAURENT GRILLET-AUBERT
Risk and Trend Mapping

- 2 -
In memory of Didier Davydoff. With my thanks to those whose help was invaluable in writing this publication, particularly within the AMF’s Scientific Advisory Board and Consultative Commissions, with a special mention for my colleague Philip Morris.

- 3 -
Executive Summary Financial indices are playing an increasingly important role. Trillions of euros of assets under management of financial products are linked to them, and this continues to rise. They are used: (i) to measure the performance of active funds – the vast majority of French collective investment funds are benchmarked to indices; (ii) as underlyings for passive management that replicates their performance – e.g. $5.4 trillion in Exchange-Traded Products worldwide as of March 2020, five times the amount in 20091; (iii) as underlyings for a growing number of derivatives – 217.1 million open positions for listed index futures and options alone (+30.4% compared with 2009); (iv) as benchmarks for financial contracts – more than $240 trillion for LIBOR. For example, $14.8 trillion of assets under management are benchmarked to MSCI indices, and between $2 and $2.5 trillion to the Bloomberg Barclays Global Aggregate bond indices. The number of indices is also increasing. The Index Industry Association (IIA) estimates that there were 2.96 million in 2019. Innovation is contributing to this proliferation in the shape of bond, smart beta, sustainable investment, strategy and “proprietary” indices. Drawing on available information and demonstrating the limitations of the data that is available, this study provides an overview of the index market and identifies both the regulatory issues and associated risks. It focuses mainly on the impact of the use of indices on market equilibrium and the industrial economy of index promoters (organisation and competition). The effects on corporate governance and those related to the reform of benchmark rates (IBOR) are discussed more succinctly. The index industry is highly concentrated and in Europe has been subject to the Benchmark Regulation (BMR) since 2018. Three global players –FTSE Russell, MSCI and S&P Dow Jones – have a 71% market share. The industry is highly profitable, with MSCI’s 2018 operating margin at 47.9%, highly innovative and rapidly evolving as it becomes part of the diversified service offering of stock market groups and data providers. On top of the benefits drawn from it, the increasing use of indices raises questions about the risks involved. Prioritising these risks is a challenging exercise given their diversity and the varying degrees to which they are documented (Table 1). The main risks identified relate to:
- The quality of the price formation process. Distortions are noted when securities are added to indices (increased correlation of returns and increased volatility). These include, in particular, a deviation of the price of these assets from their long-term level and a potentially slower incorporation of fundamental information. It remains to be seen whether these inefficiencies constitute market failures resulting, for example, from the cost or lack of market information (data, ratings, financial analysis, etc.) or from obstacles to arbitrage;
- Financial stability. Arbitrage between spot and forward index-linked products and between index-linked products and underlying or correlated assets is also central to the issue of market liquidity. Indices support risk-taking in derivatives markets, e.g. VIX hedging, and in illiquid asset markets, e.g. bonds, real estate and private assets. This could affect their stability in the event of a shock, all the more so since the current and sustained low interest rate environment promotes liquidity transformation and the use of index-linked products for liquidity needs. The increased impact of “technical” effects, linked to the rebalancing of indices or changes in their methodology, and operational risks are also highlighted here. Finally, the use of indices and the interconnected structure of markets increase vulnerabilities to the propagation of market shocks;
- The competitive operation of the market. Oligopolistic competition and the increasing consolidation of the sector not only limit transparency regarding the index offering but also the ability to compare prices, as the offering is generally bundled with data supply services.
- Investor protection. This is due to: (i) the lack of transparency and the limited scope for comparison; (ii) the difficulties in understanding certain complex or proprietary indices, particularly when the boundary between index and asset management becomes blurred and systematic indices incorporate multiple management rules and/or margins of discretion; (iii) the cost to investors of the predictability of index trading needs (adverse selection).
1 Source: ETFGI.com.

- 4 -
These risks lead to the following recommendations in particular: 1) Analysis and risk management for the efficiency and stability of secondary markets:
• The management of extreme risks requires further examination of the proportionality and appropriateness of circuit breakers and of opportunities for their improvement;
• If there are no disruptive effects, a market offering could limit some market inefficiencies. For example, an index offering that weights bond indices by criteria other than outstanding issuance amounts2 seems desirable;
• Authorities could consider informing the public about certain exposures and/or risk transfers, particularly on derivatives markets 3 where threshold effects can be disruptive, as demonstrated by the unwinding of protection sales on the VIX index in February 2018.
Specific effects of the Covid-19 crisis are noted. For example, some index administrators postponed the relancing of indices to avoid disrupting the markets further, stressing thereby the risk of procyclicity of corporate bond index investment in the event of rating downgrades. Also, the hedging strategies implemented by the issuers of some index-based structured products may have had destabilising impacts on the markets for dividend index derivatives4.
2) Transparency for investors: In an environment of accelerated innovation, issues relating to information and investors’ understanding of risks have been identified. In particular, smart beta, ESG and bond indices expose investors to specific and often complex risk factors. They may also introduce margins of discretion or, in the case of proprietary indices, create conflicts of interest. It would therefore seem appropriate to make it easier to identify and compare indices, for example by:
• Reporting similar to that of third-country indices to ESMA, resulting in an inventory of marketed indices;
• Harmonisation of the index categories in use, where appropriate in conjunction with index-linked product categories (in particular for ETPs), which would improve the clarity of the product offering;
• Systematic allocation of index identification codes.5 It would also be useful to identify index-linked products (Unique Product Identifier);
3) Management of “technical” and “operational” risks faced by index administrators: It depends mainly on the reputational risk to which index producers are exposed and entails varying margins of discretion6, calling thereby appropriate supervision into question.
• In Europe, the BMR provides a suitable supervisory framework, focusing primarily on governance. Specific reporting requirements could be considered (e.g. on observed malfunctions or the cessation of index calculation).
2 The transparency of bond indices appears limited in this respect. 3 In a similar vein to the CFTC’s Commitments of Traders data. 4 See respectively e.g. the Financial Times "Downgrades flood junk bond market with fallen angels", 07/04/20 and Financial News, "How French banks lost big in the complex world of structured finance", 15/05/20. 5 Moreover, this would assist in addressing regulatory requirements for identifying critical indices. 6 For example, in March 2020, some global index providers delayed the rebalancing of some indices (see Financial Times "Fragile markets prompt providers to leave benchmarks unchanged" dated 26/03/20).

- 5 -
4) Competition: Due to its imperfections, and against a backdrop of increasing consolidation in the sector, it generally limits transparency on the index offer and supports above recommendations 2) and 3). It presents also specific data and pricing issues. The following could therefore be considered here:
• Encouraging the systematic identification of index administrators, where this is not yet in place;
• Promoting price transparency, in particular regarding the structure and sources of fees (licence fees, fees on assets under management, etc.) and the provision of services related to the use of indices (e.g. components, weightings) in order to facilitate the use of data for index calculation and the ability to replicate and evaluate their methodologies;
• Clarifying the regulatory and accounting scope of index administration within consolidated groups to provide a better understanding of its activities and compare them to those of pure players;7
Beyond this, this study calls for further research into and analysis of the risks and impacts of the use of indices. An initial direction would be to intensify existing work, in particular: (i) the findings relating to a reduction in the information content of asset prices; (ii) the analysis of anomalies; and (iii) the impacts of index investing on financial stability and the evaluation of risk management tools, e.g. circuit breakers, transparency, etc. A second would focus on more exploratory risk analyses, particularly relating to operational resilience, market integrity and investor protection. This discussion paper is therefore intended to help guide and encourage further analysis, with a focus on Europe, and dialogue with stakeholders, industry, investors, competent authorities and academia.
7 Entities exclusively engaged in the administration and promotion of financial indices and not part of diversified financial groups.

- 6 -
Risks associated with the increased use of financial indices and guidance/recommendations provided Risk Type* Docu-
mented Identified causes, catalysts Identified management methods or tools Estimated
importance Guidance or recommendations
a Distortion of the price formation process (co-movement, volatility)
MSO Yes Negative externality of uninformed trading and certain arbitrage strategies (e.g. HFT statistical arbitrage)
TBD TBD Define risk analysis (causes, measure) Volatility limits
b Less informational content on prices; passive management “free riding”
MSO Little - Access to/cost of basic info (e.g. data, research) - Lack of “fundamental” arbitrage
- Incentive to produce/provide access to information - Incentives for “fundamental” arbitrage
TBD Define risk measure. Review of incentives to produce market info
c Transformation of liquidity, especially in illiquid markets (e.g. bonds)
FiStab Yes Search for yield and liquidity in the low interest rate environment Conflict of interest management (transparency) among benchmark administrators Liquidity risk management (asset, liability, and asset-liability)
Medium/ High Increasing
Monitor innovation, examine targeted risks (e.g. bond index weights) Publish warnings if needed Strengthen liquidity management
d Propagation/amplification of market shocks, especially in certain segments (rates and EMEs, strategies (e.g. volatility))
FiStab Yes - Propagation of shocks by arbitrage - Directional investment strategies (momentum, etc.)
Ex ante: incentive to provide liquidity, conflict of interest management, first-mover advantage Ex post: circuit breakers
Medium/ High
Review of potentially excessive risk-taking (bonds, derivatives markets) (Re)review of liquidity management tools, e.g. circuit breakers in correlated markets
e Impacts of rebalancing and methodological changes by index administrators
InvProt, FiStab
Yes Market impact Predictability of index trading and information asymmetries
Conflict of interest management (transparency) among index administrators
Medium Increasing
Discussion with stakeholders on optimal risk management Assess the need for an appropriate international framework
f Cost to the investor of the predictability of index trading (adverse selection)
MSO, InvProt
Little Predictability of index trading and information asymmetries Conflict of interest management (transparency) in passive management
Medium Increase transparency provided to investors on these transaction costs
g Understandability of complex indices InvProt Little - Integration of (multiple) business rules into indices - Margins of discretion (data, methodologies)/proprietary indices
- Complexity limitation - Conflict of interest management among index administrators/fund managers (transparency) - Facilitating comparisons between indices
Medium/ Increasing
- Define risk analysis (characteristics of structured products, causes, impacts) Increase transparency, especially of proprietary indices and comparability (see h)).
h Ability to compare index offerings and index-linked products, and pricing models
InvProt No - Limited transparency on supply and methodologies
- Systematic identification of benchmarks - Facilitating comparisons between indices - Classification of indices and exchange-traded products (ETPs) - Price transparency
Medium/ High
- Systematically identify benchmarks, ESMA register? - Facilitate comparisons between indices: classification of indices and ETPs - Price transparency
i Operational risks (in terms of concentration of operations and trading)
MSO, FiStab
Little Economies of scale/technical integration, Cybercrime Reputational risk management
Operational risk/cybercrime management Transparency to the authorities
TBD Requirements for reporting incidents to the authorities?
j Market integrity (price manipulation, front running)
InvProt, FiStab
For IBOR
- Discretion regarding data and index methodologies - Concentration of trading, low liquidity - Conflicts of interest, existence of correlated/substitutable products
Conflict of interest/transparency management (data providers, index administrators, markets) Market supervision and surveillance
Increasing Increase coordination or even integration of market surveillance systems
k Imperfect competition between index producers
OSF Very little
- Economies of scale and reputational externalities - Vertical integration with data providers, distributors
Conflict of interest management/Transparency among index producers
Medium Increasing
Increase price transparency, especially if the offer is bundled with data provision. Better identify administrators (LEI) and characterise their accounting scope of activity
Regulator’s objectives: market structure optimality (MSO), financial stability (FiStab), investor protection (InvProt).

- 7 -
Contents 1.2.1 Background ............................................................................................................ 13 1.2.2 Activities and industrial organisation ..................................................................... 13
a) Data provision ..................................................................................................... 14 b) Administration: promoting, calculating and managing indices .......................... 14 c) Dissemination of index information.................................................................... 14 d) Structuring and issuance of index-linked products ............................................. 14 e) Distribution to investors ..................................................................................... 16
1.2.3 Supply structure and proliferation of indices ......................................................... 16 1.2.4 Increasing complexity of indices ............................................................................ 18 1.3.1 Types of index use .................................................................................................. 21 1.3.2 Index investing fundamentals : from representative market indices to factor indices ............................................................................................................................. 21 1.3.3 Other factors: diversification, sustainable investment and strategies................... 26
a) International diversification and looking beyond equities – FICC (and crypto-assets?) ..................................................................................................................... 26 b) Taking non-financial criteria into account .......................................................... 27 c) Systematic management and strategy indices ................................................... 29
1.3.4 Development of derivatives markets ..................................................................... 29 1.3.5 Reference rates (IBOR): reform of critical benchmarks ......................................... 31 1.3.6 End End user ? Final client ?demand: institutional and retail investors ................ 31 2.1.1 Passive management vs active management ........................................................ 33
2.1.1.1 Passive, active and systematic management concepts ................................... 33 2.1.1.2 Active management vs passive management ................................................. 34
2.1.2 Impacts on market efficiency and stability ............................................................ 35 2.1.2.1 Index-linked products: structural impacts on secondary markets .................. 35
a) ETFs and index derivatives at the core of the market structure ......................... 35 b) Pronounced “technical” effects .......................................................................... 36
2.1.2.2 Impacts on price formation ............................................................................. 37 a) Contradictory effects on price efficiency and informational content ................. 37 b) An excessive increase in asset price co-movement ............................................ 39 c) Excess volatility, reflecting uninformed trading.................................................. 40 d) Contagion ............................................................................................................ 41
2.1.2.3 Impacts on market liquidity ............................................................................ 43 a) Impacts, autocorrelation of returns and procyclicality of index investing .......... 43 b) Impact cost and exploiting information asymmetries ........................................ 43
2.1.2.4 Limits of arbitrage and investor rationality ..................................................... 46 a) Arbitrage: limits and negative externalities ........................................................ 46 b) Lack of investor capacity to process information ............................................... 47
2.2.1 Trends ..................................................................................................................... 48 2.2.2 Strategic issues ....................................................................................................... 49
a) Vertical integration ............................................................................................. 49 b) Concentration vs differentiation ......................................................................... 50
2.2.3 Changing competitive arena .................................................................................. 52 2.3.1 Risks and recommendations identified .................................................................. 54
a) Distortion of the price formation process (co-movement, volatility) ................. 54 b) Less basic informational content on prices; passive management “free riding” 54 c) Transformation of liquidity, especially in bond and illiquid markets .................. 56 d) Propagation/amplification of market shocks in certain market segments (emerging markets, strategy indices, e.g. volatile, leveraged) or systemic .............. 56 e) Impacts of changes in methodology and index rebalancing ............................... 57 f) Cost to investors of the predictability of index trading (adverse selection) ....... 57 g) Comprehensibility of complex indices ................................................................ 57

- 8 -
h) Ability to compare index offerings and index-linked products, and pricing models ...................................................................................................................... 57 i) Operational risks (in terms of concentration of operations and trading) ........... 58 j) Market integrity (price manipulation, front running) ......................................... 58 k) Imperfect competition between index producers .............................................. 59
2.3.2 Multiple avenues to be (further) explored ............................................................. 60 2.3.3 Research directions ................................................................................................ 61

- 9 -
The index production industry is expanding through a combination of automation, innovation and strategic developments (consolidations). Automation of the index production and management processes has led to the integration of the “production chain”, from data collection through to the dissemination of indices, via calculations and adjustments processes. Innovation is broadening the reference universes of indices beyond listed equities to new asset classes (e.g. illiquid, volatile) and is incorporating trading strategies (leverage/inverse, 130/30).
On this basis, the industry is benefiting from the rapid development in the various uses and markets for index-linked products (funds, debt and structured products, derivatives). These trends reflect, especially in Europe, a growing use of index-based products by institutional investment management, particularly smart beta ETFs, ESG8 products and products that are used to satisfy liquidity needs and search for yield (high yield, emerging market debt, etc.). This environment has led to the implementation, in Europe, of a dedicated supervisory framework, consistent with the general principles drawn up at the overall level, which specifies the terms of reference of the strategic market analysis, based on a broad definition of indices. This raises questions about the challenges and the nature of the risks falling within the regulator’s competence. It is especially important to distinguish here between the index market itself and the market for index-linked products, since the boundary is sometimes blurred, especially when the indices include portfolio management criteria and discretionary margins. A description of the supply and demand for indices and their variety of uses puts the analysis into context. The analysis raises multiple questions that it endeavours to place in perspective. There are two main points of focus: the effect of index-linked management on the efficiency and stability of markets and the effect of competition and index providers’ strategies. The guidelines set out based on these points are primarily intended to refine the identification of risks from a regulatory perspective and to form the basis for discussion with stakeholders.
8 ESG stands for Environmental, Social and Governance, taken into account by management strategies aimed at capitalising on the benefits of a sustainable or socially responsible investment.

- 10 -
1. Market structure and development
1.1 Products and market participants: concepts defined in Europe by the Benchmark Regulation The European Benchmark Regulation (BMR), which came into force on 1 January 2018, regulates the provision and use of benchmark indices. It focuses on a broad definition of indices (which recognises the discretion9 of the index administrator), specifically: “any figure: (a) that is published or made available to the public; (b) that is regularly determined: (i) entirely or partially by the application of a formula or any other method of calculation, or by an assessment; and (ii) on the basis of the value of one or more underlying assets or prices, including estimated prices, actual or estimated interest rates, quotes and committed quotes, or other values or surveys”. 10 This definition is therefore in principle not limited only to benchmarks used as underlyings or as a reference for financial products.11 The regulation covers several types of benchmarks, including interest rate, commodity and “regulated data” benchmarks.12 It also introduces the concept of a family of benchmarks provided by the same administrator and determined from underlying data of the same nature. It also categorises the indices according to whether they are “critical”, “significant” or “non-significant”13 (Table 1). However, it focuses more on the market participants than on the products. This is because its main purpose is not to provide a specific framework for constructing and managing indices, but rather to require index providers and administrators (whose many activities may be outsourced) to comply with organisational and governance rules and with the requirement to implement control and transparency systems for users,and in order, in particular, to manage potential conflicts of interest. As EU administrators are subject to authorisation or registration with the competent national authority, a supervisory framework is established on this basis.14 Table 1 – Proportionality of benchmark categories (BMR Articles 20 to 26)
Critical Significant Non-significant Eligibility criterion #1
Does not fall within the definitions of Critical and Significant
benchmarks
Value of financial contracts, financial instruments and investment funds that use it at least equal to: €500 billion €50 billion
Or Or Eligibility criterion #2
Value of at least €400 billion + No substitute benchmark
+ Cessation would have a detrimental impact No substitute benchmark and cessation would have a
detrimental impact Or
Eligibility criterion #3 Index contributors are mostly located in one Member State that has recognised this benchmark as critical.
Source: AMF. 9 “The provision of benchmarks involves discretion in their determination and is inherently subject to certain types of conflicts of interest” (recital 8 of the Benchmark Regulation 2016/1011 of 8 June 2016 “on indices used as benchmarks in financial instruments and financial contracts or to measure the performance of investment funds and amending Directives 2008/48/EC (on credit agreements for consumers) and 2014/17/EU (on credit agreements for consumers relating to residential immovable property) and Regulation (EU) No 596/2014 (on market abuse)”). 10 Article 3 of the Benchmark Regulation. 11 Defined by its usage, a benchmark is “any index by reference to which the amount payable under a financial instrument or a financial contract, or the value of a financial instrument, is determined, or an index that is used to measure the performance of an investment fund with the purpose of tracking the return of such index or of defining the asset allocation of a portfolio or of computing the performance fees” (Article 3). 12 This list of categories is not exhaustive. 13 The criteria defining critical benchmarks are specified in Article 20(1) of the Regulation and those defining significant benchmarks in Article 24(1). Non-significant benchmarks are defined by default. On this basis, Regulation 2017/2446 of 19 December 2017 establishes a list of critical benchmarks consisting at present of the EONIA, EURIBOR, LIBOR, STIBOR and WIBOR indices. For the other indices, Euronext defines, for example, its CAC 40, AEX-Index, BEL 20 and PSI 20 blue chip indices as significant and its other indices as non-significant. 14 Note: The European Supervisory Authorities’ (ESAs) reform has transferred responsibility for critical benchmarks to ESMA, which will authorise and monitor the use of critical EU benchmarks and approve third-country benchmarks for use in the European Union.

- 11 -
In this respect, the BMR covers all activities related to the provision of indices and the contribution of input data for their calculation, dissemination and use by end investors. In so doing, it provides a structure for the relationships between market stakeholders, and its terminology serves as a reference. In this case, the regulation specifies the position of the input data contributor upstream and the position of the benchmark user downstream. Crucially, the regulation defines the administrator as “the natural or legal person that has control over the provision of a benchmark and in particular administers the arrangements for determining the benchmark, collects and analyses the input data, determines the benchmark and publishes it”.15 The regulatory concept of benchmark administration therefore covers a wide range of activities, from design and development to calculation and publication.16 In this context, the administrator may “outsource to a third party one or more of those functions, including the calculation or publication of the benchmark, or other relevant services and activities in the provision of the benchmark”. The non-regulatory concept of index “promoter” provides a way, in what follows, of referring more specifically to the upstream functions of promotion and index development, with the calculation and dissemination/publication being regarded here as subordinate, technical and being able to be delegated. The “index provider” means “a natural or legal person that has control over [...]: (a) administering the arrangements for determining a benchmark; (b) collecting, analysing or processing input data [...]; and (c) determining a benchmark through the application of a formula or other method of calculation or by an assessment of input data provided for that purpose”.17 The supervisory framework is assessed in particular in light of the multiple authorisation requirements for index administrators (Box 1). As a secondary consideration, a contributor is said to be “supervised” when it provides an administrator with the data required for determining an index, and the data is provided for that purpose, and otherwise unavailable to the administrator. The index user also falls within the scope of supervision insofar as the index user is required to maintain a list of the benchmarks it uses and identify those that are approved or not by ESMA. The provision of indices is a global market, as reflected in the scope of activities of market participants such as MSCI in the US and the FTSE in the UK.18 The BMR’s requirements are therefore also intended to apply to third-country index administrators. Three mechanisms are applicable: recognition by the authorities of equivalence in Europe of the framework applied in the third country in which the index administrator operates; a mechanism for prior recognition of the administrator; or endorsement of third-country benchmarks by EU index administrators on a case-by-case basis.19 In the absence of a similar regulatory framework to the BMR outside the EU,20 the implementation of an equivalence mechanism remains at this stage theoretical.21
15 Recital 16 of the Benchmark Regulation. 16 Note: Index “producer” and “administrator” are used interchangeably in the following/as follows. The producer, in the broadest sense, is therefore not restricted to design/promotion activities upstream of the production chain (just as the administrator is not restricted to administrative/technical management activities downstream). 17 Article 3 of the Benchmark Regulation. 18 This significance is measured in particular by the amount of assets managed by institutional investors and using these indices as an underlying reference. For example, in a survey of 153 pension funds in 25 countries with €2.9 trillion in assets under management, CREATE (2019) considers that 32% of their portfolios are passively managed (“traditional indexed funds [are] used by 48% of respondents, segregated accounts by 38% and ETFs by 23%”). 19 An administrator in the EU must therefore have the necessary expertise to monitor the index-providing activity of the third-country entity and be able to effectively manage the associated risks (see AMF Markets and Risk Outlook (2019)). 20 Within the EU, the BMR aims specifically to reduce the differences in interpretation recognized by the IOSCO (2013) principles for financial benchmarks. “since those principles provide a certain flexibility as to their exact scope and means of implementation, Member States are likely to adopt rules at the national level which would implement such principles in a divergent manner” (Recital 3). 21 Note: A memorandum of understanding (MoU) was signed by the Australian ASIC and ESMA on 21 October 2019 which implements a European Commission Equivalence Decision (EU 2019/1274) of 29 July 2019.

- 12 -
Moreover, the legal regime governing the marketing of index-linked products applies primarily to two types of licence agreements:
- agreements based on the intellectual property of indices, which charge for the issue of financial products that refer to them. These are generally based on the right to use the index’s trademark, but also
- licence agreements for the provision of data and information relating to the index (history of the index level, information on its components (weightings, selection criteria, etc.) and other relevant information22 (changes in composition, securities transactions, etc.).
22 Note: Index producers are data consumers and therefore, in the absence of any affiliation with intermediaries producing the required data, enter into data acquisition agreements relevant to calculating their indices.
Box 1 – Authorisation of index administrators under the BMR
The supervisory framework establishes procedures for the authorisation or registration by the competent authorities of index administrators. These procedures differ in the granularity of the information provided: registration requires information of the same nature but more concise, reflecting the proportionality of the requirements (Table 2).
Table 2 – Authorisation or registration of administrators
Entities administering: Supervised entity (in the sense of Article 3.1(17) of the BMR**)
Non-supervised entity (in the sense of Article 3.1(17) of the BMR**)
at least one critical benchmark Authorisation Authorisation one or more significant benchmarks (but no critical benchmarks)
Registration unless index provision is affected by a sector regulation applicable to the entity Authorisation
non-significant benchmarks only Registration Registration
Source: AMF.
Affected entities. The procedure is generally* similar to that of an authorisation extension for an investment services provider or an investment management company. Furthermore, the provision of indices by management companies must be clearly related to their core business (AMF Position-Recommendation 2012-19).
Information on indices. The description of benchmarks and/or families of benchmarks provided or under development describes in particular the underlying markets and the economic reality they measure. It provides information on their type (e.g. derived from regulated data, interest rates, commodities, etc.), their category (e.g. critical, etc.) and the sources used to determine their underlying notional value. The information on this data must demonstrate that it sufficiently represents the reference universe in a reliable manner and, where applicable, indicate discretion in its use (Article 11) and the role of the contributions (see Article 15 on the requirements applicable to contributors and their code of conduct). Administrators may exempt themselves from certain requirements for significant (but not critical) benchmarks (Article 25) or non-significant benchmarks (Article 26).
Information on methodologies. This must allow the assessment of compliance with the requirements of Article 12 to be assessed, and in particular provide information on the key aspects of the methodologies, on their possible publication (and method of publication), on the arrangements in place when the underlying data no longer allows the index to be calculated accurately and reliably (Article 12(3)), on the processes for validating and revising the methodologies and for consultation in the event of significant changes (Article 13). In accordance with the provisions of Article 27, further specified by ESMA’s technical standards, the administrator’s benchmark statement supplements this information.
Based on the information provided, the procedure also considers in particular:
- Governance arrangements, assessed in particular in view of the index administrator’s organisation and structures for managing conflicts of interest, and, where appropriate, the arrangements for outsourcing operations – including intra-group (identification of responsible bodies). The description of corporate governance (Article 4(1)) includes, in particular, information on the experience of the employees responsible for the provision of a benchmark (Article 4(7)(a)).
- Conflict of interest management, assessed in particular with regard to compliance policies (principles and rules for identifying, managing and disclosing conflicts of interest) and their effectiveness. In particular, conflicts resulting from discretionary assessments and/or expert judgement (Article 4(1)), from links with activities of other group entities (provision of data, use) (Article 4(1)) are considered. Any part of an administrator’s business that may create an actual or potential conflict of interest must be operationally separated from the provision of indices (Article 4(2)) and the compensation of persons (salaried or seconded) involved in that business must not be directly linked to providing the index (Article 4(7)(b)).
- The effectiveness of internal control, the supervisory committee and the accountability framework (e.g. record keeping, internal audit, management of complaint procedures).
- Risk management (strategic, operational, regulatory), business continuity plans and operational resilience. They are assessed in particular against the measures applicable in the event of changes to, or cessation of, a benchmark (Article 28(1)).
- Outsourcing of activities. External service providers and the tasks delegated to them must be identified and reported (Article 10(3)(b)) and the ability, capacity and authorisation of external service providers must be verified (Article 10(3)(a)). The outsourcing arrangement must ensure that it does not significantly compromise the administrator’s control over the provision of the benchmark and its supervision (Article 10(1)). The outsourcing agreement must not contain any clause which may call into question the liability of the administrator (Article 10(2)) and may be terminated where necessary (Article 10(3)(g)). The administrator must retain the necessary expertise to effectively supervise the outsourced tasks and manage the associated risks (Article 10(3)(d)) and must take appropriate action if the service provider does not carry out the outsourced tasks effectively and in compliance with applicable laws and regulations (Article 10(3)(c)). Any event that could significantly influence the ability to carry out the outsourced functions effectively and in compliance with the applicable laws and regulations must be disclosed (Article 10(3)(e)). The administrator must define reasonable steps and contingency plans to avoid undue operational risks related to the participation of the service provider in the benchmark determination process (Article 10(3)(h)).
*None of French administrators is a “pure player”. **As listed: banks, investment firms, (re)insurance firms, UCITS or AIF fund managers, institutions for occupational retirement provision, lenders for the purposes of credit agreements, market operators, CCPs, trade repositories.

- 13 -
1.2 Supply: Emergence of a highly concentrated industry providing indices
1.2.1 Background Initially focused on listed shares at the end of the 19th century, the provision of financial indices gave rise to a highly concentrated sector in the 20th century. This was initially led primarily by media groups (Dow Jones, Standard & Poor’s, Nihon Keizai Shinbun) and then by stock exchanges (the FTSE – a joint venture between the Financial Times and the London Stock Exchange – and national stock markets). MSCI is an exception in this regard: it was created in 1986, following the takeover by the investment bank Morgan Stanley of Capital International, a specialised index producer operating since 1968. This division of the bank was floated on the stock exchange and sold in 2009. The main challenge for established players comes from data providers such as Bloomberg and Refinitiv, which are developing an offer of financial indices that goes beyond index-related functionalities and services, in an environment where the business models of stock markets and data vendors tend to converge (see, for example, the takeover of Refinitiv by the London Stock Exchange). New entrants – such as the German company Solactive – are, therefore, rather the exception (see 1.4).
1.2.2 Activities and industrial organisation Identifying the stages of the process for producing and providing an index (Diagram 1) helps to describe, outside the strict regulatory framework, the industrial organisation of the players involved.23 By specifying the nature of the activities carried out and services provided, a typology of index administrators’ business models can be defined and the main risks and strategic issues identified.
23 While its boundaries need to be clearly defined, index provision is an industry in its own right, as confirmed by the creation in 2012 of the Index Industry Association, which brings together 14 major, mainly US-based, players in the sector.
Box 2 – Identification of index administrators and indices The identification of index administrators is provided for by Delegated Regulation (EU) 2018/1646 of 13 July 2018 using information that must be provided as part of an application for approval or registration in accordance with Article 34 of the BMR. The delegated regulation stipulates a requirement for the reporting entity to provide a Legal Entity Identifier (LEI) only in the case of an application for authorisation. The requirement therefore does not apply to applications for registration, for which identification of the reporting entity is accompanied by an “indication of the identity of the person or persons responsible for the approval and maintenance of the policies and procedures” (Article 3) while specifically taking into account cases where entities are already “supervised by the same competent authority for other activities than the provision of benchmarks”. Regarding the identification of index-linked products, the Delegated Regulation (EU) 2018/1645 of 13 July 2018 on the recognition of third-country administrators* stipulates that “a list of all benchmarks provided by the applicant which are already used in the Union or intended for future use in the Union and a description of them should be provided within the application for recognition”, “with the final objective of their inclusion in the register of Article 36 of [the BMR]” (Recital 8). The information requested also aims to collect “where available, their International Securities Identification Numbers (ISINs)”. Of the 65,739 indices identified by ESMA as of 22 March 2019 as being administered by S&P Dow Jones Indices LLC, 1,280 had an ISIN code. Since indices, unlike index-linked products, are not subject to accounting rules for valuation purposes, there is generally little standardisation in their identification. They are therefore a secondary and generic feature of the Classification of Financial Instrument (CFI) Codes of the ISO 10962:2015 standard. These codes assign a generic “Indices” attribute to the “Financial Futures” and “Options” categories, but do not provide a more specific identification of the index. Systematic identification of indices therefore remains essentially dependent on market practices (administrators’ internal codes, data providers’ proprietary tickers, etc.). It should be noted here that the implementation of the BMR encourages the systematic identification of the indices actually marketed by supervised entities, giving rise in addition to a dedicated offer of consultancy services. In this respect, it seems that the inability to systematically identify indices more specifically affects certain sell-side operators who can administer up to tens of thousands of indices, whereas buy-side operators usually consider a significantly smaller number of indices (see RIMES (2019) “European Benchmarks Regulation: Sell Side in the Crosshairs”). *Note: As part of Brexit preparations, the UK FCA also announced the launch of a UK Benchmarks Register.

- 14 -
a) Data provision Originally based on listed share prices, the production of indices is closely dependent on access to the data needed to calculate them. This relationship explains the historical importance of stock exchanges as index promoters. With the development of indices based on over-the-counter trading prices, or even interest rate quotes (IBORs) or involving intellectual property, intermediaries operating on the relevant markets (Goldman Sachs Commodity Indices (GSCI), JP Morgan’s bond and credit indices, EMMI for EONIA and EURIBOR, etc.) and companies specialising in producing the data needed to calculate indices, particularly smart beta or ESG indices (e.g. Edhec Risk, Research Affiliates, Vigeo Eiris, etc.) have become index administrators. Since investment strategies – particularly strategies based on the use of artificial intelligence and big data – are increasingly using sources of information (on order flows, secured transactions, duration and ratings of outstanding bonds, short sales, volatility surfaces, CDS pricing, derivative trades and positions, etc.), banks and financial intermediaries are likely, as a result, to develop commercial offerings providing data relevant to developing and calculating indices.24 Moreover, the growth of the main data vendors (e.g. Bloomberg, Refinitiv) has led them, firstly, to offer access services to indices and index data marketed by specialist promoters and, secondly, to include, in their range of functionalities , services enabling their clients to calculate and manage “proprietary” indices based on the data disseminated. Lastly, as index distribution channels, they tend to promote their own indices.
b) Administration: promoting, calculating and managing indices Index administration comprises two main activities: firstly, the design and promotion of indices – marketing and research, which provide the basis for developing index methodologies; secondly, the related calculation and management of indices implementing these methodologies and managing the risks. Even when carried out by the same company, these activities are distinct. Often carried out in collaboration with clients, the design and promotion activities address the structuring needs of financial products and provide the indices’ intellectual property. The calculation and management activities are based on largely automated processes and infrastructure and therefore benefit from significant economies of scale. Since these activities are exposed to operational risk – e.g. from errors or discontinuity in calculations – they capitalise greatly on the reputation of the promoter’s brand and benefit thereby from significant barriers to new entrants. Although the main players integrate the two activities, the benefit of economies of scale may also lead administrators to offer index calculation and management services to third parties that outsource this function or to develop “white label” indices.
c) Dissemination of index information The dissemination of index information generally takes the form of two main types of data flows, with varying degrees of granularity: index level, generally in the form of time series accessible to the public;25 more precise information, particularly within the reference universe, the index components and their relative weights, the criteria for selecting the components (the selection and calculation methodology can theoretically be replicated) and the various factors affecting the continuity of the index (periodic rebalancing, technical factors, methodological developments, etc.).
d) Structuring and issuance of index-linked products Direct users of indices (as opposed to end investors) are primarily financial intermediaries that issue financial products that refer to the indices and benchmarks. The BMR identifies two main types,26 namely those indices that are constitutive of the product (determining its value and/or
24 See Risk.net “UBS names group head to advance data push”; 29 November 2018. 25 At intraday frequency, full historical index information is generally provided for a fee through data feed services. 26 A benchmark user is any European supervised entity subject to specific requirements that: (i) issues financial instruments referring to one/an index or a combination of indices; (ii) determines payments related to a financial instrument or contract referring to one/an index or a combination of indices; (iii) is party to a financial contract referring to one/an index or a combination of indices; (iv) offers a borrowing rate calculated as a spread or margin

- 15 -
payment flows) and those that are not constitutive of the product but are referred to and useful for evaluating its performance.
Diagram 1 – Activities associated with the production of indices
Source: AMF.
Depending on the nature of the reference made to the indices, a distinction is made between:
- Passive management funds replicating “investable” indices, i.e. investing in the assets of a market (universe) that the index represents in order to replicate its performance. These include investment funds but also indexed debt instruments (notes/ETNs), often listed (Exchange-Traded Funds or ETFs and other Exchange-Traded Products or ETPs);
- Derivatives on indices and reference rates, listed (futures, options) or unlisted (options and warrants, swaps, etc.), in some cases accessible or dedicated to retail investors (CFDs, warrants, certificates, binary options, etc.). These products stipulate future payment flows based on the expectations of the contracting partiesand, where applicable, conditionality criteria (options, CDSs);
- A variety of structured products whose specified risk/return profile (formula) uses one or more underlying benchmarks, particularly index-linked benchmarks. Combining several components, structuring generally delivers the performance of a particular asset class (or a multiple thereof) and/or some forme of capital protection, along with conditionality (optionality). The intermediaries that create them use a variety of legal structures: “formula” funds, debt instruments (e.g. EMTNs, certificates), financial contracts, derivatives, structured loans or deposits, 27 and sometimes list them on stock exchanges;
- Loan agreements (indexed rates) whose rates are determined on the basis of indices or reference rates;28
- The use of indices as an external reference (benchmark) to evaluate an active management service ex post,29 to calculate, where appropriate, the related fees (e.g. (out)performance fees).
on one/an index or a combination of indices; (v) measures the performance of an investment fund by using one/an index or a combination of indices in order to replicate the performance of that index or combination of indices or to define the asset allocation of a portfolio or to calculate performance fees. 27 The concept of structuring refers to combining several components (or by-products) in a single financial product – typically one delivering the performance of a particular asset class or providing capital protection, and the other providing conditionality (optionality). 28 This includes the use of reference rates, e.g. money market reference rates, for “absolute return” funds. 29 Demartini A., N. Mosson (2018); Closet Index Funds: a contribution to the debate in Europe; AMF Risk & Trends.

- 16 -
The use of indices as (public-good) market information – an indicator of cyclical, market or sector economic performance – is a positive externality that is not explicitly recognised.
e) Distribution to investors
Index products are marketed, often via stock exchange platforms, to institutional investors (own-account or third-party management) or retail investors, but also to financial intermediaries operating on their own account, typically as part of trading or hedging strategies.
1.2.3 Supply structure and proliferation of indices In practice, the content of the index offering is strongly influenced by:
- Access to the data required to calculate the index – depending on the type of information and the market in question;
- The infrastructure providing the technical capability to administer and manage risks (with economies of scale);
- Research and marketing capabilities – in innovative markets. The development and maturity of the market for listed equity indices has led promoters to develop index management processes and infrastructure that limit the operational (and reputational) risks typically associated with error or disruption in the calculation of indices,30 and allow them to benefit from significant economies of scale, resulting in high levels of industry concentration and barriers to entry. However, as access to equity information and data is generally open, there is some competition in particular between the main international promoters (MSCI, FTSE Russell) and more regional promoters (S&P Dow Jones, STOXX, Euronext, etc.). Given this environment, promoters have developed very broad ranges of equity indices, including “box style” families of products that combine criteria relating to the size of listed companies (floating capitalisation), their geography (country, region) and balance sheet characteristics (“style”: growth or value stocks). Due to the sustained pace of introducing new indices, these ranges are constantly being expanded as the research and marketing phases come to an end. The expansion of the ranges now involves three (not necessarily exclusive) key areas: the expansion of equity index ranges to reflect new exposure and weighting factors (e.g. “smart beta”) and non-financial criteria (ESG); the expansion into asset classes other than equities; and the development of strategy indices. This has resulted in a proliferation of the number of indices. The range of index-linked products was initially focused on “traditional” indices, generally cap-weighted, 31 covering broadlyequity market securities (Russell 3000, etc.) or large cap (blue-chip) companies with the highest capitalisation (e.g. S&P 500, EURO STOXX 50, CAC 40). Funds replicating these indices were primarily geared towards building portfolios that were representative of the market. They continue to focus a large proportion of the holdings of index-linked products on a limited number of highly visible indices (Table 3). In principle, investment in these products is intended to be held over a/the longer term (buy and hold) than investment in products with less diversified (and actively managed) risk factors, and they are therefore likely to account for a less than proportional share of trading volumes (e.g. on ETF secondary markets). However, when they are used for liquidity management purposes, these products are also heavily traded.32
30 Although rare, index calculation errors have not historically been recorded, but can occur. The main cause is exogenous, involving information flows related to the valuations of the components of an index (e.g. trading suspensions, for example in emerging markets). Problems with valuing components may also arise, as observed during the stock market flash crash on 10 May 2010 (CFTC-SEC (2010)). There may also be instances where parameters calculated by the index administrator (e.g. the float calculation error by FTSE Russell on 4 September 2018) or the calculation of the index itself may be to blame. 31 Two notable exceptions are the Dow Jones Industrial Average (created in 1898) and Nikkei 225 (created in 1949) flagship indices, calculated as equally weighted arithmetic averages of their constituent securities. 32 Arbitrage between derivatives (especially blue chip indices), ETFs and underlying securities is therefore also an important motive/driver for trading (see Hasbrouck J. (2003) and section 2.1.2.3 below).

- 17 -
Table 3 – Equity Index Futures: Top 10 negotiated contracts (2018)
Contract Size of contract Stock Exchange
Volume processed Notional amounts Open positions Number of contracts
Ann. var. (%)
Million USD
Ann. var. (%)
Number of contracts
Ann. var. (%)
1 Bovespa Mini Index Futures
Ibovespa index value x BRL 0.20 (index point value)
B3 SA - Brasil Bolsa Balcao 706,224,217 143 - - 142,558 101
2 E-MINI S&P500 Futures
S&P 500 index value x USD 50.0 CME Group 445,199,191 22 60,771,917 36 2,694,884 -11
3 Future on EURO STOXX 50
EURO STOXX 50 index value x EUR 10.0 Eurex 318,635,725 13 12,194,697 4 3,754,740 9
4 Nikkei 225 Mini Index Futures
Nikkei 225 index value x JPY 100.0
JPX Group 273,327,463 25 5,510,634 39 1,279,710 87
5 E-MINI NASDAQ 100 Futures
Nasdaq-100 index value x USD 20.0 CME Group 124,195,504 79 17,267,680 113 203,989 -27
6 RTS Index Futures
RTS Index value x USD 2.0 (rouble equivalent)
Moscow Exchange 118,174,805 -12 247,366 -17 206,738 -40
7 FTSE China A50 Index Futures
SGX FTSE China A50 index value x USD 1.0 SGX 88,028,881 31 - - 878,618 26
8 Future on EURO STOXX Banks
EURO STOXX Banks index value x EUR 50.0 Eurex 73,510,289 32 474,322 10 1,876,103 29
9 E-MINI $5 DOW Dow Jones Industrial Average (DJIA) index value x USD 5.0 CME Group 60,324,164 84 7,507,986 111 73,727 -49
10 KOSPI 200 Futures
KOSPI 200 index value x KRW 500,000
Korea Exchange 58,939,222 28 3,942,248 7 353,406 10
Source: WFE/IOMA, AMF.
The very strong growth in the number of indices is supported by a survey conducted by the Index Industry Association (IIA) of its members,33 which counted no less than 2.96 million financial indices at the end of June 2019.34 An increase in the number of indices was initially the result of the systematic cross-referencing of the characteristics of the components of equity indices – size (small, mid, large), style (growth/value), geographical area (country, region), etc. The number of equity indices is now out of all proportion with the 52,463 companies listed worldwide.35 However, according to the IIA, the recent trend shows an increase in the number of bond indices, especially sovereign and corporate bonds. According to this source, the number of equity indices fell by 3% between 2017 and 2018, mainly due to a reduction in the number of sector indices. However, they do support the perception that indices and index-linked products are important drivers of innovation, in particular: - to support the search for yield in the current low interest rate environment – e.g. on illiquid asset markets (commodities, residential and commercial real estate, leveraged loans, private equity, bonds, including corporate, high-yield, CoCo and cat bonds) – and the trend towards the “privatisation” of the financing of the economy;36 - regarding factor/smart beta investment, including in new asset classes;37 - related to the development of ETFs, including as an alternative to index derivatives;38 - incorporating more discretionary or active management features.39 33 Bloomberg Indices, CBOE Holdings, Center for Research in Security Prices (Chicago), China Central Depository & Clearing Co., FTSE Russell, IHS Markit, ICE, Morningstar, MSCI, NASDAQ OMX, S&P Dow Jones, Stoxx, Tokyo Stock Exchange, and Hang Seng Indexes. 34 These figures remain open to interpretation, including their coverage (if these indices are used) and the structure of the population. They also need to be reconciled with data from the main promoters of indices and index-linked products. According to the Financial Times, MSCI administers approximately 200,000 indices. According to BlackRock, there were 500 ETPs in Europe in 2007, and 2,400 in 2019. Conversely, there seem to be many proprietary bank indices (underlying indices of structured products, etc.). 35 Number of domestic and foreign companies listed on exchanges at the end of June 2018; source: WFE. 36 Private financing (e.g. through unlisted shares) is defined by opposition tothe financing by so-called public markets. See Rosov S. (2018), OECD (2019). 37 EDHEC Risk (2018). For example, Amundi offers smart beta bond indices. 38 Liquidity considerations are of paramount importance here. While CME (2017) “Conversations With the Buy-Side: Futures and ETFs” points out that “while ETF volume and assets under management (AUM) have grown considerably, the liquidity available in the futures market for S&P 500 equity index exposure towers over the liquidity in comparable ETF listings”, Madhavan A., U. Marchioni, W. Li, D. Yan Du (2014) shows that ETFs are increasingly becoming an advantageous alternative to index futures. 39 Note: This development is distinct from that of providing index-linked products whose structure, or formula, incorporates margins of/for discretion, in particular active ETFs or ETFs with actively managed investment funds, and index-linked debt products.

- 18 -
The growing number of indices seems likely to reduce the clarity of the product offering. This clarity is primarily affected by the lack of a systematic index identification (data referentials, Box 2), which would make it easier to carry out systematic analysis and comparisons. It is also affected by the lack of harmonisation of naming, categories and classifications in use when, at the same time, the number of mutually non-exclusive criteria needed to characterise the indices is increasing. A major difficulty here is to identify the optimal structure of these nomenclatures. In particular, the aim is to strike a balance between the reference to the underlying asset classes40 and the reference to the strategies or rules for managing exposures to these assets. 41 In an environment where the “customisation” of indices is frequent (see Table 4), there is a growing trend towards including, in the formula and in the calculation of indices, factors characterising management rules (see 1.2.4 below). The result is a risk of confusion between nomenclature used for indices and the nomenclature used for index-linked products.42 It is therefore important to clarify the distinction between the informational content of the indices and the use made of that content (product structure/wrapper). An additional practical difficulty relates to the need for nomenclatures to remain stable over time. For example, changes to sector nomenclatures for equity indices can bear significant market impacts.43 Table 4 – Distribution of the number of funds and fund assets by US index (USD million)
Average Standard deviation
Percentile Number of indices 10th 25th 50th 75th 90th
Number of funds by index 5.32 38.45 1 1 1 1 3 603
Net assets by index (USD mn) 16,130 170,401 5 36 267 1,641 9,166 603
Source: Robertson (2018) based on Morningstar Direct data as of 26 July 2017. The sample considers US equity funds (open-end, closed-end and ETFs) using a US equity benchmark and providing information on the underlying index. A total of 603 US equity indices are used as the benchmark for 3,208 mutual funds (representing 9,021 unit classes).
1.2.4 Increasing complexity of indices The increase in the number of indices and the level of innovation they embed also results in their becoming more complex. To begin with, “traditional” stock market indices (Box 3) are not without their complexity. Changes in the representativeness of a given index requires taking the following into consideration:
- The index’s reference universe/market. The recent inclusion of China in the MSCI family of indices, for example, has renewed the questioning about the desired stability of index components’ selection criteria;44
- The use of “proprietary” criteria: classifications, free float capitalisation, definition of “styles”, etc. For example, the method used to calculate floating capitalisation varies from one index producer to another, with potentially substantial impacts on the weighting of indices.
In general, the quality of a financial index is assessed using criteria of representativeness (of a universe or market), investability (actual ability to invest in a portfolio replicating the
40 It should be noted that the BMR considers/covers a wide range of indices, including critical reference rates. 41 This debate is related to that of relevant hedge fund classifications (see for example Das N. (2003)). 42 According to the DTCC “Systemic Risk-White Paper: The next crisis will be different” of 6 September 2018, “The exposure associated with the proliferation and increasingly esoteric nature of certain ETFs should be managed more closely to match their specific risk profiles (…). In light of the above, we support the development of an industry-wide classification system for the broad category of ETPs that identifies the unique attributes of products and that will help investors better differentiate between the risk/return profiles of ‘plain vanilla’ vs more complicated products”. 43 For example, in November 2018, the change in the GICS classification (renaming the sector from “Telecommunication Services” to “Communication Services” and expanding it to include Internet companies (Facebook, Alphabet/Google) (formerly “Information Technology”) and media companies (formerly “Consumer Discretionary”); moving e-commerce companies (especially Amazon) from “Information Technology” to “Consumer Discretionary”) had a significant impact on the share prices of Amazon, Disney, Facebook and Google (I&PE (2019a)). 44 This obviously raises questions about the governance of changes in methodology, the ins and outs of the decision making, and here in particular the consideration given to the specific framework of the governance model used by the newly included listed companies. To date, implementing this decision has had no observable disruptive impact on market operations.

- 19 -
performance of the index) and transparency to investors or the public in terms of methodology and calculation (ability to replicate the methodology). In this context, assessing complexity involves considering aspects related, firstly, to the intrinsic intelligibility of the methodology and structure of the product and, secondly, to the margin for discretion in its management, and its transparency. In this regard, Demartini A., N. Mosson (2019) highlights in particular that the decline since 2010 in the complexity of structured products marketed to the public has been offset by an increase in the number of references to indices incorporating complexity factors. Positive complexity criteria have been formulated in France jointly by the ACPR and the AMF45 to limit retail clients’ access to products that may lead to a poor understanding by the client of the risk involved and render the proposed financial instrument incomprehensible. The supervisors’ policy specifically considers index complexity as one of the factors contributing to the complexity of a financial product. 46 It takes into account the intrinsic complexity of the underlying assets of structured products in assessing their complexity and specifically considers the role of indices in this regard. The complexity of an index is accordingly evaluated in a binary method (it is either complex or non-complex) according to the number of “filters” required to calculate its composition and, consequently, evaluate its performance. Blue-chip benchmarks (e.g. CAC 40, EURO STOXX 50, etc.) and, by way of exception, ESG indices are considered non-complex. The filters then examine, in particular, the liquidity of the assets, the number of asset classes, the exposure to foreign exchange risk and the way in which dividends are taken into account. If no information is available on the index, it is considered complex. Based on numerous specific examples, the AMF draws professionals’ attention to the following in particular:47
- “a non-systematic index whose components are changed more than once a year, associated with at least one element of complexity [...]”;
- “an index with many different types of filters (a liquidity filter, a dividend filter and a market responsiveness filter in the example) and/or with filters that are difficult for a retail investor to observe”;
- “the number of mechanisms included in the formula for calculating the gain or loss”; - “the discretionary nature of the index, where the entity is not authorised for collective
or individual investment schemes”. A wide variety of initiatives and regulatory work is under way. The European Commission is carrying out a number of initiatives in sustainable finance, foremost among which is an amendment to the BMR that strengthens the transparency requirements of benchmarks whose methodology includes ESG criteria and introduces two so-called "climate indices" (the EU Paris-aligned Benchmark (EU PAB) and the EU Climate Transition Benchmark (EU CTB)). Based on the measurement of carbon emissions, they aim to set portfolios on the path towards decarbonisation and align them with the objectives of the Paris Agreements. Recommendations on the methodologies used by these indices and the transparency applicable to benchmarks including ESG criteria, made by a Technical Expert Group (TEG), will serve as a basis for the delegated acts to be subsequently adopted by the Commission.48 At the same time, a taxonomy is being developed to define the sustainability criteria for a particular economic activity, and therefore for an investment. This will provide the basis for specifying the transparency requirements (Disclosure Regulation) of financial products that include sustainability factors. It should be noted in particular that this Regulation requires any product making a low-carbon promise and based on an index to follow either an EU PAB or an EU CTB. Work is also under way in other areas. For example, the regulatory qualification of crypto-asset indices is still under discussion (Reiners L. (2018)).
45 See the AMF policy on the marketing of complex financial instruments dated 15 October 2010 and its update dated 12 January 2017. 46 The measure of product complexity mainly reflects the complexity of the formula, followed by the complexity of the underlying assets (e.g. the index). 47 See Demartini A., N. Mosson (2019). 48 The recommendations of this group, the successor of the High-Level Expert Group (HLEG) (Thimann C. (2018), were published on 30 September 2019.

- 20 -
Box 3 – Index Production: Example of Equity Indices The stages involved in producing traditional capitalisation equity indices can be described broadly as follows: - Research and marketing identifying the uses of the index; development of the methodology (stock picking, weighting and calculation); governance (independent index review board, review method/frequency and methodological change). - Creation of structured information sources for the index’s reference universe:
The universe of listed companies covered by the methodology defines the set of securities on which an initial systematic data collection is carried out. This stage is crucial for assessing the representativeness of the index. Producers of international indices, for example, highlight their coverage rate of the capitalisation of listed companies in countries covered.
- Additional selection criteria, the calculation or specification of what constitutes a specific (often proprietary) information service provided by the index producer:
Floating capitalisation – since the late 1990s, to promote investability, methodologies have excluded long-term shareholdings from market capitalisation that are unlikely to contribute to the short-term liquidity of a given security. For example, significant holdings (e.g. of more than 5%) of founding families or governments, of treasury shares or shares held by employees or through the company’s pension or employee shareholding funds or schemes, and possibly by certain institutional funds, are excluded. Sector classification - Two main competing sector classifications are in use: the Industrial Classification Benchmark (ICB), developed by FTSE and Dow Jones, whose “product” approach focuses more on products and services, and the Global Industrial Classification Standard (GICS), developed by MSCI and S&P, whose “market” approach considers the cyclical nature of the securities (for example, grouping together food producers and distributors in a non-cyclical sector).
Other criteria may be used to pick stocks, such as:
- geographical criteria - liquidity criteria (trading-day ratio, turnover rate, etc.) - style– typically based on historical or expected price-to-earnings ratios (PER) or earnings per share (EPS) ratios,
price-to-book ratios and/or dividend rates. - Weighting and calculation
The index calculation generally uses an arbitrary base (1,000 at the end of 1987 for the CAC 40) and a formula that weights the share price by the corresponding floating capitalisation. The price index is calculated according to the principle of a chained Laspeyres index of the quoted market price of shares, weighted by the number of shares issued (free float), but is adjusted to ensure the continuity of the index. It thus divides the free float capitalisation by its initial value adjusted by a coefficient taking account the effects of securities transactions and changes in the sample. Rules generally account for possible constraints on the availability of the data needed to calculate the index, in particular share prices. Accordingly they account for trading interruptions that may affect certain securities or, in the case of international indices, differences in trading hours on different stock exchanges, for example.
Securities transactions and other adjustments
Many factors have the potential to affect the continuity of the index. In particular, intraday indices are adjusted between the current day’s opening price of the day and the previous day’s closing price. Many events affecting the securities concerned, referred to as securities transactions, also have the potential to unduly affect the continuity of the index. Some relate to the number of securities in circulation (admissions of new securities, issues of new shares, withdrawals, etc.), others have more technical effects on the value of the securities (splits, divisions and regroupings of securities), others are related to detachments of rights, dividend payments, bonus share allocations, and others to public offers that may be made for the securities.
Table 5 – Effects of securities transactions on index level and adjustment coefficients Transaction type Effect on prices Effect on quantities Adjust.
Coefficient Allocation of a subscription right for new shares to former shareholders
yes, downward no, as long as the new shares are not assimilated / fungible with ? to the old ones
yes
Allocation of bonus shares with immediate assimilation/fungibility
yes, downward yes, upward, by the same percentage as the decrease in prices/share price?
no
Allocation of bonus shares without immediate assimilation yes, downward no yes Inclusion of a new security in the sample yes, upward yes, upward yes Division of the nominal value of a security yes, downward yes, upward, by the same percentage as
the decrease in prices/in a security’s price
no
Regrouping of a security yes, upward yes, downward, by the same percentage as the increase in prices
no
Assimilations of new shares no yes, upward yes Capital reduction by lowering the nominal value no no no Capital reduction by cancellation of shares yes, upward yes, downward, by the same percentage
as the increase in prices no
Source: Davydoff (1998)

- 21 -
1.3 Demand: Rapid growth in the use of indices
1.3.1 Types of index use At first glance, five main types of index use stand out:
a) As an underlying reference for “investable” products – through which the investor acquires a portfolio, whose performance is intended to replicate that of the index;
b) As a reference for futures or derivatives contracts that stipulate future payment flows based on the expectations of the contracting parties and, where applicable, conditionality criteria (options, CDSs);
c) As a reference for loan agreements (indexed rates); d) As a benchmark, in the sense of an external reference, for assessing portfolio
management performance and, where applicable, for setting/calculating related fees; e) As an informational (public-good) benchmark, as an indicator of the cyclical
economic performance of a market or sector. The first four uses reflect the definition of “use of a benchmark” provided in Article 3 of the BMR. The fifth use reflects the fact that indices can also fulfil public information functions.49 This use is not explicitly addressed in the BMR provisions because it partly reflects informational externalities that are difficult to measure, for example where indices contribute to the dissemination of economic information to the public or where they measure aggregate performance, or they are used to define representative universes and samples50 of financial assets that represent the wealth of economic agents.51 They also help to provide information on the observed and expected profitability of the activities financed or reflect the perception of observed or anticipated market risks (volatility indices) (see section 2.1.2.1).
1.3.2 Fundamentals of index investing: from indices replicating the market portfolio to factor indices A recommendation to invest in a “market portfolio” is in academic research, namely in the Capital Asset Pricing Model (CAPM) (Annex 2), which is at the root of a considerable boom in index-linked management. Apart from its primary motivation, index-linked management has in practice also had two distinctive advantages for investors: methodological transparency, which reduces the asymmetry of information related to providing the portfolio management service, and the relatively low management fees, which are particularly apparent in a low yield environment (low interest rates) via their impact on fund performance.52 Evidence of this boom can be seen in the growth of assets under management in ETFs (Figures 1 and 2), and among these, funds replicating blue chip indices (shares of large capitalisation companies weighted by capitalisation (cap-weighted)).
49 Note: Some hedge fund indices, for example, are non-investable (see discussion by L’Habitant F-S. (2006)). 50 This representativeness is far from trivial and needs to be specifically assessed. For example, the sector classifications of indices (see Box 3) differ from one another and do not correspond to the sector classifications used in the national accounts. See Burnham T., H. Gakidis, J. Wurgler (2017) – Investing in the Presence of Massive Flows: The Case of MSCI Country Reclassifications for an assessment of the impacts of changes to classifications. 51 An example of using indices as a public good is their use by portfolio managers for calculating bond trading fees to meet the transparency requirements of the PRIIPs Regulation. Although the indices are not used as an investment vehicle or benchmark, this calculation uses them to identify the relevant market segments and the financial securities that comprise these segments and to provide representative samples that are used as a basis for calculating average benchmark fees. 52 BlackRock (2017) notes here the role of charging for investment advice: “This has resulted in some jurisdictions removing fund commissions from retail financial advice charging structures and a move to fee-based advice. The shift to fee-based structures risks excluding smaller retail investors, potentially creating an advice gap (FCA (2016)). One of the solutions suggested to fill this gap is the use of digital advice services”.

- 22 -
Figure 1 – Total Assets and Number of ETFs and ETPs Figure 2 – Assets and Number of European ETFs and ETPs
Source: ETFGI Table 6 – Domiciled European ETFs Figure 3 – Assets of Passive Equity Investments in US (USD bn)
Source: Lipper, AMF calculations (Benhami K., C. Le Moign (2017)) Source: Fichtner J., E. Heemskerk, J. Garcia-Bernardo (2017)
In practice, an index manager strikes a balance between representativeness and investability (Schoenfeld (2006), L’Habitant F-S. (2006)). In particular, a manager must take market liquidity conditions into account ,optimise their management to take into account transaction costs incurred via replication (building up the portfolio of index securities) and/as well as subsequent changes in index composition. They typically replicate the index partially, i.e. optimise the replication variance (tracking error) under a transaction cost constraint, which is done by minimising tte sample size (sampling) of the index components in which they actually invest. Generally They also seek to offset these costs by lending the securities in their portfolio.53,54
53 Certain ETFs in the US have zero management fees. However, the available information does not allow us to determine the relationship between the level of fees and the distribution of income from securities lending that promoters are likely to use to finance their activities. 54 Note: Alternatively, the manager may use “synthetic” replication through swap contracts where the performance of the index is “delivered” by a counterparty in return for compensation (spread). In theory, this can be interpreted as a management delegation, in which case the swap counterparty is now in charge of optimising the management of the portfolio of assets delivering the required performance.
Country of domicile -
Number of ETFs
Assets (EUR bn)
Net fund inflows (EUR bn)
Change in assets (%)
16Q3 2015 20
2015 16Q3/15 15/14 Ireland 824 273.6 230.9 44.1 35.9 22 25 Luxembourg 632 81.0 82.7 - 6.3 18.3 - 127 35 France 381 62.3 62.6 5.2 10.1 - 44 24 Germany 112 47.2 49.6 2.2 7.6 - 63 24 Other 436 23.8 16.9 0.2 0.6 - 25 0 Total EU 2,385 487.9 442.7 49.6 73.2 - 32 73.2

- 23 -
On the other hand, a significant body of literature55 criticises investment in the market portfolio. In particular, it highlights the limits of weighting portfolio securities by capitalisation, which introduces a size bias and thus a systematic risk that can affect (bias) the portfolio’s risk/return profile. This criticism gives rise to a change in management recommendation in favour of active management of factors identified as relevant. This promotes the development of factor strategies (smart beta) that optimise exposure to different factors: size (proposal for alternative security weightings), return (e.g. distinguishing between growth and value based on the book-to-market ratio), momentum (persistence of returns) or volatility (minimum variance) 56 (Annex 2). An alternative to investing in the market portfolio,is sustainable investment,which re-examines the criteria for valuing companies by complementing accounting data with information basednon-financial criteria (environmental, social and governance) . Lastly, the investment universe broadens the scope of the index investing proposal beyond listed equities (FICC, real estate, unlisted, etc.).
55 See, for example, EDHEC Risk (2018). 56 The identification of relevant factors is debatable. Cochrane J. (2011) refers in this regard to/to this as a ‘zoo factor’.

- 24 -
Box 4 – Growth of smart beta index-linked management Smart beta strategies involve exposure to “factors” (those that determine the risk/return profile) likely to capture outperformance relative to the market (Annex B). The main factors focus the investment on equities:
- with a low (or high) price-to-book ratio – Value (or Growth) factor - of small caps – Size factor – highlighting this factor also leads to criticism of weighting indices by capitalisation, which is favourable to large caps
(equally weighted indices, price-weighted indices, etc.) - with high dividend yield or high dividend growth – Dividend factor - with high profitability (e.g. ROA) and/or low cyclicality – Quality factor - that have outperformed the market over the past year – Momentum factor - with historically low volatility and/or beta – Volatility factor.
When implemented systematically, these strategies are well suited to passive management (ETFs and index funds). In the United States, the growth of smart beta indices is reflected in particular in the high levels of assets under management and inflows into certain ETFs. The growth of smart beta indices in Europe is also particularly innovative. In particular, strategies combining smart beta and fixed income or ESG approaches are being developed.
• Trends in the US smart beta ETF market In the year to the end of February 2019, 77 new smart beta ETFs were launched in the US, i.e. one third of all new ETFs, bringing the total number of smart beta ETFs to almost 1,000. Over this period, total assets under management increased by 10.9% to $880 billion, while that of traditional ETFs increased by 4.3%, mainly due to a $20 billion outflow from the SPY ETF. In November 2019 (Table 7), the 10 US smart beta ETFs with the highest annual inflows spanned four types of strategies: volatility minimisation strategies (accounting for $19.5 billion of the $50.6 billion raised by two funds), dividend capture strategies ($16.7 billion raised by four funds from Vanguard, First Trust/Value Line and iShares/Blackrock) or yield strategies (Value, Fundamental), with one last ETF having a multi-strategy approach. The five highest inflows were recorded by funds with assets under management ranging from $14.7 billion to $53.8 billion, with the Vanguard Value ETF as the largest global smart beta fund. By contrast, the iShares Russell 1000 Growth ETF ($1.0 billion) and the Edge MSCI U.S.A. Momentum Factor ETF ($1.4 billion) posted the largest annual outflows.
Table 7 – US smart beta ETFs:* 10 highest annual inflows (from 21/11/2019, in USD bn unless otherwise stated)
ETF Ticker Promoter Equity sector
Geog. focus
Strat-egy
TER (%)
Net assets Net flow Ann. perf.(%) Rk** 1Y 3Y 1Y 3Y 10Y
Edge MSCI Min Vol U.S.A. USMV iShares
BlackRock Total Mkt US Low
volatility 0.15 36.2 23 14.0 16.3 19.3 15.2 -
Edge MSCI USA Quality Factor QUAL BlackRock Total
Mkt US Funda-mental 0.15 14.7 66 6.2 9.2 21.6 14.5 -
Value VTV Vanguard Large Cap US Value 0.04 53.8 12 5.7 19.0 16.5 12.4 12.5
Dividend Appreciation VIG Vanguard Total
Mkt US Divi-dends 0.06 40.2 21 5.0 7.6 20.2 15.4 12.5
High Dividend Yield VYM Vanguard Total
Mkt US Divi-dends 0.06 28.2 26 4.5 7.7 15.6 11.5 12.9
Dividend Index Fund FVD First Trust
Value Line Total Mkt US Divi-
dends 0.70 9.0 101 3.6 5.1 16.5 11.3 13.3
Core Dividend Growth DGRO iShares
BlackRock Total Mkt US Divi-
dends 0.08 9.6 94 3.6 7.3 19.2 15.4 -
Edge MSCI Min Vol EAFE EFAV iShares
BlackRock Total Mkt
Dev. Mkts ex US
Low volatility 0.20 12.8 75 2.9 4.2 12.6 10.2 -
S&P 500 Low Volatility SPLV Invesco Large
Cap US Low volatility 0.25 12.5 77 2.7 2.8 19.7 14.5 -
ActiveBeta U.S. Large Cap Eq. GSLC Goldman
Sachs Large Cap US Multi-
factor 0.09 7.2 115 2.5 4.8 18.9 14.4 -
Strategies: Growth, Value, Momentum, Dividends, Fundamental, Low volatility, Multi-factor, Equal, Price-weighted, Fixed asset alloc. *Source: ETF.com, Factset data. **Rank by descending size of net assets of US ETFs.
• Trends in the European smart beta ETF market
In Europe, the growth of smart beta management is supported in particular by EDHEC Risk Institute’s annual surveys. The proportion of institutional investors using smart beta indices has increased from 54% in 2013 (49% in 2014) to 66% in 2019, a level that has been virtually stable over the past four years (Figure 4). The recent trend (between 2018 and 2019, Figure 5) shows a decrease in the number of investors with low exposure to these strategies (i.e. less than 20% of their investments), but an increase in those with higher exposures). As other strategies are developed (bonds, ESG), a range of indices is emerging that combines several criteria, especially smart beta and bonds (EDHEC Risk (2019)). The expansion to the bond universe of the analytical framework for smart beta strategies, initially developed for equities, calls for a critical examination of the factors of return and persistence, with 38% of those not investing in smart beta bond strategies pointing out that “Fixed-income risk premia are not sufficiently documented in the literature”. Figure 4 – Institutional investors’ use of smart beta ETFs Figure 5 – Percentage of smart beta and factor investing in amounts invested
Source: EDHEC Risk (2019). Source: EDHEC Risk (2019).

- 25 -
Against this backdrop, demand is growing rapidly, reflecting a diversification in the requirements (being) expressed (discussion in 2.1). In general, institutional investors are adopting index-based management techniques (see section 1.3 c) below). Regarding the use of ETFs by these investors (Figures 18 and 19), EDHEC Risk (2019) notes that in “2006, 45% of respondents used ETFs to invest in equities, compared with 91% in 2019. As for government and corporate bonds, the result went from 13% and 6% in 2006, to 66% and 68%, respectively, in 2019”. Factor investing appears to be an important driver of the growth in index-linked management (Box 4). According to FTSE Russell (2018),57 the percentage of investors explicitly using smart beta strategies doubled between 2015 and 2017. This source also confirms the perception of an increase in the types of factors used. ETFGI reports $680 billion smart beta assets under management in 2019 (Figure 6). On a much narrower basis, Morningstar (Figure 8) confirms these strategies’ expansion in Europe. Figure 6 – Global assets under management in cap-weighted, smart beta, other and actively managed ETPs (February 2019)
Source: ETFGI based on information from promoters, Bloomberg and Refinitiv/Lipper. AMF. The risks associated with these trends, which may lead to confusion between passive management and index-linked management of exposure to risk factors, should be noted here (see Box 5).58 Although (it is) clearly distinct from stock picking strategies in the strict sense, index-based management involving exposure to specific risk factors can be seen as a strategy of active exposure to these factors.59 A shift from using indices for passive management in the string sense of the term to using them as a systematic management tool that may not be very popular with investors, especially retail investors. Furthermore, the CAPM included its individual management recommendations (for all: hold the market portfolio) in a holistic view of the market. However, this macro-financial perspective/view is lost in the factor optimisation of investment strategies. This leads to a reformulation of the question on the impact of the increasing use of indices on financial stability. In other words, while the widespread use of passive management raises questions about the risk of a fundamental valuation failure/breakdown/dysfunction in asset pricing (“disappearance of alpha”),60 systematic (index-linked) management is more likely to raise questions on the risk of herding, for example the risk of asset reallocation associated with a common perception of risk factors.61 This point is discussed in section 2.1 below.
57 According to Cyprys M. (2016); Factor investing revolution: What will drive the next wave of growth?, Morgan Stanley Research, 12 April 2016 12 cited in Ang A., R. Ratcliffe, P. Miranda (2018), Morgan Stanley estimates the growth of Smart Beta ETF assets under management in the United States at 30% per year between 2010 and April 2016, reaching $225 billion. 58 See Robertson A. (2019): “Far from being ‘passive’, my findings indicate that index investing is better understood as a form of delegated management, where the delegee is the index creator rather than the fund manager”. 59 In the United States, for equity ETFs between 2000 and 2017, Easley D., Michayluk, M. O’Hara, Putnins (2018) shows that “most ETFs are highly active with a median active share of 93.1% and median tracking error of 8.8% p.a., relative to the passive market portfolio. Moreover, fund flows over time are concentrating into the most active ETFs (…)”. 60 Other aspects may also be taken into consideration in this regard, such as incentives to carry out financial analysis, reduced use of public financing (privatisation of financing), etc. 61 See the AMF’s Scientific Advisory Board debate of April 2018.
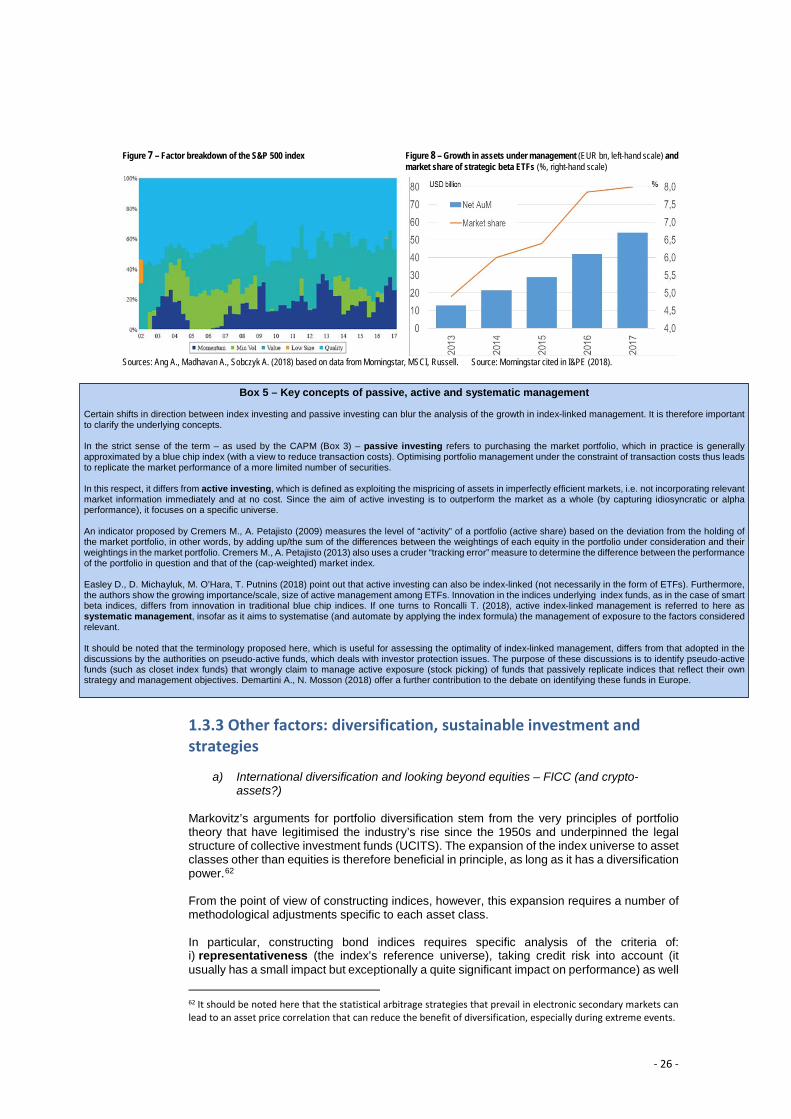
- 26 -
Figure 7 – Factor breakdown of the S&P 500 index Figure 8 – Growth in assets under management (EUR bn, left-hand scale) and market share of strategic beta ETFs (%, right-hand scale)
Sources: Ang A., Madhavan A., Sobczyk A. (2018) based on data from Morningstar, MSCI, Russell. Source: Morningstar cited in I&PE (2018).
1.3.3 Other factors: diversification, sustainable investment and strategies
a) International diversification and looking beyond equities – FICC (and crypto-assets?)
Markovitz’s arguments for portfolio diversification stem from the very principles of portfolio theory that have legitimised the industry’s rise since the 1950s and underpinned the legal structure of collective investment funds (UCITS). The expansion of the index universe to asset classes other than equities is therefore beneficial in principle, as long as it has a diversification power.62 From the point of view of constructing indices, however, this expansion requires a number of methodological adjustments specific to each asset class. In particular, constructing bond indices requires specific analysis of the criteria of: i) representativeness (the index’s reference universe), taking credit risk into account (it usually has a small impact but exceptionally a quite significant impact on performance) as well 62 It should be noted here that the statistical arbitrage strategies that prevail in electronic secondary markets can lead to an asset price correlation that can reduce the benefit of diversification, especially during extreme events.
Box 5 – Key concepts of passive, active and systematic management Certain shifts in direction between index investing and passive investing can blur the analysis of the growth in index-linked management. It is therefore important to clarify the underlying concepts. In the strict sense of the term – as used by the CAPM (Box 3) – passive investing refers to purchasing the market portfolio, which in practice is generally approximated by a blue chip index (with a view to reduce transaction costs). Optimising portfolio management under the constraint of transaction costs thus leads to replicate the market performance of a more limited number of securities. In this respect, it differs from active investing, which is defined as exploiting the mispricing of assets in imperfectly efficient markets, i.e. not incorporating relevant market information immediately and at no cost. Since the aim of active investing is to outperform the market as a whole (by capturing idiosyncratic or alpha performance), it focuses on a specific universe. An indicator proposed by Cremers M., A. Petajisto (2009) measures the level of “activity” of a portfolio (active share) based on the deviation from the holding of the market portfolio, in other words, by adding up/the sum of the differences between the weightings of each equity in the portfolio under consideration and their weightings in the market portfolio. Cremers M., A. Petajisto (2013) also uses a cruder “tracking error” measure to determine the difference between the performance of the portfolio in question and that of the (cap-weighted) market index. Easley D., D. Michayluk, M. O’Hara, T. Putnins (2018) point out that active investing can also be index-linked (not necessarily in the form of ETFs). Furthermore, the authors show the growing importance/scale, size of active management among ETFs. Innovation in the indices underlying index funds, as in the case of smart beta indices, differs from innovation in traditional blue chip indices. If one turns to Roncalli T. (2018), active index-linked management is referred to here as systematic management, insofar as it aims to systematise (and automate by applying the index formula) the management of exposure to the factors considered relevant. It should be noted that the terminology proposed here, which is useful for assessing the optimality of index-linked management, differs from that adopted in the discussions by the authorities on pseudo-active funds, which deals with investor protection issues. The purpose of these discussions is to identify pseudo-active funds (such as closet index funds) that wrongly claim to manage active exposure (stock picking) of funds that passively replicate indices that reflect their own strategy and management objectives. Demartini A., N. Mosson (2018) offer a further contribution to the debate on identifying these funds in Europe.

- 27 -
as idiosyncratic risks; ii) investability (e.g. with regard to the securities’ liquidity (off-the-run series, etc.)), and iii) the methodologies’ margin for discretion on these points. More specifically, the analysis examines:
- Securities selection , where the variety of issuance lines requires a choice to be made (e.g. between maturities, reference currency, etc.);
- Index diversification potential (bond indices are often highly correlated) and its components;
- Optimal weighting of bonds selected in the index (whereby the use of amounts outstanding overweights the most heavily indebted entities);63
- Index continuity management (rollover) and related costs; - Cost of liquidity resulting from replicating the index.
While bond ETP64 inflows amounted to 11.2% of equity ETP inflows in 2013, these have increased steadily to reach 35.7% in 2017. Box 9 in Section 2.1.2.3 provides further details of trends in the provision of bond indices and discusses some of the challenges associated with the development of bond index investing. Figure 9 – ETPs: Total investment flows
Source: BlackRock
b) Taking into account non-financial criteria
Given that companies’ accounting data does not cover all the information required to assess their performance, non-financial criteria (Environmental, Social and Governance (ESG)) are being put forward as a means to estimate their long-term performance (sustainable growth). In other words, taking ESG criteria into account should help to adjust market valuations65 (see example illustrating the climate impact of indices in Figure 10). Financial indices are, in this respect, recognised as a major channel for promoting investment strategies based on ESG criteria (EDHEC Risk (2018b), Bennani et al (2018)). Two main approaches are followed in practice: the first is “differential” and involves using ESG “versions” of existing indices; the second integrates ESG criteria more structurally into the selection of securities.
63 According to BlackRock (2019), “Volume in all US-listed high yield bond ETFs surged to a record USD 72 bn in December 2018, while volume in individual high yield bonds was $154 billion, the lowest since June 2014”. 64 For a definition of Exchange-Traded Products, see Morningstar. 65 ESG factors impact on asset prices through dedicated research or public taxes (Abou Gergi Z. (2020)).

- 28 -
Figure 10 – Climate impact assessment of stock market indices (°C) Figure 11 – ESG investment market in 2016
Source: Les Echos Gestion d’Actifs; 11 Dec 2018 based on data from Mirova. Source: Global Sustainable Investment Alliance, cited in Bennani et al. (2018a).
Quantifying the level and growth of assets under management that incorporate sustainable development criteria is fraught with uncertainties66: the need to ensure that the data collected is based on the same concepts, assessing the degree to which ESG criteria are incorporated into strategies, etc. A comprehensive survey of 229 institutions specifically identifies $228.1 billion in investments67 and confirms their upward trend. With less restrictive criteria, much higher levelsof investment are identified: $23 trillion worldwide for the ESG investment market (Figure 11) and more than €1 trillion in responsible investments in France (Table 8).68 Table 8 – Responsible investment by French management companies that responded (2017, EUR bn) Total under management of which responsible
investment of which SRI
Investment Funds 1,670 430 156 Mandates 1,780 651 154 Total 3,450 1,081 310
Total (in %) 100% 31% 9% Source: Afg The prevalence of index investing within ESG investment is discussed by Bennani et al (2018): “While active managers are more focused on stock picking portfolios, a large number of institutional investors prefer to implement ESG investing using optimized benchmarking portfolios in order to fit their strategic asset allocation (SAA) policy. For instance, they generally define an SAA portfolio based on market-capitalization indices, and monitor their investments by computing the tracking error between the invested portfolio and the strategic portfolio. (…) In the case of the MSCI World Index, (…) improving the ESG score by 0.5 implies accepting a tracking error of 32 bps on average. This result clearly demonstrates that there is no free lunch. Being an ESG investor requires taking on a tracking error risk”. Despite a dependence on the period of study and the region considered (ESG investment is more relevant in the euro area), Bennani et al (2018) concludes that “ESG appears to be a very serious candidate to join the very exclusive club of style factors”, thus opening the door to index, and systematic investment strategies . In Europe, sustainable finance is a key field of focus with its own European Commission action plan, 69 with the aim of increasing and improving transparency in order to better guide investment flows. To supplement financial reporting information in order to take sustainable investment goals into account, the following considerations arise: (i) the relevant indicators for measuring non-financial performance;70 (ii) the availability of useful data; and (iii) the quality and relevance of the information available – and actually used – to assess ESG performance criteria. As these
66 See discussion, for example, by Kölbel J., F. Heeb, F. Paetzold, T. Busch (2019). 67 See the 8th Annual Investor Survey from the Global Impact Investing Network (2018). 68 Box 6 of the AMF Markets and Risk Outlook (2019) analyses the sources of assets under management in France. 69 See European Commission action plan on financing sustainable growth; 08/03/2018. 70 In particular, here the question² arises of measuring and attributing the costs of negative externalities. For example, is the social cost of car pollution attributable to manufacturers or users?

- 29 -
informational and methodological bases have yet to be stabilised,71 a degree of discretion is necessary in the pursuit of management objectives and rules,72 which has the potential to affect the index methodologies used and in particular, how the indices are marketed73.
c) Systematic management and strategy indices Looking beyond the scope of factor indices alone, any type of rule-based systematic management can be structured as an index, thus introducing the need to distinguish between the strict notion of passive management aimed at replicating the performance of an entire asset market and systematic index-linked management incorporating asset management principles (Box 5, Table 9). Table 9 – What does systematic management include?
1980-2008 2009-2018 Option hedging Portfolio insurance (CPPI, OBPI) Index funds Quant funds (L/S, statistical arbitrage, etc.)
Indexation (CW, ETF, AW, etc.) Equity factor investing Trend-following strategies Risk parity portfolios Volatility/overlay management (vol control, vol target, vol cap, etc.) Volatility investing (short volatility, etc.) (Bank) proprietary (strategy) indices Robo-advisory
Source: Roncalli (2018)
1.3.4 Development of derivatives markets The use of indices as underlyings for derivatives is widespread. It is more readily identifiable for listed products. The number of open positions in individual equity options does not show a pronounced long-term trend in this regard (Figure 12). However, a marked increase can be observed for index futures and ETF options since 2011 (Figures 13 and 14): open positions for index futures up by 88.5% to 29.8 million and open positions for index options up by 26.6% to 187.3 million. In addition, there has been a sharp increase in stock market trading volumes in these products.74 Figure 12 – Equity options and equity index options (millions of open positions)
Source: Futures Industry Association, AMF
71 See AMF (2019); European Regulatory Update: Progress on Sustainable Finance Work (Disclosure and Benchmarks); July 2019. 72 CFA Institute (2019); “ESG integration in EMEA-Markets, Practices, and Data”. 73 See AMF’s pioneering work and 11/03/20 policy on sustainable finance and collective management. 74 See WFE/IOMA 2018 Derivatives Report and “FIA trading statistics release showing record ETD volume in 2018”.

- 30 -
Figure 13 – Equity index futures (mn open positions) Figure 14 – Equity index options (mn open positions)
Source: FIA, AMF
Over-the-counter (OTC) derivatives refer widely to interest rate benchmarks and indices to determine contractual payment flows. Such benchmarks are also often used to specify amounts of collateral posted and clearing margin requirements. A simple assessment of this use of indices depends on the data available. 75 It depends also on the degree of standardisation of the products and on the boundaries of comparability. At first glance, however, the BIS aggregate statistics (Figures 15 and 16) show the prevalence of interest rate contracts in OTC derivatives (80% of notional amounts) and among them swap contracts. Similarly to interest rate swap contracts (see the next section on references to IBORs and alternative reference rates), credit default swaps (CDSs) (Figure 17) increasingly refer to indices, a development that Aldasoro I., T. Ehlers (2018) shows is also linked to the development of central clearing. Some substitutability (and competition) is observed between ETFs and futures, especially in liquid segments (S&P 500), with ETFs being more available/tradeable in less liquid markets. The CME 76 argues that greater liquidity, the ability to trade in large size and the use of leverage tend to favour the use of futures. Acknowledging that “the implied financing level of the futures roll is one of the most important factors determining the total cost of ownership for a futures position”, it reports a decrease in these costs (from 45.7 basis points in 2017 to 16.4 basis points in 2018) and highlights the netting arrangement operated by the CME SPAN margin call system. Conversely, BlackRock77 takes the view that “since the financial crisis, the implicit cost of holding certain index derivatives has increased as a function of changes in regulation. Meanwhile, the holding costs associated with ETFs are trending downwards”78.
Figure 15 – OTC derivatives: notional amount Figure 16 – OTC derivatives: gross market value (USD thousands of billions) (USD thousands of billions)
Source: BIS, AMF. Source: BIS, AMF.
75 The use of EMIR granular supervisory data stills needs to be specified for the purposes of calculating aggregate statistics on the use of indices by derivatives. However, the next section provides an example. 76 “Group Futures and ETF Paper”; CME Group White Paper; Aite; February 2019. 77 “Liquid beta sleeves: bespoke solutions with index building blocks”; Armit Bhambra, iShares, BlackRock in Investment & Pensions Europe; 2019 Exchange-Traded Funds Guide. 78 See also footnote 37 on liquidity issues.
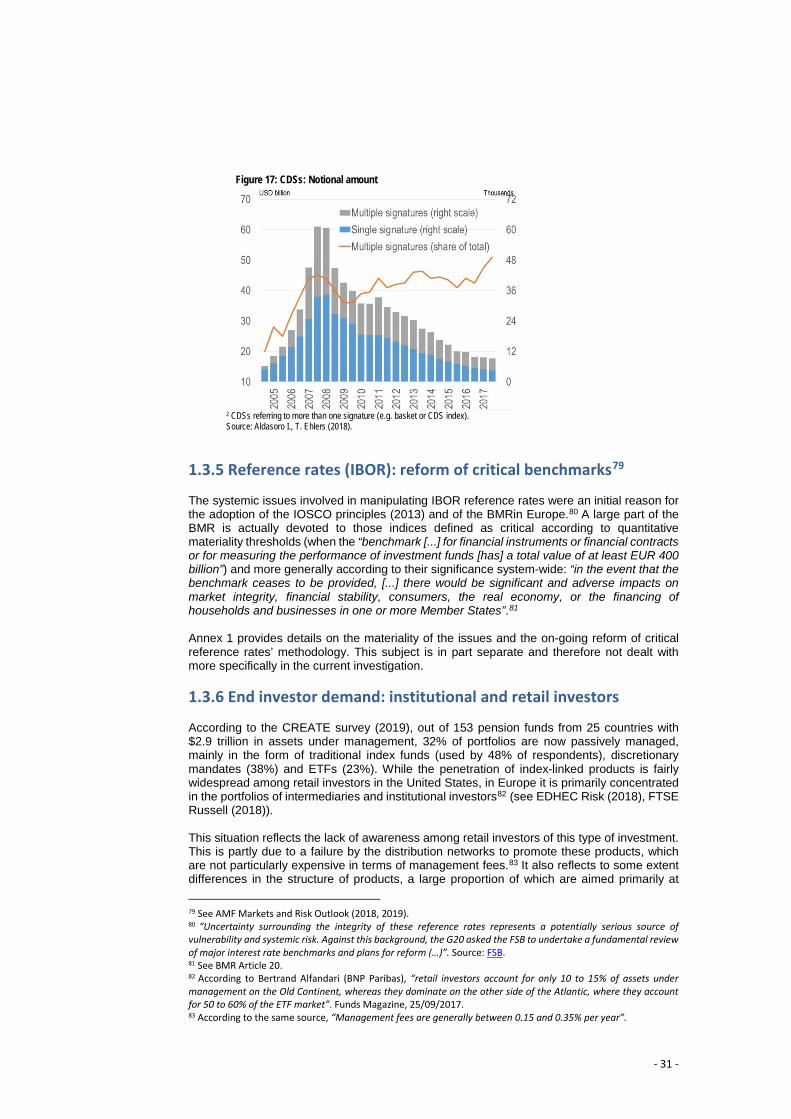
- 31 -
Figure 17: CDSs: Notional amount
2 CDSs referring to more than one signature (e.g. basket or CDS index). Source: Aldasoro I., T. Ehlers (2018).
1.3.5 Reference rates (IBOR): reform of critical benchmarks79 The systemic issues involved in manipulating IBOR reference rates were an initial reason for the adoption of the IOSCO principles (2013) and of the BMRin Europe.80 A large part of the BMR is actually devoted to those indices defined as critical according to quantitative materiality thresholds (when the “benchmark [...] for financial instruments or financial contracts or for measuring the performance of investment funds [has] a total value of at least EUR 400 billion”) and more generally according to their significance system-wide: “in the event that the benchmark ceases to be provided, [...] there would be significant and adverse impacts on market integrity, financial stability, consumers, the real economy, or the financing of households and businesses in one or more Member States”.81 Annex 1 provides details on the materiality of the issues and the on-going reform of critical reference rates’ methodology. This subject is in part separate and therefore not dealt with more specifically in the current investigation.
1.3.6 End investor demand: institutional and retail investors According to the CREATE survey (2019), out of 153 pension funds from 25 countries with $2.9 trillion in assets under management, 32% of portfolios are now passively managed, mainly in the form of traditional index funds (used by 48% of respondents), discretionary mandates (38%) and ETFs (23%). While the penetration of index-linked products is fairly widespread among retail investors in the United States, in Europe it is primarily concentrated in the portfolios of intermediaries and institutional investors82 (see EDHEC Risk (2018), FTSE Russell (2018)). This situation reflects the lack of awareness among retail investors of this type of investment. This is partly due to a failure by the distribution networks to promote these products, which are not particularly expensive in terms of management fees.83 It also reflects to some extent differences in the structure of products, a large proportion of which are aimed primarily at 79 See AMF Markets and Risk Outlook (2018, 2019). 80 “Uncertainty surrounding the integrity of these reference rates represents a potentially serious source of vulnerability and systemic risk. Against this background, the G20 asked the FSB to undertake a fundamental review of major interest rate benchmarks and plans for reform (…)”. Source: FSB. 81 See BMR Article 20. 82 According to Bertrand Alfandari (BNP Paribas), “retail investors account for only 10 to 15% of assets under management on the Old Continent, whereas they dominate on the other side of the Atlantic, where they account for 50 to 60% of the ETF market”. Funds Magazine, 25/09/2017. 83 According to the same source, “Management fees are generally between 0.15 and 0.35% per year”.

- 32 -
meeting the new active management needs of professional and institutional investors. For example, smart beta indices are often used by professionals actively managing their exposure to the respective risk factors,84 typically as part of a core-satellite approach.85 The use of index derivatives is generally linked to hedging or speculative strategies pursued by professional investors. Institutional products may present risks when their marketing is extended, through listing, to retail clients.
Figure 18: Use of ETFs and related products Figure 19: Percentage of ETFs and similar products in investments
Source: Edhec Risk (2019) survey of 182 European institutional managers (27 of whom have never invested in ETFs).
84 The marketing of these products therefore generally involves a sales force capable of assessing the specific needs of clients and even supporting clients in developing their capabilities in this area. 85 See definition of core-satellite strategies, e.g. by Vanguard (2017) and footnote 79.

- 33 -
2. Discussion of issues related to the growth of index-based management
2.1 What are the impacts of index-linked management on market efficiency and stability? The impacts of the increasing use of indices by passive management and derivatives call for a review of the operation, efficiency and stability of markets. 86 Academic research proposes/puts forward an initial framework for analysing the effects of passive management on market equilibria. Useful concepts need to be pinpointed against this background.As a first approximation, a distinction is drawn between the issues of optimal portfolio allocation and price formation, and those of market operation and liquidity resilience.
2.1.1 Passive vs active management
2.1.1.1 Passive, active and systematic management concepts Within portfolio management that replicates the performance of an index (index investing), passive investing can be more or less strictly defined. In the strict sense used by the CAPM (Box 3), passive investing in listed equity markets refers to purchasing the market portfolio. In practice, the market portfolio is generally approximated by a blue-chip index made up of the main large cap stocks in order to optimise management and transaction costs (minimising the number of stocks in the portfolio). However, these indices replicate fairly/quite closely the performance of cap-weighted indices for the market as a whole. This passive investing differs from active management, which exploits the mispricing of assets in imperfectly efficient markets, i.e. those that do not incorporate relevant market information immediately and at no cost. The aim of active investing is to outperform the market as a whole (by capturing idiosyncratic/alpha performance), and it therefore necessarily focuses on smaller samples of stocks. Cremers, Petajisto (2009) measure a fund’s “activity” (active share) based on the deviation from the holding of the benchmark portfolio, in other words, by adding up/the sum of the difference between the weight of each equity in the portfolio and their weighting in the benchmark portfolio.87 Easley D., D. Michayluk, M. O’Hara, T. Putnins (2018) point out that active investing can also be index-linked,88 provided that the investment is systematically exposed to specific factors distinct from those of market indices.89 It points also to the growing importance of actively managed ETFs. In this context, innovation in the underlying indices of index funds, as in the case of smart beta indices, differs from that in traditional blue-chip indices and strives for systematic exposure to (out)performance factors. This is what Roncalli (2017) refers to as systematic management, where managers systematise and, where appropriate, automate (by applying the index formula) the management of exposure to the factors that they consider relevant. The term “index-linked management” is therefore preferred to describe all systematic passive, index-linked management.
86 The issues related to reference rates are, for the time being, considered to be separate. 87 It should be noted that the benchmark portfolio is generally different from the market portfolio. To measure the active management portion, Cremers M., A. Petajisto (2013) also considers a cruder “tracking error” measure, the ratio of portfolio performance to (cap weighted) benchmark performance. 88 “From an investor’s perspective, we contend that even passive ETFs can function as active investments when viewed from a portfolio context.” 89 CREATE-DWS (2019) identifies the use of core-satellite institutional management models, where the core of the portfolio replicates the performance of blue-chip indices, and “satellite” pockets aim to outperform the market through their exposure to specific factors, also using indices where appropriate.

- 34 -
2.1.1.2 Active management vs passive management A long-standing debate exists in academic and empirical literature between active and “passive” management (in the strict sense of the term of market portfolio replication).90 On the one hand, Sharpe W. (1991) demonstrates that in theory: “It must be the case that: (1) before costs, the return on the average actively managed dollar will equal the return on the average passively managed dollar, and (2) after costs, the return on the average actively managed dollar will be less than the return on the average passively managed dollar”. Looking at international collective and institutional equity funds between 1991 and 2009, Busse J., A. Goyal, S. Wahal (2010), for example, finds no “reliable evidence at the aggregate level or on average of the presence of alpha”. Sharpe W. (2013) and Bogle J. (2014) stress the importance of the impact of transaction costs on performance.91 Malkiel B. (2003), who has been supporting the hypothesis of efficient, and therefore unpredictable, markets -thus markets that follow a random walk adds that “passive management is effective even if markets are inefficient”. Berk J., J. van Binsbergen (2015) documents the outperformance of US equity managers92 – implying limited market efficiency – but also that most of this outperformance is taken up by portfolio managers’ management fees. Pedersen L. (2017), however, highlights the complementary aspects of active and passive management: “Active managers can profit in aggregate, and more so if little capital is allocated to active. Therefore, the future of active management is not doom. At the same time, the historical record of average active manager returns after fees is not impressive, so more and more investors will surely recognize the benefits of passive investing. Hence, I expect that the fraction of passive investors will continue to grow, but converge to a number less than 100%”. In a model similar to that used in Grossman S., J. Stiglitz (1980), i.e. allowing for a degree of market inefficiency (imperfect information for agents and/or information cost), Gârleanu N., Pedersen L. (2018) endogenously model the efficiency of market prices according to the share allocated to active portfolio management. The equilibrium then results from a process of co-determining the proportion of active management and the level of market efficiency. Accordingly, “investors can rationally allocate less to active management and more to index funds if active management is more competent” (Stambaugh R. (2019)). In line with these approaches, Mauboussin M., D. Callahan, D. Majd (2017a) from Credit Suisse recommend: “Small and unsophisticated investors should build passive portfolios with an emphasis on asset allocation and low costs. Sophisticated investors should seek active managers.”93 Against this backrground, Bhattacharya U., N. Galpin (2011) measure the importance of stock picking in the United States and estimates that it has declined from 80% of trading volumes in the 1960s to only 24% in 2000-2004. However, this study suggests that the equity market remains efficient as long as it accounts for more than 10% of trading volumes.
90 IOSCO has initiatedwork on the impacts of passive management, in particular to assess the “questions raised about whether the growth of passive investment affects the price discovery process, the allocation of capital and corporate governance” (Board Priorities - IOSCO work program for 2019; 25 March 2019). 91 “Under plausible conditions, a person saving for retirement who chooses low-cost investments could have a standard of living throughout retirement more than 20 % higher than that of a comparable investor in high-cost investments”. French K. (2008) demonstrates: “Under reasonable assumptions, the typical investor would increase his average annual return by 67 basis points over the 1980 to 2006 period if he switched to a passive market portfolio”. 92 Where, according to Busse J., A. Goyal, S. Wahal (2010), “even before fees, we find no evidence of superior performance”. 93 According to Gârleanu N., Pedersen L. (2018), “Small investors should remain uninformed, but large and sophisticated investors benefit from searching for informed active managers since their search cost is low relative to capital. Hence, managers with larger and more sophisticated investors are expected to outperform”.

- 35 -
2.1.2 Impacts on market efficiency and stability
2.1.2.1 Index-linked products: structural impacts on secondary markets
a) ETFs and index derivatives at the core of the market structure The growth of ETFs and index futures has transformed the ecosystem and structure of markets, especially secondary markets for equities and investment funds, i.e. all the processes that contribute to price formation and market liquidity. It has since expanded to other asset classes, notably bonds. It has led to the emergence of a category of intermediaries, the “Authorised Participants” (APs), which are statutory market makers and arbitrageurs on the market for ETF units (Box 6). Beyond the primary market, APs drive the secondary market for ETF units. ICI (2014) notes, for example, that the volume traded on the secondary market for ETFs in the US is four times the volume of corresponding ETF share creations and redemptions.
The introduction of ETFs is beneficial to market liquidity insofar as it is additional to that of the underlying assets (Lettau M., A. Madhavan (2018)) and because of the arbitrage between ETFs and their underlying assets. However, its effects are contradictory because the liquidity can also be partly substituted for the liquidity of the underlying assets. For example, uninformed investors are naturally inclined to avoid adverse selection by “migrating” the underlying assets to ETFs (Gorton G., G. Pennacchi (1991), Subrahmanayam A. (1991), Israeli D., C. Lee, S. Sridharan (2017), Hamm S. (2017)). Moreover, among their many uses (hedging, etc.), ETFs satisfy a demand from institutional investors for short-term liquidity, particularly for speculative or tactical purposes (Cao (1999), Goetzmann W., M. Massa (2003)). In the absence of precise information, Aggarwal R., L. Schofield (2012) estimates that institutional investors in the United States hold about 50% of assets under management and account for 80% of ETF trading. This institutional demand involves in particular ETFs that are more liquid than their underlying assets (Broman M., P. Shum (2018)). Kamara A., X. Lou, R. Sadka (2008, 2010) and Bolla L., A. Kohler, H. Wittig (2017) show an upward trend in systematic liquidity on the US market and attribute it to correlated trading in institutional index investing, particularly in ETFs (indicating a reduced ability to diversify aggregate shocks by holding large-cap stocks). Among various reasons attesting to the importance of liquidity considerations in developing ETF products, Investment & Pension in Europe (2019) mentions, for example, the emergence of cash-flow-driven investing (CDI) solutions to meet the needs of liability-constrained pension funds. The introduction of ETFs and blue-chip index futures also affects the price formation process by reversing the direction in which asset prices are determined, with the price movements of futures and ETFs now preceding those of the underlying assets. These underlying assets are then adjusted by arbitrage (Hasbrouck J. (2003), Yu L. (2005), Israeli D., C. Lee, S. Sridharan (2017)).
Box 6 – Authorised Participants on the ETF market: a dual role ETF units are exclusively created by “Authorised Participants” (APs), market-making institutions on the stock market, under bilateral agreements with the ETF sponsor. At the close of the trading session, the APs have the exclusive power to create or redeem ETF units in kind or in cash, with the sponsor. In the case of an “in kind” transaction, the AP delivers (or receives) a representative basket of the index’s underlying equities. This basket must comply with the “creation/redemption basket” described by the ETF manager for this purpose, often with a margin of flexibility (approximation by sampling). When shares are created (or redeemed), the AP receives (or delivers) the corresponding number of ETF units in return. In the case of an “in cash” transaction, the ETF units are created/redeemed at the net asset value (NAV) of the ETF, generally at the market close (or at the next opening for certain ETFs whose underlying securities are listed in several time zones), i.e. after issuing the creation/redeeming orders by the APs. APs thus have a dual role, on the one hand as regulated providers of access to the primary market and liquidity providers (market makers), but also as guarantors of the value of ETF units, in other words as “arbitrageurs”. In this latter case, if the price of the ETF deviates from its NAV, the AP can, with no statutory obligation, gain from implementing arbitrage strategies involving taking opposing buy and sell positions on the ETF units and on the underlying basket and then unwinding these positions, if necessary with the ETF sponsor, at the end of the day. Arbitrage stands out as a major difference between ETFs and closed-end funds, whose shares can be traded at very high premiums or discounts. Pan K., Y. Zeng (2017) shows, however, that the dual role of APs can lead to conflicts of interest. However, other institutions, e.g. hedge funds or quantitative and high frequency proprietary traders, can also implement market making and arbitrage strategies without having AP status, i.e. without the right of access to the primary market for ETF units and the related obligation.

- 36 -
b) Pronounced “technical” effects The implementation and development of index methodologies have multiple specific effects on markets. Raddatz C., S. Schmukler, T. Williams (2017) assesse the impact of changes in the composition and weighting of the MSCI Emerging Markets (EME) indices on different countries and demonstrate the importance of these effects on the net investment flows of equity and bond funds. This study also documents the presence of abnormal asset returns and exchange rate movements. More generally, the adoption by the main equity indices of floating capitalisation-weighted stocks,94 changes in equity sector classifications,95 and the expansion of the MSCI EME (Lalanne F., I. Peresa (2019)) equity indices96 and the Barclays Global Aggregate (Bloomberg) bond indices97 to include China are generating substantial financial flows, to the point of raising issues at state level.98 In addition to the primary market, where the financial flows at stake can be significant, these changes have impacts on secondary markets and require appropriate risk management.99 This risk management is essentially at the discretion of index administrators and consists mainly of ensuring transparency to stakeholders, or indeed the market, on the implementation of changes and the expected impacts, particularly to ensure that conflicts of interest in relation to stakeholders (issuers, investors, intermediaries, etc.) are managed. If necessary, it also involves implementing changes gradually to avoid short-term market impact and their potentially disruptive effects. However, on this latter point there are outstanding questions on transparency, in an environment where, for example, “the market capitalisation used by the Russell [1000/2000] indices to rank shares in May is not publicly available”, requires the use of advanced techniques to predict the impact of annual revisions of these indices (Ben-David I., F. Franzoni, R. Moussawi (2019)). There are also impacts associated with implementing the methodologies themselves, particularly when rebalancing (changing the composition of) indices.100, 101 Empirical and academic literature 102 widely emphasises that they result in abnormal returns. Madhavan A. (2003) shows, for example, that the annual revisions of the Russell indices between 1996 and 2001 led to abnormal returns for the securities in question. Chang Y., H. Hong, I. Liskovich (2015) shows that the inclusion of a security in the Russell 2000 Index 94 In 2000, STOXX adopted a systematic weighting by floating capitalisation of its indices. The FTSE, which had been doing so/this since 1999 for newly listed stocks, adopted the practice across the board in June 2001. MSCI announced float weighting in December 2000 and implemented it in two stages, in November 2001 and May 2002. The CAC 40 adopted a free-float methodology on 1 December 2003. S&P finalised its adoption in 2005. 95 See, for example, the reference to the effects of the GICS amendment in November 2018 in footnote 39. 96 The impact was limited by the gradual increase, in several stages, of the country’s weight in the index (between May 2018 and the end of 2019, when it was expected to reach 3.3%). Its effects on the markets, especially its contribution to market performance (+28% between February and August 2019 for Chinese equities) and the drastic growth in portfolio flows to China (up from 50 billion in 2016 to 159 billion in 2018) were noted. 97 The inclusion of new types of Chinese bonds in the index “replicated by $2 trillion to $2.5 trillion in assets under management” could have substantial effects on the financing of emerging countries: “China expects an additional investment flow of $150 billion by 2020. Added to this will be the expected effects of including Chinese equities and bonds in the FTSE and JP Morgan indices, amounting to up to $450 billion (3 to 4% of GDP) over the next 2 to 3 years. These estimates are probably conservative as: (i) other assets will become eligible for inclusion in the indices [...]; (ii) an increase in Chinese public debt is expected [...]; [and] (iii) the high level of risk-adjusted returns on Chinese bonds should make them attractive investments”. In addition: “Investors may reduce purchases of other emerging-market assets as they re-balance their portfolios to reflect China’s inclusion. As a result, emerging market government issuers could see an average reduction of allocations by $1 bn to $3 bn each. These effects could be larger for some countries, where benchmark-driven holdings constitute a significant amount of their foreign debt” (FMI (2019)). The IMF then reflected on the effects of these developments: “More broadly, as benchmark-driven investors tend to be more sensitive to changes in global financial conditions than other investors, their greater role in international finance may mean that external shocks propagate to medium-sized emerging and frontier market economies faster than in the past”. 98 Financial Times; “MSCI visionary looks beyond traditional indices for growth”; 8 January 2019; Les Échos; “L’internationalisation des Bourses chinoises franchit un cap important”; 4 March 2019. 99 IMF (2019) also highlights the impact of including a country in the index on those it replaces (“domino effect”). 100 Cheng M., Madhavan A. (2009), Trainor W. (2010), Bai Q., S. Bond, B. Hatch (2012) (in the United States) and Grillet Aubert L., R. Sow (2010) (CAC 40) report specific risks of amplifying liquidity shocks in the underlying equity markets when rebalancing inverse and leveraged ETFs. However, Ivanov I., S. Lenkey (2018) points out (without considering cost) that arbitrage limits their potentially disruptive effects on market liquidity. 101 Bessembinder H., Carrion, Tuttle, K. Venkataraman (2016) analyses the impact of rolls on oil ETFs. 102 These are “natural experiments” useful for corporate finance and asset valuation analysis.

- 37 -
increases its price and that its removal reduces it, but points to a long-term downward trend in these effects. Chen H., V. Singal, G. Noronha (2006) show an abnormal return on S&P 500 equities103 of 5.12% on the day of the announcement of their inclusion in the S&P 500 (8.37% between the day of the announcement and its implementation) and, conversely, a decline of 8.48% (14.10%) on their removal. These effects are eventually corrected within one month – to a very limited extent for inclusions (by 2.01%, 6.36% being considered “permanent”), but extensively for removals.104 Mauboussin M., D. Callahan, D. Majd (2017b) describe, over a more recent period, the opposite effect over a one-year period – specifically, significant and positive effects for removals (+28%!) but limited effects for inclusions – with these effects diminishing in all cases over a three-year period (Figure 20). The impact of rebalancing on market liquidity is also discussed in section 2.1.2.3 b). Figure 20: Relative performance of equities following their inclusion in/removal from the S&P 500 (2000-2016)
Source: Mauboussin M., D. Callahan, D. Majd (2017b), Factset and S&P Dow Jones.
2.1.2.2 Impacts on price formation
a) Contradictory effects on price efficiency and informational content Yu L. (2005) states that ETF trading has permanent, and therefore “informed”, effects on the prices of the underlying assets. Denis D., J. McConnell, A. Ovchinnikov, Y. Yu (2003) also shows that, contrary to generally accepted theory, the inclusion or removal of securities from indices provides information on the future value of firms (lasting impacts on their prices). In a cross-sectional analysis of equities listed in the United States between 2000 and 2014, Israeli D., C. Lee, S. Sridharan (2017) shows, however, that the increase in equity holdings by ETFs reduces the benefit of acquiring information about their underlying assets and the liquidity of those assets. The degree (“synchronicity”) to which changes in a stock return is attributable to market and industry developments is shown to be positively related to the ownership of ETFs. An increase in ETF ownership also coincides with a long-term decline in the number of analysts covering the stock. Lastly, an increase in ETF ownership indicates a reduced ability to capture information on future results the following year, a conclusion that qualifies the opposing conclusions of Glosten L., S. Nallareddy, Y. Zou (2019). The latter’s conclusions find a positive impact of ETF trading on returns associated with firms’ earnings announcements, but especially on their systematic (or “macro”) component. The following observation by Ang A., Madhavan A., Sobczyk A. (2018) is worth noting: “The proportion of index movements explained by factors has materially increased in recent years, which is consistent with a more top-down, macro-driven environment or the increasing importance of economy-wide risks for financial markets”. In a similar vein, Bartram S., G. Brown, R. Stulz (2019) shows that average idiosyncratic risk declined steadily between
103 Over the period from October 1989 to December 2002, the study also analysed the impact of rebalancing the Russell 2000 Index. 104 Note: Inclusions in and removals from several indices may be cumulative. For example, a removal from the Russell 1000 may lead to an inclusion in the Russell 2000. The net effect on the demand for a security may even be positive if its weight, which was low in the previous index, becomes high in the new index (Chang Y., H. Hong, I. Liskovich (2015), Ben David I., F. Franzoni, R. Moussawi (2019)).

- 38 -
2000 and 2017, which they attribute to the fact that “US publicly listed firms have become larger, older, and their stock more liquid”. Investors tend to have more diversified portfolios, but their portfolios tend to be increasingly similar: a “US equity” portfolio today tends to have systematic exposure to the S&P 500 index without specific consideration for the securities included or not included in it. In other words, the diversification observed in investors’ portfolios is increasing, but the diversification observed across investors’ portfolios appears to be decreasing and their exposures appear to be more correlated. In line with the tendency to favour aggregate market information, there is a tendency to treat (index-linked) portfolios with no specific consideration for the equities that comprise them. For example, between March 2000 and March 2003, the 55% slump in the S&P 500 did not prevent almost half of its constituent stocks from posting a positive performance. During the 2008 crisis, when a similar downturn was observed, only 5% of stocks posted a positive return. Staer A. (2017) studies, for a sample of US equity ETFs, the impact of exogenous trading needs – i.e. uninformed, causing “noise” – of ETFs on the prices of their underlying assets. Between 2007 and 2010, a demand shock of one standard deviation (1.1%, $3 billion) on an ETF resulted in an average price increase (price pressure) of 89 basis points, of which 38% (34 basis points) was corrected within 5 days. This indicates a profit drawn from asymmetric information by the ETFs’ trading counterparties and limited informational content (permanent impact of trades on prices). However, there are some indirect informational benefits resulting from the introduction of ETFs. Appel I., T. Gormley, D. Keim (2016) shows the benefit for the governance of companies included in the indices of having their shares held by passive management funds (“more independent directors, removal of takeover defences, more equal voting rights”) and their contribution to better long-term performance. Boone A., J. White (2015) shows that these effects are related in particular to the indexation of institutional management and its positive effects on issuer transparency. Cremers M., M. Ferreira, P. Matos, L. Starks (2016) also notes that actively managed funds “are more active and charge lower fees when they encounter competitive pressure from explicitly indexed funds with low fees”. Lastly, there are effects specific to the bond markets. According to Dannhauser C. (2017), a standard deviation increase in the holding of a US corporate bond by an ETF reduces its spread and has a beneficial effect on its price: its average monthly return increases by 1.03% (high yield) and 0.75% (investment grade)). Agapova A., Volkov N. (2018) states that investment flows into these ETFs have a permanent, and therefore “informed”, impact on prices. However, the informational effects of ETFs are difficult to assess (Box 7) and are contradictory. However, this contradiction may only be apparent if the faster incorporation of certain information into market prices is accompanied by undesirable side effects. Considering ETFs that are more liquid than their underlying assets, whose price is therefore partly formed at the ETF level, Bhattacharya A., O’Hara M. (2018) notes for example that market makers extract/remove noisy information from the underlying assets and propagate noise when
Box 7 – Scope and limitations of tools for analysing price formation Assessing the impact of index-linked management on the informational content of equity prices confronts the difficulty of analysing price formation by referring to equilibrium/fundamental prices that are essentially unobservable. In a perfectly efficient market, market prices incorporate all the information, and the question of price formation is therefore redundant. Volatility therefore purely reflects the market’s ability to incorporate useful information. In practice, the indicators (proxies) proposed/put forward to assess price formation measure:
• The relative ability/capacity of prices to incorporate fundamental information, e.g. taking into account revisions to analysts’ forecasts, event studies, or the explanation of companies’ future results based on returns on equity;
• The proportion of the information (variability) specific to the security in question compared with the proportion attributable to the industry or the market as a whole (e.g. based on a Fama-French factor model) – see “synchronicity” by Roll (1988), Israeli D., C. Lee, S. Sridharan (2017) – or the proportion of the specific variance attributable to the various assets whose price differentials are subject to arbitrage (information shares – see Hasbrouck (1995));
• The market impact of trading, distinguishing the transient effects of “uninformed” trading (subject to adverse selection) from the permanent effects (over a period that is supposed to allow information to be incorporated into prices), i.e. based on assumptions on market efficiency. The literature also considers volatility ratios over different time frames (Lo A., MacKinlay (1988), Gresse C. (2014));
• The existence of arbitrage opportunities. Assumptions and approximations (proxies) therefore influence the empirical literature and explain why assessing the impact of passive management on the price formation of underlying assets remains a matter of debate.

- 39 -
trading them. They can then increase their volatility, as shocks to the ETF spread to the underlying assets even in the absence of specific relevant information: “while these ETFs bring more information to the markets at the aggregate level, individual asset prices may face persistent dislocations”. This would therefore indicate a tendency to better incorporate “macro” fundamental information into market prices, potentially to the detriment of the information specific to components of the indices. Procyclicality is a hypothesis advanced by Buffa A., D. Vayanos, P. Woolley (2019) according to which the growth in the use of indices could lead to speculative bubbles and an overvaluation of market prices. The model with “noise trading” incorporates a risk limit constraint (i.e. short-term tracking error). Investment flows then reverse the risk/return relationship: overvalued assets have low expected returns and high volatility; undervalued assets, conversely, have high expected returns and low volatility. This effect is asymmetrical, i.e. more pronounced for overvalued assets. The model then predicts pro-cyclical effects: “Risk limits cause overvalued assets to become more overvalued and undervalued assets to become more undervalued”, in other words, momentum effects (bubbles), excess volatility and permanent overvaluation of market prices (due to asymmetry). Based on this, the recommendation is to reduce the incentives for institutional managers to benchmark. However, the model’s predictions have yet to be verified empirically. More specifically, questions are also raised about the potentially destabilising nature of asset allocations associated with factor strategies. The procyclical effect (return chasing) of incorporating them into systematic management, particularly index-linked management, is still under discussion. Discussions between Cliff Asness (AQR) and Rob Arnott (Research Affiliates), and between Thierry Roncalli and Charles-Albert Lehalle (2018) on the AMF Scientific Advisory Board, are on-going and are informed by recent academic work (e.g. Gupta T., B. Kelly (2019), Arnott R., M. Clements, V. Kalesnik, J. Linnainmaa (2019), Ehsani S., J. Linnainmaa (2019), Ilmanen A., R. Israel, T. Moskowitz, A. Thapar, F. Wang (2019)). It would appear that factor-based asset allocation has a limited procyclical impact (momentum), with a return to the long-term average (Haghani J., V. White (2019)).
b) An excessive increase in asset price co-movement One anomaly that is empirically well established in the literature on indices involves price co-movement of their underlying securities. Barberis N., A. Shleifer, J. Wurgler (2005) shows that inclusion in the S&P 500 index alters the behaviour of stocks, increasing the co-movement of their prices, which then behave like a fish "joining a shool of fish”. The correlation with the other stocks in the index (beta) therefore increases sharply (the correlation with stocks outside the index decreases), leading to a distortion in the structure of the correlation of returns. Da Z., S. Shive (2018) finds that, between 2006 and 2013, the level of activity of an ETF contributed to an increase in the correlation between its underlying securities. A 1% increase in the ETF’s holding of a stock increases its beta by 0.03. At the same time, increasing an ETF’s trading turnover rate by one standard deviation increases the correlation between its underlying securities by 1%. The effect is greater for smaller-capitalisation or illiquid securities. The “co-movement” effect is observed across different markets. It is most pronounced for the Nikkei 225 (Greenwood R., N. Sosner (2007)) and is observed in both developed and emerging countries (Claessens S., Y. Yafen (2012)). It also increases with the use of indices 105 (Barberis N., A. Shleifer, J. Wurgler (2005), Claessens S., Y. Yafen (2012)). Leippold M., L. Su, A. Ziegler (2016) observes a similar effect for index futures. Shim J. (2019) points out that it is ETF arbitrage that affects the co-movement of underlying securities, especially for large-capitalisation securities held by the most actively traded ETFs. By mechanically exploiting the mispricing of an ETF by processing the basket without regard for the fundamental information (with a longer-term impact) specific to each index component, arbitrage can take advantage of ETF price adjustments. However, this leads to an over-reaction by those stocks that are more sensitive to arbitrage/an under-reaction by those that are less so. Arbitrage thus conveys erroneous information about the risk factor of the ETF to its components and “distorts” the co-movement. Share price formation and risk assessment (volatility) are therefore biased by undue, non-fundamental co-movement.
105 Koch A., S. Ruenzi, L. Starks (2016), however, also finds this effect more generally for mutual funds.

- 40 -
Branger N., R. Flacke, F. Middelhoff (2019) proposes an assessment of the cost (risk premium) associated with “co-jumps” (abrupt concurrent variations) in the returns of index components. They break down the correlation risk premium into a component reflecting the correlation of returns on a continuous basis and a “co-jump” component. An evaluation, using simulations, of index option buy strategies/basket of equities sell strategies reveals their importance: “Both risk premiums are economically and statistically significant for the S&P 100 index. In particular selling insurance against co-jumps generates a sizeable annualized Sharpe ratio of 0.85”.
c) Excess volatility, reflecting uninformed trading One explanation for volatility is that stocks in blue-chip indices, which have lower trading costs, incorporate information faster than other stocks (Vijh A. (1994)). This is rejected by Claessens S., Y. Yafen (2012): “There is more stock price co-movement than what is warranted by fundamentals. This (…) implies that there are limited diversification opportunities for investors and possibly also too little production of stock-specific information, all of which may result in a less than perfectly efficient capital allocation”. Ben-David I., F. Franzoni, R. Moussawi (2018) shows that, for a large sample of US equity ETFs, their holding of equities is accompanied by a significant increase in the volatility of returns per minute. This transient volatility (over a day) is therefore not useful for price discovery. It reflects the transmission, via high-frequency arbitrage, of non-fundamental demand shocks (noise trading) from the ETF to its underlying assets, with the associated risk premium reaching up to 56 basis points per month. Extending these results, Krause T., S. Ehsani, D. Lien (2013) shows that ETF trading transmits, via arbitrage, volatility to the ETF’s components (more so than the other way around/conversely), especially to the most liquid components and those carrying more weight in the index, and all the more so as the trading volume is high. Hansson M., O. Perers (2018) explains the effect of US equity ETF holdings on the volatility of the underlying securities and identifies three categories of ETFs: the expected positive relationship is observed for traditional index ETFs (Core ETFs); it is even more pronounced for style or strategy ETFs (Value, Growth, leveraged ETFs, etc.); but it is negative for sector ETFs (Industry ETFs). Wermers R., J. Xue (2015) shows, for example, that S&P 500 ETFs are subject to informed trading, unlike the underlying basket. The impact on the volatility of these trades, which is instantaneous, is not only much smaller but also very short-lived (three minutes duration). An upward effect on volatility has therefore yet to be demonstrated, particularly in Europe. Lastly, specific impacts related to derivatives are noted. Cheng M., A. Madhavan (2009), supported, for example for the S&P 500, by Bai, Bond, Hatch (2012) and, for the CAC 40, by Grillet Aubert L., R. Sow (2010), also reports a one-off risk of amplifying liquidity shocks on the underlying equity markets when rebalancing leveraged and inverse ETFs. Ivanov I., S. Lenkey (2018) qualifies this, highlighting the ability of arbitrage to limit these effects. More generally, the use of derivatives introduces risk-bearing (non-linear) threshold effects, especially when similar positions taken by different market participants are unwound simultaneously (herding).106 According to Le Moign C., F. Raillon (2018), the peak in volatility on 2 February 2018 on the US equity markets was probably due “less to fundamental causes than to technical factors linked to derivatives indexed on the VIX, and in particular to the impact of products betting on the decline of this index”, in this case Exchange-Traded Products indexed on the VIX futures market and structured as ETFs or debt products (Exchange-Traded Notes or ETNs).
106 For example, according to Cole C. (2017): “Many popular institutional investment strategies […] generate excess return […] from a portfolio of short optionality […]. Volatility is now an input […]. As of 2017, there is an estimated USD 1.18trn to USD 1.48trn of active short volatility exposure in domestic equity markets”.

- 41 -
d) Contagion
• Macroeconomic observations: The International Monetary Fund (IMF (2019)) posits: “More broadly, as benchmark-driven investors tend to be more sensitive to changes in global financial conditions than other investors, their greater role in international finance may mean that external shocks propagate to medium-sized emerging and frontier market economies faster than in the past”. Filippou I., A. Gozluklu, H. Rozental (2019) shows, for a sample of 41 MSCI iShares Country ETFs,107 the materiality of the propagation of fundamental shocks in the US market. It finds that arbitrage propagates shocks (fundamental or not) and identifies reasons for “flight to quality”: the asymmetric impact (more sensitive to decline) of shocks also results in reallocations towards cash ETFs. 108 This confirms the analysis of realised probability conducted by Prasad N., A. Grant, S-J. Kim (2016), which reveals an increase in its propagation (spillovers) during episodes of high volatility (global financial crisis, sovereign debt crisis). The BRIC emerging countries (Brazil, Russia, India and China), which were rather isolated until 2006, are now much more exposed to this. Yu Y., Y. Wang, R. Yi (2019) explores beyond crises and explains the dynamics of the transmission of volatility shocks between stock market indices of Systemic Middle Income Countries (South Africa, Brazil, China, India and Mexico) and the United States. In addition to the effects previously noted, volatility spillbacks from China and Mexico to the United States are observed, as well as spillovers between SMICs. In Europe, the AMF (2017) illustrates the propagation mechanism of shocks between index futures. Analysis of the underlying informational processes suggests that national price formation processes increasingly depend on trading in pan-European index-linked products (Box 8).
• Microeconomic mechanisms: In a theoretical model, Cespa G., T. Foucault (2014) supports the observation by showing how the interaction of market makers with uninformed arbitrageurs can amplify market shocks. When observing the liquidity of separate but related assets (e.g. the ETF and underlying assets), market makers create a relationship between their pockets of liquidity. This relationship is likely to: (i) amplify even an initially weak shock through interaction between the different pockets of liquidity (feedback loop) and (ii) propagate illiquidity by arbitrage (spillover). Bhattacharya A., M. O’Hara (2018) stresses the importance of a similar mechanism for ETFs with illiquid underlying assets (e.g. bonds). Arbitrage (non-instantaneous) then transmits an aggregate market shock to the underlying (“tail wagging the dog”). The pressure on asset prices due to arbitrage taking advantage of relative inefficiencies (Mitchell M., L. Pedersen, T. Pulvino (2007), Brown D., S. Davies, M. Ringgenberg (2016)) can then amplify shocks (herding) and increase volatility to the point of dislocating asset prices. Malamud S. (2016) explains how the unit creation/redemption mechanism can, contrary to the perceived stabilising role of the primary market, also propagate shocks, for example by increasing the persistence of transient shocks. Benzaquen M., J-P. Bouchaud, Z. Eisler, I. Mastromatteo (2017), using intraday order flow and trading data (consolidated at 5-minute intervals) for 275 stocks listed on the Nasdaq and the NYSE between January and December 2012, empirically confirms that approximating the value of each instrument in isolation, ignoring the interactions between different order flows, can lead to a significant underestimation of trading costs and possible contagion effects, because trades also provide ample information about the correlation between different instruments. Following the flash crash of 6 May 2010 in the United States, 109 Madhavan A. (2012) highlights the vulnerabilities of certain market structures that highly frequently consolidate fragmented liquidity and its potentially adverse effects on the resilience of market quality (price formation and market liquidity) in the event of stress. More recently, Garrison R., P. Jain, M. Paddrick (2019) empirically shows that “cross-asset [e.g. SPY/E-mini110] market order flow
107 For example, the MSCI iShares France was composed of 80 stocks as of 04/10/2019. 108 Defined by ETF.com’s “US Government Treasury Cash Equivalents” category. 109 The analysis of the flash crash by SEC-CFTC (2010) reveals a transmission of an exogenous shock in the E-Mini futures market to ETFs and underlying assets. Madhavan A. (2012) explains the role of ETFs. 110 SPY refers to the State Street Global Advisors S&P 500 ETF and E-Mini to the CME S&P 500 Index Futures Contract.
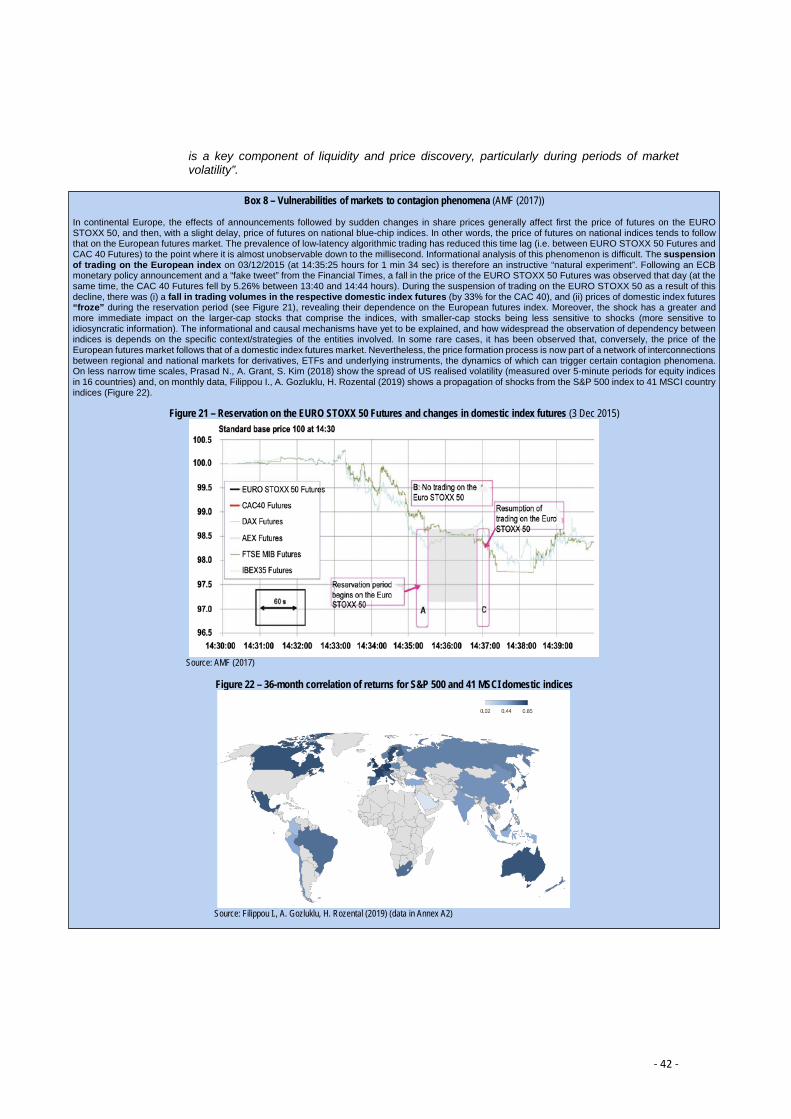
- 42 -
is a key component of liquidity and price discovery, particularly during periods of market volatility”.
Box 8 – Vulnerabilities of markets to contagion phenomena (AMF (2017)) In continental Europe, the effects of announcements followed by sudden changes in share prices generally affect first the price of futures on the EURO STOXX 50, and then, with a slight delay, price of futures on national blue-chip indices. In other words, the price of futures on national indices tends to follow that on the European futures market. The prevalence of low-latency algorithmic trading has reduced this time lag (i.e. between EURO STOXX 50 Futures and CAC 40 Futures) to the point where it is almost unobservable down to the millisecond. Informational analysis of this phenomenon is difficult. The suspension of trading on the European index on 03/12/2015 (at 14:35:25 hours for 1 min 34 sec) is therefore an instructive “natural experiment”. Following an ECB monetary policy announcement and a “fake tweet” from the Financial Times, a fall in the price of the EURO STOXX 50 Futures was observed that day (at the same time, the CAC 40 Futures fell by 5.26% between 13:40 and 14:44 hours). During the suspension of trading on the EURO STOXX 50 as a result of this decline, there was (i) a fall in trading volumes in the respective domestic index futures (by 33% for the CAC 40), and (ii) prices of domestic index futures “froze” during the reservation period (see Figure 21), revealing their dependence on the European futures index. Moreover, the shock has a greater and more immediate impact on the larger-cap stocks that comprise the indices, with smaller-cap stocks being less sensitive to shocks (more sensitive to idiosyncratic information). The informational and causal mechanisms have yet to be explained, and how widespread the observation of dependency between indices is depends on the specific context/strategies of the entities involved. In some rare cases, it has been observed that, conversely, the price of the European futures market follows that of a domestic index futures market. Nevertheless, the price formation process is now part of a network of interconnections between regional and national markets for derivatives, ETFs and underlying instruments, the dynamics of which can trigger certain contagion phenomena. On less narrow time scales, Prasad N., A. Grant, S. Kim (2018) show the spread of US realised volatility (measured over 5-minute periods for equity indices in 16 countries) and, on monthly data, Filippou I., A. Gozluklu, H. Rozental (2019) shows a propagation of shocks from the S&P 500 index to 41 MSCI country indices (Figure 22).
Figure 21 – Reservation on the EURO STOXX 50 Futures and changes in domestic index futures (3 Dec 2015)
Source: AMF (2017)
Figure 22 – 36-month correlation of returns for S&P 500 and 41 MSCI domestic indices
Source: Filippou I., A. Gozluklu, H. Rozental (2019) (data in Annex A2)

- 43 -
2.1.2.3 Impacts on market liquidity
a) Impacts, autocorrelation of returns and procyclicality of index investing Israeli D., C. Lee, S. Sridharan (2017) shows that, in the US, the introduction of an ETF reduces the liquidity of the underlying equities (bid-ask spread, daily impact cost) persistently over a one-year period, in this case by raising by 1.6% the bid-ask spread. Hamm S. (2014) qualifies this view: from 2002 to 2008, for 63 US equity ETFs, she shows that the transient component of the bid-ask spread (adverse selection) of equities increases when they are held by ETFs. The negative impact on the liquidity of equities is linked to the fact that non-informed investors “migrate” to ETFs to reduce the negative effects of their informational disadvantage. They do this by using indices that are less diversified but whose securities provide quality financial information. Agarwal V., P. Hanouna, R. Moussawi, C. Stahel (2018) analyses the equity holdings of 1,294 large-cap, sector or style US equity ETFs between 2000 and 2016 and shows that arbitrage between ETFs and their underlying securities increases the commonality of the liquidity of these securities. This implies lower ability/capacity for investors to diversify and offset liquidity shocks and therefore a vulnerability resulting from the growth of ETFs. Broman M., P. Shum (2018) shows that the liquidity of equity ETFs encourages short-term institutional demand: “relative liquidity predicts fund inflows and outflows separately, both in the positive direction”. Baltussen G., S. van Bekkum, Z. Da (2017) shows, for 20 indices from 15 countries, from their creation until the end of 2016, that the growth of indexation is, besides co-movement, a factor of autocorrelation (serial dependence) of the index returns (daily and weekly). Positive until 2000, this autocorrelation has reversed, however, and has been negative since then. Generally accepted, this result is attributed to arbitrage between index-linked products and their underlying assets, and an excess of volatility can thus be inferred. For investment-grade corporate bonds, Dannhauser C. (2017) shows that holding ETFs reduces liquidity. Holden, Nam (2019), by contrast, shows/demonstrates that a positive effect on the liquidity of high-yield bonds is observed. Dannhauser C., S. Hoseinzade (2017) also establishes that, in the context of Fed Tapering (2010-2015),there is a significant and distinct impact (e.g. compared with active and passive mutual funds) on the liquidity of the underlying assets held by ETFs. In this case, ETF investment flows cause pressure on bond yields111 (attributed to directional short-term trading strategies112 and a failure of arbitrage – see 2.1.2.4 b)), which only subsides after 7 months. Lastly, Sushko V., G. Turner (2018) examines extreme episodes of volatility, specifically the taper tantrum (2013), an episode of equity market volatility (2015) and the US presidential election (2016). Investment behaviour (net flows) is diverse and is less volatile for passively managed funds (excluding ETFs) than for actively managed funds and ETFs. However, outflows are more persistent for actively managed funds.
b) Impact cost and exploitation of information asymmetries An impact of investment flows is to be expected, especially for flows focused on specific universes, such as certain emerging markets, and/or concentrated at specific times, for example when changes are made to the methodology used or to index composition. Several factors can lead to impact costs. Firstly, the rebalancing of indices noted above (2.1.2.1 b)). According to Raddatz C., S. Schmukler, T. Williams (2017), abnormal asset returns and exchange rate changes/variations observed in such cases are consistent with an investment flow impact hypothesis. The inclusion of China in MSCI’s emerging indices has led the firm to negotiate with stakeholders (Chinese and American authorities, major clients), 111 A standard deviation increase in outflows increased spreads by 12.4 basis points in September 2013 – i.e. a 10.8% (8.5%) increase in the median (average) spread compared with the start of the “taper tantrum”. 112 “the literature suggests that […] short-horizon investment can be a source of fragility is if these investors engage in positive feedback trading, buying when the market is moving higher and selling when the market is moving lower. […] To test if these new corporate bond investors utilize a positive feedback strategy, we follow Edelen, Warner (2001), Goetzmann W., M. Massa (2003) and Warther V. (1995) by examining the sensitivity of investors to lagged market returns over the period from January 2010 to March 2015”.

- 44 -
in particular regarding the extent and progressiveness of the changes made. IMF (2019) also highlights the impacts of the inclusion113 of new types of Chinese bonds in the Bloomberg Barclays Global Aggregate Index. 114 Significant liquidity effects are also associated with rebalancing. For example, during the Greek debt crisis in July 2010, the Euro MTS index, having failed to exclude this debt from its indices,115 experienced pricing difficulties and the index had to be restructured. The effects of investment reallocations can be substantial (see 2.1.2.2 d)). Following the “taper tantrum” of May 2013, Shek J., I. Shim, H. Shin (2015) assesses the significance and impact on bond markets of the investment flows of collective investment funds in emerging countries (“100 dollars’ worth of EME international bond sales is associated with around 4 dollars’ worth of valuation losses”). As a consequence of the predominance of active investing (98% of amounts invested in emerging bond funds), however, they do not characterise the specific impact of the use of indices. For a broad sample of US ETFs and for non-fundamental demand shocks, Brown D, S. Davies, M. Ringgenberg (2019) howevershow that inflows/outflows have significant impacts on asset prices. More generally, the predictability of index fund investment flows associated with rebalancing and the resulting abnormal returns introduces a risk of adverse selection (front running). The implementation of index replication therefore involves, to varying degrees, choices between partly conflicting objectives: the index administrator’s transparency regarding index composition (predictability of changes), the ETF manager’s limitations on performance tracking (tracking error), and the investor’s performance (transaction cost losses due to adverse selection). For the annual revisions of the Russell indices from 1996 to 2001, Madhavan A. (2003) shows that index tracking by ETFs creates a high cost in the form of a premium to liquidity-providing counterparties. Chen H., V. Singal, G. Noronha (2006) 116 calculates that the magnitude of these wealth transfers to the detriment of ETF unitholders lies at 184 basis points (Russell 2000) or 12 basis points (S&P 500). Another source of vulnerability of continuous market liquidity potentially attributable to the development of ETFs is also identified by Raillon (2019) and Clark, Giritharan, Stanton (2018), which highlight the increasing concentration of equity trading volumes at the closing fixing of stock markets (Box 10).
113 See April 2019 Bloomberg announcement; “Index inclusion seen making China bond market no. 2 globally”; 01/04/2019. 114 See footnote 89. 115 The FTSE Government Bond Indexes (WGBI/EGBI) had excluded Greek debt earlier. 116 “The loss to an investor in the Russell 2000 may be about 130 basis points a year and can be as high as 184 basis points a year, and S&P 500 investors.”

- 45 -
Conversely, Moallemi C., B. Park, B. Van Roy (2009) demonstrates the effectiveness of investors’ execution algorithms in reducing the impact of trades. Frazzini A., R. Israel, T. Moskowitz (2018) also shows that the impact costs of index funds are often overestimated. On examination of the impact costs of AQR Capital, a large institutional investor (“a large arbitrageur, who is likely the marginal investor in markets”) that uses an index-based strategy, the study shows that these costs are “many times smaller than those claimed in the literature”. Furthermore, Aquilina M., K. Croxson, G. Valentini, L. Vass (2019) was unable to identify any failure by market makers to provide liquidity in times of stress in the Fixed Income ETF markets.
Box 9 – Specific risks of bond index investing 1) Growth in bond index investing. The growing importance of bond index investing noted in 1.3.3 can be explained in particular by the normative use of indices, in this case to assess the performance of portfolio management. Institutional investment in bonds tends to refer systematically to indices: “[…] the development of benchmarks for assessing even fixed-income managers […] led to the idea of being overweight or underweight relative to the index weightings and the idea of relative tracking error against the index performance"i. In this regard, there is a relative tension between index offerings favouring narrow and liquid indices, which can be used as underlying reference by derivatives, and the demand for broad indices, representative of the managers’ market. This growth also reflects institutional investors’ search for yield in a low interest rate environment and their need of liquidity. The search for yield leads to the development of riskier bond ETFs: “flows into fixed income ETFs have gravitated across strategies such as high yield, investment grade corporate bonds and emerging market debt, with demand coming especially from investors based in currency regions with low or negative interest rates, such as Europe and Japan"ii and “Bond ETFs are increasingly being used as a proxy for higher-yielding investments such as BBB bonds"iii. ETFs are estimated to account for 25% of bond investments in emerging market debt. The liquidity needs of investors are primarily a reflection of institutional investors with liability constraints. In particular, “As of 1 May 2019, the UK Pensions industry was £1.66trn (€1.85trn) of assets, earmarked to meet liabilities of over £1.84trn (€2.06trn). In the UK, 73% of pension funds have become cash flow negative, and across Europe this number stands at 64%"iv. In this context, a cash flow-driven investing (CDI) package is being offered, which aims to integrate into one “investment pocket” (5%-10% of the portfolio) cash management and other instruments, in particular ETFs, which are considered attractive in particular because of their low transaction costs. 2) Specific characteristics of bond indices. These indices’ construction presents difficulties because: - Their universe, which is much more fragmented than that of equities, is characterised by many different series, even for the same issuer, reflecting a variety of characteristics (credit quality, maturity, currency, etc.); - Their liquidity, which is generally lower as a result, also decreases during the life of the product (on-the-run/off-the-run series); - Their weighting generally reflects, as in equity markets, the outstandings issued, whereas these outstandings and market capitalisation have a very different economic meaning/significance . 3) Three risks identified on this basis: - A risk related to the weighting of indices by outstanding issues: The more indebted the issuer, the higher its weight in the index, which positively correlates the index and the credit risk. The risk is then one of underestimating correlated and extreme credit risks: “until the point that the issuer is near to default – or the market starts to worry about default – an investor will still clip the coupons, so the flaws manifest themselves as episodic point risk, such as in the euro crisis, when the problems of over-indebtedness in the European periphery were brought into sharp focus"v. Furthermore, Dathan, Davydenko (2018) shows that demand from passive investors has a procyclical effect, prompting larger bonds to be issued, at lower rates, with longer maturities and less protection. These limitations are well known and favour the use of alternative weightings (e.g. smart beta), but their adoption is not without its complexities and is gradual (“a significant amount of the market does not want to – or cannot – go down what is fundamentally an active approach to investing”vi). - A risk of non-investability of the indicesvii: Some bond indices are only partially investable, due to the unavailability of certain issues on the markets. This is visible in less liquid markets (emerging, convertible), for which indices are regularly better ranked than the funds that use them as benchmarks. This risk also reflects the limitations of the concept of representativeness for bond indices. - Liquidity risks associated in particular with the search for yield. The literature, especially when the ETF is structurally more liquid than its underlying market, points to “liquidity transformation” risks. Dannhauser C., S. Hoseinzade (2017) associates these risks with the prevalence of certain trading strategies in secondary markets. Bhattacharya A., M. O’Hara (2018) highlights these risks when the investability of the underlying assets is limited. Anadu K., M. Kruttli, P. McCabe, E. Osambela, C. Shin (2019) highlights by contrast that the secondary market can play a buffer role (absent from unlisted funds) because, firstly, market counterparties (contrarian) are likely to satisfy investors’ demand for liquidity, and secondly, the majority of redemptions are processed in kind (by exchanging the ETF share for the underlying basket). In other words, the cost of illiquidity is borne by the end investor, not by the ETF. i) Marie-Anne Allier, Amundi. ii) Antoine Lesné, SSGA. iii) Detlef Glow, Lipper-Refinitiv. iv) Armit Bhambra, BlackRock. v) Gareth Turner, JP Morgan AM cited in (I&PE (2019a,b)). vii) Problems of investability of hedge fund indices are discussed in Lhabitant F-S. (2006). vii) “State Street temporarily stops cash redemptions for muni-bond ETFs”, Wall Street Journal, 21/06/2013.

- 46 -
2.1.2.4 Limits of arbitrage and investor rationality
a) Arbitrage: limits and negative externalities The market anomalies observed (co-movement, excessive volatility, autocorrelation of returns, etc.) raise questions about the role of arbitrage and the possible imperfections that the market might fail to correct (market failures). 117 , 118 Firstly, the cost of implementing arbitrage naturally leads to friction. Lau (2015) reports that arbitrageurs approximate the composition of baskets of equities (sampling) and the financing constraints of prime brokers, which concentrate the effects of arbitrage on the most heavily weighted and most liquid securities in the indices. Apart from this, any limits that may affect arbitrage (Gromb D., D. Vayanos (2010)) – e.g. restrictions on short selling, leverage, or available capital – do not seem to be particularly significant.119 On markets where high-frequency algorithmic trading (HFT) is used, some arbitrage opportunities between index-linked products are effectively 117 Wurgler J., E. Zhuravskaya (2002): “behavioral asset pricing models […] must always explain first why arbitrage fails”. 118 Conversely, an improvement in efficiency is not necessarily caused by arbitrage: the intraday frequency analysis of the CAC 40 by Deville L., C. Gresse, B. de Séverac (2014), for example, shows that, following the introduction of an ETF, an improvement in the efficiency of the futures contract is not necessarily caused by arbitrage, and that other factors must therefore be at work. 119 Conversely, Palia D., S. Sokolinski (2019) shows that passive management by supporting securities lending and borrowing, and hence short selling, makes a positive contribution to the efficiency of price formation.
Box 10 – Concentration of liquidity at the closing fixing/auction Continuous trading of ETFs results in the creation by AP intermediaries of positions, which are unwound at the end of the day by exchanging (generally in kind) the basket of equities in the index for ETF units created on this occasion by the ETF manager. This results in a concentration of trading in the underlying equities of ETF indices at the end of the trading session. This factor is identified by Raillon F. (2019) as a likely reason for the increasing concentration of trading at the closing fixing of exchanges, to the detriment of continuous trading (Figure 23). The strengthening under MiFID 2 of asset managers’ reporting obligations (best execution) – e.g. transparency to the client (Transaction Costs Analysis) and reporting to the authorities – also promotes execution at fixing times because it simplifies processing and reduces reporting costs. This phenomenon is likely to be self-sustaining since the concentration of liquidity improves execution quality and therefore attracts increased trading volumes (liquidity begets liquidity). Raillon F. (2019) considers two types of risk. First, that the use of the fixing time is at the expense of and undermines the continuous trading process. For example, on 29 March 2019, the LVMH share price fell by 8.0% in the minutes following the opening fixing, raising questions about the lack of liquidity. More generally, it should be verified here whether the development in the use of the fixing time increases volatility and the frequency of market events (mini flash crashes). Second, the fixing process itself can be vulnerable, especially when orders (e.g. “market” orders) do not contribute to price formation. The concentration of trades at one point in time also increases vulnerability to operational risks. For example, a market operator’s error on 8 May 2018 caused a 9.0% rise in the closing price of Suez Environnement’s stock (corrected at the opening the next day by an 8.3% fall). Distorting effects on price formation were observed. It is a known fact that stock prices tend to follow a “J-curve” during the trading session. Serikova E. (2019) shows that the daily fixings make a significant contribution to this daily share price periodicity (especially for large-cap stocks). More generally, Clark D., K. Giritharan, E. Stanton (2018) (Figure 24) questions the impact of the closing fixing on price formation (price drift). Figure 23 – CAC 40: Share of trading volume at fixing time (%) Figure 24 – Price dislocation* by volume traded at fixing time (%)
Source: AMF. Source: Clark D., K. Giritharan, E. Stanton (2018), ITG. *Difference between closing price and mid-quote of a VWAP 30 mins before the closing fixing. *The following index futures that have the same securities as the EURO STOXX 50 are considered here: AEX 25, CAC 40, DAX 30, FTSE MIB 30 and IBEX 35. It should be noted that the weight of EURO STOXX 50 securities is particularly high for the CAC 40 (75% against 35% for the BEL 20). **In the United States, where ETFs are particularly well established, the closing fixing accounts for 8% of trading volumes on the stock market (Rosenblatt (2019)).

- 47 -
eliminated very quickly (Box 9; Hasbrouck J. (2003)). In any event, the profitability of arbitrage seems significant: between 2001 and 2010, Marshall B., N. Nguyen, N. Visaltanachoti (2013) estimates that arbitrage opportunities between two ETFs on the S&P 500 were 6.6% per year (net of spread).120 Two main factors, however, seem to limit arbitrage. Firstly, the volatility resulting from uninformed trading (noise) (DeLong J-B., A. Shleifer, L. Summers, R. Waldmann (1990)). Brown D., S. Davies, M. Ringgenberg (2019) notes: “Importantly, while arbitrageurs trade to correct relative mispricing, their trades do not correct fundamental mispricing. Thus, in the long term, the prices of both the ETF and the underlying assets exhibit return predictability as the fundamental mispricing corrects”. The study demonstrates this result empirically in the United States, by considering non-fundamental shocks due to ETF investment flows. Ben-David I., F. Franzoni, R. Moussawi (2018) explains that following a non-fundamental liquidity shock, uninformed arbitrage (e.g. statistical arbitrage by HFT operators) tends to correct the price difference between the ETF and its NAV, but that the convergence of the ETF price and underlying asset price can occur at a different level from that of their fundamental value. Shim J. (2019) shows that arbitrage strategies that do not take into account the specific market impact of index components also lead to an over-reaction by those stocks exposed to them and an under-reaction by those that are not. Secondly, (Bhattacharya A., M. O’Hara (2018), Brown D., S. Davies, M. Ringgenberg (2019)), the frequency of trading in illiquid underlying assets and the strategy time frame also influence arbitrage, particularly in the context of the development of ETFs with illiquid underlying assets. Bhattacharya A., M. O’Hara (2018) points out that the illiquidity of assets (e.g. bonds) acts as a brake on arbitrage. Kondor P. (2009) also shows that finite-time arbitrage strategies between two highly similar assets traded in different markets may not eliminate abnormal returns associated with price differences, even in the absence of constraints. Therefore, the implementation of arbitrage strategies is not, in principle, incompatible with the anomalies observed (co-movement, volatility, predictability of returns), nor with certain deviations of asset prices from their fundamental value. Moreover, it is important to note that these arbitrage limits are likely to produce significant effects in cases of market stress. Pasquariello P. (2014) shows a concentration of violations of the no-arbitrage opportunity hypothesis in multiple markets in these situations.
b) Lack of investor capacity to process information In addition to the imperfections of the market information processes described, various cognitive biases among investors are mentioned to explain the valuation anomalies of index-linked products and their components.121 According to the category approach (Mullainathan S. (2002), Peng L., W. Xiong (2006)),122 investors prefer aggregate information on markets or sectors to information about specific firms. According to the so-called “habitat theory” (Barberis N., A. Shleifer, J. Wurgler (2005)), investors or certain types of investors, whether individual or institutional, choose to deal only with some of the available assets because of a lack of information, the cost of information, restrictions on trading opportunities (consider French PEAs), etc. They therefore have a “preferred habitat”.
120 Chen H., V. Singal, G. Noronha (2006) for the S&P 500 and Russell indices and Greenwood R., N. Sosner (2007) for the Nikkei 225 report arbitrage opportunities that seem to be seized on, because a rapid reversion is noted. 121 Busse J., E. Elton, M. Gruber (2011), for example, shows that investors can opt for the more expensive of two substitutable products (passive funds and ETFs). That said, these choices are not incompatible with a certain rationality if some investors are informed and others are not and if there is a lack of ability/if there is no way to arbitrage between cost/lower-performing and less-cost/better-performing funds. 122 Peng L., W. Xiong (2006) considers psychological factors that limit investors’ ability to acquire information (without explicit consideration of information acquisition costs). These limitations lead to category-based learning processes that favour segment or aggregate market information over firm-specific information. Combined with overconfidence, these properties explain the observed co-movement of asset prices.

- 48 -
Claessens S., Y. Yafen (2012) shows, based on several empirical tests, that cognitive approaches (by category, habitat) go a long way towards explaining the co-movement and increase in beta values resulting from their inclusion in blue chip indices, although informational factors also partly explain these observations.
2.2 Strategies and competition from index producers
2.2.1 Trends The main players are consolidating, growing organically and through acquisitions, and establishing strategic partnerships. Firstly, in addition to their rapid organic growth, there has been a marked trend towards consolidation among the main index administrators over the past few years. This is borne out, in particular, by the merger of the Standard & Poor’s and Dow Jones indices in 2012, which, despite its primarily domestic source of income, has created the world’s largest index administrator.123 The acquisitions by the LSE/FTSE of the Russell indices in 2014, the Yield Book & Citi bond indices in 2017, and Refinitiv in 2019 (on-going)124 also reflect this. More generally, numerous acquisitions are under way by the main players with a view to consolidating – as in the case of ICE’s takeover of Bank of America’s MOVE indices125 – or expanding the range of indices they offer – by acquiring specialists in interest rate markets, commodity markets, ESG risk assessment, non-listed share and debt markets, etc.126 A counterexample is provided by the emergence of a new entrant, namely the German company Solactive, initially in the extremely mature listed equity indices market segment. Many smaller players are also active in niche segments. Unsurprisingly, there are specialist players in innovative and growth markets (ESG, strategies, etc.). However, the challenge they pose to the main promoters is slight, since they are often absorbed/acquired when/as the market develops, as is the case of MSCI’s acquisition 127 of several rating agencies specialising in ESG: KLD, Innovest, IRRC and GMI Ratings128. At the same time, major banks also tend to develop index ranges primarily for the specific needs of their clients and “customise” the assets underlying their products (e.g. warrants, certificates, autocalls, etc.).
123 The merged S&P Dow Jones LLC is a joint venture between S&P Global (formerly McGraw Hill Financial), CME Group and News Corp. 124 See Financial Times; “London Stock Exchange agrees $2.7bn Russell Investments deal”; 26/06/2014; Financial Times; “LSE confirms $27bn bet on Refinitiv, data being the future”; 29/07/2019. 125 Financial Times; “ICE expands data business by buying MOVE indices”; 06/08/2019. 126 Examples: acquisition of TMC Bonds by ICE, after that of the BAML bond indices. Still in 2017, LSEG acquired The Yield Book, Citi Fixed Income Indices for 679 million dollars, and completed the USD 147 million acquisition of Mergent, a provider of listed and non-listed asset data. In January 2020, MSCI acquired a USD190 million participation in Burgiss, provider of data on private equity, private real estate, private debt, infrastructure, etc. 127 MSCI has also expanded its range of services through the acquisition of Barra in 2004, RiskMetrics and Measurisk in 2010, and other acquisitions such as Investment Property Databank in 2012 and ICG Group in 2013. 128 NB: meanwhile major credit rating agencies develop also ESG rating capabilities. Moody’s, for example, acquired Vigeo in 2019. Some, like Morningstar are also index providers.

- 49 -
2.2.2 Strategic issues
a) Vertical integration Constraints on index development. Notwithstanding the economies of scale from which they can benefit, index producers come up against barriers to develop new indices, in particular because of constraints on access, firstly, upstream in terms of data useful for calculating the indices and, secondly, downstream when it comes to their distribution. The consolidation noted above aims to break free from these constraints by “value chain” integration (see Diagram 1). Prior to calculation (taking place), consolidation integrates the provision of data and indices, in particular by enhancing the promotion of indices by stock markets. Subsequently, this is integrated into redistribution and marketing tools (e.g. the acquisition of Refinitiv). Index producers’ access to useful data and development of proprietary strategies. The growing prevalence of financial ties between index administrators and stock exchanges, or even the integration of the former into the latter, is a major trend in recent industry developments129 that illustrates the benefit of index administrators’ privileged access to data on the assets underlying their indices. At the same time, data providers have also developed index administration services. 130 The growth in the use of electronic trading, including products that were previously mainly traded over-the-counter, has boosted the growth of indices based on FICC (Fixed Income, Commodities and Currencies) asset classes. 131 Examples include indices such as the MTS Index administered by FTSE Russell, the UBS Commodities Index administered by Bloomberg and the S&P GSCI.132 These indices were initially (as early as the 1990s) promoted by market intermediaries (inter-dealer brokers or IDBs) with privileged access to data on the trading services they provided. However, although there are still many exceptions,133 market intermediaries – such as Goldman Sachs, which sold the GSCI indices to Standard & Poor’s in 2007, or Bank of America Merrill Lynch, which sold its bond indices to ICE in 2017 – have tended to withdraw from the market to the benefit of established players. This trend reflects, of course, the benefits of specialisation and economies of scale (calculation, management and distribution infrastructures), but also those of automation, the introduction of transparency rules, and the opening up of the data market in these areas/fields/sectors. Index innovation is mainly based on the use of proprietary or “value-added” data such as ESG ratings and the integration of investment strategies into indices. The need to supply ESG rating data leads, for example, to growth either through acquiring specialists and organic growth (see the example of MSCI) or through developing joint ventures or strategic partnerships (consider Dow Jones and Robeco SAM). Accordingly, the proximity of index administrators to their data sources (the combination of functions 1 and 2 in Diagram 1) is likely to create a competitive advantage, and their access to data may be perceived as questionable.134,135
129 The major index administrators are now affiliated to stock market operators – for example, S&P Dow Jones to the CME, FTSE Russell to the LSE, STOXX to Deutsche Börse. MSCI is an exception here. However, the CBoE has announced a project/partnership? with MSCI on international equity volatility indices. 130 Not only by long-standing providers, but also by initially not-for-profit data providers such as the CRSP at the University of Chicago. 131 The annual reports of the leading index administrators provide evidence of this segment’s strong growth in profitability. 132 A discontinuity in the name of the index due to the change of its sponsor and administrator is observed here: the UBS Commodities Futures Index administered by Bloomberg was initially (from 1998) promoted by AIG and administered by Dow Jones. In May 2009, AIG’s bankruptcy forced it to transfer its rights to the index to UBS. It then changed its name to Dow Jones-UBS Commodity. In 2014, UBS changed the administrator of the index to Bloomberg and the index was renamed the Bloomberg Commodity Index. 133 Many interest rate and credit market intermediaries are index administrators (JP Morgan, IHS Markit, Citigroup, BNP Paribas, Société Générale, etc.). 134 According to ETF.com on 23/02/2012: “Even data collected via free quotes from dealers and distributed by IDBs, commonly used in the creation of custom indices, has become a chargeable item under the derived data part of market data distributors’ policies”. 135 It also raises the possibility of the emergence of conflicts of interest, similar to those revealed in the interbank sector for IBOR risk-free rates. The management of these risks is, however, specifically addressed by the BMR.
- 50 -
Integrating strategies within indices generally involves the use of proprietary formulae that may include a degree of discretion. Based initially on strategies that were previously specific to equity indices (e.g. smart beta fixed income indices), it also tends to integrate strategic allocation elements (multi-asset). Access to indices by issuers of index-linked products may give rise to another type/form of discrimination. 136 In particular, the exclusive right to develop and market index-linked products may be a barrier to competition between index producers. Such barriers are more likely to arise in cases of vertical integration between the index administrator and the intermediary using and/or distributing the index-linked products down the value chain (cumulation of functions 2 and 4 and/or 5 in Diagram 1) and affect different stakeholders in different ways. The main US index fund managers account for the bulk of index assets under management, with three players (BlackRock, Vanguard and State Street) controlling 80% of the market.137 Their high level of assets under management, although forming an important revenue base, is subject to fairly low unit pricing (allowing/enabling for example the launch of zero-cost ETFs). In other words, the competitive pressure on index producers, driven by competition between passive managers, appears to dominate the effect of market power or discriminatory vertical integration in the market segments concerned. However, this competition is not present in all market segments. For product development purposes, the access of listed derivatives markets to indices, for example, appears to be largely limited to the indices they administer. In other words, listed derivatives generally use138 the proprietary indices of the stock exchanges that promote them, such as the CME, Eurex or ICE. 139 A potentially discriminatory vertical integration is therefore observed in this segment.140
b) Concentration vs differentiation Broadly speaking, index administrators generate their revenue from two main complementary sources, either from assets under management or traded volumes (volume effect), or from more innovative or complex products with better/higher/greater margins (price effect).
• Concentration Economies of scale and barriers to entry – Part of their revenues continues to come from the administration of traditional indices, typically “cap-weighted” blue-chip indices (S&P 500, MSCI World, STOXX 50, FTSE 100, CAC 40, etc.), which account for a large share of the holdings of index-linked products. These revenues benefit from the development of passive management and the success of ETFs (see 1.3). Underlying indices have relatively low management costs, thanks to the accessibility of the data used to calculate them and the standardisation and automation of management formulae and calculations (Box 2). Moreover, they are systematically included in broader families of indices (e.g. “box style” indices that combine the characteristics of the underlying assets). With the exception of indices that incorporate proprietary management elements (e.g. smart beta), this market cannot in principle be contested, because of economies of scale (allowing for low index user fees), reputation effects (guarantee of operational continuity), ratchet effects (technical and legal
136 MSCI’s annual report highlights the risks of a lack of vertical integration up and down the value chain for an independent index administrator: “We are dependent on third parties to supply data and software for our products and are dependent on certain vendors to distribute our data. A refusal by a key vendor to distribute our data or any loss of key outside suppliers of data or software products or reduction in the accuracy or quality of such data or products or any failure by us to comply with our vendors’ licensing requirements could impair our ability to provide our clients with the data, products or services they desire, which could have a material adverse effect on our business, financial condition or results of operations”. 137 See Financial Times; “Index companies to feel the chill of fund managers’ price war”; 20/05/2019. 138 A derivative can be based on other index-linked products (e.g. ETF futures, options on index futures). 139 Note: Exceptions to this observation are instructive. For example, structured products and warrants (over-the-counter options) promoted by intermediaries are often linked to indices promoted by markets other than those on which they are listed. 140 Note: Article 37 of MiFID (non-discriminatory access to benchmarks and licensing requirements) aims to improve trading platforms’ access to indices administered by third-party platforms.

- 51 -
difficulty for an issuer of an index-linked product to change the underlying index), and the concentrated holdings of index-linked products (see previous section). Some exceptions were noted. Vanguard, the world’s second largest fund manager by assets under management, abandoned the MSCI index benchmark for 22 of its funds in 2012 in order to use the joint services of CRSP and FTSE Russell. In September 2018, State Street Global Advisors (SSGA) replaced MSCI for four of its ETFs with the independent German administrator Solactive,141 whose range of traditional equity indices is aggressively priced (fixed licence fees decoupled from the amount of assets under management). Furthermore, investment strategies that integrate systematic portfolio management rules into an index are now a simple and effective marketing tool. In an environment where the level and growth of promoters’ profitability (see below) may exceed that of their portfolio management clients, self-indexation can appear as an alternative. As a specialist in factor investment, WisdomTree was one of the first to pave the way. Others such as BlackRock, State Street, Invesco and Charles Schwab followed suit. Portfolio managers then became competitors to administrators of established indices. At this stage, however, the supply of portfolio managers still appears to be limited.142 Thus, while the economies of scale of index producers inherently create barriers to entry, the exercise of market power by index producers is likely to reflect primarily an ability to segment the client base analysed below. Figure 25 – Revenue and market shares of index administrators (annual revenue in millions of dollars)
Source: Burton-Taylor International, Financial Times, Les Echos, AMF.
• Differentiation Advantageous pricing, for their promoters, of “value-added” indices (e.g. ESG, smart beta, etc. (Box 12)) creates incentives for innovation and is likely to result in market segmentation. For example, some market intermediaries structure (often) index-linked products, listed or unlisted, whether derivatives (e.g. warrants, i.e. over-the-counter options) or structured debt products (certificates, autocalls, etc.). These products often have very specific characteristics that restrict the emergence of a secondary market (proprietary distribution), and they tend to use proprietary indices. They thus contribute to the development of a range of indices whose “contestability” must be ensured.
141 However, the halving of the expense ratio achieved here also reflects the shift from smart beta to cap-weighted indices. See Financial Times; “Race to cut costs poised to disrupt index industry”; 26/11/2018. 142 RIMES; WatersTechnology (2019).

- 52 -
2.2.3 Changing competitive arena Fee structures – The fee structures of the major index administrators consist of several components. They are generally based on licensing through recurring annual subscriptions, the fees for which are paid in advance and vary depending on the product offered, the number of users and/or the volume of services. Secondly, fees are charged for the use of indices as the underlying indices of financial products. Accordingly, licence fees are charged for the use of intellectual property relating to the underlying indices of ETFs, passive management funds or managed accounts. In general, they are based on the actual assets under management and are therefore collected in arrears. Similarly, exchanges listing index futures and options pay licence fees based on trading volumes. Lastly, revenue is generated from the provision of data and consulting services (typically access to historical data on the level and composition of the index, weightings, etc.), subscriptions to periodic reports, briefing notes, and publications associated with the indices being offered. They vary in each case and acoording to the degree to which the service is customised; they may be collected as subscriptions or one-off fees. In particular, the use of data on the components of an index and their weights in performance reports, related marketing material, institutional reports or even investment fund regulatory reports may be subject to a fee. Moreover, in recent years, data providers have tended to add their own fees, charging for the index data transmission service related to/linked to/associated with the service provided by index producers. Price differentiation – Licensing agreements are generally offered to investment funds that replicate indices or use them as benchmarks. The fees paid by different clients for the same licence vary. In particular, fees for active funds are generally lower than for passive funds. For this reason, index promoters have also benefited from the ETF boom in recent years. Invoicing (expressed in basis points per annum of assets under management) has thus generated recurring income flows that have grown with the funds’ assets under management. For structured products, fees related to licensing generally vary less. In the past, licences tended to be negotiated through the front office (the issuer of the products). Single-trade licences were then invoiced in basis points for the notional amount issued, either at issue only or annually. Since then, issuers’ legal and market data departments have tended to negotiate blanket or annual/flat-rate licences, allowing unlimited issues on a particular index or even on a family of indices for one or more years. This pricing is generally cost-effective for the issuer. Often, however, the most popular indices are excluded from the scope of blanket licences and from the option of paying per-transaction licence fees. Furthermore, in recent years, index sponsors have sought to expand the uses of fee-based indices, in particular to regulate the use of indices in connection with fund administration and securities servicing activities and to introduce licensing agreements. The more complex the offering, the less transparent the pricing – The development of index administrators’ business models and fee structures is instructive. In the late 1990s, the main promoters of “domestic” US stock market indices (e.g. Dow Jones and Standard & Poor’s) wanted to challenge the global promoters, MSCI and FTSE. With the advent of the internet drastically reducing the costs of publishing granular information and promoting the
Box 11 – Example: Structure of operating revenues for MSCI’s ESG and Real Estate product lines Based on the operating margin derived from ESG and real estate products, innovative or expanding market segments, while strategic, are not necessarily the most profitable for index producers, especially when compared to the index business as a whole (Box 12). Table 10 – Operating revenues for MSCI LLC’s ESG and Real Estate product lines in 2016 and 2017 (USD thousands)
2017 2016 Annual Var. Recurring subscriptions 93,481 84,457 9,024 10.7% Non-recurring 3,463 4,308 -845 -19.6% Total operating revenue 96,944 88,765 8,179 9.2% Adjusted EBITDA 11,783 9,472 2,311 24.4% Adjusted EBITDA margin (%) 12.2% 10.7%
Source: MSCI annual reports.

- 53 -
growth of the Net Economy, 143 they introduced aggressive new fee structures. In this environment, access to all index data (history, weights, components, changes, etc.) was published and made available free of charge, with only the use of the indices as an underlying financial product being fee-based. For example, STOXX Ltd, initially a joint venture between Dow Jones Indices, the Paris Stock Exchange, Deutsche Börse and the Swiss Stock Exchange (at the time SWX), adopted this business model to develop its range of European indices. As the competitive position of these players strengthened, they returned to pricing models similar to those of MSCI and FTSE, based both on the use of the indices themselves as underlying financial products and the related information dissemination services.
A very profitable industry. Global revenues of the major industry players grew 18.8% in 2017 and 13.4% in 2018, to $3.5 billion.144 In this environment, solid profit margins of over 65% are being achieved. An example is provided by MSCI (Box 12), which reports an adjusted operating margin of 72.8% for 2018. It should be noted, however, that the transparency that MSCI has demonstrated around the profitability of its index promotion activities has, to our knowledge, no equivalent among its counterparts in consolidated groups. Following the merger and acquisition process noted above, including the S&P and Dow Jones and FTSE and Russell mergers, the aggregate market share of the S&P Dow Jones, MSCI and FTSE Russell was estimated by some consultants to be 71.6% in 2018. While themarket remains contested (see 2.2.1 and 2.2.2 b)), in particular as a result of a few large asset managers and certain banks promoting proprietary indices, this concentration and profitability reflect, based on the fee structures mentioned, the ability of index producers to discriminate their clients.
143 Models where “internet” firms finance/financed indirectly (advertising, related services, etc.) the dissemination of information about their core business. 144 Based on estimates by Burton-Taylor International Consulting including MSCI, FTSE Russell, S&P Dow Jones, STOXX Ltd, Nasdaq, Bloomberg, Solactive, InterContinental Exchange, CRSP and Morningstar.
Box 12 – Example: Structure of operating revenues for MSCI’s index business The structure of MSCI’s operating revenues from its index business in 2017 and 2018 (Table 10) confirms the instinctive view of market trends: the majority of the index administrator’s revenues continues to come from recurring subscriptions. In 2017 and 2018, they grew by 9.7% and 11.8% respectively. Driven by its “core business” products, but also by new products (factor, ESG, and customised or specialised indices) and the growth in its clients’ assets managed by clients, hedge funds and asset management, the increase in recurring revenues (run rate), up 11.4% in 2018 following a 10.9% increase in 2017, continues. However, very strong revenue growth (+31.3%) was driven by the rise in assets under management for index-linked products (derivatives and ETFs). While the growth in ETF revenues also reflects cyclical changes in the value of assets under management, the 38.8% growth in 2017, based on trading volumes in derivatives (futures contracts and options on listed MSCI indices), is probably more structural. Table 11 – Operating revenues for MSCI LLC’s index business in 2016 and 2017 (USD thousands)
31 Dec 31 Dec 31 Dec Annual Var. 2018 2017 2016 2018/17 2017/16 Recurring subscriptions 477,612 427,289 389,348 11.8% 9.7% Asset-based charges 336,565 276,092 210,229 21.9% 31.3% Non-recurring 21,298 15,578 13,974 36.7% 11.5% Total operating revenue 835,475 718,959 613,551 16.2% 17.2% Adjusted EBITDA 607,853 522,043 431,478 16.4% 21.0% Adjusted EBITDA margin (%) 72.8% 72.6% 70.3%
Source: MSCI annual reports.

- 54 -
2.3 Guidance
2.3.1 Risks and recommendations identified Following the above review of the market for indices and index-linked products and the related literature, a review of potential risks is presented here (Table 12). From a global (international) perspective, three main types of risks are considered: those of inefficient market organisation or even market failure, those of investor protection, and those of financial stability. In addition to the heterogeneity of risks – which also depends on the markets being considered – there is also the heterogeneity of the regulatory frameworks applicable to risk management, particularly since the framework established by the BMR has no clear equivalent outside Europe.145 Despite this, the degree to which these risks are documented is assessed and the ability to manage them is briefly reviewed in an attempt to prioritise and make initial recommendations. The following risks have been identified:
a) Distortion of the price formation process (co-movement, volatility) Literature studied (2.1.2.2) documents the prevalence of “relative” arbitrage strategies, i.e. ensuring the convergence and uniqueness of substitutable asset prices (e.g. ETFs and underlying baskets). However, it also fairly widely demonstrates the concurrent development of passive management (ETFs) and market inefficiencies – “anomalies” (co-movement, volatility) that characterise relative distortions in the price formation process. These effects can generally be attributed firstly to uninformed trading and/or investors’ cognitive biases, and secondly to investment strategies prevailing in secondary markets, in particular “relative” arbitrage strategies that do not necessarily ensure that prices adjust to their fundamental value in the short term, and various strategies (e.g. liquidity-providing strategies), based on observing the trading process, that may have procyclical effects locally.
b) Less basic informational content on prices; passive management “free riding” Some studies (Blitz (2014)) see passive management as a “free rider” of active management. Some (rarer) studies (do) indicate a reduction in the informational content of equity prices as a result of their inclusion in ETFs (e.g. a decrease in the number of analysts covering them). It seems here that the market tends to place less value on firm-specific information and favour aggregate, “macro” market information. The impacts of this risk are potentially significant, since they are associated with: (i) reduced access to, and the increased costs of, market information, about which many market participants (buy-side) complain, but which still needs to be quantitatively substantiated; (ii) changes in the way financial analysis is financed (MiFID 2). These are also associated with a growing use of non-financial information (ESG). Beyond its contribution to restoring price consistency (the law of one price) and reducing certain market inefficiencies (speed of incorporating relevant market information based on observing the trading process), the impact assessment (2.1.2.2) questions the extent to which “fundamental” arbitrage actually contributes to the integration of relevant information (e.g. financial analysis) into asset prices and to the long-term equilibrium of asset prices. It therefore raises questions about possible market failures. For example, there is a lack of capacity on the part of active managers to take advantage of market inefficiencies. It is worth noting that this risk is not necessarily caused by the increase in passive management.
145 The Australian framework, for example, has however been identified as equivalent to the BMR framework (see ASIC press release of 21/10/2019 “ESMA and ASIC to co-operate on benchmarks”). In the United Kingdom, the European framework is still prevalent.
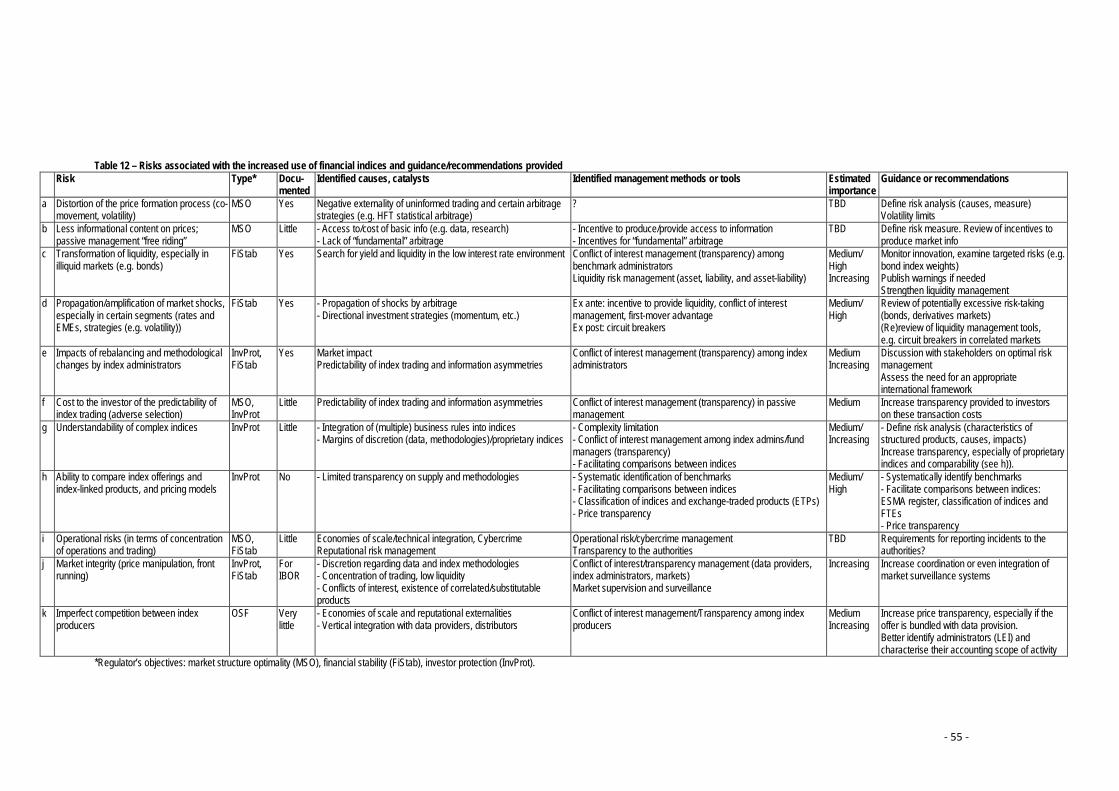
- 55 -
Table 12 – Risks associated with the increased use of financial indices and guidance/recommendations provided Risk Type* Docu-
mented Identified causes, catalysts Identified management methods or tools Estimated
importance Guidance or recommendations
a Distortion of the price formation process (co-movement, volatility)
MSO Yes Negative externality of uninformed trading and certain arbitrage strategies (e.g. HFT statistical arbitrage)
? TBD Define risk analysis (causes, measure) Volatility limits
b Less informational content on prices; passive management “free riding”
MSO Little - Access to/cost of basic info (e.g. data, research) - Lack of “fundamental” arbitrage
- Incentive to produce/provide access to information - Incentives for “fundamental” arbitrage
TBD Define risk measure. Review of incentives to produce market info
c Transformation of liquidity, especially in illiquid markets (e.g. bonds)
FiStab Yes Search for yield and liquidity in the low interest rate environment Conflict of interest management (transparency) among benchmark administrators Liquidity risk management (asset, liability, and asset-liability)
Medium/ High Increasing
Monitor innovation, examine targeted risks (e.g. bond index weights) Publish warnings if needed Strengthen liquidity management
d Propagation/amplification of market shocks, especially in certain segments (rates and EMEs, strategies (e.g. volatility))
FiStab Yes - Propagation of shocks by arbitrage - Directional investment strategies (momentum, etc.)
Ex ante: incentive to provide liquidity, conflict of interest management, first-mover advantage Ex post: circuit breakers
Medium/ High
Review of potentially excessive risk-taking (bonds, derivatives markets) (Re)review of liquidity management tools, e.g. circuit breakers in correlated markets
e Impacts of rebalancing and methodological changes by index administrators
InvProt, FiStab
Yes Market impact Predictability of index trading and information asymmetries
Conflict of interest management (transparency) among index administrators
Medium Increasing
Discussion with stakeholders on optimal risk management Assess the need for an appropriate international framework
f Cost to the investor of the predictability of index trading (adverse selection)
MSO, InvProt
Little Predictability of index trading and information asymmetries Conflict of interest management (transparency) in passive management
Medium Increase transparency provided to investors on these transaction costs
g Understandability of complex indices InvProt Little - Integration of (multiple) business rules into indices - Margins of discretion (data, methodologies)/proprietary indices
- Complexity limitation - Conflict of interest management among index admins/fund managers (transparency) - Facilitating comparisons between indices
Medium/ Increasing
- Define risk analysis (characteristics of structured products, causes, impacts) Increase transparency, especially of proprietary indices and comparability (see h)).
h Ability to compare index offerings and index-linked products, and pricing models
InvProt No - Limited transparency on supply and methodologies
- Systematic identification of benchmarks - Facilitating comparisons between indices - Classification of indices and exchange-traded products (ETPs) - Price transparency
Medium/ High
- Systematically identify benchmarks - Facilitate comparisons between indices: ESMA register, classification of indices and FTEs - Price transparency
i Operational risks (in terms of concentration of operations and trading)
MSO, FiStab
Little Economies of scale/technical integration, Cybercrime Reputational risk management
Operational risk/cybercrime management Transparency to the authorities
TBD Requirements for reporting incidents to the authorities?
j Market integrity (price manipulation, front running)
InvProt, FiStab
For IBOR
- Discretion regarding data and index methodologies - Concentration of trading, low liquidity - Conflicts of interest, existence of correlated/substitutable products
Conflict of interest/transparency management (data providers, index administrators, markets) Market supervision and surveillance
Increasing Increase coordination or even integration of market surveillance systems
k Imperfect competition between index producers
OSF Very little
- Economies of scale and reputational externalities - Vertical integration with data providers, distributors
Conflict of interest management/Transparency among index producers
Medium Increasing
Increase price transparency, especially if the offer is bundled with data provision. Better identify administrators (LEI) and characterise their accounting scope of activity
*Regulator’s objectives: market structure optimality (MSO), financial stability (FiStab), investor protection (InvProt).
- 56 -
In any event, since the fundamental equilibrium market price of assets is essentially unobservable, assessing the quality of price formation is an indirect and difficult exercise. Therefore, the available observations remain largely to be confirmed and clarified.
c) Transformation of liquidity, especially in bond and illiquid markets This risk, driven primarily by institutional investors’ search for yield and liquidity, also reflects the emergence of a market structure specific to passive bond management: innovation in indices, new ways of trading bonds, etc. The risks of liquidity transformation in investment funds are highlighted in the abundant literature (2.1.2.3), particularly from macroprudential authorities. The risks also relate specifically to passive management. An exogenous market shock (a redemption shock, on asset prices or liquidity) could, in some scenarios, generate market impacts and redemptions of fund units as part of a procyclical process. Trading dynamics, for example associated with arbitrage and liquidity provision, may also produce disruptive effects. Vulnerability specific to funds, but also that of ETFs, must be put into perspective, however, as ETFs are often treated in kind146 and their liquidity, insofar as it is additional to that of the underlying assets, may conversely act as an additional liquidity buffer. This risk warrants particular vigilance in the current low interest rate environment. It requires examining vulnerabilities of the entire “value chain” of the investments concerned: from index promoters and rating agencies (managing information asymmetries and conflicts of interest) to market intermediaries (incentives and liquidity risk management) and ultimately end investors. Fund and ETF structure resilience is only one aspect of the risk management (due diligence, asset-liability management) involved in institutional investment. As an area of innovation with significant issues around transparency (investability, representativeness, weighting, etc.), the risks surrounding bond indices are nevertheless considered significant (Medium/High).
d) Propagation/amplification of market shocks in certain market segments (emerging markets, strategy indices, e.g. volatile, leveraged) or systemic
Index-linked products de facto create market interconnections that promote the propagation of shocks. However, managing this type of risk is not new to the markets that have developed different trading interruption mechanisms. ETFs facilitate institutional financing flows to emerging countries, risk transfers on derivatives markets (selling volatility protection (VIX)), etc. However, poor risk assessments can lead to disruptive effects such as the abrupt unwinding of positions and asset reallocations (e.g. flight to quality). Some ETF structures (e.g. leveraged or inverse ETFs) can also concentrate liquidity demands locally (consider the VIX disruptive episode). Trading interruptions have proved highly effective in managing (ex post) the contagion risks to market stability, when they are adapted to the risks involved (Benhami K., C. Le Moign (2017)). Bhattacharya A., M.O’Hara (2018) makes recommendations to limit the spread of market instability: (i) introduce appropriate circuit breakers “designed to kick in whenever underlying illiquidity threatens to morph into the kind of herding spiral […] described”, which, according to the authors, would require a specific in-depth examination of circuit breakers; (ii) specifically consider assets with persistent illiquidity and order flow biased towards the systematic factor, which distorts price formation including that of derivatives; one option would be to promote the use of derivatives of highly diversified indices, for which the bias is less significant; (iii) fundamentally increase transparency and limit the cost of information on underlying assets to reduce the risk of procyclicality (herding) by shortening the time needed to integrate market information (correction of inefficiencies).
146 Created on the primary market by exchanging, between funds and Authorised Participants, the basket of underlying assets for ETF units, i.e. without cash exchange/without necessarily participating in the underlying market (Box 6).

- 57 -
More generally, it is recommended (2.1.2.2) that the role of index-linked products be reconsidered in light of changes in market structure. It is clearly important to ensure that investors are properly informed of the risks of index investing (transparency regarding the data and methodologies used to calculate indices). More generally, and from a medium-term perspective, the authorities could also play a role in providing information on the transfer of market risks at the aggregate level (e.g. the amount of risky short and long positions by market participant category).147
e) Impacts of methodological changes and index rebalancing The market impacts of methodological changes and index rebalancing can be quite significant (2.1.2.1). They expose index administrators to significant conflicts of interest (e.g. between issuers of the underlying assets, data providers and index users), and managing these determines the balance between methodological transparency (which leads to the predictability of trading) and managing the market impacts of the changes. Managing these conflicts of interest is at this stage essentially a question of private initiative, although it may raise financial stability issues. It therefore raises questions about the need for specific arrangements to manage the associated risks.
f) Cost to investors of the predictability of index trading (adverse selection) The predictability of passive management trading can lead to high transaction costs. If the trading strategies of market participants can predict certain trades, they can contribute to increasing the cost of their impact. For example, a participant anticipating an increase in demand for a security may buy it in expectation of a price increase (due to the anticipated increase in demand). In so doing, the participant rations the supply of securities and increases the cost of trading for subsequent buyers. In other words, this effect, known as adverse (or anti-) selection, leads to an increase in the transient component of the impact cost of buy transactions. This risk, which is poorly documented, is potentially high compared with the level of passive management fees. In the interest of unitholders, it is therefore important to provide transparency regarding these costs.
g) Comprehensibility of complex indices In an environment where indices tend to systematically incorporate (active) management rules, indices are becoming more complex (proliferation of management rules) and include increasingly more margin for discretion. The limits to the comprehensibility of indices pose risks for investors in structured products (see 1.2.4). Similar issues arise when offering indices that combine multiple criteria – for example, involving illiquid assets (e.g. bonds) and/or factor (e.g. smart beta) and/or ESG criteria.148 More detailed assessment of these risks is needed: firstly, to further refine, beyond the approaches taken at national level by competent authorities, the characterisation and identification of complex products; and secondly, to assess in this context the substitutability between the complexity of index-linked products (e.g. structured notes, Demartini A., N. Mosson (2019)) and the complexity of the underlying indices of financial products.
h) Ability to compare index offerings and index-linked products, and pricing models In addition to complexity, distinct comprehensibility risks pertain to the comprehension of the fundamental nature of risk factors, their persistence, and the practical constraints on the ability
147 According to Kodres L., M. Pritsker (2002), “Most of the contagious price response in a given country occurs because the order flow from cross-market rebalancing from other countries is partially misinterpreted as being related to information about asset values within that particular country. The model suggests that one possible protection against undesired, excessive price movements is a reduction in informational asymmetries through better transparency and more open access to information underlying the value of assets”. 148 Roncalli T. (2017) points out the difficulty of defining alternative risk premia compared to traditional risk premia.

- 58 -
to effectively capture performance (investability, stock picking, transaction costs, etc.). For example, Haghani J., V. White (2019) stress, for smart beta indices, the critical importance of understanding the root causes of index performance persistence. However, transparency of index offerings is limited by the lack of systematic identification of indices, the difficulty of comparing index offerings (in the absence of any harmonisation surrounding index and index-linked product categories) and methodologies, which results in an inability to replicate - carrying out or simulate)- the selection of index components, even when prices of the underlying stocks are available. In a consultation document published prior to a revision of the BMR, 149 the European Commission points out the purpose of introducing Benchmark Statements, which are information documents that supplement the index methodologies introduced by the BMR (Article 27(1)): “The aim is to enable users of benchmarks to choose appropriate benchmarks and to understand the economic reality that the benchmark or family of benchmark is intended to measure and the risks attached to the benchmarks”. It questions the usefulness of these documents in view of the fact that “different practices among administrators may however impede comparability among benchmark statements”. It also notes that they tend to duplicate the methodologies. In this context, consideration could be given to supporting the systematic identification of financial indices, requesting, where appropriate, that lists of indices be provided to ESMA, as required for third-country indices listed on its website. Harmonised index classification could also assist with comparisons, which, given the porous boundaries between these products, would be a valuable addition to index-linked product classification. This expectation has been echoed by various market participants for ETPs,150 which span very/highly disparate product categories. In any event, the conceptual difficulty of establishing mutually exclusive categories (asset classes, strategies, etc.) would lead to the adoption of multi-criteria approaches in this area. Greater fee transparency would also be useful (see k) below).
i) Operational risks (in terms of concentration of operations and trading) Concentration of traders (2.2.2 b)) and index trading increases operational risks. These concern primarily the resilience of index calculation, an aspect that the BMR supervisory framework helps to manage in Europe, particularly for critical indices/benchmarks. In an environment where the concentration of trading on certain indices increases vulnerabilities, and where the incentives of index managers to ensure resilience still rely heavily on reputational externalities,151 it has not been possible to systematically identify incidents of errors or interruptions in calculating indices, or even examples of permanent withdrawal from the market, in order to analyse their causes and effects.152 The vulnerability to cybersecurity risks linked to the concentration of passive management within certain management companies was also highlighted by the Financial Stability Oversight Council (FSOC (2018)).
j) Market integrity (price manipulation, front running) There are several factors that can increase risks to market integrity. Firstly, the development of trading based on correlations between assets and asset classes (e.g. statistical arbitrage) – in an environment of increased trading in index-linked products and baskets of equities – makes it more difficult to detect manipulative or front-running
149 EU COM; Consultation document: Review of the EU benchmark regulation; 11/10/2019. 150 DTCC (2018) and EFAMA (2019). 151 The guarantee of good risk management is linked to the risk that failures would damage the reputation of the index administrator, in an environment where indices are primarily marketed as brands. 152 Tucker J., P. Sanchez-Marin (2003) analyses some cases of disruption in the United States.

- 59 -
strategies.153 Angel J., L. Harris, C. Spatt (2010), for example, highlights the risk of front running using correlated instruments.154 Secondly, by concentrating orders and trades of certain players and/or on certain products or market segments, the development of index management increases the ability to implement – and potentially gain from – manipulative strategies. Suffice it here to remember the IBOR manipulations that led to the adoption of the BMR system in Europe and a wide-ranging reform of reference rate methodologies (Near Risk-Free Rates RFRs). A further example 155 is provided by the concentration of trades at the closing auction (Box 10), which is not necessarily risk-free. A significant proportion of “at any price” market orders raises the possibility for limit orders to impact the closing price and, insofar as it may be to its detriment, it increases the vulnerability of liquidity and continuous trading-price formation. The materiality of the increase in such risk and the specific role of indices in that respect would need to be further clarified.
k) Imperfect competition between index producers The growth of the index industry affects its competitive environment (2.2). The market for “traditional” indices emerges de facto as oligopolistic. Established index markets are generally not open to challenge. Due to the advantage of early entrants,156 players tend to bundle their index offerings and related information services and to differentiate on pricing and fees. For innovative indices, barriers to entry (new markets) and profitability (due to research and marketing efforts) are initially lower. Their competition, which is monopolistic, 157 leads to consolidation and differentiation strategies and encourages innovation, but it also limits collective efficiency (rationing of demand by price) and the clarity of the product offering (differentiation). They encourage rapid change in the sector, which is reflected in:
- Vertical consolidation of the industry particularly within stock exchange and distribution channels, thereby creating potential conflicts of interest.
- A polarisation of supply between traditional equity indices (volume-driven revenues) and innovative indices (price-driven revenues), which are often complex are growing both in pace of development and number.
In addition, the competitive limitations associated with the vertical integration of the index value chain (Diagram 1) lead to conflicts of interest, particularly in relation to the sale of market information (data required to calculate indices, information and data on indices). Conflict management is at the heart of the BMR supervisory framework in Europe (Box 1), and the authorities, in this regard, promote the clarity and comparability of product offerings. To this end, they may wish to consider promoting a systematic and harmonised identification of index producers (LEI), of the indices themselves (ISIN) and, where appropriate, of index-linked products (e.g. UPIs). Based on this, the development of harmonised classifications of indices and index-linked products would also improve the clarity and comparability of offerings (see h) above).
153 Insider trading in which an intermediary uses information on its clients’ order flow and takes proprietary positions contrary to their interests, in breach of its best execution obligations. 154 “[…] front-running a customer’s order in the same instrument is illegal, we are concerned about front running in correlated instruments. For example, buying S&P 500 futures contracts while holding a large open customer buy order in an S&P 500 ETF (to profit from the expected price impact of the customer order) should be illegal since arbitrageurs will quickly shift the price impact of the broker’s order in the futures market to the ETF market where it will increase the cost of filling the customer’s order”. 155 Bai Q., S. Bond, B. Hatch (2012) shows that the impact on the underlying assets of unwinding leveraged ETFs at the daily close is hedged at the time the next trading session starts, a possible sign of manipulation. 156 The activity tends to be focused (winner takes all) on the first product in a particular market (e.g. ETFs of blue chips). This advantage is linked in particular to the positive externalities of liquidity (liquidity begets liquidity). 157 A form of competition characterised by the ability of producers to differentiate in order to create monopolies but also by the contestability of these monopolies (low barriers to entry and/or limited product differentiation/partial substitutability) (Chamberlin E. (1933)).

- 60 -
2.3.2 Multiple avenues to be (further) explored Three major lines/paths of investigation have been identified, which have not initially been explored in depth because they merit further or specific analysis. They are: 1) The risks to investor protection associated with the use of indices, in an environment where transparency and comprehensibility in of indices tends to be based on:
- Access to proprietary data and/or non-financial information that may be difficult to access, is costly and/or involves complex data valuation issues;
- The ability to explain how the index calculation rules incorporate complex and/or discretionary information that until now has tended to characterise portfolio management strategies. In particular, certain conflicts of interest may result from the use by market intermediaries and portfolio managers of proprietary indices.
2) The effects of the growth of index-linked management on the governance of listed companies: Index-linked management brings both advantages, such as extending investors’ time horizons, and disadvantages, such as the limited ability to allocate significant resources to research and information processing given their low management fees. This is the case in the United States, where Azar J., S. Schmalz, M. Tecu (2018) and Azar J., M. Sahil, I. Schmalz (2016) attribute the lower level of competition between index component companies to the strategic behaviour of the management companies holding these companies through index investing. The interpretation of the results from these studies, which have been challenged by the asset management industry (ICI (2018), Edkins et al. (2017)) and is still a matter of debate. More generally, the literature (e.g. James K., D. Mittendorf, A. Pirrone, C. Robles-Garcia (2019)) appears at first glance to be somewhat inconclusive regarding the impacts of passive management and ETFs on the governance of listed companies. Understanding the incentives of passive management in this area still needs to be refined, given the growing importance of the subject. Bebchuk L., S. Hirst (2019) estimates that the giants of index management (the Big Three – Vanguard, BlackRock and State Street) hold 25% of the voting rights of companies making up the S&P 500, a proportion that, according to the study, is set to rise to 40% over the next two decades. 3) The issues related to IBOR reference rates, given the potentially systemic impact of their manipulations, were initially one of the main reasons for the adoption of the IOSCO (2013) and BMR principles in Europe. They are, however, quite distinct from the issues related to the industry primarily considered in this analysis. Focused analysis (e.g. Duffie D., J. Stein (2015), Hernando-Veciana A., M. Tröge (2018)) is helping to guide the ongoing reforms. An assessment of the impacts of these reforms, as a follow-up to Aquilina et al (2018), would be useful.

- 61 -
2.3.3 Research paths Financial indices and their effects on secondary markets (liquidity, price formation) benefit from extensive academic literature, which is both conceptually and empirically rich. This field of research remains fertile, and it is up to the regulator to capitalise on the wealth of debate in the industry and academia. In order to focus on contributions that are useful specifically to it, it is key that the regulator help to guide and inform this work. In addition to the topics that are not dealt with in detail here (2.3.2), many studies focus on supply-side topics related to opportunities for innovation (risk factors, ESG, etc.) and on the analysis of certain anomalies in the formation of market equilibria, themselves related to the use of indices frequently based on observable facts such as index rebalancing. They largely focus on the US market, the S&P 500 index, and ETFs. On the one hand, it appears that the impact of the use of indices on the formation of market equilibria and financial stability remains largely unclear. This involves assessing the informational inefficiencies, in particular the materiality of the risk of a fundamental deterioration in the price formation process identified by certain academic references (e.g. Israeli D., C. Lee, S. Sridharan (2017)). It also involves better identifying the causes of the market anomalies observed, depending on whether they reflect the rational preferences of agents, cognitive limitations, information failures, or the effects of market structure (trading strategies, market organisation). A better understanding of the effects of the increasing use of index derivatives, the adverse selection of ETF unitholders, the effects and limits of arbitrage, and the importance and effects of uninformed trading would be useful. Buffa A., D. Vayanos, P. Woolley (2019) indicates a risk of asset price bubbles. These studies call for empirical follow-up. The regulatory implications should also be clarified, starting with making a clearer distinction between risks that can be arbitraged by the market (inefficiencies creating opportunities for arbitrage, innovation and information provision) and those that require intervention by the authorities (market failures). Exploring the implications of vulnerabilities to liquidity shocks and contagion would also be useful. On the other hand, some areas of analysis are still incomplete. For example, it is regrettable that there is no cross-sectional perspective on the index market itself – its structure, its volume, its equilibria. Researchers’ access to data on indices and their use is generally restricted because of their commercial nature. The industrial economics of index provision is also largely ignored in the literature. Analysis of the use of proprietary indices (self-indexation) by market intermediaries would, for example, be helpful in this regard. Lastly, the impact of indices on investor protection, market integrity and operational resilience would seem, as yet, to have received only sparing attention.

- 62 -
References Abou Gergi Z. (2020), Evolving into an eco-friendly system: The real ESG challenge, CFAI blog; 16/03/20 Acharya V., L. Pedersen (2005); Asset pricing with liquidity risk; Journal of Financial Economics 77-2, 375-410
10.1016/j.jfineco.2004.06.007 Adrian T., E. Etula, T. Muir (2014); Financial intermediaries and the cross-section of asset returns; Journal of Finance 69-6,
2557-2596, DOI: 10.1111/jofi.12189 Agapova A., Volkov N. (2018); ETFs and price volatility of underlying, unpublished
https://www.aeaweb.org/conference/2019/preliminary/paper/ZyyD7R8t Agarwal V., P. Hanouna, R. Moussawi, C. Stahel (2018); Do ETFs increase the commonality in liquidity of underlying stocks?;
unpubl. Aggarwal R., L. Schofield (2012), The growth of global ETFs and regulatory challenges http://dx.doi.org/10.2139/ssrn.2001060 Aldasoro I., T. Ehlers (2018); The CDS market: What a difference a decade makes, in BIS quarterly review, June Alexander C., M. Dakos (2019); A critical investigation of cryptocurrency data and analysis
http://dx.doi.org/10.2139/ssrn.3382828 Alexander C., Dimitriu A. (2003); Sources of over-performance in equity markets; mean reversion, common trends and herding;
EFMA 2004 Basel Meetings Paper http://dx.doi.org/10.2139/ssrn.493823 Amenc N., F. Goltz, V. Le Sourd (2006); Etude Af2i-EDHEC sur l'évaluation de la qualité des indices de marché : Exigences
pour l'allocation d'actifs et la mesure de performance Amenc N., F. Goltz, L. Tang (2010); Adoption of Green Investing by institutional investors; EDHEC survey AMF (2017); Study of market shock propagation; AMF Risk & Trend Mapping AMF (2019); 2019 Markets and Risk Outlook Anadu K., M. Kruttli, P. McCabe, E. Osambela, C. Shin (2019); The shift from active to passive investing: Potential risks to
financial stability http://dx.doi.org/10.2139/ssrn.3244467 Ang A., Madhavan A., Sobczyk A. (2018); What's in Your Benchmark; A Factor Analysis of Major Market Indexes; Institutional
Investor Journal 9-2 https://doi.org/10.3905/jii.2018.9.2.066 Ang A., R. Ratcliffe, P. Miranda (2018); Capacity of smart beta strategies from a transaction cost perspective; Institutional Investor
Journal 8–3 https://doi.org/10.3905/jii.2017.8.3.039 Angel J., L. Harris, C. Spatt (2010); Equity trading in the 21st century; USC Marshall Finance and Business Economics
Research Paper 09-10 Angel, James J. and Harris, Lawrence and Spatt, Chester S., Equity Trading in the 21st Century; Marshall School of Business Working Paper FBE 09-10 http://dx.doi.org/10.2139/ssrn.158402
Anton M., F. Ederer, M. Gine, M. Schmalz (2016); Common ownership, competition, and top management incentives; Ross School of Business Paper 1328; ECGI Finance Working Paper 511/2017 http://dx.doi.org/10.2139/ssrn.2802332
Appel I., T. Gormley, D. Keim (2016); Passive Investors, Not Passive Owners; Journal of Financial Economics 121-1, 111-141 http://dx.doi.org/10.1016/j.jfineco.2016.03.003
Aquilina M., K. Croxson, G. Valentini, L. Vass (2019); Fixed-income ETFs-Primary market participation resilience-liquidity during periods of stress; FCA Research Note; Aug.
Aquilina M., G. Ibikunle, V. Mollica, A. Pirrone, T. Steffen, (2018); The Visible Hand: Benchmarks, Regulation and liquidity Arnott R., J. Hsu, P. Moore (2005); Fundamental Indexation; Financial Analysts Journal 61-2, 83-99
http://dx.doi.org/10.2139/ssrn.604842 Arnott R., M. Clements, V. Kalesnik, J. Linnainmaa (2019); Factor momentum http://dx.doi.org/10.2139/ssrn.3116974 Artus P (2012); Le problème majeur sur les marchés financiers : 'fondamentalistes' et 'chartistes' ; Flash Economie Natixis ;
28 fév. Ascolese M., J. Cerniauskas, A. Molino, S. Pérez-Duarte, G. Skrzypczynski (2017); Euro-area derivatives markets: structure,
dynamics and challenges; chapter in BIS IFC Bulletin 46 on "Data needs and statistics compilation for macroprudential analysis”
Asem E., S. Alam (2011); Changes in the constituents of the S&P 500 index and the performance of the index; Midwest Finance Association 2012 Annual Meetings Paper http://dx.doi.org/10.2139/ssrn.1933197
Asness C., A. Frazzini, L. Pedersen (2012); Leverage Aversion and Risk Parity; Financial Analysts Journal 68-1, 47-59 Augustin P., M. Chernov, L. Schmid, D. Song (2019); Benchmark interest rates when the government is risky; NBER Working
Paper 26429 http://dx.doi.org/10.3386/w26429 Avellaneda M., S. Zhang (2009); Path; Dependence of Leveraged ETF Returns http://dx.doi.org/10.2139/ssrn.1404708 Azar J., S. Sahil, M. Schmalz (2016); Ultimate Ownership and Bank Competition; http://dx.doi.org/10.2139/ssrn.2710252 Azar J., M. Schmalz, I. Tecu (2018); Anti-Competitive Effects of Common Ownership; Journal of Finance 73-4, 1513-1565
https://doi.org/10.1111/jofi.12698 Bai Q., S. Bond, B. Hatch (2014); The impact of leveraged and inverse ETFs on underlying real estate returns; Real Estate
Economics 43-1, 37-66, https://doi.org/10.1111/1540-6229.12061 Baker M., L/ Litov, A. Wachter, J. Wurgler (2004); Can mutual fund managers pick stocks; NBER Working Paper 10685; Aug.
https://doi.org/10.3386/w10685 Baltussen G., S. van Bekkum, Z. Da (2019); Indexing and stock market serial dependence around the world Journal of Financial
Economics 132-1, 26-48 https://doi.org/10.1016/j.jfineco.2018.07.016 Bams R., D. Otten (2004); How to measure mutual fund performance; Accounting and Finance 44-2, 203-222 Barberis N., A. Shleifer, J. Wurgler (2002); Comovement; NBER Working Paper 8895 https://doi.org/10.3386/w8895 Bartram S., G. Brown, R. Stulz (2019); Why is there a secular decline in idiosyncratic risk in the 2000s; Ohio State University,
Charles A. Dice Center Working Paper 2019-19 http://dx.doi.org/10.2139/ssrn.3450845 Basak S., A. Pavlova (2012); Asset prices and institutional investors http://dx.doi.org/10.2139/ssrn.1572342 Basak S., A. Pavlova (2016); A model of financialization of commodities; Journal of Finance 71; 4 Basak S., A. Pavlova, A. Shapiro (2007); Offsetting the Implicit Incentives; Benefits of Benchmarking in Money Management;
CEPR Discussion Paper 5006 http://dx.doi.org/10.2139/ssrn.403140 Bauer R., R. Koedijk, K. Otten (2006); International evidence on ethical mutual funds; Journal of Banking and Finance 29-7,
1751-1767 http://doi.org/10.1016/j.jbankfin.2004.06.035

- 63 -
Beaudan P., S. He (2019); Applying Machine Learning to Trading Strategies-Using Logistic Regression to Build Momentum-Based Trading Strategies http://dx.doi.org/10.2139/ssrn.3325656
Bebchuk L., A. Cohen, S. Hirst (2017); The Agency Problems of Institutional Investors, 31 Journal of Economic Perspectives 31-3, 89-112 https://doi.org/10.1257/jep.31.3.89
Bebchuk L., S. Hirst (2018); Index Funds and the Future of Corporate Governance: Theory, Evidence, and Policy, Columbia Law Review 119-8 http://dx.doi.org/10.2139/ssrn.3282794
Belasco E., M. Fink, D. Nanigian (2012); The impact of passive investing on corporate valuations; Managerial Finance 38-11, 1067-1084 https://doi.org/10.1108/03074351211266793
Ben David I., F. Franzoni, R. Moussawi (2012); ETFs, arbitrage, and contagion; Ohio State University, Fisher College of Business Working Paper 03-020
Ben-David I., F. Franzoni, R. Moussawi (2014); Do ETFs increase volatility; Journal of Finance 73-6, 2471-2535 https://doi.org/10.1111/jofi.12727
Ben-David I., F. Franzoni, R. Moussawi (2017); ETFs; Annual Review of Financial Economics Ben-David I., F. Franzoni, R. Moussawi (2019); A note to 'Do ETFs increase volatility?': An improved method to predict
assignment of stocks into Russell indexes; NBER Working Paper 26370 https://doi.org/10.3386/w26370 Benhami K., C. Le Moign (2017); ETF's characteristics: overview and risk analysis; The case of the French market; AMF Risk &
Trends Bennani L., T. Le Guénédal, F. Lepetit, L. Ly, V. Mortier, T. Roncalli, T. Sekine (2018); How ESG Investing has impacted the
asset pricing in the equity market; Amundi Discussion Paper 36 http://dx.doi.org/10.2139/ssrn.3316862 Bennani L., T. Le Guénédal, F. Lepetit, L. Ly, V. Mortier, T. Sekine (2018); The Alpha and Beta of ESG investing; Amundi
Working Paper 76 Benzaquen M., J-P. Bouchaud, Z. Eisler, I. Mastromatteo (2017); Dissecting cross-impact on stock markets: An empirical
analysis; Journal of Statistical Mechanics 2017-2 http://dx.doi.org/10.1088/1742-5468/aa53f7 Berk J., J. van Binsbergen (2015); Measuring skill in the mutual fund industry; Journal of Financial Economics 118-1, 1-20
https://doi.org/10.1016/j.jfineco.2015.05.002 Bernales A., G. Cortazar, L. Salamunic, G. Skiadopoulos (2018); Learning and Index Option Returns, Oct.
https://doi.org/10.1080/07350015.2018.1505629 Bertaut C., A. Tabova, V. Wong (2014); The replacement of safe assets; Evidence from the U.S. bond portfolio; FRB International
Finance Discussion Paper 1123 http://dx.doi.org/10.2139/ssrn.2569200 Bessembinder H., A. Carrion, L. Tuttle, K. Venkataraman (2016); Liquidity, resiliency and market quality around predictable
trades; Theory and evidence; Journal of Financial Economics 121-1, 142-166 Bhattacharya U., N. Galpin (2011), The global rise of the value-weighted portfolio, Journal of Financial and Quantitative Analysis
46-3, 737-756 https://doi.org/10.1017/S0022109011000044 Bhattacharya A., M. O'Hara (2018); Can ETFs increase market fragility: effect of information linkages in ETF markets; April
http://dx.doi.org/10.2139/ssrn.2740699 Binsbergen J., C. Opp (2019); Real anomalies; Journal of Finance 74-4, 1659-1706 https://doi.org/10.1111/jofi.12771 Bioy H., K. Lamont (2018); Passive sustainable funds: The global landscape; The Journal of Index Investing 9-3, 4-17
https://doi.org/10.3905/jii.2018.1.063 BIS (2013); Sovereign risk; A world without risk; free assets; BIS Working Paper 72 BIS CGFS (2003); Incentive structures in institutional asset management and their implications for financial markets; CGFS
Paper 21; Mar Black F. (1972); Capital Market Equilibrium with Restricted Borrowing; Journal of Business 45-3, 444-455
http://dx.doi.org/10.1086/295472 Black F. (1986); Noise; Journal of Finance 41-3, 528-543 https://doi.org/10.1111/j.1540-6261.1986.tb04513.x Blake D. (2018); Longevity; A new asset class http://dx.doi.org/10.2139/ssrn.3271280 Blake C., E. Elton, M. Gruber (1993); The performance of bond mutual funds; The Journal of Business 66-3, 370-403
https://doi.org/10.1086/296609 Bleiberg S., W. Priest, D. Pearl (2017); The Impact of Passive Investing; Epoch Investment Partners; May Blitz D. (2014); The dark side of passive investing; Robeco White Paper Blocher J., R. Whaley (2016); Two-sided markets on asset management: ETFs and securities lending; Vanderbilt Owen Graduate
School of Management Research Paper 24749 http://doi.org/10.2139/ssrn.2474904 Bogle J. (2014); All-In Investment Expenses-Financial Analysts Journal 70-1, 5-8 https://doi.org/10.2469/faj.v70.n1.1 Bolla L., A. Kohler, H. Wittig (2016), Index-linked investing—A curse for the stability of financial markets around the globe?,
Journal of Portfolio Management 42-1, 26-43 https://doi.org/10.3905/jpm.2016.42.3.026 Boone A., J. White (2015); The Effect of Institutional Ownership on Firm Transparency and Information Production; Journal of
Financial Economics 117-3, 508-533 https://doi.org/10.1016/j.jfineco.2015.05.008 Booth R. (2012); Index funds and securities fraud litigation; Villanova Law Public Policy Research Paper 2013-3046
https://doi.org/10.2139/ssrn.1996587 Borkovec M., I. Domowitz, V. Serbin, H. Yegerman (2010); Liquidity & Price Discovery in ETFs: One of several possible lessons
from the flash crash; ITG Report; May Branger N., R. Flacke, F. Middelhoff (2019); Jumps and the Correlation Risk Premium: Evidence from Equity Options Branger,
http://dx.doi.org/10.2139/ssrn.3448522 Braunsteffer A., C. Guagliano, J. Mazzacurati, O. Kenny, (2019); Use of credit default swaps by UCITS funds: Evidence from EU
regulatory data; ESRB Working Paper 95 Breugem M., A. Buss (2019); Institutional investors and information acquisition: Implications for asset prices and informational
efficiency; Review of Financial Studies, 32-6, 2260–2301 https://doi.org/10.1093/rfs/hhy103 Brière M., Szafarz (2017); Factor investing; The Rocky Road from Long-Only to Long-Short; Amundi Working Paper 63; April
http://doi.org/10.2139/ssrn.2908491 Broby D. (2007); A Guide to equity index construction; Ed. Riskbooks ISBN-13: 978-1904339779 Brogaard J., M. Ringgenberg, D. Sovich (2019); The real impact of index investing; Review of Financial Studies, Society for
Financial Studies, 32-9, 3461-3499 https://doi.org/10.1093/rfs/hhy129

- 64 -
Broman M. (2016); Liquidity, Style Investing, and Excess Comovement of ETF Returns; Journal of Financial Markets 30, https://doi.org/10.1016/j.finmar.2016.05.002
Broman M., P. Shum (2018); Relative liquidity, fund flows and short; term demand; Evidence from ETFs; Financial Review 53, 87-115 https://doi.org/10.1111/fire.12159
Brooks R., D. Chance, M. Hemler (2019); The “Superior Performance” of Covered Calls on the S&P 500: Rethinking an Anomaly; The Journal of Derivatives https://doi.org/10.3905/jod.2019.1.087
Brown D., S. Davies, M. Ringgenberg (2019); ETF Flows, non-fundamental demand, and return predictability http://dx.doi.org/10.2139/ssrn.2872414
Brown S., I. Hwang, F. In (2013); Why optimal diversification cannot outperform naive diversification: Evidence from tail risk exposure http://doi.org/10.2139/ssrn.2242694
Bruder B., M. Hassine Konqui, S. Darolles (2018); What role has passive management left for active management? Lyxor AM; Dec.
Buffa A., D. Vayanos, P. Woolley (2019); Asset management contracts and equilibrium prices; Boston University School of Management Research Paper 2492529 http://dx.doi.org/10.2139/ssrn.2492529
Bunzel T., S. Cohen, A. Madhavan, S. Matthews, B. Novick, J. Sethi (2017); Index investing supports vibrant capital markets; BlackRock Viewpoint; Oct.
Buraschi A., R. Kosowski, W. Sritrakul (2014); Incentives and Endogenous Risk Taking; Implications for Hedge Fund Alphas; Journal of Finance 69-6 2819-2870 https://doi.org/10.1111/jofi.12167
Burnham T., H. Gakidis, J. Wurgler (2017); Investing in the Presence of Massive Flows; MSCI reclassifications; NBER Working Paper 23557 https://doi.org/10.3386/w23557
Busse J., E. Elton, M. Gruber (2005); Are investors rational? Choices among index funds; Journal of Finance 59-1, 261-288 https://doi.org/10.1111/j.1540-6261.2004.00633.x
Busse J., A. Goyal, S. Wahal (2010); Persistence and performance in institutional investments; Journal of Finance 65-2, 765-790 https://doi.org/10.1111/j.1540-6261.2009.01550.x
Busse J., A. Goyal, S. Wahal (2014); Investing in a Global World; Review of Finance 18-2, 561-590, https://doi.org/10.1093/rof/rft015
Büyükşahin B., M. Robe (2012); Speculators, Commodities and Cross; Market Linkages; Journal of International Money and Finance https://doi.org/42 10.2139/ssrn.1707103
Caloiero E., M. Guidolin (2017); Volatility as an Alternative Asset Class; Does It Improve Portfolio Performance; Quantitative Finance and Economics 1-4, 334-362 10.3934/QFE.2017.4.334
Campbell J. (2000); Asset Pricing at the Millennium; Journal of Finance 55-4, 1515-1567 https://doi.org/10.1111/0022-1082.00260
Campbell J., J. Cochrane (1997); By force or habit: A consumption-based explanation of aggregate stock market behavior; Journal of Political Economy 107(2):205-251 https://doi.org/10.2139/ssrn.1870
Campbell J., J. Coco, F. Gomes, P. Maenhout, L. Viceira (1999); Stock market mean-reversion and the optimal equity allocation of a long-lived investor; European Finance Review 5-3 https://doi.org/10.2139/ssrn.237175
Campbell J., M. Lettau, B. Malkiel, Y. Xu (2001); Have individual stocks become more volatile? An empirical exploration of idiosyncratic risk; Journal of Finance 55-4, 1-43 https://doi.org/10.1111/0022-1082.00318
Campbell J., R. Shiller (2001); Valuation ratios and the long; run stock market outlook; NBER Working Paper 8221 https://doi.org/10.3386/w8221
Campbell J., T. Vuolteenaho (2003); Bad beta, good beta; NBER Working Paper 9509 https://doi.org/10.3386/w9509 Campbell J., M. Yogo (2002); Efficient test of stock return predictability; Journal of Financial Economics 81-1, 27-60
https://doi.org/10.1016/j.jfineco.2005.05.008 Cao J., J. Hsu, Z. Xiao, X. Zhan (2018); Smart Beta, 'Smarter' Flows http://dx.doi.org/10.2139/ssrn.2962479 Carhart M. (1997); On Persistence in Mutual Fund Performance; Journal of Finance 52-1, 57-82; https://doi.org/10.1111/j.1540-
6261.1997.tb03808.x Carvalho L., D. Silverman (2019); Complexity and Sophistication; NBER Working Paper 26036 https://doi.org/10.3386/w26036 Cespa, Foucault (2014); Illiquidity contagion and market crashes; Review of Financial Studies 27-6, 1615–1660
https://doi.org/10.1093/rfs/hhu016 CFA Institute (2019); ESG integration in EMEA-Markets: Practices, and data; CFA Institute Report Chamberlin E. (1933); The theory of monopolistic competition The Economic Journal, 43-172, 661-666
https://doi.org/10.2307/2224511 Chan K., A. Hameed (2006); Stock price synchronicity and analyst coverage in emerging markets; Journal of
Financial Economics 80-1, 115-147 https://doi.org/10.1016/j.jfineco.2005.03.010 Chang Y., H. Hong, I. Liskovich (2015); Regression Discontinuity and the Price Effects of Stock Market Indexing; Review of
Financial Studies 28-1, 221-246 https://doi.org/10.1093/rfs/hhu041 Chung H. (2012); Has the introduction of S&P 500 ETF options led to improvements in price discovery of SPDRs?; Journal of
Futures Markets 32- 7 https://doi.org/10.1002/fut.20538 Chen J., H. Hong, J. Stein (2002); Breadth of ownership and stock returns; Journal of Financial Economics 66-2/3, 171-205
https://doi.org/10.1016/S0304-405X(02)00223-4 Chen H., V. Singal, G. Noronha (2006); Index Changes and Losses to Index Fund Investors; Financial Analyst Journal 62-4; Jul-
Aug. https://doi.org/10.2469/faj.v62.n4.4185 Cheng S., M. Massa, Zhang (2019); The Unexpected activeness of passive investors; A world-wide analysis of ETFs; The Review
of Asset Pricing Studies, 9-2, 296–355, https://doi.org/10.1093/rapstu/ray011 Chernenko S., A. Sunderam (2016); Liquidity transformation in asset management: Evidence from mutual funds' cash holdings;
NBER Working Paper 22391 https://doi.org/10.3386/w22391 Chinco A., V. Fos (2019); The sound of many funds rebalancing; CEPR Discussion Paper 13561; May 10.2139/ssrn.2764941 Choi J., S. Hoseinzade, S. Shin, H. Tehranian (2019); Corporate bond mutual funds and asset fire sales
http://dx.doi.org/10.2139/ssrn.2731844 Christophersen S., M. Simutin (2017); On the Demand for High; Beta Stocks; Evidence from Mutual Funds; The Review of
Financial Studies 30-8, 2596–2620 https://doi.org/10.1093/rfs/hhx022

- 65 -
Cici G., S. Gibson (2012); The performance of corporate bond mutual funds; Evidence based on security-level holdings; Journal of Financial and Quantitative Analysis 47-1, 159-178 https://doi.org/10.2139/ssrn.1564486
Claessens S., Y. Yafen (2012); Comovement of newly added stocks with national market indices: Evidence from around the world; Review of Finance 17-1, 203–227 https://doi.org/10.1093/rof/rfs001
Clare A., S. Thomas (2015); Financial Market Indices; Facilitating innovation, monitoring markets; Cass Business School Clark D., K. Giritharan, E. Stanton (2018); Liquidity is for Closers; The Trade News; ITG Thought Leadership; Sep. CME (2019); Group Futures and ETF Paper; White Paper; Feb. CME, Aite (2017); Conversations with the buy; side; Futures and ETFs; May Coates J. (2018); The Future of corporate governance Part I: The problem of twelve; Harvard Public Law Working Paper 19-07
http://dx.doi.org/10.2139/ssrn.3247337 Cochrane J. (2011); Presidential address-Discount rates; Journal of Finance 66-4, 1047-1108 https://doi.org/10.1111/j.1540-
6261.2011.01671.x Cole C. (2017); Volatility and the alchemy of risk; Reflexivity in the shadows of Black Monday 1987; Artemis Capital Management Cont R., L. Wagalath (2013); Running for the exit; distressed selling and endogenous correlation in financial markets
Mathematical Finance 23-4, 718-741 https://doi.org/10.1111/j.1467-9965.2011.00510.x Converse N., E. Levy-Yeyati, T. Williams (2018); How ETFs amplify the global financial cycle in emerging markets; The George
Washington University, Institute for International Economic Policy working paper 2018-1 Cowles 3rd & Associates (1939); Criticism of well-known stock indices; 2nd edition; Principia Press Inc., Bloomington, Indiana Create-Research (2019); Passive Investing 2019 - The rise of stewardship http://www.create-research-uk.com/ Cremers M., M. Ferreira, P. Matos, L. Starks (2016); Indexing and active fund management; International evidence; Journal of
Financial Economics 120-3, 539-560 https://doi.org/10.1016/j.jfineco.2016.02.008 Cremers M., A. Petajisto (2009); How active is your fund manager? A new measure that predicts performance; The Review of
Financial Studies 22-9, 3329–3365 https://doi.org/10.1093/rfs/hhp057 Cremers M., A. Petajisto, E. Zitzewitz (2010); Should benchmark indices have alpha? Revisiting performance evaluation
https://doi.org/10.2139/ssrn.1108856 Cusick P. (2002); Price Effects of Addition or Deletion from the S&P500; Evidence of increasing efficiency; Financial Markets,
Institutions and Instruments 11, 349-383 https://doi.org/10.1111/1468-0416.11405 Cuthbertson S., K. Hayley, N. Motson, D. Nitzsche (2015); Diversification returns, rebalancing returns and volatility pumping
http://dx.doi.org/10.2139/ssrn.2311240 Cuthbertson S., D. Nitzsche, N. O'Sullivan (2010); Mutual fund performance measurement and evidence; Journal of Financial
Markets, Instruments and Institutions 19-2, 95-187 https://doi.org/10.1111/j.1468-0416.2010.00156.x Da Z., S. Shive (2018); ETFs and asset return correlations; European Financial Management; 24-1, 136-168
https://doi.org/10.1111/eufm.12137 Dahiya S., D. Yermack (2018); Investment returns and distribution policies of non-profit endowment funds; NBER Working
Paper 25347 https://doi.org/10.3386/w25323 Dannhauser C. (2017); The Impact of Innovation: Evidence from corporate bond ETFs; Journal of Financial Economics 125-3,
537-560 https://doi.org/10.1016/j.jfineco.2017.06.002 Dannhauser C., S. Hoseinzade (2017); The transformation of corporate bond investors and fragility: Evidence on mutual funds
and ETFs Darolles S., C. Gouriéroux, E. Jay (2012); Robust portfolio allocation with systematic risk contribution restrictions
10.2139/ssrn.2192399 Das N. (2003); Development of an Analytical Framework for hedge fund investment Das S., R. Sundaram (1998); Fee structures in the Mutual fund industry; NBER Working Paper 6639
https://doi.org/10.3386/w6639 Dathan M., S. Davydenko (2018); Debt issuance in the era of passive investment https://doi.org/10.2139/ssrn.3152612 Davydoff (1998); Les indices boursiers; Economica, ISBN 9782717836356 Davydoff D., L. Gabaut (2011); Qui prend des risques et pourquoi ?; Risques 85; Mar. Davydoff D., M. Klages (2014); Study on the performance and efficiency of the EU asset management industry: Report to the
EU Commission and Financial Services User Group DeLong JB., A. Shleifer, L. Summers, R. Waldmann (1990); Noise trader risk in financial markets; Journal of Political Economy
98-4, 703-738 https://doi.org/10.1086/261703 Demarchi M., S. Thomas (1997); Actions françaises : interactions entre la gestion de portefeuille et la négociation en bourse;
Revue d’Economie Financière 42 Demartini A., N. Mosson (2018); Closet index funds: a contribution to the debate in Europe; AMF Risk & Trends; Jul. Demartini A., N. Mosson (2020); L'évolution de la complexité des produits structurés commercialisés en France. Quel bilan de
l'action de l'AMF ?; AMF Risk & Trends; Jan. Denis D., J. McConnell, A. Ovtchinnikov, Y. Yu (2003); S&P 500 Index Additions and Earnings Expectations; Journal of Finance
58-5, 1821-1840 https://doi.org/10.1111/1540-6261.00589 Dessaint O., T. Foucault, L. Frésard, A. Matray (2019); Noisy stock prices and corporate investment; The Review of Financial
Studies 32-7, 2625–2672 https://doi.org/10.1093/rfs/hhy115 Deville L., C. Gresse, B. de Séverac (2014); Direct and Indirect Effects of Index ETFs on Spot‐Futures Pricing and Liquidity:
Evidence from the CAC 40 Index European Financial Management 20-2, 352-373 https://doi.org/10.1111/j.1468-036X.2011.00638.x
Dick-Nielsen J., M. Rossi (2019); The Cost of Immediacy for Corporate Bonds; The Review of Financial Studies, 32-1, 1-41 https://doi.org/10.1093/rfs/hhy080
Dillon C., B. Webber JSE: The construction of free float; MBA degree report; University of Cape Town Docking D., R. Dowen (2006); Evidence on stock price effects associated with changes in the S&P 600 small cap index; Quarterly
Journal of Business and Economics 45-1/2, 89-114 https://doi.org/10.2307/40473416 Drenovak, Jelic (2011); European Bond ETFs: tracking errors and sovereign debt crisis; DTCC (2018); “Systemic Risk-White Paper: The next crisis will be different”; 6 Sep. Duffie D., P. Dworczak (2018); Robust benchmark design; NBER Working Paper 20540 https://doi.org/10.3386/w20540

- 66 -
Duffie D., J. Stein (2015); Reforming LIBOR and other financial market benchmarks; Journal of Economic Perspectives 29-2, 191-212 http://dx.doi.org/10.1257/jep.29.2.191
Duffie D., P. Dworczak, H. Zhu (2017); Benchmarks in search markets; The Journal of Finance 72-5, 1983-2044 https://doi.org/10.1111/jofi.12525
Dunne P., M. Moore, R. Portes (2007); Benchmark Status in Fixed-Income Asset Markets; Journal of Business Finance & Accounting 34-9/10, 1615-1634 https://doi.org/10.1111/j.1468-5957.2007.02039.x
Easley D., D. Michayluk, M. O'Hara, T. Putnins (2018); The Active World of Passive Investing; Western Finance Association Annual Meeting http://dx.doi.org/10.2139/ssrn.3220842
Eccles, Stroehle (2019); Exploring Social Origins in the Construction of ESG Measures https://doi.org/10.2139/ssrn.3212685 Edelen R., J. Warner (2001); Aggregate price effects of institutional trading: a study of mutual fund flow and market returns;
Journal of Financial Economics 59-2, 195-220 https://doi.org/10.1016/S0304-405X(00)00085-4 EDHEC Risk (2012); North American Index Survey 2011 EDHEC Risk (2018); Annual European ETF and Smart Beta Survey Results show Growing Demand for New Developments in
Existing Smart Beta Offerings; 20 Sep. Edkins M., G. Garvey, A. Madhavan, S. Matthews, B. Novick, J. Sethi (2017); Index-investing and common ownership theories;
BlackRock Viewpoint; Mar. EFAMA (2019a); Counterparty and liquidity risks in ETFs: Response to ECB; June EFAMA (2019b); "Statement – Liquidity and counterparty risks in ETFs"; 15/07/19 Ehsani S., J. Linnainmaa (2019); Factor Momentum and the Momentum; NBER Working Paper 25551
https://doi.org/10.3386/w25551 Elhauge E. (2016); Horizontal Shareholding, Harvard Law Review 129-5, 1267-1317 Elhauge E. (2017); The Growing Problem of Horizontal Shareholding, Antitrust Chronicle, 3-1, Competition Policy International;
Harvard Public Law Working Paper 17-36 Elton E., M. Gruber, G. Commer, K. Li (2002); Spiders: Where are the bugs; Journal of Business 75-3, 453-472
https://doi.org/10.1086/339891 Engle R., A. Sarkar (2002); Pricing Exchange Traded Funds; New-York University Working Paper DRP-02-11 Estrada J. (2008); Fundamental indexation and international diversification; Journal of Portfolio Management 34-3, 93-109
https://doi.org/10.3905/jpm.2008.706247 Evans R. O. Karakaş, R. Moussawi, M. Young (2019); Phantom of the opera: ETF shorting and shareholder voting,
http://dx.doi.org/10.2139/ssrn.3345799 Evans R., R. Moussawi, M. Pagano, J. Sedunov (2018); ETF short interest and failures-to-deliver: Naked short-selling or
operational shorting; Darden Business School Working Paper 2961954 http://dx.doi.org/10.2139/ssrn.2961954 Evans M., P. O'Neill, D. Rime, J. Saakvitne (2018); Fixing the fix assessing the effectiveness of the 4pm fix benchmark; FCA
Occasional Paper Ezra D., G. Warren (2010); When Should Investors Consider an Alternative to Passive Investing; Journal of Portfolio
Management, https://doi.org/10.3905/jpm.2010.36.4.005 Fama E. (1970); Efficient Capital Markets; A Review of Theory and Empirical Work; Journal of Finance 25-2, 383-417
10.2307/2325486 Fama E., K. French (2009); Luck vs skill in the cross section of MF returns; Journal of Finance 65-5, 1915-1947
https://doi.org/10.1111/j.1540-6261.2010.01598.x Fama E., K. French (2018); Comparing Cross; Section and Time; Series Factor Models; Chicago Booth Research Paper 18-08;
Fama; Miller Working Paper 10.2139/ssrn.3255748 Fender I. (2003); Institutional asset managers; Industry trends, incentives and implications for market efficiency; BIS Quarterly
Review, Sep. Feng G., S. Giglio, D. Xiu (2019); Taming the factor zoo: A Test of New Factors; Fama-Miller Working Paper; Chicago Booth
Research Paper 17-04 http://dx.doi.org/10.2139/ssrn.2934020 ... Fernandes K., A. Shah (1999); The relevance of index funds for pension investment in equities; Development Research Group;
World Bank 2494 Feroli M., A. Kashyap, K. Schoenholtz, H. Shin (2014); Market tantrums and monetary policy; Chicago Booth Papers 14-09
Feroli, Michael and Kashyap, http://dx.doi.org/10.2139/ssrn.2409092 Fethke T., M. Prokopczuk (2018); Is commodity index investing profitable? The Journal of Index Investing 37-71
https://doi.org/10.3905/jii.2018.1.064 Fichtner J., E. Heemskerk, J. Garcia-Bernardo (2017), Hidden power of the Big Three-Passive index funds, re-concentration of
corporate ownership, and new financial risk, Business and Politics 19-2, 298-326 https://doi.org/10.1017/bap.2017.6 Filippou I., A. Gozluklu, H. Rozental (2019); ETF arbitrage and international diversification http://doi.org/10.2139/ssrn.3287417 Financial Conduct Authority, HM Treasury (2016), Financial advice market review; Final report Fitch Ratings (2015); Bond trade frequency strongly linked to issue size; 29/01/15 Frazzini A., R. Israel, T. Moskowitz (2014); Trading costs; Fama-Miller Working Paper; Chicago Booth Research Paper 14-05
http://dx.doi.org/10.2139/ssrn.2294498 Frazzini A., L. Pedersen (2011); Betting against Beta Journal of Financial Economics 111-1, 1-25
https://doi.org/10.1016/j.jfineco.2013.10.005 French K. (2008); The cost of active investing; Presidential Address; Journal of Finance 63-4, 1537-1573
https://doi.org/10.1111/j.1540-6261.2008.01368.x FTSE Russell (2018); "Smart Beta: 2018 Global Survey Findings from Asset Owners Fueda-Samikawa I., T. Takano (2017); BOJ's ETF purchases expanding steadily: How long will the BOJ hold risky assets with
no maturity?; Japan Center for Economic Research Financial Report 35; Jul Fuller R., B. Han, Y. Tung (2010); Thinking about indices and "passive" vs active management; The Journal of Portfolio
Management 6-4, 35-47 https://doi.org/10.3905/jpm.2010.36.4.035 Gârleanu N., L. Pedersen (2013); Dynamic trading with predictable returns and transaction costs; The Journal of Finance 68-6,
2309-2340,
- 67 -
Gârleanu N., L. Pedersen (2018); Efficiently inefficient markets for assets and asset management; Journal of Finance 73-4, 1663-1712 https://doi.org/10.1111/jofi.12696
Garrison R., P. Jain, M. Paddrick (2019); Cross-asset market order flow, liquidity and price discovery; Office for Financial Research Working Paper 19-0; Oct.
Gastineau G. (2002); Index Funds have lost their way; The Journal of Portfolio Management 28-2, 55-64 https://doi.org/10.3905/jpm.2002.319832
Gatzert N., S. Pokutta, N. Vogl (2019); Convergence of capital and insurance markets: Consistent pricing of index-linked catastrophe loss instruments; Journal of Risk & Insurance 86-1, 39-72 https://doi.org/10.1111/jori.12191
Gauvin L., F. Lalanne, I. Peresa, S. Rivaud (2019); Portfolio investments and fragility in emerging economies: detection tools; Banque de France Bulletin 226, Article 1 https://publications.banque-france.fr/sites/default/files/medias/documents/819345_bdf226-1_pays_en_v2.pdf
Ghosh S., E. Sorensen (2010); Rewarding fundamentals; The Journal of Portfolio Management 36-4, 71-76 https://doi.org/10.3905/jpm.2010.36.4.071
Global Impact Investing Network (2018); 8th Annual Impact Investor Survey Glosten L., S. Nallareddy, Y. Zou (2016); ETF Trading and Informational Efficiency of Underlying Securities; Columbia Business
School Research Paper 16-71 http://dx.doi.org/10.2139/ssrn.2846157 Goetzmann W., M. Massa (1999); Index funds and stock market growth; The Journal of Business 76-1, 1-28
https://doi.org/10.2139/ssrn.125470 Goldstein I., H. Jiang, D. Ng (2017); Investor flows and fragility in corporate bond funds; Journal of Financial Economics 126-3,
592–613 https://doi.org/10.1016/j.jfineco.2016.11.007 Goltz F., D. Schröder (2011); Passive Investing before and after the Crisis: Investors’ views on ETFs and competing index
products; Bankers, Markets & Investors 110; Jan-Feb Goltz F., L. Tang (2010); State of development of the ETF industry: Evidence from the demand side; Bankers, Markets &
Investors 109 Gorton G., G. Pennacchi (1991), Security baskets and index-linked securities, NBER Working Paper 3711
https://doi.org/10.3386/w3711 Graham J. (2012); Comment on the Theoretical and Empirical Evidence of Fundamental Indexing; Journal of Investment
Management 10-1 Greenwood R. (2008); Excess comovement and stock returns: Evidence from cross-sectional variation in Nikkei 225 weights;
Review of Financial Studies 21-3, 1153-1186 https://doi.org/10.1093/rfs/hhm052 Greenwood R., N. Sosner (2007); Trading patterns and excess comovement of stock returns; Financial Analyst Journal 63-5,
69-81 https://doi.org/10.2469/faj.v63.n5.4841 Gromb D., D. Vayanos (2010); Limits of Arbitrage; Annual Review of Financial Economics 2; 251-275
https://doi.org/10.1146/annurev-financial-073009-104107 Grossman S., J. Stiglitz (1980); On the Impossibility of Informationally Efficient Markets-American Economic Review 70-3, 393-
408 https://www.jstor.org/stable/1805228 Gruber M. (1996); The growth in actively managed mutual funds-Journal of Finance 51-3, 783-810 https://doi.org/10.1111/j.1540-
6261.1996.tb02707.x Gu S., B. Kelly, D. Xiu (2018); Empirical asset pricing via machine learning; NBER Working Paper 25398
https://doi.org/10.3386/w25398 Guidolin M., M. Pedio (2019); How smart is the real-estate smart beta? Evidence from optimal style factor strategies for REITs;
Baffi CAREFIN Centre Research Paper 2019-117 http://dx.doi.org/10.2139/ssrn.3458308 Gupta T., B. Kelly (2019); Factor Momentum Everywhere-Yale ICF Working Paper 2018-23
http://dx.doi.org/10.2139/ssrn.3300728 Gutiérrez G., T. Philippon (2017); Ownership, Governance and Investment; American Finance Association 108, 432-437
https://doi.org/10.1257/pandp.20181010 Haghani J., V. White (2019); Smart Beta: The Good, the Bad and the Muddy; Elm Partners; Jul. Hallahan T., N. Sinclair (2007); Fundamental indexation down under: An Examination of the performance of non-capitalization
weighted indexation in the Australian equity market; Hamm S. (2014); The Effect of ETFs on Stock Liquidity; Ohio University Working Paper https://doi.org/10.2139/ssrn.1687914 Hansson M., O. Perers (2018), ETF ownership and the volatility of US stocks, Bachelor Thesis, University of Gothenburg Harris L., E. Gurel (1986); Price and volume effects associated with changes in the S&P 500: New evidence for the existence of
price pressures; Journal of Finance 41-4, 815-829 https://doi.org/10.1111/j.1540-6261.1986.tb04550.x Hartman-Glaser B., B. Hébert (2019); The Insurance is the Lemon; Failing to Index Contracts; NBER Working Paper 25450
https://doi.org/10.3386/w25450 Hasbrouck J. (2003); Intraday Price Formation in U.S. Equity Index Markets; Journal of Finance 58-6, 2375-2400
https://doi.org/10.1046/j.1540-6261.2003.00609.x Hasbrouck J., G. Saar (2008); Technology and Liquidity Provision: The Blurring of Traditional Definitions 10.2139/ssrn.994369 Hassine M., T. Roncalli (2013); Measuring Performance of ETFs; https://doi.org/10.2139/ssrn.2404313 Heath D., D. Macciocchi, R. Michaely, M. Ringgenberg (2018); Passive Investors are Passive Monitors; Swiss Finance Institute
Research Paper 19-08 Heath D., D. Macciocchi, R. Michaely, M. Ringgenberg (2018); Do index funds monitor? Swiss Finance Institute Research
Paper 19-08 http://dx.doi.org/10.2139/ssrn.3259433 Hemphill S., M. Kahan (2018); The Strategies of anticompetitive common ownership; NYU Law and Economics Research Paper
18-29; European Corporate Governance Institute (ECGI); Law Working Paper 423-2018 http://dx.doi.org/10.2139/ssrn.3210373
Hendershott T., A. Menkveld (2014); Price pressures; Journal of Financial Economics 114-3, 405-620 https://doi.org/10.1016/j.jfineco.2014.08.001
Hens T., K. Schenk-Hoppé (2018); Patience is a Virtue in value investing; International Review of Finance https://doi.org/10.1111/irfi.12251

- 68 -
Hernando-Veciana A., M. Troege (2019); Cheap talk and strategic rounding in Libor submissions; The Review of Financial Studies https://doi.org/10.1093/rfs/hhz101
Hill J., D. Nadig, M. Hougan, D. Fuhr (2015); A comprehensive guide to ETFs; CFA Institute Research Foundation Books Hirshleifer D., Jiang D. (2010); Misvaluation factor and the cross section of expected returns; The Review of Financial Studies
23-9, 3401-3436 https://doi.org/10.1093/rfs/hhq063 HLEG (2018); Final report by the European Commission’s High-Level Expert Group on sustainable finance Holden C., J. Nam (2019); Market accessibility, corporate bond ETFs and liquidity; Kelley School of Business Research Paper
https://doi.org/10.2139/ssrn.3083257 Hollstein F., M. Prokopczuk, C. Wese Simen (2019); The Conditional CAPM Revisited: Evidence from high-frequency betas;
forthc. in Management Science Honkanen P. (2019); Securities lending and trading by active and passive funds; HEC Paris job market paper Hovenkamp H., F. Scott Morton (2019); Horizontal shareholding and antitrust policy, Yale Law Journal 127-7, 2026-2047
https://digitalcommons.law.yale.edu/ylj/vol127/iss7/8 Huang S., M. O'Hara, Z. Zhong (2019); Innovation and informed trading: Evidence from industry ETFs
http://dx.doi.org/10.2139/ssrn.3126970 Hurlin C., G. Iseli, C. Perignon, S. Yeung (2017); The Counterparty Risk Exposure of ETF Investors; HEC Paris Research Paper
2014-1050 https://halshs.archives-ouvertes.fr/halshs-01023807v3 Ilmanen A., R. Israel, T. Moskowitz, A. Thapar, F. Wang (2019); How do factor premia vary over time? A century of evidence
http://dx.doi.org/10.2139/ssrn.3400998 IMF (2019); Vulnerabilities in a maturing credit cycle; Global Financial Stability Review; Chapter 1; Apr. Israeli D., C. Lee, S. Sridharan (2017); Is there a Dark Side to ETFs?; Review of Accounting Studies 22-3, 1048-1083
https://doi.org/10.1007/s11142-017-9400-8 Ivanov I., S. Lenkey (2017); Do leveraged ETFs really amplify late day returns and volatility; Journal of Financial Markets 41-C,
36-56 https://doi.org/10.1016/j.finmar.2018.09.001 Jackson R. (2019); Common Ownership: The Investor protection Challenge of the 21st Century; SEC Commissioner’s testimony
before the Federal Trade Commission; Hearing on Competition and Consumer Protection Jacobsen B. (2017); The bad arithmetic of active management; Journal of Portfolio Management 43-2, 115-122
https://doi.org/10.3905/jpm.2017.43.2.115 James K., D. Mittendorf, A. Pirrone, C. Robles-Garcia (2019); Does the growth of passive investing affect equity market
performance? A literature review; FCA Research Note; Feb. Jarrow R. (2010); Active Portfolio Management and Positive Alphas; Fact or Fantasy; Journal of Portfolio Management, 36-4 17-
22 https://doi.org/10.3905/jpm.2010.36.4.017 Jiang, Perez (2019); Follow the leader: Index tracking with factor models Johanning L., P. Henrich, M. Becker (2011); Quantitatives ETF-Rating: Ansatz und Einsatzgebiete, in: ETF Rating:
Marktüberblick, Einsatzkriterien und Praxiseinsatz, Everling O., Kirchhoff G. (Hrsg.), Bank-Verlag Medien GmbH, Köln Jones C. (2018); Understanding the market for U.S. equity market data; NYSE report
https://www.nyse.com/article/understanding-the-market-for-us-equity-market-data Jun D., B. Malkiel (2007); New paradigm in stock indexing European Financial Management 14-1,118-126
https://doi.org/10.1111/j.1468-036X.2007.00432.x Kacperczyk M., C. Sialm, L. Zheng (2004); On the industry concentration of actively managed equity mutual funds; NBER
Working Paper 10770; Sep. https://doi.org/10.3386/w10770 Kakushadze Z., W. Yu (2018); Betas, Benchmarks and beating the market; The Journal of Trading 13-3, 44-66;
https://doi.org/10.3905/jot.2018.13.3.044 Kamara A., X. Lou, R. Sadka (2007); Divergence of liquidity commonality in the cross-section of stocks; Journal of Financial
Economics 89-3, 444-466 https://doi.org/10.2139/ssrn.943040 Kashyap A., N. Kovrijnykh, J. Li, A. Pavlova (2018); The benchmark inclusion subsidy; NBER Working Paper 25337
https://doi.org/10.3386/w25337 Kat H. (2003); Why Indexation can be a dangerous strategy?; The Journal of Wealth Management 6-1, 58-63;
https://doi.org/10.3905/jwm.2003.320475 Kaul A., V. Mehrotra, R. Morck (2002); Demand curves for stocks do slope down; New evidence from an index weights
adjustment; Journal of Finance 55-2, 893-912 https://doi.org/10.1111/0022-1082.00230 Khandani A., A. Lo (2007); What happened to the quants in August 2007? NBER Working Paper 14465
https://doi.org/10.3386/w14465 Kiniry C., F. Philips (2009); Vanguard on the active vs. passive debate. Market cyclicality and leadership volatility; Journal of
Indexes 12-2; Mar-Apr. Kirilenko A., P. Kyle, M. Samadi, T. Tuzun (2017); The flash crash: High-frequency trading in an electronic market; The Journal
of Finance 72-3, 967-998 https://doi.org/10.1111/jofi.12498 Kirschenmann K., J. Korte, S. Steffen (2018); The Zero Risk Fallacy; Banks' sovereign exposure and sovereign risk spillovers.
ZEW Centre for European Economic Research Discussion Paper 17-069 http://dx.doi.org/10.2139/ssrn.3091616 Koch A., S. Ruenzi, L. Starks (2016); Commonality in liquidity: a demand-side explanation; The Review of Financial Studies 29-
8, 1943-1974 https://doi.org/10.1093/rfs/hhw026 Kölbel J., F. Heeb, F. Paetzold, T. Busch (2019); Can sustainable investing save the world? Reviewing the mechanisms of
investor impact, http://dx.doi.org/10.2139/ssrn.3289544 Koijen R., T. Moskowitz, L. Pedersen, E. Vrugt, (2013); Carry; NBER Working Paper 19325 https://doi.org/10.3386/w19325 Kondor P. (2009), Risks in dynamic arbitrage: Price effects of convergence trading, Journal of Finance 64-2, 631-655
https://doi.org/10.1111/j.1540-6261.2009.01445.x Kornprobst A. (2019); Anticiper le risque de crise financière : nouveaux outils pour les investisseurs; Les Cahiers de l'EIFR n°6 Krause T., S. Ehsani, D. Lien (2013); Exchange Traded Funds, liquidity, and market volatility; Applied Financial Economics 4-
24,1617-1630 https://doi.org/10.1080/09603107.2014.941530 Kuenzi D. (2003); Strategy benchmarks; Journal of Portfolio Management, 29-2, 46-56 https://doi.org/10.3905/jpm.2003.319872 Kwon H. (2017); Executive Compensation under common ownership; Working Paper

- 69 -
Lalanne F., I. Peresa (2019); China rebalancing of benchmark indices: What implications? Banque de France https://blocnotesdeleco.banque-france.fr/en/blog-entry/china-rebalancing-benchmark-indices-what-implications
Lampe I., D. Würtenberger (2019); Loss Aversion and the Demand for Index Insurance; University of St.Gallen, School of Finance Research Paper 2019-07 http://dx.doi.org/10.2139/ssrn.3406641
Lau F. (2015); Three essays on the dynamic relationships between index futures and individual cash assets; Hong Kong Baptist University; Open access theses and dissertations https://repository.hkbu.edu.hk/etd_oa/154
Le Moign C., F. Raillon (2018); Heightened volatility in early February 2018: The impact of VIX products; AMF Risk & Trends; Apr.
Lehmann B., D. Modest (1985); Mutual fund performance and benchmarks: A comparison of benchmarks and benchmarks comparisons; NBER Working Paper 1721; Oct. https://doi.org/10.3386/w1721
Leippold M., L. Su, A. Ziegler (2016); How index futures and ETFs affect stock return correlations; Swiss Finance Institute Working Paper http://dx.doi.org/10.2139/ssrn.2620955
Lettau M., S. Ludvigson, P. Mandel (2018); Characteristics of mutual fund portfolios; NBER Working Paper 25381 https://doi.org/10.3386/w25381
Lettau M., A. Madhavan (2018); ETFs 101 for economists; NBER Working Paper 24250 10.3386/w24250 Lhabitant S. (2006); Hedge fund indices for retail investors; UCITS eligible or not?; AMF Working Paper 2 Lhabitant S. (2006); New absolute return strategies for wealth Management; Kedge Capital Lin C., T. Schmid, M. Weisbach (2019); Climate Change, operating flexibility and corporate investment decisions; NBER
Working Paper 26441 https://doi.org/10.3386/w26441 Liu Y., D. Mauer, Y. Zhang (2018); The hedging benefits of industrial and global diversification: Evidence from economic
downturns; Journal of Business Finance & Accounting 45-9/10, 1322-1351 https://doi.org/10.1111/jbfa.12354 Lo A. (2016); What is an index; Journal of Portfolio Management 42-2, 21-36 https://doi.org/10.3905/jpm.2016.42.2.021 Lo A., C. MacKinlay (1988); A non-random walk down Wall Street; Princeton University Press Lo A., P. Patel (2008); 130-30: The new long only; Journal of Portfolio Management 34-2, 12-38
https://doi.org/10.3905/jpm.2008.701615 Lombardi M., I. Van Robays (2011); Do financial investors destabilise the oil price; ECB Working Paper 1346; June Lopez de Prado M. (2019); A Robust estimator of the efficient frontier http://dx.doi.org/10.2139/ssrn.3469961 Low R., T. Li, T. Marsh (2018); BV-VPIN; Measuring the Impact of order flow toxicity and liquidity on international equities
markets; Journal of Risk 21-2, 63-97 https://doi.org/10.21314/JOR.2018.399 Lu L., J. Wang, G. Zhang (2009); Long-term performance of Leveraged ETF 10.2139/ssrn.1344133 Lund D. (2018); The Case against passive shareholder voting; Journal of Corporation Law, forthc. University of Chicago Coase-
Sandor Institute for Law & Economics Research Paper 829 http://dx.doi.org/10.2139/ssrn.2992046 Lynch A., R. Mendenhall (1997); New Evidence on stock price effects associated with changes in S&P500; Journal of Business
70-3, 351-383 http://dx.doi.org/10.1086/209722 Madhavan A. (2011); Exchange-Traded Funds, Market Structure and the Flash; http://dx.doi.org/10.2139/ssrn.1932925 Madhavan A., Cheng (2009); Leveraged ETFs; May Madhavan A. (2009); The Dynamics of Leveraged and Inverse Exchange-Traded Funds; The Journal Of Investment
Management 7-4, Fourth Quarter 2009 Madhavan A., U. Marchioni, W. Li, D. Yan Du (2014); Equity ETFs vs index futures; A comparison for fully funded investors; The
Journal of Index Investing; 5-2, 66-75 https://doi.org/10.3905/jii.2014.5.2.066 Madhavan A., Ming (2002); The hidden costs of index rebalancing: A case study of S&P500 composition changes of July 19,
2002; The Journal of Investing 12-3, 29-35 https://doi.org/10.3905/joi.2003.319551 Madhavan A., D. Morillo (2012); Leveraged ETPs and end-of-day volatility Madhavan A., D. Morillo (2018); The Impact of Flows into Exchange-Traded Funds: Volumes and Correlations; The Journal of
Portfolio Management Summer 2018, 44-7, 96-107 https://doi.org/10.3905/jpm.2018.44.7.096 Maier J., E. Lanik (2011); A better understanding of synthetic ETFs; Bank of America ETF Research, Non-US listed Malamud S. (2016); A dynamic equilibrium model of ETFs; CEPR Discussion Paper DP11469
http://dx.doi.org/10.2139/ssrn.2816789 Malic J. (2006); Market reactions to changes in the S&P 500 Index: An industry analysis; The Park Place Economist 14 Malkiel B. (2003); Passive Investment Strategies and Efficient Markets; European Financial Management 9-1, 1-10
https://doi.org/10.1111/1468-036X.00205 Marshall B., N. Nguyen, N. Visaltanachoti (2013); ETF arbitrage: Intraday evidence; Journal of Banking & Finance 37-9,
3486-3498 https://doi.org/10.1016/j.jbankfin.2013.05.014 Martellini L. (2004); Hedge fund indices from an academic perspective; EDHEC Risk Maryniak P. (2019); The impact of passive investing on market fragility; https://doi.org/10.2139/ssrn.2862178 Mauboussin M., D. Callahan, D. Majd (2017a); Looking for Easy Games: How passive investing shapes active management;
Credit Suisse; 04/01/17 Mauboussin M., D. Callahan, D. Majd (2017b); Corporate Longevity: Index turnover and country performance; Credit Suisse;
07/02/17 Mayhew S., V. Mihov (2004); How do exchanges select stocks for options listing; Journal of Finance 59-1,
https://doi.org/10.1111/j.1540-6261.2004.00638.x Mazouz, K., W. Daya, S. Yin, S. (2014); Index revisions, systematic liquidity risk and the cost of equity capital; Journal of
International Financial Markets, Institutions and Money 33, 283-298 https://doi.org/10.1016/j.intfin.2014.07.009 Mitchell M., L. Pedersen, T. Pulvino (2007), Slow moving capital, American Economic Review 97-2, 215-220
https://doi.org/10.1257/aer.97.2.215 Miziołek T. (2018); Index providers in the Global Financial Market https://doi.org/10.18778/0208-6018.335.10 Moallemi C., B. Park, B. Van Roy (2009); Strategic execution in presence of an uninformed arbitrageur; Journal of Financial
Markets 15-4, 10.1016/j.finmar.2011.11.002 Monk A., M. Prins, D. Rook (2019); Data defense in sustainable investing Morck R., F. Yang (2001); The Mysterious Growing Value of S&P Index Membership; NBER Working Paper 8654
https://doi.org/10.3386/w8654

- 70 -
Morris S., I. Shim, H. Shin (2017); Redemption risk and cash hoarding by asset managers; BIS Working Paper 608 Mullainathan S. (2002), A Memory-Based Model of Bounded Rationality, The Quarterly Journal of Economics, 117-3, 735-774
https://doi.org/10.1162/003355302760193887! Mulvey J., T. Nadbielny, W. Kim (2013); Levered ETPs; Theory and Practice; Ernst & Young Global Financial Services Institute
Journal of Financial Perspectives 1-2 Næs R., J. Skjeltorp, B. Ødegaard (2011); Stock market liquidity and the business cycle; Journal of Finance 66-1, 139-176
https://doi.org/10.1111/j.1540-6261.2010.01628.x Neuhaus H. (2018) ; Update on quantitative mapping exercise; Working Group on Euro Risk-Free Rates, European Central
Bank; 20 April Nicolas, Tolosa (2017); Effect of free float ratio on the behavior of shares valuation in companies listed in Latin American capital
market; in Firm Value -in "Theory and Empirical Evidence", Ch. 3 OECD (2019); Risks rising in corporate debt market; Feb O'Hara M. (2003); Presidential Address: Liquidity and Price Discovery; The Journal of Finance 58-4, vi+1335-1354
https://doi.org/10.1111/1540-6261.00569 Oliver Wyman (2018); Changing the World’s most important number: Libor Transition; Feb. Osterrieder J., L. Vetter, K. Röschli (2019); The VIX Volatility Index: A very thorough look at it
http://dx.doi.org/10.2139/ssrn.3311727 Ou-Yang (2003); Optimal contracts in a continuous time delegated portfolio management problem; Review of Financial Studies
16-1, 173-208 https://doi.org/10.1093/rfs/16.1.0173 Pagano M., A. Sanchez Serrano, J. Zechner (2018); Can ETFs pose systemic risk; report of ESRB’s Advisory Scientific
Committee 9 Pagliardi G., P. Poncet (2019); International stock market co-movements and politics-related risks; Amundi AM Working
Paper 086 Paldor I. (2017); Cross-holding by institutional investors: Is there really anything to fear? Palia D., S. Sokolinski (2019), Does passive investing help relax short-sale constraints? http://dx.doi.org/10.2139/ssrn.3335283 Pan K., Y. Zeng (2017); ETF arbitrage under liquidity mismatch http://dx.doi.org/10.2139/ssrn.2895478 Paraschiv F., S. Reese, M. Skjelstad (2019); Portfolio stress testing applied to commodity futures
http://dx.doi.org/10.2139/ssrn.3458419 Park Y. (2019); Variance disparity and market frictions; Finance and Economics Discussion Series Divisions of Research &
Statistics and Monetary Affairs, Federal Reserve Board, Washington, D.C. Working Paper 2019-059 http://dx.doi.org/10.17016/FEDS.2019.059
Pasquiarello P. (2014); Financial market dislocations; Review of Financial Studies 27-6, 1868–1914 https://doi.org/10.1093/rfs/hhu007
Pedersen L. (2017); Active vs. passive investing; Presentation slides; Oct. Pedersen L. (2018); Sharpening the arithmetic of active management; Financial Analysts Journal 74-1, 21-26
https://doi.org/10.2469/faj.v74.n1.4 Peng L., W. Xiong (2006); Investor attention, overconfidence and category learning Journal of Financial Economics 80, 563-602
https://doi.org/10.1016/j.jfineco.2005.05.003 Perold A. (2007); Fundamentally Flawed Indexing; Financial Analysts Journal 63, 31-37 https://doi.org/10.2469/faj.v63.n6.4924 Petajisto A. (2010); Active Share and mutual fund performance; Financial Analysts Journal 69(4)
https://doi.org/10.2139/ssrn.1685942 Petajisto A. (2010); The index premium and its hidden cost for index funds; Journal of empirical Finance 18, 271-288
https://doi.org/10.1016/j.jempfin.2010.10.002 Petajisto A. (2017); Inefficiencies in the Pricing of Exchange-Traded Funds; Financial Analysts Journal 73-1, 24-54
https://doi.org/10.2469/faj.v73.n1.7 Posner E., F. Scott Morton, G. Weyl (2018); A proposal to Limit the anti-competitive power of institutional investors, 83; Antitrust
Law Journal 81 Antitrust Law Journal 669 https://doi.org/10.2139/ssrn.2872754 Prasad N., A. Grant, S. Kim (2018); Time-varying volatility indices and their determinants: Evidence from developed and
emerging stock markets; International Review of Financial Analysis 60, 115-126 https://doi.org/10.1016/j.irfa.2018.09.006 Rachidy F. (2012); Revue critique des nouvelles formes d'indices obligataires de dettes souveraines; Revue Banque; juin Raddatz C., S. Schmukler, T. Williams (2017); International asset allocations and capital flows; The benchmark effect; Journal
of International Economics 108 https://doi.org/10.1016/j.jinteco.2017.06.007 Raillon F. (2019); Growing importance of the closing auction in share trading volumes; AMF Risk & Trend Mapping; Oct. Ramaswamy S. (2011); Market structures and systemic risks of ETFs; BIS Working Paper 343; April Reiners L. (2018); Bitcoin futures: From self-certification to systemic risk http://dx.doi.org/10.2139/ssrn.3284241 RIMES, WatersTechnology (2019); Benchmark Regulation: Sell side in the crosshairs; White paper; June Risk.net; Factor models miss time variations in trading day; Morgan Stanley; 01/05/18 Risk.net; Transition is an opportunity to reduce multi-rate complexities, say Bakkar and Brigo; 04/06/18 Robertson A. (2018); Passive in name only: Delegated management and 'index' investing; Yale Journal on Regulation 36-2 Rock E., D. Rubinfeld (2017); Antitrust for institutional investors; NYU Law and Economics Research Paper 17-23; University of
California Berkeley Public Law Research Paper http://dx.doi.org/10.2139/ssrn.2998296 Roll R. (1978); Ambiguity when the Market is measured by the Security Market Line; Journal of Finance 33-4, 1051-1069
https://doi.org/10.2307/2326939 Rompotis G. (2016); Return and volatility of emerging markets leveraged ETFs; Journal of Asset Management 17-3, 165-194
https://doi.org/10.1057/jam.2016.2 Roncalli T. (2017); Alternative Risk Premia: What do we know; Amundi Working Paper 61; Feb. Roncalli T., J. Teïletche (2007); An alternative approach to alternative betas; EDHEC Risk Ronzani G. (2018); Financial indices based on fundamental metrics; Performance and marketing features-ESCP Europe
master thesis Rosov S. (2018); Private vs Public Markets; Capital Formation and Implications for Investors; CFA Position Paper

- 71 -
Ross S. (1976); The arbitrage theory of capital asset pricing; Journal of Economic Theory 13-3, 341-360 https://doi.org/10.1016/0022-0531(76)90046-6
Royal Swedish Academy of Sciences (2013); Understanding asset prices; Economic Sciences Prize Committee Ruckstuhl A., P. Meier, S. Lodeiro, O. Kündig (2004); Funds of hedge funds indices: Properties, purpose and representativeness;
Züricher Hochschule Winterthur Working Paper Saglam M., T. Tuzun, R. Wermers (2019); Do ETFs Increase Liquidity? http://dx.doi.org/10.2139/ssrn.3142081 Sammon M. (2019); Passive ownership and market efficiency https://doi.org/10.2139/ssrn.3243910 Schoenfeld S. (2006); Are alternatively weighted indexes worth their weight? White paper, Northern Trust; Apr. Schoenfeld S., R. Ginis (2004); Active indexing: Using sophisticated strategies with ETFs and other index vehicles; Institutional
Investor Journal, Investment Guides, ETFs and Indexing 2004-1, 16-24 Schwert W. (1998); Stock market volatility; NBER Working Paper 6381 https://doi.org/10.3386/w6381 Sepp A., L. Dezeraud (2019); Trend-following CTAs vs Alternative Risk-Premia (ARP) products: crisis beta vs risk-premia alpha;
Hedge Fund Journal 138 Serikova E. (2019); The role of daytime stock auctions in intraday return seasonality; University of St. Gallen, School of
Finance Research Paper 2019-14 http://dx.doi.org/10.2139/ssrn.3447100 Shah A. (2019); Uncertain risk-parity http://dx.doi.org/10.2139/ssrn.3406321 Shah A., S. Thomas (1998); Market microstructure considerations in index construction https://doi.org/10.2139/ssrn.79708 Sharma S., I. Rodriguez (2020); The diminishing hedging role of crude oil: Evidence from time varying financialisation; forthc. in
Journal of Multinational Financial Management https://doi.org/10.1016/j.mulfin.2019.100593 Sharpe W. (1991); The Arithmetic of active management; Financial Analyst Journal 47-1, 7-9 https://doi.org/10.2469/faj.v47.n1.7 Shek J., I. Shim, H. Shin (2018); Investor redemptions and fund manager sales or emerging market bonds; How are they related;
Review of Finance; 22-1, 207-241 https://doi.org/10.1093/rof/rfx050 Shim J. (2019); Arbitrage co-movement http://dx.doi.org/10.2139/ssrn.3287912 Shinagawa Y. (2014); Determinants of financial market spillovers: The role of portfolio diversification, trade, home bias, and
concentration; IMF Working Paper14-187 Shum Nolan P. (2012); The long and short of leveraged ETFs: The financial crisis and performance attribution
http://dx.doi.org/10.2139/ssrn.1646160 Singleton K. (2011); Investor flows and the 2008 boom-bust in oil prices; Management Science 60-2
https://doi.org/10.1287/mnsc.2013.1756 Smirnov M. (2018); Leveraged ETFs and dynamic portfolio management; Presentation slides
https://doi.org/10.2139/ssrn.3118064 Staer A. (2017); Fund flows and underlying returns: The case of ETFs; International Journal of Business 22-4
http://dx.doi.org/10.2139/ssrn.2158468 Stambaugh R. (2019); Skill and fees in active management; NBER Working Paper 26027 https://doi.org/10.3386/w26027 Statman M. (2006); Socially Responsible Indexes; The Journal of Portfolio Management 32-3,100-109
https://doi.org/10.3905/jpm.2006.628411Stocker & Wagner (2009); A new family of equity style indices Stratmann T., J. Wellborn (2012); ETFs, fails-to-deliver and market volatility https://doi.org/10.2139/ssrn.2183251 Strine L. (2010); One fundamental corporate governance question we face: Can corporations be managed for the long term
unless their powerful electorates also act and think long term?; The Business Lawyer 66-1, 1-26 Subrahmanyam A. (1991), A Theory of trading in stock index Futures, Review of Financial Studies 4-1, 17-51
https://doi.org/10.1093/rfs/4.1.17 Sui L. (2006); The Addition and Deletion Effects of the Standard & Poor's 500 Index and Its Dynamic Evolvement from 1990 to
2002: Demand Curves, Market Efficiency, Information, Volume and Return 3-4 https://doi.org/10.1016/j.irfa.2017.06.004 Sullivan R., J. Xiong (2011); How index trading increases market vulnerability; Financial Analysts Journal 68-2
https://doi.org/10.2307/23102601 Sullivan R., J. Xiong (2012) ; Impact des opérations indicielles sur la vulnérabilité du marché ; Morningstar Professional ; June Sultan S. (2015); Three essays on Price Discovery Measure, Exchange-Traded Funds and Liquidity; Thesis submitted for the
degree of Doctor of Philosophy; University of Washington http://hdl.handle.net/1773/33732 Sushko V., G. Turner (2018); Implication of passive investing for securities markets; in BIS Quarterly Review; Mar Tang K., W. Xiong (2011); Index investing and the financialization of commodities; Financial Analysts Journal 68-6
https://doi.org/10.2139/ssrn.1455724 The Economist (2017), Building a beta mousetrap; Buttonwood; 18/03/17 The Economist (2018); “Factor investing” gains popularity; But the age-old search for a magic market-beating formula still looks
forlorn; 01/02/18 Trainor W. (2010); Do leveraged ETFs increase volatility?; Technology and Investment 1, 215-20
https://doi.org/10.4236/ti.2010.13026 Tucker M., S. Laipply (2013); Fixed-income ETFs and corporate bond liquidity challenge; Central Bank of Ireland Discussion
paper Tucker J., P. Sanchez-Marin (2003); Stress Testing ETFs; Will they deliver in times of crisis?; ETFs and Indexing 2003-1, 76-80 Van Gelderen, Huij, Kyosev (2019); Factor Investing from Concept to Implementation; The Journal of Portfolio Management
Quantitative Special Issue 45 -3, 125-140 https://doi.org/10.3905/jpm.2019.45.3.125 Vayanos D., P. Woolley (2013); An institutional theory of momentum and reversal; Review of Financial Studies 26-5, 1087-1145
https://doi.org/10.1093/rfs/hht014 Vayanos D., P. Woolley (2016); The curse of the benchmarks; London School of Economics Financial Markets Group
Discussion Paper 747 Vijh A. (1994); S&P 500 trading strategies and stock betas; Review of Financial Studies 7-1, 215-251
https://doi.org/10.1093/rfs/7.1.215 Wahal S., A. Wang (2010); Competition among mutual funds; Journal of Financial Economics 99-1, 40-59
https://doi.org/10.1016/j.jfineco.2010.08.012 Walkshäusl C., S. Lobe (2009); Fundamental indexing around the world; Review of Financial Economics 19-3, 117-127
https://doi.org/10.1016/j.rfe.2010.02.001

- 72 -
Warther V. (1995); Aggregate mutual fund flows and security returns; Journal of Financial Economics 39-2/3, 209-235 https://doi.org/10.1016/0304-405X(95)00827-2
Welborn J. (2013); Three essays on naked short; selling and fails to deliver http://hdl.handle.net/1920/8157 Wermers R., J. Xue (2015); Intraday ETF Trading and the Volatility of the underlying; Lyxor AM Research Paper Wermers R., T. Yao (2010); Active vs. passive investing and the efficiency of individual stock prices
https://doi.org/10.2139/ssrn.1573357 Wurgler J. (2010); On the economic consequences of index-linked investing; NBER Working Paper 16376
https://doi.org/10.3386/w16376 Wurgler J., E. Zhuravskaya (2002); Does arbitrage flatten the demand curves for stocks?; Journal of Business 75-4, 583-608
https://doi.org/10.1086/341636 Youle T. (2014); How much did manipulation distort Libor? Dartmouth College; Job market paper Yu L. (2005); Basket securities, price formation, and informational efficiency https://doi.org/10.2139/ssrn.862604 Yu Y., Y. Wang, R. Yi (2019); Risk transmission beyond financial crises: Volatility spillovers and spillbacks between SMICs and
the US http://dx.doi.org/10.2139/ssrn.3446629 Zhang F. (2010); High-Frequency Trading, Stock Volatility, and Price Discovery https://doi.org/10.2139/ssrn.1691679

- 73 -
Annex 1 – Use of IBOR and alternative reference rates
a) IBOR usage volumes Wheatley M. (2012) estimates the amounts outstanding of instruments that use LIBOR as a reference rate at $800 trillion. Although inadequately measured, the amounts that refer to IBOR rates are more generally evaluated as follows: LIBOR: Oliver Wyman (2018) estimates the overall notional amount of contracts and instruments using LIBOR as a reference (deposits, syndicated and commercial loans, index-linked bonds, securitisations, derivatives traded over the counter and on the market, etc.) at more than $240 trillion, including around $180 million at US dollar LIBOR rates (mostly 1- and 3-month). It also estimates that more than 15 million individuals are exposed to products using LIBOR as a reference rate. About 70% of these contracts are estimated to expire within 5 years. EONIA/EURIBOR: Estimates of the amounts referenced in contracts:
• Based on EMIR data (Ascolese et al. (2017)), the notional amount of interest rate derivative contracts amounts to almost €100 trillion, with 25% of outstandings referenced to EURIBOR, 10.8% to USD LIBOR, 3.9% to JPY LIBOR, 2.9% to GBP LIBOR and 1.5% to EONIA. The vast majority of EURIBOR contract amounts correspond to 6-month (56% of notional amounts) and 3-month (36%) interest rates.
Figure 26: Interest rate derivatives – by type of underlying benchmark of the floating rate applied
Figure 27: Euribor-referenced interest rate derivatives by maturity of the underlying (March 2017)
Source: Ascolese et al. (2017) based on confidential DDRL EMIR data, ECB calculations
• Neuhaus H. (2018) based on money market data (MMSR) estimated at:
- €10.9 trillion in notional amount of EONIA-indexed overnight interest swaps (OIS), 73% of which relate to contracts expiring before the end of 2019;
- €56.1 billion of unsecured demand deposits linked to EONIA (33% of total demand deposits), plus €89 billion in other unsecured deposits (i.e. 14% of total other deposits and short-term securities); these contracts expire within one year, therefore before the end of 2019;
- €400 billion (out of €1.9 trillion) in secured loans are referenced to EONIA; these contracts expire within one year, therefore before the end of 2019.

- 74 -
b) Regulatory work and work in the financial industry IBORs are critical benchmarks according to the BMR definition. In this instance, therefore, providing a new benchmark required the administrator to be registered with or authorised by the national competent authority. 158 The European Supervisory Authorities’ (ESA) reform transferred responsibility for critical benchmarks to ESMA, which will authorise and monitor the use of critical European Union benchmarks. The ESMA is also entrusted with implementing a European equivalence scheme and establishing within this framework cooperation agreements with the competent authorities of third countries. 159 ESMA will therefore also approve third-country benchmarks for use in the EU. The transition period for implementing the BMR expires on 1 January 2022 for critical and third-country benchmarks. For other benchmarks (significant and non-significant), the transition period expired on 1 January 2020. In particular, compliance with the new regulatory standards requires strengthening the reliability of the underlyings and the calculation of critical benchmarks. The quality of the indices – their ability to accurately and reliably represent the market and the underlying economic reality – depends on the number and quality of contributions that are useful for their calculation 160 and therefore on the liquidity of the underlying market. The decline in the activity of the underlying interbank unsecured financing markets makes reforming the calculation method a necessity. Accordingly, several jurisdictions have reformed the IBOR calculation methods and promoted alternative references (Near Risk Free Reference Rates or RFRs).161 For example:
- In the United States, the New York Fed’s publication of the Secured Overnight Funding Rate (SOFR), a benchmark based on repo transactions cleared in dollars, has been effective since 10 April 2018. Other countries, including Japan and Australia, also have projects under way.
- Eliminating the requirements to contribute to the LIBOR Panel at the end of 2021, the British Financial Conduct Authority (FCA) introduced on 23 April 2018 a new version of SONIA (Sterling OverNight Index Average)162 based on rates posted by brokers and also on rates for unsecured bilateral deposits. Published by the Bank of England, SONIA is formally designated as an alternative to the LIBOR.
- At the end of 2017, the SARON (Swiss Average Rate OverNight), launched in 2009 by the Swiss National Bank (SNB) in cooperation with the Swiss stock exchange, SIX, and referenced on the yields of the overnight swap market on LCH and Eurex was designated as an alternative to CHF Libor and the TOIS Fixing (TOm-next Index Swap).
In the euro area, the ECB, ESMA and the European Commission coordinated and facilitated the industry work to identify and adopt a euro-denominated RFR that is an alternative to EONIA (unsecured overnight money market rate) and EURIBOR.163 The Euro Short-Term Rate (€STR) has been officially calculated by the ECB since 2 October 2019 based on transaction data provided daily by 50 banks in accordance with the ECB Regulation on money market statistical reporting (MMSR) for their unsecured overnight money market transactions. With regard to EURIBOR, its administrator, the European Money Markets Institute (EMMI), developed a calculation methodology described as a hybrid, which it proposed on 6 May 2019 in order to bring EURIBOR into line with the BMR requirements. The Belgian Financial Services and Markets Authority (FSMA), which supervises the EMMI, approved this methodology in July 2019.
158 “Sapin 2” Law No. 2016-1691 of 9 December 2016 designates the AMF as the competent authority in France. 159 Alternatively, administrators authorised in the EU can approve third-country indices. 160 The work of identifying alternative benchmarks favours in particular the contribution of actual transaction prices over the contribution of posted prices, indicative of transactional interests. 161 Regarding (near) risk free reference rates see BIS (2013); “Towards better reference rate practices: a central bank perspective”; A report by a BIS Economic Consultative Committee (ECC) working group. 162 See Bank of England news release “SONIA reform implemented” of 23 April 2018. 163 EONIA and EURIBOR are administered by the EMMI (European Money Markets Institute), an international non-profit association created under Belgian law when the euro was launched (1999). Its members are the national banking associations of EU Member States.

- 75 -
Following the adoption of new methodologies, major issues, particularly legal and competitive ones, have been identified relating to the transition and effective adoption of these alternative references by the markets or to fallback clauses in contracts referring to a substitute RFR that would apply in the event of the disappearance of the index mentioned in these contracts. In this regard, the AMF published a special report on 10 December 2019 highlighting the need for users to prepare the steps required for a gradual transition to alternative benchmarks. In particular, it urges users of critical benchmarks that are likely to disappear to start preparations now for the various stages of this transition, by considering the following aspects: • Identifying the contracts impacted by the transition; • Amending the contracts affected so that they refer to a substitute RFR according to the
applicable law, for example by amending the reference rate or by adding a fallback clause referring to the substitute RFR that will apply in the event of the disappearance of the benchmark index mentioned in the contract;
• Managing any value transfers linked to the change in the benchmark index; • Updating information systems to handle the Substitute RFRs; and • Potential effects on hedge accounting.

- 76 -
Annex 2 – Market exposure vs. exposure to risk factors
a) CAPM: Theoretical foundation for the legitimacy of index investing In the 1950s, financial theory developed a conceptual framework, the Capital Asset Pricing Model (CAPM), which theoretically legitimised the use of stock market indices as an investment vehicle. In practice, this led to the development of a new class of financial products: passively managed investment funds.164 The basic intuition of the theoretical model (Markowitz (1952, 1959), Treynor (1961), Sharpe (1964)) is that stock prices on a market vary as a consequence of a common market factor and other factors specific to each market (idiosyncratic). The expected return on a stock at a given point in time is therefore expressed, assuming the stochastic properties of the variables (the errors in the model follow a random walk of normal distribution), by the following formula:
E(Rj) = αi + βi E(Rm)
where E(Rj) is the expected return on share i, E(Rm) is the aggregate expected market return and αi and βi are parameters specific to each share i reflecting firstly the elasticity of the relevant price to the index (βi) and secondly idiosyncratic sources of return (αi).
On this basis, to optimise the risk/return profile of an equity portfolio when borrowing at the risk-free rate is possible, the optimal investment strategy is to hold the “market portfolio”, i.e. an index portfolio that replicates the performance of the entire equity market. In this situation, replicating the market index (of capitalisation-weighted equities) is therefore an optimal investment strategy. Assuming that there is market efficiency, the theory also shows that this portfolio is superior, on average, to any other actively managed portfolio, where portfolio managers cannot justify the additional costs incurred for their management services. Moreover, this portfolio minimises the risks of conflicts of interest associated with delegating portfolio management, i.e. the principal-agent relationship of an investor delegating the management of an investment fund to a portfolio manager.
b) Limitations of the CAPM and development of factor analysis Several limitations of the CAPM have been identified, inherent in the theoretical, i.e. simplistic, nature of the model, that emerge from its practical implementation. The model is based on robust assumptions about the ability to invest (without limit) in the assets being considered, the time frame (homogeneous, covering a single period), the stochastic distribution of risk (ability to control risk through diversification, etc.), the investable asset classes (equities), the absence of any friction (e.g. transaction costs, taxes) and the ability to borrow (without limit) at the risk-free rate. The valuation by arbitrage of a portfolio’s assets (arbitrage pricing theory or APT, Ross S. (1976)) initiates a search for the characteristics of firms that could improve the predictive power of the CAPM. Fama E., K. French (1993, 1996) and Carhart M. (1997)165 develop multi-factor models and identify those factors that are relevant. Among the main factors identified are those of size (capitalisation), value (e.g. book-to-market, to distinguish between growth and return values), momentum (persistence of returns) and volatility. In particular, weighting portfolio values by capitalisation is criticised for introducing a size bias and, therefore, systematic risk. Research into identifying relevant factors (e.g. Feng G., S. Giglio, D. Xiu (2019)) and critiquing them (Haghani J., V. White (2019)) continues. In any case, factor analysis underpins the proposal to invest in smart beta indices.
164 Note: ETFs emerged in the early 1990s. 165 Fama, French (1993); Fama, French (1996); Carhart (1997).