june - БНБ€¦ · 2 june 1999 contents government securities interbank market 3 outstanding...
TRANSCRIPT

1999
JUNE
Secondary
Market of
Government
Securities

2 June 1999
Contents
Government Securities Interbank Market 3
Outstanding Government SecuritiesDiscount Treasury Bills 14
Treasury Bonds 19
Government Securities Issued for Structural Reform 26
Sales of Government Securities to Nonbank FinancialInstitutions, Companies and Individuals 29
Sales of Government Securities Issued for Structural Reformfor Participation in Privatization Transactions 37
Government Securities Primary Dealers and Reuters Pagesfor Government Securities Quotations 39
Abbreviations
BGL – National Currency of the Republic of BulgariaBIR – Base Interest RateBNB – Bulgarian National BankCGB – Central Government BudgetCM – Council of MinistersDISCs – Discount BondsFLIRBs – Front-loaded Interest Reduction BondsIABs – Interest Arrears BondsLSPDACB – Law on State Protection of Deposits and Accounts with Commercial Banks inrespect whereof the BNB Has Petitionedthe Institution of Bankruptcy ProceedingsMF – Ministry of FinanceSII – State Insurance InstituteZUNK – Bulgarian Abbreviation of the Law on Settlement of Nonperforming CreditsNegotiated prior to 31 December 1990 (LSNC)

3Secondary Market of Government Securities
GOVERNMENT SECURITIES INTERBANK MARKET
Source: BNB.
Chart 1Volume of Transactions in Government Securities Issued
for Budget Deficit Financing
Interbank Market of Government
Securities Issued under Regulation No. 5
In June 1999 financial institutionsconcluded 505 transactions in govern-ment securities (including the numberand volume of reverse repurchase agree-ments) issued for budget deficit financ-ing, totaling BGL 687,615.6 millionnominal value, an increase of 61.4%compared with the same period of theprevious year. In June 1998 transactionsof BGL 425,998.8 million nominal valuewere registered, Chart 1.
Over the period under review the vol-ume of secondary market transactions in
government securities between primarydealers issued under Regulation No. 5(reverse repo agreements volume ex-cluded) totaled BGL 352,776.7 million,including three-month treasury bills ofBGL 8,767.9 million, six-month ofBGL 13,324.3 million, twelve-month ofBGL 172,391.4 million, two-year ofBGL 139,673.1 million and up to fiveyears of BGL 18,620 million (Chart 2).In June sales in government securities in-tensified, their volume increasing by29.3%; structurally, demand for twelve-month treasury bills occupied the largestshare. It should be noticed that trade intwo-year government securities signifi-
(billion BGL)
1998 1999
0
100
200
300
400
500
600
700
800
900
January February March April May June
210.5 203.3224.0
891.3
622.7
485.0
221.8230.8
591.4
432.8 426.0
687.6

4 June 1999
Chart 2Structure of Transactions in Government Securities Issued
for Budget Deficit Financing
Source: BNB.
cantly rose in June, their volume increas-ing by 66.1%.
In June 1999 secondary market trans-actions on behalf of clients (i. e. underArticle 20 of Regulation No. 5) de-creased on the previous month toBGL 1,793.3 million. Transactions be-tween nonprimary dealers and physicalor legal persons (i. e. transactions underArticle 21 of Regulation No. 5) consider-ably increased compared with May,reaching BGL† 544 million. The volumeof transactions between primary andnonprimary dealers (under Article 14 ofRegulation No. 5) rose from May, reach-ing BGL 73,579.3 million, including bidsapproved at the government securitiesauctions on behalf of nonprimary dealersof BGL 5,020 million.
Interbank Market of Government
Securities Issued as a Result of
Structural Reform
In June financial institutions con-cluded 73 transactions in USD-denomi-nated government securities issued as aresult of structural reform, totalingUSD† 144.6 million nominal value (in-cluding the number and volume of re-verse repurchase agreements). In June,40 outright transactions of USD 103.3million, 13 repo agreements of USD 27.2million, and 20 transactions on behalf ofclients of USD 14.1 million (under Ar-ticles 14, 20 and 21 of Regulation No. 5)were concluded. One transaction ofBGL 260 million was concluded in lev-denominated government securities is-
(billion BGL)
3-month 6-month 12-month 2-year Totalup to 5 years
May 1999 June 1999
5.6 7.2
147.7
84.1
28.2
272.8
172.4
8.8 13.3
139.7
18.6
352.8
0
50
100
150
200
250
300
350
400

5Secondary Market of Government Securities
sued as a result of structural reform. Notransactions in foreign currency guarantygovernment securities were concluded inJune.
Thirty two transactions of USD 18.9million under Article 14, para. 6 of Regu-lation No. 5 and two transactions ofBGL 481.7 million were concluded inJune.
A new debt instrument ≠ EUR-de-nominated government securities ≠ waslaunched in the market; three transac-tions of EUR 23.8 million were regis-tered in June.
An upward trend in forex ZUNKbonds sales was reported in June andsales volumes increased 2.5 times. This isdue to a four-fold increase of outrighttransactions, a result of the dollar ZUNK
bonds interest coupon on 1 July. The vol-ume of transactions was unevenly distrib-uted in June, reflecting some specifictransactions.
Interbank market prices ranged be-tween USD 56 and USD 58.56 per USD100 nominal value by end-June. They didnot reflect price movements of BulgarianBrady bonds in the international mar-kets. Prices of outright transactions forparticipation in privatization were tradi-tionally higher than those in the inter-bank market.
Government Securities Repo
Agreements in the Interbank Market
In June the volume of repo agree-ments traded in the secondary interbank
Chart 3Volume of Transactions in USD-denominated Government Securities
in the Interbank Market
Source: BNB.
Outright salesRepo agreements Transactions on behalf of clients
(million USD)
June
0
5
10
15
20
25
30
35
40
45
50
55
1 2 3 4 7 8 9 10 11 14 15 16 17 18 21 22 23 24 25 28

6 June 1999
Chart 4Price Movements of USD-denominated Government Securities (Issued under ZUNK)
and Bulgarian Brady Bonds in the Interbank Market*
* Reuters offer quotations for Brady bonds.
ZUNK
April May June
FLIRBs IABs DISCs
45
50
55
60
65
70
75
80
7 8 13 19 20 21 23 26 27 28 29 3 4 5 11 12 13 14 17 18 19 20 21 26 27 28 3 4 7 8 9 10 11 14 15 16 17 18 22 23 24 25 28
Sources: BNB, Reuters.
Chart 5Volume of Repo Agreements in the Secondary Interbank Market
Source: BNB.
(billion BGL)
June
02468
10121416182022242628303234363840
1 2 3 4 7 8 9 10 11 14 15 16 17 18 21 22 23 24 25 28 29 30

7Secondary Market of Government Securities
Prices of Transactions in USD-denominated Government Securities
Issued under Article 5 of ZUNK(USD)
Date Price
June Minimum Maximum Average weighted
3 56.00 56.00 56.004 53.90 57.10 54.237 54.00 59.70 54.278 54.25 54.25 54.259 55.40 57.20 55.8110 55.50 55.50 55.5011 54.50 57.00 55.8114 57.25 60.00 57.3115 57.50 59.75 57.6016 56.50 58.48 57.4917 58.25 60.00 58.3518 57.75 59.00 57.7722 58.00 58.38 58.2523 58.25 59.75 58.5924 58.39 58.63 58.4325 59.00 59.00 59.0028 58.50 58.60 58.56
Monthly 53.90 60.00 56.90
Note: Data is based on privatization and outright transactions registered by the BNB.
Quotations of Bulgarian Brady Bonds*
Date DISCs FLIRBs IABs
June Offer Bid Offer Bid Offer Bid
1 65.75 64.25 58.50 57.00 64.75 63.502 65.50 64.50 57.75 57.25 64.75 63.753 66.38 65.25 59.25 58.13 65.50 63.004 66.75 66.50 59.63 59.38 66.25 65.637 68.13 67.00 62.00 61.13 67.13 66.508 68.25 68.00 62.13 61.88 67.88 66.759 68.00 67.50 62.00 61.75 67.38 66.7510 68.00 67.13 62.00 60.50 68.00 66.7511 68.25 67.75 60.50 60.00 68.00 67.1314 68.88 68.13 61.75 61.25 69.00 68.0015 69.63 67.50 62.75 61.50 69.50 68.5016 69.00 68.50 62.00 61.38 69.25 68.2517 70.50 69.00 62.88 61.75 70.00 69.0018 69.75 69.25 63.00 62.13 69.50 68.5021 69.88 69.25 63.50 61.50 69.50 68.5022 69.38 69.00 62.63 61.50 69.75 68.7523 68.50 68.00 61.63 61.00 69.13 68.1324 68.38 67.50 61.38 60.00 68.25 67.2525 68.00 67.00 60.25 59.25 68.00 67.0028 67.50 67.00 59.63 59.38 68.25 67.2529 68.00 67.38 60.25 59.00 68.00 67.1330 69.00 67.75 61.50 59.50 70.00 68.25
* Reuters quotations.

8 June 1999
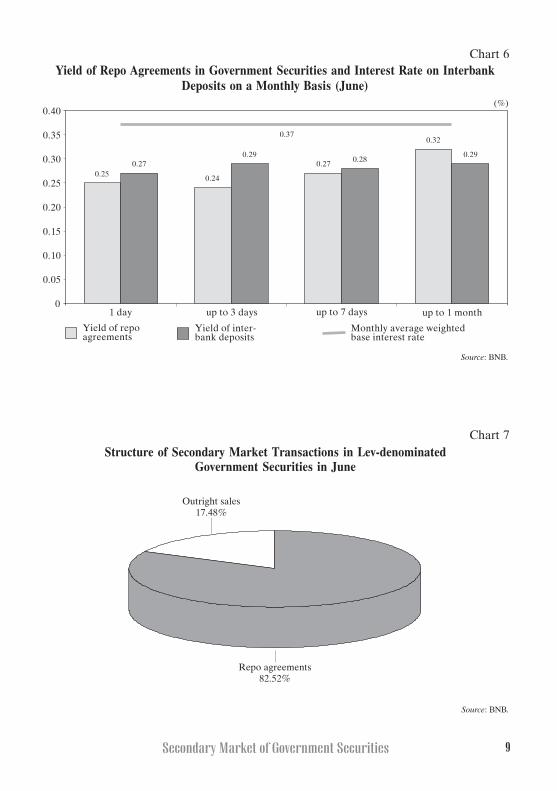
market was uneven (Chart 5). The highwas on 15 June 1999, when banks rene-gotiated their repo agreements. On thesame date interest rates on interbank de-posits also rose due to increased demandfor funds by commercial banks. The vol-ume of traded deposits hit a low on 21June due to injection of liquidity intobanks related to government securitiesinterest and maturities.
In June the yield of repo agreementsreflected insignificant changes in thebase interest rate; June saw a decrease inthe average term (in terms of days) and asignificant increase in the volume of out-right transactions in government securi-ties. The yield of repo agreements in gov-
ernment securities of up to one-monthmaturity was higher than the yield of in-terbank deposits of the same maturity,while the yield of repo agreements ingovernment securities of one, three andseven days was lower than the yield of in-terbank deposits (Chart 6). June saw asignificantly increased activity in the in-terbank secondary market, particularlystrong in the first half of June due to ac-quisition of new issues and regulation ofminimum required reserves with theBNB. Due to forthcoming redenomina-tion of the Bulgarian lev, traded volumesdecreased in the second half of the pe-riod under review.
Volume and Structure of Government Securities Secondary Market
Transactions in June
1. Volume of transactions in government securities denominated in levs (billion BGL nominal value) - repo agreements* - outright sales - privatization transactions2. Volume of transactions in government securities denominated in US dollars and Euro (lev equivalent, billion BGL) - repo agreements* - outright sales - privatization transactions3. Number of secondary market transactions - repo agreements** - outright sales - privatization transactions4. Average term of secondary market repo agreements (days)5. Average monthly yield (simple interest) on secondary market repo agreements depending on the term (%) 1 day from 2 to 3 days from 4 to 7 days up to 1 month
* Volume of reverse repo agreements excluded.** Number of reverse repo agreements excluded.
352.78 291.11 61.67
-
164.86 21.85
142.62 0.39 387 203 133 51
6.53
0.25 0.24 0.27 0.32
9Secondary Market of Government Securities
Chart 6Yield of Repo Agreements in Government Securities and Interest Rate on Interbank
Deposits on a Monthly Basis (June)
Source: BNB.
1 day up to 3 days up to 7 days up to 1 month
Yield of repoagreements
Yield of inter-bank deposits
Monthly average weightedbase interest rate
(%)
0.05
0.10
0.15
0.20
0.25
0.30
0.35
0.40
0
0.25 0.24
0.27
0.32
0.270.29
0.280.29
0.37
Chart 7Structure of Secondary Market Transactions in Lev-denominated
Government Securities in June
Source: BNB.
Repo agreements82.52%
Outright sales17.48%

10 June 1999
Volume and Yield of Deposits in the Interbank Market
and Repo Agreements in Government Securities
1 day from 2 to 3 days from 4 to 7 days from 8 to 30 days over 30 days Total
Volume Yield Volume Yield Volume Yield Volume Yield Volume Yield Volume
1.06.1999
Deposits 15 850 2.21 5 500 2.64 3 200 3.08 2 244 3.43 26 794Repo agreements 13 617 2.64 6 056 2.69 2 871 3.45 500 3.55 23 044
2.06.1999
Deposits 6 500 2.31 4 446 2.77 4 000 3.48 800 3.55 15 746Repo agreements 22 721 2.61 5 000 2.94 1 874 3.65 29 595
3.06.1999
Deposits 6 850 1.83 4 140 2.84 200 3.20 200 3.55 11 390Repo agreements 500 3.36 500
4.06.1999
Deposits 50 2.20 14 100 2.14 7 189 2.75 1 000 3.10 22 339Repo agreements 16 960 2.61 2 040 2.53 19 000
7.06.1999
Deposits 15 025 2.29 3 100 2.39 3 270 2.98 1 500 3.27 1 500 3.70 24 395Repo agreements 7 405 2.57 3 139 2.64 3 004 2.84 3 000 2.62 410 4.00 16 958
8.06.1999
Deposits 10 900 1.86 3 900 2.33 4 050 2.81 6 052 2.91 1 000 1.40 25 902Repo agreements 3 000 2.53 4 140 2.53 2 000 2.94 885 3.98 10 025
9.06.1999
Deposits 23 301 2.42 4 100 2.45 3 600 2.73 2 674 3.15 33 675Repo agreements 6 000 2.59 2 000 2.58 10 612 2.89 4 946 3.31 23 558
Chart 8Structure of Secondary Market Transactions in USD-denominated
Government Securities in June
Source: BNB.
(continued)
Repo agreements13.25%
Outright sales86.51%
Privatization transactions2.17%

11Secondary Market of Government Securities
10.06.1999
Deposits 11 240 2.06 7 190 2.84 650 3.30 19 080Repo agreements 5 599 2.64 3 100 2.67 3 669 3.26 900 3.92 13 268
11.06.1999
Deposits 12 150 2.67 10 700 3.03 2 801 2.66 2 000 3.25 27 651Repo agreements 20 805 2.69 10 075 2.80 490 3.45 31 370
14.06.1999
Deposits 9 800 2.60 5 820 2.91 5 260 3.53 20 880Repo agreements 17 305 2.65 3 000 3.35 300 4.00 20 605
15.06.1999
Deposits 14 170 2.78 10 000 2.85 5 550 3.03 7 000 3.30 36 720Repo agreements 10 175 2.71 13 710 2.74 4 700 3.06 7 000 3.13 35 585
16.06.1999
Deposits 15 176 2.79 4 500 3.02 2 200 3.03 21 876Repo agreements 6 023 2.84 7 729 2.91 505 3.55 1 000 3.35 15 257
17.06.1999
Deposits 8 104 3.29 5 526 3.44 2 584 3.42 1 588 3.90 17 802Repo agreements 12 787 2.90 1 876 3.18 657 3.45 15 320
18.06.1999
Deposits 18 023 3.65 6 989 3.28 560 3.60 25 572Repo agreements 2 112 3.44 2 116 3.86 1 950 3.46 6 178
21.06.1999
Deposits 12 460 3.85 1 000 4.50 3 520 4.43 1 400 3.90 18 380Repo agreements 300 3.55 300
22.06.1999
Deposits 12 770 3.96 700 4.50 4 500 2.67 1 250 3.90 450 6.20 19 670Repo agreements 2 300 4.56 3 000 3.89 5 300
23.06.1999
Deposits 6 790 4.35 4 200 4.61 2 770 4.72 13 760Repo agreements 3 812 4.56 2 000 4.06 2 600 4.45 39 5.07 8 451
24.06.1999
Deposits 6 727 4.36 7 141 4.69 290 4.80 14 158Repo agreements 5 010 4.52 3 315 4.59 304 5.39 8 629
25.06.1999
Deposits 11 067 4.68 6 500 4.44 400 5.00 17 967Repo agreements 2 500 4.79 200 4.56 2 600 4.72 5 300
28.06.1999
Deposits 17 720 4.34 5 000 4.94 7 120 3.85 2 555 5.00 400 2.00 32 795Repo agreements 1 500 4.36 312 4.56 3 650 4.64 5 462
29.06.1999
Deposits 18 594 4.25 7 500 4.67 600 3.50 26 694Repo agreements 3 054 4.89 210 5.07 1 200 5.25 2 321 5.15 6 785
30.06.1999
Deposits 21 290 4.75 5 600 5.44 4 779 5.34 1 770 5.13 33 439Repo agreements 4 060 5.14 2 829 5.19 5 500 5.21 12 389
Notes: 1. Volumes of transactions and deposits in million BGL.2. The volume of repo agreements includes the agreements concluded during the current day.3. Yield is calculated on an annual basis.4. Lev equivalent of the transactions in USD-denominated government securirties based on the USD exchange
rate on the day of transaction.
1 day from 2 to 3 days from 4 to 7 days from 8 to 30 days over 30 days Total
Volume Yield Volume Yield Volume Yield Volume Yield Volume Yield Volume
(continued)

12June 1999
Volume of Government Securities Transactions in the Secondary Market and Transactions in Securities in the Bulgarian Stock Exchange(thousand BGL)
Date Repo Outright Regulation No. 5 of 1998 Transactions Transactions in securities in the Bulgarian Stock Exchangein government Stock exchange
June agreements transactions Art. 14 Art. 15 Art. 20 Art. 21 securities, total market OTC market Total
1 41 538 734 - 481 088 1 701 032 - - 43 720 854 12 000 47 000 59 000
2 62 289 898 1 000 000 7 147 589 3 718 990 815 398 - 74 971 875 3 000 84 000 87 000
3 25 294 157 2 000 000 4 200 018 16 374 451 657 390 - 48 526 016 7 000 66 000 73 000
4 35 896 000 5 466 126 4 300 000 864 195 - - 46 526 321 15 000 54 000 69 000
7 34 566 760 7 664 856 5 851 240 1 171 066 - 12 893 49 266 815 3 000 88 000 91 000
8 21 464 000 8 235 512 3 123 716 10 078 515 - 663 572 43 565 315 2 000 57 000 59 000
9 34 436 018 4 644 441 11 495 306 8 203 524 - - 58 779 289 1 000 117 000 118 000
10 26 868 000 1 629 712 9 831 547 1 647 601 450 578 - 40 427 438 8 000 48 000 56 000
11 44 513 000 7 449 175 6 311 846 4 396 524 - 175 350 62 845 895 19 000 69 000 88 000
14 47 210 000 2 495 997 - 6 309 428 - 59 194 56 074 619 5 000 31 000 36 000
15 67 821 939 2 061 333 4 178 884 1 063 477 1 873 939 - 76 999 572 3 000 29 000 32 000
16 35 026 000 51 807 888 6 861 527 13 195 929 - - 106 891 344 4 000 314 000 318 000
17 37 294 528 90 094 991 2 325 302 48 488 418 5 299 713 742 629 184 245 581 9 000 45 000 54 000
18 29 595 633 1 155 059 1 400 000 9 382 712 3 783 037 - 45 316 441 7 000 169 000 176 000
21 7 553 000 3 890 000 8 133 525 11 052 802 1 882 778 1 009 357 33 521 462 13 000 127 000 140 000
22 12 216 281 4 852 378 3 324 543 2 589 065 - - 22 982 266 21 000 11 000 32 000
23 18 192 398 7 982 802 10 057 741 6 976 527 - 967 200 44 176 668 4 000 620 000 624 000
24 16 349 700 7 274 438 13 005 501 6 138 713 3 424 605 1 575 318 47 768 274 2 000 236 000 238 000
25 16 510 000 784 337 6 025 851 9 060 715 1 895 001 22 047 34 297 950 20 000 968 000 988 000
28 13 976 700 5 464 789 3 031 962 5 218 311 - - 27 691 762 16 000 1 198 000 1 214 000
29 10 315 400 2 321 000 1 130 400 11 017 018 - 22 047 24 805 865 10 000 13 000 23 000
30 21 282 900 2 800 400 5 030 400 1 910 386 - 324 543 31 348 629 109 000 156 000 265 000
Total 660 211 045 221 075 234 117 247 984 180 559 398 20 082 438 5 574 151 1 204 750 251 293 000 4 547 000 4 840 000
Notes: 1. The amount of the bids approved for participation in government securities auctions on behalf of nonprimary dealers of BGL 5,020,000 thousand is included.2. The amount of approved competitive and noncompetitive bids on behalf of companies and individuals of BGL 6,271,725 thousand is included.3. The volume of repo agreements includes reverse repo agreements and repo agreements concluded during the current day.4. Transactions in USD-denominated government securities are in levs at the US dollar exchange rate quoted by the BNB on the day of transaction.5. Banking Department data on the volume of transactions in the Bulgarian Stock Exchange.

13Secondary Market of Government Securities
Chart 9Volume of Secondary Market Transactions in Government Securities
Issued for Structural Reform in June
Source: BNB.
Chart 10Volume of Secondary Market Transactions in Government Securities
Issued for Budget Deficit Financing in June
Source: BNB.
Repo agreementsUSD 27.20 million
Outright transactionsUSD 59.81 million
Transactions under Art. 14of Regulation 5
USD 22.79 million
Transactions under Art. 15of Regulation 5
USD 16.85 million
Transactions under Art. 20of Regulation 5
USD 9.68 million
Transactions under Art. 21of Regulation 5
USD 2.66 million
Transactions under Art. 14of Regulation 5
BGL 73.6 billion
Transactions under Art. 15of Regulation 5
BGL 103.5 billionTransactions under Art. 21
of Regulation 5BGL 0.5 billion
Transactions under Art. 20of Regulation 5BGL 1.8 billion
Outright transactionsBGL 61.6 billion
Repo agreementsBGL 609.1 billion

14June 1999
Outstanding Government SecuritiesDiscount Treasury Bills
Issue No.
Issue date
Maturity date
Nominal value of the offer(million BGL)
Total nominal value of thebids received (million BGL)
Total nominal value of thebids approved (millionBGL)
Average price of the bidsapproved per BGL 100 (%)
Average discount per BGL100 (%)
Average annual yield (%)
Effective annual yield (%)
Coverage coefficient
(continued)
BG3015698007 BG3015898003 BG3016098009 BG3016698006 BG3017098008 BG3017498000 BG3017898001 BG3018498009
8.07.1998 15.07.1998 22.07.1998 12.08.1998 26.08.1998 9.09.1998 23.09.1998 14.10.1998
7.07.1999 14.07.1999 21.07.1999 11.08.1999 25.08.1999 8.09.1999 22.09.1999 13.10.1999
20 000.00 15 000.00 20 000.00 15000.00 15000.00 15 000.00 15 000.00 17 000.00
47 810.00 35 650.00 31 960.00 40419.50 25250.00 18 365.00 16 055.00 11 865.00
20 000.00 15 000.00 20 000.00 15000.00 15000.00 15 000.00 15 000.00 11 865.00
93.64 93.66 93.64 93.66 93.67 93.67 93.66 93.65
6.36 6.34 6.36 6.34 6.33 6.33 6.34 6.35
6.81 6.79 6.81 6.79 6.78 6.78 6.79 6.8
6.81 6.79 6.81 6.79 6.78 6.78 6.79 6.8
2.39 2.38 1.60 2.69 1.68 1.22 1.07 0.70

15Secondary Market of Government Securities
Issu
e N
o.
Issu
e da
te
Mat
urity
dat
e
Nom
inal
val
ue o
f th
e of
fer
(mill
ion
BG
L)
Tot
al n
omin
al v
alue
of
the
bids
rec
eive
d (m
illio
n B
GL
)
Tot
al n
omin
al v
alue
of
the
bids
app
rove
d (m
illio
nB
GL
)
Ave
rage
pri
ce o
f th
e bi
dsap
prov
ed p
er B
GL
100
(%
)
Ave
rage
dis
coun
t pe
r B
GL
100
(%)
Ave
rage
ann
ual y
ield
(%
)
Eff
ectiv
e an
nual
yie
ld (
%)
Cov
erag
e co
effi
cien
t
(con
tinue
d)
(con
tinue
d)
BG
3018
8980
00B
G30
1929
8002
BG
3019
6980
03B
G30
2009
8003
BG
3020
4980
05B
G30
1019
9001
BG
3010
4990
05B
G30
1079
9008
28.1
0.19
9811
.11.
1998
25.1
1.19
989.
12.1
998
23.1
2.19
986.
01.1
999
20.0
1.19
993.
02.1
999
27.1
0.19
9910
.11.
1999
24.1
1.19
9908
.12.
1999
22.1
2.19
995.
01.2
000
19.0
1.20
002.
02.2
000
15 0
00.0
010
000
.00
10 0
00.0
010
000
.00
10 0
00.0
025
000
.00
25 0
00.0
020
000
.00
10 2
50.0
023
395
.50
28 1
75.0
033
914
.00
19 8
50.0
032
577
.60
36 6
70.0
037
350
.00
10 2
50.0
010
000
.00
10 0
00.0
010
000
.00
10 0
00.0
025
000
.00
25 0
00.0
020
000
.00
93.2
193
.45
93.6
293
.93
94.0
493
.75
93.6
893
.76
6.79
6.55
6.38
6.07
5.96
6.25
6.32
6.24
7.3
7.03
6.83
6.48
6.36
6.68
6.76
6.66
7.31
7.03
6.83
6.48
6.36
6.69
6.77
6.67
0.68
2.34
2.82
3.39
1.99
1.30
1.47
1.87

16 June 1999
Issu
e N
o.
Issu
e da
te
Mat
urity
dat
e
Nom
inal
val
ue o
f th
e of
fer
(mill
ion
BG
L)
Tot
al n
omin
al v
alue
of
the
bids
rec
eive
d (m
illio
n B
GL
)
Tot
al n
omin
al v
alue
of
the
bids
app
rove
d (m
illio
nB
GL
)
Ave
rage
pri
ce o
f th
e bi
dsap
prov
ed p
er B
GL
100
(%
)
Ave
rage
dis
coun
t pe
r B
GL
100
(%)
Ave
rage
ann
ual y
ield
(%
)
Eff
ectiv
e an
nual
yie
ld (
%)
Cov
erag
e co
effi
cien
t
(con
tinue
d)
(con
tinue
d)
BG
3011
0990
02B
G30
1139
9006
BG
3011
6990
09B
G30
1199
9003
BG
3012
0990
01B
G30
1219
9009
BG
3012
2990
07B
G30
1239
9005
17.0
2.19
994.
03.1
999
17.0
3.19
9931
.03.
1999
7.04
.199
97.
04.1
999
14.0
4.19
9921
.04.
1999
16.0
2.20
002.
03.2
000
15.0
3.20
0029
.09.
1999
7.07
.199
95.
04.2
000
14.0
7.19
9921
.07.
1999
15 0
00.0
015
000
.00
15 0
00.0
010
000
.00
5 00
0.00
15 0
00.0
05
000.
005
000.
00
34 0
36.7
043
240
.00
31 7
90.0
027
830
.00
12 8
39.0
042
960
.00
12 7
03.0
011
577
.50
15 0
00.0
015
000
.00
15 0
00.0
010
000
.00
5 00
0.00
15 0
00.0
05
000.
005
000.
00
93.9
194
.03
94.0
997
.54
98.8
394
.32
98.8
498
.85
6.09
5.97
5.91
2.46
1.17
5.68
1.16
1.15
6.50
6.37
6.30
5.06
4.75
6.04
4.71
4.67
6.50
6.37
6.30
5.12
4.83
6.04
4.79
4.75
2.27
2.88
2.12
2.78
2.57
2.86
2.54
2.32
17Secondary Market of Government Securities
(con
tinue
d)
Issu
e N
o.
Issu
e da
te
Mat
urity
dat
e
Nom
inal
val
ue o
f th
e of
fer
(mill
ion
BG
L)
Tot
al n
omin
al v
alue
of
the
bids
rec
eive
d (m
illio
n B
GL
)
Tot
al n
omin
al v
alue
of
the
bids
app
rove
d (m
illio
nB
GL
)
Ave
rage
pri
ce o
f th
e bi
dsap
prov
ed p
er B
GL
100
(%
)
Ave
rage
dis
coun
t pe
r B
GL
100
(%)
Ave
rage
ann
ual y
ield
(%
)
Eff
ectiv
e an
nual
yie
ld (
%)
Cov
erag
e co
effi
cien
t
(con
tinue
d)
BG
3012
4990
03B
G30
1259
9000
BG
3012
6990
08B
G30
1279
9006
BG
3012
8990
04B
G30
1299
9002
BG
3013
0990
00B
G30
1319
9008
21.0
4.19
9928
.04.
1999
5.05
.199
95.
05.1
999
12.0
5.19
9919
.05.
1999
19.0
5.19
9926
.05.
1999
19.0
4.20
0028
.07.
1999
4.08
.199
93.
05.2
000
11.0
8.19
9918
.08.
1999
17.0
5.20
0025
.08.
1999
15 0
00.0
05
000.
005
000.
0010
000
.00
5 00
0.00
5 00
0.00
10 0
00.0
05
000.
00
42 6
60.5
011
500
.00
8 73
7.00
28 0
00.0
08
746.
307
850.
0017
250
.00
8 61
4.20
15 0
00.0
05
000.
005
000.
0010
000
.00
5 00
0.00
5 00
0.00
10 0
00.0
05
000.
00
94.5
498
.86
98.8
894
.82
98.8
998
.90
94.9
498
.91
5.46
1.14
1.12
5.18
1.11
1.10
5.06
1.09
5.79
4.63
4.54
5.48
4.50
4.46
5.34
4.42
5.79
4.71
4.62
5.48
4.58
4.54
5.34
4.49
2.84
2.30
1.75
2.80
1.75
1.57
1.73
1.72

18 June 1999
Issu
e N
o.
Issu
e da
te
Mat
urity
dat
e
Nom
inal
val
ue o
f th
e of
fer
(mill
ion
BG
L)
Tot
al n
omin
al v
alue
of
the
bids
rec
eive
d (m
illio
n B
GL
)
Tot
al n
omin
al v
alue
of
the
bids
app
rove
d (m
illio
nB
GL
)
Ave
rage
pri
ce o
f th
e bi
dsap
prov
ed p
er B
GL
100
(%
)
Ave
rage
dis
coun
t pe
r B
GL
100
(%)
Ave
rage
ann
ual y
ield
(%
)
Eff
ectiv
e an
nual
yie
ld (
%)
Cov
erag
e co
effi
cien
t
(con
tinue
d)
BG
3013
2990
06B
G30
1339
9004
BG
3013
4990
02B
G30
1359
9009
BG
3013
6990
07B
G30
1389
9003
BG
3013
9990
01B
G30
1409
9009
2.06
.199
92.
06.1
999
9.06
.199
916
.06.
1999
16.0
6.19
9923
.06.
1999
30.0
6.19
9930
.06.
1999
1.09
.199
931
.05.
2000
8.09
.199
915
.09.
1999
14.0
6.20
0022
.09.
1999
29.0
9.19
9929
.12.
1999
5 00
0.00
10 0
00.0
05
000.
005
000.
0010
000
.00
5 00
0.00
4 00
0.00
10 0
00.0
0
8 94
3.30
11 1
25.0
08
791.
006
750.
0014
120
.00
4 05
0.00
3 36
5.00
8 07
0.00
5 00
0.00
10 0
00.0
05
000.
005
000.
0010
000
.00
4 05
0.00
3 25
0.00
8 07
0.00
98.9
194
.85
98.9
198
.91
94.6
998
.89
98.8
397
.28
1.09
5.15
1.09
1.09
5.31
1.11
1.17
2.72
4.42
5.44
4.42
4.42
5.62
4.50
4.75
5.61
4.49
5.44
4.49
4.49
5.62
4.58
4.83
5.69
1.79
1.11
1.76
1.35
1.41
0.81
0.84
0.81
Sour
ce:
MF
.

19Secondary Market of Government Securities
Issu
e N
o./D
ate
Mat
urity
dat
e
Nom
inal
val
ue o
f th
e of
fer
(mill
ion
BG
L)
Tot
al n
omin
al v
alue
of
the
bids
rec
eive
d (m
illio
n B
GL
)
Tot
al n
omin
al v
alue
of
the
bids
app
rove
d (m
illio
n B
GL
)
Ave
rage
pri
ce o
f th
e bi
dsap
prov
ed p
er B
GL
100
(%
)
Ave
rage
dis
coun
t pe
r B
GL
100
(%)
Inte
rest
rat
e
Cov
erag
e co
effi
cien
t
Outs
tand
ing
Gove
rnm
ent S
ecur
ities
Tre
asu
ry B
on
ds
(con
tinue
d)
11/3
0.01
.199
523
/02.
03.1
995
49/0
4.05
.199
520
0/31
.05.
1995
72/2
0.07
.199
585
/14.
09.1
995
106/
30.1
1.19
9511
3/28
.12.
1995
30.0
1.20
042.
03.2
000
27.0
4.20
0021
.05.
2002
13.0
7.20
007.
09.2
000
23.1
1.20
0021
.12.
2000
25.0
050
0.00
1 00
0.00
9 32
0.25
2 98
2.00
2 00
0.00
800.
001
016.
80
25.0
040
0.00
1 00
0.00
9 32
0.25
2 98
2.00
960.
0022
0.00
1 01
6.80
25.0
040
0.00
1 00
0.00
9 32
0.25
2 98
2.00
960.
0022
0.00
1 01
6.80
100.
0010
0.00
98.0
010
0.00
96.4
393
.81
92.8
692
.34
- -
2.00
-3.
576.
197.
147.
66
BIR
BIR
BIR
BIR
BIR
BIR
BIR
BIR
1.00
0.80
1.00
1.00
1.00
0.48
0.28
1.00

20 June 1999
(con
tinue
d)
Issu
e N
o.
Issu
e da
te
Mat
urity
dat
e
Nom
inal
val
ue o
f th
e of
fer
(mill
ion
BG
L)
Tot
al n
omin
al v
alue
of
the
bids
rec
eive
d (m
illio
n B
GL
)
Tot
al n
omin
al v
alue
of
the
bids
app
rove
d (m
illio
n B
GL
)
Ave
rage
pri
ce o
f th
e bi
dsap
prov
ed p
er B
GL
100
(%
)
Ave
rage
dis
coun
t pe
r B
GL
100
(%)
Inte
rest
rat
e
Cov
erag
e co
effi
cien
t
(con
tinue
d)
BG
2030
3961
26B
G20
3109
6121
BG
2033
2971
23B
G20
3479
7121
BG
2041
0970
28B
G20
4239
7112
BG
2043
3971
11B
G20
4409
7116
29.0
2.19
9630
.05.
1996
09.0
5.19
9716
.05.
1997
17.0
7.19
9728
.08.
1997
25.0
9.19
9716
.10.
1997
28.0
2.20
0123
.05.
2001
05.0
5.20
0010
.05.
2002
13.0
7.20
0026
.08.
1999
23.0
9.19
9914
.10.
1999
1 00
0.00
800.
0035
000
.00
20 0
00.0
035
000
.00
5 00
0.00
3 00
0.00
3 00
0.00
200.
0080
0.00
30 9
10.0
020
000
.00
54 1
50.0
012
325
.00
5 15
0.00
7 97
5.00
50.0
080
0.00
30 0
00.0
020
000
.00
35 0
00.0
03
250.
003
000.
003
000.
00
91.5
010
0.00
100.
0010
0.00
97.7
597
.03
97.1
097
.70
8.50
-0.
000.
002.
252.
972.
902.
30
BIR
BIR
+7
BIR
+4
BIR
+4
BIR
7.50
7.50
6.50
0.20
1.00
0.88
1.00
1.55
2.47
1.72
2.66
21Secondary Market of Government Securities
(con
tinue
d)
Issu
e N
o.
Issu
e da
te
Mat
urity
dat
e
Nom
inal
val
ue o
f th
e of
fer
(mill
ion
BG
L)
Tot
al n
omin
al v
alue
of
the
bids
rec
eive
d (m
illio
n B
GL
)
Tot
al n
omin
al v
alue
of
the
bids
app
rove
d (m
illio
n B
GL
)
Ave
rage
pri
ce o
f th
e bi
dsap
prov
ed p
er B
GL
100
(%
)
Ave
rage
dis
coun
t pe
r B
GL
100
(%)
Inte
rest
rat
e
Cov
erag
e co
effi
cien
t
1 x
≠ an
nual
yie
ld o
f 6-
mon
th g
over
nmen
t se
curi
ties
at t
he a
uctio
n pr
eced
ing
the
inte
rest
per
iod.
(con
tinue
d)
BG
2044
6971
13B
G20
4539
7127
BG
2045
9971
24B
G20
4649
7124
BG
2030
0981
28B
G20
3019
8110
BG
2030
2981
16B
G20
3039
8114
30.1
0.19
9720
.11.
1997
04.1
2.19
9718
.12.
1997
15.0
1.19
9829
.01.
1998
12.0
2.19
9805
.03.
1998
28.1
0.19
9918
.11.
1999
02.1
2.19
9916
.12.
1999
13.0
1.20
0027
.01.
2000
10.0
2.20
0002
.03.
2000
5 00
0.00
5 00
0.00
2 50
0.00
2 00
0.00
5 00
0.00
5 00
0.00
5 00
0.00
5 00
0.00
3 05
0.00
3 95
0.00
2 48
0.00
6 88
0.00
17 4
25.0
016
360
.00
13 3
20.0
010
620
.00
3 05
0.00
1 35
0.00
2 48
0.00
2 00
0.00
5 00
0.00
5 00
0.00
5 00
0.00
5 00
0.00
96.0
596
.66
94.5
894
.16
94.8
895
.86
96.1
195
.54
3.95
3.34
5.42
5.84
5.12
4.14
3.89
4.46
6.50
(x+
1).1
82/3
65 1
(x+
1).1
82/3
65 1
(x+
1).1
82/3
65 1
(x+
1).1
82/3
65 1
8.00
8.00
7.50
0.61
0.79
0.99
3.44
3.49
3.27
2.66
2.12

22 June 1999
Issu
e N
o.
Issu
e da
te
Mat
urity
dat
e
Nom
inal
val
ue o
f th
e of
fer
(mill
ion
BG
L)
Tot
al n
omin
al v
alue
of
the
bids
rec
eive
d (m
illio
n B
GL
)
Tot
al n
omin
al v
alue
of
the
bids
app
rove
d (m
illio
nB
GL
)
Ave
rage
pri
ce o
f th
e bi
dsap
prov
ed p
er B
GL
100
(%
)
Ave
rage
dis
coun
t pe
r B
GL
100
(%)
Inte
rest
rat
e
Cov
erag
e co
effi
cien
t
(con
tinue
d)
(con
tinue
d)
BG
2030
4981
12B
G20
3059
8119
BG
2030
6981
17B
G20
3079
8115
BG
2030
8981
13B
G20
3099
8111
BG
2031
0981
19B
G20
3119
8117
19.0
3.19
9802
.04.
1998
16.0
4.19
9830
.04.
1998
14.0
5.19
9828
.05.
1998
18.0
6.19
9802
.07.
1998
16.0
3.20
0030
.03.
2000
13.0
4.20
0024
.04.
2003
11.0
5.20
0022
.05.
2003
15.0
6.20
0026
.06.
2003
5 00
0.00
5 00
0.00
5 00
0.00
1 00
0.00
5 00
0.00
2 00
0.00
5 00
0.00
2 00
0.00
7 97
0.00
8540
.00
14 5
65.0
03
605.
0014
041
.00
3 44
0.00
7 82
5.00
2 07
0.00
5 00
0.00
5 00
0.00
5 00
0.00
1 00
0.00
5 00
0.00
2 00
0.00
5 00
0.00
2 00
0.00
95.4
694
.97
94.4
387
.14
95.4
784
.78
93.5
376
.20
4.54
5.03
5.57
12.8
64.
5315
.22
6.47
23.8
0
7.50
7.50
7.00
8.00
7.00
8.00
6.00
7.00
1.59
1.71
2.91
3.61
2.81
1.72
1.57
1.04

23Secondary Market of Government Securities
Issu
e N
o.
Issu
e da
te
Mat
urity
dat
e
Nom
inal
val
ue o
f th
e of
fer
(mill
ion
BG
L)
Tot
al n
omin
al v
alue
of
the
bids
rec
eive
d (m
illio
n B
GL
)
Tot
al n
omin
al v
alue
of
the
bids
app
rove
d (m
illio
nB
GL
)
Ave
rage
pri
ce o
f th
e bi
dsap
prov
ed p
er B
GL
100
(%
)
Ave
rage
dis
coun
t pe
r B
GL
100
(%)
Inte
rest
rat
e
Cov
erag
e co
effi
cien
t
(con
tinue
d)
(con
tinue
d)
BG
2031
2981
15B
G20
3139
8113
BG
2031
4981
11B
G20
3159
8118
BG
2031
6981
16B
G20
3179
8114
BG
2031
8981
12B
G20
3199
8110
16.0
7.19
9830
.07.
1998
20.0
8.19
9803
.09.
1998
17.0
9.19
9801
.10.
1998
15.1
0.19
9829
.10.
1998
13.0
7.20
0026
.07.
2001
17.0
8.20
0030
.08.
2001
14.0
9.20
0027
.09.
2001
12.1
0.20
0025
.10.
2001
5 00
0.00
1 00
0.00
5 00
0.00
1 00
0.00
5 00
0.00
1 50
0.00
5 00
0.00
1 50
0.00
6 45
0.00
2 75
0.00
11 4
50.0
01
400.
006
640.
001
155.
007
900.
0070
0.00
5 00
0.00
1 00
0.00
5 00
0.00
1 00
0.00
5 00
0.00
1 05
5.00
5 00
0.00
250.
00
92.7
089
.60
92.9
787
.85
92.4
586
.89
91.7
183
.48
7.30
10.4
07.
0312
.15
7.55
13.1
18.
2916
.52
6.00
7.00
6.00
6.50
6.00
6.50
6.00
6.50
1.29
2.75
2.29
1.40
1.33
0.77
1.58
0.47
24 June 1999
Issu
e N
o.
Issu
e da
te
Mat
urity
dat
e
Nom
inal
val
ue o
f th
e of
fer
(mill
ion
BG
L)
Tot
al n
omin
al v
alue
of
the
bids
rec
eive
d (m
illio
n B
GL
)
Tot
al n
omin
al v
alue
of
the
bids
app
rove
d (m
illio
nB
GL
)
Ave
rage
pri
ce o
f th
e bi
dsap
prov
ed p
er B
GL
100
(%
)
Ave
rage
dis
coun
t pe
r B
GL
100
(%)
Inte
rest
rat
e
Cov
erag
e co
effi
cien
t
(con
tinue
d)
(con
tinue
d)
BG
2032
0981
18B
G20
3219
8116
BG
2032
2981
14B
G20
3009
9118
BG
2030
1991
16B
G20
3029
9114
BG
2030
3991
12B
G20
3049
9110
19.1
1.19
9803
.12.
1998
17.1
2.19
9813
.01.
1999
27.0
1.19
9910
.02.
1999
24.0
2.19
9910
.03.
1999
16.1
1.20
0029
.11.
2001
14.1
2.20
0010
.01.
2001
24.0
1.20
0107
.02.
2001
21.0
2.20
0107
.03.
2001
1 00
0.00
500.
001
000.
005
000.
008
000.
0010
000
.00
15 0
00.0
015
000
.00
3 70
0.00
1 25
0.00
2 64
7.02
13 0
53.0
020
849
.60
24 0
21.0
330
397
.50
48 3
40.0
0
1 00
0.00
500.
001
000.
005
000.
008
000.
0010
000
.00
15 0
00.0
015
000
.00
93.3
295
.55
99.8
299
.60
99.3
899
.66
99.7
499
.91
6.68
4.45
0.18
0.40
0.62
0.34
0.26
0.09
6.50
9.00
9.00
9.00
9.00
9.00
9.00
9.00
3.70
2.50
2.65
2.61
2.61
2.40
2.03
3.22

25Secondary Market of Government Securities
Issu
e N
o.
Issu
e da
te
Mat
urity
dat
e
Nom
inal
val
ue o
f th
e of
fer
(mill
ion
BG
L)
Tot
al n
omin
al v
alue
of
the
bids
rec
eive
d (m
illio
n B
GL
)
Tot
al n
omin
al v
alue
of
the
bids
app
rove
d (m
illio
nB
GL
)
Ave
rage
pri
ce o
f th
e bi
dsap
prov
ed p
er B
GL
100
(%
)
Ave
rage
dis
coun
t pe
r B
GL
100
(%)
Inte
rest
rat
e
Cov
erag
e co
effi
cien
t
(con
tinue
d)
Sour
ce:
MF
.
BG20
3059
9117
BG20
3069
9115
BG20
3079
9113
BG20
3089
9111
BG20
3099
9119
BG20
3109
9117
BG20
3129
9113
BG20
3139
9111
BG20
3169
9114
24.0
3.19
9931
.03.
1999
14.4
.199
928
.4.1
999
29.4
.199
912
.05.
1999
26.0
5.19
9909
.06.
1999
23.0
6.19
99
21.0
3.20
0124
.03.
2004
11.0
4.20
0125
.04.
2001
22.0
4.20
049.
05.2
001
23.0
5.20
016.
06.2
001
20.0
6.20
01
15 0
00.0
02
000.
0015
000
.00
20 0
00.0
01
190.
0020
000
.00
20 0
00.0
020
000
.00
15 0
00.0
0
39 2
80.0
02
795.
0047
594
.30
42 8
70.0
01
190.
0025
720
.00
25 8
27.4
015
965
.00
11 2
20.0
0
15 0
00.0
02
000.
0015
000
.00
20 0
00.0
01
190.
0020
000
.00
20 0
00.0
015
965
.00
11 2
20.0
0
100.
0586
.35
100.
8499
.88
78.3
999
.98
98.9
897
.18
93.5
5
-0.0
513
.65
-0.8
40.
1221
.61
0.02
1.02
2.82
6.45
9.00
9.00
9.00
8.00
9.00
8.00
8.00
8.00
8.00
2.62
1.40
3.17
2.14
1.00
1.29
1.29
0.80
0.75

26June 1999
Government Securities Issued for Structural ReformGuaranty Government Securities
Lev Guaranty Government Securities
(continued)
BG2040296225 BG2040396223 BG2040596228 BG2044397227 BG2047397224 BG2047597229 BG2047497222 BG2047697227
05.06.1996 12.06.1996 27.06.1996 18.08.1997 22.10.1997 22.10.1997 27.10.199705.11.1997
28.05.2003 04.06.2003 19.06.2003 09.08.2004 13.10.2004 13.10.2004 18.10.2004 27.10.2004
3 428.57 3 622.12 453.18 25 355.82 2 796.63 9 111.74 8 078.71 12 419.73
BIR BIR BIR BIR BIR BIR BIR BIR
semiannual semiannual semiannual semiannual semiannual semiannual semiannual semiannual
equal annual equal annual equal annual equal annual equal annual equal annual equal annual equal annual
7 7 7 7 7 7 7 7
Issue No.Issue dateMaturity datePrincipal (million BGL)Interest rateInterest paymentsRepaymentsMaturity (in years)
Issue No.Issue dateMaturity datePrincipal (million BGL)Interest rateInterest paymentsRepaymentsMaturity (in years)
BG2040098225 BG2040298221 BG2040398229
29.01.1998 12.02.1998 10.03.1998
20.01.2005 03.02.2005 01.03.2005
2 936.32 2 741.11 116.06
BIR BIR BIR
semiannual semiannual semiannual
equal annual equal annual equal annual
7 7 7

27Secondary Market of Government Securities
(con
tinue
d)
Foreig
n C
urren
cy G
uaran
ty G
overn
men
t S
ecu
rit
ies
LIB
OR
≠ a
vera
ge s
ix-m
onth
LIB
OR
(L
ondo
n In
terb
ank
Off
ered
Rat
e) q
uote
d by
the
Reu
ters
for
the
pre
cedi
ng in
tere
st p
erio
d.ST
RIP
S ≠
Sepa
rate
Tra
ding
of
Reg
iste
red
Inte
rest
and
Pri
ncip
al o
f Se
curi
ties.
In c
ompl
ianc
e w
ith A
rtic
le 8
and
Art
icle
9, p
ara.
1, i
tem
s 1
and
2 of
the
LSP
DA
CB
, the
Min
istr
y of
Fin
ance
issu
es le
v an
d fo
reig
n cu
rren
cy g
uara
nty
gove
rnm
ent
secu
ritie
s. T
hese
are
issu
edun
der
the
follo
win
g co
nditi
ons:
(a
) in
levs
≠ 7
-yea
r re
dem
ptio
n te
rm; i
nter
est
≠ B
IR f
or t
he r
espe
ctiv
e pe
riod
, pay
able
sem
iann
ually
; red
empt
ion
sche
dule
≠ e
qual
ann
ual i
nsta
llmen
ts.
(b
) in
US
dolla
rs ≠
3-y
ear
rede
mpt
ion
term
; int
eres
t ≠
six-
mon
th L
IBO
R p
lus
2 pe
rcen
t, pa
yabl
e se
mia
nnua
lly; r
edem
ptio
n sc
hedu
le ≠
one
-off
at
end-
peri
od; t
rans
fera
ble
only
bet
wee
n co
m-
mer
cial
ban
ks b
ased
in th
is c
ount
ry. I
nter
est c
oupo
ns a
re s
epar
ated
fro
m th
e pr
inci
pal a
nd a
re f
reel
y tr
ansf
erab
le, p
rovi
ded
that
the
MF
and
the
BN
B a
ppro
ve a
ST
RIP
S pr
ogra
m f
or th
e ba
nks
appl
ying
to
trad
e in
inte
rest
cou
pon
deri
vativ
e fin
anci
al in
stru
men
ts, t
o be
reg
iste
red
in B
NB
Gov
ernm
ent
Secu
ritie
s D
epos
itory
.T
he L
aw o
n B
ank
Dep
osit
Gua
rant
y (p
ublis
hed
in th
e St
ate
Gaz
ette
, iss
ue 2
9 of
199
8) r
epea
ls th
e L
aw o
n St
ate
Pro
tect
ion
of D
epos
its a
nd A
ccou
nts
with
Com
mer
cial
Ban
ks in
Res
pect
Whe
reof
the
BN
B H
as P
etiti
oned
the
Ins
titut
ion
of B
ankr
uptc
y P
roce
edin
gs. T
he r
epea
led
law
is a
pplic
able
to
depo
sits
and
acc
ount
s w
ith b
anks
whi
ch h
ad b
een
decl
ared
inso
lven
t be
fore
the
enf
orce
-m
ent
of t
he L
aw o
n B
ank
Dep
osit
Gua
rant
y, a
s w
ell a
s to
the
spe
cial
fun
d fo
r st
ate
prot
ectio
n of
dep
osits
and
acc
ount
s an
d gu
aran
ty g
over
nmen
t se
curi
ties
serv
ice.
Pri
ncip
als
are
base
d on
act
ual d
ata
as o
f 30
Jun
e 19
99.
Sour
ce:
MF
.
Issu
e N
o.Is
sue
date
Mat
urity
dat
eP
rinc
ipal
(m
illio
n U
SD)
Inte
rest
rate
Inte
rest
pay
men
tsR
epay
men
ts
Mat
urity
(in
yea
rs)
Issu
e N
o.Is
sue
date
Mat
urity
dat
eP
rinc
ipal
(m
illio
n U
SD)
Inte
rest
rate
Inte
rest
pay
men
tsR
epay
men
ts
Mat
urity
(in
yea
rs)
BG
2040
0971
10B
G20
4019
8116
BG
2040
2971
16B
G20
4039
7114
BG
2045
6971
12B
G20
4729
7119
BG
2047
7971
18B
G20
4789
7116
02.0
5.19
9729
.01.
1998
21.1
0.19
9721
.10.
1997
15.0
8.19
9718
.08.
1997
24.1
0.19
970
5.1
1.1
99
7
28.0
4.20
0025
.01.
2001
17.1
0.20
0017
.10.
2000
11.0
8.20
0014
.08.
2000
20.1
0.20
000
1.1
1.2
00
0
8.8
60
.51
1.4
40
.66
2.0
44
9.5
72
3.3
35
.34
LIB
OR
+2
LIB
OR
+2
LIB
OR
+2
LIB
OR
+2
LIB
OR
+2
LIB
OR
+2
LIB
OR
+2
LIB
OR
+2
sem
iann
ual
sem
iann
ual
sem
iann
ual
sem
iann
ual
sem
iann
ual
sem
iann
ual
sem
iann
ual
sem
iann
ual
one-
off
one-
off
one-
off
one-
off
one-
off
one-
off
one-
off
one-
off
at m
atur
ityat
mat
urity
at m
atur
ityat
mat
urity
at m
atur
ityat
mat
urity
at m
atur
ityat
mat
urity
33
33
33
33
BG
2040
4981
10B
G20
4059
8117
BG
2040
6981
15
13.0
2.19
9813
.03.
1998
11.0
5.19
98
09.0
2.20
0106
.03.
2001
07.0
5.20
01
3.1
30
.05
1.0
1
LIB
OR
+2
LIB
OR
+2
LIB
OR
+2
sem
iann
ual
sem
iann
ual
sem
iann
ual
one-
off
one-
off
one-
off
at m
atur
ityat
mat
urity
at m
atur
ity
33
3

28June 1999
Government Securities Issued to Settle Nonperforming Credits of State-owned Companies to Banks
Legal regulation
Issue No./Date
Maturity date
Maturity (years)
Grace period (years)
Redemption term (years)
Repayments
Principal (million)
Interest payments
1999 interest
CMD 244/91 CMD 186/93 Art. 4 ZUNK/93 Art. 5 ZUNK/93 CMD 3/94 CMD 89/95
95/01.01.1992 99/01.07.1993 98/01.10.1993 97/01.01.1994 96/01.12.1993 200/31.05.1995
01.01.2011 01.07.2017 01.10.2018 01.01.2019 01.12.2018 21.05.2002
19 24 25 25 25 7
4 4 5 5 5 4
15 20 20 20 20 3
15 equal 20 equal 20 equal 20 equal 20 equal 6 equal
annual annual annual annual annual semiannual
installments installments installments installments installments installments
3302.08 (BGL) 2429.78 (BGL) 8787.98 (BGL) 634.89 (USD) 931.34 BGL) 9320.28 (BGL)
semiannual semiannual semiannual semiannual annual semiannual
BIR+1 2/3 BIR 2/3 BIR LIBOR* 2/3 BIR BIR
* Six-month LIBOR for the US dollar in the respective period.
Principals are based on actual data as of 30 June 1999.
Long-term government bonds transferred on the MF account with the BNB are included in the debt amount under ZUNK.
Pursuant to CM Decree No. 221 of 1995 holders of long-term government bonds issued under ZUNK, CM Decrees No. 244 of 1991, No. 186 of 1993, No. 3 of 1994 may be used as legal ten-der in privatization transactions.
Pursuant to CM Decree No. 22 of 1995, long-term government bonds issued under ZUNK may be used to repay obligations of state-owned enterprises, firms and commercial companies to thegovernment, transformed under Article 10 of ZUNK. In meeting these obligations, long-term government bonds are valued at their nominal for the bonds denominated in US dollars, and 80%for those denominated in levs.
Source: MF.

29Secondary Market of Government Securities
(billion BGL)
31.III.31.XII. 30.VI. 31.VII. 30.IV. 31.V. 30.VI. 31.VII. 31.VIII. 30.IX. 31.X. 30.XI. 31.XII. 31.I. 28.II. 31.I I.I 31.V. 30.VI30.IV31.VIII. 30.IX.
1997
31.X.
1996
30.XI. 31.XII.
1998 1999
31.I. 28.II. 31.III.0
50
100
150
200
250
300
50.0
111.6
226.1
269.4
231.9 231.8
201.3
159.2
135.3134.9
139.0130.3 128.9 122.6
103.3
62.2 65.2 62.456.5 56.8 61.2
55.664.1
70.9
100.3112.1
117.1
Chart 11Net Sales of Government Securities Issued under Regulation No. 5 to Nonbank
Financial Institutions, Companies and Individuals
Source: BNB.
SALES OF GOVERNMENT SECURITIES TO NONBANK FINANCIAL
INSTITUTIONS, COMPANIES AND INDIVIDUALS
Sales of Government Securities
Issued under Regulation No. 5
and Target Issues
The volume of government securitiessales for budget deficit financing in-creased in June. As of 30 June 1999 gov-ernment securities (issued under Regula-tion No. 5) held by individuals, compa-nies and nonbank financial institutionstotaled BGL 117,119 million (Chart 11),an increase of BGL 4,969 million, or4.43%, on the previous month. Targetgovernment securities earmarked for sale
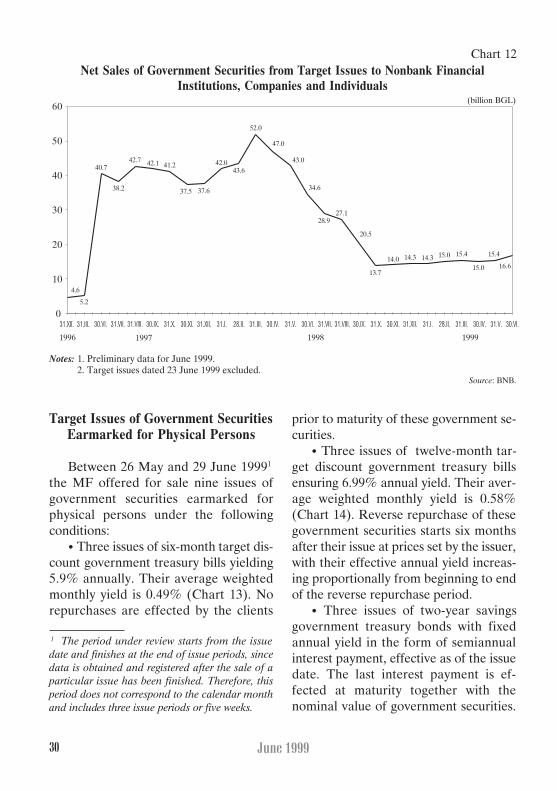
to physical persons accounted forBGL† 16,567 million (Chart 12), an in-crease of BGL 1,162 million, or 7.54%,on May.
In June sales of government securi-ties issued under Regulation No. 5 in-cluded three-month treasury bills ofBGL 5,516.7 million, six-month treasurybills of BGL 370 million, one-year ofBGL 1,739.5 million, and two-year trea-sury bonds of BGL† 1,915 million. Three-month treasury bills occupied the largestshare in total government securities salesin June, 57.82%.
Note: Preliminary data for June 1999.
30 June 1999
Chart 12Net Sales of Government Securities from Target Issues to Nonbank Financial
Institutions, Companies and Individuals(billion BGL)
31.III.31.XII. 30.VI. 30.IV. 31.V. 30.VI. 30.VI.31.VII. 31.VIII. 30.IX. 30.XI. 31.XII. 31.I. 28.II. 31.II .I 31.V.30.IV.31.X.31.VII. 31.VIII. 30.IX. 31.X.
19971996
30.XI. 31.XII.
1998 1999
31.I. 28.II. 31.III.0
10
20
30
40
50
60
4.6
5.2
38.2
42.7 42.1 41.2
37.5 37.6
42.043.6
52.0
47.0
43.0
34.6
28.927.1
15.0
15.415.014.314.314.0
13.7
20.5
40.7
15.4
16.6
Target Issues of Government Securities
Earmarked for Physical Persons
Between 26 May and 29 June 19991
the MF offered for sale nine issues ofgovernment securities earmarked forphysical persons under the followingconditions:
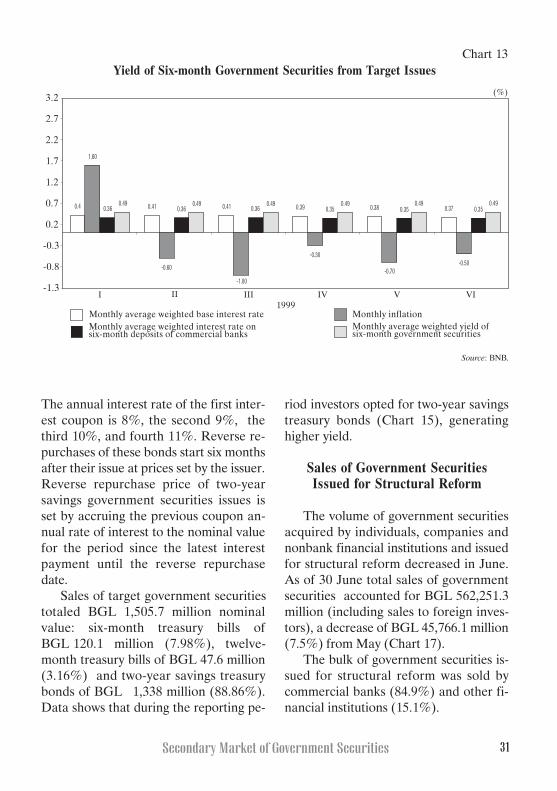
ï Three issues of six-month target dis-count government treasury bills yielding5.9% annually. Their average weightedmonthly yield is 0.49% (Chart 13). Norepurchases are effected by the clients
prior to maturity of these government se-curities.
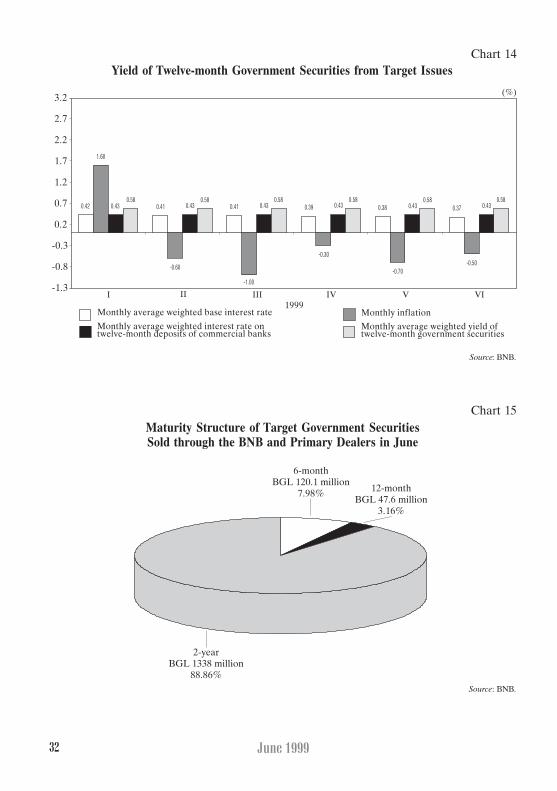
ï Three issues of twelve-month tar-get discount government treasury billsensuring 6.99% annual yield. Their aver-age weighted monthly yield is 0.58%(Chart 14). Reverse repurchase of thesegovernment securities starts six monthsafter their issue at prices set by the issuer,with their effective annual yield increas-ing proportionally from beginning to endof the reverse repurchase period.
ï Three issues of two-year savingsgovernment treasury bonds with fixedannual yield in the form of semiannualinterest payment, effective as of the issuedate. The last interest payment is ef-fected at maturity together with thenominal value of government securities.
Notes: 1. Preliminary data for June 1999.2. Target issues dated 23 June 1999 excluded.
Source: BNB.
1 The period under review starts from the issuedate and finishes at the end of issue periods, sincedata is obtained and registered after the sale of aparticular issue has been finished. Therefore, thisperiod does not correspond to the calendar monthand includes three issue periods or five weeks.
31Secondary Market of Government Securities
The annual interest rate of the first inter-est coupon is 8%, the second 9%, thethird 10%, and fourth 11%. Reverse re-purchases of these bonds start six monthsafter their issue at prices set by the issuer.Reverse repurchase price of two-yearsavings government securities issues isset by accruing the previous coupon an-nual rate of interest to the nominal valuefor the period since the latest interestpayment until the reverse repurchasedate.
Sales of target government securitiestotaled BGL 1,505.7 million nominalvalue: six-month treasury bills ofBGL 120.1 million (7.98%), twelve-month treasury bills of BGL 47.6 million(3.16%) and two-year savings treasurybonds of BGL† 1,338 million (88.86%).Data shows that during the reporting pe-
riod investors opted for two-year savingstreasury bonds (Chart 15), generatinghigher yield.
Sales of Government Securities
Issued for Structural Reform
The volume of government securitiesacquired by individuals, companies andnonbank financial institutions and issuedfor structural reform decreased in June.As of 30 June total sales of governmentsecurities accounted for BGL 562,251.3million (including sales to foreign inves-tors), a decrease of BGL 45,766.1 million(7.5%) from May (Chart 17).
The bulk of government securities is-sued for structural reform was sold bycommercial banks (84.9%) and other fi-nancial institutions (15.1%).
Chart 13Yield of Six-month Government Securities from Target Issues
Source: BNB.
Monthly average weighted base interest rate Monthly inflationMonthly average weighted interest rate onsix-month deposits of commercial banks
Monthly average weighted yield ofsix-month government securities
1999I II III IV VIV
(%)
0.4 0.41 0.41 0.39 0.38
1.60
0.36 0.36 0.36 0.35 0.350.49
-0.60
-1.00
-0.30
-0.70
0.49 0.49 0.49 0.49
-1.3
-0.8
-0.3
0.2
0.7
1.2
1.7
2.2
2.7
3.2
0.37
-0.50
0.350.49
32 June 1999
Chart 15Maturity Structure of Target Government Securities
Sold through the BNB and Primary Dealers in June
Source: BNB.
Chart 14Yield of Twelve-month Government Securities from Target Issues
Monthly average weighted base interest rate Monthly inflation
Monthly average weighted interest rate ontwelve-month deposits of commercial banks
Monthly average weighted yield oftwelve-month government securities
1999
(%)
-1.3
-0.8
-0.3
0.2
0.7
1.2
1.7
2.2
2.7
3.2
0.42 0.41 0.41 0.39 0.38
1.60
-1.00
-0.30
-0.60-0.70
0.43 0.43 0.43 0.43 0.430.58 0.58 0.58 0.58 0.58
I II III IV VIV
0.37
-0.50
0.430.58
Source: BNB.
12-monthBGL 47.6 million
3.16%
2-yearBGL 1338 million
88.86%
6-monthBGL 120.1 million
7.98%

33Secondary Market of Government Securities
Chart 16Volume of Target Government Securities Sales to Physical Persons
Source: BNB.
May June JuneJuly August September October November December January February March April May
(million BGL)
First issue period for the month Second issue period for the month Third issue period for the month
0
500
1000
1500
2000
2500
3000
1998 1999
Lev-denominated government securi-ties held by individuals, companies andnonbank financial institutions totaledBGL 8,142.8 million (1.5% of totalsales), while USD-denominated govern-ment securities issued under ZUNK ac-counted for BGL 554,108.5 million.
Sales of Government Securities to
Foreign Investors
The slight upward trend from the pre-vious months in the volume of govern-ment securities held by foreign investorscontinued in June. As of 30 June 1999government securities acquired by for-eign investors totaled BGL 146,542.1million (Chart 18), an increase of
BGL 7,988.1 million (5.8%) on May.Government securities acquired by
foreign investors and issued under Regu-lation No. 5 were repurchased and nosales were registered in June. Target gov-ernment securities (earmarked for directsale to physical persons) sold to nonresi-dents totaled BGL 6.7 million.
As of 30 June USD-denominatedlong-term government bonds held by for-eign investors increased by USD 3.3 mil-lion, reaching USD 77.4 million (equiva-lent to BGL 146,535.4 million), an in-crease of BGL 8,047 million, or 5.8%, onthe previous month. Forex bonds on do-mestic debt continued to occupy the larg-est share in foreign investorsí portfolios(99.9%).

34 June 1999
Chart 17Net Sales of Government Securities Issued for Structural Reform to Nonbank
Financial Institutions, Companies and Individuals
Note: Data on USD-denominated government securities shows the lev equivalent based on the USD exchange rate atthe end of month.
Source: BNB.
(billion BGL)
1997
30.IV. 30.VI. 30.VI.31.VII. 31.VIII. 30.IX. 31.X. 30.XI. 31.XII. 31.I. 28.I .I31.V.31.XII.
1998 1999
31.I. 28.II. 31.III. 31.III. 30.IV. 31.V.
420.8
457.4 469
515.4 504.4477.9
380.7356.7
331.8
246.7262.9
282.9 277.0300.6 312.1
596.0 601.1
0
50
100
150
200
250
300
350
400
450
500
550
600
650608.0
562.3
Chart 18Government Securities in Foreign Investorsí Portfolios
Note: Preliminary data for June 1999.Source: BNB.
Government securities issuedunder Regulation No. 5 of 1996
Target issues ofgovernment securities
USD-denominatedgovernment securities
(billion BGL)
30.IV. 30.VI. 30.VI.31.VII. 31.VIII. 30.IX. 31.X. 30.XI. 31.XII. 31.I. 28. .II31.V.
1998 199931.I. 28.II. 31.III. 31.III. 30.IV. 31.V.
0
100
200
300
400
500
600

35Secondary Market of Government Securities
Chart 20Holders of USD-denominated Government Securities Issued
under ZUNK by 30 June
Source: BNB.
Notes: 1. Including frozen government securities by financial institutions.2. Preliminary data.
Chart 19Holders of Government Securities Issued under
Regulation No. 5 and of Target Issues by 30 June
Source: BNB.
Notes: 1. Including frozen government securities by financial institutions.2. Excluding guaranty government securities issued under the LSPDACB.3. Preliminary data.
Private banksBGL 320 billion (39.08%)
Local nonbank financialinstitutions, companies and individuals
BGL 133.7 billion (16.33%)
Government banksBGL 365.1 billion (44.59%)
Foreign investorsUSD 77.4 million (12.89%)
Private banksUSD 124.9 million (20.81%)
Local nonbank financial institutions,companies and individuals
USD 215.2 million (35.86%)
Government banksUSD 182.7 million (30.44%)

36 June 1999
Chart 21Holders of Lev-denominated Government Securities Issued
for Structural Reform (as of 30 June)
Source: BNB.
Notes: 1. Including frozen government securities by financial institutions.2. Preliminary data.
Private banksBGL 2.8 billion (18.3%)
Local nonbank financialinstitutions, companies and individuals
BGL 8.1 billion (52.7%)
Government banksBGL 4.5 billion (29%)

37Secondary Market of Government Securities
SALES OF GOVERNMENT SECURITIES ISSUED FOR
STRUCTURAL REFORM FOR PARTICIPATION IN
PRIVATIZATION TRANSACTIONS
In June long-term government bondsissued under Article 5 of ZUNK, totalingUSD 0.21 million, were sold for partici-pation in privatization. Pursuant to Ar-ticle 5 of the Regulation on participationin privatization of holders of long-termgovernment bonds issued under theterms of ZUNK, CM Decrees Nos. 244of 1991, 186 of 1993 and 3 of 1994 (gov-ernment securities for structural reform),
these government securities were trans-ferred to the MF account for participa-tion in 24 privatization transactions as le-gal tender.
The average weighted price of thebonds issued under Article 5 of ZUNKand sold for participation in privatizationwas USD 57.36 per USD 100 nominalvalue (Chart 22). In June no transfertransactions in government securities
Chart 22Price Dynamics of Government Securities Issued under Articles 4 and 5
of ZUNK and Sold to Companies and Individuals
for Participation in Privatization
Source: BNB.
(USD)
Average weighted selling price in BGL Average weighted selling price in USD
(BGL)
1995
400
500
600
700
800
900
1000
1100
40
50
60
70
80
90
100
110
I III VI IX XII
1996I II III IV V VI VII VIII IX X XI XII I II III IV V VI VII VIII IX X XI XII I II III IV V VI VIVII VIII IX X XI XII
1997 1998 1999II III IV VI
38 June 1999
from issue No. 98 of 1993 (to be used aslegal tender in privatization transactions)were registered.
In June pursuant to Article 1 of theRegulation on the procedure for utiliza-tion of long-term government bonds is-sued under ZUNK for repayment of
debts to the government arising underthe same law (published in the State Ga-zette, issue 12 of 3 February 1995), ma-turing long-term government bonds ofUSD 0.6 million (issued under Article 5of ZUNK) were used.
Sales of Long-term Government Bonds Issued for Structural Reform for
Participation in Privatization Transactions
Year Jan. Feb. March April May June July Aug. Sep. Oct. Nov. Dec. Total
I. Government 1994 19.20 0.10 501.40 110.70 177.00 76.70 609.80 28.30 1523.20securities in BGL 1995 88.20 257.20 65.00 35.50 143.60 132.40 262.90 148.90 59.80 54.90 242.50 354.90 1845.80(million BGL) 1996 5.70 53.90 16.50 113.90 16.60 147.80 19.90 46.00 121.30 309.60 541.20 1151.20 2543.60
1997 210.70 1374.90 114.90 1259.35 4354.90 744.30 500.80 175.00 209.10 184.50 135.60 144.70 9408.751998 3916.30 17.18 238.60 13.70 60.00 90.72 27.30 3.96 0.00 11.47 0.00 0.00 4379.231999 0.00 0.00 0.00 0.00 0.00 0.00 0.00
II. Government 1994securities in USD 1995 0.80 0.10 0.10 0.90 1.70 3.90 7.50(million USD) 1996 0.18 0.23 0.32 2.22 0.04 2.47 0.20 2.21 0.22 4.29 1.22 0.76 14.37
1997 4.96 0.68 4.10 0.11 1.54 1.41 6.22 1.73 3.86 2.63 2.15 10.26 39.641998 31.50 4.79 11.00 13.00 13.15 10.59 5.18 13.78 4.77 3.60 4.55 2.81 118.721999 9.50 1.61 5.34 0.67 0.61 0.21 17.94
Notes: 1. Government securities in BGL include long-term government bonds issued under Article 4 of ZUNK,CM Decrees No. 186 of 1993 and No. 3 of 1994.
2. Government securities in USD include long-term government bonds issued under Article 5 of ZUNK anddenominated in US dollars.
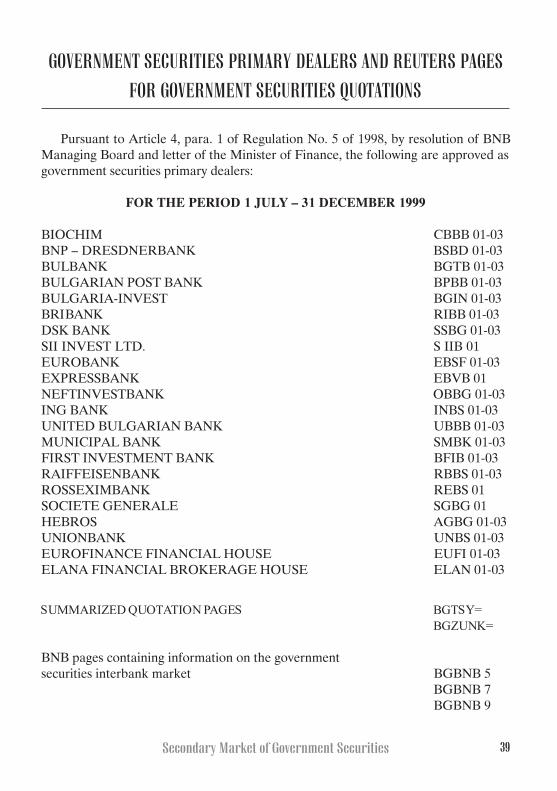
39Secondary Market of Government Securities
Pursuant to Article 4, para. 1 of Regulation No. 5 of 1998, by resolution of BNBManaging Board and letter of the Minister of Finance, the following are approved asgovernment securities primary dealers:
FOR THE PERIOD 1 JULY ≠ 31 DECEMBER 1999
BIOCHIM CBBB 01-03BNP ≠ DRESDNERBANK BSBD 01-03BULBANK BGTB 01-03BULGARIAN POST BANK BPBB 01-03BULGARIA-INVEST BGIN 01-03BRIBANK RIBB 01-03DSK BANK SSBG 01-03SII INVEST LTD. S IIB 01EUROBANK EBSF 01-03EXPRESSBANK EBVB 01NEFTINVESTBANK OBBG 01-03ING BANK INBS 01-03UNITED BULGARIAN BANK UBBB 01-03MUNICIPAL BANK SMBK 01-03FIRST INVESTMENT BANK BFIB 01-03RAIFFEISENBANK RBBS 01-03ROSSEXIMBANK REBS 01SOCIETE GENERALE SGBG 01HEBROS AGBG 01-03UNIONBANK UNBS 01-03EUROFINANCE FINANCIAL HOUSE EUFI 01-03ELANA FINANCIAL BROKERAGE HOUSE ELAN 01-03
SUMMARIZED QUOTATION PAGES BGTSY=BGZUNK=
BNB pages containing information on the governmentsecurities interbank market BGBNB 5
BGBNB 7BGBNB 9
GOVERNMENT SECURITIES PRIMARY DEALERS AND REUTERS PAGES
FOR GOVERNMENT SECURITIES QUOTATIONS
Published by the Bulgarian National BankFiscal Services Department, tel. 9145 1486.1000 Sofia, 1 Alexander Battenberg SquareTelephone: 91459Telex: 24090, 24091Fax: 980 2425, 980 6493Printed by BNB Printing Center
© Bulgarian National Bank, 1999
ISSN 1311-0055
This issue includes materials and data received up to 19 July 1999.
The contents of the Secondary Market of Government SecuritiesBulletin may be quoted or reproduced without further permission.Due acknowledgment is requested.