junctions - european commission safety basic facts 2016 - junctions - 4 - figure 2 shows that the...
TRANSCRIPT

Traffic Safety Basic Facts 2013 - Main Figures
Traffic Safety Basic Facts 2016
Junctions

Traffic Safety Basic Facts 2016 - Junctions
- 2 -
General
In 2014, about 26.000 people were killed in road accidents throughout the EU; at least 5.000 of whom were killed in road accidents at junctions - a reduction of more than 40% since 2005. So the trend in junction accident fatalities broadly followed the trend in all fatalities.
Figure 1: Number of junction fatalities and all road fatalities, EU, 2005-2014
Source: CARE database, data available in May 2016..
Statistics related to junction accidents need to be treated carefully due to the presence of a high proportion of "unknown" entries in certain countries.
The number of fatalities at junctions has fallen every
year except two since 2005.

Traffic Safety Basic Facts 2016 - Junctions
- 3 -
Table 1: Number of junction fatalities by country, 2005-2014
2005 2006 2007 2008 2009 2010 2011 2012 2013 2014
BE 210 207 195 167 164 158 170 141 138 94
BG - - - 167 119 - - - - -
CZ 262 221 216 237 177 177 171 143 140 146
DK 94 101 129 126 93 72 67 48 53 47
DE 1.333 1.291 1.219 1.117 1.071 914 1.035 - - -
EE 31 38 52 38 21 17 20 9 - 13
IE 74 56 45 42 30 23 29 23 40 -
EL - - - - - - - - - -
ES 750 754 721 577 484 458 369 377 315 353
FR 664 593 565 475 576 490 508 466 445 484
HR 82 82 82 102 85 57 72 61 61 54
IT 1.674 1.654 1.550 1.369 1.218 1.140 1.102 929 760 834
CY 26 30 34 32 17 17 22 11 12 15
LV 38 45 53 20 17 28 28 18 15 23
LT - - - - - - - - - -
LU 3 3 7 8 6 6 4 6 7 5
HU 260 266 268 246 169 129 92 87 100 105
MT - - - - - - - - - -
NL 249 276 253 227 221 192 207 190 183 163
AT 148 128 123 115 139 118 118 102 101 80
PL 898 805 884 872 739 616 678 598 550 522
PT 196 131 161 140 137 163 156 120 93 111
RO 236 238 272 270 255 208 216 227 213 175
SI 28 23 24 24 12 14 15 7 15 15
SK 72 75 61 70 35 44 - - - -
FI 73 65 62 72 51 58 66 - - -
SE 98 99 115 97 65 50 - - - -
UK 1.152 1.115 1.089 907 816 646 706 682 646 648
EU 8.818 8.463 8.347 7.517 6.716 5.914 6.064 5.559 5.210 5.241
Yearly Change
-4% -1% -10% -11% -12% 3% -8% -6% 1%
IS 3 2 1 4 1 4 1 0 3 0
CH 55 54 55 69 66 43 55 42 39 38
Source: CARE database, data available in May 2016 Totals for EU include latest available data (Data for Greece, Lithuania and Malta not included in totals)
It is estimated that more than 5.000 people died in
road accidents at junctions in the EU in 2014.

Traffic Safety Basic Facts 2016 - Junctions
- 4 -
Figure 2 shows that the proportion of fatalities in road accidents at junctions of all fatalities was slightly above 20% throughout the last years. A few countries have been excluded from this chart due to a lack of appropriate data (see Table 8). The proportions from 2014 are illustrated in Map 1.
Figure 2: Number of junction fatalities and percentage of all road fatalities, EU, 2005-2014 or latest available year
Source: CARE database, data available in May 2016
The proportion of fatalities in road accidents at junctions of all fatalities was slightly above 20% throughout the
last years.

Traffic Safety Basic Facts 2016 - Junctions
- 5 -
Map 1: Percentage of junction fatalities by country, 2014 or latest available year
The proportion of fatalities occurring at junctions varies
between 10% and 35% across the EU.

Traffic Safety Basic Facts 2016 - Junctions
- 6 -
Table 2 shows the proportion of fatalities in road accidents at junctions of all fatalities by country (data availability provided). There seems to be no common trend in this proportion across the EU, it has tended to fall in some countries, to remain constant or to rise in others.
Table 2: Percentage of junction fatalities of all road fatalities by country, 2005-2014 or latest available year
2005 2006 2007 2008 2009 2010 2011 2012 2013 2014
BE 19% 19% 18% 18% 17% 19% 20% 18% 19% 13%
BG - - - 16% 13% - - - - -
CZ 20% 21% 18% 22% 20% 22% 22% 19% 21% 21%
DK 28% 33% 32% 31% 31% 28% 30% 29% 28% 26%
DE 25% 25% 25% 25% 26% 25% 26% 29% 31% 31%
EE 18% 19% 27% 29% 21% 22% 20% 10% 11% 17%
IE 19% 15% 13% 15% 13% 11% 16% 14% 21% -
EL - - - - - - - - - -
ES 17% 18% 19% 19% 18% 18% 18% 20% 19% 21%
FR 12% 13% 12% 11% 13% 12% 13% 13% 14% 14%
HR - - 13% 15% 16% 13% 17% 16% 17% 18%
IT 29% 29% 30% 29% 29% 28% 29% 25% 22% 25%
CY 25% 35% 38% 39% 24% 28% 31% 22% 27% 33%
LV 9% 11% 13% 6% 7% 13% 16% 10% 8% 11%
LT - - - - - - - - - -
LU 6% 7% 15% 23% 13% 0% 12% 18% 16% 14%
HU 20% 20% 22% 25% 21% 17% 14% 14% 17% 17%
MT - - - - - - - - - -
NL 33% 38% 36% 34% 34% 36% 38% 34% 38% 34%
AT 19% 18% 18% 17% 22% 21% 23% 19% 22% 19%
PL 16% 15% 16% 16% 16% 16% 16% 17% 16% 16%
PT 16% 14% 17% 16% 16% 17% 18% 17% 15% 17%
RO 9% 9% 10% 9% 9% 9% 11% 11% 11% 10%
SI 11% 9% 8% 0% 7% 10% 11% 5% 12% 12%
SK 12% 12% 9% 12% 9% 12% - - 14% -
FI 19% 19% 16% 21% 18% 21% 23% - - -
SE 22% 22% 24% 24% 18% 19% 16% 18% 19% 19%
UK 35% 34% 36% 34% 35% 34% 36% 38% 36% 35%
EU 20% 20% 20% 20% 20% 20% 21% 20% 20% 21%
IS 16% 6% 7% 33% 6% 50% 8% 0% 20% 0%
CH 13% 15% 14% 19% 19% 13% 17% 12% 14% 16%
Source: CARE database, data available in May 2016
The proportion of fatalities occurring in road accidents at junctions has tended to fall
in some countries, but to rise in others.

Traffic Safety Basic Facts 2016 - Junctions
- 7 -
Figure 3: Junction fatality rates per million population by country, 2014 or latest available year
Source: CARE database, data available in May 2016
Figure 3 and Table 3 illustrate the junction fatality rates per million population by country. This indicator ranges between 5 and 17, with an EU average of 11 junction fatalities per one million residents.
The junction fatality rate ranges between 5 and 17, with an EU average of 11 junction fatalities per one
million residents.

Traffic Safety Basic Facts 2016 - Junctions
- 8 -
Table 3: Junction fatality rates per million population by country, 2005-2014 or latest available year
2005 2006 2007 2008 2009 2010 2011 2012 2013 2014
BE 20 20 18 16 15 15 15 13 12 8
BG - - - 22 16 - - - - -
CZ 26 22 21 23 17 17 16 14 13 14
DK 17 19 24 23 17 13 12 9 9 8
DE 16 16 15 14 13 11 13 13 13 13
EE 23 28 39 28 16 13 15 7 7 10
IE 18 13 10 9 7 5 6 5 9 -
EL - - - - - - - - - -
ES 17 17 16 13 10 10 8 8 7 8
FR 11 10 9 8 9 8 8 7 7 8
HR - - 19 24 20 13 17 14 14 13
IT 29 28 27 23 21 19 19 16 13 14
CY 35 40 45 41 21 21 26 13 14 17
LV 17 20 24 9 8 13 13 9 7 11
LT - - - - - - - - - -
LU 7 6 15 17 12 0 8 11 13 9
HU 26 26 27 24 17 13 9 9 10 11
MT - - - - - - - - - -
NL 15 17 15 14 13 12 12 11 11 10
AT 18 16 15 14 17 14 14 12 12 9
PL 24 21 23 23 19 16 18 16 14 14
PT 19 12 15 13 13 15 15 11 9 11
RO 11 11 13 13 12 10 11 - - -
SI 14 11 12 0 6 7 7 3 7 -
SK 13 14 11 13 7 8 - - 8 -
FI 14 12 12 14 10 11 12 - - - -
SE 11 11 13 11 7 5 5 5 5 5
UK 20 19 18 15 14 10 11 11 10 10
EU 19 18 17 16 14 12 12 11 11 11
IS 10 7 3 13 3 13 3 0 9 0
CH 7 7 7 9 9 6 7 5 5 5
Source: CARE database, data available in May 2016
Just like the number of junction fatalities, also the junction fatality rate has
been declining in the last ten years in most EU countries.

Traffic Safety Basic Facts 2016 - Junctions
- 9 -
Age and Gender
Table 4 shows that the elderly (at least 65 years) are more likely than others to be killed at a junction. The variation of the percentage of junction fatalities by age and gender is illustrated in Figure 4.
Figure 4: Percentage of junction fatalities by age group and gender, EU, 2014
Source: CARE database, data available in May 2016
Table 4: Number and distribution of road fatalities by “junction”, age group and gender and percentage of junction fatalities by age group and gender, EU, 2014
<15 15-17 18-24 25-49 50-64 65+
Un- known
Total
Junction accidents female 38 27 93 223 179 541 8 1.110
male 62 70 318 988 535 910 12 2.896
Non-junction accidents
female 193 121 457 1.074 715 1.325 16 3.901
male 256 278 1.997 5.181 2.741 2.492 57 13.002
Distribution of fatalities in
Junction accidents female 1% 1% 2% 6% 4% 14% 0% 28%
male 2% 2% 8% 25% 13% 23% 0% 72%
Non-junction accidents
female 1% 1% 3% 6% 4% 8% 0% 23%
male 2% 2% 12% 31% 16% 15% 0% 77%
Proportion of fatalities at junctions
female 16% 18% 17% 17% 20% 29% 33% 22%
male 19% 20% 14% 16% 16% 27% 17% 18%
Source: CARE database, data available in May 2016
The proportion of fatalities occurring at junctions is
highest for the age group 65+ for both females and
males.

Traffic Safety Basic Facts 2016 - Junctions
- 10 -
Road user type and transport mode
Figure 5: Distribution of junction fatalities by mode of transport, EU, 2005-2014
Source: CARE database, data available in May 2016
Figure 5 and Table 5 show the distribution of fatalities that occurred at junctions across the different modes of transport as recorded in CARE data. According to Figure 5, especially the proportion of pedestrians in junction fatalities has been steadily increasing in the last years.
The proportion of pedestrians in junction fatalities has been steadily increasing in the last
years.

Traffic Safety Basic Facts 2016 - Junctions
- 11 -
Table 5: Total number and distribution of junction fatalities by country and mode of transport, 2014 or latest available year
Car or Taxi
Pedes-trian
Motor Cycle
Pedal Cycle
Moped Lorry HGV Other Total
BE 28% 13% 19% 35% 5% 0% 0% 0% 94
BG 44% 31% 9% 9% 1% 0% 4% 2% 119
CZ 40% 20% 20% 16% 1% 3% 1% 0% 146
DK 32% 11% 15% 30% 11% 2% 0% 0% 47
DE - - - - - - - - -
EE 46% 23% 0% 0% 0% 0% 0% 31% 13
IE 63% 13% 15% 3% 0% 5% 0% 3% 40
EL - - - - - - - - -
ES 31% 24% 21% 6% 5% 6% 3% 5% 353
FR 35% 20% 27% 7% 8% 2% 0% 1% 484
HR 48% 20% 15% 7% 4% 2% 0% 4% 54
IT 38% 14% 27% 11% 5% 3% 0% 1% 834
CY 20% 27% 27% 0% 7% 13% 0% 7% 15
LV 52% 13% 13% 13% 9% 0% 0% 0% 23
LT - - - - - - - - -
LU 60% 20% 20% 0% 0% 0% 0% 0% 5
HU 30% 24% 13% 23% 6% 1% 1% 2% 105
MT - - - - - - - - -
NL 19% 7% 9% 40% 10% 1% 1% 12% 163
AT 29% 16% 23% 25% 3% 1% 3% 1% 80
PL 32% 38% 11% 14% 3% 0% 2% 1% 522
PT 20% 26% 22% 7% 13% 7% 0% 5% 111
RO 38% 33% 2% 12% 3% 4% 1% 7% 175
SI 20% 33% 20% 20% 0% 0% 0% 7% 15
SK - - - - - - - - -
FI - - - - - - - - -
SE - - - - - - - - -
UK 31% 31% 25% 9% 0% 1% 0% 3% 648
EU 34% 23% 20% 13% 4% 2% 0% 3% 4.051
CH 31% 0% 40% 29% 0% 0% 0% 0% 35
Source: CARE database, data available in May 2016
60% of fatalities occurring at junctions are
vulnerable road users.

Traffic Safety Basic Facts 2016 - Junctions
- 12 -
Table 6: Percentage of junction fatalities by country and mode of transport, 2014 or latest available year
Car or Taxi
Pedes-trian
Motor Cycle
Pedal Cycle
Moped Lorry HGV Other Total
BE 7% 13% 23% 48% 31% 0% 0% 0% 13%
BG - - - - - - - - 13%
CZ 17% 22% 33% 34% 13% 25% 4% 0% 21%
DK 17% 23% 39% 47% 38% 11% 0% 0% 26%
DE - - - - - - - - 31%
EE 18% 12% 0% 0% 0% 0% 0% 0% 17%
IE - - - - - - - - 21%
EL - - - - - - - - -
ES 15% 25% 25% 28% 31% 19% 21% 31% 21%
FR 10% 19% 20% 21% 23% 6% 0% 0% 14%
HR 19% 15% 18% 21% 18% 20% 0% 22% 18%
IT 21% 21% 32% 35% 40% 20% 4% 18% 25%
CY 20% 40% 44% 0% 0% 50% 0% 0% 33%
LV 13% 4% 30% 19% 33% 0% 0% 0% 11%
LT - - - - - - - - -
LU 13% 33% 13% 0% 0% 0% 0% 0% 14%
HU 13% 16% 24% 24% 35% 4% 7% 33% 17%
MT - - - - - - - - -
NL 18% 24% 29% 55% 53% 29% 17% 49% 34%
AT 12% 18% 24% 44% 13% 10% 22% 0% 19%
PL 13% 18% 23% 25% 23% 0% 10% 9% 16%
PT 10% 20% 26% 23% 33% 16% 0% 14% 17%
RO 9% 8% 9% 14% 20% 10% 6% 14% 10%
SI 8% 25% 18% 19% 0% 0% 0% 0% 12%
SK - - - - - - - - 14%
FI - - - - - - - - -
SE - - - - - - - - 19%
UK 24% 43% 46% 50% 17% 18% 0% 50% 35%
EU 14% 20% 28% 32% 29% 13% 8% 20% 21%
Source: CARE database, data available in May 2016
Table 6 shows the proportion of fatalities in junction accidents for different modes of transport by country. As expected, in most countries this percentage is highest for vulnerable road users.
In the EU, the percentage of junction fatalities by mode of transport is highest for pedal
cyclists and powered two-wheelers.

Traffic Safety Basic Facts 2016 - Junctions
- 13 -
Area and road type
Figure 6 shows the distribution of junction fatalities by type of road; the percentages for each type of road vary widely among the countries.
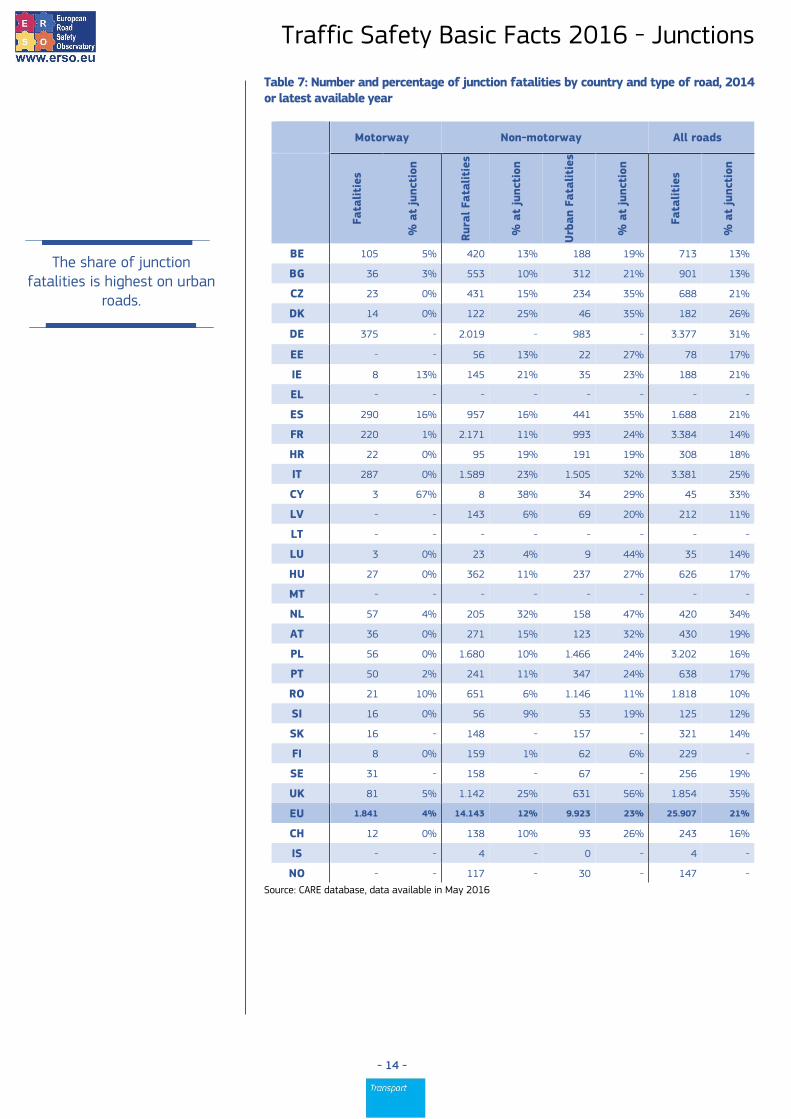
In contrast to the distribution of junction fatalities across the different types of road in Figure 6, in Table 7 the proportion of fatalities occurring at junctions is given for each type of road, which on EU average is highest for urban roads.
In 2014, the reporting of junction accidents by type of road was relatively good for only 21 EU countries.
Figure 6: Distribution of road fatalities by country, “junction” and road type, 2014 or latest available year
Source: CARE database, data available in May 2016
The share of urban junction fatalities of all road fatalities
varies from less than 5 to over 20% among the
countries.
Traffic Safety Basic Facts 2016 - Junctions
- 14 -
Table 7: Number and percentage of junction fatalities by country and type of road, 2014 or latest available year
Motorway Non-motorway All roads
Fata
liti
es
% a
t ju
nct
ion
Rura
l Fata
liti
es
% a
t ju
nct
ion
Urb
an F
ata
liti
es
% a
t ju
nct
ion
Fata
liti
es
% a
t ju
nct
ion
BE 105 5% 420 13% 188 19% 713 13%
BG 36 3% 553 10% 312 21% 901 13%
CZ 23 0% 431 15% 234 35% 688 21%
DK 14 0% 122 25% 46 35% 182 26%
DE 375 - 2.019 - 983 - 3.377 31%
EE - - 56 13% 22 27% 78 17%
IE 8 13% 145 21% 35 23% 188 21%
EL - - - - - - - -
ES 290 16% 957 16% 441 35% 1.688 21%
FR 220 1% 2.171 11% 993 24% 3.384 14%
HR 22 0% 95 19% 191 19% 308 18%
IT 287 0% 1.589 23% 1.505 32% 3.381 25%
CY 3 67% 8 38% 34 29% 45 33%
LV - - 143 6% 69 20% 212 11%
LT - - - - - - - -
LU 3 0% 23 4% 9 44% 35 14%
HU 27 0% 362 11% 237 27% 626 17%
MT - - - - - - - -
NL 57 4% 205 32% 158 47% 420 34%
AT 36 0% 271 15% 123 32% 430 19%
PL 56 0% 1.680 10% 1.466 24% 3.202 16%
PT 50 2% 241 11% 347 24% 638 17%
RO 21 10% 651 6% 1.146 11% 1.818 10%
SI 16 0% 56 9% 53 19% 125 12%
SK 16 - 148 - 157 - 321 14%
FI 8 0% 159 1% 62 6% 229 -
SE 31 - 158 - 67 - 256 19%
UK 81 5% 1.142 25% 631 56% 1.854 35%
EU 1.841 4% 14.143 12% 9.923 23% 25.907 21%
CH 12 0% 138 10% 93 26% 243 16%
IS - - 4 - 0 - 4 -
NO - - 117 - 30 - 147 -
Source: CARE database, data available in May 2016
The share of junction fatalities is highest on urban
roads.

Traffic Safety Basic Facts 2016 - Junctions
- 15 -
Type of Junction
Several types of junction are recorded in the CARE data, and Table 8 shows the data for years 2014. Junction type is not available for several countries, and there are wide variations among the others.
Table 8: Total number and distribution of junction fatalities by country and “junction”, 2014 or latest available year
At junction
Not at junction
Unknown Total
At
level
cross
ing
At
gra
de -
cr
oss
road
At
gra
de -
m
ult
iple
junct
ion
At
gra
de -
ro
undabout
At
gra
de -
T o
r st
aggere
d
junct
ion
Not
at
gra
de
(inte
rchange)
At
junct
ion -
oth
er
BE 1% 0% 0% 1% 0% 0% 12% 79% 8% 727
BG 0% 11% 0% 0% 0% 2% 0% 87% 0% 901
CZ 4% 7% 0% 0% 10% 0% 0% 79% 0% 688
DK 0% 14% 0% 0% 9% 0% 3% 74% 0% 182
DE - - - - - - - 77% 23% 3.377
EE 6% 0% 0% 0% 8% 0% 3% 83% 0% 78
IE 0% 9% 0% 1% 11% 0% 0% 0% 79% 188
EL - - - - - - - 93% 7% 795
ES 0% 7% 0% 3% 8% 0% 3% 79% 0% 1.688
FR 0% 6% 0% 2% 4% 0% 2% 86% 0% 3.384
HR 1% 5% 0% 1% 10% 0% 0% 81% 1% 308
IT 0% 9% 0% 2% 14% 0% 0% 75% 0% 3.381
CY 0% 7% 0% 7% 18% 0% 2% 67% 0% 45
LV 0% 0% 0% 0% 0% 0% 11% 89% 0% 212
LT - - - - - - - 83% 17% 267
LU 0% 6% 0% 3% 6% 0% 0% 86% 0% 35
HU 0% 8% 0% 0% 8% 0% 0% 83% 0% 626
MT - - - - - - - - 100% 13
NL 1% 31% 0% 1% 0% 0% 0% 66% 0% 476
AT 3% 12% 0% 0% 2% 0% 2% 81% 0% 430
PL 0% 0% 0% 0% 0% 0% 16% 84% 0% 3.202
PT 0% 4% 0% 2% 9% 2% 0% 82% 1% 638
RO 1% 9% 0% 0% 0% 0% 0% 90% 0% 1.818
SI 0% 6% 0% 0% 0% 0% 6% 88% 0% 125
SK - - - - - - - - 100% 321
FI 2% 0% 0% 0% 0% 0% 0% 85% 13% 229
SE - - - - - - - - 100% 270
UK 0% 5% 0% 2% 21% 0% 6% 65% 0% 1.854
EU 0% 5% 0% 1% 5% 0% 3% 78% 7% 26.258
IS 0% 0% 0% 0% 0% 0% 0% 100% 0% 4
LI - - - - - - - - 100% 2
NO - - - - - - - - 100% 147
CH 0% 7% 0% 0% 9% 0% 0% 0% 84% 243
Source: CARE database, data available in May 2016
Most fatal accidents at junctions occurred at “at
grade – crossroad” and “at grade - T or staggered
junction” type of junctions.

Traffic Safety Basic Facts 2016 - Junctions
- 16 -
Day of week and Time of day
Figure 7 shows the distribution of fatalities in junction accidents by hour of day in the EU countries, and compares this with the distribution of fatalities in non-junction accidents. This comparison shows that proportionately fewer people died at junctions during the night (8pm-7am) and proportionately more during the day (8am-6pm).
Figure 7: Distribution of road fatalities by “junction” and time of the day, EU, 2014
Source: CARE database, data available in May 2016
Figure 8: Distribution of road fatalities by “junction” and day of the week, EU, 2014
Source: CARE database, data available in May 2016
Proportionately more junction fatalities occur during day time
traffic than away from junctions, and proportionately fewer during
night time traffic.
By comparison with non-junction accidents, relatively few people
died at junctions during weekends.

Traffic Safety Basic Facts 2016 - Junctions
- 17 -
Figure 8 shows the distribution of fatalities in junction and non-junction accidents in 2014 by day of the week in the EU. By comparison with non-junction accidents, relatively few people died at junctions during weekends and relatively many on weekdays (Monday -Friday).
Seasonality
Figure 9 shows the distribution of fatalities in junction and non-junction accidents in 2014 through the year in the EU. The two distributions are similar, but there were relatively many fatalities in junction accidents in March and June, and relatively few in October and November.
Figure 9: Distribution of road fatalities by “junction” and month, EU, 2014
Source: CARE database, data available in May 2016
No marked difference was found between the
distributions of junction and non-junction fatalities by seasonality (month of the
year).
Traffic Safety Basic Facts 2016 - Junctions
- 18 -
Weather and lighting conditions
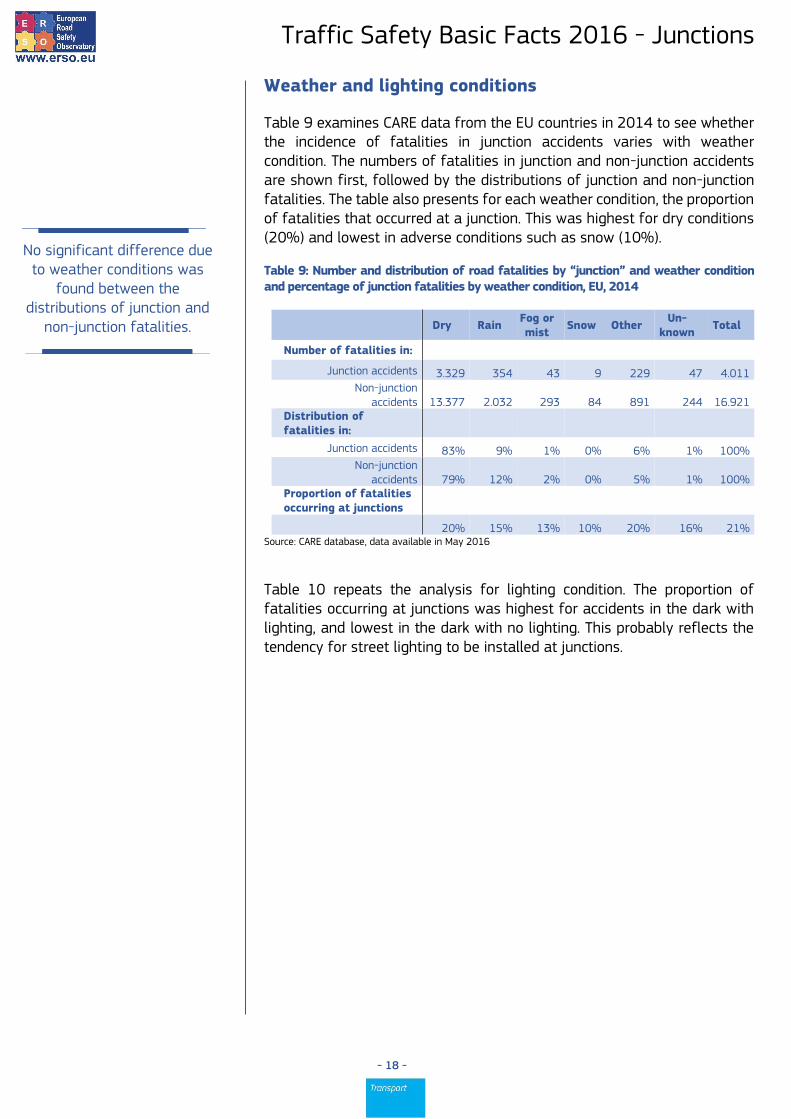
Table 9 examines CARE data from the EU countries in 2014 to see whether the incidence of fatalities in junction accidents varies with weather condition. The numbers of fatalities in junction and non-junction accidents are shown first, followed by the distributions of junction and non-junction fatalities. The table also presents for each weather condition, the proportion of fatalities that occurred at a junction. This was highest for dry conditions (20%) and lowest in adverse conditions such as snow (10%).
Table 9: Number and distribution of road fatalities by “junction” and weather condition and percentage of junction fatalities by weather condition, EU, 2014
Dry Rain
Fog or mist
Snow Other Un-
known Total
Number of fatalities in:
Junction accidents 3.329 354 43 9 229 47 4.011 Non-junction
accidents 13.377 2.032 293 84 891 244 16.921 Distribution of fatalities in:
Junction accidents 83% 9% 1% 0% 6% 1% 100% Non-junction
accidents 79% 12% 2% 0% 5% 1% 100% Proportion of fatalities occurring at junctions
20% 15% 13% 10% 20% 16% 21% Source: CARE database, data available in May 2016
Table 10 repeats the analysis for lighting condition. The proportion of fatalities occurring at junctions was highest for accidents in the dark with lighting, and lowest in the dark with no lighting. This probably reflects the tendency for street lighting to be installed at junctions.
No significant difference due to weather conditions was
found between the distributions of junction and
non-junction fatalities.

Traffic Safety Basic Facts 2016 - Junctions
- 19 -
Table 10: Number and distribution of road fatalities by “junction” and lighting condition and percentage of junction fatalities by lighting condition, EU, 2014
Darkness, no lights
Darkness, with lights
Daylight or twilight
Un- known
Total
Number of fatalities in:
Junction accidents 381 559 2.116 1.013 4.069
Non-junction accidents
3.358 1.807 8.686 3.070 16.921
Distribution of fatalities in:
Junction accidents 9% 14% 52% 25% 100%
Non-junction accidents
20% 11% 51% 18% 100%
Proportion of fatalities occurring at junctions
10% 24% 20% 25% 21%
Source: CARE database, data available in May 2016
In regard to lighting conditions the proportion of fatalities occurring at junctions was highest for accidents in the
dark with lighting.
Traffic Safety Basic Facts 2016 - Junctions
- 20 -
Accident Causation
During the EC SafetyNet project, in-depth data were collected using a common methodology for samples of accidents that occurred in Germany, Italy, the Netherlands, Finland, Sweden and the UK12.The SafetyNet Accident Causation Database was formed between 2005 and 2008, and contains details of 1.006 accidents covering all injury severities. A detailed process for recording causation (SafetyNet Accident Causation System – SNACS) attributes one specific critical event to each driver, rider or pedestrian. Links then form chains between the critical event and the causes that led to it. For example, the critical event of late action could be linked to the cause observation missed, which was a consequence of fatigue, itself a consequence of an extensive driving spell.
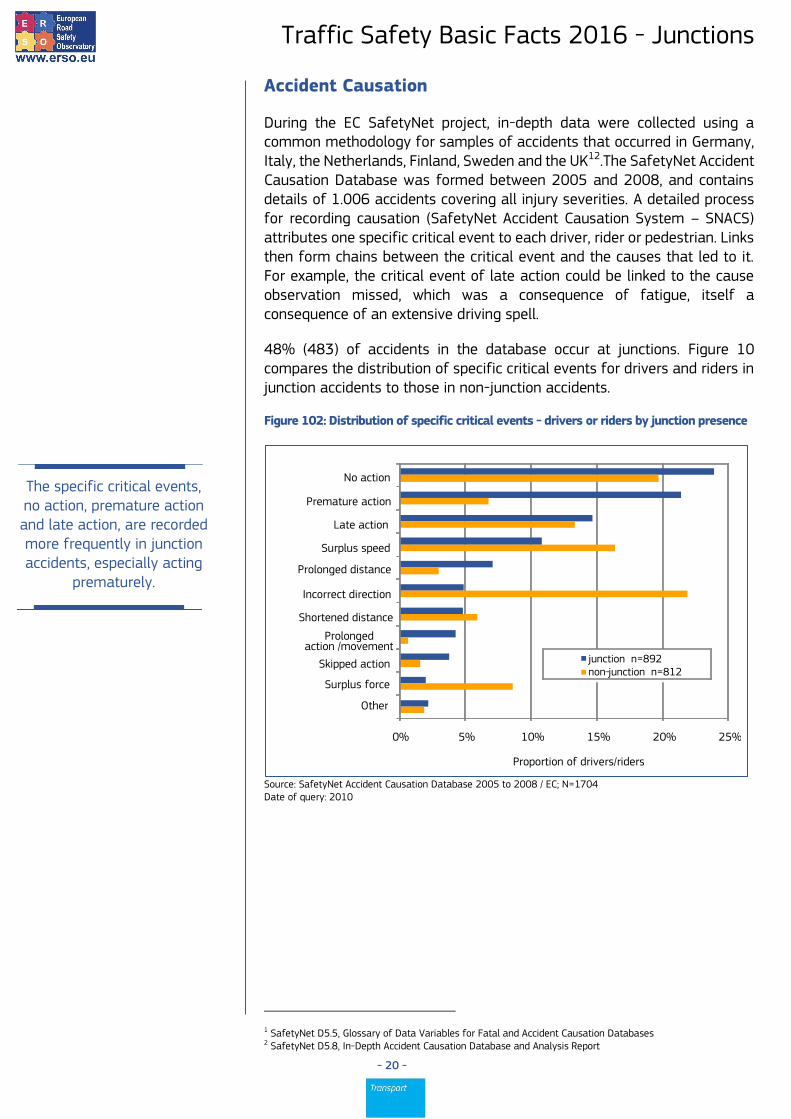
48% (483) of accidents in the database occur at junctions. Figure 10 compares the distribution of specific critical events for drivers and riders in junction accidents to those in non-junction accidents.
Figure 102: Distribution of specific critical events - drivers or riders by junction presence
Source: SafetyNet Accident Causation Database 2005 to 2008 / EC; N=1704 Date of query: 2010
1 SafetyNet D5.5, Glossary of Data Variables for Fatal and Accident Causation Databases 2 SafetyNet D5.8, In-Depth Accident Causation Database and Analysis Report
0% 5% 10% 15% 20% 25%
No action
Premature action
Late action
Surplus speed
Prolonged distance
Incorrect direction
Shortened distance
Prolonged action /movement
Skipped action
Surplus force
Other
Proportion of drivers/riders
junction n=892 non - junction n=812
The specific critical events, no action, premature action and late action, are recorded more frequently in junction accidents, especially acting
prematurely.

Traffic Safety Basic Facts 2016 - Junctions
- 21 -
The distributions are quite different for the most often recorded specific critical events. The specific critical events under the general category of ‘timing’, no action, premature action and late action, are recorded more frequently in junction accidents, especially acting prematurely. A premature action is one undertaken before a signal has been given or the required conditions are established, for example entering a junction before it is clear of other traffic.
On the other hand, incorrect direction, surplus speed and surplus force are recorded more frequently in non-junction accidents. Surplus speed describes speed that is too high for the conditions or manoeuvre being carried out, travelling above the speed limit and also if the driver is travelling at a speed unexpected by other road users. Similarly, surplus force describes excess acceleration or braking for conditions or actions. Incorrect direction refers to a manoeuvre being carried out in the wrong direction (for example, turning left instead of right) or leaving the road (not following the intended direction of the road). Here it is likely that the wrong direction element will appear in junction accidents and the leaving road element in non-junction accidents.
Table 11 shows the most frequent links recorded between causes for drivers and riders in junction accidents. There are 1.001 such links in total for this group
Table 11: Ten most frequent links between causes - drivers/riders, junction accidents
Links between causes Frequency
Faulty diagnosis - Information failure (between driver and traffic environment or driver and vehicle)
158
Observation missed - Temporary obstruction to view 92
Observation missed - Permanent obstruction to view 76
Observation missed - Faulty diagnosis 73
Observation missed - Distraction 62
Observation missed - Inadequate plan 55
Faulty diagnosis - Communication failure 55
Inadequate plan - Insufficient knowledge 53
Observation missed - Inattention 44
Observation missed - Permanent sight obstruction 24
Others 309
Total 1.001
Source: SafetyNet Accident Causation Database 2005 to 2008 / EC Date of query: 2010
16% of the links between causes are observed to be between ‘faulty diagnosis’ and ‘information failure’.
Traffic Safety Basic Facts 2016 - Junctions
- 22 -
Observation missed is recorded most frequently and the causes leading to that can be seen to fall into two groups, physical ‘obstruction to view’ type causes (for example, parked cars at a junction) and human factors (for example, not observing a red light due to distraction or inattention). Following observation missed, faulty diagnosis is an incorrect or incomplete understanding of road conditions or another road user’s actions. It is linked to both information failure (for example, a driver/rider thinking another vehicle was moving when it was in fact stopped and colliding with it) and communication failure (for example, pulling out in the continuing path of a driver who has indicated for a turn too early).
Inadequate plan (a lack of all the required details or that the road user’s ideas do not correspond to reality) is seen to lead to observation missed and be a result of insufficient knowledge.

Traffic Safety Basic Facts 2016 - Junctions
- 23 -
Notes
1. Country abbreviations
Belgium BE Italy IT Romania RO
Bulgaria BG Cyprus CY Slovenia SI
Czech Republic CZ Latvia LV Slovakia SK
Denmark DK Lithuania LT Finland FI
Germany DE Luxembourg LU Sweden SE
Estonia EE Hungary HU United Kingdom UK
Ireland IE Malta MT
Greece EL Netherlands NL Iceland IS
Spain ES Austria AT Liechtenstein LI
France FR Poland PL Norway NO
Croatia HR Portugal PT Switzerland CH
2. Sources: CARE (Community database on road accidents) The full glossary of definitions of variables used in this Report is available at: http://ec.europa.eu/transport/road_safety/pdf/statistics/cadas_glossary.pdf 3. Data available in May 2016. 4. Data refer to 2014 and when not available the latest available data are used (2009 data for BG, 2010 data for SE and SK, 2011 for Germany and 2013 data for IE and SI). Totals and related average percentages for EU also include latest available data. 5. Data from Greece, Lithuania and Malta not included in the totals. 6. At the commenting of the tables and figures, countries with small figures are omitted. 7. This 2016 edition of Traffic Safety Basic Facts updates the previous versions produced within the EU co-funded research projects SafetyNet and DaCoTA. 8. Disclaimer This report has been produced by the National Technical University of Athens (NTUA), the Austrian Road Safety Board (KFV) and the European Union Road Federation (ERF) under a contract with the European Commission. Whilst every effort has been made to ensure that the matter presented in this report is relevant, accurate and up-to-date, the Partners cannot accept any liability for any error or omission, or reliance on part or all of the content in another context. Any information and views set out in this report are those of the author(s) and do not necessarily reflect the official opinion of the Commission. The Commission does not guarantee the accuracy of the data included in this study. Neither the Commission nor any person acting on the Commission’s behalf may be held responsible for the use that may be made of the information contained therein. 9. Please refer to this Report as follows: European Commission, Traffic Safety Basic Facts on Junctions, European Commission, Directorate General for Transport, June 2016.
