jun zhang, phd, md nih public access 1 helain j. landy,...
TRANSCRIPT
Contemporary Patterns of Spontaneous Labor With NormalNeonatal Outcomes
Jun Zhang, PhD, MD1, Helain J. Landy, MD2, D. Ware Branch, MD3, Ronald Burkman, MD4,Shoshana Haberman, MD, PhD5, Kimberly D. Gregory, MD, MPH6, Christos G. Hatjis, MD7,Mildred M. Ramirez, MD8, Jennifer L. Bailit, MD, MPH9, Victor H. Gonzalez-Quintero, MD,MPH10, Judith U. Hibbard, MD11, Matthew K. Hoffman, MD, MPH12, Michelle Kominiarek,MD13, Lee A. Learman, MD, PhD13, Paul Van Veldhuisen, PhD14, James Troendle, PhD1,and Uma M. Reddy, MD, MPH1 for the Consortium on Safe Labor1Eunice Kennedy Shriver National Institute of Child Health and Human Development, NationalInstitutes of Health, Bethesda, MD2Georgetown University Hospital, MedStar Health, Washington, DC3Intermountain HealthCare and University of Utah, Salt Lake City, UT4Baystate Medical Center, Springfield, MA5Maimonides Medical Center, Brooklyn, NY6Cedars-Sinai Medical Center, Los Angeles, CA7Summa Health System, Akron City Hospital, Akron, OH8University of Texas Health Science Center at Houston, Houston, TX9MetroHealth Medical Center, Cleveland, OH10University of Miami, Miami, FL11University of Illinois at Chicago, Chicago, IL12Christiana Care Health System, Wilmington, DE13Indiana University – Clarian Health, Indianapolis, IN14The EMMES Corporation, Rockville MD
AbstractObjective—To use contemporary labor data to examine the labor patterns in a large, modernobstetric population in the United States.
Methods—Data were from the Consortium on Safe Labor, a multicenter retrospective study thatabstracted detailed labor and delivery information from electronic medical records in 19 hospitalsacross the United States. A total of 62,415 parturients were selected who had a singleton termgestation, spontaneous onset of labor, vertex presentation, vaginal delivery, and a normal perinataloutcome. A repeated-measures analysis was used to construct average labor curves by parity. Aninterval-censored regression was used to estimate duration of labor stratified by cervical dilation atadmission and centimeter by centimeter.
Corresponding author: Dr. Jun Zhang, Epidemiology Branch, NICHD, National Institutes of Health, Building 6100, Room 7B03,Bethesda, MD 20892, Tel: 301-435-6921, [email protected].
Presented in part at the Society for Maternal-fetal Medicine 29th Annual Scientific meeting, San Diego, California, January 26-31,2009.
NIH Public AccessAuthor ManuscriptObstet Gynecol. Author manuscript; available in PMC 2013 May 21.
Published in final edited form as:Obstet Gynecol. 2010 December ; 116(6): 1281–1287. doi:10.1097/AOG.0b013e3181fdef6e.
NIH
-PA Author Manuscript
NIH
-PA Author Manuscript
NIH
-PA Author Manuscript
Results—Labor may take over 6 hours to progress from 4 to 5 cm and over 3 hours to progressfrom 5 to 6 cm of dilation. Nulliparas and multiparas appeared to progress at a similar pace before6 cm. However, after 6 cm labor accelerated much faster in multiparas than in nulliparas. The 95th
percentile of the 2nd stage of labor in nulliparas with and without epidural analgesia was 3.6 and2.8 hours, respectively. A partogram for nulliparas is proposed.
Conclusion—In a large, contemporary population, the rate of cervical dilation accelerated after6 cm and progress from 4 to 6 cm was far slower than previously described. Allowing labor tocontinue for a longer period before 6 cm of cervical dilation may reduce the rate of intrapartumand subsequent repeat cesarean deliveries in the United States.
IntroductionDefining normal and abnormal labor progression has been a long-standing challenge. In hislandmark publications, Friedman was the first to depict a labor curve and divide the laborprocess into several stages and phases.1,2 Abnormal labor progression in the active phasewas defined as cervical dilation < 1.2 cm/hour in nulliparas and < 1.5 cm/hour in multiparas.No appreciable change in cervical dilation in the presence of adequate uterine contraction >2 hours was considered as labor arrest.3 These concepts have come to govern labormanagement.
However, these criteria created 50 years ago may no longer be applicable to contemporaryobstetric populations and for current obstetric management.4 Increasing maternal age andmaternal and fetal body sizes have made labor a more challenging process. Moreover,frequent obstetric interventions (induction, epidural analgesia and oxytocin use) may havealtered the natural labor process. The purpose of this study was to use contemporary labordata in a large number of parturients with spontaneous onset of labor to examine the laborpatterns and estimate duration of labor in the United States.
Materials and MethodsWe used data from the Consortium on Safe Labor, a multicenter retrospective observationalstudy that abstracted detailed labor and delivery information from electronic medical recordsin 12 clinical centers (with 19 hospitals) across 9 American College of Obstetricians andGynecologists (ACOG) U.S. districts from 2002 to 2008. 87% of births occurred in 2005 –2007. Detailed description of the study was provided elsewhere.5 Briefly, participatinginstitutions extracted detailed information on maternal demographic characteristics, medicalhistory, reproductive and prenatal history, labor and delivery summary, postpartum andnewborn information. Information from the neonatal intensive care unit (NICU) was linkedto the newborn records. Data on labor progression (repeated, time-stamped cervical dilation,station and effacement) were extracted from the electronic labor database. To make ourstudy population reflect the overall U.S. obstetric population and to minimize the impact ofthe various number of births from different institutions, we assigned a weight to each subjectbased on ACOG district, maternal race/ethnicity (non-Hispanic white, non-Hispanic black,Hispanic and others), parity (nulliparas vs. multiparas) and plurality (singleton vs. multiplegestation). We first calculated the probability of each delivery with these four factorsaccording to the 2004 National Natality data. Then, based on the number of subjects eachhospital contributed to the database, we assigned a weight to each subject .5 We applied theweight to the current analysis. This project was approved by the Institutional Review Boardsof all participating institutions.
There were a total of 228,668 deliveries in the database. A total of 62,415 parturients wereselected. Figure 1 depicts the sample selection process for the current analysis. Women weregrouped by parity (0, 1, 2+). We used a repeated-measures analysis with 8th degree
Zhang et al. Page 2
Obstet Gynecol. Author manuscript; available in PMC 2013 May 21.
NIH
-PA Author Manuscript
NIH
-PA Author Manuscript
NIH
-PA Author Manuscript
polynomial model to construct average labor curves by parity.6 In this analysis, the startingpoint was set at the first time when the dilation reached 10 cm (time = 0) and the time wascalculated backwards (e.g., 60 minutes before the complete dilation, -60 minutes). After thelabor curve models had been computed, the x-axis (time) was reverted to a positive value,i.e., instead of being -12 → 0 hours, it became 0 → 12 hours.
To estimate duration of labor, we used an interval-censored regression7 to estimate thedistribution of times for progression from one integer centimeter of dilation to the next(called “traverse time”) with an assumption that the labor data are log-normally distributed.8
The median and 95th percentiles were calculated. Because multiparous women tended to beadmitted at a more advanced stage labor than nulliparous women, many multiparous womendid not have information on cervical dilation prior to 4 cm. Therefore, the labor curve formultiparous women started at 5 cm rather than at 4 cm as for nulliparous women.
Finally, to address the clinical experience wherein a woman is first observed at a givendilation and then measured periodically, we calculated cumulative duration of labor fromadmission to any given dilation up to the first 10 cm in nulliparas. The same intervalcensored regression approach was used. We provide the estimates according to the dilationat admission (2.0 or 2.5 cm, 3.0 or 3.5 cm, 4.0 or 4.5 cm, 5.0 or 5.5 cm) because womenadmitted at different dilation levels may have different patterns of labor progression. Wethen plotted the 95th percentiles of the duration of labor from admission as a partogram. Allstatistical analyses were performed using SAS version 9.1 (PROC MIXED for the repeated-measures analysis and PROC LIFEREG for interval censored regression). Since theobjective of this paper is to describe labor patterns and estimate duration of labor withoutcomparing among various groups, no statistical tests were performed.
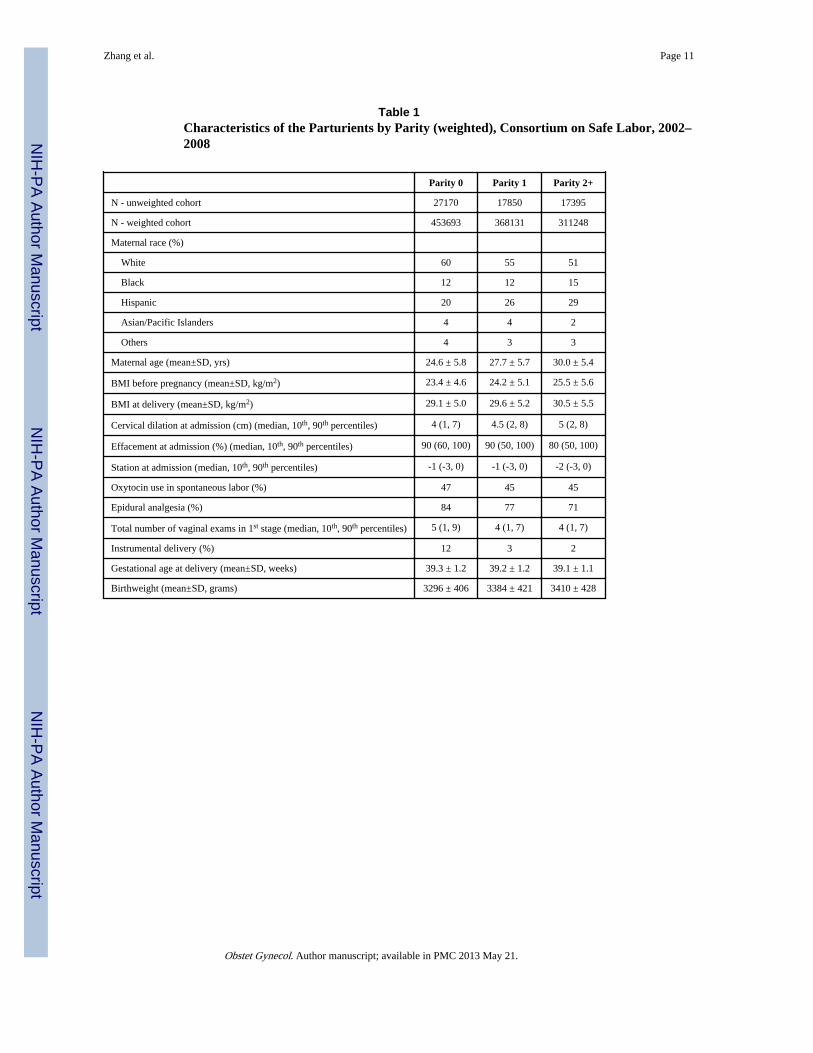
ResultsTable 1 presents the baseline characteristics of women by parity. With increasing parity,both maternal age and body mass increased. The median cervical dilation at admission was 4cm, 4.5 cm and 5 cm for parity 0, 1 and 2+, respectively, while the median effacement was90%, 90% and 80%, respectively. Oxytocin for augmentation was used in nearly half of thewomen. Approximately 80% of women used epidural analgesia for labor pain. The mediannumber of vaginal exams from admission to the first 10 cm was 5 for nulliparas and 4 formultiparas. The vast majority of women had a spontaneous vaginal delivery.
Figure 2 depicts the labor curves for various parities. In multiparas, labor appears toaccelerate after 6 cm of cervical dilation. Parity 2+ entered the active phase earlier thanParity 1. In contrast, the average labor curve for nulliparas did not show a clear inflectionpoint.
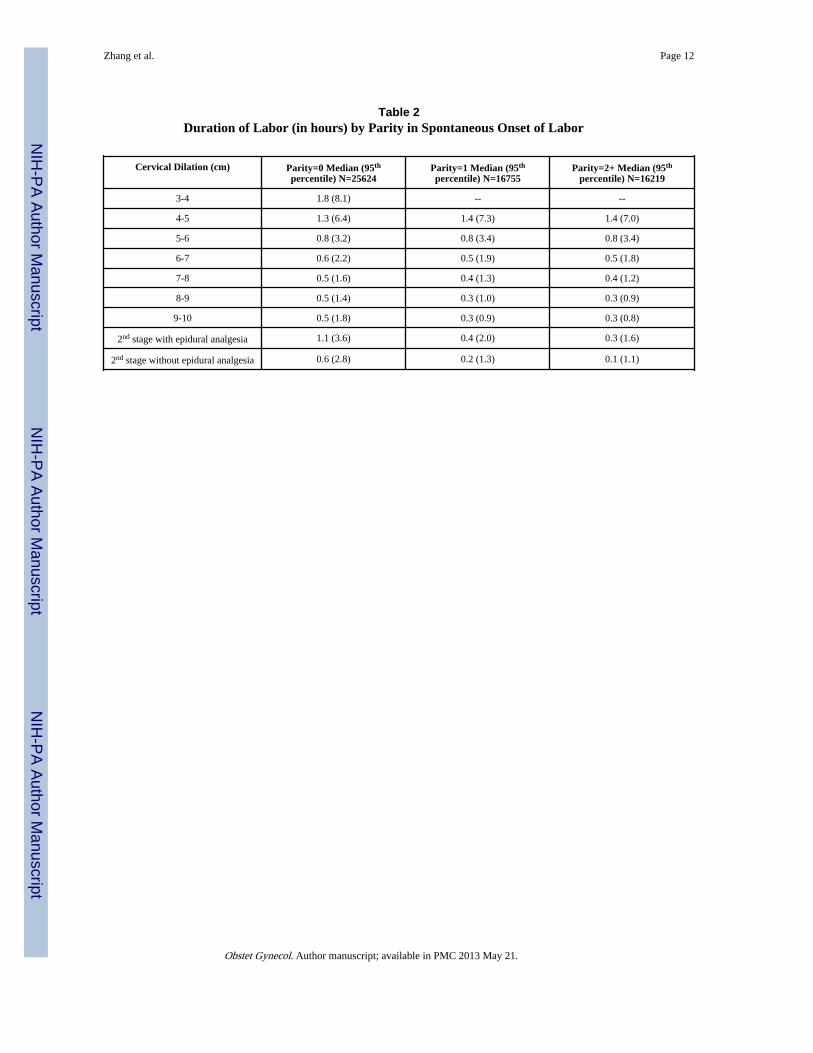
Table 2 shows the duration of labor from one centimeter of dilation to the next. The 95th
percentiles indicate that at 4 cm, it could take more than 6 hours to progress to 5 cm, whileat 5 cm, it may take more than 3 hours to progress to 6 cm. Surprisingly, the medians and95th percentiles of duration of labor before 6 cm were similar between nulliparas andmultiparas. Only after 6 cm did multiparas show faster labor than nulliparas, which isconsistent with the labor curves. This table also suggests that at 6 cm or later, almost allwomen who had vaginal delivery and normal neonatal outcomes had a 95th percentile of 1st
stage of labor of less than 2 hours, particularly in multiparas. In the 2nd stage of labor, the95th percentiles for nulliparas with and without epidural analgesia were 3.6 hours and 2.8hours, respectively. The duration of the 2nd stage was much shorter in multiparas.
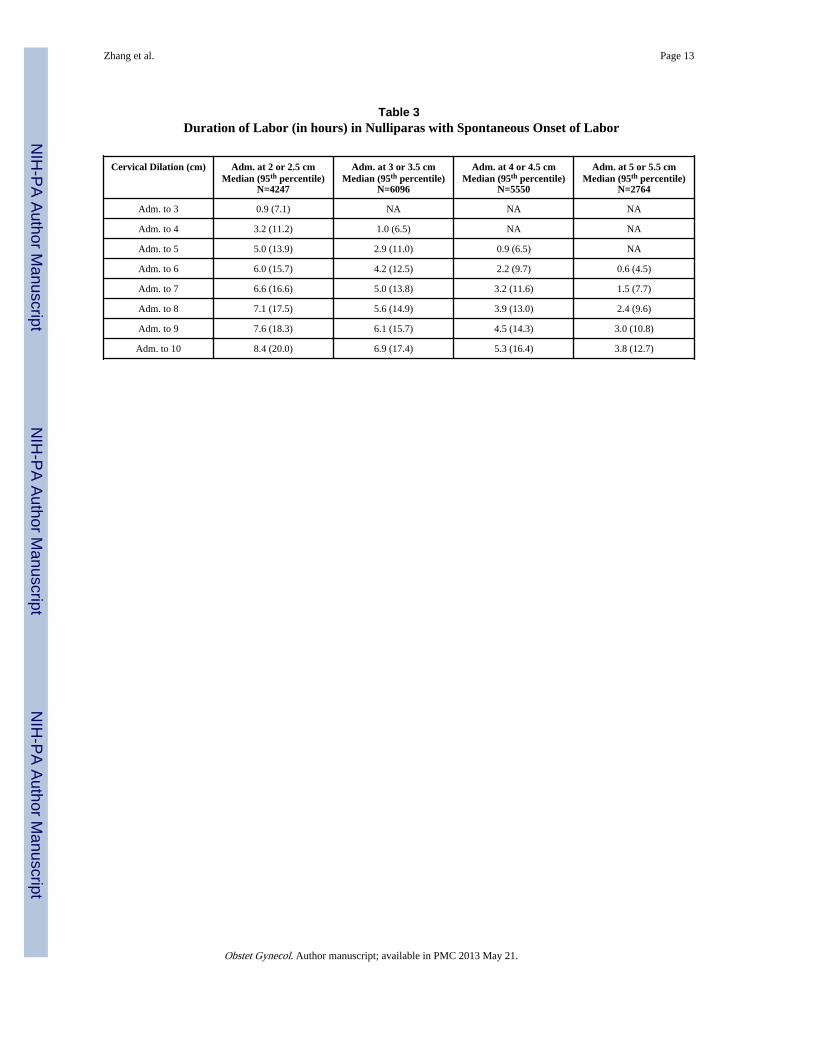
We then calculated cumulative duration of labor from admission to the first 10 cm innulliparas. Table 3 presents the median and 95th percentile of duration of the 1st stage of
Zhang et al. Page 3
Obstet Gynecol. Author manuscript; available in PMC 2013 May 21.
NIH
-PA Author Manuscript
NIH
-PA Author Manuscript
NIH
-PA Author Manuscript
labor. The 95th percentiles are also plotted as connected stair case lines in Figure 3. Eachspecific dilation at admission (2, 3, 4 or 5 cm) has its own corresponding line. At any time inthe 1st stage, if a woman's labor crosses her corresponding 95th limit to the right side of thecurve, her labor may be considered as protracted. Figure 4 illustrates 3 cases. Each letterrepresents a pelvic exam for the corresponding patient. Patient A was admitted at 2 cm. Herlabor progressed to 10 cm without crossing the corresponding 95th percentile boundary.Patient B was admitted at 4 cm. Her labor progressed to 6 cm then stopped despite oxytocinaugmentation. After 10 hours from admission, she passed the 95th percentile and may beconsidered as labor arrest. Patient C was admitted at 5 cm. She reached 9 cm after 13 hoursbut passed the 95th percentile.
DiscussionThe definitions of “normal labor” and “labor arrest” have profound effects on labormanagement and cesarean delivery rate. Our study used data from a large number ofcontemporary parturients across the U.S. who had a singleton term pregnancy withspontaneous onset of labor, a vertex fetal presentation, vaginal delivery and normal neonataloutcomes. We found that labor may take over 6 hours to progress from 4 to 5 cm and over 3hours to progress from 5 to 6 cm of dilation. Nulliparas and multiparas appeared to progressat a similar pace before 6 cm. However, after 6 cm labor accelerated much faster inmultiparas than nulliparas. The 95th percentile of the 2nd stage of labor in nulliparas withand without epidural analgesia was 3.6 and 2.8 hours, respectively. Utilizing data from thisstudy, we produced a partogram for contemporary nulliparas.
Labor curves and normal values in labor progression are still largely based on the work byDr. Emanuel Friedman several decades ago.2,3 However, our study with a contemporarypopulation observed several important differences from the classic Friedman curve.2 First,after having plotted a large number of labor curves, it became clear that there are asubstantial number of parturients who may not have a consistent pattern of the active phaseof labor, particularly in nulliparas. Labor may progress more gradually but still achievevaginal delivery.
Second, even in women who had an active phase characterized by precipitous cervicaldilation in the late 1st stage, the active phase often did not start until 6 cm or later. Thisseems to differ materially from prevailing concepts that the active phase starts before 4cm2,3 and that 4 cm is a commonly used milestone.9 Rouse et al.10,11 defined the activephase in induced labor as cervical dilation at 4 cm with ≥ 90% effacement or 5 cm dilationregardless of effacement. However, Peisner and Rosen12 found that among women who hadno active phase arrest, 50% of them entered active phase by 4 cm dilation; 74% by 5 cm and89% by 6 cm. These findings point to the importance of separating an average starting pointof active phase from a clinical diagnosis of labor arrest. Judging whether a woman is havinglabor protraction and arrest should not be based on a research definition of an averagestarting point or average duration of labor. Instead, an upper limit of what is considered“normal labor” should be used in patient management. As long as the labor is within anormal range and other maternal and fetal conditions are reassuring, a woman should beallowed to continue the labor process. Our study suggests that in the contemporarypopulation, 6 cm rather than 4 cm of cervical dilation may be a more appropriate landmarkfor the start of the active phase.
Finally, consistent with clinical experience, our data demonstrate that cervical dilation oftenaccelerates as labor advances. No appreciable change in dilation for 4 hours may be normalin early labor but probably too long after 6 cm (Table 2). This non-linear relationship shouldbe reflected in the definition of labor arrest.
Zhang et al. Page 4
Obstet Gynecol. Author manuscript; available in PMC 2013 May 21.
NIH
-PA Author Manuscript
NIH
-PA Author Manuscript
NIH
-PA Author Manuscript
For a more objective evaluation of labor protraction and arrest, a partogram may be a usefultool. Such a tool was originally utilized to prevent prolonged and obstructed labor indeveloping countries.13,14 The central feature of the partogram recommended by the WorldHealth Organization (WHO) consists of two straight diagonal, parallel lines based on thephase of maximum slope in the Friedman curve. The alert line starts at 4 cm of cervicaldilatation to the point of expected full dilatation at the rate of 1 cm per hour15, indicatingthat attention is needed if cervical dilation is slower than 1 cm per hour starting at 4 cm. Theaction line is parallel, and 4 hours to the right of the alert line. Several studies14-16, but notall17, have shown that the partogram reduces the risk of prolonged labor, cesarean sectionsand perinatal mortality in developing countries.
Our partogram differs from the one by WHO15 in that: (1) We do not consider the alert linenecessary in the U.S. since most women give birth in the hospital setting; (2) Our 95th
percentile lines, equivalent to the action line, are exponential-like stair lines rather thanstraight lines because cervical dilation is not recorded as a continuous measure. Theprogression patterns (exponential) are more consistent with the physiology of dilationacceleration in late 1st stage; and (3) Our partogram allows much slower labor progressionbefore 6 cm of dilation but much shorter duration than 4 hours after 6 cm. Finally, incontrast to the purpose of the WHO partogram, our partogram is intended to preventpremature cesarean delivery. Its validity and usefulness have yet to be confirmed.
The limitations of the current study are worth mentioning. First, defining “normal labor”remains a challenge. In order to best define this process, we, therefore, examined laborpatterns in women who had spontaneous onset of labor, vaginal delivery and normalneonatal outcomes. Second, given the very high frequency of obstetric intervention(induction and prelabor cesarean delivery) in contemporary practice, only a third of all birthsin our large population were comprised of women who were at term, had spontaneous onsetof labor and vaginal deliveries. Third, since intrapartum cesarean deliveries were performedaccording to the prevailing definition of labor arrest, some cesarean deliveries may beperformed too soon (before 6 cm), which can cause early censoring of observation. Thiscensoring may have resulted in a bias towards a shorter labor, particularly at the 95th
percentiles. Fourth, nearly half of the parturients included in our analysis were givenoxytocin for augmentation, which may have altered the natural labor progression. Thus,findings from our study must be interpreted within the context of current obstetric practice.Finally, we recognize that assessment of cervical dilation is inherently somewhat subjective.The inaccuracy of cervical dilation is likely caused by random error, which increasesstandard error but does not necessarily biases the point estimate. Given the large number ofsubjects in our study, our point estimates (the average labor curve, median and 95th
percentile) are stable.
The differences in study population and obstetric practice may partly explain why thecontemporary labor curves differ substantially from those from 50 years ago18, even thoughexactly the same statistical method was used. Women are older and heavier, factors knownto affect labor progress and duration. Labor appears to progress more slowly now thanbefore, even though more labors are being treated with oxytocin for augmentation. Thecurrent study observed that the inflection point between latent and active phases on the laborcurve emerges at a more advanced cervical dilation. For instance, the inflection point inmultiparas previously was described as occurring at 5 or 5.5 cm 50 years ago18 but our datashow that now it is at 6 or 6.5 cm. These findings indicate that the labor process incontemporary obstetric populations needs to be reevaluated and the definitions of “normal”and “abnormal” labor re-examined. Avoiding cesarean delivery before the active phase oflabor is established may reduce the rate of cesarean delivery (intrapartum and subsequentrepeat cesarean deliveries).
Zhang et al. Page 5
Obstet Gynecol. Author manuscript; available in PMC 2013 May 21.
NIH
-PA Author Manuscript
NIH
-PA Author Manuscript
NIH
-PA Author Manuscript
AcknowledgmentsFinancial support: The Consortium on Safe Labor was supported by the Intramural Research Program of the EuniceKennedy Shriver National Institute of Child Health and Human Development, National Institutes of Health, througha contract (Contract No. HHSN267200603425C).
References1. Friedman EA. The graphic analysis of labor. Am J Obstet Gynecol. 1954; 68:1568–75. [PubMed:
13207246]
2. Friedman EA. Primigravid labor: a graphicostatistical analysis. Obstet Gynecol. 1955; 6:567–89.[PubMed: 13272981]
3. Friedman, EA. Labor: Clinical Evaluation and Management. 2nd. New York: Appleton-Century-Crofts; 1978.
4. Zhang J, Troendle J, Yancey MK. Reassessing the labor curve in nulliparous women. Am J ObstetGynecol. 2002; 187:824–8. [PubMed: 12388957]
5. Zhang J, Troendle J, Reddy U, Laughon SK, Branch DW, Burkman R, Landy HJ, Hibbard JU,Haberman S, Ramirez MM, Bailit JL, Hoffman MK, Gregory KD, Gonzalez-Quintero VH,Kominiarek M, Learman LA, Hatjis CG, Van Veldhuisen P. Contemporary cesarean deliverypractice in the United States. Am J Obstet Gynecol (in press).
6. Crowder, KJ.; Hand, DJ. Analysis of Repeated Measures. New York: Chapman and Hall; 1990.
7. Klein, JP.; Moeschberger, ML. Survival Analysis: techniques for censored and truncated data.Berlin: Springer; 1997.
8. Vahratian A, Troendle JF, Siega-Riz AM, Zhang J. Methodological challenges in studying laborprogression. Paediatr Perinat Epidemiol. 2006; 20:72–8. [PubMed: 16420344]
9. Albers LL, Schiff M, Gorwoda JG. The length of active labor in normal pregnancies. ObstetGynecol. 1996; 87:355–9. [PubMed: 8598954]
10. Rouse DJ, Owen J, Hauth JC. Criteria for failed labor induction: prospective evaluation of astandardized protocol. Obstet Gynecol. 2000; 96:671–7. [PubMed: 11042299]
11. Lin MG, Rouse DJ. What is a failed labor induction? Clin Obstet Gynecol. 2006; 49:585–93. 20.[PubMed: 16885665]
12. Peisner DB, Rosen MG. Transition from latent to active labor. Obstet Gynecol. 1986; 68:448–51.[PubMed: 3748488]
13. Philpott RH, Castle WM. Cervicographs in the management of labour in primigravidae I: the alterline for detecting abnormal labour. J Obstet Gynaecol Br Common. 1972; 79:592–8.
14. Philpott RH, Castle WM. Cervicographs in the management of labour in primigravidae II: theaction line and treatment of abnormal labour. J Obstet Gynaecol Br Common. 1972; 79:599–602.
15. World Health Organization. World Health Organization partograph in management of labour.Lancet. 1994; 343(8910):1399–1404. [PubMed: 7910888]
16. Dujardin B, De Schampheleire I, Sene H, Ndiaye F. Value of the alert and action lines on thepartgram. Lancet. 1992; 339:1336–8. [PubMed: 1350000]
17. Lavender T, Hart A, Smyth RMD. Effect of partogram use on outcomes for women in spontaneouslabor at term. Cochroane Database of Systematic Reviews. 2008; (4) Art.No.:CD 005461.
18. Zhang J, Troendle J, Mikolajczyk R, Sundaram R, Beaver J, Fraser W. The natural history of thenormal 1st stage of labor. Obstet Gynecol. 2010; 115:705–10. [PubMed: 20308828]
Zhang et al. Page 6
Obstet Gynecol. Author manuscript; available in PMC 2013 May 21.
NIH
-PA Author Manuscript
NIH
-PA Author Manuscript
NIH
-PA Author Manuscript
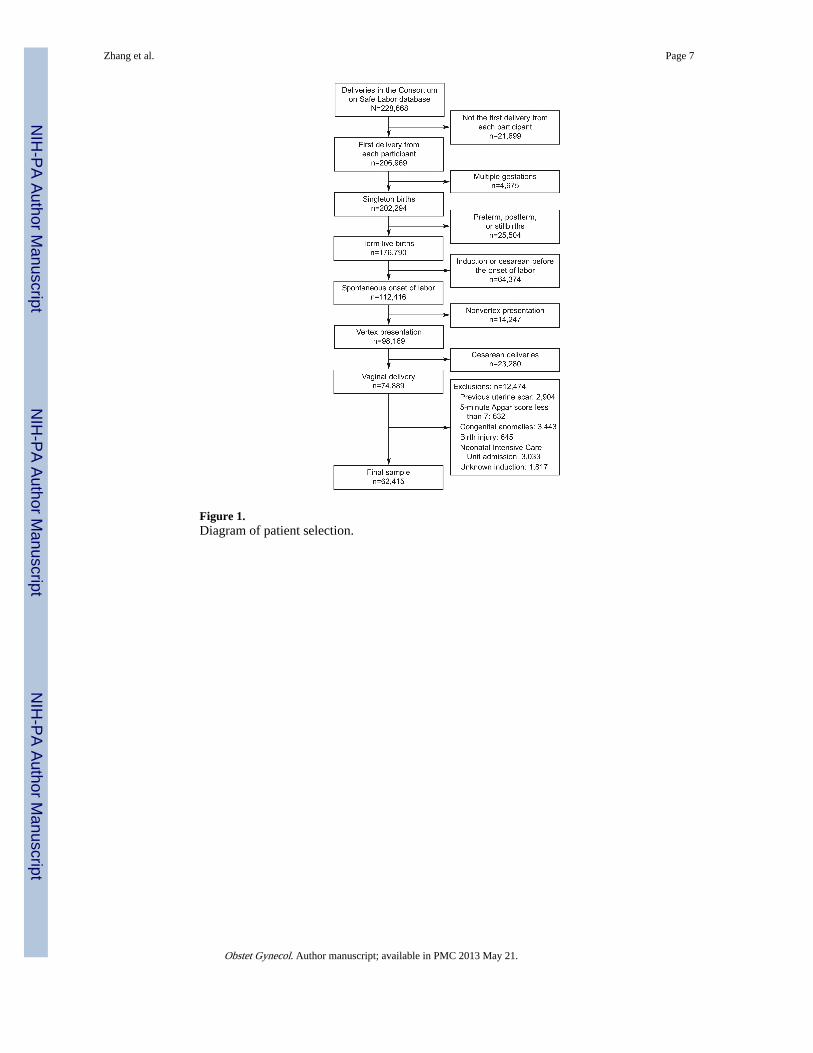
Figure 1.Diagram of patient selection.
Zhang et al. Page 7
Obstet Gynecol. Author manuscript; available in PMC 2013 May 21.
NIH
-PA Author Manuscript
NIH
-PA Author Manuscript
NIH
-PA Author Manuscript

Figure 2.Average labor curves by parity in singleton, term pregnancies with spontaneous onset oflabor, vaginal delivery and normal neonatal outcomes. P0: nulliparas; P1: women of parity1; P2+: women of parity 2 or higher.
Zhang et al. Page 8
Obstet Gynecol. Author manuscript; available in PMC 2013 May 21.
NIH
-PA Author Manuscript
NIH
-PA Author Manuscript
NIH
-PA Author Manuscript
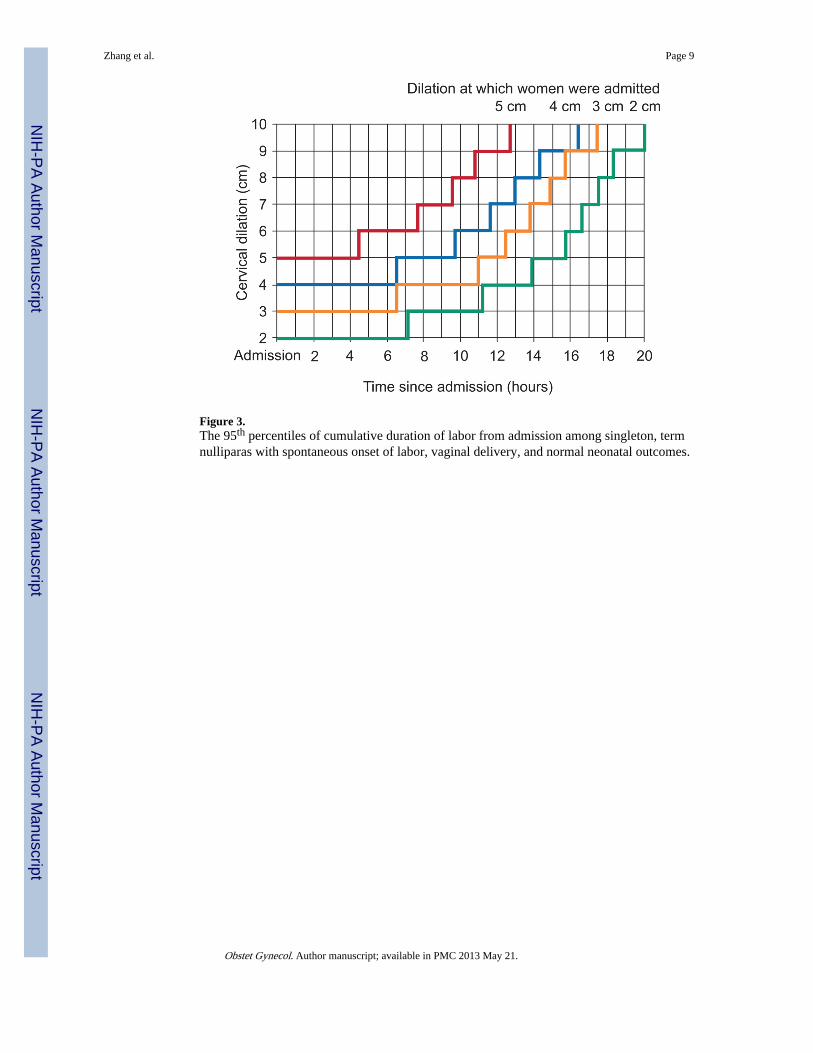
Figure 3.The 95th percentiles of cumulative duration of labor from admission among singleton, termnulliparas with spontaneous onset of labor, vaginal delivery, and normal neonatal outcomes.
Zhang et al. Page 9
Obstet Gynecol. Author manuscript; available in PMC 2013 May 21.
NIH
-PA Author Manuscript
NIH
-PA Author Manuscript
NIH
-PA Author Manuscript
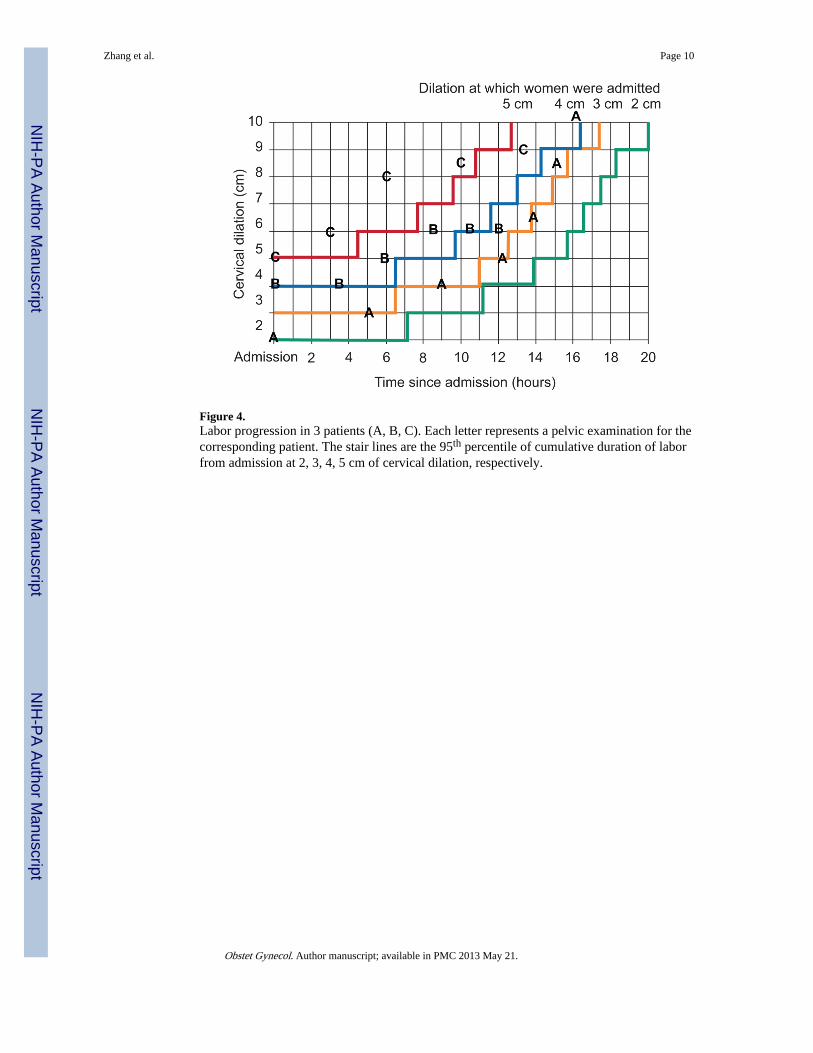
Figure 4.Labor progression in 3 patients (A, B, C). Each letter represents a pelvic examination for thecorresponding patient. The stair lines are the 95th percentile of cumulative duration of laborfrom admission at 2, 3, 4, 5 cm of cervical dilation, respectively.
Zhang et al. Page 10
Obstet Gynecol. Author manuscript; available in PMC 2013 May 21.
NIH
-PA Author Manuscript
NIH
-PA Author Manuscript
NIH
-PA Author Manuscript
NIH
-PA Author Manuscript
NIH
-PA Author Manuscript
NIH
-PA Author Manuscript
Zhang et al. Page 11
Table 1Characteristics of the Parturients by Parity (weighted), Consortium on Safe Labor, 2002–2008
Parity 0 Parity 1 Parity 2+
N - unweighted cohort 27170 17850 17395
N - weighted cohort 453693 368131 311248
Maternal race (%)
White 60 55 51
Black 12 12 15
Hispanic 20 26 29
Asian/Pacific Islanders 4 4 2
Others 4 3 3
Maternal age (mean±SD, yrs) 24.6 ± 5.8 27.7 ± 5.7 30.0 ± 5.4
BMI before pregnancy (mean±SD, kg/m2) 23.4 ± 4.6 24.2 ± 5.1 25.5 ± 5.6
BMI at delivery (mean±SD, kg/m2) 29.1 ± 5.0 29.6 ± 5.2 30.5 ± 5.5
Cervical dilation at admission (cm) (median, 10th, 90th percentiles) 4 (1, 7) 4.5 (2, 8) 5 (2, 8)
Effacement at admission (%) (median, 10th, 90th percentiles) 90 (60, 100) 90 (50, 100) 80 (50, 100)
Station at admission (median, 10th, 90th percentiles) -1 (-3, 0) -1 (-3, 0) -2 (-3, 0)
Oxytocin use in spontaneous labor (%) 47 45 45
Epidural analgesia (%) 84 77 71
Total number of vaginal exams in 1st stage (median, 10th, 90th percentiles) 5 (1, 9) 4 (1, 7) 4 (1, 7)
Instrumental delivery (%) 12 3 2
Gestational age at delivery (mean±SD, weeks) 39.3 ± 1.2 39.2 ± 1.2 39.1 ± 1.1
Birthweight (mean±SD, grams) 3296 ± 406 3384 ± 421 3410 ± 428
Obstet Gynecol. Author manuscript; available in PMC 2013 May 21.
NIH
-PA Author Manuscript
NIH
-PA Author Manuscript
NIH
-PA Author Manuscript
Zhang et al. Page 12
Table 2Duration of Labor (in hours) by Parity in Spontaneous Onset of Labor
Cervical Dilation (cm) Parity=0 Median (95th
percentile) N=25624Parity=1 Median (95th
percentile) N=16755Parity=2+ Median (95th
percentile) N=16219
3-4 1.8 (8.1) -- --
4-5 1.3 (6.4) 1.4 (7.3) 1.4 (7.0)
5-6 0.8 (3.2) 0.8 (3.4) 0.8 (3.4)
6-7 0.6 (2.2) 0.5 (1.9) 0.5 (1.8)
7-8 0.5 (1.6) 0.4 (1.3) 0.4 (1.2)
8-9 0.5 (1.4) 0.3 (1.0) 0.3 (0.9)
9-10 0.5 (1.8) 0.3 (0.9) 0.3 (0.8)
2nd stage with epidural analgesia 1.1 (3.6) 0.4 (2.0) 0.3 (1.6)
2nd stage without epidural analgesia 0.6 (2.8) 0.2 (1.3) 0.1 (1.1)
Obstet Gynecol. Author manuscript; available in PMC 2013 May 21.
NIH
-PA Author Manuscript
NIH
-PA Author Manuscript
NIH
-PA Author Manuscript
Zhang et al. Page 13
Table 3Duration of Labor (in hours) in Nulliparas with Spontaneous Onset of Labor
Cervical Dilation (cm) Adm. at 2 or 2.5 cmMedian (95th percentile)
N=4247
Adm. at 3 or 3.5 cmMedian (95th percentile)
N=6096
Adm. at 4 or 4.5 cmMedian (95th percentile)
N=5550
Adm. at 5 or 5.5 cmMedian (95th percentile)
N=2764
Adm. to 3 0.9 (7.1) NA NA NA
Adm. to 4 3.2 (11.2) 1.0 (6.5) NA NA
Adm. to 5 5.0 (13.9) 2.9 (11.0) 0.9 (6.5) NA
Adm. to 6 6.0 (15.7) 4.2 (12.5) 2.2 (9.7) 0.6 (4.5)
Adm. to 7 6.6 (16.6) 5.0 (13.8) 3.2 (11.6) 1.5 (7.7)
Adm. to 8 7.1 (17.5) 5.6 (14.9) 3.9 (13.0) 2.4 (9.6)
Adm. to 9 7.6 (18.3) 6.1 (15.7) 4.5 (14.3) 3.0 (10.8)
Adm. to 10 8.4 (20.0) 6.9 (17.4) 5.3 (16.4) 3.8 (12.7)
Obstet Gynecol. Author manuscript; available in PMC 2013 May 21.