jumal kejuruteraan 10 (1998) 33-49 behaviour of ... · soil ph indicated a neutral condition. brady...
TRANSCRIPT
Jumal Kejuruteraan 10 (1998) 33-49
Behaviour of Trinitrotoluene in Electrokinetic Soil Processing
M. Raihan Taha, Yalcin B. Acar, Robert J. Gale & Mark E. Zappi
ABSTRACT
The behaviour and removal of trini"OlOluene (TNT) in ·contaminated soil under tlectrokinetic processes was investigated. The soil used in this study was obtained from the Hastings East Industrial Park site in Nebraska, USA.
A current density of 123.3 /lAlcm' was applied to soil specimens compacted in glass cells. Test with water and a surfactant solution, SDS. as anolytes indicated that TNT concentrations in the soil sample decreased significantly at the sections ciosestto the cathode. This, however, was not due to removal of TNT away from the cathode. Extensive analysis indicated that the disappearance of TNT was possibly due to the transformation of TNT to TNT anions possibly due to reaction of TNT with base and reductive environment generated during electrolysis. These anions were nol detected in inilial analysis with high performance liquid chromatography using EPA method. The eleclrokinelic processes needs further engineering in order to enhance removal of TNT from soils.
ABSTRAK
Kelakuan dan penyingkiran TNT dalam tanah tercemar menggunakan proses elektrokinetik dikaji. Tanah yang diuji datang dari tapak Hastings East Industrial Park di Nebraska, USA . Kerumpatan arus sebanyak 12.3 mAlcm2 dikenakan ke atas spesimen lanah yang dipadatkan dalam sel gelas. Ujian menggunakan air dan sejenis larutan surfaktan, SDS, sebagai cecair anod menunjukkan kepekatan TNT dalam sempel tanah berkurangan pada bahagian berdekatan dengan kalod. Walau bagaimanapun, ini bukanlah sebab penyingkiran TNT daripada bahagian katod. Analisis yang lebih mendalam menunjukkan kehilangan TNT kemungkinan disebabkan oleh transformasi TNT kepada anion TNT akibat tindakbalas TNT dengan bes dan sekilaran penurunan yang wujud semasa elek"olisis. Anion TNT ini tidak dapat dikesan dalam analisis awal menggunakan peralatan kromatograft cecair berprestasi tinggi mengikut kaedah EPA. Proses elektrokinelik ini perlu diperbaiki lagi untuk meningkalkan proses penyingkiran dan pembersihan TNT daripada lanah,
INTRODUcnON
The U oited States Army has a number of sites contaminated with explosive laden materials such as 2,4,6 - trinitrotoluene (TNT). The contamination is due to release to the environment in the course of production, handling,
34
loading and packaging of military or civilian devices, and ultimate disposal of emplosive residues. TNT is toxic to many organisms and it is a known mutagen (Boopathy et al. 1993). TNT is listed as a priority pollutant by the United States Environmental Protection Agency, USEPA (Keither and Telliard 1979). Therefore, it is important that TNT is removed from the soil to protect against any health hazard.
TNT is the most widely used explosive due to its low melting point, its chemical and thermal stability, low sensitivity to impact, friction, and high temperature, and the availability of safe methods of manufacture. It is also the "standard" explosive material by which the performance of all other explosive compounds are compared. TNT is environmentally stable. yet extremely photo reactive (Zappi et aI. 1993). A single TNT manufacturing plant can generate as much as 1.9 million litres of wastewater per day (Yinon 1990). In addition, in shell-loading plants, large volumes of water are used to wash out residual explosives. Wastewaters from the manufacturing of TNT have often been disposed of by discharging into the sea, lakes, unlined lagoons, rivers or streams, landfills and deep ground pumping. A number of techniques have been investigated to decontaminate TNT from the ground. Composting of explosives has proven to be effective and half lives for the breakdown of TNT were found to range between 7 to 22 days (Westonroy 1989). The disadvantage of composting is that it requires large quantities of additives, and only a small amount of the total volume composted is contaminated soil (Boopathy et al. 1994). Incineration has been the only proven technology to cleanup TNT contaminated soil (Lechner et aI. 1993). However. the method has high capital cost and low public acceptance. There is a need to find other cost effective solutions to remediate TNT from contaminated sites.
This study attempts to investigate the behaviour of TNT in electrokinetic processes. The main goal is to use electrokinetic process to remediate TNT in contaminated soils. Electrokinetic soil processing is an emerging remediation technology for polluted soil or slurries and the EPA classifies .it as a physical remediation treatment for phase separation (EPA 1989). It was hypothesized that this method might provide a cost effective means of removing nonpolar contaminant species such as TNT as well as metal species and water soluble organic contaminants from soils. The method uses low level DC currents (in the order of milliamps per square centimetre), that are applied through electrodes inserted into soil mass to move contaminants across the soil medium. Several reviews, theoretical treatments, laboratory studies and current technology status of this technique may be found elsewhere (e.g. Alshawabkeh and Acar 1992. 1996; Acar et aJ. 1993a. 1993b; Acar et al. 1994; Ugaz et aJ. 1994 and Acar et al. 1995).
MATERIALS AND METHODS
SOIL PROPERTIES
The soil used throughout this study was obtained from the Hastings East Industrial Park site in Nebraska, USA. Some basic geotechnical properties of the soil are · given in Table I. More than 85% of the soil particles were

35
retained on the ASTM No. 200 (74 mm size openit)gs) standard sieve. The soil is classified in the CL or OL region (inorganic clay or organic silts of low plasticity) in the Unified Soil Classification System (uscs) plasticity chart. Soil pH indicated a neutral condition. Brady (1974) reports the range of cation exchange capacity (CEC) to be between 20-26 mmol charge per 100 g of dry soil in neutral conditions. The value of 24.6 obtained in this study fell within the approximate range proposed by Brady (1974). Chemical analysis found that TNT concentrations in the soil sample ranged between 15 000 to 17 000 I1g/g of dry soil.
TABLE l. Basic properties of soil used in experiments
Properties
Natural water content (%)
Specific gravity Liquid limit (%) Plastic limit (%)
pH Cation Exchange Capacity. CEC (mmol charge/IOOg dry soil)
Values/Observation
16.8 2.53
43.9 21.1 7.2
24.6
EXPERIMENTAL SETUP
The electrokinetic experimental setup is shown in Figure I. A glass cell which held the compacted specimen and two Teflon end caps was used to minimize possibility of adsorption of TNT or any degradation products onto setup materials. The end caps and the glass cell were connected with threaded rods and tightened with nuts. A horizontal configuration was chosen so that condition of negligible external hydraulic gradient may be set easily between the inflow and outflow. This permits the study of only effects of electrical gradient. Liquid was supplied at the anode through a Teflon tube from a Marriote bottle. The Marriote bottle arrangement was used to supply the liquid continuously from a constant elevation. The end caps were furnished with gas vents to allow gases that are produced from electrode reactions to escape. A port with a septum was also provided so that liquids can be sampled by a syringe, and the pH developments at the anode and cathode compartments can then be monitored. The liquid was then injected back into its respective compartment in order to preserve the system. A valve was placed at both the inflow and outflow tubes so that flow into and out of the sample can be stopped during sampling and reinjecting of the liquids. Inert graphite electrodes were chosen to prevent introduction of corrosion products that might cause complicated electrochemistry due to electrode-electrolysis products. The electrodes were 0.31 em thick and 10 em in diameter with fifty 0.3 em diameter holes drilled into them to pennit free flow of liquids.
The soil specimens were air dried and compacted in the glass cells having outside diameter of 11.43 em, inside diameter 10.16 em and 5.08 em in height. In this study, compaction characteristics of the soil were not

36
-- ---8 --Datum
--~-
Note: I. Bubble tube (MarriOlc bottle)-constant head wpply reservoir la. Gas vent·anode; 2c. Oas venc-caahode 38. pH samplins port-anode; 3e. pH sampling port-cathode 48. End cap-anode compartment 4c. End cap-cathode compartment S. Soil specimen 6. Excess ports 7. DC supply 10 carbon electrodes in the end caps 8. Cathode · overflow and measuring cylinder
flGURS 1. Electrokinetic test experimental setup
evaluated since it was only important to prepare similar soil specimens for allteslS so that the effeclS of electrical gradient and different solutions could be studied. Furthermore, it is also important to minimize exposure to the contaminated soil for health and safety reasons. Therefore, it was decided to run only a selected number of experiments. One hundred and eighty grams of air dried soil were initially mixed with 80 mL of deaired deionised water (pH ranging between 6.5-7.5). The mixture was then poured into the polyarcylite sleeve arrangement and compaction was done with a standard Proctor compaction hammer (weight = 2.49 k.g and drop height = 304.8 mm) at 12 hammer blows. The soil was compacted only in one lift in order to obtain a homogeneous sample and to avoid over compaction of the soil specimen.
The test setups were housed in a hood for protection against any risk. of sparl<s and detonations and also for confinement against any spills. A constant current of 10 rnA was applied (current density = 123.3 IlAJcm') to the specimens through a DC power supply. Most test runs were over a period of 7 days and the pH values of liquid samples were taken daily. However,
37
for the first 24 hours pH were recorded more frequently, i.e., at 0, I, 4, 10 and 22 hours in order to monitor the pH development more closely. At the end of each test, anode and cathode liquids were collected from the access pon. The electrodes and filter papers were taken out and washed with methanol to leach out any adsorbed TNT and the washing liquids were collected. All liquids were then analyzed for TNT concentrations and mass balance purposes. The soil sample was extruded and cut into 5 sections and analysis of TNT concentrations were done after drying. The soil pH before and after tests were also taken.
TNT ANALYSIS
A High Performance Liquid Chromatography (HPLC) instrument was used for the analysis of TNT concentrations. The general procedure follows that of EPA Method 8330 (1990) for analysis of explosives by HPLC. The injection volume for the analysis was set at 25 ~, the mobile phase being HPLC grade methanol and filtered deaired deionized water (I; I solution). A flowrate of I mL/min was used in the column. These settings were established after long and extensive calibration trials. The uv detection wavelength of TNT is at 254 nm. TNT standards for establishing the calibration curve was purchased from Crescent Chemical Co., New York, USA.
RESULTS AND DISCUSSION
The first test (Cell I) was conducted with water at both the anode and cathode compartments. This is the control test to which the performance of all other solutions were compared. The second test (Cell 2) was processed with 0.5% sodium dodecyl sulphate (50S) solution at the anode and water as the catholyte. 50S is a very common surfactant and is known to have an excellent solubilizing strength. It was hypothesised that 50S might be able to desorb TNT from the soil surface and eventually TNT in the aqueous solution would be transponed to the cathode by electroosmosis. Batch solubilization of TNT using 50S and other surfactant solutions is described elsewhere (Taba 1996 and Taba et al. 1997). The initial and final specimen propenies of Cells I and 2 are shown in Table 2. Both samples have almost the same characteristics. A final mass balance of over 80% were achieved in both tests.
ELECTRICAL POTENTIAL
Electrical potential measurements (Figure 2) showed that the reduction of voltage to a constant value (4 to 5 volts) took place within the first 24 hours. In all previous works using a similar setup (Putnam 1988 and Hamed 1990), the voltage profile was the reverse of that observed in this study. The foremost reason is possibly that in those studies the initial soil pH was around 4. The high initial concentration of metallic species such as Ph" ions in the soil pore fluid renders high ionic strength and therefore high initial electrical conductivity and low voltage. The increase in potential with time (decreasing electrical conductiviry and increasing voltage) was related to precipitation of metallic species at their hydroxide solubility limits, or due

38
to the effect of the high pH environment developed near the cathode (Alshawabkeh 1994). In this study, the initial soil pH was around neutral. The high concentrations of TNT (nonpolar) in the soil and relatively low concentrations of ionic species renders low conductivity and high voltage. The development and movement of acid and base fronts increases conductivity thereby dropping the voltage.
TABLE 2. Specimen properties for Cell and Cell
Property Cell I' Cell 2**
Initial Dry density, kN/m] 12.76 12.44 Moisture content, % 15.77 14.56
Saturation. % 42.22 34.75 Porosity 0.49 0 ."
pH 7.15 7.06
Final Dry densilY, kN/m' 12.40 11 .98
Saturation, % 94.37 100 Porosity 0.5 0.52
Applied current density. 123.3 123.3 ~A/cm'
Test duration, hours 168 168 Toral flow. mL {pore volumes] 279 [1.4J 211[1.0)
... Control test - water at anode and cathode compartments. ** 50S (0.5%) solution at the anode and water at cathode companments .
i ii,
. 20 ~ .. +~ .. -.. -... -... -.. -.. -.-.+ .... - ..... -... ,-,- .. .. ..... '! ' o .
i i : i
15 4-.. ··--.-.l-..... .f i '
o 50 100
Time (Hours)
• o Cell I
Cen 2
l
......... -
..... -........... --_ ....... -
150 200
FIGURE 2. Electrical potential across the specimen during electrokinetic test
39
LIQUIDS PH OF THE ANODE AND CATHODE COMPARTMENTS
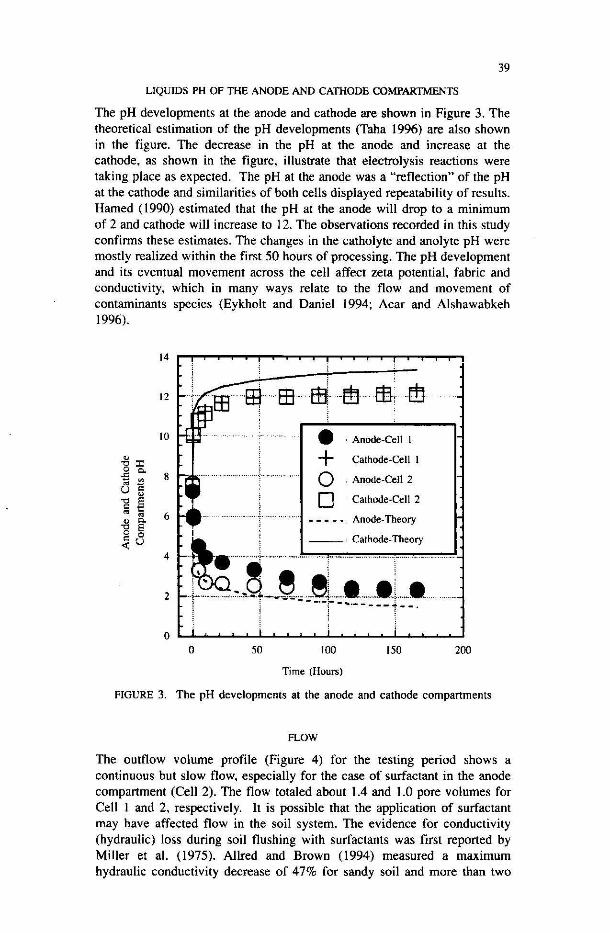
The pH developments at the anode and cathode are shown in Figure 3. The theoretical estimation of the pH developments (Taba 1996) are also shown in the figure. The decrease in the pH at the anode and increase at the cathode, as shown in the figure. illustrate that electrolysis reactions were taking place as expected. The pH at the anode was a "reflection" of the pH at the cathode and similarities of both cells displayed repeatability of results. Hamed (1990) estimated that the pH at the anode will drop to a minimum of 2 and cathode will increase to 12. The observations recorded in this study confirms these estimates. The changes in the catholyte and anolyte pH were mostly realized within the first 50 hours of processing. The pH development and its eventual movement across the cell affect zeta potential, fabric and conductivity, which in many ways relate to the flow and movement of contaminants species (Eykholt and Daniel 1994; Acar and Alshawabkeh 1996).
14
12
10
~
'8:1: ..c Q. 8 - . . -u = ~
'0 E a '5 6 ~ Q. '0 E 0 = 0 <u
4
2
o
............... !.,. ....
50
• . Anode-Cell I
+ Cathode-Cell 1
o . Anode-Cell 2
o Cathode-Cell 2
Anode-Theory
100 150
Time (Hours)
200
FIGURE 3. The pH developments at the anode and cathode compartments
FLOW
The outflow volume profile (Figure 4) for the testing period shows a continuous but slow flow, especially for the case of surfactant in the anode compartment (Cell 2). The flow totaled about 1.4 and 1.0 pore volumes for Cell I and 2, respectively. It is possible that the application of surfactant may have affected flow in the soil system. The evidence for conductivity (hydraulic) loss during soil flushing with surfactants was first reported by Miller et a!. (1975). Allred and Brown (1994) measured a maximum hydraulic conductivity decrease of 47% for sandy soil and more than two

40
orders of magnitude for loam. Surfactant mixtures, soil organic content, added solution electrolytes and pore blockages all affect the degree of hydraulic conductivity losses. In addition, it is probable that addition of a surfactant solution decreased the electrolyte concentration increasing the thickness of diffuse double layer leading to slight fabric changes decreasing the hydraulic conductivity.
3 E. ~ 0 Ii:
350 n:=:::::::I::;-""" .......... T"..........,-,-r-...,.....,.'"1 300
250 -+-...
200 +.
150 ....... ! i i
100 +. !
50
0
0
• Cenl
o Cen2
.. J I
j ; ., ••••• ~ __ ._ ... HW ... __ •• _ ••••••• _ :..._.~._._
50 100
Time (Hours)
........ ···i·-· ..... -.. --.. -..... -_ ..
•
150
FIGURE 4. The outflow profile during electrokinetic tests
200
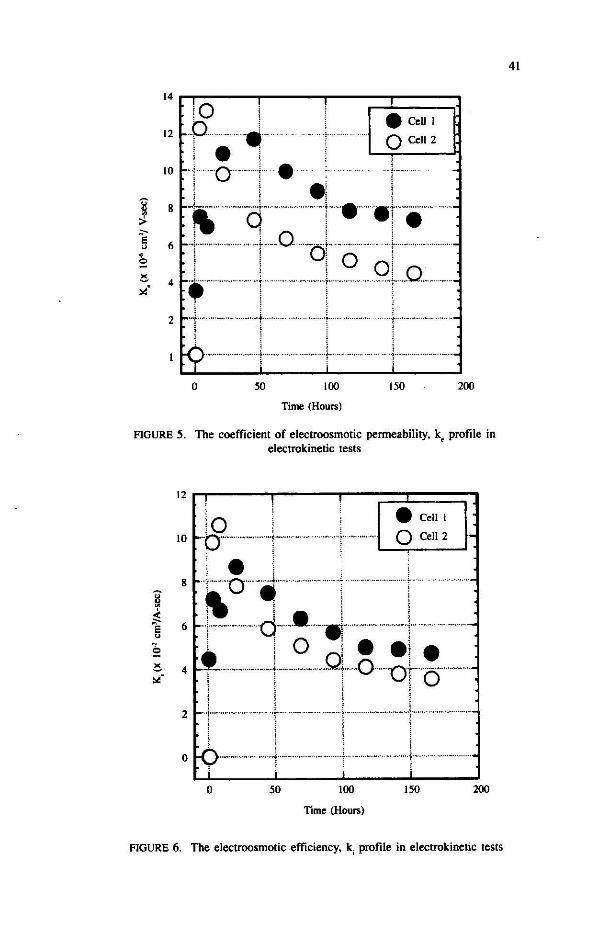
The coefficient of electroosmotic permeability, k, and the electroosmotic water transport efficiency, k; can thus be calculated from the flowrate, electrical potential (voltage) gradient, current and cross sectional area of the soil specimen. Fundamentally. k, is a proportionality constant between hydraulic flow velocity and electrical gradient and k; is a measure of the efficiency and economics of electroosmotic dewatering. In Figure 5 and 6. it is shown that k, and k; first increase and then decrease to a stable value. Similar trends were reported by other worl<ers (Casagrande 1983 and Hamed 1990). The time dependent changes of k, and k; demonstrate that significant changes occur in the overall cell resistance and hence the chemistry across the cell during the process. fherefore. k, and k; are not constant for a specific soil but they are time dependent variables. presumably controlled by the chemistry generated (Hamed 1990). Modeling the time dependent behavior of k, represents one of the most difficult tasks in evaluariog species transport by electrokinetic processes.
FINAL SOIL PH
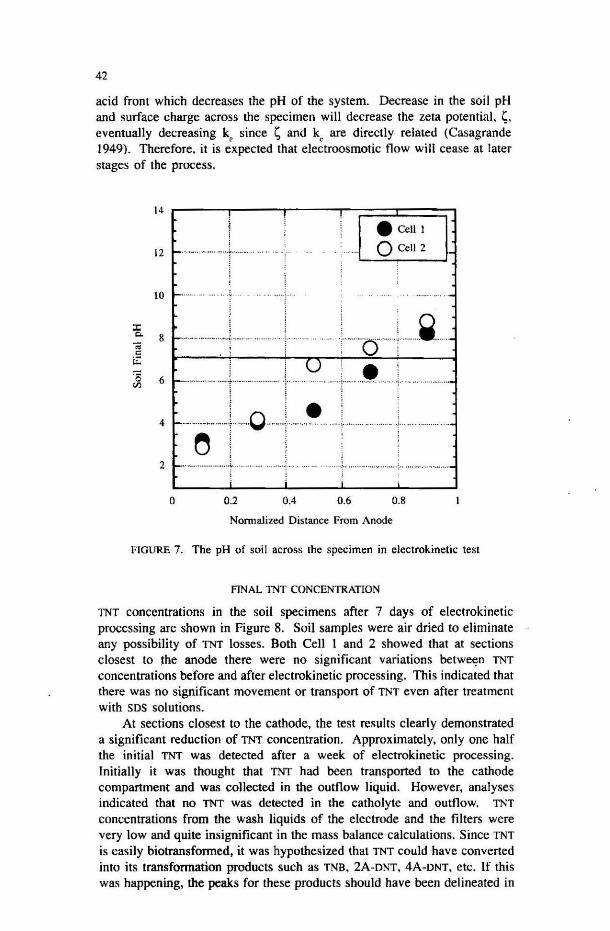
The pH profiles in Figure 7 illustrate the advance of the acid front from the anode to the cathode. The drop in k, is also a consequence of the sweeping
14 rl()---r--T-;::I;:=:::::;:J !O I
12.P.. o· ~~~ . : , 10 fo·1· '0"1 .•.
l .' , , : ,
8 fo-~······················l·'···········'·············1····.·······.t······· .. ······ ,q : i· 6 fol·····!·O'·O;.'··O ···r·······
, ...... 0 ....... _.1" ...... Q ... _._ .. _ ..... _ 4 fo~f" .. t· .. · .. · .. ··· .. · .. ,.. ...... - -
................. 1. ... ...... -....... '.H .••• '~ 1
. .. j ........ , ..
, ··-······T
.......... i
·"·····r i
o 50 100 150 200
Time (Hours)
FIGURE 5. The coefficient of electroosmotic penneability. ke profile in electrokinetic tests
, 2 __ j_ ...... H ........ " ........ +_ ............ _ ..... --... ~
o 50 100 150 200
Time (Hours)
FIGURE 6. The electroosmotic efficiency. k j profile in electrokinetic tests
41
42
acid front which decreases Ihe pH of the syslem. Decrease in the soil pH and surface charge across the specimen will decrease Ihe zela potential, ~, eventually decreasing k, since ~ and k, are directly related (Casagrande 1949). Therefore, il is expecled Ihal electroosmotic flow will cease at later stages of Ihe process.
14 r---~!r----r-----rr===~==~ i • Cell I
12 !-...... .... .. o Cell 2
10 . . ..
8 - .................. i .... ·· ............... ,... ... .. ..' .,- ·O '.. ~· ·
4
o
.... -.. _-_. , , 0.2
i U e i "
• ;
j
i 0.4 0.6 0.8
Nomla1ized Distance From Anode
FIGURE 7. The pH of soil across the specimen in electrokinetic test
ANAL TNT CONCENTRATION
TNT concentrations in the soil specimens after 7 days of electrokinetic processing are shown in Figure 8. Soil samples were air dried 10 eliminate any possibilily of TNT losses. Both Cell 1 and 2 showed that at sections closest to the anode there were no significant variations betwe<?" TNT concentrations before and after electrokinetic processing. This indicated that there was no significant movement or transport of TNT even after treatment with 50S solutions.
At sections closest to the cathode, the test results clearly demonstrated a significant reduction of TNT concentration. Approximately, only one half the initial TNT was detected afler a week of electrokinetic processing. Initially it was thought thai TNT had been transported to the cathode compartment and was collected in the outflow liquid. However, analyses indicated that no TNT was detected in the catholyte and outflow, TNT concentrations from the wash liquids of the electrode and the filters were very low and quite insignificant in the mass balance calculations. Since TNT is easily biotransfonned, it was hypothesized that TNT could have converted into its transfonnation products such as TNB, 2A·DNT, 4A·DNT, etc. If this was happening, the peaks for Ihese products should have been delinealed in

20000 .----!r---'l---"T !!---T 1,----'
I+-ilial Cell I
15000
10000 r ' ' .... • Cell (+Final
o Cell 2-Final
... tOO"" ....... '" L.. !
o
i '*
..+. . .... -
,
• o 5000 r . .. ··t .......... ······r .. ··········,,···· "r ······ .. ·· ··~ .. -··~··r ................ -
i i i O~ ____ L-__ ~ ____ -J ____ ~ ____ ~
o 0.2 0.4 0.6 0.8
Normalized Distance From Anode
FIGURE 8. Final TNT concentration in the soil specimen after electrokinetic soil processing
43
the HPLC chromatograms. However, only one peak, i.e. that for TNT, was observed in all analyses. This demonstrates the fact that all other known products were below detection levels, simply did not exist, or an undetectable product was being produced.
Another pastulate was possible oxidation of TNT. However, any such oxidation should be less likely to prevail close to the cathode, under strongly reducing conditions. A brief examination of the pH and TNT concentration profiles indicate that the drop in TNT concentrations occur simultaneously when the pH of the soil became greater than seven. This gives an indication that base alone might have reacted wilh TNT resulting in its disappearance. A simple test was then conducted to investigate if basic conditions could have transformed or degraded TNT. A sel triplicate samples of 3 grams of the initially contaminated soil were mixed with 5 mL of O.OIM ammonium hydroxide (NHPH) having pH of 10.18. For comparison and discussion purposes, another set of soil samples were mixed with 5 mL of 0.1 M Hcl (hydrochloric acid) having a pH of 1.16. The soil samples were kept in darkness, then air dried naturally, after which the samples were tested for TNT concentrations. The TNT concentrations for the base and acid reactions were 15292 Ilg/g (0',.,=441) and 16,245 Ilg/g (0',.,;567), respectively. This result does not indicate significant variation of TNT concentrations upon exposure to base as was initially thought to happen in EK tests at sections close to the cathode. It is possible that the reaction in the soil electrokinetic tests is more complex and may involve other products from the cathode electrolysis.

44
ANALYSIS OF TNT TRANSFORMATION PRODUCTS
In order to confinn the disappearance of TNT and the possibility of its transfonnation to other products, the remaining soil samples from electrokinetic tests were sent to the us Anny Waterways Experiment Station (WES) Environmental Chemistry Labordtory, Vicksburg, Mississippi, USA for an independent analyses of TNT and all other known lransfonnation products. The TNT concentrations of soil samples after elCClrokinetic uealment from WES were compared to those obtained by the authors (designated as LSU) in Figures 9 and 10. The results showed higher TNT concentrations in WES analyses at sections close to the anode than those in LSU analyses. However, the discrepancies are not unusual for HPLC analysis of organics by two separate laboratories. They may be attributed to differenees in equipment, operator, temperature, test details, etc. Indeed, it is stated that only if calibration standards do not agree within 20%, then the calibration curve needs to be reevaluated (EPA 1990). It may be inferred that the 20% difference is the maximum by which the results can differ. Both WES and LSU analyses confonn within 20% of each other. The most interesting fact was the near similarities of TNT concentrll!ions at sections closest to the cathode. This demonstrated that the finding of TNT disappearance close to the cathode was reliable.
The results of analysis for known TNT lransfonnation products are tabulated in Table 3. There was an increase in IN8 coneenuations at sections closest to the cathode. At the same time, there was a corresponding decrease in the concenuations of other products at these sections. However, the sum of all detennined TNT lransfonnation products could not nearly makeup TNT
2S000
I 1 I I !
I 0\ ~-I o-r-------0 e I • 1--1---I
I , ! ! --_._-+---- --Q-eLSU I OWES
I ----+._- -_._.-
~ 20000
c .2 S ISOOO c ~ y c 8 !-:z: 10000 !-'ii c Ii:
sooo
! I
I I o o 0.2 0.4 0.6 O.S
Nonnaliztd Distance From Anode
FIGURE 9. Comparison of WES and LSU analysis of TNT for Cell I

45
25000 I"'""T'".......,.....,I,.-....-.-.!-.-......... .,..........,..., .... r-!I ....... ...,..,
I I ""-------i--r<\-+--- ----t------o I V ;
; I i i 0 • I ,-+' --:::---I---r.-+---I i !. U, I I •
11 __ I ~ 10000 tr==.=LS:±U=:;-1
Ir--1---- I-~ --
5000 ~O==7F=--='--I--~I.--_.,--I ! I !
O~~~~~~~~~~--~~--~
15000
o 0.2 0.4 0.6 0.8
Nonnalized Distance From Anode
FIGURE 10. Comparison of WES and LSU analysis of TNT for Cen 2
losses from mass balance calculations. In fact the results showed that the concentrations of all the conventionally known compounds were negligible compared to the initial TNT concentrations. It can be hypothesized that TNT
could have reacted to form a product(s) that is not detected at 254 nm, the wavelength used for analysis of the TNT and its metabolites.
A possible explanation for the TNT disappearance can be referred to Okamoto et aI. (1977) in which they described a colored solution when TNT
reacted with strong base. This reaction was frrst described by Janovsky (1891). The reaction was interpreted as a result of formation of an intermediate, 2,4,6- trinitrobenznyl anion (TNT) which absorbs light in the visible region (500-525 nm). On future reaction, the anions initially produced reacted with umeacted TNT to yield a complex. now known as Janovsky's complex. Thus. according to Okamoto, et al. (1977)
TNT + Amine (base) -+ TNT + Amine W TNT + TNT -+ (TNT - TNT)'
in which (TNT-TNT)' is the Janovsky's complex. Okamoto et aI. (1977) cautioned that these hypotheses were suggested with very limited results.
Meisenheimer (1902) and Jackson and Earle (1903) independently arrived at similar structures to explain the phenomenon observed by Janovsky (189 I). They proposed a different structure for the highly colored species which are known as Jackson-Meisenheimer (J-M) anions. Jenkins(1990) used the J-M anions to develop a simplified method for in situ detection and determination of TNT concentrations in soils. TNT can be converted into J-M anions by addition of potaSsium hydroxide (KOH) and sodium sulphite

46
TABLE 3, Concenrrarion of TNT (ranSfOnnalion products in Cell 1 and Cel1 2 after electrokinetic soil processing
TNT Transformation Cell I Concentrations (JIg/g) Cell 2 Concenlralions <J,lg/g) products Normalized distance from anode Normalized distance from anode
0.1 0.3 0.5 0.7 0.9 0. 1 0.3 0.5 0.7 0.9
TNB 51 77 lOB 176 229 49.5 94 IB9 25B 260 4A·DNT 44.5 22.5 ~25 ~25 <25 90 10 <25 <25 <25 2A·DNT 56 20.5 9.5 75 15.5 154 15 10 11.5 14.5 2.6·DNT <26 <26 <26 <26 <26 <26 <26 <26 <26 ~26
2.4·DNT 34 40 37.5 33.5 23.5 22 31.5 31 32.5 19.5 Azoxytol <100 <100 <100 <100 <100 <100 < 100 < 100 <100 <100 2.6· DANT <50 <50 <50 <50 <50 <50 <50 <50 <50 <SO 2,4·DANT <100 <100 <100 < 100 < 100 <100 <100 <100 <100 <100 DNA ~25 ~25 ~25 ~25 <25 <25 <25 <25 ~25 <25 TNT (xl0·') 19.5 19.4 IB.7 16.99.1 18.4 19.2 16.4 14.4 6.7
TNS = 1.3.5-Trinitrobenzene 4A· DNT = 4-Amino-2,6 -Dinitrotoluene 2A-DNT := 2-Amino-4. 6-Dinitrotoluc:ne 2.6-DNT = 2 ,6-Dinitrotoluene 2.4-DNT = 2.4-Dinitfotoluene DNA:: 3.5-Dinitroanaline 2.4-DANT ::: 2 .4-Diamino-6-Nitrotoluene 2.6-DANT=2.6-Diamino-4 -Nitrotoluene
(Na,SO,) within a few minutes. Absorbance is measured at 540 nm using a spectrophotometer. The Jackson-Meisenheimer anions concentration show an excellent correlation to the TNT concentrations. These correlations, however, are derived from tests at low level «200 ppm) TNT concentrations.
In order to demonstrate the existence of J-M anions in solution, 2.1 mg/L of TNT solution was prepared with 95% acetone and 5% deionized deaired water. A pellet of KOH and 0.2 g Na,SO, were then added to 25 mL of the TNT solution and the solution was shaken for 3 minutes. A dark red solution appeared. Upon addition of sulphuric acid (H,S04) drop by drop, the red colouration diminishes and slowly the solution becomes colorless. The reversibility of the reaction, first by the addition of the base and then the acid, proves the formation of the J-M anions or the Janovslcy 's complex when bases are added to the TNT solutions.
Two grams of soil from section 5 (closest to the cathode in the region where the reaction is suspected) of Cell I and 2 were then shaken for · 3 minutes with 10 mL acetone (95 %) and water (5%) solution to see if TNT
could have transformed into the J·M anions during electrokinetic processing. The extract was then centrifuged for 10 minutes and filtered with 0.5 11m pore size filter. A dark red solution was observed. Sulphuric acid was then added drop by drop to the solution. It was observed that the colour reduced to orange indicating the existence of the J·M anions. It is probable that the J. M anions were formed in the electrolcinetic tests although a quantitative assessment needs to be made to assess the extent of this fonnation.
OBSERVATIONS
Tests results presented showed no removaVmigration of TNT in test specimens even with SOS solutions. In batch solubilization tests (Taha et al. 1997), it was shown that removal of Th"f into the pore fluid was possible using SDS.
Once TNT is solubilized in the pore fluid, theoretically, electroosmotic

47
process should be able to carry TNT away from the electrode:s. The inability of the proses to transport TNT was probably due to inability of the solutions (water and SDS) to solubilize TNT. It must be mentioned that in batch solubilization tests, contaminated soil was shaken rigorously with solutions for 18 hours before TNT was extracted and analyzed. In electrokinetic tests. such dynamic mixing did nol occur as the solutions were allowed to pass through the sample under zero hydraulic gradient. The possibility of enham.:ing removal by improving contact time between solution and contaminated soil. and increasing electroosmotic flow (through neutralization of acid at the anode) also proved to be unsuccessful in improving removal efficiency _ (Taha 1996). This was probably due to high TNT content in the soil sample (15000 ~g/g - 17 non ~g/g) which !nade small observable loss in TNT
concentration (in the range of 200 ~g/g) insignificant. It may be possible lO first flush the TNT with a base, thus converting it into the TNT anions (l-M
anions or Janovsky's complex). which are more soluble. then using electroosmotic processes to transport the anions to the anode for removal.
CONCLUSIONS
TNT is toxic to many organisms and is also a known mutagen. Its bellav ior
and removal from soils using electrokinetic processes have been investigated in this study. Electrokinetic soil processing might prove to be a cost etfective means for remediation of nonpolar organic contaminants such as TNT. It was found that TNT concentrations were reduced significantly at soil sections close to the cathode after electrokinetic soil processing. This may be due to the transformation of TNT to TNT anions (Jackson-Meisenheimer anions or Janovsky's complex) in the basic. reductive environment It was observed that significant removal of TNT did not occur even after the supply liquid was changed to sos solution. It is concluded that there is a need to engineer the process further to enhance the solubility of TNT. or to convert it 10 a more soluble limn. especially when its concentration is high (~15 (XlO-17 (XlO ~g/gl.
ACKNOWLEDGMENT
The authors gratefully acknowledge the financial support of the us Army Waterways Experiment Station (WES). Vicksburg, Mississippi for this projecl. Cynthia Teeter of WES Environmental Chemistry Branch perfomed the analysis of TNT transformation products. Sarah Jones helped the authors in the TNT analysis and other analytical chemistry related matters. Discussions with Dr. Mohamad Qasim of WES and Dr. Thomas Jenkins of LS Army Corps of Engineers Cold Regions Research and Engineering Laboratory. Hanover. NH provided helpful insight. Any opinions. findings and conclusionsor recommendations expressed in this material are of the authors and do not necessarily retlect the views of the sponsors.
REFERENCES
Acar, YB. & Aishawabkeh. A.N. 1996. Electrokinetic remediation: I. Pilot-scale tests y,'ith lead spiked kaolinite . .I. Georecll. Ellg .. ASCE. l~~n): 173-185.
Acar, YB .. Alshawabkeh. A.N. & Gale. RJ. 1993a. A review of fundamentals of removing contaminants from soils by clectrokinctics. Envirnnrn~nlal
48
Geotechhology. Proc. Mediterranean Con! envirOflinental Geolechnology. Cesme, Turkey, edited by A.A. Balkema. pp. 321-330.
Acar. Y.B., Alshawabkeh, A.N. & Gale, R.J. 1993b. Fundamentals of extracting species from soils by electrokinetics. Waste Management 13: 141-15l.
Acar, Y.B. Alshawbkeh, A.N. & Gale. R.I. 1994. Removal of cadmium (II) from saturated kaolinite by the application of electric current. Geoluhnique 44 (2): 239-254.
Acar. Y.B, Gale, R.J., Alshawabkeh, A.N, Marks, R.E., Puppala,S., Bricka. M. & Parker. R. (1995). Eleclrokinetic remediation: Basics and technology and status. J. of Hazardous Materials 40: 117-137.
Allred, B, & Brown. G.O. 1994. SUlfactanl induced reductions in soil hydraulic conductivity. Grou.nd Water Monitoring and Remediation. Vol. 14(2): 174-184. Groundwater Pub. Co .. Riverside. Dublin OH. Spring,
Aishawabkeh. A.N. 1994. Theoretical and experimental modeling of multi species transport in soils under electric field. PhD Dissertation, Louisiana State University, Baton Rouge.
Alshawabkeh. A.N. & Acar. Y.B. 1996. Electrokinetic Remediation: II. Theoretical Model. 1. Geotech. En8. 122 (3 ): 185-1%.
Aishawabkeh. A.N. & Acar. Y.B. 1992. Removal of contaminants from soils by electrokinetic: a theoretical treatise. J . of Environ . Sci. Health A27(7): 1835-1861.
Boopathy, R., KUlpa, C.F. & Wilson, M. 1993. Metabolism of 2,4,6- Trinitrotoluene (TNT) by desulfobrio sp. (B strain). Applied Microhiol. 39: 270-275.
Boopathy, R., Wilson, M. Montemagno, C.D .. Manning. Jr. J.F. & Kulpa, C.F. 1994. Biological transfonnation of 2,4.6- Trinitrotoluene (TNT) by soil bacteria isolated from TNT - contaminated soil. Bioresource Technology 47: 19-24.
Brady. N.C. 1974. The Nature and Properties of Soils. 8th edition. New York: MacMillan Pub. Co., Inc.
Casagrande, L. 1949. Electroosmosis in soils. GeoIechnique 1(3): 159·177. Casagrande. L. 1983. Stabilization of soils by means of electro-osmosis·State of the
art. J. 80sion Society of Cil'il Engineers 69(2): 255-302. EPA. ) 989. Guide to IreaTment technologies for hazardous waster at Superfund sites.
EPA/54012-89/052. Office of Research and Development, Washington, D.C. EPA Method 8330. 1990. Nitroaromatics and nitramines by high peljormance liquid
chromatography (HPLC). Office of Solid Waste and emergency Response, Washington. D.C.
Eykhoh. O.R. & Daniel, D.E. 1994. Impact of system chemistry on electroosmosis in contaminated soil. 1. Geotech. En8. 120(5): 797-815.
Hamed. J. 1990. Decontamination of soil using electroosmosis. PhD dissertation. Louisiana State University, Baton Rouge.
Jackson. c.L. & Earle. R.B. 1903. On certain colored substances derived from nitro compounds. American Chemical Journal 29: 89·120.
Janovsky. J.v. 1891. Uber eine reaction der dinitrokoper. Berichte 24: 971-972. Jenkins. T.F. ) 990. Development of a simplified field method for the detennination
of TNT in soi1. US Army Cold Regions Research and Engineering Laboratory, Special report 90-38, Hanover. Nh.
Keither. L.H. & Telliard. W.A. 1979. Priority pollutants. I. A perspective view. Envi . Sl'i . Tech 13: 416-423.
Lechner. c.A. & Feireisel. D.F. 1993. Incineration of soils and sludges contaminated with explosives. Seminar on Technologies fOT Remediating Sites Contaminated with Explosive and Radioactive Waste. Dallas. USEPA.
Meisenheimer, J. voo. 1902. Uber reactionen aromatischer nitrokoper. Leibig's Annalen Dr Chemie 323: 205-246.
Miller. W.W., Valoras. N. & Letey, J. 1975. Movement of two non.ionic surfactanls

49
in wenable and waler repellent soils. Soil Science Society of America Proceedings 39: 12-16.
Okamoto, Y., Chou. E.J. & Wang. J., Roth. M. 1977. The removal of 2,4,6-Trinitrotoluene (TNT) from Aqueous Solution with Surfactants. Proc. Natl . Con/. Treat . Disposal Ind. Wastewaters Residues. Inf. Transfer, lnes. Rockville. Md. pp. 249 - 253.
Putnam, G.A. 1988. Detennination of pH gradients in the electrochemical processing of kaolinite. MS Thesis, Louisiana Stale University, Baton Rouge.
Rosen, MJ. 1978. Sulfac/ants and Interfacial Phenomena. John Wiley & Sons, New York .
Taha, M.R. 1996. Micellar electrokinetic remediation of TNT from soils. PhD -Disscnation. Louisiana State University, Baton Rouge.
Taha, M.R., Acar. Y.B., Soewarto, !.H .• Gale. R.I. & Zappi. M.E. 1997. Surfactant enhanced desorption of TNT from contaminated soil. Water. Air and Soil 100: 33-48.
Ugaz. A., Puppala, S., Gale. R.J. & Acar. Y.B. 1994. Complicating features of electrokinetic remediation of soils and slurries: Saturation effects and the role of ca,hode electrolysis. Chem. EnR. Comm. 129: 183·200.
Westonroy. Inc. 1979. Composting of Explosive Contaminated Soil Technology. us Army Toxic and Hazardous Materials Agency repon No. CCTHA-TC-CR-90027, Aberdeen Proving Ground, MD.
Yinon, Y. 1990. Toxicity and Metabolism oj Explosives. Boca Raton Florida: eRe Press Inc.
Zappi, M.E .. Gunnison. D., Pennington. J .• Teeter. C .• Coyle. C. & Rope. C. 1993. Evaluation of Bioslurry Systems fOT Treating Explosives Contaminated Soils From the Hastings East Industrial Park. Report submitted to USAE District, Kansas City, Missouri.
M. Raihan Taha Department of Civil and Structural Engineering Universiti Kebangsaan Malaysia 43600 UKM Bangi Selangor D.E. Malaysia
Yalcin B . Acar Department of Civil & Environmental Engineering Louisiana State University Baton Ronge LA 70803, USA
Rovert J.Gale Department of Chemistry Louisiana State University Baton Rouge LA 70803, USA
Mark E. Zappi Department of Chemical Engineering P.O. Box 9595. Mississippi State University MS 39762. USA
--_ . _ - - -