julian t. saldivar elementary school % asian % n % n % hispanic grade year n n % african american...
TRANSCRIPT

JULIAN T. SALDIVAR ELEMENTARY SCHOOL
School Number 271 August 7, 2018

1 Table of Contents2018-19 Data Packet: Standard Issue
2. Contents ........... Table of Contents
3. Notes ................ Notes and Data Descriptions
STUDENTS AND STAFF
6. Summary .......... Summary of Student and Teacher Statistics
7. Enroll (1) ........... Enrollment Statistics by Ethnicity
8. Enroll (2) ........... Enrollment Statistics by Select Student Group
9. Attendance ....... Student Attendance Statistics
10. Teachers ........... Teacher Statistics
STAAR
11. Reading (3-8) .... STAAR 3-8 Reading in English
16. Writing (3-8) ..... STAAR 3-8 Writing in English
21. Math (3-8) ........ STAAR 3-8 Mathematics in English
26. Science (3-8) ..... STAAR 3-8 Science in English
STAAR (SPANISH)
31. Reading (3-8) .... STAAR 3-8 Reading in Spanish
36. Writing (3-8) ..... STAAR 3-8 Writing in Spanish
TERRANOVA/SUPERA
41. Compliance ....... SCE Compliance for At-Risk Students
42. Reading (TN) ..... TerraNova Reading Subtest
44. Language (TN) .. TerraNova Language Subtest
46. Math (TN) ......... TerraNova Mathematics Subtest
48. Reading (SUP) ... SUPERA Reading Subtest
50. Language (SUP) SUPERA Language Subtest
ENGLISH PROFICIENCY
52. IPT ..................... IDEA Proficiency Test
LOCAL ASSESSMENT
53. ACP ................... Dallas ISD Assessments of Course Performance
August 7, 2018 Dallas ISD Evaluation & Assessment (Office of Institutional Research) rpt_CONTENTS 2018-19 Data Packet
2JULIAN T. SALDIVAR ELEMENTARY SCHOOL (271)

3
Notes, Definitions, and Data DescriptionsNotes
TELPAS: Performance standards for the new 2018 TELPAS were not available at publication. New data packets will be generated when all TELPAS composite
ratings and yearly progress indicators can be reported.
Student percentages are computed as the percentage of total student enrollment.•
Additional statistics are available in ENROLLMENT and TEACHER reports.•
Teacher demographics and location assignments are from the district's Public Education Information Management System (PEIMS) submission to the TEA.•
2018-19 DATA PACKET INFORMATION
2017-18 SCHOOL SUMMARY
Race/ethnic categories are based on the latest federal standards for ethnicity and race reporting, though some categories have been combined due to small
group sizes. Students reporting their ethnicity as “Hispanic” are not counted in any race category.
•
Statistics are based on the school's enrollment at the end of the fifth six-weeks grading period.•
The “retention rate” is the percentage of students in the same grade at the end of the fifth six-weeks grading period for both 2016-17 and 2017-18.•
“New” students were new to the district in 2017-18. They are counted as new if not enrolled in a district campus before the last day of the 2016-17 school year.•
ENROLLMENT
• Statistics are based on student attendance through the end of the sixth six-weeks grading period (the end of the school year).
• “Average daily membership” is the total number of school days students were SCHEDULED or ENROLLED divided by the number of school days in the year.• The “average daily attendance” number (N) is the total number of school days students were IN ATTENDANCE divided by the number of school days in the
year. The “average daily attendance” percentage (%) is the average attendance rate. For each student, the number of days attended is divided by the number
of days enrolled. This rate is then averaged across students.
• The number (N) of “yearly transactions” is the total number of transfer and withdrawal transactions in the school year. The percentage (%) is the number of
transactions divided by “average daily membership,” which gives (on average) the percentage of the membership associated with a transaction.
• “Continuously enrolled” students are enrolled and in attendance for a minimum number of instructional days in at least one course at the school between the
beginning of the school year and the first day of the main STAAR testing period. The minimum number varies depending on the school year's calendar.
• The “stability rate” is the number of continuously enrolled students divided by “average daily membership.”
ATTENDANCE
August 7, 2018 Dallas ISD Evaluation & Assessment (Office of Institutional Research) rpt_NOTES 2018-19 Data Packet
3JULIAN T. SALDIVAR ELEMENTARY SCHOOL (271)
3
Notes, Definitions, and Data DescriptionsNotes
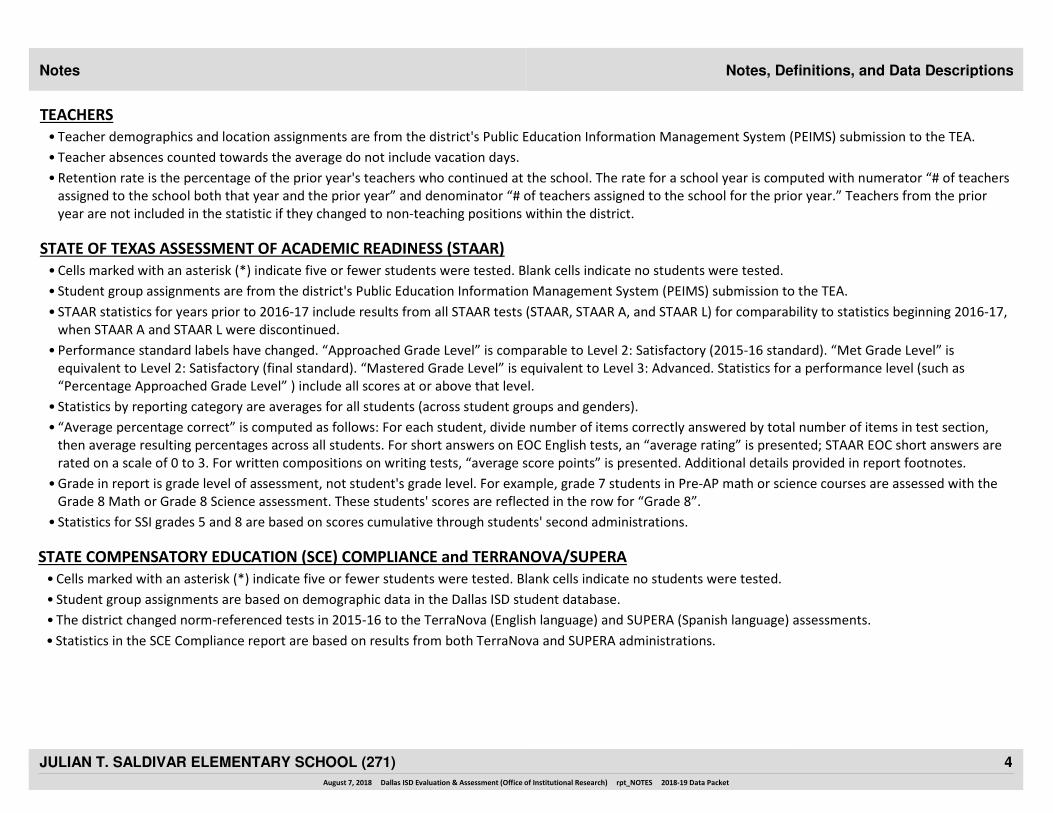
• Teacher demographics and location assignments are from the district's Public Education Information Management System (PEIMS) submission to the TEA.
TEACHERS
• Teacher absences counted towards the average do not include vacation days.
• Retention rate is the percentage of the prior year's teachers who continued at the school. The rate for a school year is computed with numerator “# of teachers
assigned to the school both that year and the prior year” and denominator “# of teachers assigned to the school for the prior year.” Teachers from the prior
year are not included in the statistic if they changed to non-teaching positions within the district.
Cells marked with an asterisk (*) indicate five or fewer students were tested. Blank cells indicate no students were tested.•
•
•
•
•
Student group assignments are from the district's Public Education Information Management System (PEIMS) submission to the TEA.
Grade in report is grade level of assessment, not student's grade level. For example, grade 7 students in Pre-AP math or science courses are assessed with the
Grade 8 Math or Grade 8 Science assessment. These students' scores are reflected in the row for “Grade 8”.
Statistics by reporting category are averages for all students (across student groups and genders).
“Average percentage correct” is computed as follows: For each student, divide number of items correctly answered by total number of items in test section,
then average resulting percentages across all students. For short answers on EOC English tests, an “average rating” is presented; STAAR EOC short answers are
rated on a scale of 0 to 3. For written compositions on writing tests, “average score points” is presented. Additional details provided in report footnotes.
• Statistics for SSI grades 5 and 8 are based on scores cumulative through students' second administrations.
• STAAR statistics for years prior to 2016-17 include results from all STAAR tests (STAAR, STAAR A, and STAAR L) for comparability to statistics beginning 2016-17,
when STAAR A and STAAR L were discontinued.
STATE OF TEXAS ASSESSMENT OF ACADEMIC READINESS (STAAR)
• Performance standard labels have changed. “Approached Grade Level” is comparable to Level 2: Satisfactory (2015-16 standard). “Met Grade Level” is
equivalent to Level 2: Satisfactory (final standard). “Mastered Grade Level” is equivalent to Level 3: Advanced. Statistics for a performance level (such as
“Percentage Approached Grade Level” ) include all scores at or above that level.
•
•
Cells marked with an asterisk (*) indicate five or fewer students were tested. Blank cells indicate no students were tested.
Student group assignments are based on demographic data in the Dallas ISD student database.
• The district changed norm-referenced tests in 2015-16 to the TerraNova (English language) and SUPERA (Spanish language) assessments.
• Statistics in the SCE Compliance report are based on results from both TerraNova and SUPERA administrations.
STATE COMPENSATORY EDUCATION (SCE) COMPLIANCE and TERRANOVA/SUPERA
August 7, 2018 Dallas ISD Evaluation & Assessment (Office of Institutional Research) rpt_NOTES 2018-19 Data Packet
4JULIAN T. SALDIVAR ELEMENTARY SCHOOL (271)

3
Notes, Definitions, and Data DescriptionsNotes
•
• Raw scores on the ACPs (percentage of items correct) are scaled each year to maintain similar annual passing rates for the district.
ACPs are semester exams administered in grades K-12. Not all courses have ACPs. In secondary grades, ACP scores account for a portion of students' semester
grades (10% at middle and 15% at high). “Average course mark (no ACP)” is computed from semester grades before factoring in ACP scores. In elementary
grades, ACP results account for 5% of students' semester grades for core courses; course-grade statistics are not reported in packets for elementary grades.
• A scale score of at least 70% is required to pass an ACP. For grade levels with numeric grading, a course mark of at least 70% is required to pass a course.
Cells marked with an asterisk (*) indicate five or fewer students were tested. Blank cells indicate no students were tested.•
DALLAS ISD ASSESSMENTS OF COURSE PERFORMANCE (ACP)
• Statistics are computed separately for Semester 1 and Semester 2 tests; time of administration during the school year is not relevant. Results from tests
written for different school years are not combined.
August 7, 2018 Dallas ISD Evaluation & Assessment (Office of Institutional Research) rpt_NOTES 2018-19 Data Packet
5JULIAN T. SALDIVAR ELEMENTARY SCHOOL (271)

Summary 2017-18 Group Summary Statistics
Grade
STUDENT ENROLLMENT
Enrollment
PK 107
KN 99
1 91
2 95
3 121
4 82
5 93
ALL 688
STUDENT AND TEACHER RACE/ETHNICITY
Students
Number Percent Number PercentEthnicity/Race
Black/African American
American Indian/Alaska Native
Asian/Hawaiian/Pacific Islander
Hispanic
White
Multiple
9 1.3
1 0.1
1 0.1
672 97.7
4 0.6
8 19.5
26 63.4
5 12.2
2 4.9
* *
* *
1 0.1
SELECT STUDENT GROUP ENROLLMENT
Number PercentGroup
Economically disadvantaged
Limited English proficient (LEP)
Special education
668 97.1
587 85.3
43 6.3
*For teachers, “Other” category includes American Indican/Alaska Native and Asian/Hawaiian/Pacific Islander.
Not reported (students only) — —0 0.0
Other* (teachers only) 0 0.0— —
Talented and Gifted (TAG) 103 15.0
At-Risk 608 88.4
Teachers
August 7, 2018 Dallas ISD Evaluation & Assessment (Office of Institutional Research) rpt_SUMMARY 2018-19 Data Packet
6JULIAN T. SALDIVAR ELEMENTARY SCHOOL (271)
N %
Asian
%NN %%
Hispanic
N N %Grade Year
African American American Indian
Enrollment
White
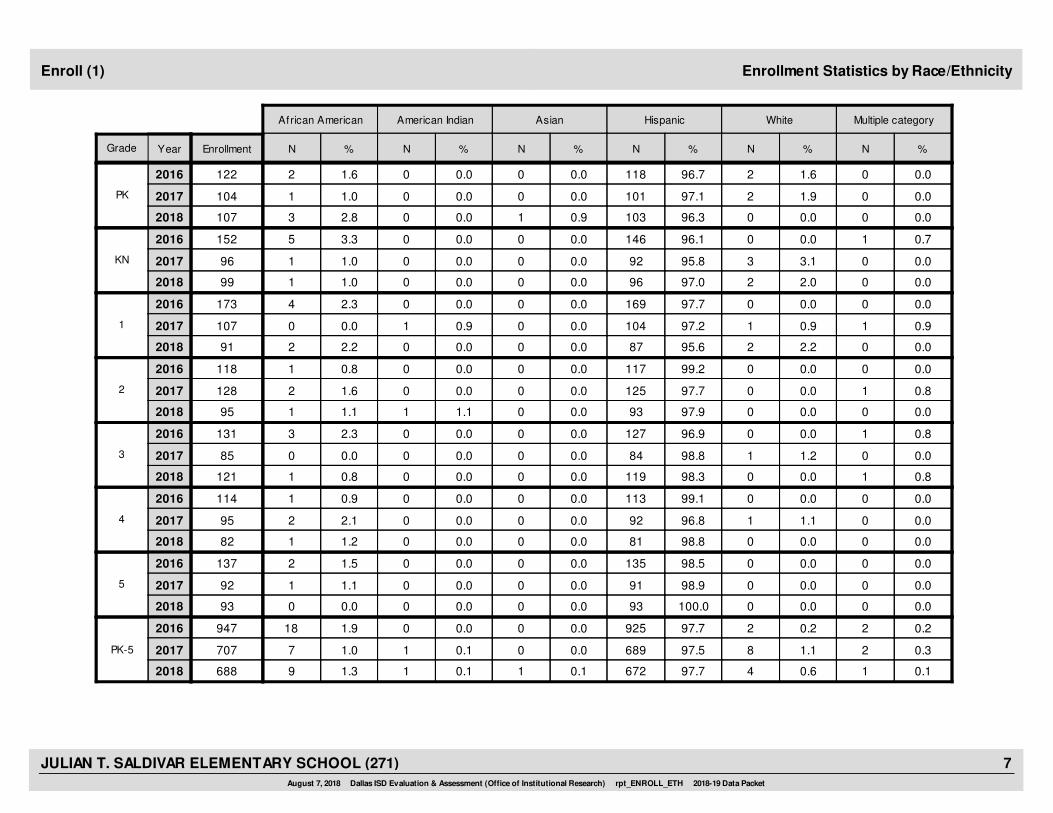
Enrollment Statistics by Race/EthnicityEnroll (1)
N %
Multiple category
2018
2016
2017
0.0
0.0
0.9
0
0
1
0.0
0.0
0.0
0
0
0
96.7
97.1
96.3
118
101
103
1.6
1.0
2.8
2
1
3
1.6
1.9
0.0
2
2
0
PK
107
104
122 0.0
0.0
0.0
0
0
0
2018
2016
2017
0.0
0.0
0.0
0
0
0
0.0
0.0
0.0
0
0
0
96.1
95.8
97.0
146
92
96
3.3
1.0
1.0
5
1
1
0.0
3.1
2.0
0
3
2
KN
99
96
152 0.7
0.0
0.0
1
0
0
2018
2016
2017
0.0
0.0
0.0
0
0
0
0.0
0.9
0.0
0
1
0
97.7
97.2
95.6
169
104
87
2.3
0.0
2.2
4
0
2
0.0
0.9
2.2
0
1
2
1
91
107
173 0.0
0.9
0.0
0
1
0
2018
2016
2017
0.0
0.0
0.0
0
0
0
0.0
0.0
1.1
0
0
1
99.2
97.7
97.9
117
125
93
0.8
1.6
1.1
1
2
1
0.0
0.0
0.0
0
0
0
2
95
128
118 0.0
0.8
0.0
0
1
0
2018
2016
2017
0.0
0.0
0.0
0
0
0
0.0
0.0
0.0
0
0
0
96.9
98.8
98.3
127
84
119
2.3
0.0
0.8
3
0
1
0.0
1.2
0.0
0
1
0
3
121
85
131 0.8
0.0
0.8
1
0
1
2018
2016
2017
0.0
0.0
0.0
0
0
0
0.0
0.0
0.0
0
0
0
99.1
96.8
98.8
113
92
81
0.9
2.1
1.2
1
2
1
0.0
1.1
0.0
0
1
0
4
82
95
114 0.0
0.0
0.0
0
0
0
2018
2016
2017
0.0
0.0
0.0
0
0
0
0.0
0.0
0.0
0
0
0
98.5
98.9
100.0
135
91
93
1.5
1.1
0.0
2
1
0
0.0
0.0
0.0
0
0
0
5
93
92
137 0.0
0.0
0.0
0
0
0
2018
2016
2017
0.0
0.0
0.1
0
0
1
0.0
0.1
0.1
0
1
1
97.7
97.5
97.7
925
689
672
1.9
1.0
1.3
18
7
9
0.2
1.1
0.6
2
8
4
PK-5
688
707
947 0.2
0.3
0.1
2
2
1
August 7, 2018 Dallas ISD Evaluation & Assessment (Office of Institutional Research) rpt_ENROLL_ETH 2018-19 Data Packet
7JULIAN T. SALDIVAR ELEMENTARY SCHOOL (271)
N %
At RIsk New (to District)
N %
TAG
N %
Economically
Disadvantaged
Grade Year
LEP Special Education
N % N % N %
Retention
Rate (%)Enrollment
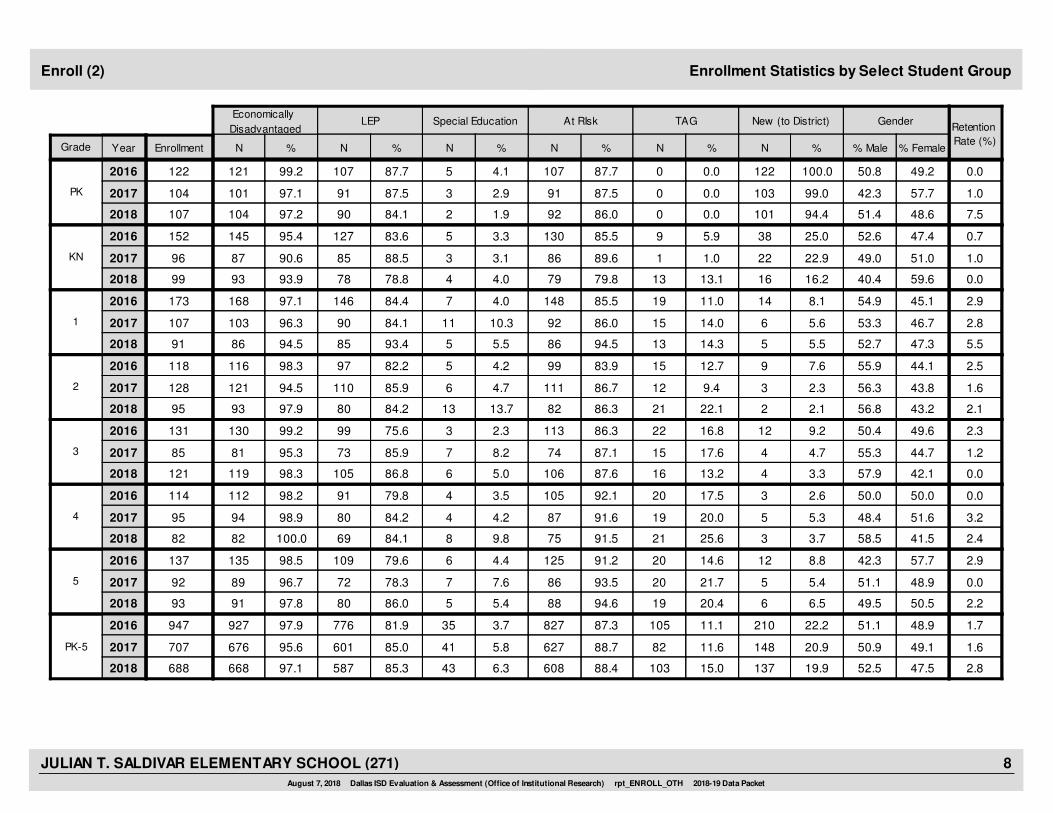
Enrollment Statistics by Select Student GroupEnroll (2)
Gender
% Male % Female
87.7
87.5
86.0
107
91
92
100.0
99.0
94.4
PK
2018 107
104
122 99.2
97.1
97.2
121
101
104
87.7
87.5
84.1
107
91
90
4.1
2.9
1.9
5
3
2
0.0
0.0
0.0
0
0
0
0.0
1.0
7.5
2016
2017
122
103
101
50.8
42.3
51.4
49.2
57.7
48.6
85.5
89.6
79.8
130
86
79
25.0
22.9
16.2
KN
2018 99
96
152 95.4
90.6
93.9
145
87
93
83.6
88.5
78.8
127
85
78
3.3
3.1
4.0
5
3
4
5.9
1.0
13.1
9
1
13
0.7
1.0
0.0
2016
2017
38
22
16
52.6
49.0
40.4
47.4
51.0
59.6
85.5
86.0
94.5
148
92
86
8.1
5.6
5.5
1
2018 91
107
173 97.1
96.3
94.5
168
103
86
84.4
84.1
93.4
146
90
85
4.0
10.3
5.5
7
11
5
11.0
14.0
14.3
19
15
13
2.9
2.8
5.5
2016
2017
14
6
5
54.9
53.3
52.7
45.1
46.7
47.3
83.9
86.7
86.3
99
111
82
7.6
2.3
2.1
2
2018 95
128
118 98.3
94.5
97.9
116
121
93
82.2
85.9
84.2
97
110
80
4.2
4.7
13.7
5
6
13
12.7
9.4
22.1
15
12
21
2.5
1.6
2.1
2016
2017
9
3
2
55.9
56.3
56.8
44.1
43.8
43.2
86.3
87.1
87.6
113
74
106
9.2
4.7
3.3
3
2018 121
85
131 99.2
95.3
98.3
130
81
119
75.6
85.9
86.8
99
73
105
2.3
8.2
5.0
3
7
6
16.8
17.6
13.2
22
15
16
2.3
1.2
0.0
2016
2017
12
4
4
50.4
55.3
57.9
49.6
44.7
42.1
92.1
91.6
91.5
105
87
75
2.6
5.3
3.7
4
2018 82
95
114 98.2
98.9
100.0
112
94
82
79.8
84.2
84.1
91
80
69
3.5
4.2
9.8
4
4
8
17.5
20.0
25.6
20
19
21
0.0
3.2
2.4
2016
2017
3
5
3
50.0
48.4
58.5
50.0
51.6
41.5
91.2
93.5
94.6
125
86
88
8.8
5.4
6.5
5
2018 93
92
137 98.5
96.7
97.8
135
89
91
79.6
78.3
86.0
109
72
80
4.4
7.6
5.4
6
7
5
14.6
21.7
20.4
20
20
19
2.9
0.0
2.2
2016
2017
12
5
6
42.3
51.1
49.5
57.7
48.9
50.5
87.3
88.7
88.4
827
627
608
22.2
20.9
19.9
PK-5
2018 688
707
947 97.9
95.6
97.1
927
676
668
81.9
85.0
85.3
776
601
587
3.7
5.8
6.3
35
41
43
11.1
11.6
15.0
105
82
103
1.7
1.6
2.8
2016
2017
210
148
137
51.1
50.9
52.5
48.9
49.1
47.5
August 7, 2018 Dallas ISD Evaluation & Assessment (Office of Institutional Research) rpt_ENROLL_OTH 2018-19 Data Packet
8JULIAN T. SALDIVAR ELEMENTARY SCHOOL (271)

Stability Rate
%
Continuously
Enrolled
N DistrictNN
Average Daily
MembershipAverage Daily Attendance Yearly Transactions
Grade Year N %District District N District % % District % District
Student Attendance StatisticsAttendance
87.1
88.9
95.3
128
91
92
10,883
9,830
10,240
30
9
12KN
2016 95.0140 20.4 19.3
2017
2018 94.997 8.8 17.8
96.093 12.4 19.6
12,185
11,061
11,388
95.5
95.1
95.6
11,638
10,520
10,888
89.3
88.9
89.9
147
102
97
91.9
87.4
88.9
160
84
97
12,066
10,347
11,169
30
9
201
2016 95.9167 17.2 18.1
2017
2018 95.792 9.4 16.6
95.4104 18.3 18.4
13,397
11,550
12,278
96.1
95.7
96.1
12,877
11,055
11,800
90.1
89.6
91.0
174
96
109
86.2
93.0
96.3
103
89
128
12,286
10,717
11,850
23
9
152
2016 96.0115 19.3 16.6
2017
2018 96.792 9.4 15.9
96.9129 11.3 16.9
13,532
11,864
12,938
96.6
96.1
96.4
13,066
11,398
12,476
90.8
90.3
91.6
119
96
133
84.7
95.1
93.1
112
116
82
12,216
11,431
12,162
23
7
63
2016 96.1127 17.4 15.3
2017
2018 97.0118 5.7 14.4
96.885 6.8 15.9
13,328
12,536
13,158
96.9
96.4
96.8
12,911
12,080
12,734
91.7
91.2
92.4
132
122
88
87.7
93.6
93.8
104
80
88
11,676
11,637
11,953
13
6
104
2016 96.7115 11.0 15.8
2017
2018 96.783 7.0 14.1
96.290 10.7 15.4
12,688
12,675
12,873
96.9
96.5
96.8
12,300
12,235
12,467
92.0
91.8
92.9
119
85
94
90.2
93.6
95.2
120
86
88
11,217
11,513
11,367
4
1
55
2016 96.9129 3.0 5.7
2017
2018 96.889 1.1 6.1
97.590 5.4 6.1
12,178
12,498
12,220
97.0
96.6
96.9
11,815
12,078
11,838
92.1
92.1
93.0
133
92
92
88.2
92.0
93.8
727
546
575
70,344
65,475
68,741
123
41
68KN-5
2016 96.1792 14.9 15.2
2017
2018 96.3572 6.9 14.0
96.5591 11.1 15.3
77,308
72,186
74,855
96.5
96.1
96.5
74,608
69,366
72,203
91.0
90.7
91.8
824
593
613
August 7, 2018 Dallas ISD Evaluation & Assessment (Office of Institutional Research) rpt_ATTENDANCE 2018-19 Data Packet
9JULIAN T. SALDIVAR ELEMENTARY SCHOOL (271)

Teacher StatisticsTeachers
0.0
Percentage
0Beginning (0)
191 - 5
76 - 10
1311 - 20
2More than 20
Years Number
80.5
60.7
48.3
2
75.631
24.410
4.9
63.426
19.58
12.25White
African American
Hispanic
Multiple
Male
Female
5.9
4.7
Number PercentageEthnicity/Race
DISTRIBUTIONS YEARS EXPERIENCE
Teachers: 41
7.9
Average Absences
RetentionRate
46.3
17.1
31.7
4.9
2015-16
2016-17
2017-18
Number PercentageGender
9.841
14.662
9.843
34.1141-3
9.844
2.415
27More than 3 65.9
0 0.0Other
ATTENDANCE / RETENTION
August 7, 2018 Dallas ISD Evaluation & Assessment (Office of Institutional Research) rpt_TEACHER 2018-19 Data Packet
10JULIAN T. SALDIVAR ELEMENTARY SCHOOL (271)

FemaleMigrant MaleAt RiskWhiteAfricanAmer
HispanicEcon
DisadvSpecialEduc
LEP All DistrictYearGradeNumber Tested(All Students)
State of Texas Assessment of Academic Readiness 3-8 (English): READING
PERCENTAGE APPROACHED GRADE LEVEL STANDARD
3-8 (EN) Read (1)
60.0 54.5
55.6 53.3
60.0 *
67.42018 * 63.2 55.0 * * 57.1 2183.3
3
58.12016 * 48.3 53.3 * * 54.5 3341.2
59.52017 * 69.2 71.4 * * 71.4 14*
66.7 *
36.4 53.3
55.6 60.0
61.92018 * 66.7 66.7 * * 68.8 1650.0
4
62.62016 * 48.0 46.2 * * 46.2 2631.3
56.42017 * * 50.0 55.6 * * 57.9 1936.4
88.9 100.0
68.8 94.4
80.0 72.7
76.02018 93.8 93.3 * * 93.8 1690.9
5
70.62016 * 81.8 80.0 * 77.8 82.4 3482.6
71.72017 * 71.4 72.7 * * 72.7 2271.4
71.0 72.7
55.6 68.8
65.5 72.0
68.72018 * 74.0 70.0 25.0 83.3 71.7 5374.1
3-5
63.92016 * 60.9 60.5 20.0 64.3 62.4 9355.4
62.72017 * * 64.0 66.7 50.0 85.7 67.3 5558.6
NUMBER TESTED IN GRADES 3-5
31 22
45 48
29 25
22,6102018 502 50 8 12 5327
22,5292016 875 86 10 14 9356
23,0842017 2 503 54 6 7 5529
August 7, 2018 Dallas ISD Evaluation & Assessment (Office of Institutional Research) rpt_STAAR38_E_read_per_app 2018-19 Data Packet
11JULIAN T. SALDIVAR ELEMENTARY SCHOOL (271)

FemaleMigrant MaleAt RiskWhiteAfricanAmer
HispanicEcon
DisadvSpecialEduc
LEP All DistrictYearGradeNumber Tested(All Students)
State of Texas Assessment of Academic Readiness 3-8 (English): READING
NUMBER NOT APPROACHED GRADE LEVEL STANDARD
3-8 (EN) Read (2)
4 5
8 7
4 *
2,3092018 * 7 9 * * 9 211
3
3,1142016 * 15 14 * * 15 3310
3,0142017 * 4 4 * * 4 14*
4 *
7 7
4 4
2,8112018 * 5 5 * * 5 165
4
2,7282016 * 13 14 * * 14 2611
3,3232017 * * 8 8 * * 8 197
1 0
5 1
2 3
1,9562018 1 1 * * 1 161
5
2,2942016 * 6 6 * 2 6 344
2,2692017 * 6 6 * * 6 224
9 6
20 15
10 7
7,0762018 * 13 15 6 2 15 537
3-5
8,1362016 * 34 34 8 5 35 9325
8,6062017 * * 18 18 3 1 18 5512
NUMBER TESTED IN GRADES 3-5
31 22
45 48
29 25
22,6102018 502 50 8 12 5327
22,5292016 875 86 10 14 9356
23,0842017 2 503 54 6 7 5529
August 7, 2018 Dallas ISD Evaluation & Assessment (Office of Institutional Research) rpt_STAAR38_E_read_num_not_app 2018-19 Data Packet
12JULIAN T. SALDIVAR ELEMENTARY SCHOOL (271)

FemaleMigrant MaleAt RiskWhiteAfricanAmer
HispanicEcon
DisadvSpecialEduc
LEP All DistrictYearGradeNumber Tested(All Students)
State of Texas Assessment of Academic Readiness 3-8 (English): READING
PERCENTAGE MET GRADE LEVEL STANDARD
3-8 (EN) Read (3)
30.0 18.2
27.8 6.7
40.0 *
33.62018 * 26.3 25.0 * * 23.8 2133.3
3
29.22016 * 20.7 20.0 * * 18.2 3311.8
32.92017 * 61.5 57.1 * * 57.1 14*
33.3 *
18.2 6.7
22.2 40.0
35.62018 * 40.0 46.7 * * 43.8 1610.0
4
28.62016 * 12.0 11.5 * * 11.5 2612.5
32.42017 * * 31.3 27.8 * * 31.6 199.1
66.7 42.9
43.8 61.1
40.0 27.3
44.12018 56.3 53.3 * * 56.3 1636.4
5
36.32016 * 54.5 50.0 * 55.6 52.9 3447.8
38.22017 * 33.3 31.8 * * 31.8 2228.6
41.9 36.4
31.1 27.1
34.5 44.0
38.02018 * 40.0 40.0 12.5 33.3 39.6 5325.9
3-5
31.42016 * 31.0 27.9 20.0 42.9 29.0 9326.8
34.62017 * * 40.0 37.0 16.7 42.9 38.2 5520.7
NUMBER TESTED IN GRADES 3-5
31 22
45 48
29 25
22,6102018 502 50 8 12 5327
22,5292016 875 86 10 14 9356
23,0842017 2 503 54 6 7 5529
August 7, 2018 Dallas ISD Evaluation & Assessment (Office of Institutional Research) rpt_STAAR38_E_read_per_met 2018-19 Data Packet
13JULIAN T. SALDIVAR ELEMENTARY SCHOOL (271)

FemaleMigrant MaleAt RiskWhiteAfricanAmer
HispanicEcon
DisadvSpecialEduc
LEP All DistrictYearGradeNumber Tested(All Students)
State of Texas Assessment of Academic Readiness 3-8 (English): READING
PERCENTAGE MASTERED GRADE LEVEL STANDARD
3-8 (EN) Read (4)
10.0 9.1
11.1 0.0
20.0 *
19.32018 * 10.5 10.0 * * 9.5 2116.7
3
15.22016 * 6.9 6.7 * * 6.1 330.0
20.02017 * 46.2 42.9 * * 42.9 14*
8.3 *
18.2 6.7
22.2 30.0
17.72018 * 13.3 20.0 * * 18.8 160.0
4
13.42016 * 12.0 11.5 * * 11.5 2612.5
16.92017 * * 25.0 22.2 * * 26.3 190.0
33.3 14.3
25.0 27.8
40.0 9.1
20.12018 25.0 20.0 * * 25.0 169.1
5
16.62016 * 27.3 30.0 * 33.3 26.5 3417.4
19.42017 * 23.8 22.7 * * 22.7 2221.4
16.1 18.2
17.8 12.5
27.6 32.0
19.12018 * 16.0 16.0 12.5 16.7 17.0 537.4
3-5
15.12016 * 16.1 16.3 10.0 28.6 15.1 9310.7
18.82017 * * 30.0 27.8 16.7 14.3 29.1 5510.3
NUMBER TESTED IN GRADE 3-5
31 22
45 48
29 25
22,6102018 502 50 8 12 5327
22,5292016 875 86 10 14 9356
23,0842017 2 503 54 6 7 5529
August 7, 2018 Dallas ISD Evaluation & Assessment (Office of Institutional Research) rpt_STAAR38_E_read_per_mst 2018-19 Data Packet
14JULIAN T. SALDIVAR ELEMENTARY SCHOOL (271)
1. Understanding Across Genres (GR 3-5)
1. Understanding/Analysis Across Genres (GR 6-8)
2. Understanding/Analysis
of Literary Texts
3. Understanding/Analysis
of Informational TextsYearGrade
REPORTING CATEGORY
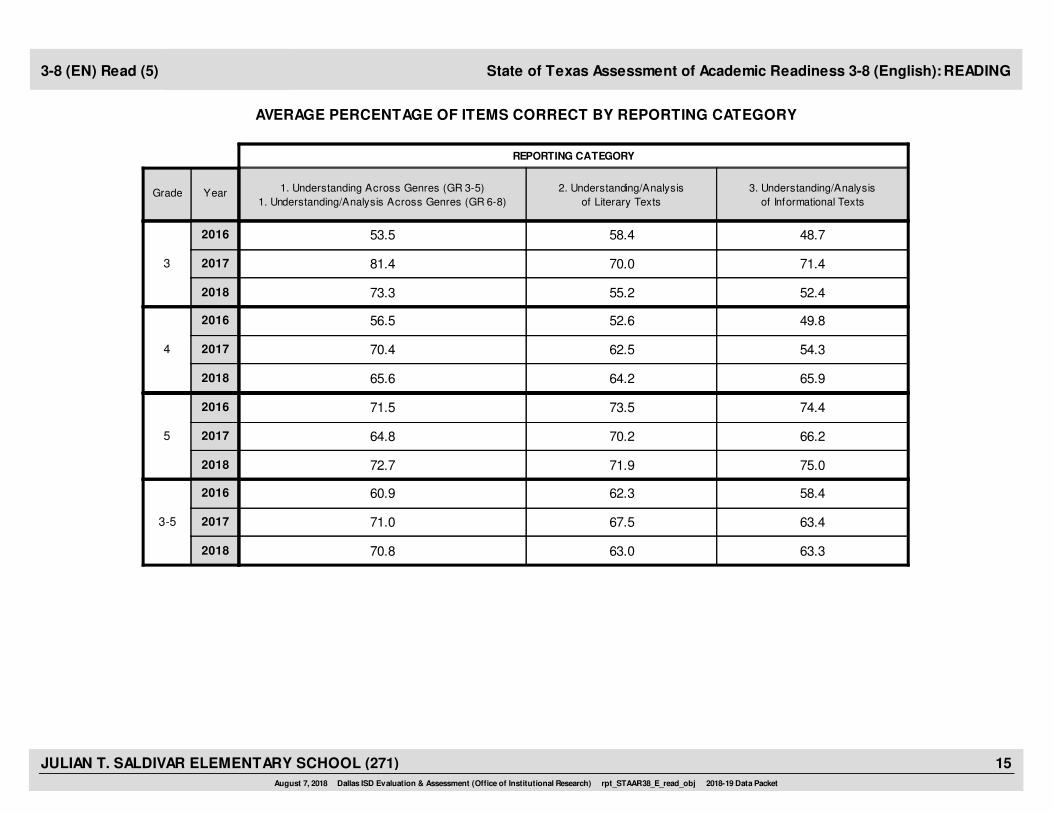
State of Texas Assessment of Academic Readiness 3-8 (English): READING
AVERAGE PERCENTAGE OF ITEMS CORRECT BY REPORTING CATEGORY
3-8 (EN) Read (5)
2018 73.3 55.2 52.4
2016 53.5 58.4 48.7
3 2017 81.4 70.0 71.4
2018 65.6 64.2 65.9
2016 56.5 52.6 49.8
4 2017 70.4 62.5 54.3
2018 72.7 71.9 75.0
2016 71.5 73.5 74.4
5 2017 64.8 70.2 66.2
2018 70.8 63.0 63.3
2016 60.9 62.3 58.4
3-5 2017 71.0 67.5 63.4
August 7, 2018 Dallas ISD Evaluation & Assessment (Office of Institutional Research) rpt_STAAR38_E_read_obj 2018-19 Data Packet
15JULIAN T. SALDIVAR ELEMENTARY SCHOOL (271)

FemaleMigrant MaleAt RiskWhiteAfricanAmer
HispanicEcon
DisadvSpecialEduc
LEP All DistrictYearGradeNumber Tested(All Students)
State of Texas Assessment of Academic Readiness 3-8 (English): WRITING
PERCENTAGE APPROACHED GRADE LEVEL STANDARD
3-8 (EN) Writing (1)
46.2 *
33.3 40.0
44.4 70.0
51.22018 * 50.0 56.3 * * 52.9 1727.3
4
57.32016 * 38.5 37.0 * * 37.0 2723.5
54.42017 * * 56.3 55.6 * * 57.9 1936.4
NUMBER TESTED IN GRADE 4
13 4
12 15
9 10
7,3612018 161 16 4 5 1711
7,2392016 261 27 3 4 2717
7,5302017 1 162 18 2 3 1911
August 7, 2018 Dallas ISD Evaluation & Assessment (Office of Institutional Research) rpt_STAAR38_E_write_per_app 2018-19 Data Packet
16JULIAN T. SALDIVAR ELEMENTARY SCHOOL (271)

FemaleMigrant MaleAt RiskWhiteAfricanAmer
HispanicEcon
DisadvSpecialEduc
LEP All DistrictYearGradeNumber Tested(All Students)
State of Texas Assessment of Academic Readiness 3-8 (English): WRITING
NUMBER NOT APPROACHED GRADE LEVEL STANDARD
3-8 (EN) Writing (2)
7 *
8 9
5 3
3,5892018 * 8 7 * * 8 178
4
3,0902016 * 16 17 * * 17 2713
3,4352017 * * 7 8 * * 8 197
NUMBER TESTED IN GRADE 4
13 4
12 15
9 10
7,3612018 161 16 4 5 1711
7,2392016 261 27 3 4 2717
7,5302017 1 162 18 2 3 1911
August 7, 2018 Dallas ISD Evaluation & Assessment (Office of Institutional Research) rpt_STAAR38_E_write_num_not_app 2018-19 Data Packet
17JULIAN T. SALDIVAR ELEMENTARY SCHOOL (271)

FemaleMigrant MaleAt RiskWhiteAfricanAmer
HispanicEcon
DisadvSpecialEduc
LEP All DistrictYearGradeNumber Tested(All Students)
State of Texas Assessment of Academic Readiness 3-8 (English): WRITING
PERCENTAGE MET GRADE LEVEL STANDARD
3-8 (EN) Writing (3)
38.5 *
16.7 6.7
33.3 20.0
29.22018 * 43.8 50.0 * * 47.1 1718.2
4
28.72016 * 11.5 11.1 * * 11.1 2711.8
26.02017 * * 18.8 22.2 * * 26.3 199.1
NUMBER TESTED IN GRADE 4
13 4
12 15
9 10
7,3612018 161 16 4 5 1711
7,2392016 261 27 3 4 2717
7,5302017 1 162 18 2 3 1911
August 7, 2018 Dallas ISD Evaluation & Assessment (Office of Institutional Research) rpt_STAAR38_E_write_per_met 2018-19 Data Packet
18JULIAN T. SALDIVAR ELEMENTARY SCHOOL (271)

FemaleMigrant MaleAt RiskWhiteAfricanAmer
HispanicEcon
DisadvSpecialEduc
LEP All DistrictYearGradeNumber Tested(All Students)
State of Texas Assessment of Academic Readiness 3-8 (English): WRITING
PERCENTAGE MASTERED GRADE LEVEL STANDARD
3-8 (EN) Writing (4)
0.0 *
16.7 6.7
0.0 10.0
7.12018 * 12.5 12.5 * * 11.8 170.0
4
10.92016 * 11.5 11.1 * * 11.1 2711.8
7.42017 * * 6.3 0.0 * * 5.3 190.0
NUMBER TESTED IN GRADE 4
13 4
12 15
9 10
7,3612018 161 16 4 5 1711
7,2392016 261 27 3 4 2717
7,5302017 1 162 18 2 3 1911
August 7, 2018 Dallas ISD Evaluation & Assessment (Office of Institutional Research) rpt_STAAR38_E_write_per_mst 2018-19 Data Packet
19JULIAN T. SALDIVAR ELEMENTARY SCHOOL (271)

1. Composition¹
GR 4: Expository
GR 7: Personal Narrative
1. Composition¹
GR 4: Personal Narrative
GR 7: Expository
2. Revision 3. EditingYearGrade
REPORTING CATEGORY
State of Texas Assessment of Academic Readiness 3-8 (English): WRITING
AVERAGE PERCENTAGE OF ITEMS CORRECT BY REPORTING CATEGORY
3-8 (EN) Writing (5)
3.4
3.1
3.6
2018 –– 50.0 68.4
2016 –– 50.0 45.4
4 2017 –– 65.8 57.6
¹Average score points (range 0-8). A composition is rated tw ice on a scale of 1 to 4, and the ratings are summed to determine score points for the composition. Score point scale: 0=Nonscorable; 2=Very Limited; 3=betw een Very
Limited and Basic; 4=Basic; 5=betw een Basic and Satisfactory; 6=Satisfactory; 7=betw een Satisfactory and Accomplished; 8=Accomplished
NOTE: Beginning in 2016, only one composition w as required.
August 7, 2018 Dallas ISD Evaluation & Assessment (Office of Institutional Research) rpt_STAAR38_E_write_obj 2018-19 Data Packet
20JULIAN T. SALDIVAR ELEMENTARY SCHOOL (271)

FemaleMigrant MaleAt RiskWhiteAfricanAmer
HispanicEcon
DisadvSpecialEduc
LEP All DistrictYearGradeNumber Tested(All Students)
State of Texas Assessment of Academic Readiness 3-8 (English): MATHEMATICS
PERCENTAGE APPROACHED GRADE LEVEL STANDARD
3-8 (EN) Math (1)
89.9 92.2
61.5 73.8
85.1 76.3
74.52018 * 91.5 90.9 * 91.3 90.8 12090.5
3
65.32016 * 68.3 70.6 * 67.7 67.7 13065.8
70.02017 * 81.0 81.8 * 78.1 81.2 8578.4
83.3 88.2
51.8 55.2
58.7 69.4
75.22018 * 85.2 85.1 42.9 85.5 85.4 8284.0
4
63.52016 * 54.0 56.0 * 57.1 53.5 11451.9
68.12017 * * 66.3 64.0 * 67.9 64.2 9564.0
80.0 78.7
* 71.9 72.0
80.9 86.4
86.92018 79.3 82.4 * 78.5 79.3 9278.2
5
79.62016 * 71.8 71.2 * 69.2 72.0 13270.2
80.62017 * 83.5 81.8 * 82.9 82.6 9283.1
85.2 86.4
* 61.8 67.7
75.0 77.1
78.82018 * 85.9 86.6 37.5 85.7 85.7 29484.6
3-5
69.32016 * 65.1 66.3 18.2 65.0 64.9 37663.1
72.72017 * * 76.8 75.6 45.5 76.0 75.7 27274.9
162 132
3 178 198
140 131
36,3182018 2912 269 16 252 294267
36,9592016 3705 353 11 297 376243
NUMBER TESTED IN GRADES 3-5
37,2782017 2 2673 254 11 221 272243
August 7, 2018 Dallas ISD Evaluation & Assessment (Office of Institutional Research) rpt_STAAR38_E_math_per_app 2018-19 Data Packet
21JULIAN T. SALDIVAR ELEMENTARY SCHOOL (271)

FemaleMigrant MaleAt RiskWhiteAfricanAmer
HispanicEcon
DisadvSpecialEduc
LEP All DistrictYearGradeNumber Tested(All Students)
State of Texas Assessment of Academic Readiness 3-8 (English): MATHEMATICS
NUMBER NOT APPROACHED GRADE LEVEL STANDARD
3-8 (EN) Math (2)
7 4
25 17
7 9
3,0722018 * 10 10 * 9 11 12010
3
4,4782016 * 40 35 * 32 42 13039
3,8512017 * 16 14 * 16 16 8516
8 4
27 26
19 15
3,0282018 * 12 11 4 10 12 8212
4
4,4632016 * 52 48 * 39 53 11450
4,0162017 * * 31 32 * 25 34 9531
9 10
* 16 21
9 6
1,5822018 19 15 * 17 19 9219
5
2,4122016 * 37 36 * 33 37 13236
2,3082017 * 15 16 * 12 16 9214
24 18
* 68 64
35 30
7,6822018 * 41 36 10 36 42 29441
3-5
11,3532016 * 129 119 9 104 132 376125
10,1752017 * * 62 62 6 53 66 27261
NUMBER TESTED IN GRADES 3-5
162 132
3 178 198
140 131
36,3182018 2912 269 16 252 294267
36,9592016 3705 353 11 297 376243
37,2782017 2 2673 254 11 221 272243
August 7, 2018 Dallas ISD Evaluation & Assessment (Office of Institutional Research) rpt_STAAR38_E_math_num_not_app 2018-19 Data Packet
22JULIAN T. SALDIVAR ELEMENTARY SCHOOL (271)

FemaleMigrant MaleAt RiskWhiteAfricanAmer
HispanicEcon
DisadvSpecialEduc
LEP All DistrictYearGradeNumber Tested(All Students)
State of Texas Assessment of Academic Readiness 3-8 (English): MATHEMATICS
PERCENTAGE MET GRADE LEVEL STANDARD
3-8 (EN) Math (3)
50.7 60.8
23.1 43.1
59.6 50.0
41.82018 * 55.1 54.5 * 54.8 55.0 12054.3
3
32.62016 * 33.3 34.5 * 32.3 33.1 13030.7
39.92017 * 54.8 55.8 * 49.3 55.3 8548.6
60.4 61.8
28.6 24.1
37.0 40.8
44.22018 * 60.5 60.8 14.3 60.9 61.0 8257.3
4
28.92016 * 26.5 27.5 * 28.6 26.3 11426.0
39.42017 * * 40.2 39.3 * 43.6 38.9 9539.5
44.4 53.2
* 19.3 30.7
46.8 50.0
53.82018 48.9 50.6 * 50.6 48.9 9247.1
5
35.32016 * 26.0 25.6 * 21.5 25.8 13221.5
42.42017 * 48.4 48.9 * 48.6 47.8 9245.8
51.9 58.3
* 23.6 32.8
47.9 46.6
46.62018 * 54.6 55.0 6.3 55.2 54.8 29452.8
3-5
32.32016 * 28.6 29.2 9.1 27.3 28.5 37626.0
40.52017 * * 47.6 47.6 18.2 47.1 47.1 27244.4
162 132
3 178 198
140 131
36,3182018 2912 269 16 252 294267
36,9592016 3705 353 11 297 376339
NUMBER TESTED IN GRADES 3-5
37,2782017 2 2673 254 11 221 272243
August 7, 2018 Dallas ISD Evaluation & Assessment (Office of Institutional Research) rpt_STAAR38_E_math_per_met 2018-19 Data Packet
23JULIAN T. SALDIVAR ELEMENTARY SCHOOL (271)

FemaleMigrant MaleAt RiskWhiteAfricanAmer
HispanicEcon
DisadvSpecialEduc
LEP All DistrictYearGradeNumber Tested(All Students)
State of Texas Assessment of Academic Readiness 3-8 (English): MATHEMATICS
PERCENTAGE MASTERED GRADE LEVEL STANDARD
3-8 (EN) Math (4)
34.8 35.3
12.3 16.9
27.7 31.6
19.62018 * 35.6 35.5 * 36.5 35.0 12036.2
3
12.52016 * 15.1 16.0 * 14.1 14.6 13014.0
19.92017 * 29.8 29.9 * 21.9 29.4 8521.6
25.0 35.3
19.6 10.3
19.6 18.4
23.82018 * 28.4 32.4 0.0 26.1 29.3 8224.0
4
14.62016 * 15.0 15.6 * 17.6 14.9 11416.3
22.12017 * * 19.6 19.1 * 23.1 18.9 9520.9
22.2 38.3
* 5.3 2.7
29.8 20.5
27.62018 30.4 32.9 * 31.6 30.4 9228.7
5
13.92016 * 3.8 4.0 * 2.8 3.8 1322.5
19.32017 * 25.3 26.1 * 25.7 25.0 9224.1
28.4 36.4
* 12.4 9.6
25.7 22.9
23.72018 * 32.0 33.8 0.0 32.1 32.0 29430.3
3-5
13.62016 * 11.1 11.6 9.1 11.1 10.9 37610.6
20.42017 * * 24.7 24.8 9.1 23.5 24.3 27222.2
NUMBER TESTED IN GRADE 3-5
162 132
3 178 198
140 131
36,3182018 2912 269 16 252 294267
36,9592016 3705 353 11 297 376339
37,2782017 2 2673 254 11 221 272243
August 7, 2018 Dallas ISD Evaluation & Assessment (Office of Institutional Research) rpt_STAAR38_E_math_per_mst 2018-19 Data Packet
24JULIAN T. SALDIVAR ELEMENTARY SCHOOL (271)

1. Numerical Representations and
Relationships
2. Computations and Algebraic Relationships
3. Geometry andMeasurement
4. Data Analysis and Personal Financial
Literacy
YearGrade
REPORTING CATEGORY
State of Texas Assessment of Academic Readiness 3-8 (English): MATHEMATICS
AVERAGE PERCENTAGE OF ITEMS CORRECT BY REPORTING CATEGORY
3-8 (EN) Math (5)
2018 80.9 71.6 68.2 81.0
2016 63.7 60.0 66.6 62.8
3 2017 67.9 72.9 64.7 71.5
2018 74.1 70.3 70.5 70.4
2016 64.0 53.6 45.6 51.6
4 2017 72.0 56.1 53.1 58.4
2018 65.8 65.6 65.7 69.0
2016 57.1 55.0 59.7 60.1
5 2017 69.7 68.0 67.3 62.8
2018 74.3 69.4 68.1 74.3
2016 61.5 56.3 57.8 58.5
3-5 2017 70.0 65.3 61.5 64.0
August 7, 2018 Dallas ISD Evaluation & Assessment (Office of Institutional Research) rpt_STAAR38_E_math_obj 2018-19 Data Packet
25JULIAN T. SALDIVAR ELEMENTARY SCHOOL (271)

FemaleMigrant MaleAt RiskWhiteAfricanAmer
HispanicEcon
DisadvSpecialEduc
LEP All DistrictYearGradeNumber Tested(All Students)
State of Texas Assessment of Academic Readiness 3-8 (English): SCIENCE
PERCENTAGE APPROACHED GRADE LEVEL STANDARD
3-8 (EN) Science (1)
69.6 70.2
* 74.5 58.4
73.3 65.9
68.82018 69.9 72.1 * 71.3 69.9 9368.2
5
66.12016 * 65.4 64.2 33.3 64.2 65.2 13264.5
65.92017 * 70.5 72.9 * 69.6 69.7 8969.5
NUMBER TESTED IN GRADE 5
46 47
2 55 77
45 44
10,2712018 93 86 4 80 9388
9,6262016 1302 123 6 106 132121
9,7592017 881 85 5 69 8982
August 7, 2018 Dallas ISD Evaluation & Assessment (Office of Institutional Research) rpt_STAAR38_E_sc_per_app 2018-19 Data Packet
26JULIAN T. SALDIVAR ELEMENTARY SCHOOL (271)

FemaleMigrant MaleAt RiskWhiteAfricanAmer
HispanicEcon
DisadvSpecialEduc
LEP All DistrictYearGradeNumber Tested(All Students)
State of Texas Assessment of Academic Readiness 3-8 (English): SCIENCE
NUMBER NOT APPROACHED GRADE LEVEL STANDARD
3-8 (EN) Science (2)
14 14
* 14 32
12 15
32082018 28 24 * 23 28 9328
5
32632016 * 45 44 4 38 46 13243
33282017 * 26 23 * 21 27 8925
NUMBER TESTED IN GRADE 5
46 47
2 55 77
45 44
10,2712018 93 86 4 80 9388
9,6262016 1302 123 6 106 132121
9,7592017 881 85 5 69 8982
August 7, 2018 Dallas ISD Evaluation & Assessment (Office of Institutional Research) rpt_STAAR38_E_sc_num_not_app 2018-19 Data Packet
27JULIAN T. SALDIVAR ELEMENTARY SCHOOL (271)

FemaleMigrant MaleAt RiskWhiteAfricanAmer
HispanicEcon
DisadvSpecialEduc
LEP All DistrictYearGradeNumber Tested(All Students)
State of Texas Assessment of Academic Readiness 3-8 (English): SCIENCE
PERCENTAGE MET GRADE LEVEL STANDARD
3-8 (EN) Science (3)
26.1 42.6
* 38.2 18.2
57.8 36.4
32.62018 34.4 37.2 * 36.3 34.4 9333.0
5
26.72016 * 26.9 26.0 16.7 23.6 26.5 13224.0
33.02017 * 47.7 49.4 * 47.8 47.2 8945.1
NUMBER TESTED IN GRADE 5
46 47
2 55 77
45 44
10,2712018 93 86 4 80 9388
9,6262016 1302 123 6 106 132121
9,7592017 881 85 5 69 8982
August 7, 2018 Dallas ISD Evaluation & Assessment (Office of Institutional Research) rpt_STAAR38_E_sc_per_met 2018-19 Data Packet
28JULIAN T. SALDIVAR ELEMENTARY SCHOOL (271)

FemaleMigrant MaleAt RiskWhiteAfricanAmer
HispanicEcon
DisadvSpecialEduc
LEP All DistrictYearGradeNumber Tested(All Students)
State of Texas Assessment of Academic Readiness 3-8 (English): SCIENCE
PERCENTAGE MASTERED GRADE LEVEL STANDARD
3-8 (EN) Science (4)
10.9 17.0
* 7.3 2.6
33.3 6.8
12.12018 14.0 15.1 * 15.0 14.0 9313.6
5
6.72016 * 4.6 4.9 16.7 5.7 4.5 1325.0
12.82017 * 20.5 21.2 * 20.3 20.2 8919.5
NUMBER TESTED IN GRADE 5
46 47
2 55 77
45 44
10,2712018 93 86 4 80 9388
9,6262016 1302 123 6 106 132121
9,7592017 881 85 5 69 8982
August 7, 2018 Dallas ISD Evaluation & Assessment (Office of Institutional Research) rpt_STAAR38_E_sc_per_mst 2018-19 Data Packet
29JULIAN T. SALDIVAR ELEMENTARY SCHOOL (271)

1. Matter and Energy2. Force, Motion,
and Energy3. Earth and Space
4. Organisms and
EnvironmentsYearGrade
REPORTING CATEGORY
State of Texas Assessment of Academic Readiness 3-8 (English): SCIENCE
AVERAGE PERCENTAGE OF ITEMS CORRECT BY REPORTING CATEGORY
3-8 (EN) Science (5)
2018 62.9 65.9 63.5 67.8
2016 64.4 63.7 64.6 65.8
5 2017 64.2 65.2 75.3 70.1
August 7, 2018 Dallas ISD Evaluation & Assessment (Office of Institutional Research) rpt_STAAR38_E_sc_obj 2018-19 Data Packet
30JULIAN T. SALDIVAR ELEMENTARY SCHOOL (271)

FemaleMigrant MaleAt RiskWhiteAfricanAmer
HispanicEcon
DisadvSpecialEduc
LEP All DistrictYearGradeNumber Tested(All Students)
State of Texas Assessment of Academic Readiness 3-8 (Spanish): READING
PERCENTAGE APPROACHED GRADE LEVEL STANDARD
3-8 (SP) Read (1)
69.5 85.0
46.8 66.0
58.3 64.7
76.62018 75.8 74.4 * 75.8 75.8 9975.8
3
66.02016 56.7 58.4 56.7 56.7 9756.7
66.02017 61.4 61.3 * 60.9 61.4 7060.9
52.8 73.3
47.8 44.2
54.1 74.4
68.22018 62.1 57.6 * 61.5 62.1 6661.5
4
61.22016 46.1 45.8 * 46.1 46.1 8946.1
64.22017 64.5 64.8 * 64.0 64.5 7664.0
77.8 92.5
* 75.6 86.4
89.2 90.9
88.12018 85.5 85.7 * 85.5 85.5 7685.3
5
79.12016 82.0 82.3 82.0 82.0 10082.0
87.32017 90.0 89.4 * 89.9 90.0 7089.9
67.2 84.5
* 56.0 67.8
67.3 76.4
77.02018 75.1 73.5 25.0 75.0 75.1 24174.9
3-5
68.02016 62.2 63.1 * 62.2 62.2 28662.2
71.32017 71.8 71.9 * 71.4 71.8 21671.4
NUMBER TESTED IN GRADES 3-5
131 110
3 134 152
110 106
14,2422018 241 219 8 240 241239
14,8792016 286 268 1 286 286286
14,7622017 216 199 4 213 216213
August 7, 2018 Dallas ISD Evaluation & Assessment (Office of Institutional Research) rpt_STAAR38_S_read_per_app 2018-19 Data Packet
31JULIAN T. SALDIVAR ELEMENTARY SCHOOL (271)

FemaleMigrant MaleAt RiskWhiteAfricanAmer
HispanicEcon
DisadvSpecialEduc
LEP All DistrictYearGradeNumber Tested(All Students)
State of Texas Assessment of Academic Readiness 3-8 (Spanish): READING
NUMBER NOT APPROACHED GRADE LEVEL STANDARD
3-8 (SP) Read (2)
18 6
25 17
15 12
1,2052018 24 23 * 24 24 9924
3
1,9052016 42 37 42 42 9742
1,8872017 27 24 * 27 27 7027
17 8
24 24
17 10
1,5812018 25 25 * 25 25 6625
4
1,9742016 48 45 * 48 48 8948
1,8302017 27 25 * 27 27 7627
8 3
* 10 8
4 3
4882018 11 10 * 11 11 7611
5
8762016 18 17 18 18 10018
5212017 7 7 * 7 7 707
43 17
* 59 49
36 25
3,2742018 60 58 6 60 60 24160
3-5
4,7552016 108 99 * 108 108 286108
4,2382017 61 56 * 61 61 21661
NUMBER TESTED IN GRADES 3-5
131 110
3 134 152
110 106
14,2422018 241 219 8 240 241239
14,8792016 286 268 1 286 286286
14,7622017 216 199 4 213 216213
August 7, 2018 Dallas ISD Evaluation & Assessment (Office of Institutional Research) rpt_STAAR38_S_read_num_not_app 2018-19 Data Packet
32JULIAN T. SALDIVAR ELEMENTARY SCHOOL (271)

FemaleMigrant MaleAt RiskWhiteAfricanAmer
HispanicEcon
DisadvSpecialEduc
LEP All DistrictYearGradeNumber Tested(All Students)
State of Texas Assessment of Academic Readiness 3-8 (Spanish): READING
PERCENTAGE MET GRADE LEVEL STANDARD
3-8 (SP) Read (3)
42.4 57.5
17.0 38.0
33.3 44.1
45.32018 48.5 48.9 * 48.5 48.5 9948.5
3
36.92016 27.8 30.3 27.8 27.8 9727.8
39.22017 38.6 38.7 * 37.7 38.6 7037.7
30.6 56.7
32.6 30.2
29.7 53.8
36.92018 42.4 37.3 * 41.5 42.4 6641.5
4
35.52016 31.5 32.5 * 31.5 31.5 8931.5
36.02017 42.1 42.3 * 41.3 42.1 7641.3
63.9 77.5
* 41.5 47.5
56.8 60.6
62.62018 71.1 71.4 * 71.1 71.1 7670.7
5
43.32016 45.0 44.8 45.0 45.0 10045.0
49.12017 58.6 57.6 * 58.0 58.6 7058.0
45.0 64.5
* 29.9 39.5
40.0 52.8
47.42018 53.9 53.0 0.0 53.8 53.9 24153.6
3-5
38.22016 35.0 36.2 * 35.0 35.0 28635.0
40.82017 46.3 46.2 * 45.5 46.3 21645.5
NUMBER TESTED IN GRADES 3-5
131 110
3 134 152
110 106
14,2422018 241 219 8 240 241239
14,8792016 286 268 1 286 286286
14,7622017 216 199 4 213 216213
August 7, 2018 Dallas ISD Evaluation & Assessment (Office of Institutional Research) rpt_STAAR38_S_read_per_met 2018-19 Data Packet
33JULIAN T. SALDIVAR ELEMENTARY SCHOOL (271)

FemaleMigrant MaleAt RiskWhiteAfricanAmer
HispanicEcon
DisadvSpecialEduc
LEP All DistrictYearGradeNumber Tested(All Students)
State of Texas Assessment of Academic Readiness 3-8 (Spanish): READING
PERCENTAGE MASTERED GRADE LEVEL STANDARD
3-8 (SP) Read (4)
22.0 37.5
10.6 16.0
16.7 32.4
24.12018 28.3 28.9 * 28.3 28.3 9928.3
3
21.42016 13.4 14.6 13.4 13.4 9713.4
25.42017 24.3 24.2 * 23.2 24.3 7023.2
11.1 20.0
15.2 16.3
10.8 28.2
18.42018 15.2 16.9 * 13.8 15.2 6613.8
4
16.62016 15.7 16.9 * 15.7 15.7 8915.7
17.32017 19.7 18.3 * 18.7 19.7 7618.7
25.0 50.0
* 14.6 11.9
48.6 36.4
30.52018 38.2 40.0 * 38.2 38.2 7638.7
5
13.62016 13.0 12.5 13.0 13.0 10013.0
22.72017 42.9 40.9 * 42.0 42.9 7042.0
19.8 37.3
* 13.4 14.5
25.5 32.1
24.02018 27.8 29.2 0.0 27.5 27.8 24127.6
3-5
17.52016 14.0 14.6 * 14.0 14.0 28614.0
21.92017 28.7 27.6 * 27.7 28.7 21627.7
NUMBER TESTED IN GRADE 3-5
131 110
3 134 152
110 106
14,2422018 241 219 8 240 241239
14,8792016 286 268 1 286 286286
14,7622017 216 199 4 213 216213
August 7, 2018 Dallas ISD Evaluation & Assessment (Office of Institutional Research) rpt_STAAR38_S_read_per_mst 2018-19 Data Packet
34JULIAN T. SALDIVAR ELEMENTARY SCHOOL (271)
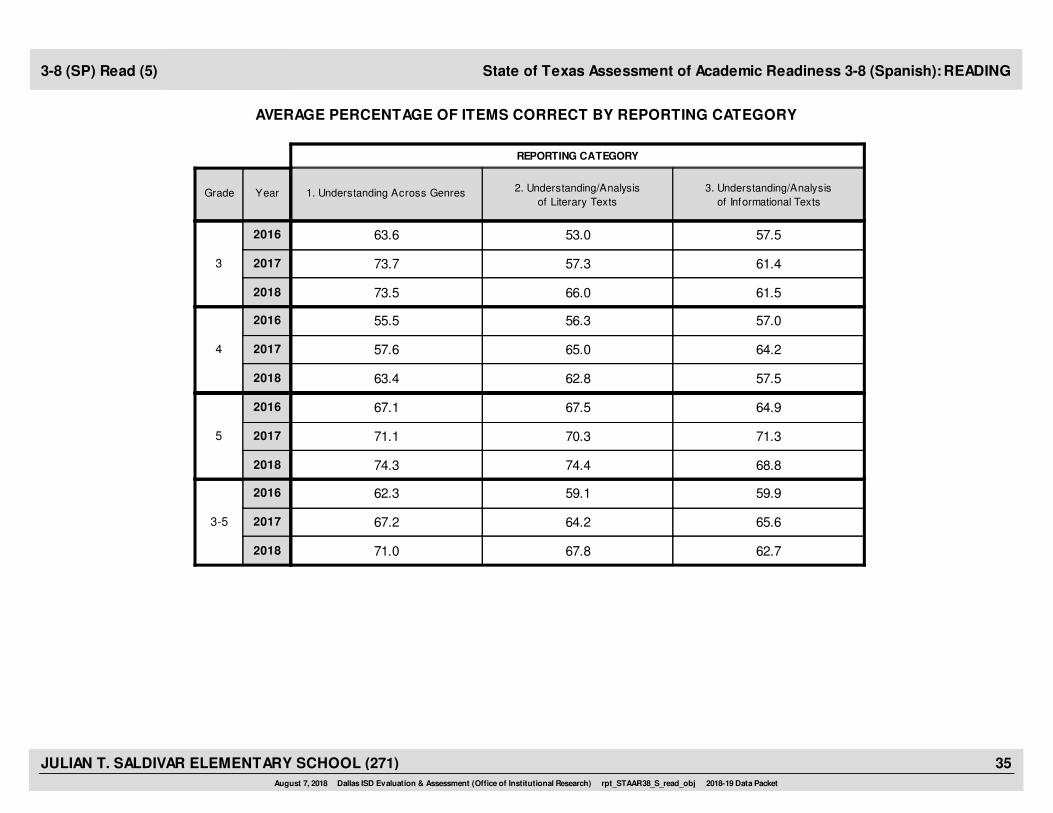
1. Understanding Across Genres 2. Understanding/Analysis
of Literary Texts
3. Understanding/Analysis
of Informational TextsYearGrade
REPORTING CATEGORY
State of Texas Assessment of Academic Readiness 3-8 (Spanish): READING
AVERAGE PERCENTAGE OF ITEMS CORRECT BY REPORTING CATEGORY
3-8 (SP) Read (5)
2018 73.5 66.0 61.5
2016 63.6 53.0 57.5
3 2017 73.7 57.3 61.4
2018 63.4 62.8 57.5
2016 55.5 56.3 57.0
4 2017 57.6 65.0 64.2
2018 74.3 74.4 68.8
2016 67.1 67.5 64.9
5 2017 71.1 70.3 71.3
2018 71.0 67.8 62.7
2016 62.3 59.1 59.9
3-5 2017 67.2 64.2 65.6
August 7, 2018 Dallas ISD Evaluation & Assessment (Office of Institutional Research) rpt_STAAR38_S_read_obj 2018-19 Data Packet
35JULIAN T. SALDIVAR ELEMENTARY SCHOOL (271)

FemaleMigrant MaleAt RiskWhiteAfricanAmer
HispanicEcon
DisadvSpecialEduc
LEP All DistrictYearGradeNumber Tested(All Students)
State of Texas Assessment of Academic Readiness 3-8 (Spanish): WRITING
PERCENTAGE APPROACHED GRADE LEVEL STANDARD
3-8 (SP) Writing (1)
61.8 83.3
63.0 77.3
56.8 74.4
71.02018 71.9 68.4 * 71.4 71.9 6471.4
4
71.72016 69.7 71.4 69.7 70.0 9069.7
70.32017 65.8 63.4 * 65.3 65.8 7665.3
NUMBER TESTED IN GRADE 4
34 30
46 44
37 39
4,9772018 64 57 3 63 6463
5,1162016 89 84 89 9089
5,2072017 76 71 1 75 7675
August 7, 2018 Dallas ISD Evaluation & Assessment (Office of Institutional Research) rpt_STAAR38_S_write_per_app 2018-19 Data Packet
36JULIAN T. SALDIVAR ELEMENTARY SCHOOL (271)

FemaleMigrant MaleAt RiskWhiteAfricanAmer
HispanicEcon
DisadvSpecialEduc
LEP All DistrictYearGradeNumber Tested(All Students)
State of Texas Assessment of Academic Readiness 3-8 (Spanish): WRITING
NUMBER NOT APPROACHED GRADE LEVEL STANDARD
3-8 (SP) Writing (2)
13 5
17 10
16 10
1,4442018 18 18 * 18 18 6418
4
1,4492016 27 24 27 27 9027
1,5482017 26 26 * 26 26 7626
NUMBER TESTED IN GRADE 4
34 30
46 44
37 39
4,9772018 64 57 3 63 6463
5,1162016 89 84 89 9089
5,2072017 76 71 1 75 7675
August 7, 2018 Dallas ISD Evaluation & Assessment (Office of Institutional Research) rpt_STAAR38_S_write_num_not_app 2018-19 Data Packet
JULIAN T. SALDIVAR ELEMENTARY SCHOOL (271) 37

FemaleMigrant MaleAt RiskWhiteAfricanAmer
HispanicEcon
DisadvSpecialEduc
LEP All DistrictYearGradeNumber Tested(All Students)
State of Texas Assessment of Academic Readiness 3-8 (Spanish): WRITING
PERCENTAGE MET GRADE LEVEL STANDARD
3-8 (SP) Writing (3)
41.2 53.3
41.3 54.5
27.0 48.7
44.92018 46.9 45.6 * 46.0 46.9 6446.0
4
49.12016 48.3 48.8 48.3 47.8 9048.3
44.42017 38.2 38.0 * 37.3 38.2 7637.3
NUMBER TESTED IN GRADE 4
34 30
46 44
37 39
4,9772018 64 57 3 63 6463
5,1162016 89 84 89 9089
5,2072017 76 71 1 75 7675
August 7, 2018 Dallas ISD Evaluation & Assessment (Office of Institutional Research) rpt_STAAR38_S_write_per_met 2018-19 Data Packet
38JULIAN T. SALDIVAR ELEMENTARY SCHOOL (271)

FemaleMigrant MaleAt RiskWhiteAfricanAmer
HispanicEcon
DisadvSpecialEduc
LEP All DistrictYearGradeNumber Tested(All Students)
State of Texas Assessment of Academic Readiness 3-8 (Spanish): WRITING
PERCENTAGE MASTERED GRADE LEVEL STANDARD
3-8 (SP) Writing (4)
17.6 33.3
19.6 25.0
10.8 28.2
19.02018 25.0 26.3 * 23.8 25.0 6423.8
4
21.92016 22.5 23.8 22.5 22.2 9022.5
14.42017 19.7 21.1 * 20.0 19.7 7620.0
NUMBER TESTED IN GRADE 4
34 30
46 44
37 39
4,9772018 64 57 3 63 6463
5,1162016 89 84 89 9089
5,2072017 76 71 1 75 7675
August 7, 2018 Dallas ISD Evaluation & Assessment (Office of Institutional Research) rpt_STAAR38_S_write_per_mst 2018-19 Data Packet
39JULIAN T. SALDIVAR ELEMENTARY SCHOOL (271)

1. Composition
Expository¹
1. Composition
Personal Narrative¹2. Revision 3. EditingYearGrade
REPORTING CATEGORY
State of Texas Assessment of Academic Readiness 3-8 (Spanish): WRITING
AVERAGE PERCENTAGE OF ITEMS CORRECT BY REPORTING CATEGORY
3-8 (SP) Writing (5)
4.6
4.5
4.0
2018 –– 66.0 71.1
2016 –– 62.4 68.4
4 2017 –– 58.9 65.5
¹Average score points (range 0-8). A STAAR composition is rated tw ice on a scale of 1 to 4, and the ratings are
summed to determine score points for the composition. Score point scale: 0=Nonscorable; 2=Very Limited; 3=betw een
Very Limited and Basic; 4=Basic; 5=betw een Basic and Satisfactory; 6=Satisfactory; 7=betw een Satisfactory and
Accomplished; 8=Accomplished
NOTE: Beginning in 2016, only one composition w as required.
August 7, 2018 Dallas ISD Evaluation & Assessment (Office of Institutional Research) rpt_STAAR38_S_write_obj 2018-19 Data Packet
40JULIAN T. SALDIVAR ELEMENTARY SCHOOL (271)

PERCENTAGE AT OR ABOVE THE 40th PERCENTILE on the TERRANOVA/SUPERA
Number Tested
(All Students)
Number Tested
(All Students)DistrictAt Risk Not At Risk All DistrictYearGrade At Risk Not At Risk All
State Compensatory Education (SCE) Compliance for At-Risk StudentsCompliance
YearGrade
TERRANOVA/SUPERA MATHEMATICSTERRANOVA/SUPERA READING
2016
K
61.3 9882.22018 93.7 95.0 93.9 99 69.2 90.0 73.5
59.4
59.6
147
96
83.278.6 80.0 78.8 146 44.9 75.0 49.0
81.72017 93.0 100.0 93.8 96 62.8 90.0 65.6
2016
K
2018
2017
2016
1
55.5 9173.92018 80.2 * 81.3 91 66.3 * 68.1
52.0
54.2
172
103
75.985.6 69.2 83.1 172 57.8 56.0 57.6
74.92017 84.3 42.9 78.6 103 66.3 71.4 67.0
2016
1
2018
2017
2016
2
58.7 9153.62018 46.3 54.5 47.3 91 56.3 90.9 60.4
56.8
57.6
118
129
53.454.0 72.2 56.8 118 67.0 66.7 66.9
54.32017 50.5 55.0 51.2 129 70.6 70.0 70.5
2016
2
2018
2017
2016
K-2
58.5 28069.62018 73.5 83.3 74.7 281 63.9 91.7 67.5
56.0
57.1
437
328
70.474.7 73.4 74.5 436 55.9 65.1 57.2
69.72017 73.9 61.4 72.3 328 66.9 75.0 68.0
2016
K-2
2018
2017
33,5172018 245 36 281 33,476244 36 280
38,0232016 372 64 436
35,8592017 284 44 328
37,912374 63 437
35,697284 44 328# Tested
(GR K-2)
2018
2016
2017# Tested
(GR K-2)
August 7, 2018 Dallas ISD Evaluation & Assessment (Office of Institutional Research) rpt_SCE_COMPLIANCE 2018-19 Data Packet
41JULIAN T. SALDIVAR ELEMENTARY SCHOOL (271)

FemaleMigrant MaleAt RiskWhiteAfrican
AmerHispanic
Econ
Disadv
Special
EducLEP All DistrictYearGrade Number Tested
(All Students)
TerraNova ReadingTN Read (1)
PERCENTAGE AT OR ABOVE THE 40th PERCENTILE
100.0 90.9
78.6 80.0
* 100.0
80.02018 * 94.4 94.1 * 94.7 19*
K
79.42016 66.7 83.3 78.3 * * 79.2 24*
77.82017 * * 100.0 100.0 * 100.0 12*
83.3 *
42.9 76.5
* 37.5 40.0
63.12018 * 85.7 87.5 * * 88.9 9*
1
66.52016 * 59.3 61.3 * 50.0 61.3 3142.9
63.52017 41.2 41.2 * 38.9 18*
66.7 50.0
58.8 85.7
47.1 66.7
60.02018 * 57.1 57.1 * * 60.0 15*
2
61.02016 * 63.6 66.7 * * 66.7 2450.0
60.42017 * 56.5 54.2 * * 53.8 2650.0
82.6 80.0
60.0 79.4
* 53.3 65.4
67.42018 * 79.5 79.5 57.1 * 81.4 4377.8
K-2
68.52016 72.7 67.2 67.9 37.5 69.2 68.4 7952.9
66.72017 * * 60.0 60.4 * 55.6 58.9 5650.0
23 20
45 34
1 30 26
17,6962018 394 39 7 5 439
20,5932016 6711 78 8 13 7917
# Tested
(GR K-2)19,1282017 1 503 53 4 9 5612
August 7, 2018 Dallas ISD Evaluation & Assessment (Office of Institutional Research) rpt_NR_E_read_1_perGE40 2018-19 Data Packet
42JULIAN T. SALDIVAR ELEMENTARY SCHOOL (271)

FemaleMigrant MaleAt RiskWhiteAfrican
AmerHispanic
Econ
Disadv
Special
EducLEP All DistrictYearGrade Number Tested
(All Students)
TerraNova ReadingTN Read (2)
NUMBER AT OR ABOVE THE 80th PERCENTILE
6 9
3 3
* 4
2,0662018 * 14 13 * 15 19*
K
2,3532016 1 5 5 * * 6 24*
2,0122017 * * 5 7 * 7 12*
3 *
0 6
* 1 2
1,3682018 * 5 5 * * 6 9*
1
1,6052016 * 5 6 * 0 6 310
1,5042017 3 3 * 3 18*
2 0
2 3
0 0
1,2032018 * 1 1 * * 2 15*
2
1,3452016 * 5 5 * * 5 240
1,2992017 * 0 0 * * 0 260
11 12
5 12
* 4 6
4,6372018 * 20 19 3 * 23 435
K-2
5,3032016 2 15 16 0 1 17 791
4,8152017 * * 8 10 * 2 10 563
23 20
45 34
1 30 26
17,6962018 394 39 7 5 439
20,5932016 6711 78 8 13 7917
# Tested
(GR K-2)19,1282017 1 503 53 4 9 5612
August 7, 2018 Dallas ISD Evaluation & Assessment (Office of Institutional Research) rpt_NR_E_read_2_nGE80 2018-19 Data Packet
JULIAN T. SALDIVAR ELEMENTARY SCHOOL (271) 43

FemaleMigrant MaleAt RiskWhiteAfrican
AmerHispanic
Econ
Disadv
Special
EducLEP All DistrictYearGrade Number Tested
(All Students)
TerraNova LanguageTN Lang (1)
PERCENTAGE AT OR ABOVE THE 40th PERCENTILE
87.5 100.0
42.9 70.0
* 100.0
71.42018 * 94.4 94.1 * 94.7 19*
K
72.62016 33.3 61.1 52.2 * * 54.2 24*
70.72017 * * 100.0 100.0 * 100.0 12*
83.3 *
21.4 52.9
* 12.5 10.0
48.42018 * 85.7 87.5 * * 88.9 9*
1
50.22016 * 40.7 38.7 * 33.3 38.7 3128.6
49.02017 11.8 11.8 * 11.1 18*
44.4 16.7
70.6 71.4
29.4 22.2
47.22018 * 28.6 28.6 * * 33.3 15*
2
46.72016 * 72.7 70.8 * * 70.8 2483.3
47.22017 * 26.1 29.2 * * 26.9 2616.7
69.6 75.0
46.7 61.8
* 36.7 38.5
55.32018 * 69.2 69.2 42.9 * 72.1 4366.7
K-2
55.82016 27.3 56.7 52.6 0.0 53.8 53.2 7952.9
54.92017 * * 36.0 39.6 * 33.3 37.5 5633.3
23 20
45 34
1 30 26
17,6962018 394 39 7 5 439
20,5702016 6711 78 8 13 7917
# Tested
(GR K-2)19,1242017 1 503 53 4 9 5612
August 7, 2018 Dallas ISD Evaluation & Assessment (Office of Institutional Research) rpt_NR_E_lang_1_perGE40 2018-19 Data Packet
44JULIAN T. SALDIVAR ELEMENTARY SCHOOL (271)

FemaleMigrant MaleAt RiskWhiteAfrican
AmerHispanic
Econ
Disadv
Special
EducLEP All DistrictYearGrade Number Tested
(All Students)
TerraNova LanguageTN Lang (2)
NUMBER AT OR ABOVE THE 80th PERCENTILE
5 7
0 3
* 4
1,3682018 * 11 11 * 12 19*
K
1,5832016 1 2 3 * * 3 24*
1,3612017 * * 7 8 * 8 12*
4 *
0 1
* 0 0
6422018 * 3 5 * * 5 9*
1
7332016 * 1 1 * 0 1 310
7122017 0 0 * 0 18*
1 0
3 3
0 1
9372018 * 1 0 * * 1 15*
2
9772016 * 6 6 * * 6 242
9862017 * 1 1 * * 1 260
10 8
3 7
* 4 5
2,9472018 * 15 16 2 * 18 433
K-2
3,2932016 1 9 10 0 2 10 792
3,0592017 * * 8 9 * 1 9 561
23 20
45 34
1 30 26
17,6962018 394 39 7 5 439
20,5702016 6711 78 8 13 7917
# Tested
(GR K-2)19,1242017 1 503 53 4 9 5612
August 7, 2018 Dallas ISD Evaluation & Assessment (Office of Institutional Research) rpt_NR_E_lang_2_nGE80 2018-19 Data Packet
JULIAN T. SALDIVAR ELEMENTARY SCHOOL (271) 45

FemaleMigrant MaleAt RiskWhiteAfrican
AmerHispanic
Econ
Disadv
Special
EducLEP All DistrictYearGrade Number Tested
(All Students)
TerraNova MathematicsTN Math (1)
PERCENTAGE AT OR ABOVE THE 40th PERCENTILE
71.8 74.6
47.4 50.7
59.6 71.4
61.32018 * * 73.7 71.7 * 68.8 73.5 9869.2
K
59.52016 33.3 49.6 48.2 * 45.2 49.0 14744.9
59.72017 * * 64.1 65.5 * 62.4 65.6 9662.8
71.4 64.3
52.7 65.4
* 65.4 68.6
55.52018 * * 69.0 66.3 * 65.9 68.1 9166.3
1
52.22016 * 58.8 58.2 * 59.4 58.6 16959.0
54.32017 68.3 67.3 * 67.0 67.0 10366.3
62.0 58.5
63.5 73.1
72.6 67.9
58.82018 * 59.6 60.7 22.2 56.4 60.4 9156.3
2
56.92016 * 67.3 67.3 * 68.4 67.8 11568.0
57.72017 * 71.4 71.3 * 71.3 70.5 12970.6
68.1 66.9
53.9 62.3
* 66.9 69.2
58.52018 * * 67.5 66.3 37.5 63.8 67.5 28063.9
K-2
56.12016 45.5 58.0 57.3 7.1 56.9 57.8 43156.5
57.22017 * * 68.3 68.4 10.0 67.3 68.0 32866.9
138 142
232 199
1 172 156
33,3852018 4 2714 267 16 240 280244
37,7582016 41911 419 14 364 431368
# Tested
(GR K-2)35,5432017 3 3193 307 10 281 328284
August 7, 2018 Dallas ISD Evaluation & Assessment (Office of Institutional Research) rpt_NR_E_math_1_perGE40 2018-19 Data Packet
46JULIAN T. SALDIVAR ELEMENTARY SCHOOL (271)

FemaleMigrant MaleAt RiskWhiteAfrican
AmerHispanic
Econ
Disadv
Special
EducLEP All DistrictYearGrade Number Tested
(All Students)
TerraNova MathematicsTN Math (2)
NUMBER AT OR ABOVE THE 80th PERCENTILE
18 22
7 9
4 9
2,1352018 * * 40 38 * 28 40 9828
K
2,1142016 0 16 15 * 13 16 14713
1,8892017 * * 12 11 * 10 13 9610
12 10
8 8
* 14 9
1,6892018 * * 20 20 * 16 22 9117
1
1,5192016 * 14 16 * 12 16 16912
1,6102017 23 22 * 20 23 10320
13 10
7 10
13 12
2,1392018 * 22 22 0 19 23 9119
2
2,1672016 * 17 17 * 13 17 11513
2,1152017 * 24 24 * 21 25 12921
43 42
22 27
* 31 30
5,9632018 * * 82 80 1 63 85 28064
K-2
5,8002016 2 47 48 0 38 49 43138
5,6142017 * * 59 57 0 51 61 32851
138 142
232 199
1 172 156
33,3852018 4 2714 267 16 240 280244
37,7582016 41911 419 14 364 431368
# Tested
(GR K-2)35,5432017 3 3193 307 10 281 328284
August 7, 2018 Dallas ISD Evaluation & Assessment (Office of Institutional Research) rpt_NR_E_math_2_nGE80 2018-19 Data Packet
47JULIAN T. SALDIVAR ELEMENTARY SCHOOL (271)

FemaleMigrant MaleAt RiskWhiteAfrican
AmerHispanic
Econ
Disadv
Special
EducLEP All DistrictYearGrade Number Tested
(All Students)
SUPERA ReadingSUP Read (1)
PERCENTAGE AT OR ABOVE THE 40th PERCENTILE
93.5 93.9
74.6 83.1
88.1 97.6
84.62018 * 94.9 93.4 * 93.6 93.8 8093.6
K
87.52016 78.7 77.8 * 78.7 78.7 12278.7
85.82017 * 92.7 92.0 * 92.9 92.9 8492.9
74.4 87.2
85.0 91.8
84.1 90.2
85.72018 * 81.3 79.5 * 80.5 80.5 8280.5
1
87.22016 87.9 88.2 * 87.8 87.9 14187.8
87.82017 86.9 87.7 * 87.1 87.1 8587.1
39.0 51.4
46.8 61.7
37.5 66.0
46.22018 45.3 45.3 0.0 44.7 44.7 7644.7
2
44.02016 54.3 54.3 * 54.3 54.3 9454.3
46.92017 50.5 50.0 50.5 50.5 10350.5
67.0 79.7
72.1 80.2
66.9 83.8
72.12018 * 74.2 72.9 0.0 73.3 73.5 23873.3
K-2
72.72016 75.8 75.7 33.3 75.8 75.9 35775.8
73.22017 * 74.7 74.4 50.0 75.0 75.0 27275.0
115 123
190 167
142 130
15,8212018 4 233 229 9 236 238236
17,4302016 356 345 6 355 357355
# Tested
(GR K-2)16,7312017 2 269 254 6 272 272272
August 7, 2018 Dallas ISD Evaluation & Assessment (Office of Institutional Research) rpt_NR_S_read_1_perGE40 2018-19 Data Packet
48JULIAN T. SALDIVAR ELEMENTARY SCHOOL (271)

FemaleMigrant MaleAt RiskWhiteAfrican
AmerHispanic
Econ
Disadv
Special
EducLEP All DistrictYearGrade Number Tested
(All Students)
SUPERA ReadingSUP Read (2)
NUMBER AT OR ABOVE THE 80th PERCENTILE
23 33
28 34
26 32
2,7892018 * 55 53 * 54 56 8054
K
3,3692016 62 61 * 62 62 12262
3,1042017 * 58 51 * 58 58 8458
14 18
25 33
10 17
2,2622018 * 32 29 * 32 32 8232
1
2,5972016 58 56 * 57 58 14157
2,5272017 27 26 * 27 27 8527
2 1
5 5
6 9
3792018 3 3 0 3 3 763
2
3342016 10 10 * 10 10 9410
3892017 15 13 15 15 10315
39 52
58 72
42 58
5,4302018 * 90 85 0 89 91 23889
K-2
6,3002016 130 127 1 129 130 357129
6,0202017 * 100 90 2 100 100 272100
115 123
190 167
142 130
15,8212018 4 233 229 9 236 238236
17,4302016 356 345 6 355 357355
# Tested
(GR K-2)16,7312017 2 269 254 6 272 272272
August 7, 2018 Dallas ISD Evaluation & Assessment (Office of Institutional Research) rpt_NR_S_read_2_nGE80 2018-19 Data Packet
49JULIAN T. SALDIVAR ELEMENTARY SCHOOL (271)

FemaleMigrant MaleAt RiskWhiteAfrican
AmerHispanic
Econ
Disadv
Special
EducLEP All DistrictYearGrade Number Tested
(All Students)
SUPERA LanguageSUP Lang (1)
PERCENTAGE AT OR ABOVE THE 40th PERCENTILE
93.5 95.9
85.7 88.1
85.7 92.9
83.02018 * 94.9 94.7 * 94.9 95.0 8094.9
K
85.42016 86.9 86.3 * 86.9 86.9 12286.9
83.52017 * 90.2 89.3 * 89.3 89.3 8489.3
51.2 59.0
56.3 77.0
61.4 75.6
67.72018 * 55.0 53.8 * 54.9 54.9 8254.9
1
69.42016 65.7 65.4 * 65.5 65.2 14165.5
69.72017 67.9 67.9 * 68.2 68.2 8568.2
29.3 51.4
55.3 55.3
37.5 55.3
41.82018 40.0 40.0 0.0 39.5 39.5 7639.5
2
38.62016 55.3 55.4 * 55.3 55.3 9455.3
42.12017 45.6 46.9 45.6 45.6 10345.6
54.8 71.5
65.8 74.9
59.2 73.8
64.02018 * 63.5 62.9 0.0 63.1 63.4 23863.1
K-2
64.22016 70.2 69.9 33.3 70.1 70.0 35770.1
64.72017 * 66.2 66.1 66.7 66.2 66.2 27266.2
115 123
190 167
142 130
15,8212018 4 233 229 9 236 238236
17,4292016 356 345 6 355 357355
# Tested
(GR K-2)16,7312017 2 269 254 6 272 272272
August 7, 2018 Dallas ISD Evaluation & Assessment (Office of Institutional Research) rpt_NR_S_lang_1_perGE40 2018-19 Data Packet
50JULIAN T. SALDIVAR ELEMENTARY SCHOOL (271)

FemaleMigrant MaleAt RiskWhiteAfrican
AmerHispanic
Econ
Disadv
Special
EducLEP All DistrictYearGrade Number Tested
(All Students)
SUPERA ReadingSUP Lang (2)
NUMBER AT OR ABOVE THE 80th PERCENTILE
15 30
28 28
20 23
1,9852018 * 44 43 * 43 45 8043
K
2,4302016 56 52 * 56 56 12256
2,0652017 * 43 36 * 43 43 8443
2 3
8 8
8 6
9302018 * 5 4 * 5 5 825
1
1,0012016 16 16 * 16 16 14116
9612017 13 13 * 14 14 8514
4 8
6 10
4 8
6522018 12 12 0 12 12 7612
2
6422016 16 15 * 16 16 9416
6662017 12 12 12 12 10312
21 41
42 46
32 37
3,5672018 * 61 59 0 60 62 23860
K-2
4,0732016 88 83 0 88 88 35788
3,6922017 * 68 61 0 69 69 27269
115 123
190 167
142 130
15,8212018 4 233 229 9 236 238236
17,4292016 356 345 6 355 357355
# Tested
(GR K-2)16,7312017 2 269 254 6 272 272272
August 7, 2018 Dallas ISD Evaluation & Assessment (Office of Institutional Research) rpt_NR_S_lang_2_nGE80 2018-19 Data Packet
51JULIAN T. SALDIVAR ELEMENTARY SCHOOL (271)

IDEA Proficiency Test
PERCENTAGE BY PROFICIENCY LEVEL
IPT
%NNumber
Tested%NNNGrade N N %%%%
Level 6Level 5Level 4Level 3Level 2Level 1
**** 54.56**PK 11
********KN 16
******1 6
****2 2
38** 37.8 31 7.36** 46.35 82
38** 33.3 39 15.418 14.5 17 32.5ALL 117
August 7, 2018 Dallas ISD Evaluation & Assessment (Office of Institutional Research) rpt_IPT 2018-19 Data Packet
52JULIAN T. SALDIVAR ELEMENTARY SCHOOL (271)

Course% Items Correct
CourseMark
ACP ACP
Averages % Passing District % Passing
Course Mark(no ACP)
ScaleScore
NumberTested
Course
Dallas ISD Assessments of Course PerformanceACP
Course% Items Correct
CourseMark
ACP ACP
Averages % Passing District % Passing
Course Mark(no ACP)
ScaleScore
NumberTested
Course
SEMESTER 1 TESTS SEMESTER 2 TESTS
Elementary School Exams
KINDERGARTEN MATHEMATICS (tested with 2017-2018 test) KINDERGARTEN MATHEMATICS (tested with 2017-2018 test)
85.7 89.3 94.1 86.5102
KINDERGARTEN READING (tested with 2017-2018 test) KINDERGARTEN READING (tested with 2017-2018 test)
89.7 93.1 100.0 92.520
KINDERGARTEN READING SPANISH (tested with 2017-2018 test) KINDERGARTEN READING SPANISH (tested with 2017-2018 test)
92.8 94.5 98.8 93.482
GRADE 1 MATHEMATICS (tested with 2017-2018 test) GRADE 1 MATHEMATICS (tested with 2017-2018 test)
87.4 89.2 92.2 79.3 0.090
GRADE 1 READING (tested with 2017-2018 test) GRADE 1 READING (tested with 2017-2018 test)
91.9 93.9 100.0 87.3 0.013
GRADE 1 READING SPANISH (tested with 2017-2018 test) GRADE 1 READING SPANISH (tested with 2017-2018 test)
87.3 87.3 91.4 90.581
GRADE 2 MATHEMATICS (tested with 2017-2018 test) GRADE 2 MATHEMATICS (tested with 2017-2018 test)
77.2 84.8 84.6 80.0 97.8 81.3 92.790
GRADE 2 READING (tested with 2017-2018 test) GRADE 2 READING (tested with 2017-2018 test)
77.1 84.7 85.0 88.2 100.0 75.3 91.117
GRADE 2 READING SPANISH (tested with 2017-2018 test) GRADE 2 READING SPANISH (tested with 2017-2018 test)
74.7 78.3 83.5 77.0 95.9 76.1 93.974
GRADE 3 MATHEMATICS (tested with 2017-2018 test) GRADE 3 MATHEMATICS (tested with 2017-2018 test)
73.4 80.6 89.1 82.5 96.7 67.4 90.4120
August 7, 2018 Dallas ISD Evaluation & Assessment (Office of Institutional Research) rpt_ACP 2018-19 Data Packet
53JULIAN T. SALDIVAR ELEMENTARY SCHOOL (271)

Course% Items Correct
CourseMark
ACP ACP
Averages % Passing District % Passing
Course Mark(no ACP)
ScaleScore
NumberTested
Course
Dallas ISD Assessments of Course PerformanceACP
Course% Items Correct
CourseMark
ACP ACP
Averages % Passing District % Passing
Course Mark(no ACP)
ScaleScore
NumberTested
Course
SEMESTER 1 TESTS SEMESTER 2 TESTS
GRADE 3 READING (tested with 2017-2018 test) GRADE 3 READING (tested with 2017-2018 test)
45.7 63.8 77.1 31.8 86.4 53.7 89.122
GRADE 3 READING SPANISH (tested with 2017-2018 test) GRADE 3 READING SPANISH (tested with 2017-2018 test)
57.3 71.5 81.9 59.6 91.9 58.8 91.599
GRADE 4 LANGUAGE ARTS (tested with 2017-2018 test) GRADE 4 LANGUAGE ARTS (tested with 2017-2018 test)
57.6 72.9 88.3 57.9 100.0 58.8 92.219
GRADE 4 LANGUAGE ARTS SPANISH (tested with 2017-2018 test) GRADE 4 LANGUAGE ARTS SPANISH (tested with 2017-2018 test)
69.2 74.3 79.3 70.6 95.6 66.7 90.968
GRADE 4 MATHEMATICS (tested with 2017-2018 test) GRADE 4 MATHEMATICS (tested with 2017-2018 test)
72.2 81.5 80.5 75.9 90.4 64.3 91.083
GRADE 4 READING (tested with 2017-2018 test) GRADE 4 READING (tested with 2017-2018 test)
61.8 76.1 86.9 63.2 100.0 66.3 91.919
GRADE 4 READING SPANISH (tested with 2017-2018 test) GRADE 4 READING SPANISH (tested with 2017-2018 test)
64.7 76.5 79.3 70.6 95.6 76.0 91.268
GRADE 5 MATHEMATICS (tested with 2017-2018 test) GRADE 5 MATHEMATICS (tested with 2017-2018 test)
68.8 77.2 79.6 70.3 100.0 73.3 91.191
GRADE 5 READING (tested with 2017-2018 test) GRADE 5 READING (tested with 2017-2018 test)
73.3 80.5 78.1 87.5 100.0 76.4 92.516
GRADE 5 READING SPANISH (tested with 2017-2018 test) GRADE 5 READING SPANISH (tested with 2017-2018 test)
67.6 78.4 77.2 78.7 96.0 71.1 95.275
GRADE 5 SCIENCE (tested with 2017-2018 test) GRADE 5 SCIENCE (tested with 2017-2018 test)
71.2 71.2 78.4 60.4 90.1 67.1 94.191
August 7, 2018 Dallas ISD Evaluation & Assessment (Office of Institutional Research) rpt_ACP 2018-19 Data Packet
54JULIAN T. SALDIVAR ELEMENTARY SCHOOL (271)