judging a ship's lateral position and direction of motion...
TRANSCRIPT
58 TRANSPORTATION RESEARCH RECORD 1316
Judging a Ship's Lateral Position and Direction of Motion with Simulated Visual Aids to Navigation
KEVIN LAXAR, S. M. LURIA, AND MARC B. MANDLER
An appropriately designed parallax (two-station) range allows a mariner to accurately determine a range line-the correct path to steer a vessel-at great distances. Less expensive alternatives tc p3.r3.!!3.x ra!1ges 3.re desi!-3.b!e, 3.r:d many ide3.s fer sing!e-st~!ticn ranges have been proposed, but mariners' abilities to establish range lines with them have not been measured. The present work quantified the sensitivity of three different range systems and determined how much information can be provided by a range in order to achieve a criterion performance level. These systems use (a) temporal characteristics, (b) spatial representation , or (c) color changes of the signal to represent changes in lateral position. Range systems were simulated either opto-mechanically or on a high-resolution computer display system. The ability of the mariner to determine both lateral position in a channel and direction of motion across a channel was assessed psychophysically for each range. The performance was compared with that obtained with a parallax range. This allowed quantification of performance and evaluation of the implications of replacing parallax ranges with the single-station ranges.
The U .S. Coast Guard uses a visual method, the parallax range beacon , to indicate to a vessel's operator the correct path or range to follow along such navigation channels as approaches to harbors and within rivers. For nighttime use, this consists of a pair of lights positioned on the range axis with the farther light higher than the nearer one (Figure 1). The vertical alignment of the lights indicates that the vessel is positioned on the range's longitudinal centerline, or range axis, and any deviation from this course is readily apparent.
Although effective and easy to use , such aids are expensive because the more remote range light is typically located on shore, requiring the purchase , construction, and maintenance of the site . An alternative single-station range indicator- that is, a device located at one site-is therefore desirable .
In this study, visual performance was compared for four types of parallax ranges and three types of single-station ranges under similar laboratory conditions. In particular, how well observers could judge when they were on and off the range axis and when they were moving toward and away from the range axis were examined. Measurements were made at different lateral positions in the channel to map the sensitivity of the range system across the width of the channel. The objectives were to determine which range systems provide information adequate for navigation and provide guidance to the engineer designing range systems.
K. Laxar and S. M. Luria , Naval Submarine Medical Research Laboratory, Box 900 SUBASE NLON, Groton, Conn. 06349-5900. M. B. Mandler, U. S. Coast Guard Research and Development Center, Avery Point, Groton, Conn. 06340
Interim results are presented here; final results will be reported in a subsequent publication (J). Further details of the experiments can be found in the reports referenced at the beginning of each of rhe foiiowing sections on tht: various simulated display types studied . The experiments on the colorcoded range system were incomplete at the time of this report . Results can be found elsewhere (2) .
PARALLAX RANGES
Our baseline performance was the observers' ability using parallax ranges to judge their motion toward or away from the range axis (dynamic simulations), and whether they were on or off the range axis (static simulations) (3).
Method
Observers
Volunteers from 23 to 59 years of age participated in the experiments. All had normal color vision and 20/25 or better visual acuity, with correction if required. Most were experienced psychophysical observers. In these parallax experiments, 13 observers participated in the dynamic simulations, and 4 of them also participated in the static simulations.
Apparatus
The range configurations were simulated on a Ramtek 9400 high-resolution color display system driven by a DEC VAX minicomputer. Observers responded using an auxiliary key pad.
Displays
Four types of parallax range indicator lights, discussed next, were simulated dynamically. The first two types are in use; the latter two have been proposed as alternatives.
Two-Point Fixed This range display consisted of two lights that were always on and vertically aligned when viewed from the center of the channel. The lights were 0.6 arc min in diameter and separated by 4.0 arc min when aligned (Figure

Laxar et al.
FRONT RANGE LIGHT
i
REAR (HIGHER) RANGE LIGHT
59
T RANGE AXIS
w -----1------- ----1
y \
_ I ANGLE el POSITION OF THE OBSERVER
FIGURE 1 Top view of a parallax range: W, channel width; Y, distance of observer from range axis; 9, horizontal component of the angle between th~ lights.
2a). The vertical separation approximated the angle specified by the U.S . Coast Guard for affording optimal sensitivity in perceiving lateral position (4). When viewed from off center, the lights were not vertically aligned, and the misalignment increased with increasing distance from the center of the channel.
Two-Point Flashing The second display was similar to the two-point fixed except that the two lights flashed continuously. The upper light was on for 3.0 sec and off for 3.0 sec, and the lower light was on for 0.3 sec and off for 0.7 sec (Figure 2b) .
Extended Source This range display consisted of two bars of light, 0.3 arc min x 6.0 arc min, oriented vertically with no separation between them, and they were always on (Figure 2c). As with the spots of light, they were in vertical alignment only when seen from the center of the channel.
Path Indicator The fourth type of display consisted of a column of lights (Figure 2d). The center light, larger than the
A
0
FIXED
0 4'[
0
0 0 0 0
0 0 0 0 0
B
FLASHING
EQUAL INT 6
0 4'[
0 QKFI
PATH INDICATOR
0 0 0 0
0 0 0 0 0
c EXTENDED
s'
6'
RIGHT OF ft. ON it, LEFT OF ft.
FIGURE 2 Four parallax range light configurations.
others, was in alignment with the column only when viewed from the center of the channel. This type of display, oriented horizontally, is typically used as a glide slope indicator on aircraft carriers. It was oriented vertically so that lateral position instead of elevation was indicated. Unlike the device used on aircraft carriers, which shows five discrete elevations, this display provided a continuous change in lateral position to determine if the enhanced display improved performance. If implemented, it might be constructed as a single-station range device using Fresnel lenses as on aircraft carriers .
Procedure
For the static experiments, only the two-point and extendedsource ranges were simulated. Observers were seated 6 m from the computer monitor and were given 5 min to adapt to the dark . The monitor screen subtended visual angles of 2.4 degrees high x 3.3 degrees wide and was uniformly illuminated to 0.003 cd/m2
, equivalent to the night sky with a partial moon. The white stimuli, at a luminance of 100 cd/m2, were centered on the screen. The luminance level was imposed by hardware constraints. The testing room was otherwise dark.
Static Thresholds These experiments were similar to the visual acuity experiments of Westheimer and McKee (5). The static thresholds, here and throughout this study, were measured with the method of constant stimuli. In separate experiments, either the two-point or the extended-source range was presented with the lower light in one of nine positions up to 37.1 arc sec (0 .62 arc min) to the right or left of the upper light. The stimulus positions were chosen to encompass the range whose extreme values could easily be judged by the observers as off axis . The stimuli were presented in random order for 0.2 sec once every 4 sec. The observer pressed one of two buttons on the keypad to indicate a left or right relative position of the lower light. Each position was presented randomly 30 times in two 270-trial sessions that lasted 18 min each, and the computer recorded each response.
Dynamic Thresholds These thresholds were measured with the method of limits throughout this study. For each trial, a pair of range lights was displayed in a configuration corresponding to a view from some distance off the range axis. After 1 to 5 sec, the bottom light began to move slowly to the right or left, simulating a vessel's motion across the channel. As soon as the observer could correctly judge the direction of motion, he or she pressed a button corresponding to

60
that direction. When the correct button was pressed, the angular distance that had been traversed by the lower light was recorded by the computer. Trials were separated by a 2-sec interval. Errors were recorded, and those trials were rerun later in the session.
Eleven starting positions, up to 6.2 arc min right and left of center, were chosen randomly. Situations were simulated in which the mariner was off the centerline by different amounts when first viewing the display, and the change in distance from centerline that is required before a change in the display can be detected was calculated. The lower light moved at 9.3 arc sec2 • For typical channel configurations, this corresponded to a speed of 2.6 to 11.5 knots across the channel. This was so imperceptibly slow that judgments were based on the position of the lights at some time after the motion started.
Performance was measured in a single experimental session. This consisted first of ~2 practice trials. Next, trials at each starting position were presented in random order in both directions. This was repeated over three blocks. The session thus comprised 66 trials and lasted about 50 min.
Results
Static Thresholds
Data from the four observers were combined, and probit analyses were conducted on the 2,160 trials from both the two-point and extended-source range configurations. With chance performance represented by the 50 percent probability level and certainty represented by 100 percent, a probability of 95 percent correct responses was chosen for the practical purposes of this study. With the two-point range, observers could judge when they were off the range axis by 30.7 arc sec (0.51 arc min). With the extended-source configuration, the mean accuracy was 33.2 arc sec (0.55 arc min). The difference between the two range configurations was not significant, t(3) = 0.80, p > .10. Additional practice and a less conservative criterion probability level would likely have made the performance of these observers approach the 5 to 10 arc sec acuity found by Westheimer and McKee (5).
Dynamic Thresholds
Figure 3 shows the average thresholds for detecting motion both to the left and right of start position for the four range displays. Threshold is the average deviation from the start position required by the observers to correctly judge the direction of motion for that range.
A repeated measures anillysis of variance (ANOVA) WilS computed on the deviations for the following factors: 4 range indicator configurations x 2 directions of motion (to the right or left) x 11 start positions x 13 subjects. Thresholds varied significantly with range configuration, F (3,36) = 3.46, p < .05. A Newman-Keuls test showed a significant difference between only the extended-source and the two-point flashing range configurations (p < .05), however.
The effect of the start position was also significant. Th.resholds are smallest for start positions at or near the range axis (start position of 0.0) and increase as the start position dis-
TRANSPORTATION RESEARCH RECORD 1316
2.0
:: c l.B
0
;5 1.6 :i:: en ll..I ~ 1.4 I-
1.2 --~-~.....--~~-..--~~-------'
- B - 6 -4 -2 0 2 4 6 B LEFT RIGHT
START POSITION (arc min)
FIGURE 3 Motion thresholds for four parallax range light configurations (in all references to thresholds, lower thresholds indicate grl'atl'r Sl'nsitivity, or hP.UP.r performance).
tance increases left or right from center. This means that observers can easily determine whether they are moving toward or away from the range axis when near the axis, but they require a greater change in lateral position to correctly judge their direction of motion when off the range axis.
The right-left direction of motion effect was not significant. However, a significant interaction was found between direction of motion and start position, F (10,120) = 15.36, p < .001. This interaction defines the direction of relative motion (DRM) effect (toward or away from the range axis), which was significant in separate ANOV As for all four range configurations. This DRM effect indicates that thresholds for judging motion toward the range axis are different from thresholds for motion away from the range axis. Figure 4 shows an example of these results for the two-point fixed range. Observers were better at judging changes when the direction of relative motion was toward the range axis than when it was away, by an average of 0.31 arc min. Results for the other types of parallax displays were comparable.
Four of the 13 observers had extensive experience in making fine perceptual judgments. To determine whether such experience had any effect on motion thresholds, their performance was compared with that of the entire group. The experienced observers had thresholds averaging 0.5 arc min more sensitive than the entire group.
2.0 c: ·e l .B :: c
0 .J
1.6
0 1.4 ::c en ~ 1.2 ::c 1-
1.0
-B -6 -4 -2 0 2 4 6 LEFT RIGHT
START POSITION (arc min)
FIGURE 4 Thresholds for relative motion toward and away from the range axis for the two-point fixed range.
B

Laxar et al.
Errors-that is, when the observer responded with the wrong direction of motion-were analyzed in a corresponding manner to that for motion thresholds. Table 1 shows that the twopoint flashing range produced almost twice as many errors as the other configurations. A four-way ANOV A showed a significant effect on errors for range configuration F (3,36) = 3.44, p < .05. A Newman-Keuls test showed that the twopoint flashing range was significantly different from the other three configurations, p < .05, which were not significantly different from each other.
The effect of start position was also significant [F (10,120) = 3.68, p < .001 ]. The error data for all range configurations combined are shown in Figure 5. As with judgment of motion, the best performance was near the on-axis position and became increasingly poor as the off-axis distance increased. Interestingly, direction of relative motion toward or away from the range axis had no effect on error rate, in contrast with the significant effect it had on judgment of motion.
ROTA TING BEAMS SINGLE-STATION RANGE
This proposed range indicator displays a horizontal triplet of lights that appear to flash simultaneously when viewed from the channel centerline; when the vessel is to the right of centerline the right light would appear to flash first, and when to the left of centerline, the left light would appear to flash first
TABLE 1 MEAN ERROR PERCENTAGES BY PARALLAX RANGE CONFIGURATION
Direction of Relative Motion
Range Configuration ToWard Away Mean
Two-point fixed 9.5 12.4 11.1
61
(6). This asynchrony would alert the mariner that the vessel was off course and in which direction. The course could then be altered until the lights were again flashing simultaneously.
To design such a beacon, the smallest interval at which most viewers can perceive temporal order with reasonable reliability must be determined. Earlier studies found intervals ranging from as little as 3 msec (7) to 30 msec (8) for binocular viewing, depending on the stimuli used. To approximate point source lights under night viewing conditions, the following experiment was conducted (9) to simulate this single-station range indicator.
Method
Apparatus
The three flashing lights were produced by three cylinders with apertures, rotating about separate light sources. Figure 6 illustrates the operation of the apparatus. The left beacon, with two beams, rotates counterclockwise at a given speed. The center beacon, with one beam, rotates clockwise at twice that speed. The right beacon, with two beams, rotates clockwise at the same speed as the left beacon. All three beacons therefore flash at the same rate. The interval between sequential flashes increases with distance from range axis. To simulate angles off the centerline, movable apertures were placed in front of the beams (instead of rotating the apparatus or moving the observer). At the viewing distance of 6.1 m, the lights were 0. 78 degree ( 47 arc min) apart and subtended 0.01 degree (0.6 arc min) visual angle. The lights were flashed once every 2 sec (0.5 Hz). Their luminance was 230 cd/m2
,
and the flash duration was about 50 msec. The experiments were conducted in a dimly lit room.
Two-point flashing 17.1 18.0 17.5* Procedure
E>cten:ied source 6. 7 10.3
Path indicator 4.4 13.3
All
*Significantly different from all others, which were not
significantly different from each other.
20
16 ;ie
Cl) a:: 12
0 a:: e-a: UJ
4
o--~~~~~~~~...---.
-8 -6 -4 -2 0 2 4 6 8 LEFT RIGHT
START POSITION (ore min)
FIGURE 5 Mean percent errors for four parallax ranges combined.
8.6
11.6
Ten observers were given several practice sessions before the start of the study, and 2 min for adaptation to the ambient illumination before each session.
Static Thresholds The observer viewed the set of lights at either 0 degrees (centerline) or at various viewing angles. The magnitude of the angle needed for a correct judgment of the temporal order (left light first versus right light first) was measured. A given angle of view was set and the flashing lights exposed until the observer made a judgment. The lights were occluded while a new angle of view was set, and so on.
Dynamic Thresholds The minimal amount of change in the viewing angle of the flashing lights that the observers could perceive was measured. Starting with randomly varied viewing angles ofO (simultaneity), 1, 2, 4, or 6 degrees to the right or left of centerline, the difference threshold was measured for both increasing and decreasing viewing angles. For each trial, the display was exposed and the viewing angle remained constant for a random period of 5 to 10 sec, after which the angle was changed at the rate of 5 degrees/min. The observer

62 TRANSPORTATION RESEARCH RECORD 1316
A
SIMULTANEOUS
-y- 'I, -?- ..,1, -a-' •' I
6 0N CENTERLINE"'
v OBS
B c
~ lST 2ND 3RD 3RD 2NO lST
'Ci .:6'- -'Ci-- -'I' , I' '1' I I
' I , ,1; -'Ci--o~ -a-T T ;I'
I
OISt> 'Lt:" OF CHANNEL, MOYE RIGHT' 'RIGHT OF CHANNEL, MOYE LE"' <1 OIS
FIGURE 6 Operation of the sequential beacons: (a) when viewed from range axis, beacons flash simultaneously; (b) when viewed from left of range axis, left beacon is seen first, followed by center beacon and then right beacon; (c) when viewed from right of range axis, right beacon is seen first, followed by center and then left.
reported when a change in the flash pattern was detected and whether the change was toward more or less simultaneity. Incorrect responses were not recorded, but the trial was repeated at some random time later in the session.
Results
Static Thresholds
Mean thresholds were calculated to determine the viewing angle at which the observers correctly identified the left-right direction of temporal order. A prubil analysis was used lu compute the 95 percent correct threshold. This resulted in a mean temporal interval of 8.4 msec between the flashes of the left and middle beacons, or 42.7 arc min (SD = 21.4 arc min) of visual angle from the centerline position.
To further study this type of range display, several parameters were varied. Thresholds were measured using two flashing lights instead of three. Thresholds were not significantly different, although the variability with the two lights was greater. Again using just two lights, no significant differences in
thresholds were found when the lights were separated by only 16 arc min of visual angle rather than the original 47 arc min. Thresholds were significantly worse, however, when the luminance of the lights was decreased in three steps from the original level of 230 cd/m2 to 0.65 cd/m2 (10).
Using the three-light display, performance was measured when the display was flashed at twice the flash rate (once per second) and at half the flash rate (once every 4 sec) with that presented in the previous experiments (once every 2 sec). The temporal interval threshold to identify temporal order remained constant at about 5.6 msec for all flash rates, but the angula1 deviation from centerline at which the observers could perceive nonsimultaneity decreased proportionally as flash rate decreased. When flashed at the slowest rate, sensitivity was doubled in comparison with the figures given above, a substantial improvement in performance.
An additional experiment showed that the temporal interval threshold, and therefore the viewing angle, decreased when the lights were defocused by putting lenses up to + 2 diopters in front of the observers' eyes (11). Performance improved nearly twofold with the blurred image.

Laxar et al.
Dynamic Thresholds
Figure 7 shows the mean difference thresholds both in terms of the change in the viewing angle and in the temporal interval for each of the five starting positions. The standard deviations of these values were on the order of 35 arc min. The data show means for only 9 observers because one observer found it too difficult to do the task at the 4- and 6-degree conditions.
As the angle of the starting position from the centerline increased (and, therefore, the magnitude of the temporal interval between flashes increased), it generally became more difficult for the observers to detect a change in the flash pattern. The effect of the start position was highly significant according to the Friedman Analysis of Variance by Ranks, (xr2 = 11.93, p < .01). The difference between "toward" and "away from" simultaneity was not significant.
The curves are, of course, not monotonic. The thresholds drop at approximately 1 and 2 degrees, after which they rise continuously. One explanation seems evident. There is a range of perceptual simultaneity, temporal intervals around simultaneity that the observer cannot discriminate. When this range is exceeded the observer can detect nonsimultaneity, which for most observers occurs at a viewing angle of between 1 and 2 degrees. If the starting position is 1 degree off center, the resulting temporal interval is typically too small for the observer to detect. However, only a small increase in temporal interval is required to detect that the lights are no longer simultaneous. If the starting position is simultaneity, then a larger change is required to exceed the range of perceptual simultaneity. If the starting position is 2 degrees off center, this is typically just outside the range of perceptual simultaneity. Thus, only a small decrease in temporal interval results in the observer readily reporting simultaneity. A much larger change is required if the temporal interval is increasing.
130
120 c: .E ~ c II 0
0 ..J 0 100 I
"' "" a: I
0 I\ I- 90
"" ~\ u z "" 0 \ a:
"" 80 I u. \ u.
FREQUENCY ENCODED SINGLE-STATION RANGE
63
This proposed flickering or flashing light range display would indicate lateral position in the channel by varying the flash frequency, combined with chromatic information to indicate left or right side (Figure 8). When on the centerline, the navigator would see a steady light. As the vessel moved off the centerline, the navigator would see the light start to flash on and off, increasing in frequency with distance from the centerline. Moving to the right could be signalled by a flashing red light, and moving to the left by a flashing green light. The range centerline position could be indicated by a steady white light.
The basic question is, how well can observers discriminate the frequency of a flashing light? Earlier studies (12-15) found that over the range of 1 to 20 Hz, the difference threshold, t:.f, was a monotonically increasing function of frequency, but results varied widely in the range of 0.01to2.4 Hz, depending on stimulus size and experimental procedure. None used a point source of light on a dark background or measured difference thresholds of a constantly flashing light as it slowly changed frequency, as would be the case with a flashing range indicator when a vessel traveled across the width of the range. The following experiment was therefore conducted (16).
Method
Apparatus
The light source was a diffused white beam that subtended a visual angle of 1.9 arc min at the 6 m viewing distance. Its steady-state luminance was 41 cd/m2 • The 50 percent duty
26
24
x I 22 I
I
/t " .. I~ ..
20 E 1,_v /,31 ... I~ <l I <?
/if 18
/~ ,,_o I 16 _...x Ci I
\ ----\.-, ........ 70 14
0 2 4 6
START POSITION (deg)
FIGURE 7 Rotating beams difference thresholds in minutes of arc of viewing angle and temporal interval, as a function of start position in degrees of off-center viewing; thresholds are shown for changes toward and away from simultaneity.

64
CHANNEL EDGE
GREEN
I 't. I I
~ Ill
TRANSPORTATION RESEARCH RECORD 1316
CHANNEL EDGE
RED
i JlJlIUUUUl JlJlIUUUUl WHITE z w w
~ TIME
~ !I! JUUUlJl w ~
TIME
TIME
FIGURE 8 Frequency encoded range.
cycle of the light was modulated by a rotating half-sector disk mounted on a rheostat-controlled electric motor. By adjusting the speed of the motor, the light could be made to flicker at the desired frequency, which was calibrated by a Strobotac (General Radio Corp.). Five base frequencies were used: 0.5, 1.0, 2.0, 4.0, and 6.7 Hz.
Procedure
The observer sat in a dimly lit room and binocularly viewed the apparatus, which was set to one of the five base frequencies. The frequency was then slowly increased or decreased, at the rate of approximately 1 Hz in 30 sec, until the observer correctly reported "faster" or "slower," and the change in frequency was recorded. A minimum of three such thresholds was determined for both faster and slower flicker rates at each base frequency. Four observers participated. Only thresholds for changes in frequency, simulating a vessel's motion across a channel, were measured because it was assumed that a position on centerline would be displayed as a light that did not flicker. The distance from the centerline at which the light appeared to flash would be determined by the angle through which the steady light was displayed and the distance the observer was from it.
Results
The mean faster and slower frequency difference thresholds for all observers at each base frequency were calculated. Because the two thresholds were similar, their mean was calculated; the difference thresholds (t:i.f) and their standard deviations are shown as a function of base frequency in Figure
..... :!!:
TIME
~ !I! JUUUlJl I!! :!!:
TIME
9. Difference thresholds increase nearly linearly as base frequency increased. The standard deviations also increase at the higher base frequencies. The results show that the observer's sensitivity to changes in frequency decreases as the frequency of the flashing light increases. This would mean that the mariner's sensitivity to lateral motion decreases as the vessel approaches the edge of the channel.
The mean difference threshold can be termed a just noticeable difference (jnd) in frequency. The number of jnds was summed up within the range of 0 to 6. 7 Hz, resulting in 24 discriminable steps. The cumulative jnds are given by base frequency in Figure 9.
.6
.5
N :i:: ..... 4
<I .3
.2
0
CUMULATIVE jnds
4 7 11 18 24
2 3 4 5 6
FREQUENCY (Hz)
FIGURE 9 Frequency difference thresholds (4.f) by base frequency for four observers; error bars show standard deviations.
7

Laxar et al.
DISCUSSION OF RESULTS
Observer sensitivity for judging position in the channel depends on the type of range display, the starting point in the channel, and the direction of motion . The results have been presented thus far in terms of angular measures of sensitivity. To relate the measured deviation thresholds to accuracy of navigation it is necessary to convert the angular measures to distances in a given channel. The Commandant of the U.S. Coast Guard ( 4) has specified optimal limits for parallax range configurations, represented by a lateral sensitivity factor, K, calculated from the length and width of the range and the placement of the range lights. Design guidelines require that ranges have K factors between 1.5 and 4.5. A range with a K factor less than 1.5 will not change its alignment perceptibly with small changes in lateral position. A range with a K factor greater than 4.5 will change alignment too rapidly with changes in lateral position. In the following discussion, a range 152 m (500 ft) wide by 1,219 m (4,000 ft) Jong is assumed, with the near end of the range 610 m (2,000 ft) from the range beacon. This gives a K factor of 4.5 at the near end of the range and 1.5 at the far end and provides a basis for direct comparison of the various range displays . For a given K factor, thresholds are directly proportional to channel width, so the results are applicable to any range configuration.
Static Thresholds
The performances of the four types of range displays tested, at both the near and far ends of the channel, are compared in Figure 10. Relative performance is similar for both ends of the channel, with thresholds at the far end three times greater than those at the near end, because the distance from the beacon(s) is three times greater. The two-point fixed and the extended-source parallax displays are nearly identical, with a threshold of slightly less than 4.5 m around the range axis at the near end and about 13.5 m at the far end of the channel.
The rotating beam display appears to afford much less sensitivity than the parallax displays, with thresholds that are nearly twice the size. Results showed, however, that the thresholds would be halved when the lights were flashed at half the rate illustrated by these data, bringing the levels similar to those of the parallax displays.
-;;; .. .. 20 I-..
z ~ .! 'i' " Q .. ..
"' Q Q 15 .. u "' 1i .. ... :: ..
Q z Q
" ~ ~ 0 0 ... 0 .. 0 ~ :z: VI Q
~ Ill ,_ ,_ 0 .. " "" ril ;! u u ..
10 z
~ :l .. ~ 1; .. i:i " 0 " :z: z .. ... 0 ,_
t:i .... '1' .. ,. ;: VI ;! ,_ u " ~ z Q 0 >< "" ffi ... "" .. ... .. .. 5 a 2 Q ..
I- z ... ::: ~
.. < ,_ I- ... ><
"' .... "" 0 NEAR END FAR END
FIGURE IO Thresholds for perceiving on- or off-range centerline, for two parallax and two single-station range displays at the near and far ends of the channel.
65
The frequency coded display, on the other hand , shows much better sensitivity than any of the other range types. These figures are arbitrary, however, and depend on the design of the beacon. In this type of display the centerline would be indicated by a fixed-on beam, and with a departure from centerline, the beam would start to blink. Centerline sensitivity would therefore depend on the angle covered by the steady on-center beam. The data shown here, 1.1 m at the near end and 3.2m at the far end, are based on the 24 jnds within the range of flash frequencies tested, as discussed in the following section.
Dynamic Thresholds
Figure 11 shows motion thresholds for the four types of parallax and two types of single-station range displays, on-axis and at the edge of the channel. The results are given for the far end of the channel (K = 1.5). Thresholds for the near end of the channel (K = 4.5) are one-third the size shown in Figure 11. Overall, the extended source is the best of the parallax range displays, followed by the path indicator. At the far end of the channel, the extended source, at 30.9 m sensitivity on axis, was 4.5 m better than the currently used two-point fixed-on display. At the channel edge, the extended source was 4.9 m better.
Performance was significantly better with motion toward the range centerline than away for parallax range displays. The mean difference of 0.31 arc min shown for the two-point fixed range display in Figure 4 is equivalent to having sensitivity 2.6 m better at the near end of the channel and 7.9 m better at the far end. Results for the other types of parallax range displays are comparable. This means that with such displays, mariners are less sensitive to motion when approaching the edge of the channel than when moving toward the centerline, perhaps contrary to what a range indicator should be capable of displaying.
The greater accuracy found with the group of highly experienced observers, 0.5 arc min, is equivalent to 4.3 m at the near end of the channel and 12. 7 m at the far end. This suggests that with training or experience, performance can be improved for a variety of range light configurations.
The single-station rotating beam display shows higher thresholds than the others, at 47.9 m on-axis and 42.1 m at
FAR END OF CHANNEL
-;;; 50 -.. "'
~
I- 40 "' - -- -.! -- ,__ -Q ... 30 0 :z: Ill .. .. 20 :z: .... " ..
10 z: < z >-
- z ",__ z " Q 'i' i!i lil 0 ~ ii .. Q :c .. .. 8 :c ti .. "'
Q .. "' u
~ s ~ .e .~ ~ 0 u >< .. 0 .; ,_ ,l'j .:: "
,_ - 0 .. ... .5! ~ "" ,_ ,_ VI ~ ~
... 5 ~ ~ i!i lil Q " ~ Q 0 " ,! ~ .. ,! z 0 0 !il .. 0 0 Q ~ .. - '1' 'l' ... " .. 'l' z a .. ~ ;! ~ i
.. ~ ;! 0 0 ... 0 ... ..
,! 3 .:l " 0 ,! .:l 0 .. .... ... "" "" ... c
0 I I ON-AXIS CHANNEL EDGE
FIGURE 11 Thresholds for perceiving motion across the channel width for four parallax and two single-station range displays on the range axis and at the edge of the channel.
66
the channel edge, at the far end of the channel. When the lights were flashed at half the rate, sensitivity was increased twofold for static thresholds . Although motion thresholds were not measured, it is reasonable to assume that sensitivity to motion also would be greatly increased at slower flash rates . This could make the rotating beam display as good as, or better than, the parallax displays for static thresholds. The dynamic conditions would probably still remain difficult for the observers.
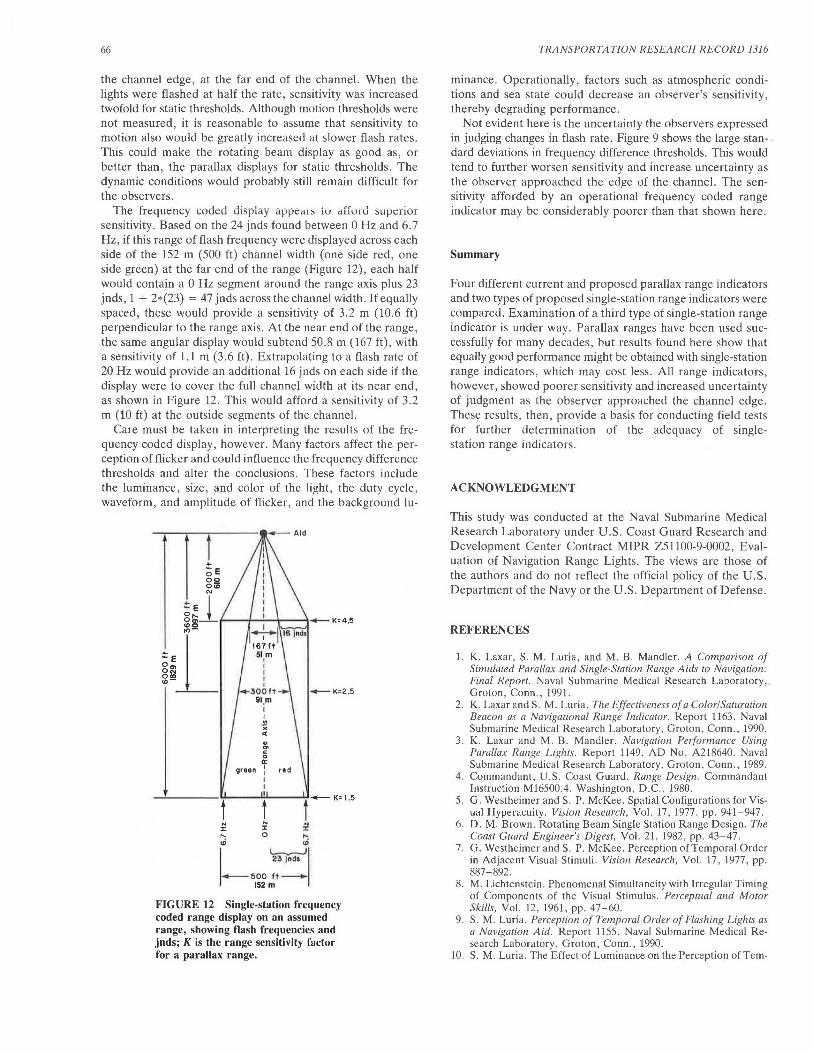
The frequency coded display appears to afford superior sensitivity . Based on the 24 jnds found between 0 Hz and 6. 7 Hz, if this range of flash frequency were displayed across each side of the 152 m (500 ft) channel width (one side red, one side green) at the far end of the range (Figure 12), each half would contain a 0 Hz segment around the range axis plus 23 jnds, 1 + 2*(23) = 47 jnds across the channel width. If equally spaced, these would provide a sensitivity of 3.2 m (10.6 ft) perpendicular to the range axis. At the near end of the range , the same angular display would subtend 50.8 m (167 ft), with a sensitivity of 1.1 m (3.6 ft). Extrapolating to a flash rate of 20 Hz would provide an additional 16 jnds on each side if the display were to cover the full channel width at its near end, as shown in Figure 12. This would afford a sensitivity of 3.2 m (10 ft) at the outside segments of the channel.
Care must be taken in interpreting the results of the frequency coded display, however. Many factors affect the perception of flicker and could influence the frequency difference thresholds and alter the conclusions. These factors include the luminance, size, and color of the light, the duty cycle, waveform, and amplitude of flicker, and the background Ju-
---- K=2.5
... ... :I: :I: r--; 0 ,..._
"' "'
I ~1 - soo1t -1s2 m
FIGURE 12 Single-station frequency coded range display on an assumed range, showing flash frequencies and jnds; K is the range sensitivity factor for a parallax range.
TRANSPORTATION RESEARCH RECORD 1316
minance. Operationally , factors such as atmospheric conditions and sea state could decrease an observer's sensitivity, thereby degrading performance.
Not evident here is the uncertainty the observers expressed in judging changes in flash rate. Figure 9 shows the large standard deviations in frequency difference thresholds. This would tend to further worsen sensitivity and increase uncertainty as the observer approached the edge of the channel. The sensitivity afforded by an operational frequency coded range indicator may be considerably poorer than that shown here.
Summary
Four different current and proposed parallax range indicators and two types of proposed single-station range indicators were compared. Examination of a third type of single-station range indicator is under way. Parallax ranges have been used successfully for many decades, but results found here show that equally good performance might be obtained with single-station range indicators , which may cost less. All range indicators, however , showed poorer sensitivity and increased uncertainty of judgment as the observer approached the channel edge. These results , then, provide a basis for conducting field tests for further determination of the adequacy of singlestation range indicators.
ACKNOWLEDGMENT
This study was conducted at the Naval Submarine Medical Research Laboratory under U.S. Coast Guard Research and Development Center Contract MIPR Z51100-9-0002 , Evaluation of Navigation Range Lights. The views are those of the authors and do not reflect the official policy of the U.S. Department of the Navy or the U.S. Department of Defense.
REFERENCES
1. K. Laxar, S. M. Luria, and M. B. Mandler. A Comparison of Simulated Parallax and Single-Station Range Aids to Navigation: Final Neport. Naval Submarine Medical Research Laboratory, Groton, Conn., 1991.
2. K. Laxar and S. M. Luria. The Effectiveness of a Co/or/Saturation Beacon as a Navigational Range Indicator. Report 1163. Naval Submarine Medical Research Laboratory, Groton, Conn., 1990.
3. K. Laxar and M. B. Mandler. Navigation Performance Using Parallax Range Lighrs. Report 1149. AD No . A218640. Naval Submarine Medical Research Laboratory, Groton, Conn., 1989.
4. Commandant, U.S. Coast Guard. Range Design. Commandant Instruction Ml6500.4. Washington, D.C., 1980.
5. G. Westheimer and S. P. McKee. Spatial Configurations for Visual HyperaL:uity. v'ision Research, Yul. 17, 1977, pp. 941-947.
6. D. M. Brown. Rotating Beam Single Station Range Design. The Coast Guard Engineer's Digest, Vol. 21, 1982, pp. 43-47.
7. G. Westheimer and S. P. McKee. Perception of Temporal Order in Adjacent Visual Stimuli. Vision Research, Vol. 17, 1977, pp. 887-892.
8. M. Lichtenstein. Phenomenal Simultaneity with Irregular Timing of Components of the Visual Stimulus. Perceptual and Motor Skills, Vol. 12, 1961, pp . 47-60 .
9. S. M. Luria. Perception of Temporal Order of Flashing Lights as a Navigation Aid. Report 1155. Naval Submarine Medical Research Laboratory, Groton, Conn., 1990.
10. S. M. Luria. The Effect of Luminance on the Perception of Tern-
Laxar et al.
poral Order of Flashing Lights. Perceptual and Motor Skills, Vol. 71, 1990, pp. 1,115-1,119.
11. S. M. Luria and J. S. Newacheck. The Effect of Defocussing the Image on the Perception of Temporal Order of Flashing Lights. Naval Submarine Medical Research Laboratory, Groton, Conn., 1991.
12. C. R. Brown. Difference Thresholds for Intermittent Photic Stimuli as a Function of Rate of Flash, Number of Flashes, and Presentation Time. Journal of the Optical Society of America, Vol. 49, 1959, pp. 56-60.
13. J. W. Gebhard, G. H. Mowbray, and C. L. Byham. Difference
67
Limens for Photic Intermittence. Quarterly Journal of Experimental Psychology, Vol. 7, 1955, pp. 49-55.
14. M. B. Mandler. Temporal Frequency Discrimination Above Threshold. Vision Research, Vol. 24, 1984, pp. 1,873-1,880.
15. G. H. Mobray and J. W. Gebhard. Differential Sensitivity of the Eye to Intermittent White Light. Science, Vol. 121, 1955, pp. 173-175.
16. K. Laxar and S. M. Luria. Frequency of a Flashing Light as a Navigational Range Indicator. Report 1157. AD No. A221924. Naval Submarine Medical Research Laboratory, Groton, Conn., 1990.