jual shear connector 081281000409
TRANSCRIPT
Research Report
Fatigue strength of shear connectors
The researcher:
En Xie
The supervisor:
Prof. Maria Isabel Brito Valente
University of Minho, Guimarães, Portugal
February, 2011

Fatigue strength of shear connectors February 2011
II
CONTENTS
1. Introduction .............................................................................................................. 1
1.1. Types of shear connectors ........................................................................................... 1
1.2. Motivation and objectives ........................................................................................... 3
2. Survey over endurance tests ..................................................................................... 4
2.1. Tests by Slutter and Fisher ......................................................................................... 4
2.1.1. Tests for headed studs ............................................................................................................. 4
2.1.2. Tests for channel connectors ................................................................................................... 9
2.2. Tests by Mainstone and Menzies .............................................................................. 10
2.3. Tests by Roderick and Ansourian ............................................................................ 11
2.4. Tests by Hallam ......................................................................................................... 12
2.5. Tests by Roik and Holtkamp .................................................................................... 13
2.6. Tests by Roik and Hanswille ..................................................................................... 15
2.7. Tests by Naithani and Gupta .................................................................................... 17
2.8. Tests by Faust and Leffer ......................................................................................... 19
2.9. Tests by Shim and Lee ............................................................................................... 20
2.10. Tests by Badie and Tadros ........................................................................................ 21
2.11. Tests by Seracino and Oehlers ................................................................................. 23
2.12. Tests by Lee and Shim ............................................................................................... 25
2.13. Tests by Ahn and Kim ............................................................................................... 27
2.14. Tests by Kwon and Engelhardt ................................................................................ 28
3. Survey over residual strength tests ......................................................................... 30
3.1. Tests by Oehlers ......................................................................................................... 30
3.2. Tests by Gattesco and Giuriani ................................................................................ 32
3.3. Tests by Bro and Westberg ....................................................................................... 33
3.4. Tests by Ahn and Kim with stud connectors ........................................................... 34
3.5. Tests by Hanswille and Porsch ................................................................................. 35
3.6. Tests by Ahn and Kim with Perfobond connectors ................................................ 40
4. Survey over slip tests ............................................................................................... 42

Fatigue strength of shear connectors February 2011
III
4.1. Tests by Hallam ......................................................................................................... 42
4.2. Tests by Gattesco and Giuriani ................................................................................ 43
4.3. Tests by Taplin ........................................................................................................... 43
4.4. Tests by Valente ......................................................................................................... 46
5. Discussion ............................................................................................................... 47
5.1. Fatigue life calculation for studs .............................................................................. 47
5.2. Residual strength calculation for studs ................................................................... 50
5.3. Low cycle fatigue behavior of studs ......................................................................... 52
5.4. Slip characteristics for studs under repeated loading ............................................ 52
6. Conclusion .............................................................................................................. 54
7. References ............................................................................................................... 56

Fatigue strength of shear connectors February 2011
IV
LIST OF FIGURES
Figure 1 - Effect of shear connection on strain, bending and shear stresses ......................... 1
Figure 2 - Several types of connectors .................................................................................. 2
Figure 3 - Push-out-specimen used by Slutter and Fisher (1966) ......................................... 5
Figure 4 - Failure models of Shear studs under fatigue loading (Hallam, 1976) .................. 7
Figure 5 - S-N curves for stud test results by Slutter and Fisher ........................................... 8
Figure 6 - Comparison of test results and the provision of AASHTO .................................. 8
Figure 7 - Failure models of channel connectors .................................................................. 9
Figure 8 - Comparison of test results by Slutter and Fisher and the equation (3) ............... 10
Figure 9 - Push-out-specimen used by Mainstone and Menzies (Roik and Hanswille 1990)
..................................................................................................................................... 10
Figure 10 - Push-out-specimen used by Roderick and Ansourian (Roik and Hanswille 1990)
..................................................................................................................................... 12
Figure 11 - Push-out-specimen used by Hallam (Roik and Hanswille 1990) ..................... 12
Figure 12 - Push-out-specimen used by Roik and Holtkamp (Roik and Hanswille 1990) . 14
Figure 13 - S-N relationships of tests by authors in 1960s to 1970s ................................... 14
Figure 14 - Push-out-specimen used by Roik and Hanswille (Roik and Hanswille 1990) . 16
Figure 15 - Test results by Roik and Hanswille (1989) ....................................................... 16
Figure 16 - New Standard test specimen used by Naithani and Gupta (1988) .................... 17
Figure 17 - Test results by Naithani and Gupta (1988) ....................................................... 18
Figure 18 - Push-out-specimen used by Faust and Leffer (2000) ....................................... 19
Figure 19 - Test results by Faust and Leffer (2000) ............................................................ 20
Figure 20 - Push-out-specimen used by Shim and Lee (2001) ........................................... 20
Figure 21 - Test results by Shim and Lee (2001) ................................................................ 21
Figure 22 - L-shaped specimen used by Badie and Tadros (2002) ..................................... 22
Figure 23 - Push-out-specimen used by Seracino and Oehlers (2003)................................ 24
Figure 24 - Test results by Seracino and Oehlers (2003) .................................................... 25
Figure 25 - Push-out-specimen used by Lee and Shim (2005) ........................................... 25
Figure 26 - Relation between stress range and fatigue life for large studs .......................... 26
Figure 27 - Push-out-specimen used by Ahn and Kim (2007) ............................................ 27
Figure 28 – Test results by Ahn and Kim (2007) ................................................................ 28
Figure 29 - Post-installed shear connectors (Kwon and Engelhardt 2010) ......................... 28
Figure 30 - Direct-shear test setup and reinforcing bar layout (Kwon and Engelhardt 2010)
..................................................................................................................................... 29
Figure 31 - Test results by Kwon and Engelhardt (2010) .................................................... 29
Figure 32 - Push-out-specimen used by Oehlers (1990) ..................................................... 30
Figure 33 – Experimental interaction between strength and Endurance ............................. 31

Fatigue strength of shear connectors February 2011
V
Figure 34 - specimen details used by Gattesco and Giuriani (1996): (a) plan of specimen;
(b) transversal section; (c) longitudinal section; (d) exploded view ........................... 32
Figure 35 - Push-out-specimen used by Bro and Westberg (2004) ..................................... 34
Figure 36 - Test results by Bro and Westberg (2004) .......................................................... 34
Figure 37 - Test results by Ahn and Kim (2007) ................................................................. 35
Figure 38 - Push-out-specimen used by Hanswille and Porsch (2007) ............................... 36
Figure 39 - Tests with multiple block of loading (Hanswille and Porsch 2007) ................. 36
Figure 40 – Comparison of fatigue test results with the prediction in Eurocode 4 ............. 39
Figure 41 – Decrease of static strength versus lifetime due to high cycling loading .......... 40
Figure 42 – Comparison between the test results with the results of the lifetime prediction
to Palmgren-Miner (Hanswille and Porsch, 2007) ...................................................... 40
Figure 43 - Connector shape and push-out-specimen used by Ahn and Kim (2008) .......... 41
Figure 44 –Test results of Perfobond connectors by Ahn and Kim ..................................... 42
Figure 45 - Push-out specimens used by Taplin (1997) ...................................................... 44
Figure 46 - Push-out specimens used by Valente (2007) .................................................... 47
Figure 47 – Relationship between the experimental and theoretical fatigue life(Hanswille
and Porsch, 2007) ........................................................................................................ 50
Figure 48 – Comparison of the experimental and theoretical values of the reduced static
strength by equation (15) ............................................................................................. 51
Figure 49 – Comparison of the experimental and theoretical values of the reduced static
strength by equation (16) ............................................................................................. 51
Figure 50 – Evolution of slip depending on the cycles load range by Valente (2007) ........ 54
Fatigue strength of shear connectors February 2011
VI
LIST OF TABLES
Table 1 - Test results of stud connectors by Slutter and Fisher (1966) .................................. 5
Table 2 - Test results of channel connectors by Slutter and Fisher (1966) ............................ 9
Table 3 - Test results of stud connectors by Mainstone and Menzies (1967) ...................... 11
Table 4 - Test results by Roderick and Ansourian (1976) ................................................... 12
Table 5 - Test results by Hallam (1976) .............................................................................. 13
Table 6 - Test results by Roik and Holtkamp (1976) ........................................................... 14
Table 7 - Test results by Roik and Hanswille (1989) .......................................................... 16
Table 8 - Test results by Naithani and Gupta (1988) ........................................................... 18
Table 9 - Test results by Faust and Leffer (2000) ................................................................ 19
Table 10 -Test results by Shim and Lee (2001) ................................................................... 20
Table 11 - Test results by Badie and Tadros (2002) ............................................................ 22
Table 12 - Test results by Seracino and Oehlers (2003) ...................................................... 24
Table 13 - Test results by Lee and Shim (2005) .................................................................. 26
Table 14 - Test results by Ahn and Kim (2007) ................................................................... 27
Table 15 - Test results by Kwon and Engelhardt (2010) ..................................................... 29
Table 16 - Test results by Oehlers (1990) ............................................................................ 30
Table 17 - Test results of Gattesco and Giuriani (1996) ...................................................... 33
Table 18 - Test results by Bro and Westberg (2004) ............................................................ 34
Table 19 - Test results by Ahn and Kim (2007) ................................................................... 35
Table 20 - Number of specimens tested in each series and static ultimate strength ............ 37
Table 21 - Test results by Hanswille and Porsch (S1~S4) ................................................... 37
Table 22 - Test results by Hanswille and Porsch (S5~S6) ................................................... 37
Table 23 - Test results of Perfobond connectors by Ahn and Kim (2008) .......................... 41
Table 24 - Test results of stud connectors by Hallam (1976) .............................................. 42
Table 25 - Tests result by Gattesco and Giuriani (1997) ..................................................... 43
Table 26 - Rate of slip growth for all symmetric cyclic tests .............................................. 44
Table 27 - Rate of slip growth for all unidirectional cyclic tests ......................................... 45
Table 28 - Slip results by Valente (2007) ............................................................................ 47
Table 29 - Design models for the fatigue life of shear studs ............................................... 48
Table 30 -Coeddicient in equation (18) for the rate of slip growth as determined by ......... 53

Fatigue strength of shear connectors February 2011
VII
LIST OF SYBOLS fc - cylinder strength of the concrete (MPa) fy - yield strength of shear connector material (MPa) fu - tensile strength of shear connector material (MPa) d - diameter of steel stud connector (mm) L - length of channel connector or Perfobond connector (mm) Pmax - the maximum load per connector(kN) Pmin - the minimum load per connector(kN) ΔP - Pmax-Pmin, load range (kN) Δτ - ΔP /A(A-shear area of connector), stress range(MPa) N - number of cycles Ne - experimental fatigue life Nf - theoretical fatigue life Δq - stress range of channel connector, N/mm of one channel Pu - ultimate strength per connector due to static loading (kN) Ps - residual static strength per connector after certain cycling numbers (kN) smax - the maximum slip per cycle (mm) smin - the minimum slip per cycle (mm) δ - slip per cycle (mm) m, k - exponents in expression for fatigue life K1 K2 - coefficients

Fatigue strength of shear connectors February 2011
1 / 58
1. Introduction
1.1. Types of shear connectors
Shear connection is essential for steel-concrete composite structures, as shown in Figure 1, only
when the interface between steel beam and concrete slab is eliminated, the two components can
act together as a composite unit.
Figure 1 - Effect of shear connection on strain, bending and shear stresses
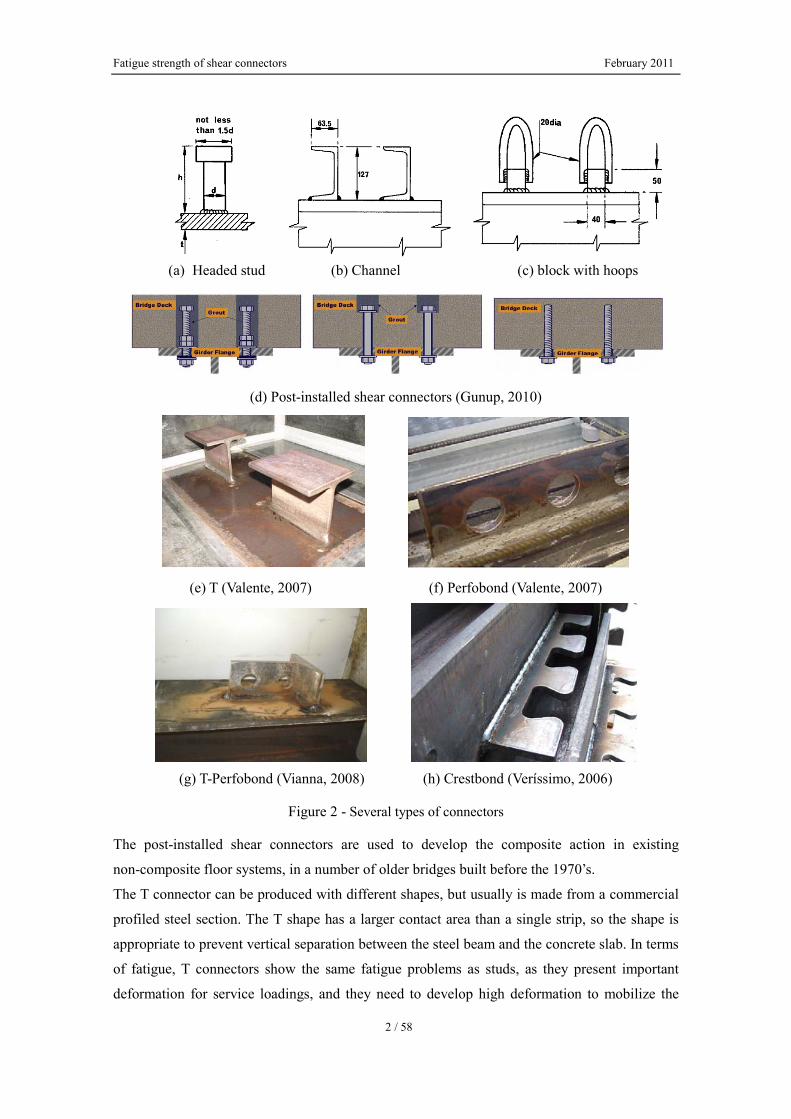
Since 1940s, several types of shear connectors have been proposed and used in composite
structures (Figure 2), such as headed stud connector, channel connector, block connector with
hoops, post-installed shear connector, T connector, Perfobond, T-Perfobond and Crestbond (CR
connector).
The most well-known and used connector is the headed stud, developed during the 40’s by
Melson Stud Welding Company. These connectors are industrially produced and are available in
various diameters, usually varying from 6 to 23 mm, and various heights, that can go from 30 to
500 mm. The main advantage of this connector are as the stud welding is fast, it anchors well in
concrete and it is easy to dispose the reinforcement through the slab, between the studs. Some
disadvantage can also be pointed out as it needs high energetic resources to work, fatigue
problems can also occur for service load level.
Since the maximum shear force that can be resisted by a stud is relatively low, other types of
connector with higher strength have been developed in the early times, primarily for use in
bridges as block connector with hoops and channel connector.
Strain Bending stress Shear stress
Strain Bending stress Shear stress
(a) No connection
(b) Full connection
Beam section
Elastic stress Ultimate Plastic stress
Fatigue strength of shear connectors February 2011
2 / 58
(a) Headed stud (b) Channel (c) block with hoops
(d) Post-installed shear connectors (Gunup, 2010)
(e) T (Valente, 2007) (f) Perfobond (Valente, 2007)
(g) T-Perfobond (Vianna, 2008) (h) Crestbond (Veríssimo, 2006)
Figure 2 - Several types of connectors
The post-installed shear connectors are used to develop the composite action in existing
non-composite floor systems, in a number of older bridges built before the 1970’s.
The T connector can be produced with different shapes, but usually is made from a commercial
profiled steel section. The T shape has a larger contact area than a single strip, so the shape is
appropriate to prevent vertical separation between the steel beam and the concrete slab. In terms
of fatigue, T connectors show the same fatigue problems as studs, as they present important
deformation for service loadings, and they need to develop high deformation to mobilize the

Fatigue strength of shear connectors February 2011
3 / 58
maximum load.
The Perfobond rib shear connector was developed by a German office in the late 1980’s, moved
by the unsatisfactory behavior of shear studs that result from fatigue problems. Perfobond
connectors can be produced in large scale with different shapes and sizes, they can easily be
welded without special equipment at site or at factory, and a significant number of studs can be
replaced by a smaller number of Perfobond ribs, as this connector shows a very high load
bearing capacity.
T-Perfobond connector derives from the Perfobond connector by adding a flange to the plate,
acting as a blocking. This kind connector could combine the large strength of a block type
connector with some ductility and uplift resistance arising from the holes at the Perfobond
connector web. Because of combination, it is complicated to calculate the shear strength. It
might be applied only in some specific projects.
The principal disadvantage of Perfobond is the difficulty of placing the transversal bottom slab
reinforcement. To avoid this disadvantage, some similar improved types of connectors like
Crestbond also called CR connector have been invented and studied, considering open apertures
on the plates.
1.2. Motivation and objectives
Nowadays steel and concrete composite beams are widely applied in structures mainly subjected
to dynamic loads, such as railway and road bridges exposed to traffic loads and industrial crane
runways exposed to folk-lift truck loads, the fatigue resistance of these structures must be
generally and carefully verified. And normally the shear forces between concrete flange and
steel beams are all transferred by different kinds of shear connectors, fatigue failure of
composite beam may happen on shear connectors. So the fatigue resistance of shear connectors
in composite beams is significant for the safe of whole structure and needed to be well
investigated.
The fatigue strength of shear connectors could be explained in three ways, the fatigue endurance
described by the relationships between stress range (S) and number of cycles (N), the static
residual strength after a certain number of cycling loading, and the slip behavior during the
cycling tests. S-N curves which widely used for steel fatigue assessment are also useful for
shear connectors. Although there are already S-N curves for headed steel studs in Eurocodes and
AASHTO, they are normally available for common studs. Whether these S-N curves applicable
for large diameter studs or studs embedded in high strength concrete or other kind shear
connectors is questionable. And the factors influencing fatigue life of shear connectors are
needed more research. Furthermore, for the fatigue life assessment of existing structures, it is
important to attain the residual strength after a certain service life or the principles of slip

Fatigue strength of shear connectors February 2011
4 / 58
developing behavior during the service life. Then it is possible to assess how long the shear
connectors could still service.
Based on forenamed reasons, the following report surveys almost all the available test results
for fatigue strength of shear connectors around the world, including summaries of the research
on endurance, residual strength and slip of shear connectors under cycling loading. The
objectives of this report are the following:
- to describe the test specimens and test procedures each author used for fatigue testing;
- to present the test results of endurance, the residual strength and the slip behavior of shear
connectors;
- to compare the test results between different authors’;
- to discuss the applicable S-N curves for designing shear connectors;
- to evaluate the factors influencing the fatigue life of shear connectors;
- to analyze the slip developing principles during the fatigue testing;
- to generalize methodology for research on fatigue behavior of new kind connectors;
.
2. Survey over endurance tests
2.1. Tests by Slutter and Fisher
2.1.1. Tests for headed studs
Slutter and Fisher (1966) examined the fatigue resistance on 46 stud connector specimens by
beam tests as shown in Figure 3.
All the specimens’ slabs had the same geometry, with 680×500×150 mm3, including the same
distribution of #4 bars (13mm in diameter), 4 transversal and 3 longitudinal rebars were
disposed. The concrete flange was casted in horizontal position, as in a real structure.
Different stud diameters and various flange thickness were tested. These were the parameters
under study on the fatigue resistance of the tested specimens. Therefore, three types of steel
section were used: section 8WF40 with flange thickness tf = 14.3 mm, section 8WF31 with
flange thickness tf = 11.1 mm, and section 8WF67 with flange thickness tf = 23.8 mm. The test
specimens were divided in two groups: one that includes unidirectional loading and other that
regards reversal loading. The test details and results are listed up in Table 1. Tests number 1 to
42 are with section 8WF40, number 43 and 44 are with section 8WF31, and number 45 and 46
are with section 8WF67.

Fatigue strength of shear connectors February 2011
5 / 58
(a) Dimension
(b) Unidirectional loading (c) Reversal loading
Figure 3 - Push-out-specimen used by Slutter and Fisher (1966)
Table 1 - Test results of stud connectors by Slutter and Fisher (1966)
Test fc fy fu d Pmax Pmin ΔP Δτ N
MPa MPa MPa mm kN kN kN MPa (×103)
1 a1A 25.9 342.1 423.8 19 19.8 -11.9 31.7 112 1587.4
2 b1A 26.3 342.1 423.8 19 19.8 -11.9 31.7 112 1975.2
3 c1A 26.9 342.1 423.8 19 19.8 -11.9 31.7 112 2557.5
4 a2A 25.8 342.1 423.8 19 27.8 -11.9 39.7 140 104.6
5 b2A 33.2 342.1 423.8 19 27.8 -11.9 39.7 140 104.8
6 c2A 27.4 342.1 423.8 19 27.8 -11.9 39.7 140 171.1
7 a3A 30.8 342.1 423.8 19 35.7 -11.9 47.6 168 106.5
8 b3A 26.4 342.1 423.8 19 35.7 -11.9 47.6 168 85.5
9 c3A 26.9 342.1 423.8 19 35.7 -11.9 47.6 168 30.6
10 a2B 29.5 342.1 423.8 19 27.8 4.0 23.8 84 897.3
F

Fatigue strength of shear connectors February 2011
6 / 58
11 b2B 30.9 342.1 423.8 19 27.8 4.0 23.8 84 565.3
12 c2B 31.0 342.1 423.8 19 27.8 4.0 23.8 84 551.1
13 a3B 31.5 342.1 423.8 19 35.7 4.0 31.8 112 139.4
14 b3B 31.3 342.1 423.8 19 35.7 4.0 31.8 112 114.7
15 c3B 30.2 342.1 423.8 19 35.7 4.0 31.8 112 199.5
16 a4B 33.7 342.1 423.8 19 43.7 4.0 39.7 140 41.5
17 b4B 30.3 342.1 423.8 19 43.7 4.0 39.7 140 50.7
18 c4B 31.5 342.1 423.8 19 43.7 4.0 39.7 140 58.7
19 a3C 30.8 342.1 423.8 19 35.7 19.8 15.9 56 7481.1
20 b3C 31.1 342.1 423.8 19 35.7 19.8 15.9 56 10276.0
21 c3C 30.5 342.1 423.8 19 35.7 19.8 15.9 56 5091.1
22 a4C 33.0 342.1 423.8 19 43.7 19.8 23.8 84 798.0
23 b4C 30.7 342.1 423.8 19 43.7 19.8 23.8 84 1215.4
24 c4C 30.9 342.1 423.8 19 43.7 19.8 23.8 84 1010.4
25 a5C 31.1 342.1 423.8 19 51.6 19.8 31.8 112 335.8
26 b5C 32.2 342.1 423.8 19 51.6 19.8 31.8 112 99.2
27 c5C 32.6 342.1 423.8 19 51.6 19.8 31.8 112 197.0
28 a6B 22.7 398.2 495.0 19 23.8 4.0 19.8 70 662.5
29 b6B 23.0 398.2 495.0 19 23.8 4.0 19.8 70 919.1
30 c6B 23.6 398.2 495.0 19 23.8 4.0 19.8 70 1144.6
31 a6C 22.2 398.2 495.0 19 39.7 19.8 19.9 70 1213.6
32 b6C 22.2 398.2 495.0 19 39.7 19.8 19.9 70 1295.3
33 c6C 22.2 398.2 495.0 19 39.7 19.8 19.9 70 1618.9
34 e1G 35.1 407.1 450.5 22 19.8 -12.2 31.9 84 1056.4
35 e2G 34.0 407.1 450.5 22 27.7 -12.2 39.9 105 218.6
36 e3G 30.9 407.1 450.5 22 35.7 -12.2 47.9 126 48.3
37 e2H 31.2 407.1 450.5 22 27.7 3.8 24.0 63 2133.0
38 e3H 30.9 407.1 450.5 22 35.7 3.8 31.9 84 112.5
39 e4H 31.4 407.1 450.5 22 43.7 3.8 39.9 105 33.0
40 e3I 31.3 407.1 450.5 22 35.7 19.8 16.0 42 4885.1
41 e4I 32.3 407.1 450.5 22 43.7 19.8 24.0 63 587.7
42 e5I 31.8 407.1 450.5 22 51.7 19.8 31.9 84 134.3
43 8WF31 27.5 342.1 423.8 19 27.8 4.0 23.8 84 405.5
44 8WF31 27.5 342.1 423.8 19 27.8 4.0 23.8 84 727.5
45 8WF67 27.5 262.7 437.3 19 27.8 4.0 23.8 84 205.5
46 8WF67 27.5 262.7 437.3 19 27.8 4.0 23.8 84 125.1
Fatigue strength of shear connectors February 2011
7 / 58
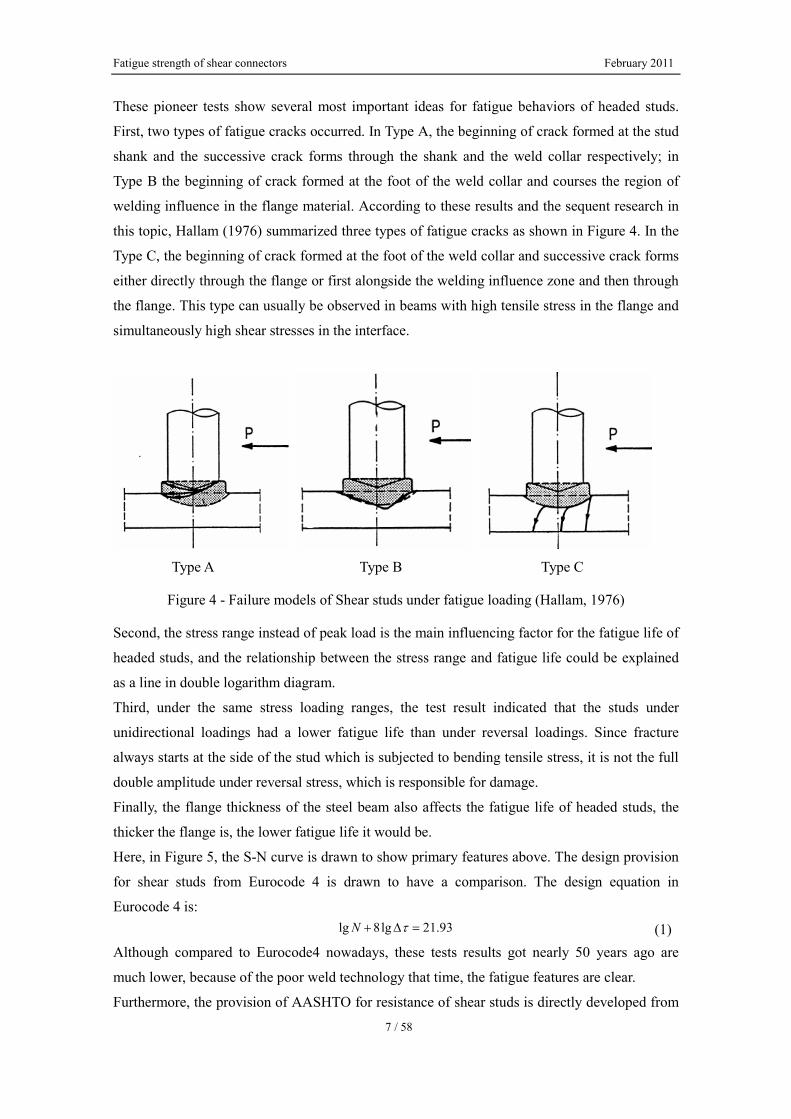
These pioneer tests show several most important ideas for fatigue behaviors of headed studs.
First, two types of fatigue cracks occurred. In Type A, the beginning of crack formed at the stud
shank and the successive crack forms through the shank and the weld collar respectively; in
Type B the beginning of crack formed at the foot of the weld collar and courses the region of
welding influence in the flange material. According to these results and the sequent research in
this topic, Hallam (1976) summarized three types of fatigue cracks as shown in Figure 4. In the
Type C, the beginning of crack formed at the foot of the weld collar and successive crack forms
either directly through the flange or first alongside the welding influence zone and then through
the flange. This type can usually be observed in beams with high tensile stress in the flange and
simultaneously high shear stresses in the interface.
Type A Type B Type C
Figure 4 - Failure models of Shear studs under fatigue loading (Hallam, 1976)
Second, the stress range instead of peak load is the main influencing factor for the fatigue life of
headed studs, and the relationship between the stress range and fatigue life could be explained
as a line in double logarithm diagram.
Third, under the same stress loading ranges, the test result indicated that the studs under
unidirectional loadings had a lower fatigue life than under reversal loadings. Since fracture
always starts at the side of the stud which is subjected to bending tensile stress, it is not the full
double amplitude under reversal stress, which is responsible for damage.
Finally, the flange thickness of the steel beam also affects the fatigue life of headed studs, the
thicker the flange is, the lower fatigue life it would be.
Here, in Figure 5, the S-N curve is drawn to show primary features above. The design provision
for shear studs from Eurocode 4 is drawn to have a comparison. The design equation in
Eurocode 4 is: lg 8lg 21.93N τ+ Δ = (1)
Although compared to Eurocode4 nowadays, these tests results got nearly 50 years ago are
much lower, because of the poor weld technology that time, the fatigue features are clear.
Furthermore, the provision of AASHTO for resistance of shear studs is directly developed from

Fatigue strength of shear connectors February 2011
8 / 58
these results. The equation in AASHTO transformed to relationship of stress range and fatigue
life is: 4 (238 29.51lg )Nτ
πΔ = − (2)
The comparison of test results and the provision is shown in Figure 6.
10
100
1000
1000 10000 100000 1000000 10000000
Stre
ss R
ange
(Mpa
)
Number of cycles (N)
unidirectional loading Reversal loading
8WF31(t=11.1mm) 8WF67(t=23.8mm)
Eurocode 4
Figure 5 - S-N curves for stud test results by Slutter and Fisher
0
20
40
60
80
100
120
140
160
180
200
1000 10000 100000 1000000 10000000
Stre
ss R
ange
(Mpa
)
Number of cycles (N)
AASHTO
Figure 6 - Comparison of test results and the provision of AASHTO
Fatigue strength of shear connectors February 2011
9 / 58
2.1.2. Tests for channel connectors
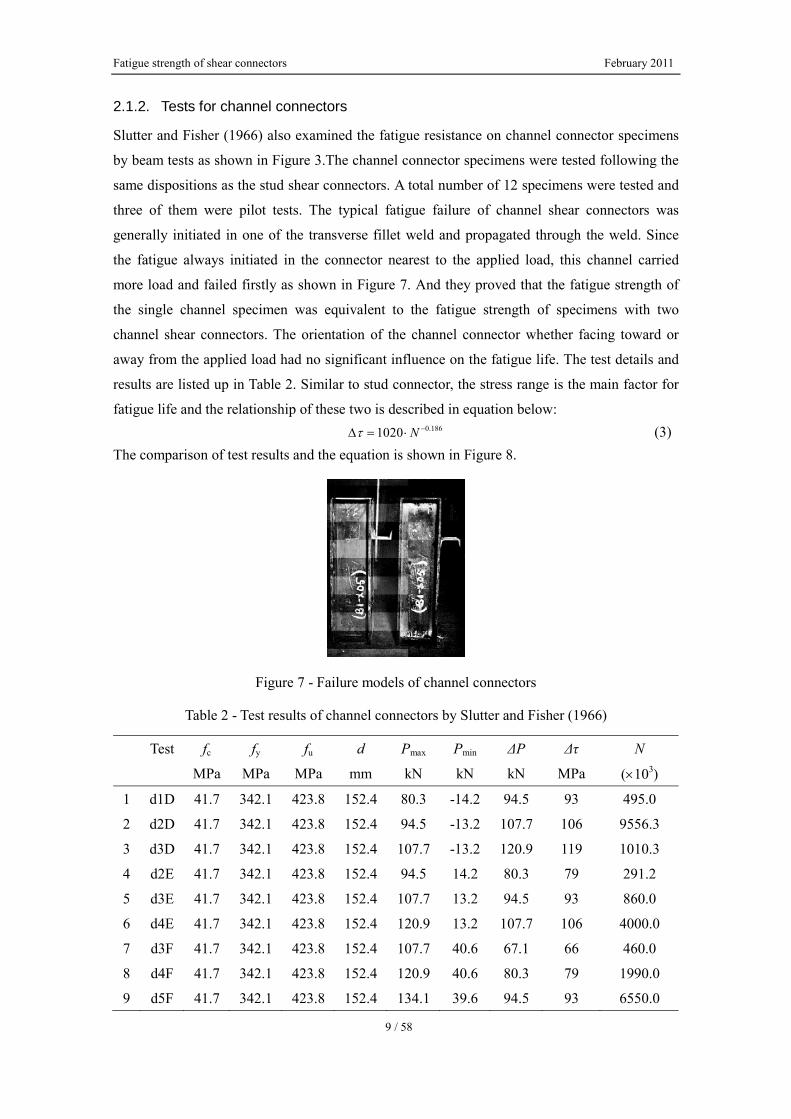
Slutter and Fisher (1966) also examined the fatigue resistance on channel connector specimens
by beam tests as shown in Figure 3.The channel connector specimens were tested following the
same dispositions as the stud shear connectors. A total number of 12 specimens were tested and
three of them were pilot tests. The typical fatigue failure of channel shear connectors was
generally initiated in one of the transverse fillet weld and propagated through the weld. Since
the fatigue always initiated in the connector nearest to the applied load, this channel carried
more load and failed firstly as shown in Figure 7. And they proved that the fatigue strength of
the single channel specimen was equivalent to the fatigue strength of specimens with two
channel shear connectors. The orientation of the channel connector whether facing toward or
away from the applied load had no significant influence on the fatigue life. The test details and
results are listed up in Table 2. Similar to stud connector, the stress range is the main factor for
fatigue life and the relationship of these two is described in equation below: 0.1861020 Nτ −Δ = ⋅ (3)
The comparison of test results and the equation is shown in Figure 8.
Figure 7 - Failure models of channel connectors
Table 2 - Test results of channel connectors by Slutter and Fisher (1966)
Test fc fy fu d Pmax Pmin ΔP Δτ N
MPa MPa MPa mm kN kN kN MPa (×103)
1 d1D 41.7 342.1 423.8 152.4 80.3 -14.2 94.5 93 495.0
2 d2D 41.7 342.1 423.8 152.4 94.5 -13.2 107.7 106 9556.3
3 d3D 41.7 342.1 423.8 152.4 107.7 -13.2 120.9 119 1010.3
4 d2E 41.7 342.1 423.8 152.4 94.5 14.2 80.3 79 291.2
5 d3E 41.7 342.1 423.8 152.4 107.7 13.2 94.5 93 860.0
6 d4E 41.7 342.1 423.8 152.4 120.9 13.2 107.7 106 4000.0
7 d3F 41.7 342.1 423.8 152.4 107.7 40.6 67.1 66 460.0
8 d4F 41.7 342.1 423.8 152.4 120.9 40.6 80.3 79 1990.0
9 d5F 41.7 342.1 423.8 152.4 134.1 39.6 94.5 93 6550.0

Fatigue strength of shear connectors February 2011
10 / 58
0
20
40
60
80
100
120
140
160
180
200
10000 100000 1000000 10000000
Stre
ss R
ange
(Mpa
)
Number of cycles (N)
Equation (3)
Figure 8 - Comparison of test results by Slutter and Fisher and the equation (3)
2.2. Tests by Mainstone and Menzies
Mainstone and Menzies (1967) performed fatigue tests on push-out specimens, using stud shear
connectors, channel connectors and bar connectors. Only 23 tests results from stud shear
connectors are collected and presented here. The specimens’ geometry is in accordance with
Figure 9, with two connectors on only one level. The specimen was not constrained from
horizontal movement at its base. No details were given concerning the yielding and the ultimate
strength of the rebars, the studs or the steel beams. Stud dimensions were 19 mm in diameter
and 100 mm in height. It could be assumed for the headed studs usually used in Britain that the
mean tensile strength of the stud material is about 600MPa. The test details and results are listed
up in Table 3. And the relationship between stress range and the fatigue life is introduced in
Figure 13.
Figure 9 - Push-out-specimen used by Mainstone and Menzies (Roik and Hanswille 1990)

Fatigue strength of shear connectors February 2011
11 / 58
Table 3 - Test results of stud connectors by Mainstone and Menzies (1967)
Test fc fy fu d Pmax Pmin ΔP Δτ N
MPa MPa MPa mm kN kN kN MPa (×103)
1 S1 27.4 - 600.0 19 49.9 4.8 45.1 159 76.0
2 S2 28.3 - 600.0 19 40.0 4.0 36.0 127 439.0
3 S7 29.5 - 600.0 19 40.0 4.0 36.0 127 1940.0
4 S9 31.2 - 600.0 19 55.0 5.4 49.6 175 42.0
5 S10 27.6 - 600.0 19 66.9 33.4 33.5 118 1700.0
6 S12 27.7 - 600.0 19 75.1 37.7 37.4 132 679.0
7 S13 22.3 - 600.0 19 20.1 -19.8 40.0 141 630.0
8 S15 28.5 - 600.0 19 20.1 -19.8 40.0 141 481.0
9 S17 34.8 - 600.0 19 17.6 -17.3 34.9 123 2200.0
10 S20 36.5 - 600.0 19 82.5 41.4 41.1 145 669.0
11 S21 36.5 - 600.0 19 34.9 -35.1 70.0 247 21.0
12 S23 30.0 - 600.0 19 85.1 63.8 21.3 75 657.0
13 S25 29.7 - 600.0 19 92.4 69.4 23.0 81 13.3
14 S27 30.6 - 600.0 19 87.6 43.9 43.7 154 9.0
15 S28 30.3 - 600.0 19 87.6 43.9 43.7 154 6.0
16 S31 26.8 - 600.0 19 85.1 42.5 42.6 150 8.6
17 S32 25.9 - 600.0 19 92.4 69.4 23.0 81 165.0
18 S33 25.5 - 600.0 19 89.9 67.4 22.4 79 106.0
19 S34 33.1 - 600.0 19 32.6 -28.3 60.9 215 16.5
20 P40 15.7 - 600.0 19 40.0 4.0 36.0 127 991.7
21 P41 15.8 - 600.0 19 40.0 4.0 36.0 127 650.9
22 P42 40.0 - 600.0 19 49.9 5.1 44.8 158 285.1
23 P43 40.0 - 600.0 19 49.9 5.1 44.8 158 143.0
2.3. Tests by Roderick and Ansourian
Roderick and Ansourian (1976) reported on 4 tests with one level load and three tests with
multi-level load. Test specimens according to Figure 10 were examined. No details were given
concerning the rebar. The studs presented 19 mm in diameter and 100 mm in height. The test
details and results are listed up in Table 4. And the relationship between stress range and the
fatigue life is introduced in Figure 13.

Fatigue strength of shear connectors February 2011
12 / 58
Figure 10 - Push-out-specimen used by Roderick and Ansourian (Roik and Hanswille 1990)
Table 4 - Test results by Roderick and Ansourian (1976)
Test fc fy fu d Pmax Pmin ΔP Δτ N
MPa MPa MPa mm kN kN kN MPa (×103)
1 R1 26.4 274.0 466.0 19 44.2 4.5 39.7 140 616.0
2 R2 26.4 274.0 466.0 19 44.2 4.5 39.7 140 194.1
3 R3 26.4 274.0 466.0 19 44.2 4.5 39.7 140 190.5
4 R4 26.4 217.0 437.0 19 44.2 4.5 39.7 140 49.3
2.4. Tests by Hallam
Hallam (1976) reported on 13 tests using headed studs with 19 mm in diameter and 76 mm in
height. Nothing is said about the rebar properties or the welding procedure. The push-out
specimens were built with two studs on each side. And during the tests, the concrete slabs were
prevented from separation by a steel rod, as shown in Figure 11.
When the first side failed, during the fatigue loading, the corresponding slab was removed,
holes were drilled in the steel flange and a pre-cast concrete slab was bolted, replacing the
original slab. The fatigue loading was then continued until the studs on the second side failed.
The test details and results are listed up in Table 5. And the relationship between stress range
and the fatigue life is introduced in Figure 13.
Figure 11 - Push-out-specimen used by Hallam (Roik and Hanswille 1990)

Fatigue strength of shear connectors February 2011
13 / 58
Table 5 - Test results by Hallam (1976)
Test fc fy fu d Pmax Pmin ΔP Δτ N
MPa MPa MPa mm kN kN kN MPa (×103)
1 PS1 48.2 215.0 421.0 19 28.4 1.1 27.2 96 1303.0
2 PS2.1 46.5 215.0 421.0 19 28.4 2.3 26.1 92 824.0
3 PS2.2 46.5 215.0 421.0 19 28.4 2.3 26.1 92 845.0
4 PS3.1 46.5 215.0 421.0 19 28.4 2.3 26.1 92 652.0
5 PS3.2 46.5 215.0 421.0 19 28.4 2.3 26.1 92 652.0
6 PS4.1 28.1 215.0 421.0 19 49.9 2.3 47.6 168 52.8
7 PS4.2 28.1 215.0 421.0 19 49.9 2.3 47.6 168 52.8
8 PS5.1 28.1 215.0 421.0 19 49.9 2.3 47.6 168 58.6
9 PS5.2 28.1 215.0 421.0 19 49.9 2.3 47.6 168 67.9
10 PS6.1 26.5 215.0 421.0 19 23.2 2.3 21.0 74 3170.0
11 PS6.2 26.5 215.0 421.0 19 23.2 2.3 21.0 74 3554.0
12 PS7.1 26.5 215.0 421.0 19 23.2 2.3 21.0 74 5140.0
13 PS7.2 26.5 215.0 421.0 19 23.2 2.3 21.0 74 6096.0
14 PS8.1 26.2 215.0 421.0 19 23.0 1.1 21.8 77 21331.0
15 PS8.2 26.2 215.0 421.0 19 23.0 1.1 21.8 77 20965.0
16 PS9.1 26.2 215.0 421.0 19 23.0 1.1 21.8 77 24305.0
17 PS9.2 26.2 215.0 421.0 19 23.0 1.1 21.8 77 35000.0
18 PS10.1 24.2 215.0 421.0 19 44.2 2.3 42.0 148 61.7
19 PS10.2 24.2 215.0 421.0 19 44.2 2.3 42.0 148 75.5
20 PS11.1 24.2 215.0 421.0 19 44.2 2.3 42.0 148 110.0
21 PS11.2 24.2 215.0 421.0 19 44.2 2.3 42.0 148 110.0
22 PS12.1 17.8 215.0 421.0 19 33.7 2.3 31.5 111 148.7
23 PS12.2 17.8 215.0 421.0 19 33.7 2.3 31.5 111 174.8
24 PS13.1 17.8 215.0 421.0 19 33.7 2.3 31.5 111 182.6
25 PS13.2 17.8 215.0 421.0 19 33.7 2.3 31.5 111 182.6
2.5. Tests by Roik and Holtkamp
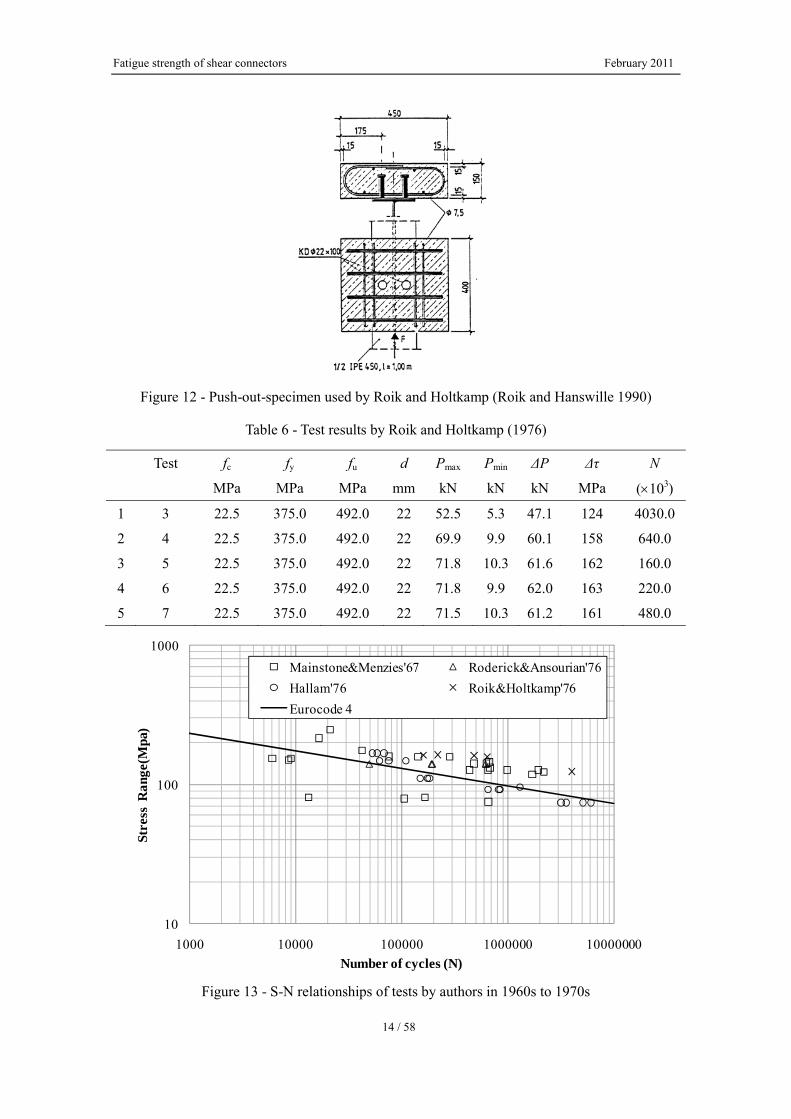
Roik and Holtkamp (1976) reported on push-out-tests under pure shear stress. The tested
specimens are represented in Figure 12. The diameter of rebar was 7.5 mm. 4 transversal and 4
longitudinal rebars were disposed on the concrete slab. The test details and results are listed up
in Table 6. And the relationship between stress range and the fatigue life is introduced in Figure
13.
Fatigue strength of shear connectors February 2011
14 / 58
Figure 12 - Push-out-specimen used by Roik and Holtkamp (Roik and Hanswille 1990)
Table 6 - Test results by Roik and Holtkamp (1976)
Test fc fy fu d Pmax Pmin ΔP Δτ N
MPa MPa MPa mm kN kN kN MPa (×103)
1 3 22.5 375.0 492.0 22 52.5 5.3 47.1 124 4030.0
2 4 22.5 375.0 492.0 22 69.9 9.9 60.1 158 640.0
3 5 22.5 375.0 492.0 22 71.8 10.3 61.6 162 160.0
4 6 22.5 375.0 492.0 22 71.8 9.9 62.0 163 220.0
5 7 22.5 375.0 492.0 22 71.5 10.3 61.2 161 480.0
10
100
1000
1000 10000 100000 1000000 10000000
Stre
ss R
ange
(Mpa
)
Number of cycles (N)
Mainstone&Menzies'67 Roderick&Ansourian'76Hallam'76 Roik&Holtkamp'76Eurocode 4
Figure 13 - S-N relationships of tests by authors in 1960s to 1970s

Fatigue strength of shear connectors February 2011
15 / 58
2.6. Tests by Roik and Hanswille
Roik and Hanswille (1989) reported on tests with concrete flanges under compressive stress and
with cracked concrete flanges in tension. The specimens are shown in Figure 14. The setups
were a little different from normal push-out tests. For test specimens D1-D2, actually there were
two specimens connected together at the end, one in the usual direction, the other opposite; the
compressive load was applied at the top and transmitted from one beam to another, so more
studs could be tested at one time. And two prestressing steel bars passed throw each concrete
beam, the prestressing load was 600 kN, For test specimens Z1-Z3, one specimen were used and
the tensile load was applied at the top with end fixed. For Z1, two prestressing steel bars passed
throw each concrete beam, the prestressing load was 600 kN too. So the compression tests D1,
D2 and the tension test Z1 were prestressed in transverse direction; the tests Z2 and Z3 had no
transverse prestressing. In Table 7 and Figure 15 the test details and results are listed up.
In figure 15, it is clear that the endurance increases remarkably due to transverse compression.
But because of the scarce test numbers, the results are not sufficient for a safe statement.

Fatigue strength of shear connectors February 2011
16 / 58
Figure 14 - Push-out-specimen used by Roik and Hanswille (Roik and Hanswille 1990)
Table 7 - Test results by Roik and Hanswille (1989)
Test fc fy fu d Pmax Pmin ΔP Δτ N
MPa MPa MPa mm kN kN kN MPa (×103)
1 D1 40.8 373.0 485.0 22 62.3 8.0 54.4 143 2875.0
2 D2 40.8 373.0 485.0 22 62.3 8.0 54.4 143 2550.0
3 Z1 51.3 373.0 485.0 22 70.7 8.4 62.3 164 2940.0
4 Z2 32.5 373.0 485.0 22 70.7 8.4 62.3 164 170.0
5 Z3 31.5 373.0 485.0 22 70.7 8.4 62.3 164 1335.0
10
100
1000
1000 10000 100000 1000000 10000000
Stre
ss R
ange
(Mpa
)
Number of cycles (N)
Eurocode 4
Figure 15 - Test results by Roik and Hanswille (1989)

Fatigue strength of shear connectors February 2011
17 / 58
2.7. Tests by Naithani and Gupta
Naithani and Gupta (1988) reported on 12 specimens with stud shear connectors tested with a
new kind of test set-up as shown in Figure 16. In this kind of test set-up, the shear transfer at the
interface of steel and concrete may be unaccompanied by moment, and it was unaffected by
‘group effect’. A group of 12 specimens was subjected to uniform conditions of fatigue loading.
These were tested for varying stress ranges, keeping the concrete strength approximately the
same. In Table 8 the test details and results are listed up.
Based on the tests, the following relationship had resulted between the life and stress range for
an 18 mm diameter stud connectors by authors, as: log 7.595 0.02827N τ= − Δ (4)
The tests results dotted in Figure 17 are compared to AASHTO and the Slutter and Fisher’s
results, obviously, the former results are lower to AASHTO and the latter, because of the
difference between test methods and the disappearance of ‘group effect’. If equation (4) applied
in design, the values of stress range obtained by this equation would result in a lower value and
may lead to be a much safer design.
Figure 16 - New Standard test specimen used by Naithani and Gupta (1988)

Fatigue strength of shear connectors February 2011
18 / 58
Table 8 - Test results by Naithani and Gupta (1988)
Test fc fy fu d Pmax Pmin ΔP Δτ N
MPa MPa MPa mm kN kN kN MPa (×103)
1 F1 26.8 295.0 450.0 18 49.2 10.0 39.2 154.2 1.0
2 F2 25.0 295.0 450.0 18 49.2 10.0 39.2 154.2 3.2
3 F3 31.5 295.0 450.0 18 39.4 10.0 29.4 115.65 23.0
4 F4 30.5 295.0 450.0 18 39.4 10.0 29.4 115.65 21.0
5 F5 20.0 295.0 450.0 18 34.5 10.0 24.5 96.38 68.0
6 F6 20.8 295.0 450.0 18 34.5 10.0 24.5 96.38 78.0
7 F7 25.0 295.0 450.0 18 29.6 10.0 19.6 77.1 266.0
8 F8 26.8 295.0 450.0 18 29.6 10.0 19.6 77.1 48.0
9 F9 21.7 295.0 450.0 18 24.7 10.0 14.7 57.83 1150.0
10 F10 20.6 295.0 450.0 18 24.7 10.0 14.7 57.83 685.0
11 F11 28.0 295.0 450.0 18 22.3 10.0 12.3 48.2 2000.0*
12 F11' 28.0 295.0 450.0 18 24.7 10.0 14.7 57.83 1247.5
13 F12 26.7 295.0 450.0 18 19.8 10.0 9.8 38.55 2512.0*
* No failure
0
20
40
60
80
100
120
140
160
180
200
1000 10000 100000 1000000 10000000
Stre
ss R
ange
(Mpa
)
Number of cycles (N)
Naithani and Gupta'88
Slutter and Fisher'66
AASHTO
Equation (4)
Figure 17 - Test results by Naithani and Gupta (1988)

Fatigue strength of shear connectors February 2011
19 / 58
2.8. Tests by Faust and Leffer
Faust and Leffer (2000) reported push-out tests performed with headed studs embedded in
lightweight aggregate concrete (LWAC). The specimens were tested under cyclic loading and
the test set-up is shown in Figure 18. Four headed studs with 22 mm diameter and 125 mm
height were welded on the flanges of the steel section. Two steel bars were attached at the end in
order to take over tensile forces which tend to separate the slab from the steel beam. No details
were given concerning the rebar. The test details and results are listed up in Table 9 and Figure
17.Compared to design provision in Eurocde 4 for headed studs in normal aggregate concrete,
the fatigue strength curve in somewhat more inclined in case of LWAC. And so far the results
conducted that the Eurocode 4 is conservative for LWAC with closed structure.
Figure 18 - Push-out-specimen used by Faust and Leffer (2000)
Table 9 - Test results by Faust and Leffer (2000)
Test fc fy fu d Pmax Pmin ΔP Δτ N
MPa MPa MPa mm kN kN kN MPa (×103)
1 1 48.00 - - 22 69 26 42 110.9 566.0
2 2 48.00 - - 22 69 26 42 110.9 522.6
3 3 48.00 - - 22 69 25 44 116.0 720.0
4 4 48.00 - - 22 69 15 54 141.8 83.7
5 5 48.00 - - 22 69 14 55 144.4 103.6
6 6 48.00 - - 22 69 13 56 147.0 96.5
7 7 48.00 - - 22 69 5 64 167.6 60.4
8 8 48.00 - - 22 69 27 41 108.3 550.0
9 9 48.00 - - 22 69 29 39 103.2 907.0
10 10 48.00 - - 22 69 29 39 103.2 913.0
11 11 48.00 - - 22 69 7 62 162.5 39.1
Fatigue strength of shear connectors February 2011
20 / 58
10
100
1000
1000 10000 100000 1000000 10000000
Stre
ss R
ange
(Mpa
)
Number of cycles (N)
Eurocode 4
Figure 19 - Test results by Faust and Leffer (2000)
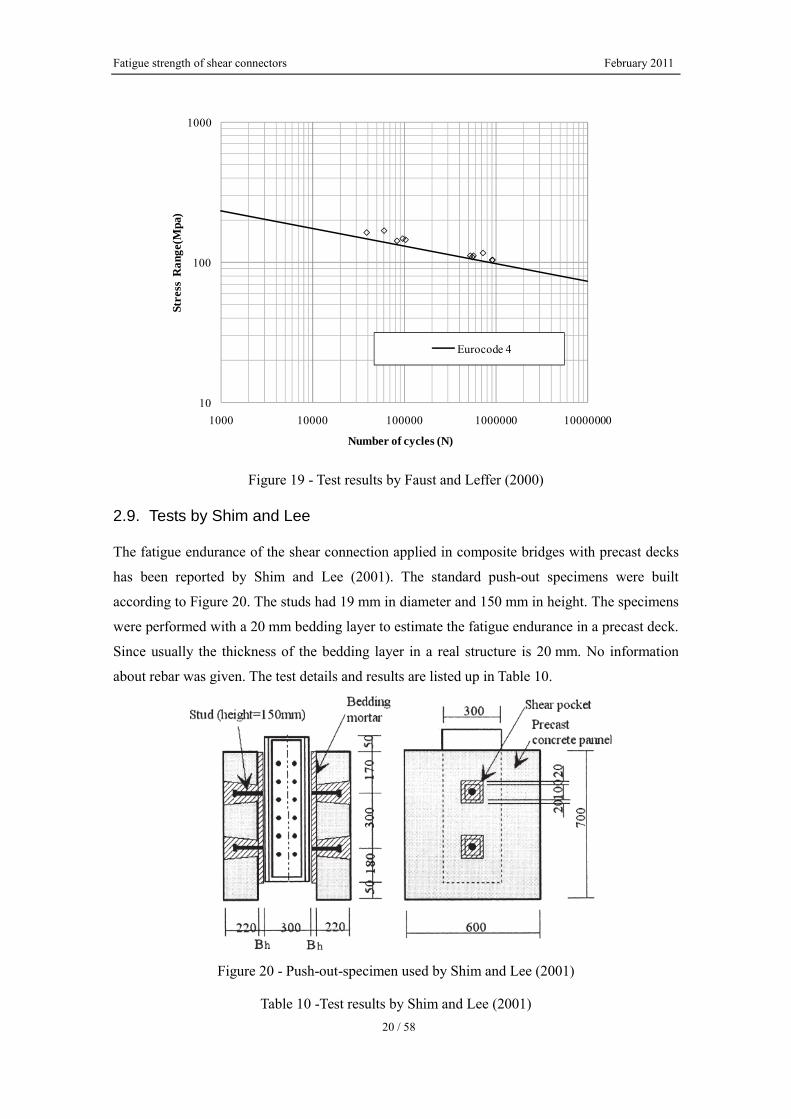
2.9. Tests by Shim and Lee
The fatigue endurance of the shear connection applied in composite bridges with precast decks
has been reported by Shim and Lee (2001). The standard push-out specimens were built
according to Figure 20. The studs had 19 mm in diameter and 150 mm in height. The specimens
were performed with a 20 mm bedding layer to estimate the fatigue endurance in a precast deck.
Since usually the thickness of the bedding layer in a real structure is 20 mm. No information
about rebar was given. The test details and results are listed up in Table 10.
Figure 20 - Push-out-specimen used by Shim and Lee (2001)
Table 10 -Test results by Shim and Lee (2001)
Fatigue strength of shear connectors February 2011
21 / 58
Test fc fy fu d Pmax Pmin ΔP Δτ N
MPa MPa MPa mm kN kN kN MPa (×103)
1 F150A 54.88 - 450.0 19 36.75 1.25 35.50 125.2 75.0
2 F170A 54.88 - 450.0 19 41.66 1.25 40.40 142.5 68.0
3 F130B 61.09 - 450.0 19 31.85 1.25 30.59 107.9 380.0
4 F150B 61.09 - 450.0 19 36.75 1.25 35.50 125.2 210.0
5 F180B 61.09 - 450.0 19 44.10 1.25 42.84 151.1 63.0
6 F130C 71.38 - 450.0 19 31.85 1.25 30.59 107.9 410.0
7 F150C 71.38 - 450.0 19 36.75 1.25 35.50 125.2 490.0
8 F180C 71.38 - 450.0 19 44.10 1.25 42.84 151.1 49.0
9 F180C 71.38 - 450.0 19 44.10 1.25 42.84 151.1 60.0
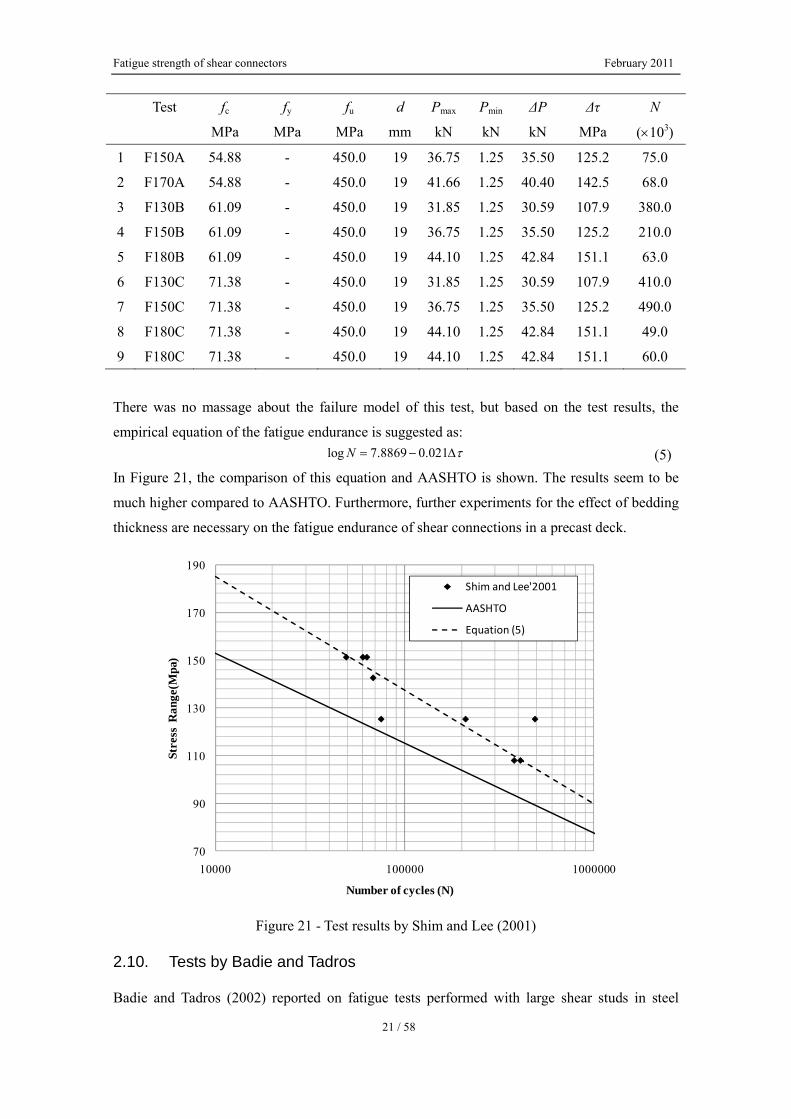
There was no massage about the failure model of this test, but based on the test results, the
empirical equation of the fatigue endurance is suggested as: log 7.8869 0.021N τ= − Δ (5)
In Figure 21, the comparison of this equation and AASHTO is shown. The results seem to be
much higher compared to AASHTO. Furthermore, further experiments for the effect of bedding
thickness are necessary on the fatigue endurance of shear connections in a precast deck.
70
90
110
130
150
170
190
10000 100000 1000000
Stre
ss R
ange
(Mpa
)
Number of cycles (N)
Shim and Lee'2001
AASHTO
Equation (5)
Figure 21 - Test results by Shim and Lee (2001)
2.10. Tests by Badie and Tadros
Badie and Tadros (2002) reported on fatigue tests performed with large shear studs in steel

Fatigue strength of shear connectors February 2011
22 / 58
bridge girders. The diameter of the steel studs was 31.8 mm. these kinds of studs had about
twice the static ultimate strength than the 22.2 mm studs, so fewer studs were required along the
height of steel girder. L-shaped specimens with different kinds of rebar were examined as
shown in Figure 22. The height of studs was 140 mm. During the tests, fatigue loading was
applied until two million cycles were reached or failure occurred; whichever occurred first. If
the test specimen endured the two million cycles without failure, a maximum monotonic load
would be applied. During this monotonic loading, slip and load were recorded. The test details
and results are listed up in Table 11.
Figure 22 - L-shaped specimen used by Badie and Tadros (2002)
Table 11 - Test results by Badie and Tadros (2002)
Test fc fy fu d Pmax Pmin ΔP Δτ N
MPa MPa MPa mm kN kN kN MPa (×103)
1 LS-5-25A 48.00 340.0 440.0 31.8 164 27 137 172.4 49.0
2 LS-5-25B 48.00 340.0 440.0 31.8 164 27 137 172.4 50.0
3 LS-5-23A 48.00 340.0 440.0 31.8 153 27 126 158.6 74.0
4 LS-5-21 48.00 340.0 440.0 31.8 142 27 115 144.8 94.0
5 LS-5-20 48.00 340.0 440.0 31.8 137 27 110 137.9 554.0
6 LS-5-19 48.00 340.0 440.0 31.8 131 27 104 131.0 567.0
7 LS5-18A 48.00 340.0 440.0 31.8 126 27 99 124.1 166.0
8 LS5-18B 48.00 340.0 440.0 31.8 126 27 99 124.1 2533.0
9 LS-5-17 48.00 340.0 440.0 31.8 120 27 93 117.2 1636.0
10 LS-5-16 48.00 340.0 440.0 31.8 115 27 88 110.3 1372.0
11 LS-5-15 48.00 340.0 440.0 31.8 110 27 82 103.4 2000.0*
12 LS-5-14 48.00 340.0 440.0 31.8 104 27 77 96.5 2594.0*
13 LS-5-10A 48.00 340.0 440.0 31.8 82 27 55 68.9 4680.0*
14 LS-5-10B 48.00 340.0 440.0 31.8 82 27 55 68.9 6708.0*
15 SS-5-25 48.00 290.0 340.0 22.2 80 13 67 172.4 27.0

Fatigue strength of shear connectors February 2011
23 / 58
16 SS-5-23 48.00 290.0 340.0 22.2 75 13 61 158.6 60.0
17 SS-5-21 48.00 290.0 340.0 22.2 69 13 56 144.8 285.0
18 SS-5-20 48.00 290.0 340.0 22.2 67 13 53 137.9 189.0
19 SS-5-19 48.00 290.0 340.0 22.2 64 13 51 131.0 157.0
20 SS-5-18 48.00 290.0 340.0 22.2 61 13 48 124.1 935.0
21 SS-5-17 48.00 290.0 340.0 22.2 59 13 45 117.2 400.0
22 SS-5-16 48.00 290.0 340.0 22.2 56 13 43 110.3 245.2
23 SS-5-15 48.00 290.0 340.0 22.2 53 13 40 103.4 600.0
24 SS-5-14 48.00 290.0 340.0 22.2 51 13 37 96.5 2000.0*
25 SS-5-10 48.00 290.0 340.0 22.2 40 13 27 68.9 2500.0*
* No failure
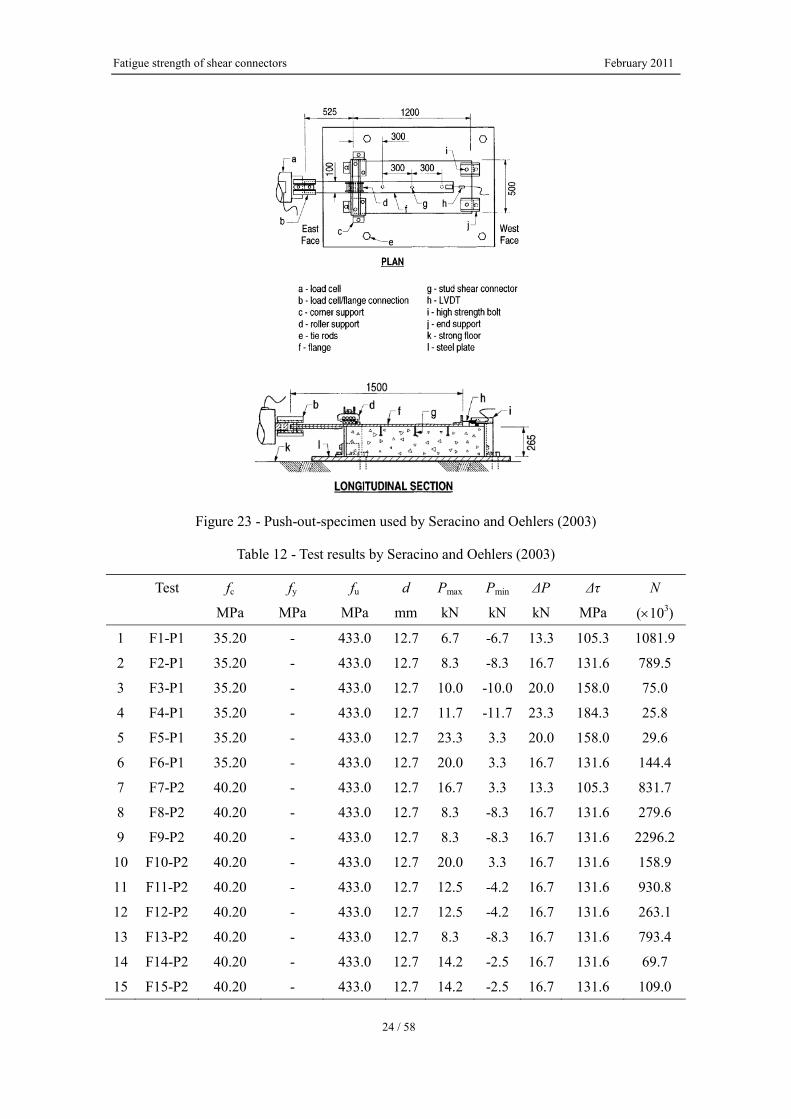
2.11. Tests by Seracino and Oehlers
A new push-pull specimen was developed by Seracino and Oehlers (2003) to provide a better
understanding of bi-directional cyclic fatigue behavior of stud shear connectors. The pull-push
test setup is shown in Figure 23. The specimen was restrained by four supports located at each
corner of the concrete block. No internal reinforcement was placed near the connectors. Three
stud shear connectors with 75 mm height and 12.7 mm diameter were welded onto a steel plate
(flange). The studs presented 300 mm spacing and were embedded in concrete. The test details
and results are listed up in Table 12 and Figure 24. The tests confirmed that for a given range of
load, the fatigue life of connectors subjected to bi-directional cyclic loading is normally longer
than those subjected to unidirectional loads only, with the exception of two bi-directional tests,
F14-P2 and F15-P2 where Pmax/ΔP=0.85. Similarly, it proved the fatigue characteristics gotten
from test results of Slutter and Fisher (1966) and Mainstone and Menzies (1967).
It was also shown in this test that the rate of increase in slip per cycle is constant over most of
the fatigue life with a rapid increase near the end so that, if monitored, can be used to provide
adequate warning of failure.
Fatigue strength of shear connectors February 2011
24 / 58
Figure 23 - Push-out-specimen used by Seracino and Oehlers (2003)
Table 12 - Test results by Seracino and Oehlers (2003)
Test fc fy fu d Pmax Pmin ΔP Δτ N
MPa MPa MPa mm kN kN kN MPa (×103)
1 F1-P1 35.20 - 433.0 12.7 6.7 -6.7 13.3 105.3 1081.9
2 F2-P1 35.20 - 433.0 12.7 8.3 -8.3 16.7 131.6 789.5
3 F3-P1 35.20 - 433.0 12.7 10.0 -10.0 20.0 158.0 75.0
4 F4-P1 35.20 - 433.0 12.7 11.7 -11.7 23.3 184.3 25.8
5 F5-P1 35.20 - 433.0 12.7 23.3 3.3 20.0 158.0 29.6
6 F6-P1 35.20 - 433.0 12.7 20.0 3.3 16.7 131.6 144.4
7 F7-P2 40.20 - 433.0 12.7 16.7 3.3 13.3 105.3 831.7
8 F8-P2 40.20 - 433.0 12.7 8.3 -8.3 16.7 131.6 279.6
9 F9-P2 40.20 - 433.0 12.7 8.3 -8.3 16.7 131.6 2296.2
10 F10-P2 40.20 - 433.0 12.7 20.0 3.3 16.7 131.6 158.9
11 F11-P2 40.20 - 433.0 12.7 12.5 -4.2 16.7 131.6 930.8
12 F12-P2 40.20 - 433.0 12.7 12.5 -4.2 16.7 131.6 263.1
13 F13-P2 40.20 - 433.0 12.7 8.3 -8.3 16.7 131.6 793.4
14 F14-P2 40.20 - 433.0 12.7 14.2 -2.5 16.7 131.6 69.7
15 F15-P2 40.20 - 433.0 12.7 14.2 -2.5 16.7 131.6 109.0

Fatigue strength of shear connectors February 2011
25 / 58
10
100
1000
1000 10000 100000 1000000 10000000
Stre
ss R
ange
(Mpa
)
Number of cycles (N)
bi-directional loading unidirectional loading
Eurocode 4
Figure 24 - Test results by Seracino and Oehlers (2003)
2.12. Tests by Lee and Shim
Lee and Shim (2005) reported on fatigue tests of large stud shear connectors, namely the
diameters of 25 mm, 27 mm and 30 mm. Standard push-out specimens were tested as shown in
Figure 25. The rebar had 16 mm diameter. The studs presented 155 mm height. The test details
and results are listed up in Table 13.
Figure 25 - Push-out-specimen used by Lee and Shim (2005)

Fatigue strength of shear connectors February 2011
26 / 58
Table 13 - Test results by Lee and Shim (2005)
Test fc fy fu d Pmax Pmin ΔP Δτ N
MPa MPa MPa mm kN kN kN MPa (×103)
1 FT25-A1 30.0 353.0 426.0 25 49.1 0.0 49.1 100 2134.0
2 FT25-A2 30.0 353.0 426.0 25 73.6 0.0 73.6 150 44.8
3 FT25-A3 30.0 353.0 426.0 25 83.4 0.0 83.4 170 60.0
4 FT25-B1 40.0 353.0 426.0 25 63.8 0.0 63.8 130 387.2
5 FT25-B2 40.0 353.0 426.0 25 73.6 0.0 73.6 150 61.1
6 FT25-B3 40.0 353.0 426.0 25 87.0 0.0 87.0 177.3 5.3
7 FT27-A1 30.0 353.0 426.0 27 73.5 0.0 73.5 128.4 142.6
8 FT27-A2 30.0 353.0 426.0 27 85.9 0.0 85.9 150 22.5
9 FT27-A3 30.0 353.0 426.0 27 97.3 0.0 97.3 170 13.8
10 FT30-A1 30.0 353.0 426.0 30 91.9 0.0 91.9 130 75.5
11 FT30-A2 30.0 353.0 426.0 30 106.0 0.0 106.0 150 10.4
12 FT30-A3 30.0 353.0 426.0 30 110.3 0.0 110.3 156.1 19.3
The test results including the test results by Badie and Tadros (2002) are plotted in Figure 26. It
was proved that fatigue endurance obtained from the tests was slightly lower than the current
S-N curve in eurocode 4.
10
100
1000
1000 10000 100000 1000000 10000000
Stre
ss R
ange
(Mpa
)
Number of cycles (N)
31.8mm by Badie&Tadro'02 22mm by Badie&Tadro'0225mm by Lee&Shim'05 27mm by Lee&Shim'0530mm by Lee&Shim'05 EC4
Figure 26 - Relation between stress range and fatigue life for large studs
Fatigue strength of shear connectors February 2011
27 / 58
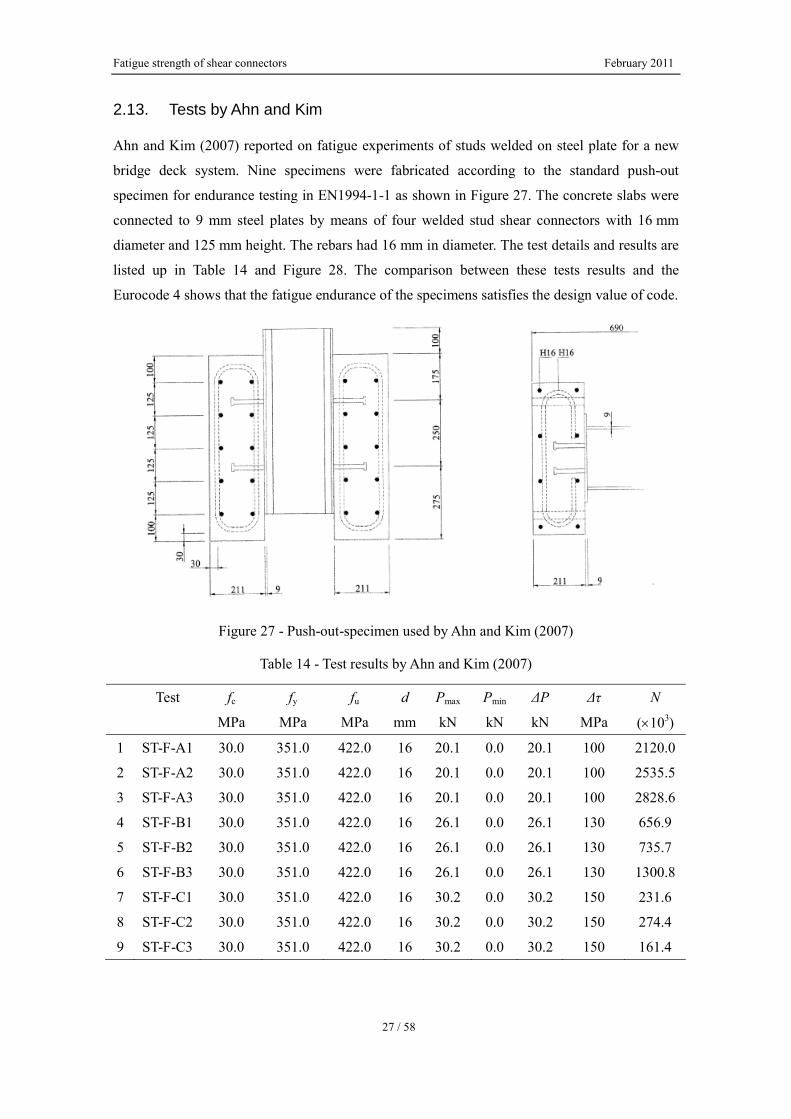
2.13. Tests by Ahn and Kim
Ahn and Kim (2007) reported on fatigue experiments of studs welded on steel plate for a new
bridge deck system. Nine specimens were fabricated according to the standard push-out
specimen for endurance testing in EN1994-1-1 as shown in Figure 27. The concrete slabs were
connected to 9 mm steel plates by means of four welded stud shear connectors with 16 mm
diameter and 125 mm height. The rebars had 16 mm in diameter. The test details and results are
listed up in Table 14 and Figure 28. The comparison between these tests results and the
Eurocode 4 shows that the fatigue endurance of the specimens satisfies the design value of code.
Figure 27 - Push-out-specimen used by Ahn and Kim (2007)
Table 14 - Test results by Ahn and Kim (2007)
Test fc fy fu d Pmax Pmin ΔP Δτ N
MPa MPa MPa mm kN kN kN MPa (×103)
1 ST-F-A1 30.0 351.0 422.0 16 20.1 0.0 20.1 100 2120.0
2 ST-F-A2 30.0 351.0 422.0 16 20.1 0.0 20.1 100 2535.5
3 ST-F-A3 30.0 351.0 422.0 16 20.1 0.0 20.1 100 2828.6
4 ST-F-B1 30.0 351.0 422.0 16 26.1 0.0 26.1 130 656.9
5 ST-F-B2 30.0 351.0 422.0 16 26.1 0.0 26.1 130 735.7
6 ST-F-B3 30.0 351.0 422.0 16 26.1 0.0 26.1 130 1300.8
7 ST-F-C1 30.0 351.0 422.0 16 30.2 0.0 30.2 150 231.6
8 ST-F-C2 30.0 351.0 422.0 16 30.2 0.0 30.2 150 274.4
9 ST-F-C3 30.0 351.0 422.0 16 30.2 0.0 30.2 150 161.4

Fatigue strength of shear connectors February 2011
28 / 58
10
100
1000
1000 10000 100000 1000000 10000000
Stre
ss R
ange
(Mpa
)
Number of cycles (N)
Eurocode 4
Figure 28 – Test results by Ahn and Kim (2007)
2.14. Tests by Kwon and Engelhardt
Kwon and Engelhardt (2010) reported on fatigue tests of post-installed shear connectors, which
were applied to develop composite action in existing non-composite floor systems. Three types
of post-installed shear connectors with 22 mm diameter were tested. The shear connectors’
configuration is shown in Figure 29. A kind of direct-shear test setup for single shear connector
tests and the reinforcing bar layout of single shear connector test specimens were shown in
Figure 30. All post-installed shear connectors had a 127 mm embedment depth into the 178 mm
thick concrete block. In Table 15 the test details and results are listed up. The empirical equation
established by authors is: 536 60.01log NτΔ = − (6)
The comparison for the equation and AASHTO is shown in Figure 31. It proved that the
post-installed shear connectors showed significantly higher fatigue strength than conventional
welded shear studs. The superior fatigue strength of these post-installed shear connectors
enables the strengthening of existing bridges by using significantly fewer shear connectors than
would be possible with conventional welded shear studs.
Figure 29 - Post-installed shear connectors (Kwon and Engelhardt 2010)

Fatigue strength of shear connectors February 2011
29 / 58
Figure 30 - Direct-shear test setup and reinforcing bar layout (Kwon and Engelhardt 2010)
Table 15 - Test results by Kwon and Engelhardt (2010)
Test fc fy fu d Pmax Pmin ΔP Δτ N
MPa MPa MPa mm kN kN kN MPa (×103)
1 HASAA-15HF 44.3 - 724.0 22 43.2 4.0 39.2 103 10000.0*
2 HASAA-20HF 26.5 - 724.0 22 56.5 4.0 52.5 138 4362.9
3 HASAA-25HF 26.5 - 724.0 22 69.4 4.0 65.4 172 114.4
4 HASAA-25HF1 26.5 - 724.0 22 69.4 4.0 65.4 172 164.0
5 HASAA-30HF 26.5 - 724.0 22 82.7 4.0 78.7 207 341.6
6 HASAA-30HF1 23.5 - 628.0 22 82.7 4.0 78.7 207 58.2
7 HASAA-35HF 23.5 - 628.0 22 95.6 4.0 91.6 241 210.3
8 HASAA-40HF 23.5 - 628.0 22 108.9 4.0 104.9 276 56.1
9 DBLNB-45HF 41.6 - 724.0 22 121.8 4.0 117.8 310 5112.0*
10 HTFGB-35HF1 43.0 - 604.0 22 95.6 4.0 91.6 241 5002.7*
11 HASAA-30HF2 23.8 - 725.0 22 82.7 4.0 78.7 207 9.8
12 HASAA-30HF3 23.8 - 725.0 22 82.7 4.0 78.7 207 21.5
13 HASAA-35HF1 23.8 - 725.0 22 95.6 4.0 91.6 241 101.8
* No failure
0
50
100
150
200
250
300
350
1000 10000 100000 1000000 10000000
Stre
ss R
ange
(Mpa
)
Number of cycles (N)
AASHTO Equation (6)
Figure 31 - Test results by Kwon and Engelhardt (2010)

Fatigue strength of shear connectors February 2011
30 / 58
3. Survey over residual strength tests
3.1. Tests by Oehlers
Oehlers (1990) reported on experimental tests to show that the monotonic strength of stud shear
connectors is reduced under fatigue loads. This author established a method for the shear
connection design that allows the reduction in the monotonic strength due to fatigue loads. A
series of 14 identically manufactured push-out specimens were examined as shown in Figure 32.
The studs were 12.7 mm in diameter and 75 mm in height. No information was given about the
rebar.
The specimens were tested in three series, S, F, and M. The specimens in series S were tested to
determine the static ultimate strength, Pu, of the shear connection. Pu is the mean value of the
three results, experimentally determined as 54.3 kN. In series F, cyclic loading was
continuously applied until the connector fractured. The range of the cyclic load, 0.25 Pu, was
held constant and the peak of the cyclic load was varied. In series M, a block of cyclic loads was
applied and then the specimens were loaded monotonically to failure; the range and peak of
cyclic load was held constant and the number of cycles in a block varied. The test details and
results are listed up in Table 16. Ps is the residual static strength per connector after certain
cycling numbers.
Figure 32 - Push-out-specimen used by Oehlers (1990)
Table 16 - Test results by Oehlers (1990)
Test fc fy fu d Pmax Pmin ΔP ΔP/Pu N Ps
MPa MPa MPa mm kN kN kN (×103) kN
1 S1 60 - 458.0 12.7 52.3 - - 0 52.3
2 S2 60 - 458.0 12.7 56.0 - - 0 56.0
3 S3 60 - 458.0 12.7 54.7 - - 0 54.7
4 F1 60 - 458.0 12.7 44.9 31.3 13.6 0.25 572.0 -

Fatigue strength of shear connectors February 2011
31 / 58
5 F2 60 - 458.0 12.7 35.9 22.3 13.6 0.25 718.0 -
6 F3 60 - 458.0 12.7 26.9 13.3 13.6 0.25 1088.0 -
7 F4 60 - 458.0 12.7 26.9 13.3 13.6 0.25 895.0 -
8 F5 60 - 458.0 12.7 15.6 2.0 13.6 0.25 1251.0 -
9 F6 60 - 458.0 12.7 15.6 2.0 13.6 0.25 1507.0 -
10 M1 60 - 458.0 12.7 15.6 2.0 13.6 0.25 250.0 46.1
11 M2 60 - 458.0 12.7 15.6 2.0 13.6 0.25 500.0 43.6
12 M3 60 - 458.0 12.7 15.6 2.0 13.6 0.25 750.0 40.1
13 M4 60 - 458.0 12.7 15.6 2.0 13.6 0.25 1026.0 30.0
14 M5 60 - 458.0 12.7 15.6 2.0 13.6 0.25 1250.0 26.5
The three series results could be plotted in one diagram as shown in Figure 33. For series F, the
Pmax is taken as the longitudinal axis and for series M, the Ps is the longitudinal parameter. The
relationship between the load and the cycling number is given by the following equation: (1 )s
fu
PN NP
= − (7)
The fatigue life Nf is a purely theoretical life that can only occur if monotonic failure is
prevented, it is the fatigue life if a fatigue crack could propagate through the whole area of the
stud without the occurrence of the bright monotonic failure zone. And N can be defined as the
number of cycles of load to cause monotonic strength to reduce from Pu to Ps.
0
10
20
30
40
50
60
0 0.5 1 1.5 2 2.5
P s(kN)
N (x106)
Series S
Series F
Series M
Figure 33 – Experimental interaction between strength and Endurance
Nf

Fatigue strength of shear connectors February 2011
32 / 58
3.2. Tests by Gattesco and Giuriani
Gattesco and Giuriani (1996) reported four stud connector push-out tests, two for monotonic
loading and two for cyclic loading. The specimen details were shown in Figure 34. This special
direct test was set up in order to remove some limitations of the normal push-out test. Here the
stud shank diameter was 19 mm and overall height was 125 mm. The test details and results are
listed up in Table 17.And the value of Pu derived from static tests is 106.1 kN.
The main arm of this test was to get the information on the shape of the load-slip curves and the
damage accumulation at the end of each cycle for shear. This kind of fatigue behavior would be
well investigated in next chapter.
Figure 34 - specimen details used by Gattesco and Giuriani (1996): (a) plan of specimen; (b)
transversal section; (c) longitudinal section; (d) exploded view
Fatigue strength of shear connectors February 2011
33 / 58
Table 17 - Test results of Gattesco and Giuriani (1996)
Test fc fy fu d Pmax Pmin ΔP ΔP/Pu N Ps
MPa MPa MPa mm kN kN kN (×103) kN
1 C1 32.5 350 480 19
30 11.8 18.2 0.17 10
99.4
40 11.8 28.2 0.27 11
50 9.4 40.6 0.38 28
60 7.2 52.8 0.50 54
70 4.2 65.8 0.62 330
80 -1.2 81.2 0.77 650
80 -0.9 80.9 0.76 140
2 C2 32.5 350 480 19
50 2.25 47.75 0.45 25
96.1 70 -2 72 0.68 500
80 -9 89 0.84 100
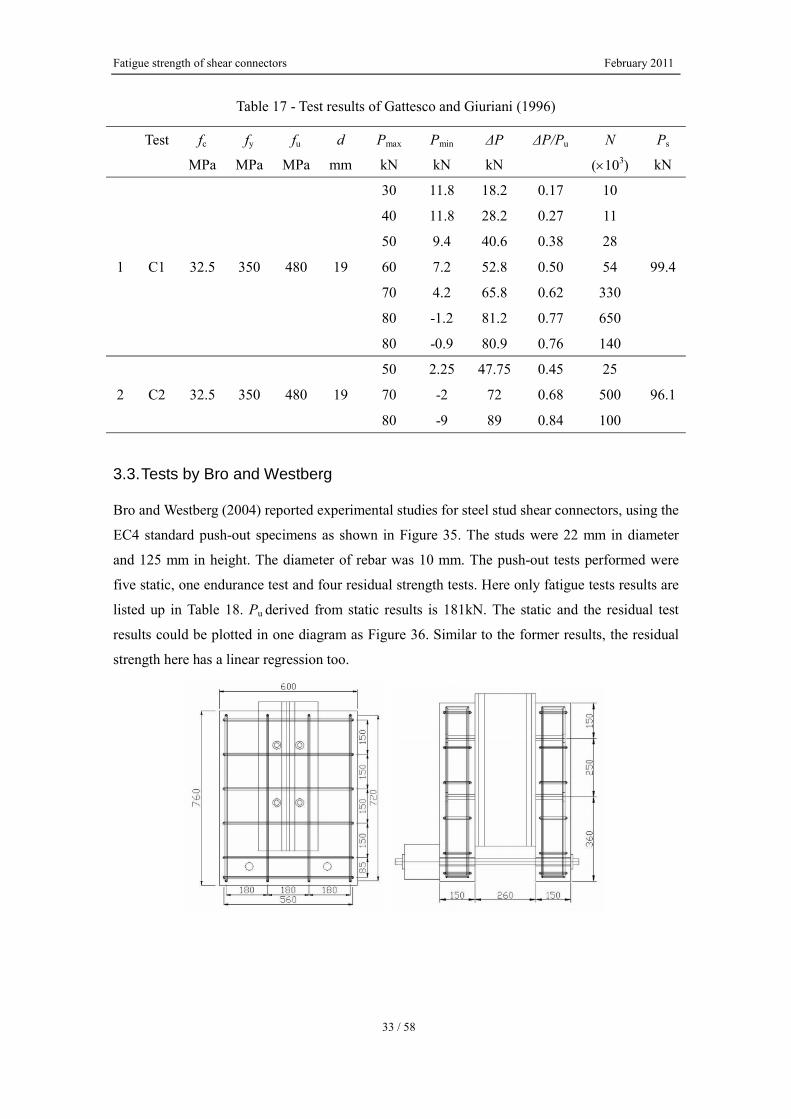
3.3. Tests by Bro and Westberg
Bro and Westberg (2004) reported experimental studies for steel stud shear connectors, using the
EC4 standard push-out specimens as shown in Figure 35. The studs were 22 mm in diameter
and 125 mm in height. The diameter of rebar was 10 mm. The push-out tests performed were
five static, one endurance test and four residual strength tests. Here only fatigue tests results are
listed up in Table 18. Pu derived from static results is 181kN. The static and the residual test
results could be plotted in one diagram as Figure 36. Similar to the former results, the residual
strength here has a linear regression too.

Fatigue strength of shear connectors February 2011
34 / 58
Figure 35 - Push-out-specimen used by Bro and Westberg (2004)
Table 18 - Test results by Bro and Westberg (2004)
Test fc fy fu d Pmax Pmin ΔP ΔP/Pu N Ps
MPa MPa MPa mm kN kN kN (×103) kN
1 1 30 350.0 450.0 22 107.5 71.3 36.2 0.20 4900 -
2 1 30 350.0 450.0 22 107.5 71.3 36.2 0.20 400 166.1
3 2 30 350.0 450.0 22 107.5 71.3 36.2 0.20 1000 161.9
4 3 30 350.0 450.0 22 107.5 71.3 36.2 0.20 1200 159.6
5 4 30 350.0 450.0 22 107.5 71.3 36.2 0.20 2000 164.1
80
100
120
140
160
180
200
0 1 2 3 4 5
P s(kN)
N (x106)
Figure 36 - Test results by Bro and Westberg (2004)
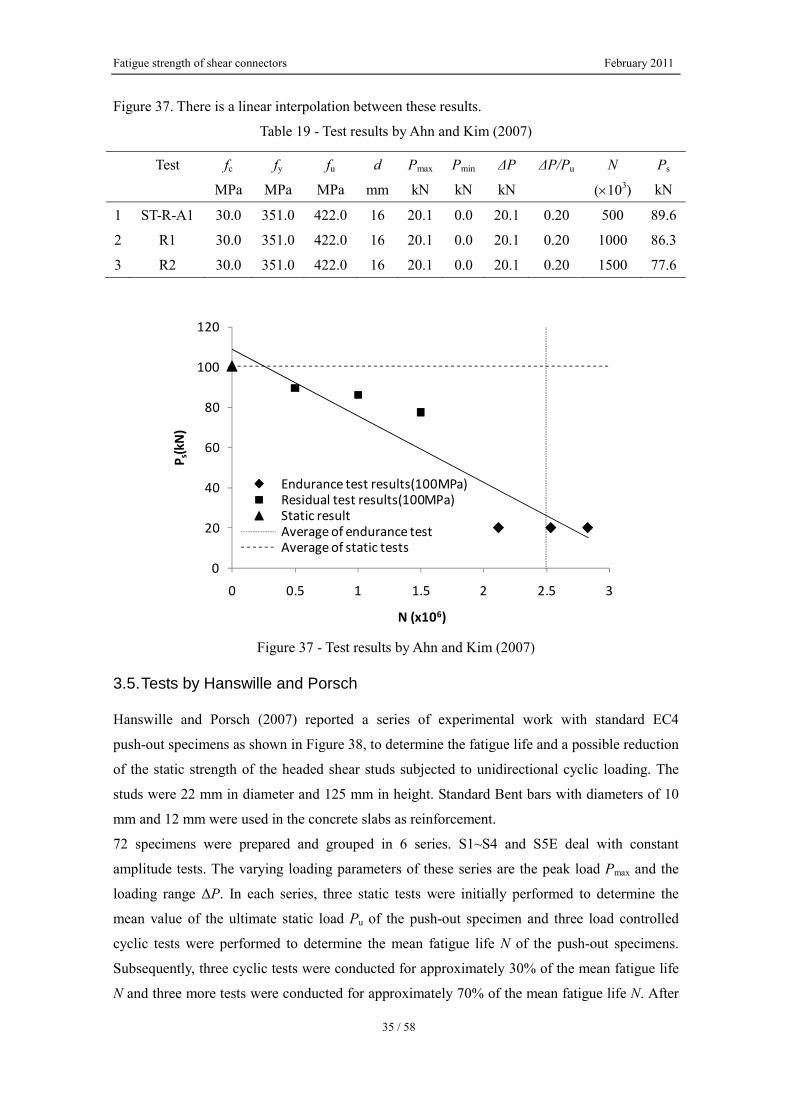
3.4. Tests by Ahn and Kim with stud connectors
Ahn and Kim (2007) also reported three residual strength tests for a new bridge deck system
using the identical specimens as shown in Figure 27. Here only the test details and results are
listed up in Table 19. Pu derived from static results is 100.5 kN.The residual strength tests
results by Ahn and Kim together with part endurance tests results in chapter 2.13 are plotted in
Fatigue strength of shear connectors February 2011
35 / 58
Figure 37. There is a linear interpolation between these results.
Table 19 - Test results by Ahn and Kim (2007)
Test fc fy fu d Pmax Pmin ΔP ΔP/Pu N Ps
MPa MPa MPa mm kN kN kN (×103) kN
1 ST-R-A1 30.0 351.0 422.0 16 20.1 0.0 20.1 0.20 500 89.6
2 R1 30.0 351.0 422.0 16 20.1 0.0 20.1 0.20 1000 86.3
3 R2 30.0 351.0 422.0 16 20.1 0.0 20.1 0.20 1500 77.6
0
20
40
60
80
100
120
0 0.5 1 1.5 2 2.5 3
P s(kN)
N (x106)
Endurance test results(100MPa)Residual test results(100MPa)Static resultAverage of endurance testAverage of static tests
Figure 37 - Test results by Ahn and Kim (2007)
3.5. Tests by Hanswille and Porsch
Hanswille and Porsch (2007) reported a series of experimental work with standard EC4
push-out specimens as shown in Figure 38, to determine the fatigue life and a possible reduction
of the static strength of the headed shear studs subjected to unidirectional cyclic loading. The
studs were 22 mm in diameter and 125 mm in height. Standard Bent bars with diameters of 10
mm and 12 mm were used in the concrete slabs as reinforcement.
72 specimens were prepared and grouped in 6 series. S1~S4 and S5E deal with constant
amplitude tests. The varying loading parameters of these series are the peak load Pmax and the
loading range ΔP. In each series, three static tests were initially performed to determine the
mean value of the ultimate static load Pu of the push-out specimen and three load controlled
cyclic tests were performed to determine the mean fatigue life N of the push-out specimens.
Subsequently, three cyclic tests were conducted for approximately 30% of the mean fatigue life
N and three more tests were conducted for approximately 70% of the mean fatigue life N. After

Fatigue strength of shear connectors February 2011
36 / 58
reaching the pre-defined number of cycles, each of these six test specimens was statically
loaded until failure, under displacement control, to obtain the reduced static strength after high
cycle preloading.
Specimens of series S5 and S6 were tested with two and four blocks of loading sequences.
These tests were performed with a constant loading range, in which the peak load was increased
or decreased subsequently while the loading range was held constant, as shown in Figure 39.
The specimen numbers of each series and the static strength are listed up in Table 20.
The test details and results of S1~S4 and S5~S6 are listed up separately in Table 21 and
Table 22.
Figure 38 - Push-out-specimen used by Hanswille and Porsch (2007)
Figure 39 - Tests with multiple block of loading (Hanswille and Porsch 2007)

Fatigue strength of shear connectors February 2011
37 / 58
Table 20 - Number of specimens tested in each series and static ultimate strength
Series S1 S2 S3 S4 S5E S5-2 S5-3 S5-4 S5-6 S6-3 S6-4
Number
Of tests
Pu 3 3 3 3 3
3 1 4 4 3 3 N 3 3 3 3 1
0.3N 3 3 3 3 1
0.7N 3 3 3 3 1
Pu (kN) 205 184 201 181 189 186 196
Table 21 - Test results by Hanswille and Porsch (S1~S4)
Test fc fy fu d Pmax Pmin ΔP ΔP/Pu N Ps
MPa MPa MPa mm kN kN kN (×103) kN
1
S1 44-52
337.0 448.0 22 90.2 49.2 41.0 0.20 6200 -
2 337.0 448.0 22 90.2 49.2 41.0 0.20 1984 154
3 337.0 448.0 22 90.2 49.2 41.0 0.20 5580 129
4
S2 42-45
337.0 448.0 22 130.6 84.6 46.0 0.25 1200 -
5 337.0 448.0 22 130.6 84.6 46.0 0.25 384 174
6 337.0 448.0 22 130.6 84.6 46.0 0.25 840 154
7
S3 53-56
337.0 448.0 22 88.4 38.1 50.3 0.25 5100 -
8 337.0 448.0 22 88.4 38.1 50.3 0.25 1224 133
9 337.0 448.0 22 88.4 38.1 50.3 0.25 3519 123
10
S4
43
337.0 448.0 22 128.5 92.3 36.2 0.20 3500 -
11 337.0 448.0 22 128.5 92.3 36.2 0.20 1015 181
12 337.0 448.0 22 128.5 92.3 36.2 0.20 2520 156
13
S5E 43
337.0 448.0 22 56.7 9.4 47.3 0.25 6400 -
14 337.0 448.0 22 56.7 9.4 47.3 0.25 3776 111
15 337.0 448.0 22 56.7 9.4 47.3 0.25 4672 114
Table 22 - Test results by Hanswille and Porsch (S5~S6)
Test fc fy fu d Pmax Pmin ΔP ΔP/Pu N Ps
MPa MPa MPa mm kN kN kN (×103) kN
1 S5-2a 43 337.0 448.0 22133 86 47 0.25 204 -
83 36 47 0.25 792 -
2 S5-2c 43 337.0 448.0 22133 86 47 0.25 198 -
83 36 47 0.25 1440 -
3 S5-3a 43 337.0 448.0 22 83 36 47 0.25 1099 -

Fatigue strength of shear connectors February 2011
38 / 58
133 86 47 0.25 - -
4 S5-4a 43 337.0 448.0 2283 36 47 0.25 473 -
56 9 47 0.25 1365 -
5 S5-4b 43 337.0 448.0 2283 36 47 0.25 517 -
56 9 47 0.25 772 -
6 S5-4c 43 337.0 448.0 2283 36 47 0.25 544 -
56 9 47 0.25 735 -
7 S5-4d 43 337.0 448.0 2283 36 47 0.25 542 -
56 9 47 0.25 3396 -
8 S5-6a 43 337.0 448.0 2256 9 47 0.25 537 -
83 36 47 0.25 5821 -
9 S5-6b 43 337.0 448.0 2256 9 47 0.25 1223 -
83 36 47 0.25 761 -
10 S5-6c 43 337.0 448.0 2256 9 47 0.25 1295 -
83 36 47 0.25 1744 -
11 S5-6d 43 337.0 448.0 2256 9 47 0.25 1277 -
83 36 47 0.25 3206 -
12 S6-3a 46 337.0 448.0 22
83 45 38 0.20 756 -
101 63 38 0.20 768 -
120 82 38 0.20 770 -
139 101 38 0.20 868 -
13 S6-3b 46 337.0 448.0 22
83 45 38 0.20 765 -
101 63 38 0.20 804 -
120 82 38 0.20 785 -
139 101 38 0.20 324 -
14 S6-3c 46 337.0 448.0 22
83 45 38 0.20 754 -
101 63 38 0.20 759 -
120 82 38 0.20 750 -
139 101 38 0.20 449 -
15 S6-4a 46 337.0 448.0 22
139 101 38 0.20 550 -
120 82 38 0.20 763 -
101 63 38 0.20 754 -
83 45 38 0.20 583 -
16 S6-4b 46 337.0 448.0 22
139 101 38 0.20 550 -
120 82 38 0.20 758 -
101 63 38 0.20 750 -

Fatigue strength of shear connectors February 2011
39 / 58
83 45 38 0.20 756 -
17 S6-4c 46 337.0 448.0 22
139 101 38 0.20 540 -
120 82 38 0.20 753 -
101 63 38 0.20 753 -
83 45 38 0.20 1208 -
Based on such massive test results, several characteristics have been found by authors. First, in
Figure 40 the results of the constant amplitude tests of series S1- S5E are compared with the
corresponding test results, from which the fatigue strength curve in Eurocode 4 was derived.
The test results are in good agreement with the given prediction according to Eurocode 4.
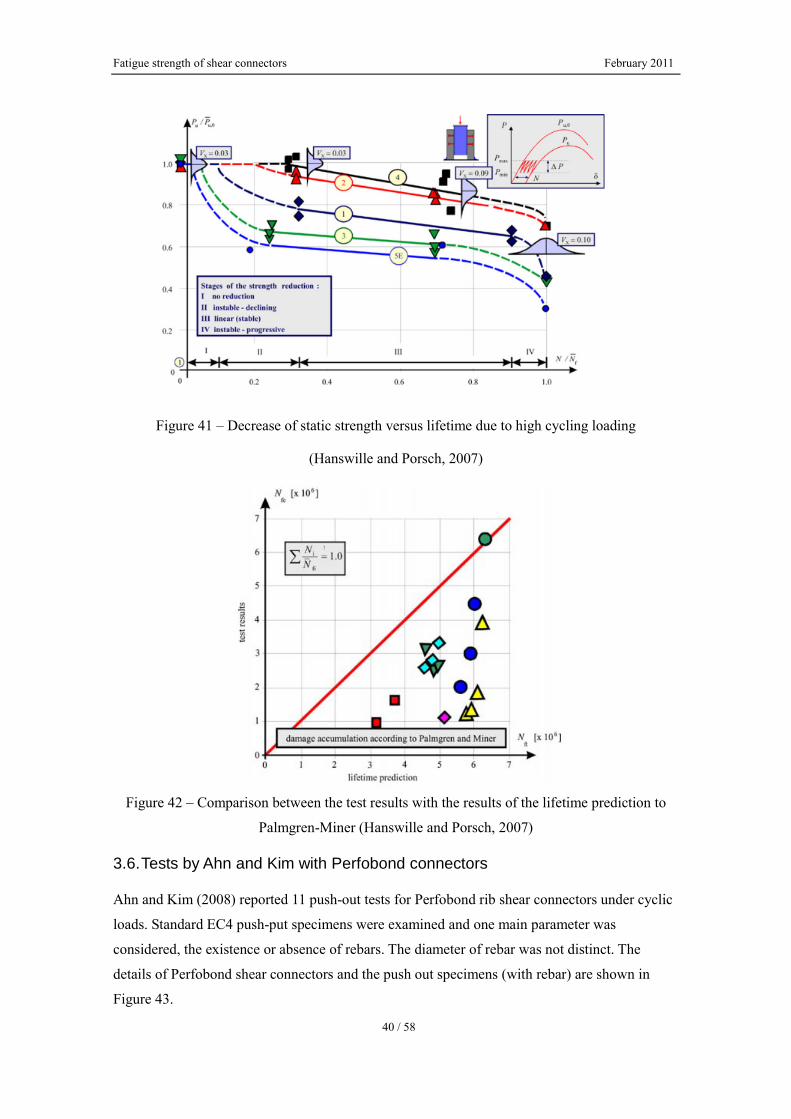
Second, in Figure 41, where the results are related to the mean static strength and the mean
fatigue life of each series respectively, it is shown that the influence of the cyclic loading
becomes evident. Especially in series S1, S3 and S5E with low peak loads, the rapid increase of
the static strength within the first 20% of the fatigue life is noteworthy. On the other hand N is
much greater for the series with high peak loads. The test results also indicate an early crack
initiation at approximately 10%-20% of the fatigue life which causes the reduction of the static
strength. Constant amplitude tests have shown that the magnitude of the peak load Pmax of the
cycle loading has a significant effect on the way cracks are formed at the stud foot.
Third, evaluation of the tests with multiple blocks of loading on the basis of linear damage
accumulation hypothesis of Palmgren and Miner, on which the present design codes rely, is
shown in Figure 42. It is obvious that expect for one test, all results of the lifetime prediction
according to Palmgren and Miner lie on the unsafe side.
Figure 40 – Comparison of fatigue test results with the prediction in Eurocode 4
(Hanswille and Porsch, 2007)
Fatigue strength of shear connectors February 2011
40 / 58
Figure 41 – Decrease of static strength versus lifetime due to high cycling loading
(Hanswille and Porsch, 2007)
Figure 42 – Comparison between the test results with the results of the lifetime prediction to
Palmgren-Miner (Hanswille and Porsch, 2007)
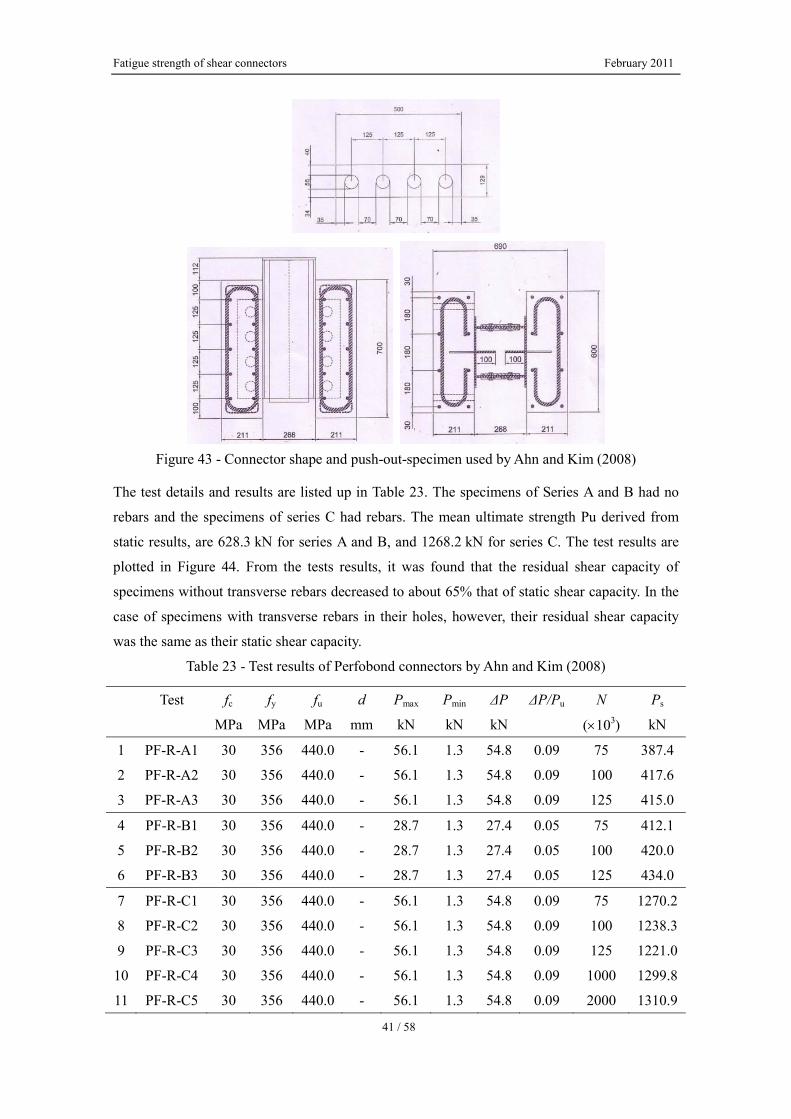
3.6. Tests by Ahn and Kim with Perfobond connectors
Ahn and Kim (2008) reported 11 push-out tests for Perfobond rib shear connectors under cyclic
loads. Standard EC4 push-put specimens were examined and one main parameter was
considered, the existence or absence of rebars. The diameter of rebar was not distinct. The
details of Perfobond shear connectors and the push out specimens (with rebar) are shown in
Figure 43.
Fatigue strength of shear connectors February 2011
41 / 58
Figure 43 - Connector shape and push-out-specimen used by Ahn and Kim (2008)
The test details and results are listed up in Table 23. The specimens of Series A and B had no
rebars and the specimens of series C had rebars. The mean ultimate strength Pu derived from
static results, are 628.3 kN for series A and B, and 1268.2 kN for series C. The test results are
plotted in Figure 44. From the tests results, it was found that the residual shear capacity of
specimens without transverse rebars decreased to about 65% that of static shear capacity. In the
case of specimens with transverse rebars in their holes, however, their residual shear capacity
was the same as their static shear capacity.
Table 23 - Test results of Perfobond connectors by Ahn and Kim (2008)
Test fc fy fu d Pmax Pmin ΔP ΔP/Pu N Ps
MPa MPa MPa mm kN kN kN (×103) kN
1 PF-R-A1 30 356 440.0 - 56.1 1.3 54.8 0.09 75 387.4
2 PF-R-A2 30 356 440.0 - 56.1 1.3 54.8 0.09 100 417.6
3 PF-R-A3 30 356 440.0 - 56.1 1.3 54.8 0.09 125 415.0
4 PF-R-B1 30 356 440.0 - 28.7 1.3 27.4 0.05 75 412.1
5 PF-R-B2 30 356 440.0 - 28.7 1.3 27.4 0.05 100 420.0
6 PF-R-B3 30 356 440.0 - 28.7 1.3 27.4 0.05 125 434.0
7 PF-R-C1 30 356 440.0 - 56.1 1.3 54.8 0.09 75 1270.2
8 PF-R-C2 30 356 440.0 - 56.1 1.3 54.8 0.09 100 1238.3
9 PF-R-C3 30 356 440.0 - 56.1 1.3 54.8 0.09 125 1221.0
10 PF-R-C4 30 356 440.0 - 56.1 1.3 54.8 0.09 1000 1299.8
11 PF-R-C5 30 356 440.0 - 56.1 1.3 54.8 0.09 2000 1310.9

Fatigue strength of shear connectors February 2011
42 / 58
300
500
700
900
1100
1300
1500
0 0.5 1 1.5 2 2.5 3
P s(kN)
N (x106)
Series ASeries BSeries CPu for Series A and BPu for Series C
Figure 44 –Test results of Perfobond connectors by Ahn and Kim
4. Survey over slip tests
4.1. Tests by Hallam
Although Hallam (1976) reported 13 push-out tests conducted under constant amplitude
unidirectional repeated loading as shown in part 2.4, the quantitative expressions for the slip
growth per cycle, as a function of the load range were developed. The load-slip data from
Hallam are listed up in Table 24. The calculation of static strength Pu was derived from CP 117-
Composite Construction in structural Steel and Concrete (BSI 1967).Here δ presents the slip per
cycle and the unit is mm.
Table 24 - Test results of stud connectors by Hallam (1976)
Test fc Pmax Pmin ΔP ΔP/Pu N δ/1000
MPa kN kN kN (x103) μm
1 PS4 35.2 49.9 2.3 47.6 0.41 1303.0 20.3
2 PS5 35.2 49.9 2.3 47.6 0.41 824.0 19.1
3 PS6 33.2 28.4 2.3 26.1 0.24 845.0 0.178
4 PS7 33.2 28.4 2.3 26.1 0.24 652.0 0.0356
5 PS8 32.8 23.2 2.3 21.0 0.20 652.0 0.0483
6 PS9 32.8 23.2 2.3 21.0 0.20 52.8 16.4
7 PS10 30.3 44.2 2.3 44.2 0.39 52.8 5.18
8 PS11 30.3 44.2 2.3 44.2 0.39 58.6 5.15
9 PS12 22.8 33.7 2.3 33.7 0.33 67.9 7
10 PS13 22.8 33.7 2.3 33.7 0.33 3170.0 20.3
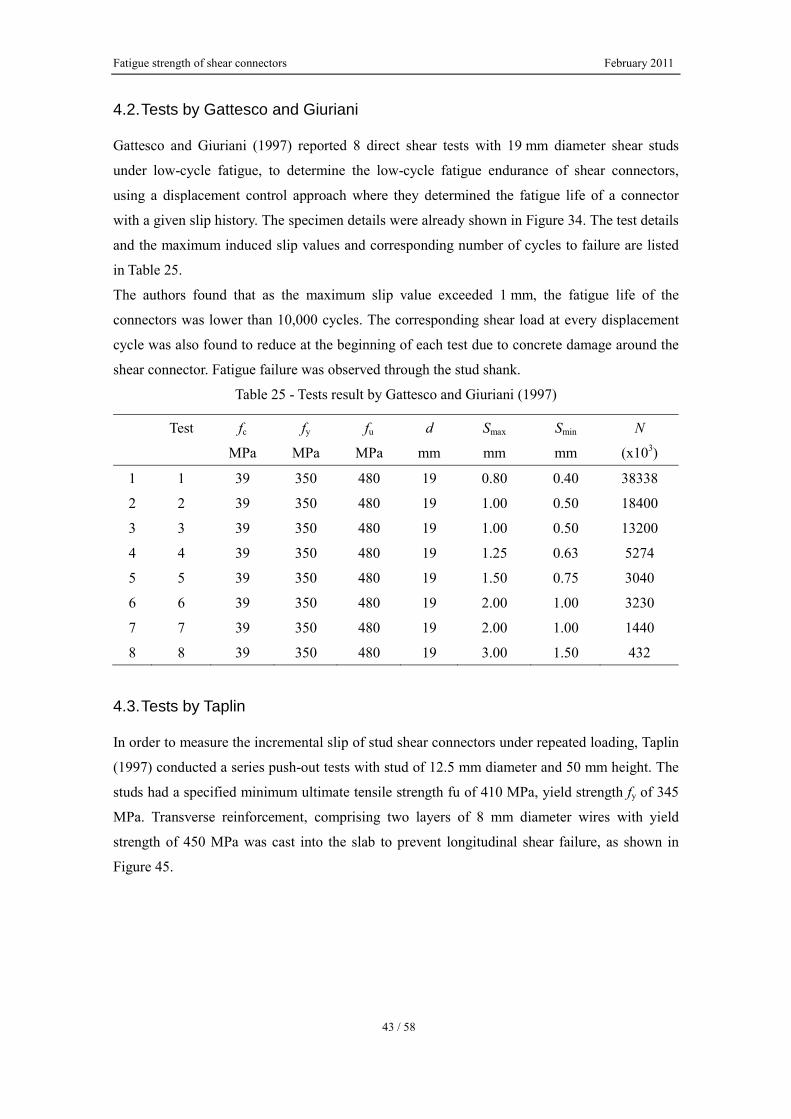
Fatigue strength of shear connectors February 2011
43 / 58
4.2. Tests by Gattesco and Giuriani
Gattesco and Giuriani (1997) reported 8 direct shear tests with 19 mm diameter shear studs
under low-cycle fatigue, to determine the low-cycle fatigue endurance of shear connectors,
using a displacement control approach where they determined the fatigue life of a connector
with a given slip history. The specimen details were already shown in Figure 34. The test details
and the maximum induced slip values and corresponding number of cycles to failure are listed
in Table 25.
The authors found that as the maximum slip value exceeded 1 mm, the fatigue life of the
connectors was lower than 10,000 cycles. The corresponding shear load at every displacement
cycle was also found to reduce at the beginning of each test due to concrete damage around the
shear connector. Fatigue failure was observed through the stud shank.
Table 25 - Tests result by Gattesco and Giuriani (1997)
Test fc fy fu d Smax Smin N
MPa MPa MPa mm mm mm (x103)
1 1 39 350 480 19 0.80 0.40 38338
2 2 39 350 480 19 1.00 0.50 18400
3 3 39 350 480 19 1.00 0.50 13200
4 4 39 350 480 19 1.25 0.63 5274
5 5 39 350 480 19 1.50 0.75 3040
6 6 39 350 480 19 2.00 1.00 3230
7 7 39 350 480 19 2.00 1.00 1440
8 8 39 350 480 19 3.00 1.50 432
4.3. Tests by Taplin
In order to measure the incremental slip of stud shear connectors under repeated loading, Taplin
(1997) conducted a series push-out tests with stud of 12.5 mm diameter and 50 mm height. The
studs had a specified minimum ultimate tensile strength fu of 410 MPa, yield strength fy of 345
MPa. Transverse reinforcement, comprising two layers of 8 mm diameter wires with yield
strength of 450 MPa was cast into the slab to prevent longitudinal shear failure, as shown in
Figure 45.

Fatigue strength of shear connectors February 2011
44 / 58
Figure 45 - Push-out specimens used by Taplin (1997)
A total of 15 push-out specimens were tested, comprising 4 monotonic tests to determine the
static strength of the stud shear connectors, 7 tests with symmetric cyclic loading, and 4 tests
with unidirectional cyclic loading. All the cyclic tests were performed with predefined load
ranges. The load was applied for 30 cycles at each load range. The rate of slip growth for all
symmetric cyclic tests is listed up in Table 26 and the rate of slip growth for all unidirectional
cyclic tests is listed up in Table 27. Here according to the results of monotonic tests, the
calculated ultimate strength Pu is 50kN.
Table 26 - Rate of slip growth for all symmetric cyclic tests
Test fc Pmax Pmin ΔP ΔP/Pu N δ/1000(μm)
MPa kN kN kN (x103) Lvdt 1 Lvdt 2
+ - + -
1 4 -
6.25 -6.25 12.50 0.25 0.03 0.94 -0.12 1.24 -0.89
9.38 -9.38 18.75 0.375 0.03 3.31 1.32 2.59 -2.65
12.50 -12.50 25.00 0.5 0.03 8.36 3.53 2.28 0.61
15.63 -15.63 31.25 0.625 0.03 48.6 8.99 23.9 7.59
2 5 47.4
6.25 -6.25 12.50 0.25 0.03 1.42 0.38 -0.27 1.24
9.38 -9.38 18.75 0.375 0.03 2.67 -0.62 1.87 0.31
11.25 -11.25 22.50 0.45 0.03 6.48 2.31 0.67
12.50 -12.50 25.00 0.5 0.03 16.8 2.02 9.67
13.75 -13.75 27.50 0.55 0.03 9.75 42.4 14.5
3 6 43.1
6.25 -6.25 12.50 0.25 0.03 1.22 0.22 0.53 0.94
9.38 -9.38 18.75 0.375 0.03 2.70 0.90 3.25 1.38
11.25 -11.25 22.50 0.45 0.03 12.1 2.09 6.33
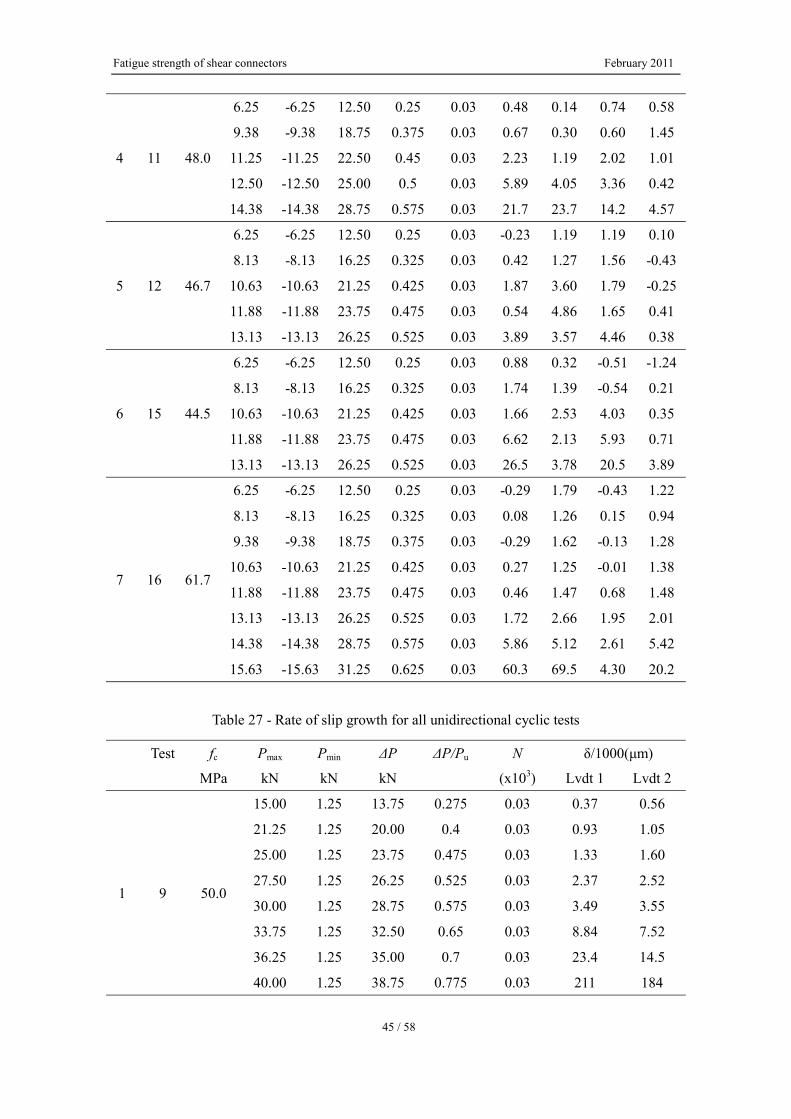
Fatigue strength of shear connectors February 2011
45 / 58
4 11 48.0
6.25 -6.25 12.50 0.25 0.03 0.48 0.14 0.74 0.58
9.38 -9.38 18.75 0.375 0.03 0.67 0.30 0.60 1.45
11.25 -11.25 22.50 0.45 0.03 2.23 1.19 2.02 1.01
12.50 -12.50 25.00 0.5 0.03 5.89 4.05 3.36 0.42
14.38 -14.38 28.75 0.575 0.03 21.7 23.7 14.2 4.57
5 12 46.7
6.25 -6.25 12.50 0.25 0.03 -0.23 1.19 1.19 0.10
8.13 -8.13 16.25 0.325 0.03 0.42 1.27 1.56 -0.43
10.63 -10.63 21.25 0.425 0.03 1.87 3.60 1.79 -0.25
11.88 -11.88 23.75 0.475 0.03 0.54 4.86 1.65 0.41
13.13 -13.13 26.25 0.525 0.03 3.89 3.57 4.46 0.38
6 15 44.5
6.25 -6.25 12.50 0.25 0.03 0.88 0.32 -0.51 -1.24
8.13 -8.13 16.25 0.325 0.03 1.74 1.39 -0.54 0.21
10.63 -10.63 21.25 0.425 0.03 1.66 2.53 4.03 0.35
11.88 -11.88 23.75 0.475 0.03 6.62 2.13 5.93 0.71
13.13 -13.13 26.25 0.525 0.03 26.5 3.78 20.5 3.89
7 16 61.7
6.25 -6.25 12.50 0.25 0.03 -0.29 1.79 -0.43 1.22
8.13 -8.13 16.25 0.325 0.03 0.08 1.26 0.15 0.94
9.38 -9.38 18.75 0.375 0.03 -0.29 1.62 -0.13 1.28
10.63 -10.63 21.25 0.425 0.03 0.27 1.25 -0.01 1.38
11.88 -11.88 23.75 0.475 0.03 0.46 1.47 0.68 1.48
13.13 -13.13 26.25 0.525 0.03 1.72 2.66 1.95 2.01
14.38 -14.38 28.75 0.575 0.03 5.86 5.12 2.61 5.42
15.63 -15.63 31.25 0.625 0.03 60.3 69.5 4.30 20.2
Table 27 - Rate of slip growth for all unidirectional cyclic tests
Test fc Pmax Pmin ΔP ΔP/Pu N δ/1000(μm)
MPa kN kN kN (x103) Lvdt 1 Lvdt 2
1 9 50.0
15.00 1.25 13.75 0.275 0.03 0.37 0.56
21.25 1.25 20.00 0.4 0.03 0.93 1.05
25.00 1.25 23.75 0.475 0.03 1.33 1.60
27.50 1.25 26.25 0.525 0.03 2.37 2.52
30.00 1.25 28.75 0.575 0.03 3.49 3.55
33.75 1.25 32.50 0.65 0.03 8.84 7.52
36.25 1.25 35.00 0.7 0.03 23.4 14.5
40.00 1.25 38.75 0.775 0.03 211 184

Fatigue strength of shear connectors February 2011
46 / 58
2 14 44.5
15.00 1.25 13.75 0.275 0.03 0.41 0.74
21.25 1.25 20.00 0.4 0.03 1.30 1.55
25.00 1.25 23.75 0.475 0.03 1.60 2.02
27.50 1.25 26.25 0.525 0.03 2.11 2.54
30.00 1.25 28.75 0.575 0.03 3.12 4.44
33.75 1.25 32.50 0.65 0.03 9.81 20.6
36.25 1.25 35.00 0.7 0.03 23.4 52.7
40.00 1.25 38.75 0.775 0.03 145 333
3 13 45.3
15.00 1.25 13.75 0.275 0.03 0.10
21.25 1.25 20.00 0.4 0.03 0.78
25.00 1.25 23.75 0.475 0.03 1.42
27.50 1.25 26.25 0.525 0.03 1.72
30.00 1.25 28.75 0.575 0.03 2.29 2.53
33.75 1.25 32.50 0.65 0.03 9.17 8.03
36.25 1.25 35.00 0.7 0.03 14.1 18.6
40.00 1.25 38.75 0.775 0.03 48.3 54.0
42.50 1.25 41.25 0.825 0.03 59.9 56.0
46.25 1.25 45.00 0.9 0.03 233 300
4 17 60.5
15.00 1.25 13.75 0.275 0.03 0.06 0.03
21.25 1.25 20.00 0.4 0.03 0.50 0.08
25.00 1.25 23.75 0.475 0.03 1.24 0.56
27.50 1.25 26.25 0.525 0.03 1.41 0.24
30.00 1.25 28.75 0.575 0.03 2.91 0.43
33.75 1.25 32.50 0.65 0.03 3.20 0.92
36.25 1.25 35.00 0.7 0.03 2.82 1.12
40.00 1.25 38.75 0.775 0.03 3.95 1.50
42.50 1.25 41.25 0.825 0.03 5.24 2.00
46.25 1.25 45.00 0.9 0.03 11.4 4.23
48.75 1.25 47.50 0.95 0.03 17.6 5.76
4.4. Tests by Valente
Valente (2007) conducted 2 static and 4 cyclic standard push-out tests with headed studs in high
strength lightweight concrete solid slabs. The studs had 13 mm diameter and 50 mm height. And
the ultimate tensile strength, fu, and yelding tensile strength, fy, were 501 MPa and 596 MPa,
respectively. Two layers of 5 mm diameter bars were disposed as shown in Figure 46. The cyclic
test details and results are listed up in Table 28. The ultimate strength Pu here is 58kN.

Fatigue strength of shear connectors February 2011
47 / 58
Figure 46 - Push-out specimens used by Valente (2007)
Table 28 - Slip results by Valente (2007)
Test fc Pmax Pmin ΔP ΔP/Pu N Ps δ/1000
MPa kN kN kN (x103) kN μm
1 CN13.3 63.79 26.7 5.1 21.6 0.38 10 58.0 3.34
2 CN13.4 63.34 31.9 4.9 27.0 0.47 16 57.7 5.33
3 CN13.5 63.79
12.4 3.7 8.7 0.15 1
58.1
0.49
24.3 3.4 21.3 0.37 1 7.38
30.6 3.5 27.1 0.47 1 20.12
36.5 3.2 33.3 0.58 1 59.24
40.3 3.2 37.1 0.65 1 143.0
4 CN13.6 56.65
16.1 4.8 11.3 0.21 1
48.2
5.92
31.9 4.5 27.4 0.51 1 69.27
40.0 4.6 35.4 0.65 1 469.23
48.2 4.5 43.7 0.81 1 28483
5. Discussion
5.1. Fatigue life calculation for studs
From the previous chapters’ description, it is clear that most of the research work for fatigue
behavior of shear connector is dealt with shear studs. These studies focused on endurance tests,
residual strength tests, low-cycle fatigue or slip behavior. In addition, Slutter and Fisher (1966)
researched the fatigue strength of channel connectors, Ann and Kim (2008) conducted residual
strength research on Perfobond shear connectors and Kwon and Engelhardt (2010) researched
the fatigue strength of post-installed shear connectors.
Because there are more research results of studs, the fatigue behavior on this kind of shear
connector is better studied, and the fatigue strength design criterions for shear studs are

Fatigue strength of shear connectors February 2011
48 / 58
established in international codes, such as Eurocode3 and 4, British code BS5400 and American
code AASHTO. Johnson (2000) reanalyzed several results obtained in fatigue tests performed
with studs and three distinct models for design were presented, the “EC model”, the “BS model”
and the “Peak load model”.
The “EC model” as shown in equation (8), takes the stress range of shear studs as the main
decisive factor for fatigue strength, no account of the static shear strength of the stud Pu or the
maximum shear force applied Pmax. It is applied now in Eurocode3 and 4 and AASHTO.
( ) 10m kN τΔ = (8)
The “BS model” used in the British Bridge Code BS5400 takes in account the stud static
strength as Equation (9) .
( / ) 10um kN P PΔ = (9)
The “Peak Load model” as shown in equation (10) is based on the work developed by Oehlers
(1990). Unlike other authors, it takes account on the maximum shear force Pmax. ( / ) 10u
m kN P Pf Δ = (10)
, where the endurance is max[1 ( / )]uf
N N P P= −
Table 29 lists up the comparison of these three models.
Table 29 - Design models for the fatigue life of shear studs
Calculation Model Basic equation Applicable equation
EC Model ( ) 10m kN τΔ = lg 8lg 21.93N τ+ Δ = (Eurocode4)
4 (238 29.51lg )Nτπ
Δ = − (AASHTO)
BS Model ( / ) 10um kN P PΔ = lg 8lg( / ) 1.29uN P P+ Δ = (BS 5400)
Peak load Model ( / ) 10u
m kN P Pf Δ = , where
max[1 ( / )]uf
N N P P= − max / 0.6uP P ≤ (applied condition)
Furthermore, Hanswille and Porsch (2007) selected and reanalyzed 65 fatigue resistance test
results since 1960s, considering the selection criteria as:
- The specimen must consist of two concrete slabs and a steel beam with headed shear studs
as shear connectors in according with Eurocode 4.
- The concrete slabs must be cast in a horizontal position.
- The stud must be welded with an adequate welding procedure ensuring the formation of a
weld collar in accordance with EN 13918 and EN 14555.

Fatigue strength of shear connectors February 2011
49 / 58
- Test must be made with sufficient transverse reinforcement.
- Only test with unidirectional loading are considered.
- Only headed shear studs in solid slabs are considered.
Then the fatigue life of headed studs in push-put specimen subjected to unidirectional cyclic
loading can be predicted with the following form:
max
max
1 2
1log
2
uf
u
PPN PP
K KP
−=
Δ−− ⋅
(11)
K1and K2 are coefficients. For push-out specimens with lateral restraints of concrete slab, they
could be taken as 1 20.1267 0.1344K K= = , and for push-out specimens without lateral restraints,
they are 1 20.1483 0.1680K K= = .
If the static tests do not exist, the static strength of the headed shear studs Pu should be
calculated with the model given in Eurocode 4. In EC4 the static strength is defined by the
minimum of the two equations where the first one corresponds to the case “steel failure” and the
other one to the case “concrete failure”: 2
1 0.37u cm cP d E f= ⋅ ⋅ (12)
22
14u uP f dπ= ⋅ (13)
In most of the tests the modulus of elasticity of concrete was not determined experimentally so
this is determined on the basis of the relations given EC2 with the following equation: 1/39500 ( )cm cE f= ⋅ (14)
To illustrate the quality of the prediction on the relationship between the experimental fatigue
life Ne and the theoretical fatigue life Nf is given in Figure 47 by Hanswille and Porsch (2007).
Although it seems to have a good quality of prediction, because of the strict selection criteria for
test results to be analyzed, the applicability of the equation (11) is limited. It could not be
available for all the test specimens.

Fatigue strength of shear connectors February 2011
50 / 58
Figure 47 – Relationship between the experimental and theoretical fatigue life(Hanswille and
Porsch, 2007)
5.2. Residual strength calculation for studs
There are two different views about the calculation models for the static residual strength of
studs after a certain number of cycling loadings. One theory is that the residual strength has a
linear regression according to the fatigue life as shown in Figure 33, Figure 36 and Figure 37,
derived by the tests results of Oehlers (1990) , Bro and Westberg (2004) and Ahn and Kim
(2007). Another is that the relationship between the residual strength and the fatigue life is
nonlinear as shown in Figure 41, derived by the test results of Hanswille and Porsch (2007).
According to equation (7) established by Oehlers (1990), the following equation is used by Bro
and Westberg (2004) to derive the residual strength: (1 )s u
f
NP PN
= − (15)
where 612.9 10fN = × for 0.2 uP PΔ = and 22d mm= .
Hanswille and Porsch (2007) established the following equation taking into account the
limitations to predict the reduced satic strength at a given number of loading cycles:
max
max
max
max
1max
0.1267 0.1344 (1 )2
max
0.74 (1 ) 0.54 0.04 ln( )
101
u
u
sP
u u PP PP P
u
P P P NP P P
N
PP
−
Δ− ⋅ ⋅ −
Δ= ⋅ ⋅ − + − ⋅
−≤⎧
⎪⎨≥⎪⎩
(16)
To illustrate the quality of prediction of these two equations, the Comparison of the
experimental and theoretical values of the reduced static strength by each equation is given in
Figure 48 and Figure 49.It seems that both equations have a precision, equation (16) has less
limitation for application, despite of the complicated formula.
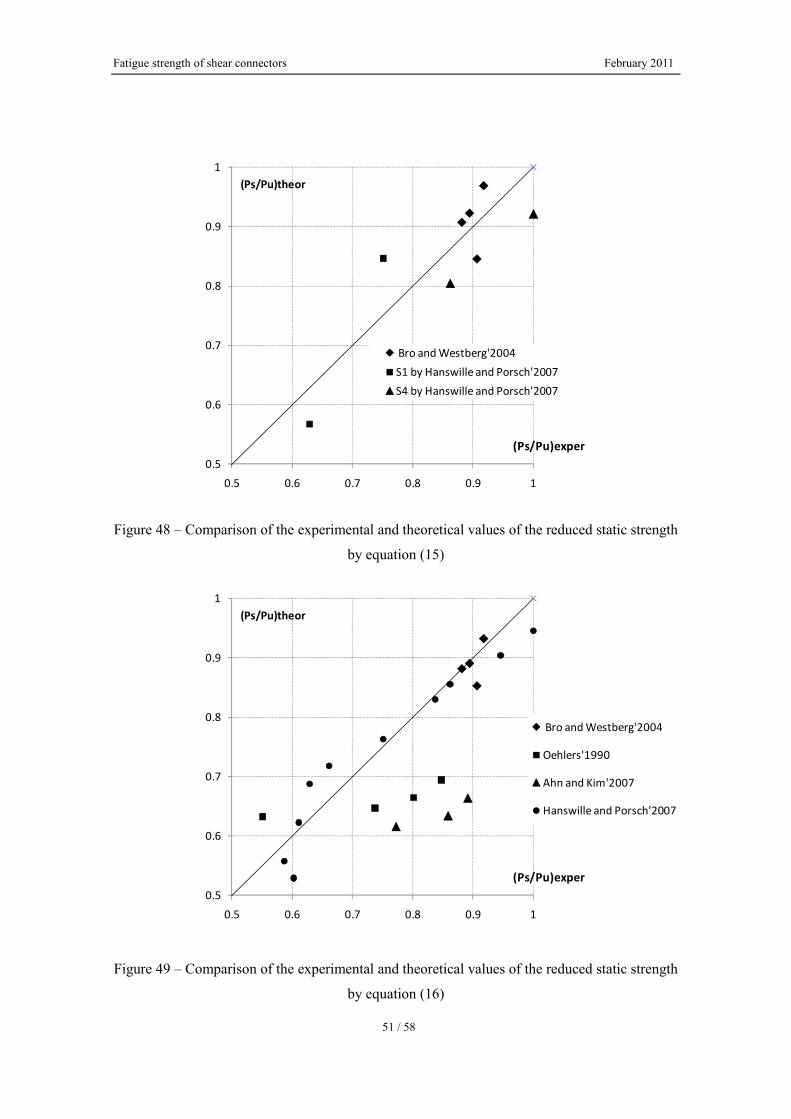
Fatigue strength of shear connectors February 2011
51 / 58
0.5
0.6
0.7
0.8
0.9
1
0.5 0.6 0.7 0.8 0.9 1
(Ps/Pu)theor
(Ps/Pu)exper
Bro and Westberg'2004
S1 by Hanswille and Porsch'2007
S4 by Hanswille and Porsch'2007
Figure 48 – Comparison of the experimental and theoretical values of the reduced static strength
by equation (15)
0.5
0.6
0.7
0.8
0.9
1
0.5 0.6 0.7 0.8 0.9 1
(Ps/Pu)theor
(Ps/Pu)exper
Bro and Westberg'2004
Oehlers'1990
Ahn and Kim'2007
Hanswille and Porsch'2007
Figure 49 – Comparison of the experimental and theoretical values of the reduced static strength
by equation (16)

Fatigue strength of shear connectors February 2011
52 / 58
5.3. Low cycle fatigue behavior of studs
Although most research has focused on loading cases in which shear connectors deform within
their elastic range, in recent years, studies have also consider cases where connectors are loaded
into their inelastic range. These studies show that loading shear connectors into their inelastic
range results in a low number of cycles to reach failure; a phenomenon called low-cycle fatigue.
Reversal of load was rarely considered and full load reversal was considered in specimens tested
by Oehlers (1995) and in tests made by Erlicher et al. (2001). Values of load reversal were
always well below the stud capacity. Fatigue life was generally in the thousands to millions of
cycles and it was determined that shear studs subjected to fatigue loading can have significantly
reduced load capacity. From these tests, fatigue-strength relationships were developed. Data was
extrapolated into the low-cycle range, inferring that only a slight loss of strength would be
expected for a low number of inelastic cycles.
Low-cycle fatigue generally concerns loading approaching or exceeding the yield capacity of a
section, with failures occurring prior to 1000 load cycles. Unidirectional testing of shear studs
considering low-cycle fatigue was performed by Gattesco and Giuriani (1996) and Gattesco et
al. (1997). Fatigue life was shown to be greatly reduced when large slip was present. Testing
was performed using a direct shear test method to model low slab compressive stresses at the
end of a typical beam section. These researchers, as well as Taplin and Grundy (1997) and
Valente (2007), noted the accumulation of slip and damage under reversed cyclic loading. Shake
down (stabilization of residual deformations in a structure during a series of repeated loading
beyond the elastic limit) did not occur, but instead incremental collapse (increasing residual
deformations until failure) was verified.
5.4. Slip characteristics for studs under repeated loading
Hallam (1976) found that the slip per cycle could be related to the load range by equation (17),
where, the slip value is expressed in millimeters.
log 10 12.99( )u
PP
δ Δ= − + (17)
Like Hallam, Lo (1978) found that the slip increases approximately linearly with cycles of
loading. He did not develop a relationship between the rate of slip growth and the magnitude of
the repeated load.
Meanwhile, Oehlers and Foley (1985) found the same principle. By assuming that the stiffness
reduction is attributable to the propagation of a fatigue crack, they proposed that the equation
for the rate of slip growth as a function of the load range should be similar in form to Paris’s
equation, that is

Fatigue strength of shear connectors February 2011
53 / 58
( ) ( )m
u
Pd Pδ α Δ (18)
By reviewing the data from Hallam and Lo, as well as their own tests results, the authors
determined the value for the coefficient m as given in Table 30.
Table 30 -Coeddicient in equation (18) for the rate of slip growth as determined by
Oehlers and Foley (1985)
Data source m
Hallam (1976) 6.7
Lo (1978) 5.0
Oehlers and Foley (1985) 4.0
All above 5.3
In the following, Oehlers and Coughlan (1986) combined the results from above authors and
their own data and proposed equation (13) for the rate of slip growth as:
51.70 10 ( )u
Pd Pδ − Δ= × (19)
Later, Taplin (1997) proposed equation (20), which corresponds to the line of best fit on the date
presented in Table 26 and Table 27. The value of slip per cycle is expressed in millimeter:
max(3.71 4.91)10 u
PPδ
−
= (20)
Valente (2007) proved that the evaluation on the rate of slip growth is influenced by the number
of load cycles performed or considered in an analysis for headed studs embedded in lightweight
concrete. The linear and the logarithmic trends were analyzed, since they gave the best
correlations between rate of slip growth and number of load cycles applied. The author
established linear and logarithmic equations for each specimen. In global terms, the logarithmic
trend is a better approach when the load range value is lower: ΔP/Pu<0.5, while the linear trend
is best fitting when the load range is higher: ΔP/Pu>0.5.For test CN 13, the linear equation is
expressed as:
log 7.11 5.79( )u
PP
δ Δ= − + (21)
The comparison of this equation and the results obtained by other authors is represented in
Figure 50. Although the equation (21) has a similar manner as the equation (18), but the values
obtained for the rate of slip growth are always higher than the values obtained by Lo. With
exception on the results obtained by Taplin (1997), it seems that the rate of slip growth is higher
for lightweight concrete than for normal density concrete.

Fatigue strength of shear connectors February 2011
54 / 58
Figure 50 – Evolution of slip depending on the cycles load range by Valente (2007)
Furthermore, based on their slip test results, Hanswille and Porsch (2007) established the
load-slip equation for headed studs under cycling loading, the relationship between applying
load Pi (kN) and the corresponding slip si (mm) under a certain cycling numbers Ni could be
expressed as:
max3.95
max
0.1041.4
(0.664 0.029) ln( 1)
u
PP
i
i uf
u i
s eP P NP P
P N
⋅⎡ ⎤−⎢ ⎥
= ⋅ ⎢ ⎥− Δ⎢ ⎥+ + ⋅ −⎢ ⎥⎣ ⎦
(22)
with the limitation for 0.8 uP PΔ ≤ . It seems to have a good prediction for their experiments. But
the general application of this equation needs more research.
6. Conclusion
This report deals with the question of fatigue strength of shear connectors. The test results of
four kinds of shear connectors as headed steel stud, channel connector, post-installed shear
connector and Perfobond connector are collected, including the test details. The results are
divided in three parts: endurance tests, static residual strength after a certain number of
high-cycle tests and the slip behavior under fatigue loading. On the basis of test results from
these three parts, a series of problems were carefully discussed such as the fatigue life
calculation models, the residual strength calculation models, the low-cycle fatigue behavior and
the slip characteristics. Based on the research, several conclusions could be derived..
(1) For headed studs, since 1960s, various researches have conducted a great number of fatigue
tests on push-out or beam test specimens, but because of different sizes and shapes of the
composite components, because of number and position of studs, because of various
Fatigue strength of shear connectors February 2011
55 / 58
restraints, the results from international test vary widely. The factors as loading mode, load
range, peak load, weld quality, stud diameter, concrete ability and static strength all seem to
have an influence on the fatigue strength of shear studs. For the test of new shear connectors,
the standard push-out specimens in Eurocode 4 is recommended.
(2) Earlier researchers view stress range is the main factor influencing high cycle life of studs,
and some provisions are established basing on their research. But researches in recent years
prove that the peak load and the static strength of studs also have remarkable influences,
since the crack of concrete around studs may redistribute the forces and cause more damage.
New principles including these effects for calculation of fatigue endurance are established
and the future application of these principles need more research.
(3) Headed studs subjected to bidirectional cyclic loading have a higher fatigue strength
compared to unidirectional cyclic loading, since fracture always starts at the side of the stud
which is subjected to bending tensile stress, it is not the full double amplitude under reversal
stress, which is responsible for damage. The test results of large diameter studs like 25 mm,
28 mm, 30 mm and 32 mm show that the fatigue endurance of large diameter is slightly
lower that Eurocode 4 predicts. For the shear studs embedded in lightweight aggregate
concrete, a somewhat more inclined S-N curve could be observed.
(4) There are linear and nonlinear two kinds of theories for calculation residual strength of
headed studs, both have good prediction with experimental results, but the linear model has
more restriction. And there are two trends to predict the slip behavior of shear studs too,
linear and the logarithmic trends, which applied to describe the relationships between the
slips with the maximum load and the ultimate static load.
(5) For channel connector, the limited test results show that the stress range at the weld position
of the channel is the main factor for fatigue strength of this kind connector. And it is proved
that the fatigue strength of the single channel specimen was equivalent to the fatigue
strength of specimens with two channel shear connectors. The orientation of the channel
connector whether facing toward or away from the applied load had no significant influence
on the fatigue life.
(6) For post-installed shear connectors, the test results show that they have significantly higher
fatigue strength than conventional welded shear studs. The superior fatigue strength of these
post-installed shear connectors enables the strengthening of existing bridges by using fewer
shear connectors. But for their usage in new composite beams, spaces should be set aside in
advance of concreting.
(7) Perfobond showed extremely high fatigue strength compared to welded studs, but the
influencing factors for their fatigue behavior are not clear yet and should be well researched
in the future.

Fatigue strength of shear connectors February 2011
56 / 58
7. References
Roik K, Hanswille G. Background Report on Eurocode4—Limit state of fatigue for headed
studs. Report EC4/11/90, 1990
Slutter RG, Fisher JW. Fatigue strength of shear connectors. Highway research record
no.147.New York, 1966
Mainstone RJ, Menzies JB. Shear connectors in steel-concrete composite beams for bridges,
Part1 and 2 concrete; 1(9-10), 1967
Roderick JW, Ansorian P. Repeated loading of composite beams. The civil engineering
transactions of the institution of engineers, Australia, Paper No. 3459, 1976
Hallam MW. The behavior of stud shear connectors under repeated loading. Research Rep.
R281, School of civil engineering, University of Sydney, 1976
Roik K, Holtkamp HJ. Unrersuchungen zur Dauer- und Betriebsfestigkeit von Verbundtragern
mit Kopfbolzendubeln. Stahlau 58, 1989
Roik K, Hanswille G. Zur Dauerfestigkeit von Kopfbolzendubeln bei verbundtragern.
Bauingenieur 62, 1987
Naithani KC, Gupta VK, Gada AD. Behavior of shear connectors under dynamic loads.
Materials and Structures/Materiaux et Constructions, 21, pp.359-363, 1988
Lee PG, Shim CS, Chang SP. Design of shear connection in composite steel and concrete bridge
with precast decks. Journal of Constructional Steel Research 57, pp.203-219, 2001
Faust T, Leffer A, Mesinger M. Fatigue of headed studs embedded in LWAC. Second
international symposium on structural lightweight aggregate concrete, pp.212-220, ISBN
82-91341-37-0, 2000
Badie SS, Tadros MK et al. Large shear studs for composite action in steel bridge girders.
Journal of Bridge Engineering, 7(3): pp.195-203, 2002
Seracino R, Oehlers DJ, Yeo MF. Behaviour of stud shear connectors subjected to bi-directional
cyclic loading. Advances in structural engineering 6(1): pp.65-75, 2003
Lee PG, Shim CS, Chang SP. Static and fatigue behavior of large stud shear connectors for
steel-concrete composite bridge. Journal of Constructional Steel Research 61, pp.1270-1285,
2005
Ahn JH, Kim SH, Jeong YJ. Fatigue experiment of stud welded on steel plate for a new bridge

Fatigue strength of shear connectors February 2011
57 / 58
deck system. Steel and composite structures, 7(5): pp.391-404, 2007
Kwon G, Engelhardt MD, Klingner RE. Behavior of post-installed shear connectors under static
and fatigue loading. Journal of Constructional Steel Research 66, pp.532-541, 2010
Oehlers DJ. Deterioration in strength of stud connectors in composite bridge beams. Journal of
structural engineering, 116(12), pp.3417-3431, 1990
Hanswille G, Porsch M, Ustundag C. Resistance of headed studs subjected to fatigue loading
Part �: experimental study. Journal of Constructional Steel Research 63, pp.101-116, 2007
Hanswille G, Porsch M, Ustundag C. Resistance of headed studs subjected to fatigue loading
Part �: analytical study. Journal of Constructional Steel Research 63, pp.485-493, 2007
Bro M, Westberg M. Infulence of fatigue on headed stud connectors in composite bridge.
Master’s thesis, Lulea University of Technology, Sweden, 2004
Ahn JH, Kim SH, Jeong YJ. Shear behavior of Perfobond rib shear connector under static and
cyclic loadings. Magazine of Concrete Research, 60(5), pp.347-357, 2008
Gattesco N, Giuriani E. Experimental study on stud shear connectors subjected to cyclic loading.
Journal of Constructional Steel Research 38(1), pp.1-21, 1996
Taplin G, Grundy P. Incremental slip of stud shear connectors under repeated loading.
Composite construction-conventional and innovative. International conference ,Innsbruck,
Sutriche, pp. 145-150, 1997
Valente MI. Experimental studies on shear connection systems insteel and lightweight concrete
composite bridges. Doctoral thesis. University of Minho, Portugal, 2007
Gattesco N, Giuriani E, Gubana A. Low-cycle fatigue test on stud shear connectors. Journal of
Structural Engineering 123(2), pp.145-150, 1997
Johnson RP. Resistance of stud shear connectors to fatigue. Journal of Constructional Steel
Research 56, pp.101-116, 2000
European Committee for Standardization.Eurocode4-Design of composite steel and concrete
structures, Part2:bridges, 1994
European Committee for Standardization.Eurocode3-Design of steel structures, 2005
American Association of State Highway and Transportation Officials. AASHTO LRFD.Bridge
design specifications. 3rd edition, 2004
British Standards Institution. BS5400, Steel, concrete and composite bridges, Part 10, Fatigue,
1980
Fatigue strength of shear connectors February 2011
58 / 58
Erlicher S, Bursi OS, Zandonimi R. Low-cycle fatigue behavior of pull-push specimens with
headed stud shear connectors, International Symposium on Connections between Steel and
Concrete, University of Stuttgart, Vol.2, pp.1303-1312, 2001
Oehlers DJ. Design and assessment of shear connectors in composite bridge beams.Journal of
Structural Engineering ASCE, Vol. 121, No. 2, February, pp. 214-224, 1995
Oehlers DJ, Foley L. The fatigue strength of stud shear connections in composite beams.
Proceedings ICE, Pt. 2 79, pp. 349-364, 1985
Lo KK. Fatigue behaviour of stud connectors in composite plate and slab systems. MEngSc
Thesis, University of Melbourne, 1978
Oehlers DJ, Coughlan CG. The shear stiffness of stud shear connections in composite beams.
Journal of Constructional Steel Research, Vol. 6, pp. 273-284, 1986