jprobe reference guideusdownloads.quest.com.edgesuite.net/.../referenceguide.pdf · chapter 4...
TRANSCRIPT
World Headquarters5 Polaris WayAliso Viejo, CA 92656Web Site: www.quest.comEmail: [email protected]. and Canada: (949) 754-8000
JProbe Reference GuideVersion 7.0
®
January 2007
Copyright Information© 2007 Quest Software, Inc,ALL RIGHTS RESERVED.This guide contains proprietary information protected by copyright. The software described in this guide is fur-nished under a software license or nondisclosure agreement. This software may be used or copied only in accordance with the terms of the applicable agreement. No part of this guide may be reproduced or transmitted in any form or by any means, electronic or mechanical, including photocopying and recording for any purpose other than the purchaser’s personal use without the written permission of Quest Software, Inc.
Disclaimer: The information in this document is provided in connection with Quest products. No license, express or implied, by estoppel or otherwise, to any intellectual property right is granted by this document or in connection with the sale of Quest products. EXCEPT AS SET FORTH IN QUEST'S TERMS AND CONDITIONS AS SPECI-FIED IN THE LICENSE AGREEMENT FOR THIS PRODUCT, QUEST ASSUMES NO LIABILITY WHATSO-EVER AND DISCLAIMS ANY EXPRESS, IMPLIED OR STATUTORY WARRANTY RELATING TO ITS PRODUCTS INCLUDING, BUT NOT LIMITED TO, THE IMPLIED WARRANTY OF MERCHANTABILITY, FIT-NESS FOR A PARTICULAR PURPOSE, OR NON-INFRINGEMENT. IN NO EVENT SHALL QUEST BE LIABLE FOR ANY DIRECT, INDIRECT, CONSEQUENTIAL, PUNITIVE, SPECIAL OR INCIDENTAL DAMAGES (INCLUDING, WITHOUT LIMITATION, DAMAGES FOR LOSS OF PROFITS, BUSINESS INTERRUPTION OR LOSS OF INFORMATION) ARISING OUT OF THE USE OR INABILITY TO USE THIS DOCUMENT, EVEN IF QUEST HAS BEEN ADVISED OF THE POSSIBILITY OF SUCH DAMAGES. Quest makes no representations or warranties with respect to the accuracy or completeness of the contents of this document and reserves the right to make changes to specifications and product descriptions at any time without notice. Quest does not make any commitment to update the information contained in this document.
If you have any questions regarding your potential use of this material, please contact:
Quest Software World HeadquartersLEGAL Dept5 Polaris WayAliso Viejo, CA 92656
www.quest.comemail: [email protected]: 949-754-8000
Please refer to our Web site for regional and international office information.
TrademarksQuest, JProbe®, Quest Software, the Quest Software logo, Aelita, Benchmark Factory, Big Brother, DataFactory, DeployDirector, ERDisk, Fastlane, Final, Foglight, Funnel Web, I/Watch, Imceda, InLook, InTrust, IT Dad, JClass, JProbe, LeccoTech, LiveReorg, NBSpool, NetBase, PerformaSure, PL/Vision, Quest Central, RAPS, SharePlex, Sitraka, SmartAlarm, Speed Change Manager, Speed Coefficient, Spotlight, SQL Firewall, SQL Impact, SQL LiteSpeed, SQL Navigator, SQLab, SQLab Tuner, SQLab Xpert, SQLGuardian, SQLProtector, SQL Watch, Stat, Stat!, Toad, T.O.A.D., Tag and Follow, Vintela, Virtual DBA, and XRT are trademarks and registered trademarks of Quest Software, Inc. Other trademarks and registered trademarks used in this guide are property of their respective owners.
Third Party ContributionsThis product includes software developed by:Sun™, Solaris®, Java™, and HotSpot™ are trademarks or registered trademarks of Sun Microsystems, Inc. in the United States and other countries.Microsoft® and Windows® are registered trademarks of Microsoft Corporation.AIX® is a registered trademark of IBM Corporation.IBM JRE on AIXCONTAINS IBM(R) 32-bit SDK for AIX(TM), Java(TM) 2 Technology Edition, Version 5 (c) Copyright Sun Microsystems Inc, 1992, 2003. (c) Copyright International Business Machines Corporation, 1996 - 2005 (c) Copyright The Apache Software Foundation, 1999-2002All Rights Reserved These files or modules may not be 1) used for any purpose other than to enable the JProbe Suite; 2) copied (except for backup purposes); 3) further distributed; or 4) reverse assembled, reverse compiled, or otherwise translated, except as specifically permitted by law without the possibility of contractual waiver. HP® and HP-UX® are registered trademarks of Hewlett-Packard Company.Red Hat® is a registered trademark of Red Hat, Inc. in the United States and other countries.SUSE® LINUX AG is a registered trademark of SUSE AG, a Novell company.Linux® is a registered trademark of Linus Torvalds.UNIX® is a registered trademark of The Open Group in the United States and other countries.MAC OS® is a registered trademark of Apple Computer Inc. registered in the United States and other countries.This product includes software developed by the Apache Software Foundation http://www.apache.org/. This product includes software developed by Mark Martinec, copyright © 1999 Mark Martinec [email protected]. All rights reserved.This product includes software developed by the GNU Trove http://trove4j.sourceforge.net/license.shtml. This product includes code derived from software contributed to Berkeley by Henry Spencer Copyright © 1992, 1993, 1994 Henry Spencer, copyright © 1992, 1993, 1994 The Regents of the University of California. All rights reserved.
Redistribution and use in source and binary forms, with or without modification, are permitted provided that the following conditions are met:1. Redistributions of source code must retain the above copyright notice, this list of conditions and the following disclaimer.2. Redistributions in binary form must reproduce the above copyright notice, this list of conditions and the following disclaimer in the documentation and/or other materials provided with the distribution.3. All advertising materials mentioning features or use of this software must display the following acknowledgement:This product includes software developed by the University of California, Berkeley and its contributors.4. Neither the name of the University nor the names of its contributors may be used to endorse or promote products derived from this software without specific prior written permission.THIS SOFTWARE IS PROVIDED BY THE REGENTS AND CONTRIBUTORS “AS IS” AND ANY EXPRESS OR IMPLIED WARRANTIES, INCLUDING, BUT NOT LIMITED TO, THE IMPLIED WARRANTIES OF MERCHANTABILITY AND FITNESS FOR A PARTICULAR PURPOSE ARE DISCLAIMED. IN NO EVENT SHALL THE REGENTS OR CONTRIBUTORS BE LIABLE FOR ANY DIRECT, INDIRECT, INCIDENTAL, SPECIAL, EXEMPLARY, OR CONSEQUENTIAL DAMAGES (INCLUDING, BUT NOT LIMITED TO, PROCUREMENT OF SUBSTITUTE GOODS OR SERVICES; LOSS OF USE, DATA, OR PROFITS; OR BUSINESS INTERRUPTION) HOWEVER CAUSED AND ON ANY THEORY OF LIABILITY, WHETHER IN CONTRACT, STRICT LIABILITY, OR TORT (INCLUDING
NEGLIGENCE OR OTHERWISE) ARISING IN ANY WAY OUT OF THE USE OF THIS SOFTWARE, EVEN IF ADVISED OF THE POSSIBILITY OF SUCH DAMAGE.
Other trademarks and registered trademarks used in this guide are property of their respective owners.

Contents 5
Contents
About This Guide.......................................................................7
Conventions.................................................................................................................. 7
Additional Documentation ......................................................................................... 8
About Quest Software, Inc........................................................................................ 10
Contacting Quest Software ....................................................................................... 11
Contacting Customer Support .................................................................................. 11
Submitting Feedback on JProbe ............................................................................... 12
Chapter 1 Introduction .......................................................................... 13
JProbe Overview........................................................................................................ 13
Diminishing Java™ Issues Using JProbe.................................................................. 14
Program Correctness Issues................................................................................ 15
Program Efficiency Issues ................................................................................... 17
Strategies for Achieving Program Efficiency in Memory ...................................... 20
Strategies for Achieving Program Efficiency in Performance ............................... 23
JProbe Strategies ........................................................................................................ 25
Understanding the Architecture for Your Program......................................... 25
Regular Checkups ............................................................................................... 26
Selecting Use Cases ............................................................................................. 26
Compiling Your Program................................................................................... 27
Chapter 2 jplauncher Reference ............................................................... 29
jplauncher Options .................................................................................................... 29
Running a JProbe Session Using jplauncher........................................................... 30
Converting an Old JPL File Using jplauncher........................................................ 32
Chapter 3 JPL File Structure and JProbe Options ........................................... 33
Sample JPL Files ........................................................................................................ 33
JProbe Options ........................................................................................................... 38
JProbe LaunchPad Options ................................................................................ 39
Advanced JProbe Options .................................................................................. 46
Editing a JPL File ....................................................................................................... 47
6 JProbe: Reference Guide
Chapter 4 Memory Troubleshooting and Session Runtime Tips ...........................49
Troubleshooting Tips................................................................................................. 49
Session Runtime Tips ................................................................................................ 52
Chapter 5 Performance Troubleshooting and Session Runtime Tips .....................55
Performance Troubleshooting Tips.......................................................................... 55
Performance Session Runtime Tips ......................................................................... 57
Chapter 6 Coverage Troubleshooting..........................................................61
Index ...................................................................................63
About This Guide 7
About This Guide
Congratulations on purchasing JProbe®. JProbe contains three analysis tools that will help you to:
■ Improve memory usage and reduce unnecessary garbage collections in your Java™ programs.
■ Find performance bottlenecks in your Java™ programs.
■ Ensure that your test cases cover all the code in your Java™ applications.
ConventionsThe following conventions are used in this guide.
Typographical Conventions
Other Conventions
Typewriter Font Typewriter font is used for the following items:
• Java language source code and examples of file contents• Command-line statements
Italic Text Italics are used for the following items:
• Path names and file names• Titles of external documents• Terms introduced for the first time• Figure captions• Responses to actions performed during procedures
Bold Text Bold is used for the following items:
• UI controls in procedures, such as menu items, button names, selections, and data that you need to enter
• Email addresses and URLs
Click Save. Click the button to perform an action.
8 JProbe: Reference Guide
Additional DocumentationIn addition to this guide, the following information sources will be important to your success in using JProbe:
■ JProbe User Guide
■ JProbe Reference Guide
■ Installing JProbe Guide
■ Integrating JProbe with Your Application Server Guide
■ Release Notes
■ Online Help
■ JProbe Application Server Integration
■ IDE Integration Instructions in the Knowledgebase
■ Java-related Products and Support
Select Menu > Item. Select a menu and choose a menu item.
<value> Placeholder for a value that you must supply;for example, <jprobe_dir> is the JProbe directory.
<jprobe_dir>\path\file Backslashes are used in directory paths. For UNIX systems, substitute forward slashes.
Go to www.quest.com The leading http:// is omitted from URLs unless the Web site is secure, in which case the https:// is included. All absolute Web addresses are correct at time of release.
screen captures Screen captures were taken running JProbe with default settings on a Windows XP platform. The JProbe Console may look different on your computer.
Indicates a Memory procedure or information.
Indicates a Performance procedure or information.
Indicates a Coverage procedure or information.
About This Guide 9
JProbe User Guide
The JProbe User Guide contains information about JProbe features and procedures on how to use them. The guide contains information for each of the JProbe analysis tools, Memory, Performance and Coverage.
JProbe Reference Guide
The JProbe Reference Guide provides background information about JProbe and the three anlysis tools. It also includes jplauncher command-line tools, information about the JPL file structure, JProbe Options and troubleshooting information.
Installing JProbe Guide
The installation guide contains system requirements, installation instructions for Windows-based and UNIX-based systems, a list of supported JVMs, IDE integration instructions, and a quick start method for using JProbe. A PDF version of the guide is available on the CD and is also installed in the doc directory for future reference.
Integrating JProbe with Your Application Server Guide
Most J2EE applications rely on a third-party application server or servlet engine. JProbe support a range of application servers on various platforms. The Integrating Your Application Server guide tells you how to use the standalone version of the JProbe Application Server Integration tool to integrate JProbe with your application server. You can run the tool from the command line, create local or global integrations, as well as run JProbe sessions from the tool.
Release Notes
The Release Notes file contains release notes and known issues for JProbe, and is installed in the JProbe directory.

10 JProbe: Reference Guide
Online Help
The online help contains context-sensitive help for most windows and dialogs, and procedures for completing common tasks. There are no screen captures in the online help. See theJProbe User Guide for complete product documentation.
JProbe Application Server Integration
If your version of an application server is not in the list of supported application servers, you can see if support for it was added since the release, and, if necessary, submit a request for support. You can submit a request for support by going to:
http://www.quest.com/support, and select Case Management.
IDE Integration Instructions in the Knowledgebase
If your version of an IDE is not available in the IDE integration tool, you can see if there is a manual integration available. Go to www.quest.com/support, and select Search Knowledgebase. From the product list select JProbe as the product. Search our Knowledgebase for your IDE. If the IDE you are working with is not in our supported list, you can submit a request for a new integration procedure by contacting Quest Software Technical Support.
About Quest Software, Inc.Quest Software, Inc. delivers innovative products that help organizations get more performance and productivity from their applications, databases and Windows infrastructure. Through a deep expertise in IT operations and a continued focus on what works best, Quest helps more than 18,000 customers worldwide meet higher expectations for enterprise IT. Quest Software can be found in offices around the globe and at www.quest.com.

About This Guide 11
Contacting Quest SoftwarePlease refer to our Web site for regional and international office information.
Java-related Products and Support
You can purchase Java-related products and support by email, through a reseller, or by contacting one of the direct sales offices. An up-to-date list of sales contacts is posted on the Web site.
Contacting Customer SupportQuest Support is available to customers who have a trial version of a Quest product or who have purchased a commercial version and have a valid maintenance contract. Quest Support provides around the clock coverage with SupportLink, our web self-service. Visit SupportLink at: http://support.quest.com
From SupportLink, you can do the following:
Email [email protected]
Mail Quest Software, Inc.World Headquarters5 Polaris WayAliso Viejo, CA 92656USA
Web Site www.quest.com
Email [email protected]
Telephone In North America: 1 800 663-4723In Germany: +49 (0)69 97168 186In France: +33 (0)1 5568 1259Rest of Europe: +31 20 5106-720
Web Site JProbe Web Site: www.quest.com/jprobeResellers List: www.quest.com/partners/directory
12 JProbe: Reference Guide
■ Quickly find thousands of solutions (Knowledgebase articles/documents).
■ Download patches and upgrades.
■ Seek help from a Support engineer.
■ Log and update your case, and check its status.
View the Global Support Guide for a detailed explanation of support programs, online services, contact information, and policy and procedures. The guide is available at:
http://support.quest.com/pdfs/Global Support Guide.pdf
Submitting Feedback on JProbeWe are interested in hearing about how you use JProbe, any problems you encounter, or any additional features you would find helpful. The majority of enhancements to our products are the result of customer requests.
Send your comments by mail or fax using the contact information for the office closest to you.
In North America
JProbe Product ManagerQuest Software Inc.260 King Street EastToronto, Ontario, M5A 4L5, CanadaFax: 416 933-5001
In Europe
JProbe Product ManagerQuest Software Inc.Trivium Building 6th floor, Derkinderenstraat 221062 DB, Amsterdam, The NetherlandsFax: +31 (0)20 470-0326
Note: While your feedback is appreciated, we are unable to guarantee a personal response. To ensure a response to technical issues, please contact Technical Support.
Introduction 13
Chapter 1
Introduction
If you are like many JProbe users, you started looking for Java™ analysis tools because your Java™ program does not meet your expectations. You are not alone in your search for solutions. The sheer number of interdependencies found in object-oriented, multithreaded Java™ programs—especially multitiered, Web-based applications—makes it very difficult to improve performance without assistance. JProbe helps you to identify and resolve common Java™ problems — fast.
This chapter describes Java™ related issues, introduces JProbe, matches JProbe tools to Java™ issues, provides some strategies to get you started and describes the JProbe environment.
Note: This guide explains some performance-related aspects of Java as they relate to JProbe. For a broader treatment of Java™ issues, refer to Sun Microsystems’ Java™ documentation on their Web site, your JVM documentation, and general publications that discuss strategies for performance tuning Java™ programs.
Advanced Tip: If you are already familiar with Java™-specific issues and the power of JProbe, skip this section and get started analyzing your Java program. Go to JProbe User Guide, “Managing JProbe Sessions”.
■ The following topics are covered in this chapter:
■ JProbe Overview
■ Diminishing Java™ Issues Using JProbe
■ Strategies for Achieving Program Efficiency in Memory
■ Strategies for Achieving Program Efficiency in Performance
■ JProbe Strategies
JProbe OverviewJProbe offers a set of Java analysis tools for use in a pre-production development environment. Coverage is a program correctness tool, while e Performance and Memory are program efficiency tools. For more information
14 JProbe: Reference Guide
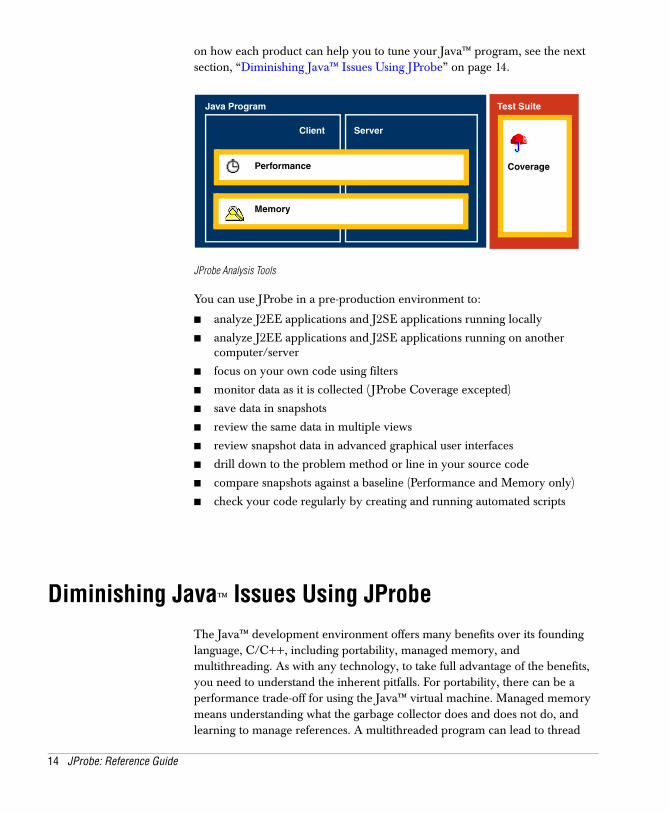
on how each product can help you to tune your Java™ program, see the next section, “Diminishing Java™ Issues Using JProbe” on page 14.
JProbe Analysis Tools
You can use JProbe in a pre-production environment to:
■ analyze J2EE applications and J2SE applications running locally
■ analyze J2EE applications and J2SE applications running on another computer/server
■ focus on your own code using filters
■ monitor data as it is collected ( JProbe Coverage excepted)
■ save data in snapshots
■ review the same data in multiple views
■ review snapshot data in advanced graphical user interfaces
■ drill down to the problem method or line in your source code
■ compare snapshots against a baseline (Performance and Memory only)
■ check your code regularly by creating and running automated scripts
Diminishing Java™ Issues Using JProbeThe Java™ development environment offers many benefits over its founding language, C/C++, including portability, managed memory, and multithreading. As with any technology, to take full advantage of the benefits, you need to understand the inherent pitfalls. For portability, there can be a performance trade-off for using the Java™ virtual machine. Managed memory means understanding what the garbage collector does and does not do, and learning to manage references. A multithreaded program can lead to thread
Coverage
Java Program Test Suite
Client Server
Memory
Performance
Introduction 15
deadlocks. Some of these pitfalls you can work around, some you cannot. You need to understand and focus on the issues you can control.
This section identifies the Java-based pitfalls that software developers can work around under two broad categories: program correctness and program efficiency. These categories recognize a common strategy in many software development environments—developers first create a program that works correctly, and then they tune it to run efficiently.
Program Correctness Issues
A program is correct when the tasks outlined in the use cases can be completed successfully and return accurate results. There are many tools on the market to help you create and debug Java code. For example, integrated development environments (IDEs) provide a graphical interface that can help you to avoid basic programming problems. Java™ debugging tools help you to identify and solve coding problems. Testing tools enable you to create unit testing frameworks and script automated test suites. These tools, however, cannot help you to avoid the pitfalls associated with multithreading, nor can they ensure that your tests are complete.
Tip: Users experience thread deadlocks as a “hung program.”
Testing Issues Using Coverage
To ensure that your program is correct, you test it. Testing of Java™ programs brings with it a higher degree of complexity than with other programs because Java™ is portable. You need to consider multiple platforms, operating systems, and Java™ runtime environments. For J2EE applications, you usually need to support multiple versions of at least one application server. If your program is Web-based, your testing may also need to take into consideration multiple versions of a Web server, servlet engines, browsers, security, and firewalls.
Quality assurance testing differs across the industry. Your development environment will determine the kinds of tests performed, who performs them, when tests are run, and whether they are automated or manual. Whatever tests you do, it is important to ensure that your tests are repeatable and that they cover your entire program, including code dependencies on third-party components and servers.
Testing on multiple platforms adds significant project costs in terms of resources and time, especially if your test suite is run manually. A poorly focused test suite can inflate those costs while producing less than desirable

16 JProbe: Reference Guide
results. Based on use cases, you need to make informed decisions about what you want to test across platforms and what you do not need to test.
Coverage helps you to understand exactly what code your current tests cover, including how many times a line of code or conditional branch executes and what code is missed entirely. You can then streamline your tests so that you get the most out of each test run by focusing on the critical path, reducing redundancies, and improving coverage.
Coverage—Coverage Browser Tab
Who Uses Coverage?
Coverage is aimed at anyone responsible for testing code, which usually means the QA/testing group, but may also include software developers. Use Coverage when designing test cases for new use cases, and whenever software developers implement changes that impact your existing test cases. Coverage can also be used by software developers to verify that the frameworks built for unit testing are complete.

Introduction 17
Program Efficiency Issues
Program efficiency can be boiled down to two issues: how effectively your program uses limited resources such as memory, and the performance of your program. You can use a variety of metrics and benchmarks to evaluate program efficiency, but in the end, it is your users who will determine whether your program meets their expectations.
Expectations are subjective—your users’ expectations will differ depending on their circumstances. For example, expectations might come from the responsiveness of a previous, non-Java™ version of the product, or they might be based on other software your end user uses. You need to understand, and be able to explain, the trade-offs of working in Java™, so that you can manage those expectations.
Memory Management Issues
One of the first things many software developers learn about Java™ is that they no longer need to manage memory. This is a half truth. While you no longer need to free objects from memory yourself, you are still responsible for dereferencing objects that are no longer required. This allows the JVM’s runtime garbage collector to free memory for you.
While the JVM specification requires a garbage collection algorithm, the choice of an algorithm is left up to the developers implementing the specification. Sun’s Java™ SDK 1.4.2 (and higher) reference implementations use a mark-and-sweep algorithm, while Sun’s Hotspot JVM uses a generational garbage collector. Other vendors can implement their own algorithms. For more information, consult the documentation for the JVM you are using.
To understand Java’s™ memory management issues, consider the mark-and-sweep algorithm. When the JVM attempts to allocate an object and finds that the heap is full, the JVM calls the garbage collector. The garbage collector identifies all reachable objects by tracing paths to them from the root set. The root set includes entry points to the JVM created by your program, like static references and threads. Objects that are not reachable are removed. If not enough memory can be freed, then the JVM grows the size of the heap.
Two common pitfalls of managed memory are poor reference management and excessive object creation.
18 JProbe: Reference Guide
Tip: Programs with loitering objects exhibit the same symptoms as traditional memory leaks—memory grows without bounds—but loiterers are caused by the garbage collector’s inability to determine if an object has future value to your program.
Poor Reference Management (Loitering Objects)
The garbage collector cannot determine if an object is live—that is, if it is of future value to your program—only that it is reachable. So if your program will never use an object again, but you fail to remove the reference to the object, the object will remain, or loiter, in memory indefinitely. Java developers refer to this problem as “unintentional object retention” or loitering objects.
The effect on the Java heap extends beyond a single object, or loiterer, remaining in memory. The loiterer, in turn, often anchors a whole subgraph of objects, which can consume a significant amount of memory. When your program allocates new objects, the memory consumed by the loitering objects cannot be reused. Instead, the JVM must run the garbage collector more frequently and potentially grow the size of the heap.
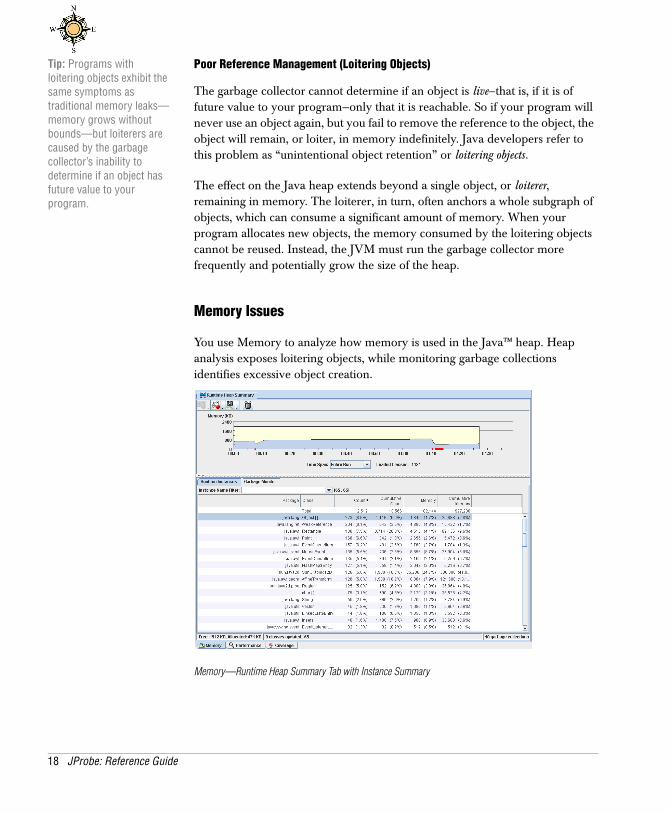
Memory Issues
You use Memory to analyze how memory is used in the Java™ heap. Heap analysis exposes loitering objects, while monitoring garbage collections identifies excessive object creation.
Memory—Runtime Heap Summary Tab with Instance Summary

Introduction 19
Who Uses Memory?
Software developers at any level can benefit from using Memory. You can run targeted sessions, focusing on how your program manages the lifecycle of objects in the Java™ heap. Not only can you debug memory problems in existing code, you can also use Memory as part of your ongoing development process. For example, you can confirm design assumptions about object lifecycles whenever you add new code to your application.
Excessive Object Allocation
If your program creates an excessive number of objects, the Java™ heap will become larger, and garbage collection activities will take longer because there are more objects to evaluate. Consider a method that allocates a new temporary object at every iteration of a loop, even though the object is never reused and is no longer required when the loop exits. It would be a more efficient use of memory to allocate a single object outside the loop and reuse it within the loop.
Memory helps you to find memory leaks caused by poor reference management (loitering objects) or over-allocation of objects, and improve performance by reducing excessive garbage collections. Performance highlights performance bottlenecks in your program’s workflow.
Performance Issues
In the narrowest sense, performance is measured as the time experienced by your the user while completing a task. You can tune your Java™ program so that the features used most frequently by users are responsive. In Java™, you need to evaluate the efficiency of the algorithms in your methods, and understand the impact of the methods invoked by your methods.
Inefficient Algorithms
Inefficient algorithms in the critical path adversely affect performance. Some examples of inefficient algorithms include methods that exhibit one or more of the following behaviors: repeatedly invoking another method; redoing calculations instead of using cached results; running calculations on the main thread; using an inappropriate algorithm for the situation; or over-allocating objects. Finally, it is entirely possible that a method in a third-party component is inefficient, in which case you can reduce the performance impact by reducing the number of calls to the problem method.
20 JProbe: Reference Guide
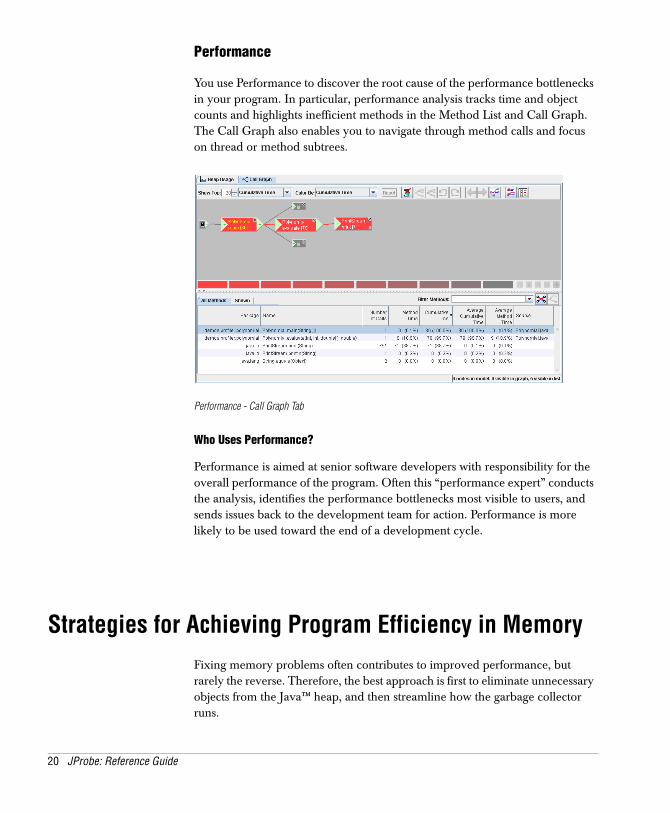
Performance
You use Performance to discover the root cause of the performance bottlenecks in your program. In particular, performance analysis tracks time and object counts and highlights inefficient methods in the Method List and Call Graph. The Call Graph also enables you to navigate through method calls and focus on thread or method subtrees.
Performance - Call Graph Tab
Who Uses Performance?
Performance is aimed at senior software developers with responsibility for the overall performance of the program. Often this “performance expert” conducts the analysis, identifies the performance bottlenecks most visible to users, and sends issues back to the development team for action. Performance is more likely to be used toward the end of a development cycle.
Strategies for Achieving Program Efficiency in MemoryFixing memory problems often contributes to improved performance, but rarely the reverse. Therefore, the best approach is first to eliminate unnecessary objects from the Java™ heap, and then streamline how the garbage collector runs.
Introduction 21
Analyzing an Existing Program
Developers can use JProbe at the end of a development cycle to improve program efficiency. To analyze the entire program, you should be an experienced software developer with good knowledge of the architecture and expected behavior of the program. If time is short, you could first focus on the use cases where memory leaks have been noticed or the program performance is slow.
While not required, you should take some initial snapshots of your program before implementing any changes. These snapshots become your baseline—the standard against which you can assess subsequent code improvements. Setting and measuring against a baseline helps you to quantify improvements to yourself, your team members, quality assurance, product management, marketing, and other stakeholders. For more information, see “Measuring Memory Improvements” in the JProbe User Guide.
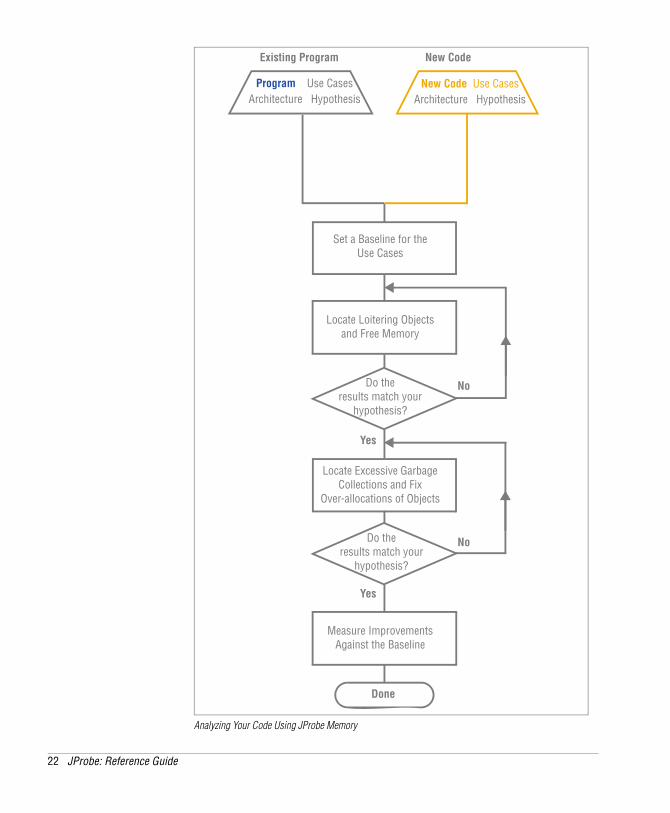
The following architecture is for the Memory analysis tool.
22 JProbe: Reference Guide
Analyzing Your Code Using JProbe Memory
No
Yes
Yes
Program Use CasesArchitecture Hypothesis
Set a Baseline for theUse Cases
Locate Loitering Objects and Free Memory
Locate Excessive Garbage Collections and Fix
Over-allocations of Objects
Do theresults match your
hypothesis?
Done
Do theresults match your
hypothesis?
No
New Code Use CasesArchitecture Hypothesis
Existing Program New Code
Measure ImprovementsAgainst the Baseline

Introduction 23
Analyzing New Code During the Development Cycle
Using JProbe, all software developers can ensure that the code they add to the program uses memory efficiently. Add your code to the pre-production program. When you assess the results, you can toggle between displaying the set of data that represents your code only and the data for the entire program.
Strategies for Achieving Program Efficiency in Performance
Senior developers often use JProbe at the end of a development cycle to improve program efficiency. Use Performance to eliminate bottlenecks.
Analyzing an Existing Program
JProbe highlights hotspots in your program, which helps you to identify performance bottlenecks, that is, algorithms that are too slow or that block other processes for too long. To analyze the entire program, you should be an experienced software developer with good overall knowledge of the architecture and expected behavior of the program.
Analyzing New Code During the Development Cycle
Using JProbe, all software developers can ensure that the code they add to the program uses memory efficiently. Add your code to the pre-production program. When you assess the results, you can toggle between displaying the set of data that represents your code only and the data for the entire program.
The following architecture is for Performance analysis tool.
24 JProbe: Reference Guide
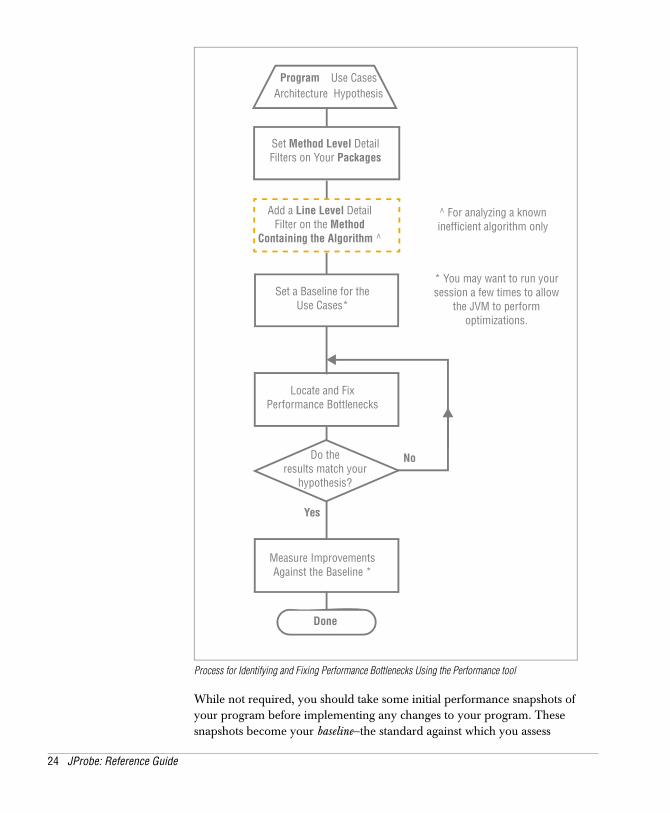
Process for Identifying and Fixing Performance Bottlenecks Using the Performance tool
While not required, you should take some initial performance snapshots of your program before implementing any changes to your program. These snapshots become your baseline—the standard against which you assess
Architecture HypothesisProgram Use Cases
Yes
Set a Baseline for theUse Cases*
Locate and Fix Performance Bottlenecks
Do theresults match your
hypothesis?
Done
No
Measure ImprovementsAgainst the Baseline *
* You may want to run your session a few times to allow
the JVM to perform optimizations.
Set Method Level Detail Filters on Your Packages
Add a Line Level Detail Filter on the Method
Containing the Algorithm ^
^ For analyzing a known inefficient algorithm only

Introduction 25
subsequent code improvements. Setting and measuring against a baseline helps you to quantify improvements to yourself, your team members, quality assurance, product management, marketing, and other stakeholders. Be sure to run the initial session a few times before selecting a snapshot to use as a baseline. The JVM may perform some optimizations that only show improvement on subsequent runs of your program. For more information, see “Saving Baseline Snapshots” in the JProbe User’s Guide.
Focusing on a Known Inefficient Algorithm
Any time during a development cycle, a senior software developer may suspect that a heavily-used algorithm, though running as efficiently as possible, is a performance bottleneck. You can use JProbe to analyze how the algorithm is called. For the most part, however, you should discourage your team from routinely using JProbe on their algorithms. You only want to spend time optimizing algorithms that your users use most frequently; this use assessment is most effective when done by a senior software developer looking at the program as a whole.
JProbe StrategiesJProbe provides the tools you need to achieve performance improvements. The way that you use them depends where you are in the development cycle.
Understanding the Architecture for Your Program
Review the architecture document for your program. Architecture documents typically outline a high-level view of the relationships within your Java program. For example, in a multitiered application, the architecture would identify what each tier does, how they communicate with each other, and what data they exchange. In addition, a core set of principal classes, methods, and interfaces should be identified. It is important that you understand the lifecycle of the principal objects—when they are created, how long they live, and when they can be removed. Focus on understanding the control flow, that is, how the objects within your program relate to one another.

26 JProbe: Reference Guide
If you do not have an architecture document, consider creating one. Performance’s Call Graph tab is a good place to start, as it can give you an overview of the control flow in your program.
Regular Checkups
Learning to fix performance issues with JProbe results in better, more savvy Java™ programming skills. Your performance problems will diminish as you program to avoid pitfalls; however, some complex issues will still need to be verified, and you may have less experienced team members contributing code to the program. Use JProbe during your development cycle to make sure that you avoid new problems, and to verify that your tests continue to exercise your critical code.
Consider creating automated scripts to take snapshots on a regular basis. Review the snapshots to catch potential problems early in the development cycle. For details, see “Running Automated Sessions” on page 15.
Selecting Use Cases
Use cases describe high-level tasks from a user’s perspective. If your development environment is process-conscious, look for documented use cases wherever project information is kept. In less formal development environments, you may need to derive the use cases by examining the program and end-user documentation. By focusing your efforts on frequently attempted use cases, you can ensure that your improvements will be visible to your users.
To help ensure that performance gains are visible:
1. Identify the use cases for your program.
2. Analyze which use cases are attempted most frequently, that is, determine the critical path of your program.
3. Identify the use cases in the critical path that are prompting complaints. You will focus on this subset of use cases first.
4. Formulate hypotheses for the use cases.
5. Run Performance and Memory sessions on the use cases.
Introduction 27
6. Run Coverage sessions with the test cases that target the use cases.
Tip: For Performance and Memory if the validation step is a perceived problem, you can run an analysis session on this step. For Coverage, you need to ensure that the entire process is tested.
For example, in a Web application, a high-level task might be to log on to a secure area with a user ID and password. This case implies a set of steps that your user goes through, such as obtaining a unique ID, setting a password, entering the data into an online form, submitting the form for validation, and either going to the secure site or being denied access.
Compiling Your Program
You can run JProbe without recompiling your program for most situations. If you intend to analyze your program line-by-line, however, you may want to consider using the -g compiler option when you compile your program.
Improving Line-level Data with the -g Compiler Option
To report on line-level data, JProbe reads from the line number table created when you compiled your code. The line number table matches a range of bytes in the compiled bytecode to a line in your source code. Depending on your compiler, the match can sometimes be imprecise. You can view your existing line and local variables tables by running javap -l (letter “l”) with your compiled class file.
If you want to try to improve the quality of line information, you can compile your code with the -g compiler option. The -g option generates debugging information on line numbers and local variables, and identifies the source file names.

28 JProbe: Reference Guide
jplauncher Reference 29
Chapter 2
jplauncher Reference
jplauncher is a command-line tool that you can use to start and run JProbe analysis on standalone applications. This appendix describes jplauncher commands. For information about using jplauncher to run automated sessions, see Running Automated Sessions with jplauncher in the Managing JProbe Sessions chapter of the JProbe User Guide.
Important
If your program is a J2EE application that requires a commercial application server, use the JProbe Integration Tool, or use the command-line tool jpasrun. For more information about jpasrun see the jpasrun Options section in the Integrating JProbe with Your Application Server guide. Alternatively, to run JProbe you can modify your application server’s script. For more information see Modifying Application Server Scripts in the Integrating JProbe with Your Application Server guide.
This section covers the following topics:
■ jplauncher Options
■ Running a JProbe Session Using jplauncher
■ Converting an Old JPL File Using jplauncher
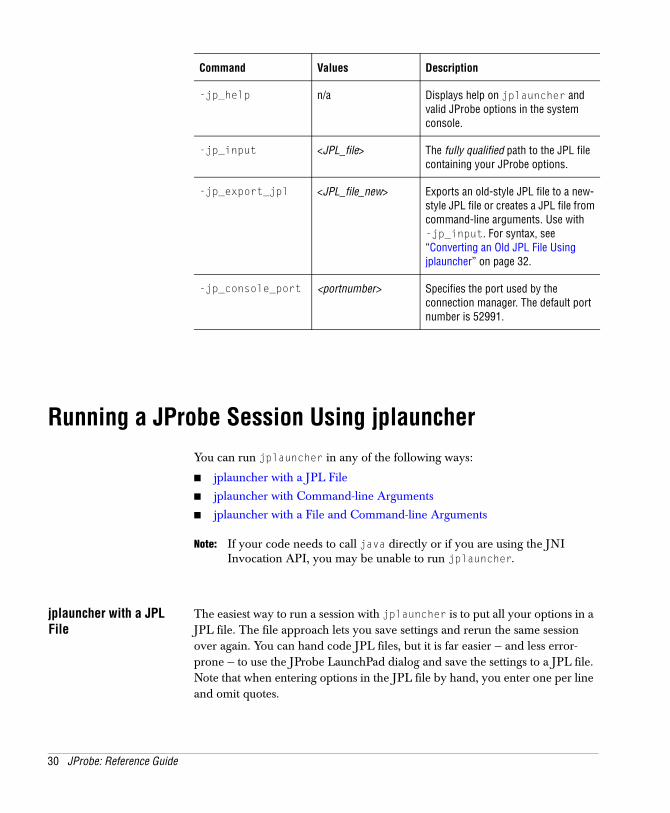
jplauncher OptionsThe options in the following table can only be entered on the command line with jplauncher, that is, they cannot be included in a JPL file.
Important: Where necessary, use the quoting and path separator conventions for the command shell you are using (Windows, sh, csh, etc.).
30 JProbe: Reference Guide
Running a JProbe Session Using jplauncherYou can run jplauncher in any of the following ways:
■ jplauncher with a JPL File
■ jplauncher with Command-line Arguments
■ jplauncher with a File and Command-line Arguments
Note: If your code needs to call java directly or if you are using the JNI Invocation API, you may be unable to run jplauncher.
jplauncher with a JPL File
The easiest way to run a session with jplauncher is to put all your options in a JPL file. The file approach lets you save settings and rerun the same session over again. You can hand code JPL files, but it is far easier — and less error-prone — to use the JProbe LaunchPad dialog and save the settings to a JPL file. Note that when entering options in the JPL file by hand, you enter one per line and omit quotes.
Command Values Description
-jp_help n/a Displays help on jplauncher and valid JProbe options in the system console.
-jp_input <JPL_file> The fully qualified path to the JPL file containing your JProbe options.
-jp_export_jpl <JPL_file_new> Exports an old-style JPL file to a new-style JPL file or creates a JPL file from command-line arguments. Use with -jp_input. For syntax, see “Converting an Old JPL File Using jplauncher” on page 32.
-jp_console_port <portnumber> Specifies the port used by the connection manager. The default port number is 52991.

jplauncher Reference 31
Syntax:<jprobe_dir>\bin> jplauncher -jp_input=<JPL_file>
where <JPL_file> is the fully-qualified path to a JPL file that contains your program name and arguments, JProbe options, and Java options.
jplauncher with Command-line Arguments
Another way to run a session is to enter your JProbe options, Java options, application, and application arguments on the command line. The only required argument is -jp_function, which tells jplauncher which JProbe tool to run. All other options have default values that are used if you do not specify the option. When entering paths, use the quoting and path separator conventions for the command shell that you are using (Windows, sh, csh, etc.). For more information, see “JProbe Options” on page 38.
Syntax:<jprobe_dir>\bin> jplauncher [jprobe_options] [java_options]
<app_name> <app_args>
JProbe options and Java options must be entered before your application class name (<app_name>), because jplauncher assumes that any arguments after the class name are arguments for your application (<app_args>).
Memory Example: Enter all parameters on one line.<jprobe_dir>\bin> jplauncher -jp_function=memory-jp_java=c:\jdk1.4.2\bin\java.exe-serverdemos.memory.leakexample.LeakExample -fix
Performance Example: Enter all parameters on one line.<jprobe_dir>\bin> jplauncher -jp_function=performance-jp_java=c:\jdk1.4.2\bin\java.exe-jp_collect_data=demos.performance.polynomial.*.*():method-serverdemos.performance.polynomial.Polynomial
Coverage Example: Enter all parameters on one line.<jprobe_dir>\bin> jplauncher -jp_function=coverage-jp_java=c:\jdk1.4.2\bin\java.exe-jp_collect_data=demos.coverage.adventure.*.*():include-serverdemos.coverage.adventure.Adventure
32 JProbe: Reference Guide
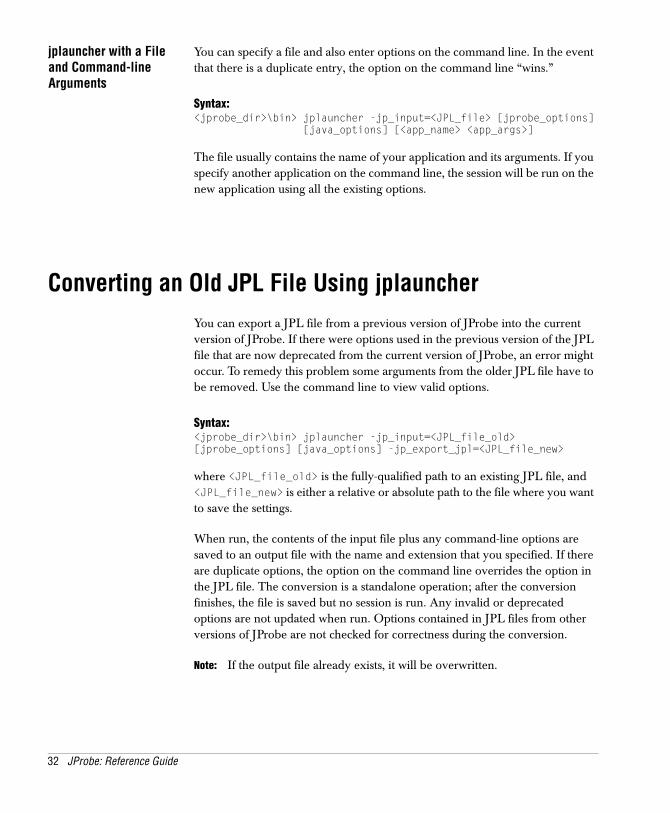
jplauncher with a File and Command-line Arguments
You can specify a file and also enter options on the command line. In the event that there is a duplicate entry, the option on the command line “wins.”
Syntax:<jprobe_dir>\bin> jplauncher -jp_input=<JPL_file> [jprobe_options]
[java_options] [<app_name> <app_args>]
The file usually contains the name of your application and its arguments. If you specify another application on the command line, the session will be run on the new application using all the existing options.
Converting an Old JPL File Using jplauncherYou can export a JPL file from a previous version of JProbe into the current version of JProbe. If there were options used in the previous version of the JPL file that are now deprecated from the current version of JProbe, an error might occur. To remedy this problem some arguments from the older JPL file have to be removed. Use the command line to view valid options.
Syntax:<jprobe_dir>\bin> jplauncher -jp_input=<JPL_file_old>[jprobe_options] [java_options] -jp_export_jpl=<JPL_file_new>
where <JPL_file_old> is the fully-qualified path to an existing JPL file, and <JPL_file_new> is either a relative or absolute path to the file where you want to save the settings.
When run, the contents of the input file plus any command-line options are saved to an output file with the name and extension that you specified. If there are duplicate options, the option on the command line overrides the option in the JPL file. The conversion is a standalone operation; after the conversion finishes, the file is saved but no session is run. Any invalid or deprecated options are not updated when run. Options contained in JPL files from other versions of JProbe are not checked for correctness during the conversion.
Note: If the output file already exists, it will be overwritten.

JPL File Structure and JProbe Options 33
Chapter 3
JPL File Structureand JProbe Options
When you save your settings in the JProbe LaunchPad dialog, you create a JPL file. The JPL file contains information on your program and its arguments, selected JProbe options, and selected Java options. You can open the JPL file in a text editor to review your settings. You can also tweak some options, add additional options, and save the file.
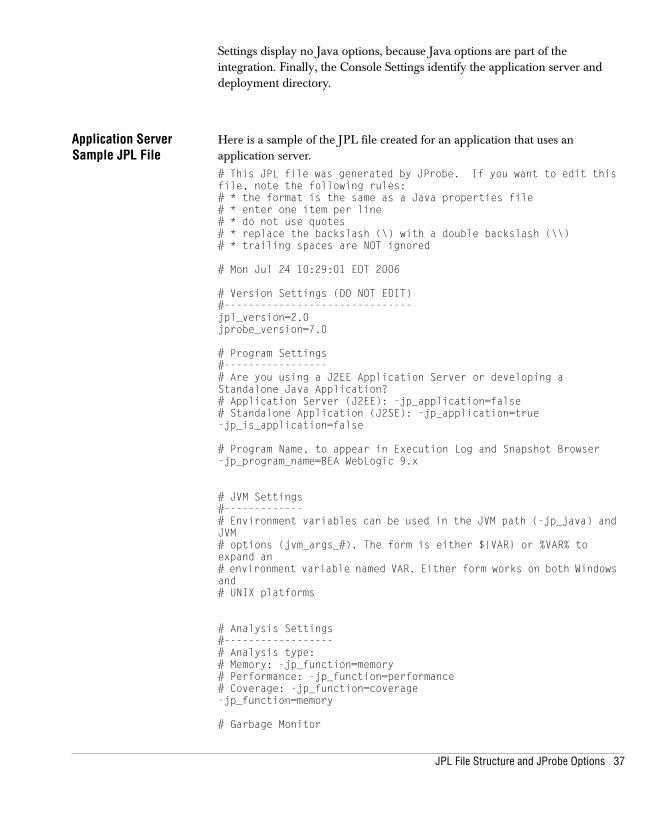
This section shows you typical JPL files for a standalone application and for an application that uses an application server. The typical JProbe options that you find in the JPL files are then defined for you, followed by other JProbe options that are available to you.
This section covers the following topics:
■ Sample JPL Files
■ JProbe Options
■ Editing a JPL File
Sample JPL FilesThe following samples were created using the JProbe LaunchPad dialog. JPL files contain a list of properties organized under the following headings:
■ Version Settings: JPL version and JProbe product version
■ Program Settings: Application information and arguments (app_arg)
■ JVM Settings: Java options, such as -classpath (jvm_arg)
■ Analysis Settings: JProbe LaunchPad data collection settings
■ Messages: JProbe Options dialog Messages settings
■ Console Settings: JProbe Console control settings
34 JProbe: Reference Guide
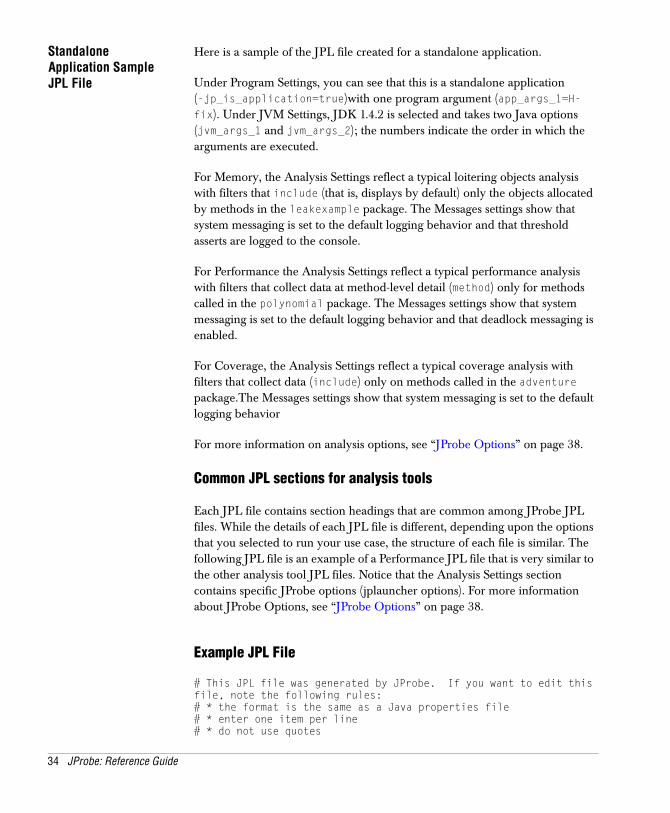
Standalone Application Sample JPL File
Here is a sample of the JPL file created for a standalone application.
Under Program Settings, you can see that this is a standalone application (-jp_is_application=true)with one program argument (app_args_1=H-fix). Under JVM Settings, JDK 1.4.2 is selected and takes two Java options (jvm_args_1 and jvm_args_2); the numbers indicate the order in which the arguments are executed.
For Memory, the Analysis Settings reflect a typical loitering objects analysis with filters that include (that is, displays by default) only the objects allocated by methods in the leakexample package. The Messages settings show that system messaging is set to the default logging behavior and that threshold asserts are logged to the console.
For Performance the Analysis Settings reflect a typical performance analysis with filters that collect data at method-level detail (method) only for methods called in the polynomial package. The Messages settings show that system messaging is set to the default logging behavior and that deadlock messaging is enabled.
For Coverage, the Analysis Settings reflect a typical coverage analysis with filters that collect data (include) only on methods called in the adventure package.The Messages settings show that system messaging is set to the default logging behavior
For more information on analysis options, see “JProbe Options” on page 38.
Common JPL sections for analysis tools
Each JPL file contains section headings that are common among JProbe JPL files. While the details of each JPL file is different, depending upon the options that you selected to run your use case, the structure of each file is similar. The following JPL file is an example of a Performance JPL file that is very similar to the other analysis tool JPL files. Notice that the Analysis Settings section contains specific JProbe options (jplauncher options). For more information about JProbe Options, see “JProbe Options” on page 38.
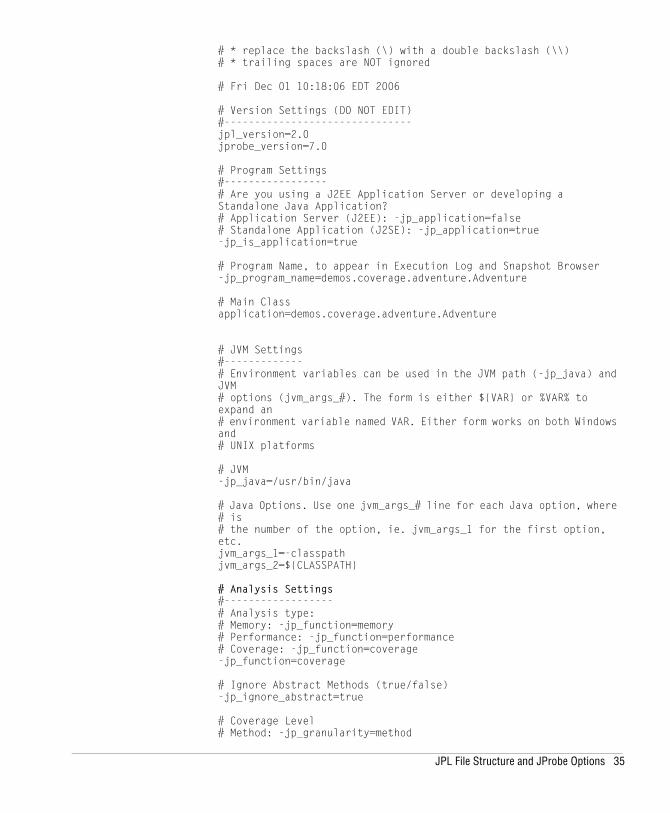
Example JPL File
# This JPL file was generated by JProbe. If you want to edit this file, note the following rules:# * the format is the same as a Java properties file# * enter one item per line# * do not use quotes
JPL File Structure and JProbe Options 35
# * replace the backslash (\) with a double backslash (\\)# * trailing spaces are NOT ignored
# Fri Dec 01 10:18:06 EDT 2006
# Version Settings (DO NOT EDIT)#-------------------------------jpl_version=2.0jprobe_version=7.0
# Program Settings#-----------------# Are you using a J2EE Application Server or developing a Standalone Java Application?# Application Server (J2EE): -jp_application=false# Standalone Application (J2SE): -jp_application=true-jp_is_application=true
# Program Name, to appear in Execution Log and Snapshot Browser-jp_program_name=demos.coverage.adventure.Adventure
# Main Classapplication=demos.coverage.adventure.Adventure
# JVM Settings#-------------# Environment variables can be used in the JVM path (-jp_java) and JVM# options (jvm_args_#). The form is either ${VAR} or %VAR% to expand an# environment variable named VAR. Either form works on both Windows and# UNIX platforms
# JVM-jp_java=/usr/bin/java
# Java Options. Use one jvm_args_# line for each Java option, where # is# the number of the option, ie. jvm_args_1 for the first option, etc.jvm_args_1=-classpathjvm_args_2=${CLASSPATH}
# Analysis Settings#------------------# Analysis type:# Memory: -jp_function=memory# Performance: -jp_function=performance# Coverage: -jp_function=coverage-jp_function=coverage
# Ignore Abstract Methods (true/false)-jp_ignore_abstract=true
# Coverage Level# Method: -jp_granularity=method
36 JProbe: Reference Guide
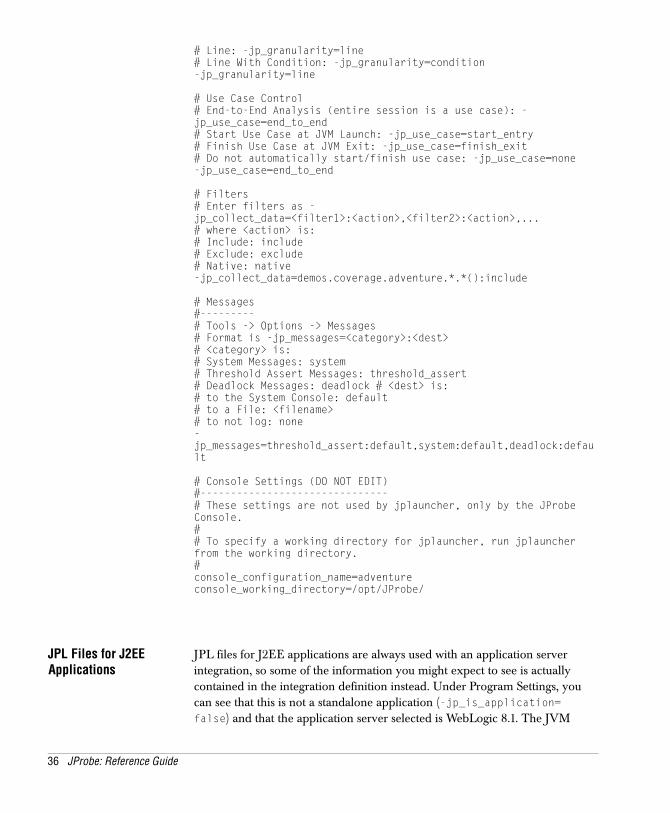
# Line: -jp_granularity=line# Line With Condition: -jp_granularity=condition-jp_granularity=line
# Use Case Control# End-to-End Analysis (entire session is a use case): -jp_use_case=end_to_end# Start Use Case at JVM Launch: -jp_use_case=start_entry# Finish Use Case at JVM Exit: -jp_use_case=finish_exit# Do not automatically start/finish use case: -jp_use_case=none-jp_use_case=end_to_end
# Filters# Enter filters as -jp_collect_data=<filter1>:<action>,<filter2>:<action>,...# where <action> is:# Include: include# Exclude: exclude# Native: native-jp_collect_data=demos.coverage.adventure.*.*():include
# Messages#---------# Tools -> Options -> Messages# Format is -jp_messages=<category>:<dest># <category> is:# System Messages: system# Threshold Assert Messages: threshold_assert# Deadlock Messages: deadlock # <dest> is:# to the System Console: default# to a File: <filename># to not log: none-jp_messages=threshold_assert:default,system:default,deadlock:default
# Console Settings (DO NOT EDIT)#-------------------------------# These settings are not used by jplauncher, only by the JProbe Console.## To specify a working directory for jplauncher, run jplauncher from the working directory.#console_configuration_name=adventureconsole_working_directory=/opt/JProbe/
JPL Files for J2EE Applications
JPL files for J2EE applications are always used with an application server integration, so some of the information you might expect to see is actually contained in the integration definition instead. Under Program Settings, you can see that this is not a standalone application (-jp_is_application= false) and that the application server selected is WebLogic 8.1. The JVM
JPL File Structure and JProbe Options 37
Settings display no Java options, because Java options are part of the integration. Finally, the Console Settings identify the application server and deployment directory.
Application Server Sample JPL File
Here is a sample of the JPL file created for an application that uses an application server. # This JPL file was generated by JProbe. If you want to edit this file, note the following rules:# * the format is the same as a Java properties file# * enter one item per line# * do not use quotes# * replace the backslash (\) with a double backslash (\\)# * trailing spaces are NOT ignored
# Mon Jul 24 10:29:01 EDT 2006
# Version Settings (DO NOT EDIT)#-------------------------------jpl_version=2.0jprobe_version=7.0
# Program Settings#-----------------# Are you using a J2EE Application Server or developing a Standalone Java Application?# Application Server (J2EE): -jp_application=false# Standalone Application (J2SE): -jp_application=true-jp_is_application=false
# Program Name, to appear in Execution Log and Snapshot Browser-jp_program_name=BEA WebLogic 9.x
# JVM Settings#-------------# Environment variables can be used in the JVM path (-jp_java) and JVM# options (jvm_args_#). The form is either ${VAR} or %VAR% to expand an# environment variable named VAR. Either form works on both Windows and# UNIX platforms
# Analysis Settings#------------------# Analysis type:# Memory: -jp_function=memory# Performance: -jp_function=performance# Coverage: -jp_function=coverage-jp_function=memory
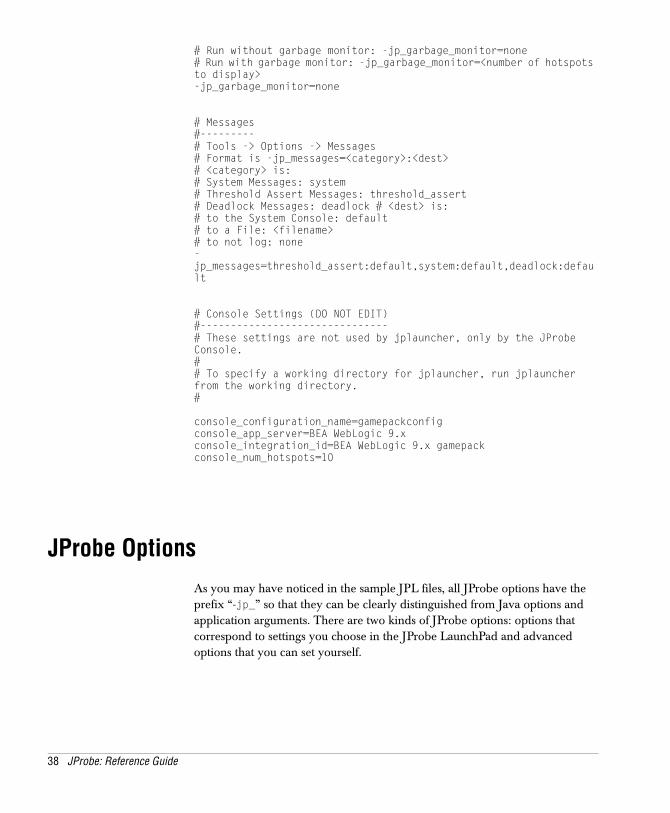
# Garbage Monitor
38 JProbe: Reference Guide
# Run without garbage monitor: -jp_garbage_monitor=none# Run with garbage monitor: -jp_garbage_monitor=<number of hotspots to display>-jp_garbage_monitor=none
# Messages#---------# Tools -> Options -> Messages# Format is -jp_messages=<category>:<dest># <category> is:# System Messages: system# Threshold Assert Messages: threshold_assert# Deadlock Messages: deadlock # <dest> is:# to the System Console: default# to a File: <filename># to not log: none-jp_messages=threshold_assert:default,system:default,deadlock:default
# Console Settings (DO NOT EDIT)#-------------------------------# These settings are not used by jplauncher, only by the JProbe Console.## To specify a working directory for jplauncher, run jplauncher from the working directory.#
console_configuration_name=gamepackconfigconsole_app_server=BEA WebLogic 9.xconsole_integration_id=BEA WebLogic 9.x gamepackconsole_num_hotspots=10
JProbe OptionsAs you may have noticed in the sample JPL files, all JProbe options have the prefix “-jp_” so that they can be clearly distinguished from Java options and application arguments. There are two kinds of JProbe options: options that correspond to settings you choose in the JProbe LaunchPad and advanced options that you can set yourself.

JPL File Structure and JProbe Options 39
JProbe LaunchPad Options
When you review a JPL file that was created using the JProbe LaunchPad dialog or the Settings Wizard, the JProbe options map to the settings that you selected.
Example:-jp_java=c:\jdk1.5.0_01\bin\java.exe
maps to the Java executable you select in the JProbe LaunchPad dialog or the JProbe Settings Wizard.
The following table lists the options, their values, a brief description of what each does, and its equivalent JProbe LaunchPad setting. If an option is not included, its default value is assumed. In the table, default values are underlined.
Important: When entering JProbe options on the command line, you use the quoting and path separator conventions for the command shell that you are using (Windows, sh, csh, etc.). In the JPL file, quotes are omitted and paths are entered one per line.
Memory Option Values Description LaunchPad/Console Equivalent
-jp_count_threshold class_name:count [,class_name:count]
A comma-separated list of up to five fully-qualified classes with threshold values. See <threshold> Syntax.
Threshold Values dialog
-jp_function [memory] Tells jplauncher to run a Memory session.
JProbe LaunchPad dialog in use
-jp_garbage_monitor [none|<num>] Sets the number of classes reported in the garbage monitor.
• Run Garbage Monitor during a Use Case checkbox
• Number of hotspots to display value.
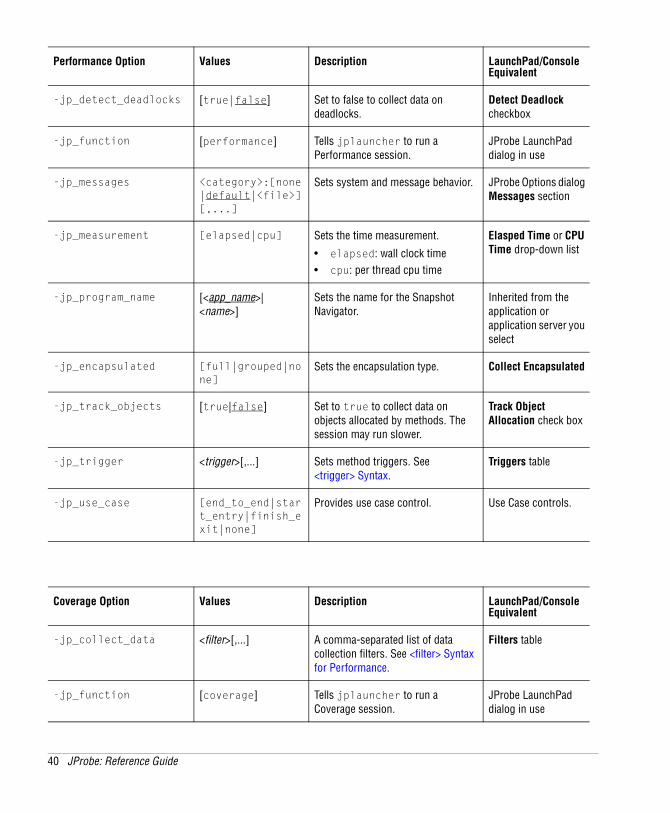
Performance Option Values Description LaunchPad/Console Equivalent
-jp_collect_data <filter>[,...] A comma-separated list of data collection filters. See <filter> Syntax for Performance.
Filters table
40 JProbe: Reference Guide
-jp_detect_deadlocks [true|false] Set to false to collect data on deadlocks.
Detect Deadlock checkbox
-jp_function [performance] Tells jplauncher to run a Performance session.
JProbe LaunchPad dialog in use
-jp_messages <category>:[none|default|<file>][,...]
Sets system and message behavior. JProbe Options dialog Messages section
-jp_measurement [elapsed|cpu] Sets the time measurement.
• elapsed: wall clock time• cpu: per thread cpu time
Elasped Time or CPU Time drop-down list
-jp_program_name [<app_name>|<name>]
Sets the name for the Snapshot Navigator.
Inherited from the application or application server you select
-jp_encapsulated [full|grouped|none]
Sets the encapsulation type. Collect Encapsulated
-jp_track_objects [true|false] Set to true to collect data on objects allocated by methods. The session may run slower.
Track Object Allocation check box
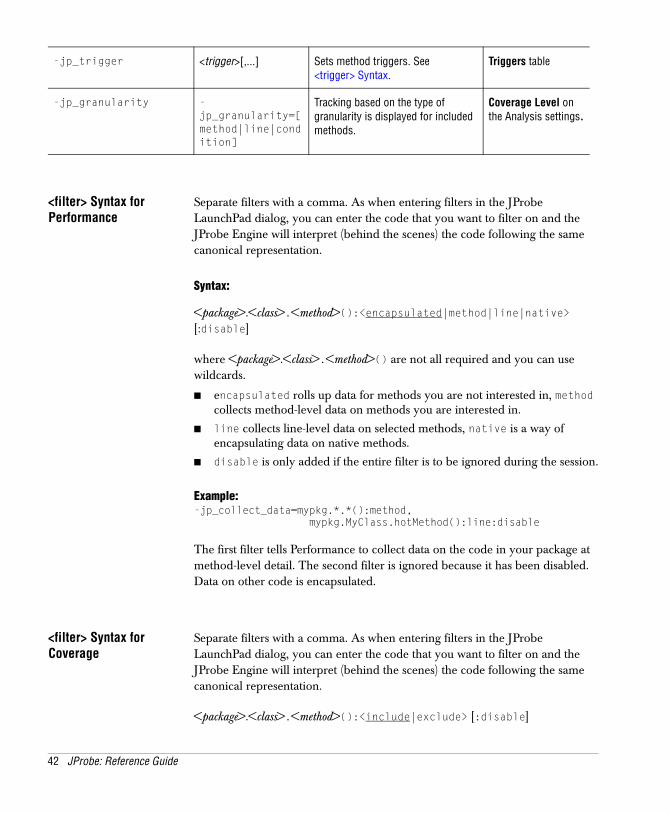
-jp_trigger <trigger>[,...] Sets method triggers. See<trigger> Syntax.
Triggers table
-jp_use_case [end_to_end|start_entry|finish_exit|none]
Provides use case control. Use Case controls.
Performance Option Values Description LaunchPad/Console Equivalent
Coverage Option Values Description LaunchPad/Console Equivalent
-jp_collect_data <filter>[,...] A comma-separated list of data collection filters. See <filter> Syntax for Performance.
Filters table
-jp_function [coverage] Tells jplauncher to run a Coverage session.
JProbe LaunchPad dialog in use
JPL File Structure and JProbe Options 41
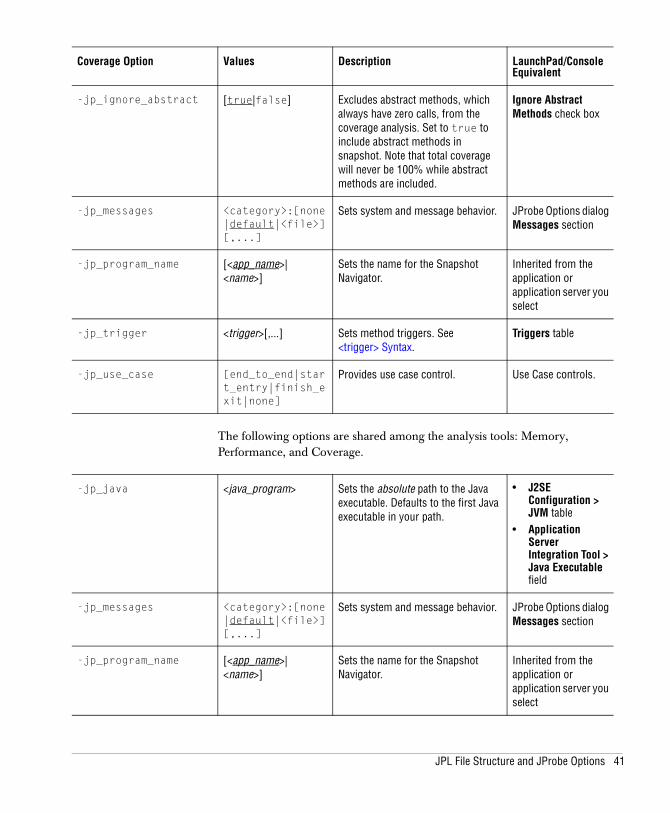
The following options are shared among the analysis tools: Memory, Performance, and Coverage.
-jp_ignore_abstract [true|false] Excludes abstract methods, which always have zero calls, from the coverage analysis. Set to true to include abstract methods in snapshot. Note that total coverage will never be 100% while abstract methods are included.
Ignore Abstract Methods check box
-jp_messages <category>:[none|default|<file>][,...]
Sets system and message behavior. JProbe Options dialog Messages section
-jp_program_name [<app_name>|<name>]
Sets the name for the Snapshot Navigator.
Inherited from the application or application server you select
-jp_trigger <trigger>[,...] Sets method triggers. See<trigger> Syntax.
Triggers table
-jp_use_case [end_to_end|start_entry|finish_exit|none]
Provides use case control. Use Case controls.
Coverage Option Values Description LaunchPad/Console Equivalent
-jp_java <java_program> Sets the absolute path to the Java executable. Defaults to the first Java executable in your path.
• J2SE Configuration > JVM table
• Application Server Integration Tool > Java Executable field
-jp_messages <category>:[none|default|<file>][,...]
Sets system and message behavior. JProbe Options dialog Messages section
-jp_program_name [<app_name>|<name>]
Sets the name for the Snapshot Navigator.
Inherited from the application or application server you select
42 JProbe: Reference Guide
<filter> Syntax for Performance
Separate filters with a comma. As when entering filters in the JProbe LaunchPad dialog, you can enter the code that you want to filter on and the JProbe Engine will interpret (behind the scenes) the code following the same canonical representation.
Syntax:
<package>.<class>.<method>():<encapsulated|method|line|native> [:disable]
where <package>.<class>.<method>() are not all required and you can use wildcards.
■ encapsulated rolls up data for methods you are not interested in, method collects method-level data on methods you are interested in.
■ line collects line-level data on selected methods, native is a way of encapsulating data on native methods.
■ disable is only added if the entire filter is to be ignored during the session.
Example:-jp_collect_data=mypkg.*.*():method,
mypkg.MyClass.hotMethod():line:disable
The first filter tells Performance to collect data on the code in your package at method-level detail. The second filter is ignored because it has been disabled. Data on other code is encapsulated.
<filter> Syntax for Coverage
Separate filters with a comma. As when entering filters in the JProbe LaunchPad dialog, you can enter the code that you want to filter on and the JProbe Engine will interpret (behind the scenes) the code following the same canonical representation.
<package>.<class>.<method>():<include|exclude> [:disable]
-jp_trigger <trigger>[,...] Sets method triggers. See<trigger> Syntax.
Triggers table
-jp_granularity -jp_granularity=[method|line|condition]
Tracking based on the type of granularity is displayed for included methods.
Coverage Level on the Analysis settings.
JPL File Structure and JProbe Options 43
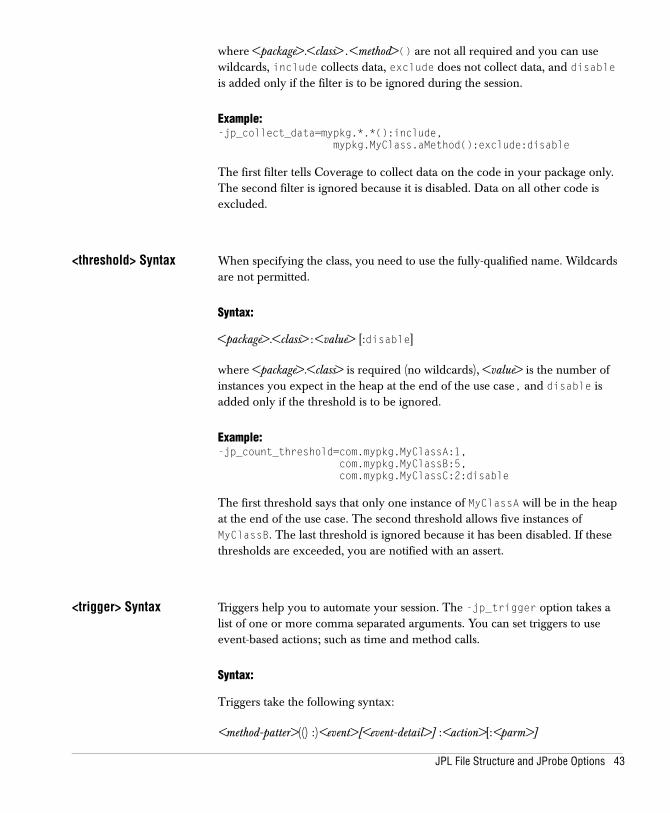
where <package>.<class>.<method>() are not all required and you can use wildcards, include collects data, exclude does not collect data, and disable is added only if the filter is to be ignored during the session.
Example:-jp_collect_data=mypkg.*.*():include,
mypkg.MyClass.aMethod():exclude:disable
The first filter tells Coverage to collect data on the code in your package only. The second filter is ignored because it is disabled. Data on all other code is excluded.
<threshold> Syntax When specifying the class, you need to use the fully-qualified name. Wildcards are not permitted.
Syntax:
<package>.<class>:<value> [:disable]
where <package>.<class> is required (no wildcards), <value> is the number of instances you expect in the heap at the end of the use case, and disable is added only if the threshold is to be ignored.
Example:-jp_count_threshold=com.mypkg.MyClassA:1,
com.mypkg.MyClassB:5,com.mypkg.MyClassC:2:disable
The first threshold says that only one instance of MyClassA will be in the heap at the end of the use case. The second threshold allows five instances of MyClassB. The last threshold is ignored because it has been disabled. If these thresholds are exceeded, you are notified with an assert.
<trigger> Syntax Triggers help you to automate your session. The -jp_trigger option takes a list of one or more comma separated arguments. You can set triggers to use event-based actions; such as time and method calls.
Syntax:
Triggers take the following syntax:
<method-patter>(() :)<event>[<event-detail>] :<action>[:<parm>]
44 JProbe: Reference Guide
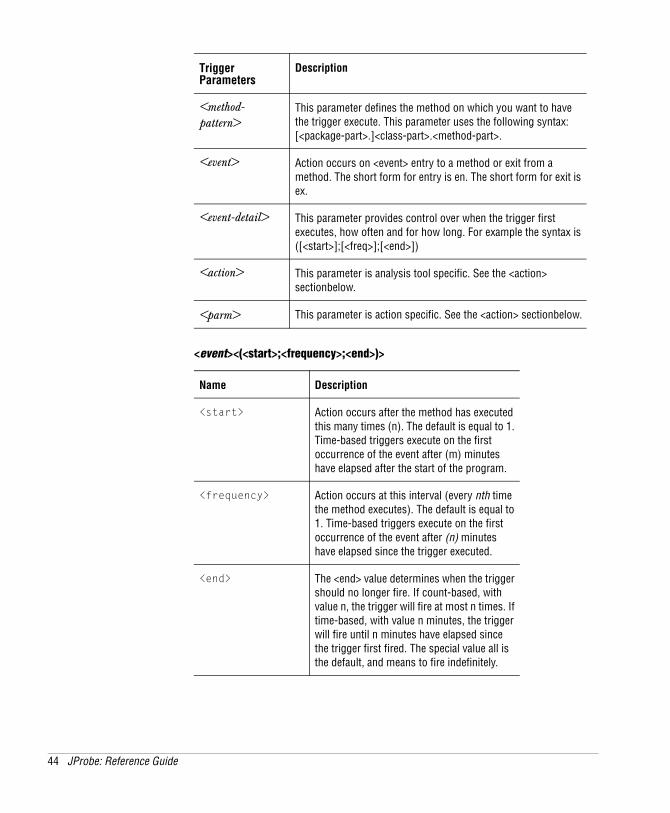
<event><(<start>;<frequency>;<end>)>
Trigger Parameters
Description
<method-pattern>
This parameter defines the method on which you want to have the trigger execute. This parameter uses the following syntax: [<package-part>.]<class-part>.<method-part>.
<event> Action occurs on <event> entry to a method or exit from a method. The short form for entry is en. The short form for exit is ex.
<event-detail> This parameter provides control over when the trigger first executes, how often and for how long. For example the syntax is ([<start>];[<freq>];[<end>])
<action> This parameter is analysis tool specific. See the <action> sectionbelow.
<parm> This parameter is action specific. See the <action> sectionbelow.
Name Description
<start> Action occurs after the method has executed this many times (n). The default is equal to 1. Time-based triggers execute on the first occurrence of the event after (m) minutes have elapsed after the start of the program.
<frequency> Action occurs at this interval (every nth time the method executes). The default is equal to 1. Time-based triggers execute on the first occurrence of the event after (n) minutes have elapsed since the trigger executed.
<end> The <end> value determines when the trigger should no longer fire. If count-based, with value n, the trigger will fire at most n times. If time-based, with value n minutes, the trigger will fire until n minutes have elapsed since the trigger first fired. The special value all is the default, and means to fire indefinitely.
JPL File Structure and JProbe Options 45
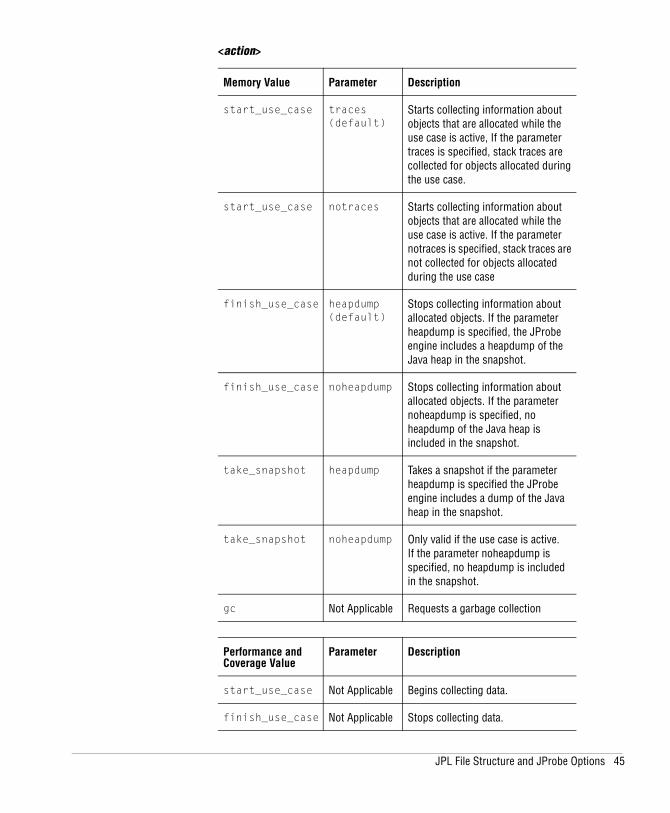
<action>
Memory Value Parameter Description
start_use_case traces (default)
Starts collecting information about objects that are allocated while the use case is active, If the parameter traces is specified, stack traces are collected for objects allocated during the use case.
start_use_case notraces Starts collecting information about objects that are allocated while the use case is active. If the parameter notraces is specified, stack traces are not collected for objects allocated during the use case
finish_use_case heapdump (default)
Stops collecting information about allocated objects. If the parameter heapdump is specified, the JProbe engine includes a heapdump of the Java heap in the snapshot.
finish_use_case noheapdump Stops collecting information about allocated objects. If the parameter noheapdump is specified, no heapdump of the Java heap is included in the snapshot.
take_snapshot heapdump Takes a snapshot if the parameter heapdump is specified the JProbe engine includes a dump of the Java heap in the snapshot.
take_snapshot noheapdump Only valid if the use case is active.If the parameter noheapdump is specified, no heapdump is included in the snapshot.
gc Not Applicable Requests a garbage collection
Performance and Coverage Value
Parameter Description
start_use_case Not Applicable Begins collecting data.
finish_use_case Not Applicable Stops collecting data.
46 JProbe: Reference Guide
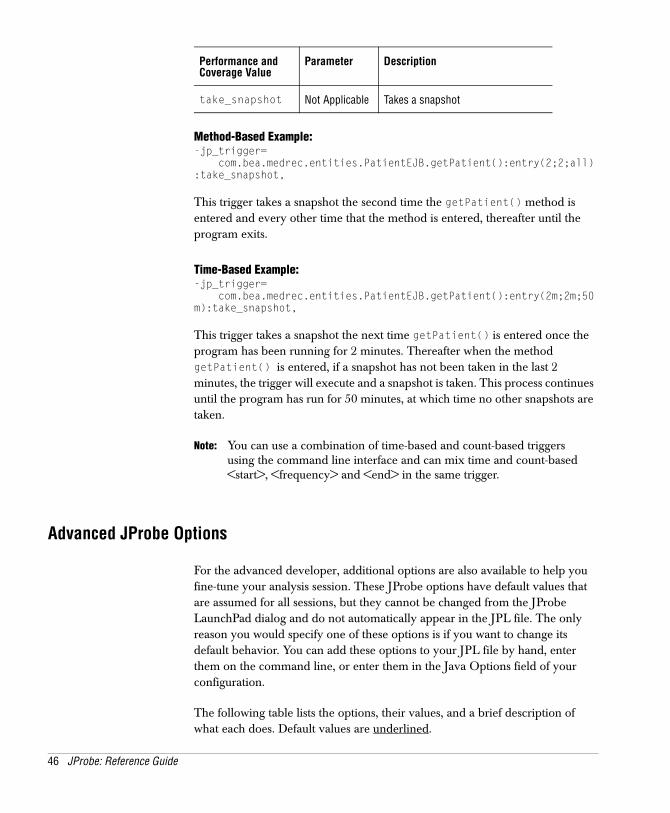
Method-Based Example:-jp_trigger=
com.bea.medrec.entities.PatientEJB.getPatient():entry(2;2;all):take_snapshot,
This trigger takes a snapshot the second time the getPatient() method is entered and every other time that the method is entered, thereafter until the program exits.
Time-Based Example:-jp_trigger=
com.bea.medrec.entities.PatientEJB.getPatient():entry(2m;2m;50m):take_snapshot,
This trigger takes a snapshot the next time getPatient() is entered once the program has been running for 2 minutes. Thereafter when the method getPatient() is entered, if a snapshot has not been taken in the last 2 minutes, the trigger will execute and a snapshot is taken. This process continues until the program has run for 50 minutes, at which time no other snapshots are taken.
Note: You can use a combination of time-based and count-based triggers using the command line interface and can mix time and count-based <start>, <frequency> and <end> in the same trigger.
Advanced JProbe Options
For the advanced developer, additional options are also available to help you fine-tune your analysis session. These JProbe options have default values that are assumed for all sessions, but they cannot be changed from the JProbe LaunchPad dialog and do not automatically appear in the JPL file. The only reason you would specify one of these options is if you want to change its default behavior. You can add these options to your JPL file by hand, enter them on the command line, or enter them in the Java Options field of your configuration.
The following table lists the options, their values, and a brief description of what each does. Default values are underlined.
take_snapshot Not Applicable Takes a snapshot
Performance and Coverage Value
Parameter Description
JPL File Structure and JProbe Options 47
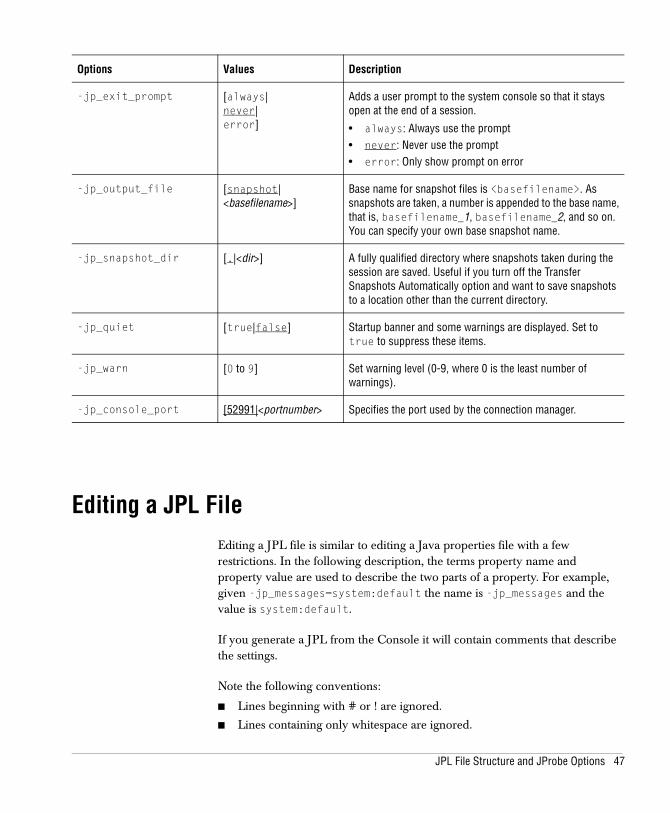
Editing a JPL FileEditing a JPL file is similar to editing a Java properties file with a few restrictions. In the following description, the terms property name and property value are used to describe the two parts of a property. For example, given -jp_messages=system:default the name is -jp_messages and the value is system:default.
If you generate a JPL from the Console it will contain comments that describe the settings.
Note the following conventions:
■ Lines beginning with # or ! are ignored.
■ Lines containing only whitespace are ignored.
Options Values Description
-jp_exit_prompt [always|never|error]
Adds a user prompt to the system console so that it stays open at the end of a session.
• always: Always use the prompt• never: Never use the prompt• error: Only show prompt on error
-jp_output_file [snapshot|<basefilename>]
Base name for snapshot files is <basefilename>. As snapshots are taken, a number is appended to the base name, that is, basefilename_1, basefilename_2, and so on. You can specify your own base snapshot name.
-jp_snapshot_dir [.|<dir>] A fully qualified directory where snapshots taken during the session are saved. Useful if you turn off the Transfer Snapshots Automatically option and want to save snapshots to a location other than the current directory.
-jp_quiet [true|false] Startup banner and some warnings are displayed. Set to true to suppress these items.
-jp_warn [0 to 9] Set warning level (0-9, where 0 is the least number of warnings).
-jp_console_port [52991|<portnumber> Specifies the port used by the connection manager.
48 JProbe: Reference Guide
■ To wrap a value to the next line, type \ at the end of the line to wrap.
■ You can use the following escape characters in the value:• \t tab
• \\ backslash
• \ (that is, backslash followed by space) space
• \x the character x
• \n end of line
• \r or \r\n line break
• \” or \’ quotes
■ Quotes are not required around arguments and paths containing white space (unlike the command line where quotes might be required). Only include quotes when you intend them as part of the value.
■ To change your application, edit the application property. Example: application=com.example.foo.Foo
■ To add application arguments, use the app_args_# property name, where # indicates the order of execution starting from 1. The order of the arguments in the file is irrelevant. Example: app_args_1=-run
■ To add JVM arguments, use the jvm_args_# property name, where # indicates the order of execution starting from 1. The order of the arguments in the file is irrelevant. Example: jvm_args_1=-cp
■ For JVM arguments, you can use environment variables as property values. Valid environment variable names start with a letter (a..z, A..z) or a minus sign, and can only contain letters, numbers, or the underscore character. As for syntax, you can use either ${ENVVAR} or %ENVVAR%, regardless of your platform.
Example
Given the following information on the command line:java -classpath $CLASSPATH com.example.foo.Foo arg1 "arg 2"
the same information is represented in the JPL file as follows:jvm_args_1=-classpathjvm_args_2=${CLASSPATH}application=com.example.foo.Fooapp_args_1=arg1app_args_2=arg 2
Memory Troubleshooting and Session Runtime Tips 49
Chapter 4
Memory Troubleshooting andSession Runtime Tips
As you work with JProbe, you may need some assistance to get the most out of your analysis sessions. The following sections provide some tips to help you. If you do not find what you are looking for here, try using the technical support resources offered by Quest Software. For more information, see “Contacing Customer Support ” section of the JProbe User Guide.
Troubleshooting TipsThe following tips can help you with problems you may encounter. See the Readme file for other product-related issues.
I am having difficulties configuring my environment.
Contact technical support for assistance. When you do, be prepared to describe your environment. The customer service representative may ask you to run a JProbe session that includes some debugging options to describe your settings more fully.
Debugging options include the following:■ -jp_echo_command=true■ -jp_exit_prompt=always
The session hangs when running an application server under load.
If you notice excessive heap growth without garbage collections followed by an application crash, increase the -Xms, -Xmx parameters or lighten the load so that the JVM has a chance to catch up and do a garbage collection. As the JVM caches data, you can increase the load.

50 JProbe: Reference Guide
Note: For some JVMs you will need to specify the initial heap size and maximum heap size with a specific value. For example, Xms512m -Xms512m.
For example, the compiling process for JSPs takes up a significant amount of memory. If your session is failing at a load of only, say, five pages per second, it is likely a memory allocation problem. Running through the JSPs at a slow pace allows the application server to cache them, and afterwards you can increase the load on the system without difficulty.
In the Runtime Heap Summary window, the memory reported in the Heap Usage Chart does not match the total line in the Runtime Instances.
The value reported in the Heap Usage Chart represents an approximation of the size of the heap based on summary data received from the JVM about memory used and memory freed. The Runtime Instances, on the other hand, contains details on instances that were allocated during your use case only, so it does not reflect the full heap.
So, for the purposes of your investigation, use the chart and values in the Runtime Instances as a starting point, but for serious investigation, take a snapshot and use the Instances View to analyze your data.
In the Runtime Heap Summary window, the Garbage Monitor tab does not contain any data.
An empty table could also indicate that a garbage collection has not yet occurred. Click the Request Garbage Collection toolbar button.
The Merged Allocation Points View window states “No trace available.”
If the Merged Allocation Points View window shows “No trace available,” the message may be because the JVM did not provide traces for any of the objects of the class.
The stack traces are inaccurate in the Merged Allocation Points View window.
For example, consider the following Java program: Method A line 100 calls Method B .. Method B line 200 Object o = new Object();
Most JVMs do some optimization to the code and eventually can inline the method B into the method A. After inlining, the line number reported in the

Memory Troubleshooting and Session Runtime Tips 51
stack trace will be A:100—that is, the line where A calls B, not the line where Object o is created. B is not visible in the stack trace.
You will know when you open the source code that inlining has occurred. You should be able to determine which method was inlined from the code associated with the line number, locate that method, and investigate the problem. If you are not familiar enough with your program to locate the method, you can rerun the session without the JVM’s optimizing compiler. Your program will run slower, but the accuracy of the allocation point information should improve because methods are not inlined. For more information, see “Disabling the Just-in-time ( JIT) or other Optimizing Compiler” in the JProbe User Guide.
How to generate an IBM dump.
Some IBM JVMs automatically generate a heapdump when an out of memory exception is thrown. You can also generate a heapdump in situations where you are using an IBM JVM and are unable to take a snapshot.
You need to set the environment variables to allow heapdumps on request and to specify the format of the heapdump (with the exception of an out of memory situation described below). The following environment variables allow the JVM to generate a list of all the objects in the Java heap.
Tip: On Windows you can generate a heapdump by sending a SIGBREAK signal to the process (ctrl + \ on UNIX and ctrl + break on Windows). The IBM_HEAP_DUMP and IBM_HEAPDUMP must be set prior to taking a heapdump.
Note: *By setting this environment variable
IBM_JAVA_HEAPDUMP_TEXT=true you will ensure that the system is able to import the text heapdump. If you set this environment variable IBM_JAVA_HEAPDUMP_TEXT=false you will ensure that the system is able to import the PHD heapdump. The default setting is IBM_JAVA_HEAPDUMP_TEXT=false.
Optionally, you can set the IBM_HEAPDUMPDIR=<directory> environment variable. This environment variable controls the location of where the heapdump file is saved.
IBM Dump Task Action
Add Java environment variables
On your system, set the environment variables:IBM_HEAP_DUMP=trueIBM_HEAPDUMP=trueIBM_HEAPDUMP_OUTOFMEMORY=trueIBM_JAVACORE_OUTOFMEMORY=trueIBM_JAVA_HEAPDUMP_TEXT=true*
52 JProbe: Reference Guide
Starting with SDK 1.4.2, some variables are automatically set by the JVM (IBM_HEAPDUMP_OUTOFMEMORY and IBM_JAVACORE_OUTOFMEMORY) which can result in several heap dump files (heapdump##.txt) and Javacore files (javacore##.txt) being generated when the Java heap becomes exhausted. This can be disabled by setting the following environment variables:
IBM_HEAPDUMP_OUTOFMEMORY=false
IBM_JAVACORE_OUTOFMEMORY=false
JProbe Console offers a graphical view option for post-processing heap dump files in txt and PHD file formats. For more information about using the IBM Text Dump and the IBM PHD Dump options see, Importing an IBM Dump into Memory in the JProbe User Guide.
Session Runtime TipsThe following tips will help you improve session runtime performance, regardless of the type of analysis session you are running.
Try different supported JVMs.
The session runtime performance depends in part on the speed at which your Java program runs. Modern JVMs. For more information, see the JVM documentation and Installing JProbe.
Exit or abort your program before investigating snapshots.
If you open a snapshot in one of the investigation tools while your program continues to run, you may find that the JProbe Console responds more slowly than desired. To improve JProbe Console performance, exit your program before opening a snapshot.
Choose not to monitor the session.
Monitoring the session requires an extra JVM be running: the JVM running the JProbe Console. You can run a JProbe session without the JProbe Console. Instead of interacting with the session through the JProbe Console, you use triggers to collect data and take snapshots. After the session ends, you can open the snapshots in the JProbe Console.
Memory Troubleshooting and Session Runtime Tips 53
Alternatively, you can attach a Console, take a snapshots and when finished detach and close the Console.
Reduce the depth of stack traces.
Reduce the depth of the trace that is saved. A full stack trace may not always be required to identify the location and context of an object allocation; only the last few methods need to be saved.
Keep Use Cases Short.
Your program will run slower during a use case, since JProbe has to collect a great deal of information. Keep use cases short to minimize this impact.

54 JProbe: Reference Guide
Performance Troubleshooting and Session Runtime Tips 55
Chapter 5
Performance Troubleshootingand Session Runtime Tips
As you work with JProbe, you may need some assistance to get the most out of your analysis sessions. The following sections provide some tips to help you. If you do not find what you are looking for here, try using the technical support resources offered by Quest Software. For more information, see “Contacting Customer Support” in the JProbe User Guide.
Performance Troubleshooting TipsThe following tips can help you with problems you may encounter. See the Readme file for other product-related issues.
I am having difficulties configuring my environment.
Contact technical support for assistance. When you do, be prepared to describe your environment. The customer service representative may ask you to run a JProbe session that includes some debugging options to describe your settings more fully. You enter debugging options in the JVM Arguments ( Java Options) field available from the JProbe LaunchPad dialog.
Debugging options include the following:■ -jp_echo_command=true■ -jp_exit_prompt=error
I cannot connect to the shared snapshot directory.
If you have trouble connecting to a shared directory, ensure the directory is shared and/or the drive is mounted. For assistance, contact your System Administrator.
56 JProbe: Reference Guide
In the Call Graph tab, the graph does not change to reflect the number of nodes I entered in the Show Top field.
If you type a number in the Show Top field that is the same as the existing number, the Call Graph may not redraw correctly. Use the spin box arrows.
I have some small, frequently-called methods that show up as hotspots. Why?
If your JVM is adding a lot of overhead, you can see it most when you analyze frequently-called methods that execute very quickly — these methods (such as accessors) may be inappropriately reported as hotspots. They are unlikely candidates for performance improvement. However, they may affect your analysis by hiding the real hotspots in your application.
You can use JProbe Performance filters to reduce the overhead attributed to these small methods or to eliminate the overhead altogether.
■ To reduce the overhead, add a filter for the small method and set it to Encapsulated.
■ To eliminate the overhead, add filters for each method that calls the small method and set the filters to Encapsulated. This is the best solution if the method only has a few callers.
My program called a method in a derived class, but I don’t see the method in the Call Graph or Method List.
This issue arises when you set an encapsulated filter on the derived class, but use a method- or line-level filter on the base class. What happens is that when you call a method in the derived class through a reference of the base type, JProbe attributes the performance data for the derived method to the calling method. The easiest fix is to ensure that both classes use the same type of filter. Alternatively, you can set a line-level filter on the calling method to see how much time was spent calling the derived method.
Consider the following program snippet and imagine that Base has a method-level detail filter, while Derived uses an encapsulated filter.
class Base {
public static void main(String args[]) { Base base = new Derived();
base.method();}
public void method() { System.out.println("In Base.method()");
}
Performance Troubleshooting and Session Runtime Tips 57
}
class Derived extends Base {
public void method() { System.out.println("In Derived.method()");
}
}
In this example, all performance data for Derived.method() is attributed to main(), and Derived.method() does not appear in the Call Graph or Method List. If you changed the filter on the Derived class to method-level, the performance data would be correctly attributed to Derived.method().
The session hangs when running an application server under load.
First, you should turn off object allocation data collection. If you still notice excessive heap growth without garbage collections followed by an application crash, increase the -Xms, -Xmx parameters or lighten the load so that the JVM has a chance to catch up and do a garbage collection. As the JVM caches data, you can increase the load.
For example, the compiling process for JSPs takes up a significant amount of memory. If your session is failing at a load of only, say, five pages per second, it is likely a memory allocation problem. Running through the JSPs at a slow pace allows the application server to cache them, and afterwards you can increase the load on the system without difficulty.
In the Runtime Heap Summary window, the memory reported in the Heap Usage You need to set the environment variables to allow heapdumps on request and to specify the format of the heapdump (with the exception of an out of memory
Performance Session Runtime TipsThe following tips will help you to improve session runtime performance.
58 JProbe: Reference Guide
Try different supported JVMs.
The session runtime performance depends in part on the speed at which your Java program runs. Modern JVMs, such as Java 2 SDK 1.4.2 and IBM 1.5.0, generally improve program performance. For more information, see the JVM documentation and Installing JProbe Guide.
Exit or abort your program before investigating snapshots.
If you open a snapshot in one of the investigation tools while your program continues to run, you may find that the JProbe Console responds more slowly than desired, because it is competing for resources with the JProbe Analysis Engine. To improve JProbe Console performance, exit your program or abort the session before opening a snapshot.
Choose not to monitor the session or monitor it remotely.
Monitoring the session requires that two JVMs be running: the JVM under analysis that executes your program and the JVM running the JProbe Console. If you monitor remotely, the JVMs are not competing for resources on the same computer. Alternatively, you can run a JProbe session without the JProbe Console. Instead of interacting with the session through the JProbe Console, you use triggers to collect data and take snapshots. After the session ends, you can open the snapshots in the JProbe Console.
Set filters to reduce the amount of data collected.
Filters reduce overhead and improve session performance significantly. The default filter setting collects data on methods in your package, and encapsulates data for the methods contained in all other packages. If you were to collect data on all methods, the session would run very slowly and the data collected would be of little value in tracking down performance bottlenecks. As you confirm which of your methods are working well, you can encapsulate those methods too. For more information, see “Encapsulating Data on Methods” in the JProbe User Guide.
Only track object allocation data when you want to look for overallocations.
Collecting data on all objects allocated by your methods is time consuming, and you do not need this information to track down your performance hotspots. Only enable Track Object Allocation when you want to focus on how many objects your methods allocate.
Performance Troubleshooting and Session Runtime Tips 59
Only collect line data on problem methods.
Only use the Line Level filter on methods that you have identified as performance bottlenecks. Collecting data line-by-line causes the session to run more slowly. For more information, see the JProbe User Guide, Collecting Data on Lines of Code.
Reduce the number of nodes in the Call Graph.
Displaying a large or complex Call Graph can take longer than desired. To improve the responsiveness of the Call Graph, use some of the following techniques to reduce the number of methods that need to be maintained:
■ use data collection filters
■ exclude threads
■ reduce the number of Show Top nodes
■ prune subtrees
■ isolate a subtree

60 JProbe: Reference Guide
61
Chapter 6
Coverage Troubleshooting
You may encounter the following problems while using JProbe.
A statement that I think should be executable is non-executable (or vice versa)
Your javac compiler makes a determination about whether a line of code is executable or not. For example, some compilers consider a try statement to be executable, while others treat it as non-executable. Same with variable declarations. JProbe cannot change this assessment. You will need to become familiar with your compiler’s behavior over time.
Lines of code with identical statements show different results
For example, sometimes a line with only a bracket has calls attributed to it even though other similar lines are treated as if they are non-executable. JProbe uses the line table generated by your compiler to match ranges of bytes in the bytecode to line numbers in your source code. Sometimes the match can be imprecise, so the results belonging to one line are applied to another line, which can cause confusion. You can try improving the line number table when you compile your code, but there will likely always be some overlap.
When there is executed code and non-executed code on the same line, some lines are reported as hit, while others are reported as missed
When multiple statements are on one line, JProbe refers to the compiler’s line table to decide what to do with the line of code.
For example:case1:Non-ExecutedCode();break;case2:ExecutedCode();break;
The code for case1 is not executed but the code for case2 is executed; the whole line could be displayed as either hit or missed, depending on your compiler. You can eliminate this problem by putting one statement per line.

62 JProbe: Reference Guide
Index 63
Index
Aadvanced 46algorithms, inefficient 19application server integration,JPasrun 29architecture, understanding the 25automated sessions
regular checkups 26
Ccompiling your program 27correctness issue 15Coverage 61customer expectations, managing 17
Ddiminishing Java issues 14
Eefficiency issues, program 17excessive object allocation 19expectations, managing customer 17
Ffilters 42Filters (data collection)
performance session runtime tip 58
G-g compiler option 27garbage collection
excessive 19
Hheap dump 51
IIBM heap dump 51IBM PHD Dump 52
inefficient algorithms 19Integration Tool 29
JJava development issues 14JPasrun, application server integration 29JPL file 33
editing 47JPL file, structure 33jplauncher
command line arguments 31commands 29reference 29with a JPL file 30
JProbe LaunchPad dialogequivalent options in JPL file 39
JProbe Options 38JProbe options 46
Lline level data,-g compiler 27line-level data
improving 27troubleshooting 61
line-level data, improving 27
MMemory 49memory management issues 17
PPerformance 55performance
issues 19pitfall, inefficient algorithms 19pitfalls
excessive object allocation 19program correctness issues 15program efficiency issues 17
Rregular checkup 26regular checkups 26
Ssample 33strategies

64 JProbe: Reference Guide
achieving program efficiency 23syntax 42, 43syntax for Coverage 42syntax for Performance 42
Ttesting
issues and program correctness 15thresholds 42triggers 43Troubleshooting 49, 55, 61
Uuse cases
selecting 26