jpdo systems modeling and analysis - umd isr · jpdo systems modeling and analysis ... • the smad...
TRANSCRIPT
JPDO Systems Modeling and Analysis
Dr. George Hunter
Presented on behalf of Yuri Gawdiak
JPDO Systems Modeling and Analysis Division (SMAD)
September 5, 2007
2
Systems Modeling and Analysis Division
JPDO Organizational Changes
• Yuri Gawdiak has joined the JPDO as the lead for the newly created Systems Modeling and Analysis Division (SMAD).
• This division will continue the SEAD's work on modeling the NextGen architecture and systems.
• SMAD will also provide analytical support to other JPDO offices to include the Enterprise Architecture and Engineering Division, the Portfolio Management Division, and the Policy Division.

3
Systems Modeling and Analysis Division
JPDO Organizational Changes
• Yuri comes to the JPDO from NASA and has extensive experience in aeronautical engineering and analysis.
• He managed the development and transfer of air traffic management and safety applications to the FAA and industry and was the program manager of the Engineering for Complex Systems program.
• Most recently, he has been performing strategic analyses within NASA's Program Analysis and Evaluation Office.

4
Systems Modeling and Analysis Division
• Priorities:– Better coordination with Enterprise Architecture & Portfolio
Management Divisions
– Support improved Operational Improvement prioritizations and sequencing
– Develop and implement comprehensive verification & validation strategy
• Approach:– Collect requirements and schedule targets from JPDO
divisions
– Conduct technical interchange meetings with partner organizations & programs to get lessons learned, expectations, issues, requirements, and identify possible tools/products that are mutually beneficial
– Develop integrated SMA division plan

5
SMAD Key Planning Elements
• Stakeholder Identification
• Requirements Analysis
– Fixes to existing functions
– Upgrades/performance improvements
– New functions/gap fillers
• Current key goals in the SMAD plan
– Improve turn-around time improvements/quick response capability
– Integrated JPDO/FAA support schedule
– Strategic upgrades (including long term validation approaches)

6
Systems Modeling and Analysis Division
JPDO Goals
Expand Capacity
Ensure Safety
Protect the Environment
Ensure our National Defense
Secure the Nation
Retain U.S. Leadershipin Global Aviation
7
Systems Modeling and Analysis Division
What is NextGen?
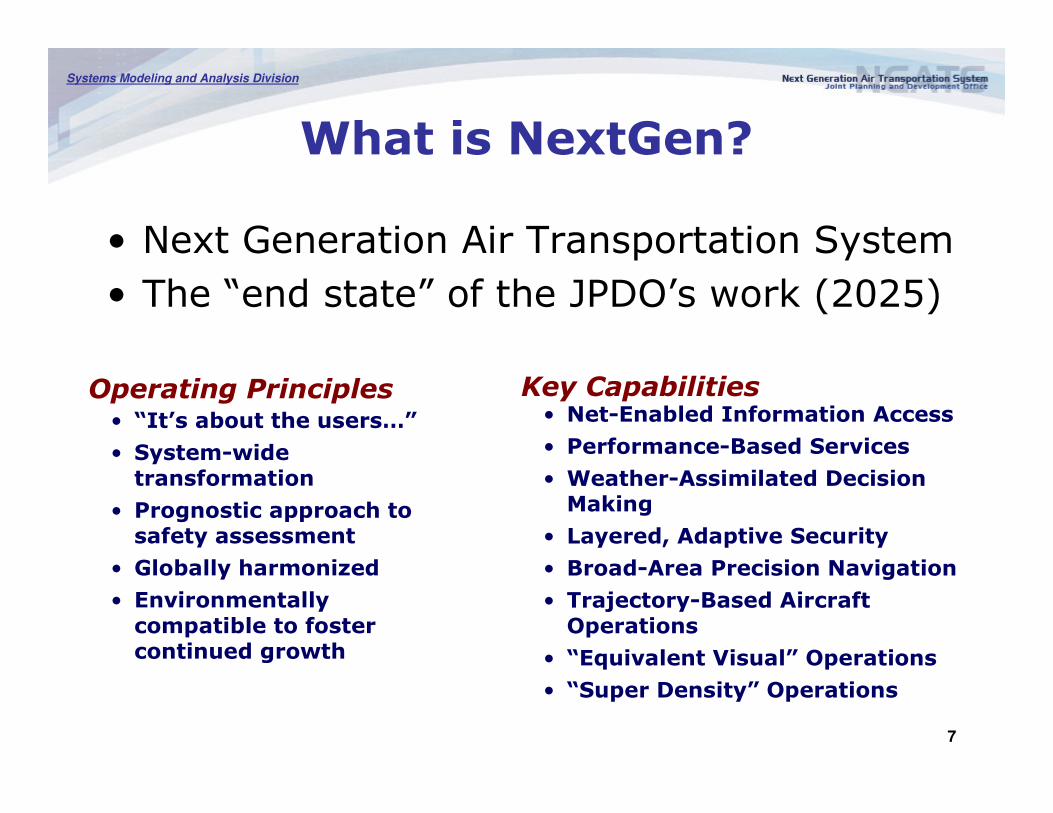
• Next Generation Air Transportation System
• The “end state” of the JPDO’s work (2025)
Operating Principles• “It’s about the users…”
• System-wide transformation
• Prognostic approach to safety assessment
• Globally harmonized
• Environmentally compatible to foster continued growth
• Net-Enabled Information Access
• Performance-Based Services
• Weather-Assimilated Decision Making
• Layered, Adaptive Security
• Broad-Area Precision Navigation
• Trajectory-Based Aircraft Operations
• “Equivalent Visual” Operations
• “Super Density” Operations
Key Capabilities

8
Operational Improvements (OIs)
• Each segment in the Portfolio Roadmap is composed of a set of Operational Improvements
• Each OI indicates a particular step towards achieving one or more of the JPDO key capabilities (e.g., trajectory-based operations) and thus achieving one or more of the JPDO national goals (e.g., capacity)
• The SMAD models groups of OI’s and individual OI’s to evaluate the performance of the NextGen
• Not all OIs have been modeled
– Some are too vague
– Some cannot be addressed by our current models

9
Systems Modeling and Analysis Division
SM
AD
OI
Impact
CharacterizationDirect NAS Effects
(ACES, LMINET,
ProbTFMBoeing Airport
Capacity Constraints)
Multi-year
Consumer, Carrier
Ramifications
(NAS Strategy
Simulator, USCAP)
Strategy
Impact
(Metrics)
Safety,
Environmental
(NIRS, INM, EDMS)
Security,
Economic Impacts
(GRA AMMS &
NACBA,
Operational
Improvement (OI)
DevelopmentDecisions
Strategy Evaluation
Existing Data (e.g. ETMS Schedules)
Define Future
Schedule and
Conditions(TSAM, AvDemand) Validation
IPT
s
SMAD Modeling and Analysis Framework

10
Systems Modeling and Analysis Division
SMAD Modeling and Simulation Tools• ACES (NASA-Ames/Sensis): Agent-based simulation of individual aircraft flying one day
of NAS activity
• LMINET (LMI): Queuing model for airports and sectors of one day of NAS activity.
• ProbTFM Tool (Sensis): Tool for designing and evaluating probabilistic traffic flow management in heavy weather
• AvDemand (Sensis): Calculates future NAS demand based on FAA forecasts
• AvAnalyst (Sensis): Analysis and visualization tool for NASA ACES simulation outputs
• TSAM (LaRC, VaTech): Transportation Systems Analysis Model – demand generation and NAS-wide modeling and analysis
• NAS-Wide Environmental Impact Model (Metron, NASEIM): Detailed calculator of noise and emissions based on individual flight trajectories from ACES
• GRA Screening Model (GRA): For each passenger service airport, model describing current security lanes and processing rates; may be adapted for additional lanes or changes in processing rates
• FAA NAS Strategy Simulator (Ventana): Multi-year, macro-level simulation of annual system statistics of demand, NAS activity, FAA costs and revenues
• Airport Capacity Constraints Model (Boeing): For 35 OEP airports, computes detailed capacity as a function of runway configuration, operational procedures, and ground infrastructure.
11
Systems Modeling and Analysis Division
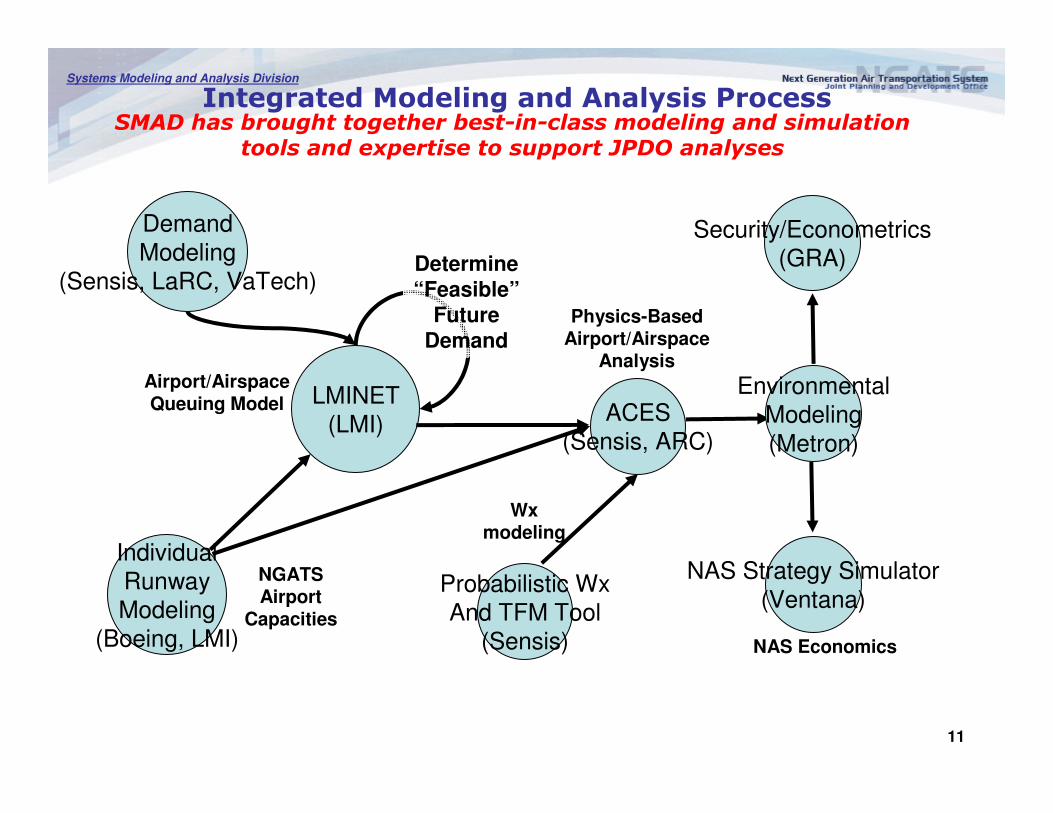
Integrated Modeling and Analysis Process
Demand
Modeling
(Sensis, LaRC, VaTech)
LMINET
(LMI)
Individual
Runway
Modeling
(Boeing, LMI)
NGATSAirport
Capacities
Physics-BasedAirport/Airspace
Analysis
Determine“Feasible”
FutureDemand
ACES
(Sensis, ARC)
Environmental
Modeling
(Metron)
NAS Strategy Simulator
(Ventana)
Security/Econometrics
(GRA)
SMAD has brought together best-in-class modeling and simulation tools and expertise to support JPDO analyses
Probabilistic Wx
And TFM Tool
(Sensis)
Wxmodeling
NAS Economics
Airport/AirspaceQueuing Model

12
Systems Modeling and Analysis Division
Recent NAS Tradeoff Studies
• Congestion modeling
• Critical flights
• Delay distribution
• NAS performance sensitivity
13
Systems Modeling and Analysis Division
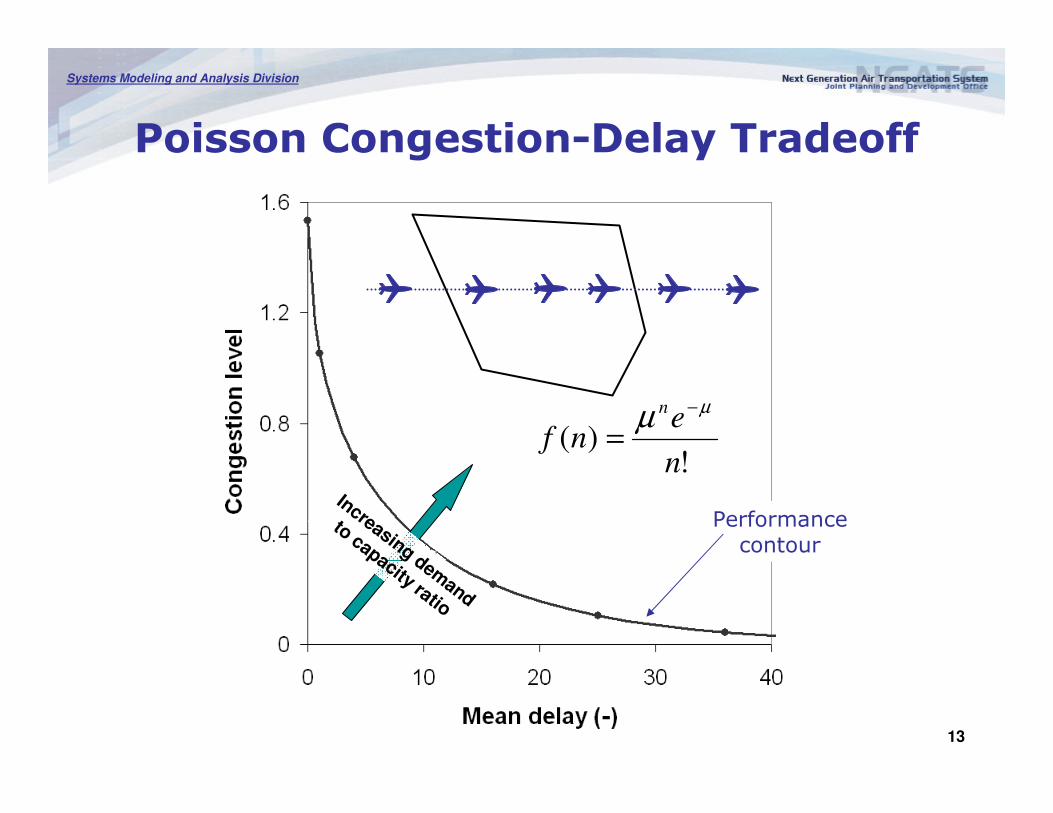
Poisson Congestion-Delay Tradeoff
!)(
n
enf
n µµ −
=
Increasing demand
to capacity ratio
Performancecontour

14
Systems Modeling and Analysis Division
NAS Performance Contours
Increasing traffic
and/or weather
2006/09/08
2006/11/17
2006/07/04 2006/11/12
2006/11/162007/01/07
2006/12/14
Lines of constant
NAS performance
Date Traffic Weather2006/11/16 Normal Heavy2007/01/07 Light Heavy2006/11/12 Light Moderate2006/12/14 Normal Light2006/07/04 Light Moderate2006/09/08 Normal Clear2006/11/17 Normal Clear
15
Systems Modeling and Analysis Division
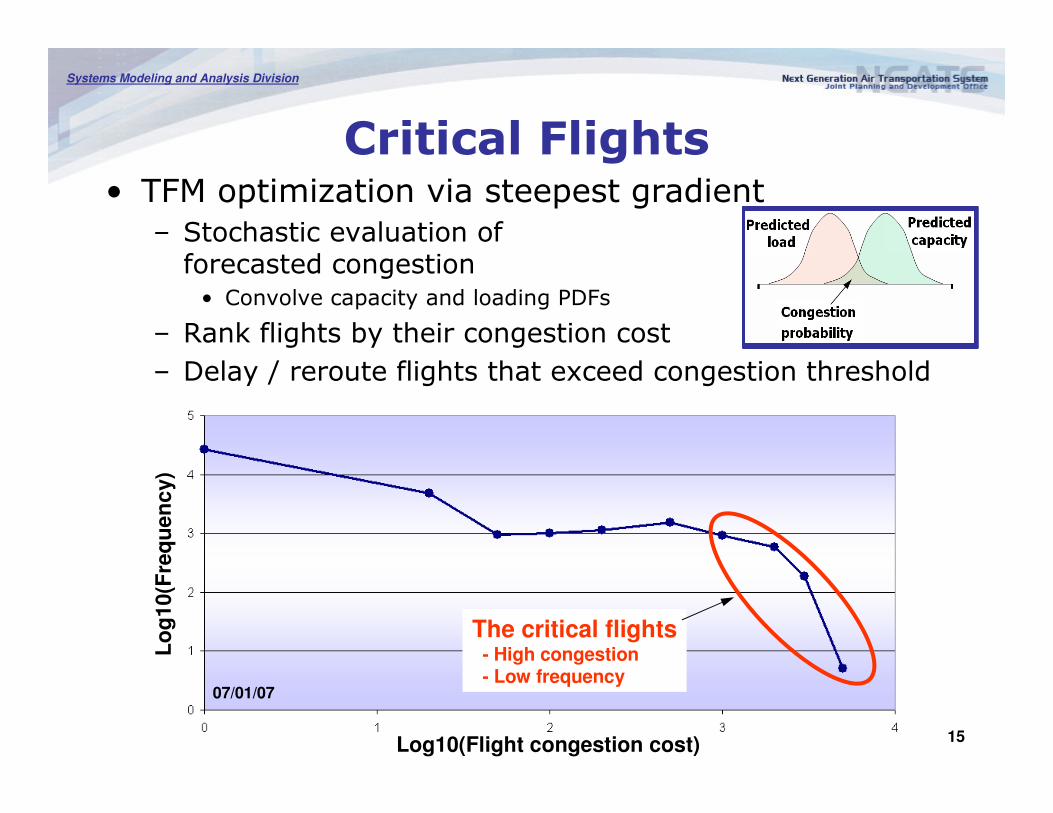
Critical Flights• TFM optimization via steepest gradient
– Stochastic evaluation of forecasted congestion• Convolve capacity and loading PDFs
– Rank flights by their congestion cost
– Delay / reroute flights that exceed congestion threshold
Lo
g10(F
req
uen
cy)
Log10(Flight congestion cost)
The critical flights- High congestion- Low frequency
07/01/07

16
Systems Modeling and Analysis Division
Delay Distribution
Lo
g10(F
req
uen
cy)
Log10(Flight congestion cost)
↑↑↑↑ #Flights delayed
↓↓↓↓ Delay/flight delayed
↓↓↓↓ Efficiency of delay
↑↑↑↑ Total delay
Log10(Flight congestion cost)
Lo
g10(F
req
uen
cy)

17
Systems Modeling and Analysis Division
Mean vs RMS Delay
Nov 12, 2006
RMS delay
Mean delay
Increased delay distribution
18
Systems Modeling and Analysis Division
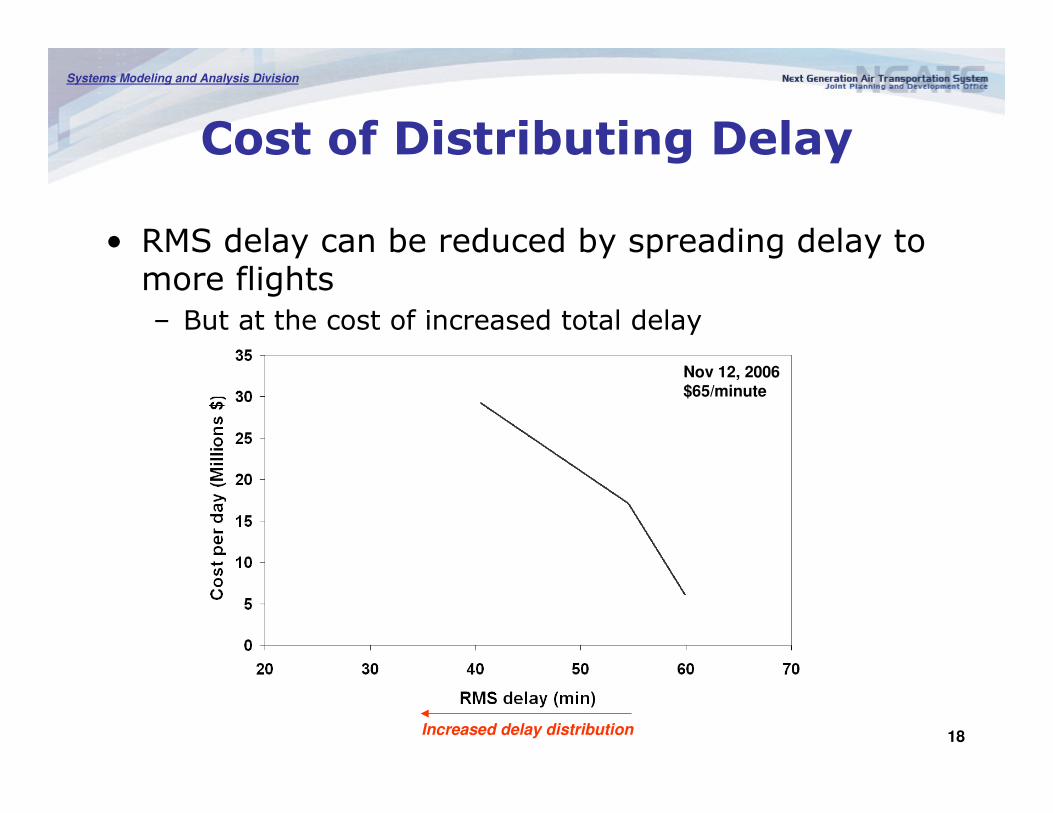
Cost of Distributing Delay
• RMS delay can be reduced by spreading delay to more flights
– But at the cost of increased total delay
Nov 12, 2006$65/minute
Increased delay distribution

19
Systems Modeling and Analysis Division
Min(Delay) andDistributed Delay Solutions
Nov 12, 2006
ETMS/ASPM
Minimum delay
Non agileminimum delay
Delay distribution
Non agiledelay distribution

20
Systems Modeling and Analysis Division
BACKUP

21
Systems Modeling and Analysis Division
Performance-Based TFM
Egalitarian TFM: Minimize max(delay)
Utilitarian TFM: Minimize sum(delay)
Forecasted
congestion
Stream A
Stream B

22
Systems Modeling and Analysis Division
2006/11/12• Sunday
– Traffic: Light (42,037 IFR tracks)
– Weather: Moderate-heavy

23
Systems Modeling and Analysis Division
ProbTFM Optimization
• Is the egalitarian premise correct?
– We find a great variation in flight congestion cost, with a few flights with very high costs
Lo
g10(F
req
uen
cy)
Log10(Flight congestion cost)
The critical flights- High congestion- Low frequency
Jan 7, 07
The policy decision needs to be informed of NAS performance relationships …

24
Systems Modeling and Analysis Division
Recent results
• Probabilistic CDM

25
Systems Modeling and Analysis Division
Probabilistic CDM• Performance-based probabilistic TFM
– Premise: Flight plans and traffic schedule are a rich solution with many constraints and preferences built-in• Should minimize deviation from traffic schedule
– Try to minimize control effort for a given NAS performance target• Give operators visibility into flight costs and the tools; let them solve the problem
Lo
g10(F
req
uen
cy)
Log10(Flight congestion cost)
The critical flights- High congestion- Low frequencyJan 7, 07
26
Systems Modeling and Analysis Division
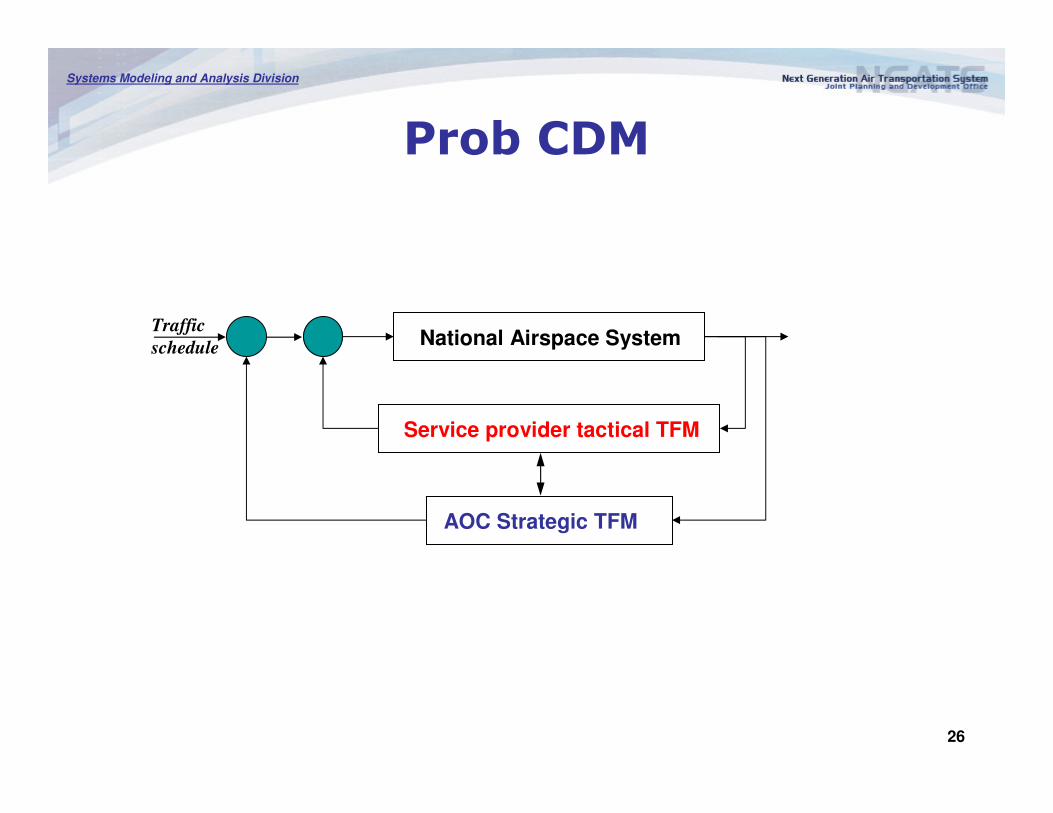
Prob CDM
National Airspace System
Service provider tactical TFM
AOC Strategic TFM
Traffic
schedule