jp morgan - north america metals & mining
TRANSCRIPT

8/20/2019 JP Morgan - North America Metals & Mining
http://slidepdf.com/reader/full/jp-morgan-north-america-metals-mining 1/17
North America Equity Research26 July 2010
North America Metals & MiningSteel (Stock) Momentum Turning Positive
North America Metals & Mining
Michael F. Gambardella AC
(1-212) 622-6446
Tyler J. Langton(1-212) 622-5234
Brian P. Ossenbeck, CFA(1-212) 622-1023
J.P. Morgan Securities Inc.
See page 13 for analyst certification and important disclosures.J.P. Morgan does and seeks to do business with companies covered in its research reports. As a result, investors should be aware that the firm mhave a conflict of interest that could affect the objectivity of this report. Investors should consider this report as only a single factor in making thinvestment decision.
• Macro headwinds show signs of abating. Concerns surrounding astronger dollar and a slowing Chinese economy sent investors into asteel stock selling frenzy over the last two months. In addition, investors pointed toward declining Chinese prices of iron ore and steel to supporttheir bearish views on U.S. steel stocks. On July 6th, the Wall StreetJournal published a front page story about steel prices declining thatappeared to top-tick the market's bearish concerns. In our view, themarket momentum is turning from ultra-bearish to bullish and recentlyhit an inflection point. Fears about a strengthening U.S.-dollar, a majorheadwind for steel and material stocks, has faded as the dollar actuallydeclined 8% against the Euro to $1.29 after many had proclaimed that
the dollar was headed to parity just six weeks ago. Recently, the marketappears to be anticipating that China’s government is actually movingcloser to easing and re-stimulating growth instead of continuing itstightening policies. As a result, we think the two biggest macroheadwinds for steel (and materials) stocks appear to be fading.
• Key steel leading indicators recently turn positive. In the past week,Chinese iron ore prices have risen 8% while Chinese steel prices haveincreased for the first time in two months. Scrap prices in Turkey, amajor global buyer, have also been moving up recently. In our opinion,the macro and industry-specific pressures dragging steel stocks downover the past two months are now turning positive.
• X remains the best way to participate in higher steel and iron oreprices. We see the recent activity in China’s steel prices, Turkey’s scrapimports, and spot iron ore prices as early indicators for what will likely be a 4Q recovery for the industry. U.S. Steel (X/OW rated) offersinvestors leverage to participate in these themes via its early cycle endmarkets and insulation against rising raw material costs at an attractivevaluation. Cliffs Natural Resources (CLF/OW rated) also providesexposure to this trend, although we would exercise caution heading intothe 2Q conference call on July 29th since CLF is still in arbitration withsome of its North American Iron Ore customers. We also believeArcelorMittal (MT/OW rated), with its global reach and captive ironore assets, should also benefit in this environment even though we
believe they will have to reduce 3Q guidance on the upcoming call.

8/20/2019 JP Morgan - North America Metals & Mining
http://slidepdf.com/reader/full/jp-morgan-north-america-metals-mining 2/17
2
North America Equity Research26 July 2010
Michael F. Gambardella(1-212) [email protected]
Investment Thesis Notwithstanding temporary dislocations, we believe iron ore prices are ultimately the
key driver of steel, scrap, and steel stock prices as iron ore sits atop the steel cost
pyramid since steel and scrap are basically iron ore derivatives. As a result, we think
higher Q3 iron ore contract prices, supply discipline, and continued economic
improvement will ultimately push steel prices higher as concerns over summer
seasonality, excess blast furnace capacity, and macro risks abate.
In the past week, we have seen Chinese steel and spot iron ore prices post their first
increases since early May. Spot iron ore prices are up 8% while Chinese steel prices
have increased 6%. Scrap prices in Turkey, a major scrap buyer in the world, have
been trending up as well. In addition to the first positive steel industry datapoints, we
are seeing a big shift in the market’s perceptions of two key macro drivers of steel(and materials) stocks – the dollar and China. It was only 5-6 weeks ago that the
dollar had rallied against the Euro to 1.19 and many industry observers thought the
dollar was heading to parity with the Euro - a strong dollar is viewed as a major
headwind for steel stocks (and prices), especially U.S.-based steels. Furthermore,
market fears about China’s credit tightening and slowing demand put additional
downward pressure on steel and other material stocks. Recently, the market appears
to be anticipating that China’s government is actually getting closer to easing and re-
stimulating growth. As a result, we think the two biggest macro concerns the market
had appear to be fading.
Finally, steel stocks tend to trade around the market’s perceptions of inflection points
for future earnings newsflow. Usually these inflection points occur just as the market
consensus appears to be unusually negative or positive. On July 6th, the Wall Street
Journal published a front page story about declining steel prices. In our opinion, the
WSJ story marked a bottom in investor sentiment on the group. In fact, most steel
stocks have outperformed the S&P 500 since the July 6th WSJ story (see Figure 1).
Figure 1: The majority of steel stocks outperformed the S&P since July 6th
95
100
105
110
115
120
125
130
135
7/6/2010 7/8/2010 7/10/2010 7/12/2010 7/14/2010 7/16/2010 7/18/2010 7/20/2010 7/22/2010
AKS
X
MT
STLD
S&P 500
NUE
Source: Bloomberg

8/20/2019 JP Morgan - North America Metals & Mining
http://slidepdf.com/reader/full/jp-morgan-north-america-metals-mining 3/17
3
North America Equity Research26 July 2010
Michael F. Gambardella(1-212) [email protected]
Iron ore prices spiked on strong production surge
As shown in Figure 2 below, spot iron ore prices rallied from late 2009 and reached a
peak of roughly $185/tonne CFR on April 23 before sliding back to $118/tonne inmid-July and recently showing a modest increase to $127/tonne. At the peak, spot
prices were roughly 53% above the Q2 contract price, which was 90% above the
2009 annual contract price. While spot iron ore prices are now 13% below the Q3
contract price, (see Figure 3 below) they still command a 1% premium to the Q2
contract price.
Figure 2: Spot prices currently trade at a 1% premium to Q2 freight adjusted contract prices
0
50
100
150
200
250
Mar-
05
Jul-
05
Nov-
05
Mar-
06
Jul-
06
Nov-
06
Mar-
07
Jul-
07
Nov-
07
Mar-
08
Jul-
08
Nov-
08
Mar-
09
Jul-
09
Nov-
09
Mar-
10
Jul-
10
$ / T o n n e
Contract Price (Vale SSF) Brazil-China Freight Spot Price
Source: Company reports, J.P. Morgan estimates, and Bloomberg.
Figure 3: Spot iron or e prices are currently at a 13% discount t o the Q3 contract price
-40%
-20%
0%
20%
40%
60%
80%
100%
120%
Mar-
05
Jul-
05
Nov-
05
Mar-
06
Jul-
06
Nov-
06
Mar-
07
Jul-
07
Nov-
07
Mar-
08
Jul-
08
Nov-
08
Mar-
09
Jul-
09
Nov-
09
Mar-
10
Jul-
10
I r o n O r e S p o t P r e m i u m / ( D i s c o u n t )
Source: Bloomberg.
We think the surge in spot prices through the spring of this year was driven by a
confluence of factors. On the demand side, Chinese monthly steel production
climbed from the high 40 million tonne range in the last two months of 2009 and hit
55 million tonnes in both March and April of this year, topping out at 56 million
tones in May (or an annualized rate of 672mm tonnes vs. 2009 production levels of
566 million tonnes). At the same time, global monthly production ex-China also
started to rebound, increasing from the high 50/low 60 million tonne range in the
October 2009-February 2010 time frame to 66-68mm tonnes in March, April and
Spot iron ore prices peaked at a
53% premium to the Q2 contractprice, but now trade at a 1%
premium to Q2 and a 13%
discount to Q3 contract prices.
8/20/2019 JP Morgan - North America Metals & Mining
http://slidepdf.com/reader/full/jp-morgan-north-america-metals-mining 4/17
4
North America Equity Research26 July 2010
Michael F. Gambardella(1-212) [email protected]
May of 2010. This ramping production forced buyers into the spot market, supply
issues in India kept the spot market tight, and prices spiked.
Moderating Chinese steel production in June, in part from the central government’s
policy actions to control the overheated property market, was the primary contributor
to the decline from peak iron ore prices. Specifically, Chinese monthly steel
production declined to 53.8 million tonnes in June. Combined concerns over China
slowing, excess blast furnace capacity, sovereign debt risks in Europe, and seasonally
slower summer months for steel buying sent spot iron ore prices sliding from the
April peak.
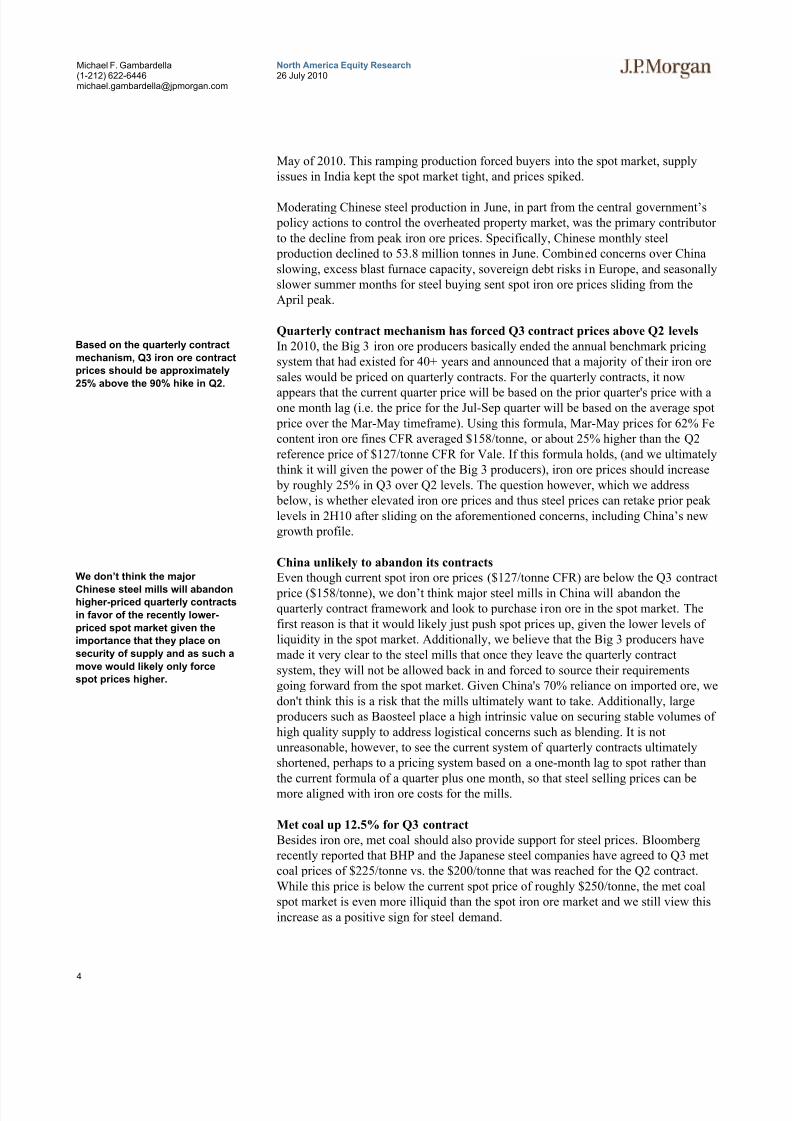
Quarterly contract mechanism has forced Q3 contract prices above Q2 levels
In 2010, the Big 3 iron ore producers basically ended the annual benchmark pricing
system that had existed for 40+ years and announced that a majority of their iron ore
sales would be priced on quarterly contracts. For the quarterly contracts, it now
appears that the current quarter price will be based on the prior quarter's price with aone month lag (i.e. the price for the Jul-Sep quarter will be based on the average spot
price over the Mar-May timeframe). Using this formula, Mar-May prices for 62% Fe
content iron ore fines CFR averaged $158/tonne, or about 25% higher than the Q2
reference price of $127/tonne CFR for Vale. If this formula holds, (and we ultimately
think it will given the power of the Big 3 producers), iron ore prices should increase
by roughly 25% in Q3 over Q2 levels. The question however, which we address
below, is whether elevated iron ore prices and thus steel prices can retake prior peak
levels in 2H10 after sliding on the aforementioned concerns, including China’s new
growth profile.
China unlikely to abandon its contracts
Even though current spot iron ore prices ($127/tonne CFR) are below the Q3 contract
price ($158/tonne), we don’t think major steel mills in China will abandon thequarterly contract framework and look to purchase iron ore in the spot market. The
first reason is that it would likely just push spot prices up, given the lower levels of
liquidity in the spot market. Additionally, we believe that the Big 3 producers have
made it very clear to the steel mills that once they leave the quarterly contract
system, they will not be allowed back in and forced to source their requirements
going forward from the spot market. Given China's 70% reliance on imported ore, we
don't think this is a risk that the mills ultimately want to take. Additionally, large
producers such as Baosteel place a high intrinsic value on securing stable volumes of
high quality supply to address logistical concerns such as blending. It is not
unreasonable, however, to see the current system of quarterly contracts ultimately
shortened, perhaps to a pricing system based on a one-month lag to spot rather than
the current formula of a quarter plus one month, so that steel selling prices can be
more aligned with iron ore costs for the mills.
Met coal up 12.5% for Q3 contract
Besides iron ore, met coal should also provide support for steel prices. Bloomberg
recently reported that BHP and the Japanese steel companies have agreed to Q3 met
coal prices of $225/tonne vs. the $200/tonne that was reached for the Q2 contract.
While this price is below the current spot price of roughly $250/tonne, the met coal
spot market is even more illiquid than the spot iron ore market and we still view this
increase as a positive sign for steel demand.
Based on the quarterly contract
mechanism, Q3 iron ore contract
prices should be approximately
25% above the 90% hike in Q2.
We don’t think the major
Chinese steel mills will abandonhigher-priced quarterly contracts
in favor of the recently lower-
priced spot market given the
importance that they place on
security of supply and as such a
move would likely only force
spot prices higher.

8/20/2019 JP Morgan - North America Metals & Mining
http://slidepdf.com/reader/full/jp-morgan-north-america-metals-mining 5/17
5
North America Equity Research26 July 2010
Michael F. Gambardella(1-212) [email protected]
Global production should not see a sharp drop-off
As shown in Figure 4 & Figure 6 below, both Chinese and global (ex China) steel
production have seen a steady increase since the lows of late 2008/early 2009 before peaking in May and declining 4% MoM in June. The risk for iron ore prices,
however, is that China materially slows its production rates (including the impact
from removing export tax rebates), the rebound in global production ex-China stalls,
or a combination of the two. While China will likely see a slowdown in the property
and fixed asset investment areas due to government tightening efforts, we don't think
production rates should see a sharp decline and that any slowing in China should be
at least partially cushioned by rebounding steel production rates in the rest of the
world, which are still climbing back from depressed levels. Additionally, from an
iron ore supply perspective, we don't think the Big 3 producers will oversupply the
market given the past discipline that they have demonstrated. As a result, we don’t
think spot iron ore prices have much further to fall.
Figure 4: China monthly steel product ion
10.0
20.0
30.0
40.0
50.0
60.0
M
a r - 0
5
J
u l - 0 5
N o
v - 0
5
M
a r - 0
6
J
u l - 0 6
N o
v - 0
6
M
a r - 0
7
J
u l - 0 7
N o
v - 0
7
M
a r - 0
8
J
u l - 0 8
N o
v - 0
8
M
a r - 0
9
J
u l - 0 9
N o
v - 0
9
M
a r - 1
0
T o n n e s
i n M i l l i o n s
Source: Bloomberg.
Figure 5: China annual steel production
(100)
-
100
200
300
400
500
600
700
1995 1996 1997 1998 1999 2000 2001 2002 2003 2004 2005 2006 2007 2008 2009 2010E
T o n n e
s i n m i l l i o n s
Steel Production Steel Net Exports Source: CEIC, J.P. Morgan. 2010 estimates represent January-June actual data plus 2H10 estimate
Chinese steel production hit a
record monthly level of 56mm
tonnes in May before declining
to 53.8mm in June.

8/20/2019 JP Morgan - North America Metals & Mining
http://slidepdf.com/reader/full/jp-morgan-north-america-metals-mining 6/17
6
North America Equity Research26 July 2010
Michael F. Gambardella(1-212) [email protected]
Figure 6: Global steel month ly produc tion, ex China
30.0
40.0
50.0
60.0
70.0
80.0
M a r - 0 5
J u l - 0 5
N o v - 0 5
M a r - 0 6
J u l - 0 6
N o v - 0 6
M a r - 0 7
J u l - 0 7
N o v - 0 7
M a r - 0 8
J u l - 0 8
N o v - 0 8
M a r - 0 9
J u l - 0 9
N o v - 0 9
M a r - 1 0
T o n n e s i n M i l l i o n s
Source: Bloomberg.
Announced idlings not a concern but a sign of supply discipline
Despite our view that steel production rates should remain firm, investors have been
concerned by weakening steel prices (U.S. HRC peaked at $703/ton and has recently
fallen to $583/ton). In the U.S., ArcelorMittal announced in late May that it would
idle two furnaces (Indiana Harbor East #5 and #6) which each have capacity of about
5,000 tons/day and replace them with lower cost capacity by restarting its Burns
Harbor D furnace (capacity of about 7,400 tons/day). Rebuild and construction work
at the #3 furnace at Indiana Harbor West, however, was stopped with contractors
being transferred to the D furnace at Burns Harbor. Separately, on June 2, the
company commented it could potentially shut three furnaces in Europe as Q3 is
typically characterized by lower demand due to summer shutdowns. No decision,
however, had been made on whether the furnaces would be idled or which plants
would be affected. While MT will see a net loss of production in the U.S. and could
see some in Europe, we view these actions more as a response to seasonality and to
optimize production and not as a sign that demand will take a significant step down.
Additionally, Severstal announced plans to idle the high-cost, geographically
disadvantaged Sparrow’s Point plant in the U.S. while U.S. Steel will cut back
production in Europe in response to declining demand. However, not all production
adjustments have been negative as Saltzgitter recently brought Flachstahl C online to
meet improving demand in Germany.
Elevated iron ore = elevated scrap = elevated steel prices
Given our view that iron ore prices should not fall much further and remain elevated,
steel prices should also start to move up to cover rising raw material costs. As shown
in Figure 7 below, most steel producers in the world do not have their own iron ore
supplies, and we estimate that only roughly 165 million tonnes of iron ore is owned
and captively used (i.e. excluding iron ore that is sold externally by steel companies
or acquired through strategic contracts) by steel companies globally, or just 15% of
the iron ore that steel companies require. Given this relatively low percentage, we
don't think these producers could cause steel prices to drop lower if they chose (and
we don't think they will) to pursue volumes (market share) at the expense of pricing.
Global production ex China
remains in the mid 60mm range
in June, despite China’s recentproduction moderation, versus a
high 50mm/low 60mm tonne
range in late 2009 and early
2010.

8/20/2019 JP Morgan - North America Metals & Mining
http://slidepdf.com/reader/full/jp-morgan-north-america-metals-mining 7/17
7
North America Equity Research26 July 2010
Michael F. Gambardella(1-212) [email protected]
Figure 7: Captive iron ore prod uction fr om global steel companies is rare
0.0
10.0
20.0
30.0
40.0
50.0
A r c e l o r M i t t a l
U . S . S t e e l
S A I L
E v r a z
S e v e r s t a l
N L M K
T a t a
C S N
U s i m i n a s
A h m s a
T e r n i u m
G e r d a u S A I r
o n O r e U s a g e ( M M T o n n e s )
Source: J.P. Morgan estimates.
We would also note, as shown in Figure 8 below, that the producers with the highest
levels of raw material self-sufficiency should fare the best from an earnings
perspective in an environment of escalating raw material prices. U.S. Steel remains
our top pick in the U.S. given its iron ore self-sufficiency and favorable met coal
contracts in its North American Flat-rolled operations. We would also point out that
these producers, besides the U.S., are largely in Brazil, Russia and India and don't
export significant quantities of steel to the U.S., thus further reducing the risk of
imports from low cost regions.
Figure 8: Global steel producers with the greatest levels of ir on ore self-sufficiency
0%
20%
40%
60%
80%
100%
C S N
N L M K
S A I L
T a
t a
A h m s a
E v r a z
U . S .
S t e e
l
U s
i m i n a s
T e r n
i u m
S e v e r s
t a l
G e r d a u
S A
A r c e
l o r M
i t t a l
I r o n
O r e
S e
l f - S u
f f i c i e n c
Source: Company reports and J.P. Morgan estimates.
Rising Chinese costs should set a floor for global pricing...
If average global iron ore and met coal prices for 2010 end up equaling the current
spot prices, we would expect to see (as shown in Figure 9 below) a significant
increase in the cash costs for China and the other raw material-short foreign
producers as they are, to varying degrees, largely reliant on the global market for iron
ore and met coal. China in particular remains heavily exposed to imported iron ore
given the low grade of domestic supplies; see Figure 10 for more details. Since 2000,
Chinese steelmaker dependence on imported iron ore has surged to nearly 70% from
38%.
8/20/2019 JP Morgan - North America Metals & Mining
http://slidepdf.com/reader/full/jp-morgan-north-america-metals-mining 8/17
8
North America Equity Research26 July 2010
Michael F. Gambardella(1-212) [email protected]
This would stand in contrast to 2009 when the global cost curve was much flatter due
to steep declines in global raw material costs or in 2002 when China was a low cost
producer before rising material costs negated its labor advantage (see Figure 11 &Figure 12).
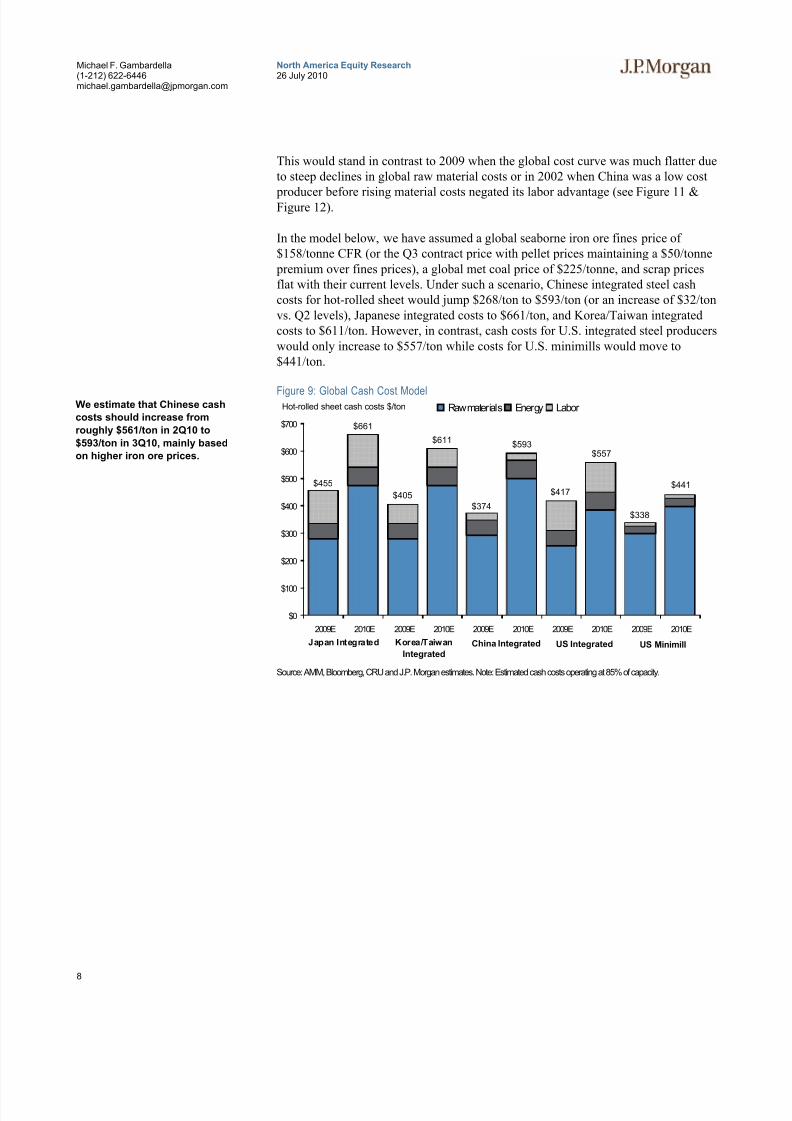
In the model below, we have assumed a global seaborne iron ore fines price of
$158/tonne CFR (or the Q3 contract price with pellet prices maintaining a $50/tonne
premium over fines prices), a global met coal price of $225/tonne, and scrap prices
flat with their current levels. Under such a scenario, Chinese integrated steel cash
costs for hot-rolled sheet would jump $268/ton to $593/ton (or an increase of $32/ton
vs. Q2 levels), Japanese integrated costs to $661/ton, and Korea/Taiwan integrated
costs to $611/ton. However, in contrast, cash costs for U.S. integrated steel producers
would only increase to $557/ton while costs for U.S. minimills would move to
$441/ton.
Figure 9: Global Cash Cost Model
$0
$100
$200
$300
$400
$500
$600
$700
2009E 2010E 2009E 2010E 2009E 2010E 2009E 2010E 2009E 2010E
Raw materials Energy Labor
Japan Integrated Korea/Taiwan
IntegratedChina Integrated US Integrated US Minimill
$455
$661
$405
$611
$374
$593
$417
$557
$338
$441
Hot-rolled sheet cash costs $/ton
Source: AMM, Bloomberg, CRU and J.P. Morgan estimates. Note: Estimated cash costs operating at 85% of capacity.
We estimate that Chinese cash
costs should increase from
roughly $561/ton in 2Q10 to
$593/ton in 3Q10, mainly based
on higher iron ore prices.

8/20/2019 JP Morgan - North America Metals & Mining
http://slidepdf.com/reader/full/jp-morgan-north-america-metals-mining 9/17
9
North America Equity Research26 July 2010
Michael F. Gambardella(1-212) [email protected]
Figure 10: Chinese steelmakers are dependent on i ron or e imports
-
100
200
300
400
500
600
700
800
900
1,000
1995 1996 1997 1998 1999 2000 2001 2002 2003 2004 2005 2006 2007 2008 2009 2010E
T o n n e s i n m i l l i o n s
I ron O re Impor ts I ron O re Produc tion Source: CEIC. 2010 estimates represent January-May annualized numbers. Calculated production is equal to total iron ore
consumption required for total integrated steel production rates less iron ore imports.
Figure 11: China is no longer a low cost producer of steel
$0
$100
$200
$300
$400
$500
$600
$700
2002 2010E 2002 2010E
Raw materials Energy Labor
China
Integrated
US
Integrated
$178
$593
$269
$557
Hot-rolled sheet cash costs $/ton
Source: AMM, Bloomberg, CRU and J.P. Morgan estimates. Estimated cash costs operating at 85% of capacity.
Raw material inputs now
account for 84% of China’s steel
costs—labor costs are no longer
the key to being a low cost
steelmaker in the world.

8/20/2019 JP Morgan - North America Metals & Mining
http://slidepdf.com/reader/full/jp-morgan-north-america-metals-mining 10/17
10
North America Equity Research26 July 2010
Michael F. Gambardella(1-212) [email protected]
Figure 12: Global iron ore contract prices have increased 750% since 2000
0
20
40
60
80
100
120
140
2000 2001 2002 2003 2004 2005 2006 2007 2008 2009 2Q10 3Q10
G l o b a l S e a b o r e I r o n O r e C o n t r a c t P r i c e ( $ / t o n n e )
Source: Vale SSF contract prices, FOB
. . . and would likely push global steel prices higher
We also note that current Chinese steel prices of $610/tonne (or $554/ton) are below
our estimated cash costs for Chinese producers in 2010 of $653/tonne (or $593/ton).
As a result, we would expect Chinese steel prices to start to slowly move up at least
toward their cash costs and/or see supply cuts force prices higher. Such increases
would also enable domestic producers to raise their prices given the tight supply
constraints here in the U.S. Chinese prices for HRC and rebar have begun to trend
upwards recently, up 6% and 5% respectively in the last week. See Figure 13 for
further details below.
Figure 13: China domestic HRC & rebar spot prices are rebounding
$400
$450
$500
$550
$600
$650
Jul-09 Aug-09 Sep-09 Oct-09 Nov-09 Dec-09 Jan-10 Feb-10Mar-10 Apr-10 May-10 Jun-10 Jul-10
U S $ / s h o r t t o n
China HRC China Rebar
Source: Bloomberg
8/20/2019 JP Morgan - North America Metals & Mining
http://slidepdf.com/reader/full/jp-morgan-north-america-metals-mining 11/17
11
North America Equity Research26 July 2010
Michael F. Gambardella(1-212) [email protected]
Longer term we expect China to consolidate its steel industry and rationalize capacity
as a means to limit adverse environmental impacts as well as increase its focus on
higher value exports. The country recently took modest steps toward this goalthrough a small amount of blast furnace rationalization in Hebei, removal of export
tax rebates on commodity steel products, and steel producer consolidation.
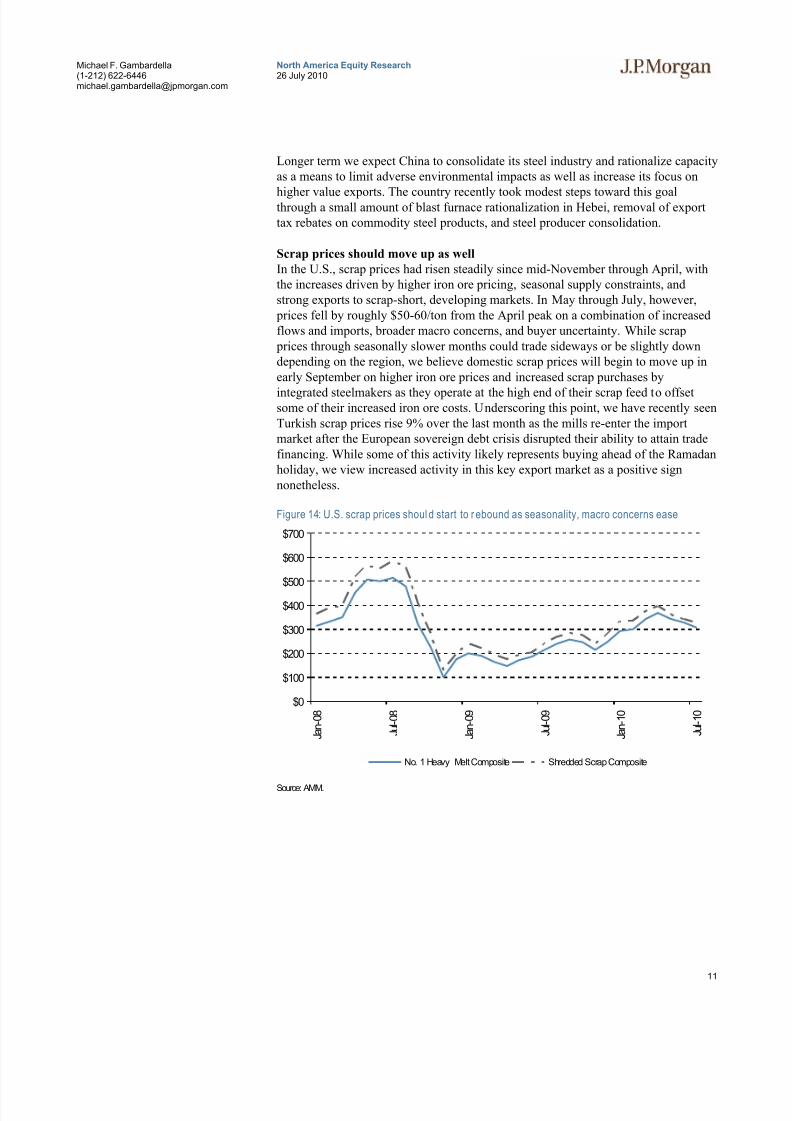
Scrap prices should move up as well
In the U.S., scrap prices had risen steadily since mid-November through April, with
the increases driven by higher iron ore pricing, seasonal supply constraints, and
strong exports to scrap-short, developing markets. In May through July, however,
prices fell by roughly $50-60/ton from the April peak on a combination of increased
flows and imports, broader macro concerns, and buyer uncertainty. While scrap
prices through seasonally slower months could trade sideways or be slightly down
depending on the region, we believe domestic scrap prices will begin to move up in
early September on higher iron ore prices and increased scrap purchases by
integrated steelmakers as they operate at the high end of their scrap feed to offsetsome of their increased iron ore costs. Underscoring this point, we have recently seen
Turkish scrap prices rise 9% over the last month as the mills re-enter the import
market after the European sovereign debt crisis disrupted their ability to attain trade
financing. While some of this activity likely represents buying ahead of the Ramadan
holiday, we view increased activity in this key export market as a positive sign
nonetheless.
Figure 14: U.S. scrap prices shoul d start to r ebound as seasonality, macro concerns ease
$0
$100
$200
$300
$400
$500
$600
$700
J a n - 0 8
J u l - 0 8
J a n - 0 9
J u l - 0 9
J a n - 1 0
J u l - 1 0
No. 1 Heavy Melt Composite Shredded Scrap Composite
Source: AMM.

8/20/2019 JP Morgan - North America Metals & Mining
http://slidepdf.com/reader/full/jp-morgan-north-america-metals-mining 12/17
12
North America Equity Research26 July 2010
Michael F. Gambardella(1-212) [email protected]
Figure 15: Turkey heavy melt mix scrap index moving up i n July
$150
$200
$250
$300
$350
$400
$450
$500
6 / 2 / 2 0 0 9
6 / 2 6 / 2 0 0 9
7 / 2 0 / 2 0 0 9
8 / 1 3 / 2 0 0 9
9 / 6 / 2 0 0 9
9 / 3 0 / 2 0 0 9
1 0 / 2 4 / 2 0 0 9
1 1 / 1 7 / 2 0 0 9
1 2 / 1 1 / 2 0 0 9
1 / 4 / 2 0 1 0
1 / 2 8 / 2 0 1 0
2 / 2 1 / 2 0 1 0
3 / 1 7 / 2 0 1 0
4 / 1 0 / 2 0 1 0
5 / 4 / 2 0 1 0
5 / 2 8 / 2 0 1 0
6 / 2 1 / 2 0 1 0
7 / 1 5 / 2 0 1 0
Turkey scrap import prices (CFR)
$/tonne
Source: Bloomberg, Steel Business Briefing

8/20/2019 JP Morgan - North America Metals & Mining
http://slidepdf.com/reader/full/jp-morgan-north-america-metals-mining 13/17
13
North America Equity Research26 July 2010
Michael F. Gambardella(1-212) [email protected]
Companies Recommended in This Report (all prices in this report as of market close on 23 July 2010)
Arcelor Mittal (MT/$32.95/Overweight), Cliffs Natural Resources (CLF/$55.90/Overweight), U.S. Steel Corp
(X/$48.90/Overweight)Analyst Certification:
The research analyst(s) denoted by an “AC” on the cover of this report certifies (or, where multiple research analysts are primarilyresponsible for this report, the research analyst denoted by an “AC” on the cover or within the document individually certifies, withrespect to each security or issuer that the research analyst covers in this research) that: (1) all of the views expressed in this reportaccurately reflect his or her personal views about any and all of the subject securities or issuers; and (2) no part of any of the researchanalyst’s compensation was, is, or will be directly or indirectly related to the specific recommendations or views expressed by theresearch analyst(s) in this report.
Important Disclosures
• Market Maker/ Liquidity Provider: JPMSL and/or an affiliate is a market maker and/or liquidity provider in Arcelor Mittal.
• Lead or Co-manager: JPMSI or its affiliates acted as lead or co-manager in a public offering of equity and/or debt securities forArcelor Mittal, Cliffs Natural Resources, U.S. Steel Corp within the past 12 months.
• Beneficial Ownership (1% or more): JPMSI or its affiliates beneficially own 1% or more of a class of common equity securities of
U.S. Steel Corp.• Client of the Firm: Arcelor Mittal is or was in the past 12 months a client of JPMSI; during the past 12 months, JPMSI provided to
the company investment banking services, non-investment banking securities-related services and non-securities-related services.Cliffs Natural Resources is or was in the past 12 months a client of JPMSI; during the past 12 months, JPMSI provided to thecompany investment banking services, non-investment banking securities-related services and non-securities-related services. U.S.Steel Corp is or was in the past 12 months a client of JPMSI; during the past 12 months, JPMSI provided to the company investment
banking services.
• Investment Banking (past 12 months): JPMSI or its affiliates received in the past 12 months compensation for investment bankingservices from Arcelor Mittal, Cliffs Natural Resources, U.S. Steel Corp.
• Investment Banking (next 3 months): JPMSI or its affiliates expect to receive, or intend to seek, compensation for investment banking services in the next three months from Arcelor Mittal, Cliffs Natural Resources, U.S. Steel Corp.
• Non-Investment Banking Compensation: JPMSI has received compensation in the past 12 months for products or services otherthan investment banking from Arcelor Mittal, Cliffs Natural Resources. An affiliate of JPMSI has received compensation in the past12 months for products or services other than investment banking from Arcelor Mittal, Cliffs Natural Resources.
0
32
64
96
128
160
Price($)
Oct
06
Jul
07
Apr
08
Jan
09
Oct
09
Jul
10
Arcelor Mittal (MT) Price Chart
N $28 OW $45
OW $40 OW $37
OW $46 N $27 OW $55 OW $57
Source: Bloomberg and J.P. Morgan; price data adjusted for stock splits and dividends.
This chart shows J.P. Morgan's continuing coverage of this stock; the current analyst may or may not have covered it
over the entire period.
J.P. Morgan ratings: OW = Overweight, N = Neutral, UW = Underweight.
Date Rating Share Price($)
Price Target($)
23-Oct-08 OW 24.18 46.00
06-Nov-08 OW 24.88 40.00
19-Dec-08 N 25.04 28.00
12-Mar-09 N 20.27 27.00
13-May-09 OW 24.41 37.00
25-Jun-09 OW 33.31 45.00
08-Jan-10 OW 48.05 55.00
27-Apr-10 OW 42.91 57.00

8/20/2019 JP Morgan - North America Metals & Mining
http://slidepdf.com/reader/full/jp-morgan-north-america-metals-mining 14/17
14
North America Equity Research26 July 2010
Michael F. Gambardella(1-212) [email protected]
0
37
74
111
148
185
Price($)
Oct06
Jul07
Apr 08
Jan09
Oct09
Jul10
Cliffs Natural Resources (CLF) Price Chart
OW $26.5 OW $38 OW $60 OW $81
OW $41.5 OW $33.5 OW $53 OW $90
OW OW $54 OW $30OW $26OW $44 OW $83
Source: Bloomberg and J.P. Morgan; price data adjusted for stock splits and dividends.
Initiated coverage Dec 04, 2007. This chart shows J.P. Morgan's continuing coverage of this stock; the current analyst
may or may not have covered it over the entire period.
J.P. Morgan ratings: OW = Overweight, N = Neutral, UW = Underweight.
Date Rating Share Price
($)
Price Target
($)
04-Dec-07 OW 45.08 -
19-Nov-08 OW 18.63 54.00
11-Dec-08 OW 27.29 41.50
26-Feb-09 OW 16.14 26.50
03-Apr-09 OW 20.47 30.00
15-Jul-09 OW 23.20 26.00
03-Aug-09 OW 27.39 33.50
01-Oct-09 OW 32.36 38.00
30-Oct-09 OW 34.87 44.00
10-Dec-09 OW 43.14 53.00
18-Feb-10 OW 47.40 60.00
12-Mar-10 OW 60.31 83.00
29-Apr-10 OW 64.33 90.00
14-Jul-10 OW 48.90 81.00
0
58
116
174
232
290
Price($)
Oct06
Jul07
Apr 08
Jan09
Oct09
Jul10
U.S. Steel Corp (X) Price Chart
OW OW $49 OW $86
OW $134 OW $56 OW $70
OW $115 OW $80 OW $42.5 OW $55 OW $75
Source: Bloomberg and J.P. Morgan; price data adjusted for stock splits and dividends.
This chart shows J.P. Morgan's continuing coverage of this stock; the current analyst may or may not have covered it
over the entire period.
J.P. Morgan ratings: OW = Overweight, N = Neutral, UW = Underweight.
Date Rating Share Price($)
Price Target($)
25-Apr-07 OW 103.04 115.00
06-Jun-07 OW 118.66 134.00
03-Aug-07 OW 91.53 --
28-Oct-08 OW 35.20 80.00
19-Dec-08 OW 37.34 56.00
28-Jan-09 OW 34.80 49.00
12-Mar-09 OW 19.10 42.5028-Jul-09 OW 41.27 55.00
08-Jan-10 OW 60.91 75.00
26-Jan-10 OW 49.61 70.00
28-Apr-10 OW 58.44 86.00
Explanation of Equity Research Ratings and Analyst(s) Coverage Universe:
J.P. Morgan uses the following rating system: Overweight [Over the next six to twelve months, we expect this stock will outperform theaverage total return of the stocks in the analyst’s (or the analyst’s team’s) coverage universe.] Neutral [Over the next six to twelvemonths, we expect this stock will perform in line with the average total return of the stocks in the analyst’s (or the analyst’s team’s)coverage universe.] Underweight [Over the next six to twelve months, we expect this stock will underperform the average total return ofthe stocks in the analyst’s (or the analyst’s team’s) coverage universe.] J.P. Morgan Cazenove’s UK Small/Mid-Cap dedicated researchanalysts use the same rating categories; however, each stock’s expected total return is compared to the expected total return of the FTSEAll Share Index, not to those analysts’ coverage universe. A list of these analysts is available on request. The analyst or analyst’s team’scoverage universe is the sector and/or country shown on the cover of each publication. See below for the specific stocks in the certifyinganalyst(s) coverage universe.
Coverage Universe: Michael F. Gambardella: AK Steel (AKS), Alcoa (AA), Allegheny Technologies (ATI), ArcelorMittal (MT), Carpenter Technology (CRS), Century Aluminum Company (CENX), Cliffs Natural Resources (CLF),
8/20/2019 JP Morgan - North America Metals & Mining
http://slidepdf.com/reader/full/jp-morgan-north-america-metals-mining 15/17
15
North America Equity Research26 July 2010
Michael F. Gambardella(1-212) [email protected]
Commercial Metals (CMC), Dynamic Materials (BOOM), Freeport-McMoRan Copper & Gold (FCX), Gerdau Ameristeel(GNA), Globe Specialty Metals (GSM), GrafTech International (GTI), Haynes International (HAYN), Metals USA
(MUSA), Nucor Corp. (NUE), Reliance Steel & Aluminum (RS), Steel Dynamics, Inc. (STLD), Teck Resources(TCKb.TO), Thompson Creek Metals (TC), U.S. Steel Corp (X), Worthington Industries (WOR)
J.P. Morgan Equity Research Ratings Distribution, as of June 30, 2010
Overweight(buy)
Neutral(hold)
Underweight(sell)
JPM Global Equity Research Coverage 46% 42% 12%
IB clients* 49% 46% 31%
JPMSI Equity Research Coverage 44% 48% 9%IB clients* 68% 61% 53%
*Percentage of investment banking clients in each rating category.For purposes only of NASD/NYSE ratings distribution rules, our Overweight rating falls into a buy rating category; our Neutral rating falls into a holdrating category; and our Underweight rating falls into a sell rating category.
Valuation and Risks: Please see the most recent company-specific research report for an analysis of valuation methodology and risks onany securities recommended herein. Research is available at http://www.morganmarkets.com , or you can contact the analyst named onthe front of this note or your J.P. Morgan representative.
Analysts’ Compensation: The equity research analysts responsible for the preparation of this report receive compensation based uponvarious factors, including the quality and accuracy of research, client feedback, competitive factors, and overall firm revenues, whichinclude revenues from, among other business units, Institutional Equities and Investment Banking.
Other Disclosures
J.P. Morgan is the global brand name for J.P. Morgan Securities Inc. (JPMSI) and its non-US affiliates worldwide. J.P. Morgan Cazenove is a brand name for equity research produced by J.P. Morgan Securities Ltd.; J.P. Morgan Equities Limited; JPMorgan Chase Bank, N.A., DubaiBranch; and J.P. Morgan Bank International LLC.
Options related research: If the information contained herein regards options related research, such information is available only to persons whohave received the proper option risk disclosure documents. For a copy of the Option Clearing Corporation’s Characteristics and Risks ofStandardized Options, please contact your J.P. Morgan Representative or visit the OCC’s website athttp://www.optionsclearing.com/publications/risks/riskstoc.pdf.
Legal Entities DisclosuresU.S.: JPMSI is a member of NYSE, FINRA and SIPC. J.P. Morgan Futures Inc. is a member of the NFA. JPMorgan Chase Bank, N.A. is amember of FDIC and is authorized and regulated in the UK by the Financial Services Authority. U.K.: J.P. Morgan Securities Ltd. (JPMSL) is amember of the London Stock Exchange and is authorised and regulated by the Financial Services Authority. Registered in England & Wales No.2711006. Registered Office 125 London Wall, London EC2Y 5AJ. South Africa: J.P. Morgan Equities Limited is a member of the JohannesburgSecurities Exchange and is regulated by the FSB. Hong Kong: J.P. Morgan Securities (Asia Pacific) Limited (CE number AAJ321) is regulated
by the Hong Kong Monetary Authority and the Securities and Futures Commission in Hong Kong. Korea: J.P. Morgan Securities (Far East) Ltd,Seoul Branch, is regulated by the Korea Financial Supervisory Service. Australia: J.P. Morgan Australia Limited (ABN 52 002 888 011/AFSLicence No: 238188) is regulated by ASIC and J.P. Morgan Securities Australia Limited (ABN 61 003 245 234/AFS Licence No: 238066) is aMarket Participant with the ASX and regulated by ASIC. Taiwan: J.P.Morgan Securities (Taiwan) Limited is a participant of the Taiwan StockExchange (company-type) and regulated by the Taiwan Securities and Futures Bureau. India: J.P. Morgan India Private Limited is a member of
the National Stock Exchange of India Limited and Bombay Stock Exchange Limited and is regulated by the Securities and Exchange Board ofIndia. Thailand: JPMorgan Securities (Thailand) Limited is a member of the Stock Exchange of Thailand and is regulated by the Ministry ofFinance and the Securities and Exchange Commission. Indonesia: PT J.P. Morgan Securities Indonesia is a member of the Indonesia StockExchange and is regulated by the BAPEPAM LK. Philippines: J.P. Morgan Securities Philippines Inc. is a member of the Philippine StockExchange and is regulated by the Securities and Exchange Commission. Brazil: Banco J.P. Morgan S.A. is regulated by the Comissao de ValoresMobiliarios (CVM) and by the Central Bank of Brazil. Mexico: J.P. Morgan Casa de Bolsa, S.A. de C.V., J.P. Morgan Grupo Financiero is amember of the Mexican Stock Exchange and authorized to act as a broker dealer by the National Banking and Securities Exchange Commission.Singapore: This material is issued and distributed in Singapore by J.P. Morgan Securities Singapore Private Limited (JPMSS) [MICA (P)020/01/2010 and Co. Reg. No.: 199405335R] which is a member of the Singapore Exchange Securities Trading Limited and is regulated by theMonetary Authority of Singapore (MAS) and/or JPMorgan Chase Bank, N.A., Singapore branch (JPMCB Singapore) which is regulated by theMAS. Malaysia: This material is issued and distributed in Malaysia by JPMorgan Securities (Malaysia) Sdn Bhd (18146-X) which is aParticipating Organization of Bursa Malaysia Berhad and a holder of Capital Markets Services License issued by the Securities Commission inMalaysia. Pakistan: J. P. Morgan Pakistan Broking (Pvt.) Ltd is a member of the Karachi Stock Exchange and regulated by the Securities andExchange Commission of Pakistan. Saudi Arabia: J.P. Morgan Saudi Arabia Ltd. is authorised by the Capital Market Authority of the Kingdom
8/20/2019 JP Morgan - North America Metals & Mining
http://slidepdf.com/reader/full/jp-morgan-north-america-metals-mining 16/17
16
North America Equity Research26 July 2010
Michael F. Gambardella(1-212) [email protected]
of Saudi Arabia (CMA) to carry out dealing as an agent, arranging, advising and custody, with respect to securities business under licence number35-07079 and its registered address is at 8th Floor, Al-Faisaliyah Tower, King Fahad Road, P.O. Box 51907, Riyadh 11553, Kingdom of SaudiArabia. Dubai: JPMorgan Chase Bank, N.A., Dubai Branch is regulated by the Dubai Financial Services Authority (DFSA) and its registered
address is Dubai International Financial Centre - Building 3, Level 7, PO Box 506551, Dubai, UAE.
Country and Region Specific DisclosuresU.K. and European Economic Area (EEA): Unless specified to the contrary, issued and approved for distribution in the U.K. and the EEA byJPMSL. Investment research issued by JPMSL has been prepared in accordance with JPMSL's policies for managing conflicts of interest arisingas a result of publication and distribution of investment research. Many European regulators require that a firm to establish, implement andmaintain such a policy. This report has been issued in the U.K. only to persons of a kind described in Article 19 (5), 38, 47 and 49 of the FinancialServices and Markets Act 2000 (Financial Promotion) Order 2005 (all such persons being referred to as "relevant persons"). This document mustnot be acted on or relied on by persons who are not relevant persons. Any investment or investment activity to which this document relates is onlyavailable to relevant persons and will be engaged in only with relevant persons. In other EEA countries, the report has been issued to personsregarded as professional investors (or equivalent) in their home jurisdiction. Australia: This material is issued and distributed by JPMSAL inAustralia to “wholesale clients” only. JPMSAL does not issue or distribute this material to “retail clients.” The recipient of this material must notdistribute it to any third party or outside Australia without the prior written consent of JPMSAL. For the purposes of this paragraph the terms“wholesale client” and “retail client” have the meanings given to them in section 761G of the Corporations Act 2001. Germany: This material isdistributed in Germany by J.P. Morgan Securities Ltd., Frankfurt Branch and J.P.Morgan Chase Bank, N.A., Frankfurt Branch which areregulated by the Bundesanstalt für Finanzdienstleistungsaufsicht. Hong Kong: The 1% ownership disclosure as of the previous month end
satisfies the requirements under Paragraph 16.5(a) of the Hong Kong Code of Conduct for Persons Licensed by or Registered with the Securitiesand Futures Commission. (For research published within the first ten days of the month, the disclosure may be based on the month end data fromtwo months’ prior.) J.P. Morgan Broking (Hong Kong) Limited is the liquidity provider for derivative warrants issued by J.P. Morgan StructuredProducts B.V. and listed on the Stock Exchange of Hong Kong Limited. An updated list can be found on HKEx website:http://www.hkex.com.hk/prod/dw/Lp.htm. Japan: There is a risk that a loss may occur due to a change in the price of the shares in the case ofshare trading, and that a loss may occur due to the exchange rate in the case of foreign share trading. In the case of share trading, JPMorganSecurities Japan Co., Ltd., will be receiving a brokerage fee and consumption tax (shouhizei) calculated by multiplying the executed price by thecommission rate which was individually agreed between JPMorgan Securities Japan Co., Ltd., and the customer in advance. Financial InstrumentsFirms: JPMorgan Securities Japan Co., Ltd., Kanto Local Finance Bureau (kinsho) No. 82 Participating Association / Japan Securities DealersAssociation, The Financial Futures Association of Japan. Korea: This report may have been edited or contributed to from time to time byaffiliates of J.P. Morgan Securities (Far East) Ltd, Seoul Branch. Singapore: JPMSS and/or its affiliates may have a holding in any of thesecurities discussed in this report; for securities where the holding is 1% or greater, the specific holding is disclosed in the Important Disclosuressection above. India: For private circulation only, not for sale. Pakistan: For private circulation only, not for sale. New Zealand: Thismaterial is issued and distributed by JPMSAL in New Zealand only to persons whose principal business is the investment of money or who, in thecourse of and for the purposes of their business, habitually invest money. JPMSAL does not issue or distribute this material to members of "the
public" as determined in accordance with section 3 of the Securities Act 1978. The recipient of this material must not distribute it to any third
party or outside New Zealand without the prior written consent of JPMSAL. Canada: The information contained herein is not, and under nocircumstances is to be construed as, a prospectus, an advertisement, a public offering, an offer to sell securities described herein, or solicitation ofan offer to buy securities described herein, in Canada or any province or territory thereof. Any offer or sale of the securities described herein inCanada will be made only under an exemption from the requirements to file a prospectus with the relevant Canadian securities regulators and only
by a dealer properly registered under applicable securities laws or, alternatively, pursuant to an exemption from the dealer registration requirementin the relevant province or territory of Canada in which such offer or sale is made. The information contained herein is under no circumstances to
be construed as investment advice in any province or territory of Canada and is not tailored to the needs of the recipient. To the extent that theinformation contained herein references securities of an issuer incorporated, formed or created under the laws of Canada or a province or territoryof Canada, any trades in such securities must be conducted through a dealer registered in Canada. No securities commission or similar regulatoryauthority in Canada has reviewed or in any way passed judgment upon these materials, the information contained herein or the merits of thesecurities described herein, and any representation to the contrary is an offence. Dubai: This report has been issued to persons regarded as
professional clients as defined under the DFSA rules.
General: Additional information is available upon request. Information has been obtained from sources believed to be reliable but JPMorganChase & Co. or its affiliates and/or subsidiaries (collectively J.P. Morgan) do not warrant its completeness or accuracy except with respect to anydisclosures relative to JPMSI and/or its affiliates and the analyst’s involvement with the issuer that is the subject of the research. All pricing is as
of the close of market for the securities discussed, unless otherwise stated. Opinions and estimates constitute our judgment as of the date of thismaterial and are subject to change without notice. Past performance is not indicative of future results. This material is not intended as an offer orsolicitation for the purchase or sale of any financial instrument. The opinions and recommendations herein do not take into account individualclient circumstances, objectives, or needs and are not intended as recommendations of particular securities, financial instruments or strategies to
particular clients. The recipient of this report must make its own independent decisions regarding any securities or financial instrumentsmentioned herein. JPMSI distributes in the U.S. research published by non-U.S. affiliates and accepts responsibility for its contents. Periodicupdates may be provided on companies/industries based on company specific developments or announcements, market conditions or any other
publicly available information. Clients should contact analysts and execute transactions through a J.P. Morgan subsidiary or affiliate in their home jurisdiction unless governing law permits otherwise.
“Other Disclosures” last revised March 1, 2010.
Copyright 2010 JPMorgan Chase & Co. All rights reserved. This report or any portion hereof may not be reprinted, sold or
redistributed without the written consent of J.P. Morgan.

8/20/2019 JP Morgan - North America Metals & Mining
http://slidepdf.com/reader/full/jp-morgan-north-america-metals-mining 17/17
North America Equity Research26 July 2010
Michael F. Gambardella(1-212) [email protected]