j.p. morgan energy conference 1q 2016 announced successful enhanced oil recovery project in eagle...
TRANSCRIPT

NYSE Stock Symbol: EOGCommon Dividend: $0.67Basic Shares Outstanding: 550 Million
Internet Address:http://www.eogresources.com
Investor Relations ContactsCedric W. Burgher, SVP Investor and Public Relations
(713) 571-4658, [email protected] J. Streit, Director IR
(713) 571-4902, [email protected] M. Ehmer, Manager IR
(713) 571-4676, [email protected]
J.P. Morgan Energy Conference

Copyright; Assumption of Risk: Copyright 2016. This presentation and the contents of this presentation have been copyrighted by EOG Resources, Inc. (EOG). All rights reserved. Copying of the presentation is forbidden without the prior written consent of EOG. Information in this presentation is provided “as is” without warranty of any kind, either express or implied, including but not limited to the implied warranties of merchantability, fitness for a particular purpose and the timeliness of the information. You assume all risk in using the information. In no event shall EOG or its representatives be liable for any special, indirect or consequential damages resulting from the use of the information.
Cautionary Notice Regarding Forward-Looking Statements: This presentation includes forward-looking statements within the meaning of Section 27A of the Securities Act of 1933, as amended, and Section 21E of the Securities Exchange Act of 1934, as amended. All statements, other than statements of historical facts, including, among others, statements and projections regarding EOG's future financial position, operations, performance, business strategy, returns, budgets, reserves, levels of production and costs, statements regarding future commodity prices and statements regarding the plans and objectives of EOG's management for future operations, are forward-looking statements. EOG typically uses words such as "expect," "anticipate," "estimate," "project," "strategy," "intend," "plan," "target," "goal," "may," "will," "should" and "believe" or the negative of those terms or other variations or comparable terminology to identify its forward-looking statements. In particular, statements, express or implied, concerning EOG's future operating results and returns or EOG's ability to replace or increase reserves, increase production, reduce or otherwise control operating and capital costs, generate income or cash flows or pay dividends are forward-looking statements. Forward-looking statements are not guarantees of performance. Although EOG believes the expectations reflected in its forward-looking statements are reasonable and are based on reasonable assumptions, no assurance can be given that these assumptions are accurate or that any of these expectations will be achieved (in full or at all) or will prove to have been correct. Moreover, EOG's forward-looking statements may be affected by known, unknown or currently unforeseen risks, events or circumstances that may be outside EOG's control. Important factors that could cause EOG's actual results to differ materially from the expectations reflected in EOG's forward-looking statements include, among others:
• the timing, extent and duration of changes in prices for, supplies of, and demand for, crude oil and condensate, natural gas liquids, natural gas and related commodities; • the extent to which EOG is successful in its efforts to acquire or discover additional reserves; • the extent to which EOG is successful in its efforts to economically develop its acreage in, produce reserves and achieve anticipated production levels from, and maximize reserve recovery from, its existing and future
crude oil and natural gas exploration and development projects; • the extent to which EOG is successful in its efforts to market its crude oil and condensate, natural gas liquids, natural gas and related commodity production;• the availability, proximity and capacity of, and costs associated with, appropriate gathering, processing, compression, transportation and refining facilities; • the availability, cost, terms and timing of issuance or execution of, and competition for, mineral licenses and leases and governmental and other permits and rights-of-way, and EOG’s ability to retain mineral licenses
and leases;• the impact of, and changes in, government policies, laws and regulations, including tax laws and regulations; environmental, health and safety laws and regulations relating to air emissions, disposal of produced
water, drilling fluids and other wastes, hydraulic fracturing and access to and use of water; laws and regulations imposing conditions or restrictions on drilling and completion operations and on the transportation of crude oil and natural gas; laws and regulations with respect to derivatives and hedging activities; and laws and regulations with respect to the import and export of crude oil, natural gas and related commodities;
• EOG's ability to effectively integrate acquired crude oil and natural gas properties into its operations, fully identify existing and potential problems with respect to such properties and accurately estimate reserves, production and costs with respect to such properties;
• the extent to which EOG's third-party-operated crude oil and natural gas properties are operated successfully and economically;• competition in the oil and gas exploration and production industry for the acquisition of licenses, leases and properties, employees and other personnel, facilities, equipment, materials and services; • the availability and cost of employees and other personnel, facilities, equipment, materials (such as water) and services;• the accuracy of reserve estimates, which by their nature involve the exercise of professional judgment and may therefore be imprecise;• weather, including its impact on crude oil and natural gas demand, and weather-related delays in drilling and in the installation and operation (by EOG or third parties) of production, gathering, processing, refining,
compression and transportation facilities;• the ability of EOG's customers and other contractual counterparties to satisfy their obligations to EOG and, related thereto, to access the credit and capital markets to obtain financing needed to satisfy their
obligations to EOG;• EOG's ability to access the commercial paper market and other credit and capital markets to obtain financing on terms it deems acceptable, if at all, and to otherwise satisfy its capital expenditure requirements;• the extent and effect of any hedging activities engaged in by EOG;• the timing and extent of changes in foreign currency exchange rates, interest rates, inflation rates, global and domestic financial market conditions and global and domestic general economic conditions;• political conditions and developments around the world (such as political instability and armed conflict), including in the areas in which EOG operates;• the use of competing energy sources and the development of alternative energy sources;• the extent to which EOG incurs uninsured losses and liabilities or losses and liabilities in excess of its insurance coverage;• acts of war and terrorism and responses to these acts; • physical, electronic and cyber security breaches; and• the other factors described under ITEM 1A, Risk Factors, on pages 13 through 21 of EOG’s Annual Report on Form 10-K for the fiscal year ended December 31, 2015 and any updates to those factors set forth in EOG's
subsequent Quarterly Reports on Form 10-Q or Current Reports on Form 8-K.
In light of these risks, uncertainties and assumptions, the events anticipated by EOG's forward-looking statements may not occur, and, if any of such events do, we may not have anticipated the timing of their occurrence or the duration and extent of their impact on our actual results. Accordingly, you should not place any undue reliance on any of EOG's forward-looking statements. EOG's forward-looking statements speak only as of the date made, and EOG undertakes no obligation, other than as required by applicable law, to update or revise its forward-looking statements, whether as a result of new information, subsequent events, anticipated or unanticipated circumstances or otherwise.
Oil and Gas Reserves; Non-GAAP Financial Measures: The United States Securities and Exchange Commission (SEC) permits oil and gas companies, in their filings with the SEC, to disclose not only “proved” reserves (i.e., quantities of oil and gas that are estimated to be recoverable with a high degree of confidence), but also “probable” reserves (i.e., quantities of oil and gas that are as likely as not to be recovered) as well as “possible” reserves (i.e., additional quantities of oil and gas that might be recovered, but with a lower probability than probable reserves). Statements of reserves are only estimates and may not correspond to the ultimate quantities of oil and gas recovered. Any reserve estimates provided in this presentation that are not specifically designated as being estimates of proved reserves may include "potential" reserves and/or other estimated reserves not necessarily calculated in accordance with, or contemplated by, the SEC’s latest reserve reporting guidelines. Investors are urged to consider closely the disclosure in EOG’s Annual Report on Form 10-K for the fiscal year ended December 31, 2015, available from EOG at P.O. Box 4362, Houston, Texas 77210-4362 (Attn: Investor Relations). You can also obtain this report from the SEC by calling 1-800-SEC-0330 or from the SEC's website at www.sec.gov. In addition, reconciliation and calculation schedules for non-GAAP financial measures can be found on the EOG website at www.eogresources.com.

JPM_0616-1
1Q 2016
Announced Successful Enhanced Oil Recovery Project In Eagle Ford
Established Austin Chalk Play Overlaying South Texas Eagle Ford
Exceeded U.S. Oil Production Forecast
Reduced LOE per BOE 29% YoY
Operations
Increased 2016 U.S. Oil Production Forecast* by 2%
On Track to Achieve 47% YoY Capital Expenditure Decrease*
Two-Thirds of Well Cost Reductions from Sustainable Efficiency Improvements
Lowered 2016 LOE, Transportation and G&A Expense Forecast*
* Based on full-year estimates as of May 5, 2016, excluding acquisitions.

JPM_0616-2
Shifting to Premium Locations- Generate at Least 30% Direct ATROR* at $40 Oil
Premium Inventory >10 Years and Growing- Adding New Premium Inventory 2-3 Times Faster Than Drilling- Improve Existing Plays With Technology and Innovation- Organic Exploration and Tactical Acquisitions
Premium Drilling Significantly Increases Capital Productivity- Oil Production Declines Just 5% YOY With 47% Less Capital**- Drill ≈200 Net Wells and Complete ≈270 Net Wells
- 230 Drilled Uncompleted Net Wells At YE 2016
Maintain Strong Balance Sheet
* See reconciliation schedules. ** Based on full-year estimates as of May 5, 2016, excluding acquisitions
Low-Cost Global Oil Producer
Focus on Returns

JPM_0616-3
$30 $40 $50 $60
* Estimated potential reserves net to EOG, not proved reserves. See reconciliation schedules.
100%+
10%
60%
30%
Premium Drilling Direct ATROR*New Standard of Capital Discipline
Creates Large Capital Efficiency Gains
Faster Production Growth
Adding Locations Faster Than Drilling
Extends U.S. Horizontal Lead
Globally Competitive
Oil:
2 BnBoe* >3,200 Locations >10 Years of Drilling

JPM_0616-4
Focus on Premium Locations
Precision Targeting
Advanced Completions
Lower Costs
* Domestic completions, gross oil production.
10.713.6
20.9
2014 2015 2016 Est
120-Day Cumulative Oil Production* (Bbl Per Foot of Treated Lateral)

JPM_0616-5
Eagle Ford
Bakken/Three Forks – Core
Bakken/Three Forks – Non-Core
Delaware Basin Wolfcamp
Delaware Basin 2nd Bone Spring Sand
Delaware Basin Leonard
DJ Basin
Powder River Basin
Inventory Growing in Quality and Size
5,200
590
950
2,130
1,250
1,600
460
275
≈ 12,500
* Number of remaining net wells as of January 1, 2016. Assumes no further downspacing, acreage additions or enhanced recovery.** Estimated potential reserves net to EOG, not proved reserves. Includes proved reserves and prior production from existing wells.
Remaining Locations*Total Premium
549,000
120,000
110,000
168,000
111,000
93,000
85,000
63,000
≈ 1,300,000
NetAcres
ResourcePotential(MMBoe)**Play
3,200
620
400
1,300
500
550
210
190
≈ 7,000
1,535
330
695
255
280
80
≈ 3,200

JPM_0616-6
New Geologic Concept In an Existing Play
Precision Targeting Key
Responds Well to EOG-Style Completions
Overlays Existing Eagle Ford Acreage
Exhibiting Premium-Level Well Performance
Two Exploratory Wells Completed YTD; Plan 7 Additional Wells in 2016- Leonard AC Unit 101H 30-Day IP: 2,100 Bopd and 2,715 Boed- Denali Unit 101H 20-Day IP: 2,265 Bopd and 3,130 Boed

JPM_0616-7
Four Gas Injection Pilot Projects with 15 Producing Wells- One Additional Project Planned for 2016 with 32 Wells- Geologically and Geographically Diverse - EOR Incremental Production in 2016 ≈1,000 Net Bopd
Attractive Economics- ATROR* >30% and PVI** >2.0 at $40 Oil- Finding Cost <$6 per Barrel- Capital Investment ≈$1MM per Well - Long Reserve Life and Low Decline Rate
Extended Development Timeline- Limited to Developed Areas- Evaluating Optimal EOR Development Plan- Studying Extent of EOR Applicability Across Field
Not Widely Repeatable across Other Tight Oil Plays- Good Vertical Containment- Black Oil Window- EOG Eagle Ford Uniquely Positioned in Optimal Setting
* See reconciliation schedules. Natural gas price $2.50 per MMBtu Henry Hub.** Net present value divided by capital investment.

JPM_0616-8
0
100
200
300
400
500
600
1.0x
1.3x – 1.7x
Primary Recovery
Enhanced Oil Recovery
2-5 Years
(Net Mbo)

JPM_0616-9
0
30
60
90
120
150
0 30 60 90 120 150 180 210 240 270
Eagle Ford East WellsAverage Cumulative Oil Production*
2012
20132014
Eagle Ford West Wells Average Cumulative Oil Production*
(Mbo)
Producing Days
* Normalized to 6,600-foot lateral.
2015
0
30
60
90
120
150
0 30 60 90 120 150 180 210 240 270
Producing Days
* Normalized to 4,600-foot lateral.
(Mbo)
2012
201320142015

JPM_0616-10
EOG > 2X Industry Average
758
368
0
100
200
300
400
500
600
700
800
EOG Industry
* Eagle Ford, Bakken, Permian, DJ and PRB.Source: IHS Performance Evaluator, supplied by IHS Global Inc.; Copyright (2016).1/1/13 through 6/30/15.
Bopd

JPM_0616-11
0
5
10
15
20
25
30
35
40
45
0
100
200
300
400
500
600
700
800
900
EOG A B C D E F G H I J K
Numberof Wells
1st 3 MonthsBopd/Boed 134
Wolfcamp DelawareWolfcamp MidlandNatural GasWell Count
Average three-month production, normalized to 5,000’ lateral. All horizontal wells from original operator January 2015 – February 2016.Gas production converted at 20:1.Delaware Basin: Culberson, Eddy, Lea, Loving, Reeves and Ward counties. Peer Companies: APA, APC, CXO, XEC.Midland Basin: Martin, Midland and Upton counties. Peer Companies: APA, CXO, FANG, PE, PXD, RSPP, QEP.Source: IHS Performance Evaluator, supplied by IHS Global Inc.; Copyright (2016).

JPM_0616-12
Lower Eagle Ford
1. Measure Rock Characteristics and Grade High to Low Quality2. Overall
Grade
3. Drill

JPM_0616-13
2015 Completions4,030 Events /1,000 ft
540 Events /1,000 ft
2010 Completions
Contain Events Closerto Wellbore
Enhance Complexity to Contact More Surface Area
Note: Microseismic dots represent well stimulation events during completions.

JPM_0616-14
* CWC = Drilling, Completion, Well-Site Facilities and Flowback.
11.5
7.56.7
2014 2015 Target
Delaware Basin Wolfcamp Oil Play South Texas Eagle Ford Bakken
* Normalized to 5,300’ lateral. * Normalized to 8,400’ lateral.* Normalized to 4,500’ lateral.
6.15.7
5.2
2014 2015 Target
8.8
7.26.2
2014 2015 Target

JPM_0616-15
32.8
18.7
8.8
2014 2015 Record
Delaware Basin Wolfcamp Oil Play South Texas Eagle Ford Bakken
* Normalized to 5,300’ lateral. * Normalized to 8,400’ lateral.* Normalized to 4,500’ lateral.
14.2
10.9
8.97.8
3.7
2012 2013 2014 2015 Record
20.8
14.712.4
8.5
5.4
2012 2013 2014 2015 Record

JPM_0616-16
Pressure Pumping
WirelineRentals &
Equipment
Drilling
Flowback & Facilities
Supervsion & Labor
1Q 2015 Efficiencies Pricing 2016 Target
$8.3MM-$1.5MM
-$0.5MM$6.7MM
Water Handling
Faster Completion Operations
Drilling
Flowback & Facilities
* CWC = Drilling, Completion, Well-Site Facilities and Flowback.
+$0.4MM
High-Density
Completions
3/4 Savings From Efficiencies
Efficiency Savings$1.5MM Per Well
Price Savings$0.5MM Per Well
Sustainable Efficiency Improvements

JPM_0616-17
2014 1Q15 2Q15 3Q15 4Q15 1Q16
G&P G&A Taxes Other Than Income Transportation LOE
$12.84*$13.72$14.49
$15.39$17.02
* Excludes one-time expenses of $18.7 million in 4Q15 related to early leasehold termination and $22.4 million in 1Q16 related to voluntary retirement program. Includes stock compensation expense and other non-cash items. See reconciliation schedules.
$11.96*

JPM_0616-18
* Source: Sanford C. Bernstein & Co. Thousand Club includes wells with 30-day rate over 1,000 Boed in 2015.Represents 3,600 wells out of 40,000 drilled.Companies: BHP, CHK, CLR, COG, COP, CXO, DVN, EPE, EQT, HES, MRO, NBL, PXD, RRC, RICE, SM, SWN, TOU, XEC.
0%
20%
40%
60%
80%
100%
0
50
100
150
200
250
300
EOG A B C D E F G H I J K L M N O P Q R S
Well CountPercent Oil
Well Count Percent Oil

JPM_0616-19
7,998 8,087
8,244
8,568
8,577 8,678
8,754 8,835
8,9599,129
9,198
9,423
9,341
9,451
9,6489,694
9,479
9,315
9,433
9,407
9,4539,379
9,329
9,246 9,1809,129
9,037 8,948
8,799
8,629
8,508
8,253
8,1128,178
8,2288,222
8,1898,152
8,150
8,1418,075
8,006
8,002
7,8607,792
7,9518,082
8,115
Jan Mar May Jul Sep Nov Jan Mar May Jul Sep Nov Jan Mar May Jul Sep Nov Jan Mar May Jul Sep Nov
* EIA STEO Model Released April 2016
2014+1,252
2015+726
2016-829
2017-558
(MBod)

JPM_0616-20
Middle East
Venezuela
Brazil
Russia
Nigeria
Angola
US L48 Conv
Mexico
GOM
$0$10$20$30$40$50$60$70$80$90
$100
MiddleEast/Russia
Medium CostConventional
USTight Oil
DeepWater
High CostNon-OPEC
Arctic / RussianUnconventional
* Price required to achieve 10% Direct ATROR (see reconciliation schedules).Source: PIRA.
Brent ($/BBL)
50% 22% 5% 16% 7% -% World Supply
Oil Sands
New Marginal Cost of Oil
(≈ $65 - $75)North Sea
U.S. Tight OilFar East
Russia EOG ($30)*
EOG Competitive Globally

JPM_0616-21
High-Quality Assets With Scale- Large Eagle Ford, Bakken and Delaware Basin Footprints- Scale Drives Cost Savings and Leverages Technology Gains
Innovation and Technology Focus- In-House Completion Design- Merging Data Science and Geoscience
Low-Cost Operator- Highest Production Per Employee in Peer Group- Vertically Integrated: Self-Sourced Sand, Chemicals and Drilling Fluids
Organic Exploration Growth- Internal Prospect Generation First-Mover Advantage- Replacing Inventory at 2x Drilling Pace
Organization and Culture- Decentralized Structure Bottom-Up Value Creation- Returns-Driven Culture – Significant Employee Compensation Criteria
Sustainable Competitive Advantage

JPM_0616-22
Improve Well Productivity with Technology and Innovation- Enhanced Oil Recovery- Precision Lateral Targeting and High-Density Completions
Lower Costs- Identify Further Efficiency Improvements- Enhance Infrastructure
Extend Our Lead- Add Premium-Quality Drilling Potential Through Organic Exploration- Develop Only Premium Locations Going Forward
Maintain a Strong Balance Sheet- Balance Capex to Cash Flow- Recycle Inventory Through Asset Sales
Reset Company to Be Successful At Low Prices
Resume High-Return Growth When Prices Improve

JPM_0616-23

JPM_0616-24
0
1
2
3
4
5
6
7
A B C D E F G H I J PeerAvg
K EOG L M N
Source: UBS Investment Research. Net debt as of 12/31/15 and 2016E EBITDAX as of April 18, 2016. Based on $40/Bbl WTI and $2.40/MMBtu.Peer Group: APA, APC, CLR, COG, COP, CXO, DVN, HES, MRO, NBL, NFX, OXY, PXD and RRC.

JPM_0616-25
Eagle Ford Delaware Basin Wolfcamp - Oil and ComboDelaware Basin 2nd Bone Spring SandDelaware Basin LeonardBakken/Three Forks – Core
Bakken/Three Forks – Non-Core
* Direct ATROR at Flat Oil Prices. See reconciliation schedules. Oil price at the wellhead, natural gas price $2.50 per MMBtu.
40%15%Powder River BasinWyoming DJ Basin
5% 10% $50
Oil
Excludes Indirect Capital:- Gathering, Processing and Other Midstream- Land, Seismic, Geological and Geophysical
Direct ATROR*Based on cash flow and time value of money:- Estimated Future Commodity Prices and Operating Costs - Costs Incurred to Drill, Complete and Equip a Well
$40
Oil
60%30%Premium Inventory

JPM_0616-26* Estimated potential reserves net to EOG, not proved reserves.
2010 2011 2012 2013 2014 2015
Eagle Ford
Bakken/Rockies
Delaware Basin
Barnett Combo
1,610
65
700
1,885
1,400
1,600
7x Production Since 2010

JPM_0616-27
WEBB
FRIO
BEE
UVALDE
DIMMIT
BEXAR
KINNEY
ZAVALA
MEDINA
LA SALLE
LAVACA
MAVERICK
LIVE OAK
ATASCOSA
DE WITT
FAYETTE
MCMULLEN
WILSON
GONZALES
KARNES
GUADALUPE
Oil 76%
Gas 13%
NGLs11%
Current Production Mix
2016 Operations
Largest Oil Producer and Acreage Holder in the Eagle Ford- Average 5 Rigs Operating in 2016- Complete ≈150 Net Wells in 2016 vs. 329 in 2015
Estimated Resource Potential 3.2 BnBoe;* 7,200 Net Wells- EUR 450 MBoe/Well, NAR at ≈40-Acre Spacing
Precision Targeting- Lateral Drilling Window 20’ vs. Prior 150’
Acreage 91% Held by Production at YE 2015
1Q 2016 Wells 30-Day IP: Bopd Boed- Stills Unit 2H 2,775 3,490- Fleetwood Unit 5H-8H 2,330 2,995- Boedeker 18H 2,305 2,760
Focused on Premium Locations
Few Lease Retention Obligations
Testing Stacked-Staggered “W” Patterns 200’ to 250’ Apart
Reducing Operating Costs Through Sustainable Efficiencies
* Estimated potential reserves net to EOG, not proved reserves. Includes 1,032 MMBoe proved reserves booked at December 31, 2015 and prior production from existing wells.
Crude OilWindow
Dry GasWindow
Wet GasWindow
0 25 Miles
San Antonio
Corpus Christi
Laredo
EOG 608,000 Net Acres549,000 Net Acres in Oil Window

JPM_0616-28
0%
20%
40%
60%
80%
100%
$30 $40 $50 $60 $70
Flat Oil Price $/Bbl
* See reconciliation schedules. Natural gas price $2.50 per MMBtu Henry Hub.
Direct ATROR*

JPM_0616-29
Brushy Canyon
Leonard A
Leonard B
1st Bone Spring
2nd Bone Spring
3rd Bone Spring
Upper Wolfcamp
Middle Wolfcamp
Lower Wolfcamp
4,80
0’
One WorldTrade Center
1,792’
Battery Park to Wall Street to City Hall 4,800’ Middle Bakken
Lower EagleFord
40’ 150’
Battery Park
Wall Street
City Hall

JPM_0616-30
168,000 Net Acres Prospective with Multiple Target Zones- 4,500’ Average Lateral; ≈700’ Spacing- 2,130 Net Drilling Locations- Complete ≈60 Net Wells in 2016 vs. 28 in 2015
Estimated Resource Potential 1.3 BnBoe,* Net to EOG
Oil Play- 110,000 Net Acres, 1,375 Locations- EUR 750 MBoe, Gross; 600 MBoe, NAR - CWC** $7.5MM in 2015; Target $6.7MM
Combo Play- 58,000 Net Acres, 755 Locations- EUR 900 MBoe, Gross; 675 MBoe, NAR- CWC** $6.6MM in 2015- Acquired ≈8,000 Net Acres in 4Q 2015
Testing 500’ Spacing and Additional Targets- Extending Lateral Lengths
Wolfcamp Oil Window Wells Bopd Boed Lateral- 1Q 2016 12 Wells 30-Day IP 1,480 2,150 4,500’- Rattlesnake 21 Fed Com #701H 20-Day IP 2,670 3,735 7,000’- Rattlesnake 21 Fed Com #702H 20-Day IP 2,870 4,010 7,100’
* Estimated potential reserves net to EOG, not proved reserves. Includes 211 MMBoe of proved reserves booked at December 31, 2015 and prior production from existing wells.
** CWC = Drilling, Completion, Well-Site Facilities and Flowback
NGLs33%
Typical Reeves CountyWolfcamp Combo Well
Gas36%
Oil31%
Gas26%
NGLs24%
Oil50%
Typical NorthernWolfcamp Oil Well

JPM_0616-31
111,000 Net Acres Prospective in Northern Delaware Basin- 1,250 Net Drilling Locations; ≈ 850’ Spacing- Complete ≈10 Net Wells in 2016 vs. 27 in 2015Estimated Resource Potential 500 MMBoe,* Net to EOG
Typical Well- 4,500’ Lateral- EUR 500 MBoe, Gross; 400 MBoe, NAR- $6.6 MM CWC** in 2015- API 43°- 48°
93,000 Net Acres Prospective- >1,600 Net Drilling Locations; 12 Net Wells Completed in 2015Estimated Resource Potential 550 MMBoe,* Net to EOG- Evaluating Oil Mix; Highly Variable Across the PlayTypical Well- 4,500’ Lateral- EUR 500 MBoe, Gross; 400 MBoe, NAR- $5.8 MM CWC** in 2015
* Estimated potential reserves net to EOG, not proved reserves. Includes 64 MMBoe of proved reserves in Second Bone Spring Sand and 72 MMBoe in Leonard Shale booked at December 31, 2015 and prior production from existing wells.
** CWC = Drilling, Completion, Well-Site Facilities and Flowback.
NGLs17%
Typical 2nd Bone Spring Sand Well
Gas23%
Oil60%
Leonard Shale
Second Bone Spring Sand
JPM_0616-32
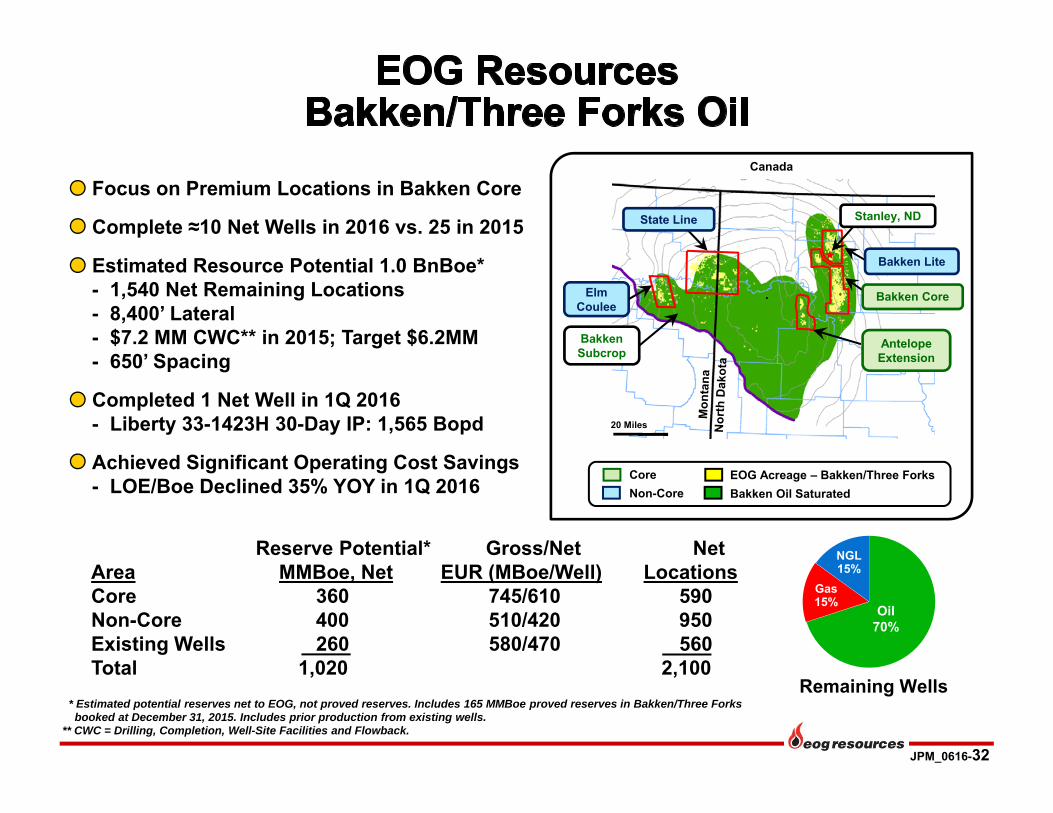
* Estimated potential reserves net to EOG, not proved reserves. Includes 165 MMBoe proved reserves in Bakken/Three Forks booked at December 31, 2015. Includes prior production from existing wells.
** CWC = Drilling, Completion, Well-Site Facilities and Flowback.
Focus on Premium Locations in Bakken Core
Complete ≈10 Net Wells in 2016 vs. 25 in 2015
Estimated Resource Potential 1.0 BnBoe*- 1,540 Net Remaining Locations- 8,400’ Lateral- $7.2 MM CWC** in 2015; Target $6.2MM- 650’ Spacing
Completed 1 Net Well in 1Q 2016- Liberty 33-1423H 30-Day IP: 1,565 Bopd
Achieved Significant Operating Cost Savings- LOE/Boe Declined 35% YOY in 1Q 2016
Canada
Bakken Core
Bakken Subcrop
AntelopeExtension
Bakken Lite
State Line
Elm Coulee
EOG Acreage – Bakken/Three ForksBakken Oil Saturated
20 Miles
Gas 15%
Remaining Wells
Oil70%
NGL15%
Reserve Potential* Gross/Net NetArea MMBoe, Net EUR (MBoe/Well) LocationsCore 360 745/610 590Non-Core 400 510/420 950Existing Wells 260 580/470 560Total 1,020 2,100
Stanley, ND
CoreNon-Core

JPM_0616-33
Industry production data from IHS. EOG economic analysis. * * NPV calculated using $50 WTI and $2.50 NYMEX fixed for life of well.** Top 10 Operators are 30% less productive than EOG. Assumes industry capital and operating costs equal to EOG.
EOG EOGPremium
Wells
Top 10 Producers**
2015 2016
EOG Creates Most NPV per Well
$0.8MM
$4.3MM
-$1.3MM

JPM_0616-34* Based on full-year estimates as of May 5, 2016, excluding acquisitions.
$6.2
$3.6
$2.0
$1.4
$0.8
$0.4
$0.7
$0.3
$0.1
288.9 284.4270.0
0.00
50.00
100.00
150.00
200.00
250.00
300.00
0
1
2
3
4
5
6
7
8
9
10
2014 2015 2016*
$8.3 Bn
$4.7 Bn
$2.4 - $2.6 Bn
- 44%
- 47%
Oil Production (MBopd)Gathering, Processing and OtherExploration and Development FacilitiesExploration and Development

JPM_0616-35
Source: IHS. As of November, 2015.Peer companies: APC, CHK, CLR, COP, DVN, MRO, PXD, WLL and XOM.
370
251
217 215200
189
161 160 156136
EOG A B C D E F G H I
EOG is Industry Leader

JPM_0616-36
9.0%
8.1%7.3%
6.5%
5.2% 5.1% 4.9%4.4%
2.9% 2.6%
EOG A B C PeerAvg
D E F G H
Source: FactSet, adjusted earnings. Peer companies: APC, APA, CHK, DVN, HES, MRO, NBL and PXD.

JPM_0616-37
Production and Reserve GrowthReturns
A 30%
B 45%
C 40%
D 30%
F 58%
10%
EOG 8%25%
E 30%10%
G 10%
H 30%
Source: Company Reports. Percentages represent weightings applied in determining executive officer short-term incentive compensation.Peer Group: APA, APC, CHK, DVN, HES, MRO, NBL and PXD.
EOG Employees Are Incentivized to Deliver Returns

JPM_0616-38
$0.03 $0.04 $0.04 $0.04 $0.05 $0.06$0.08
$0.12
$0.18
$0.26$0.29
$0.31 $0.32$0.34
$0.38
$0.59
$0.67 $0.67
$0.00
$0.10
$0.20
$0.30
$0.40
$0.50
$0.60
$0.70
1999 2000 2001 2002 2003 2004 2005 2006 2007 2008 2009 2010 2011 2012 2013 2014 2015 2016*
Note: Dividends adjusted for 2-for-1 stock splits effective March 1, 2005 and March 31, 2014.* Indicated annual rate.
Committed to the Dividend16 Dividend Increases in 17 Years

JPM_0616-39
United Kingdom
East Irish Sea (Conwy)- Production Commenced March 2016- Under Production Test to Determine Optimal
Long-Term Rate
Sercan Joint Development Project- 5-Well Program- Complete One Well Late 2016
Limited Capital Spending in 2016
Active Exploration Program
Trinidad
TRINIDAD
ATLANTIC OCEAN
U(a)
VENEZUELA
4(a)
U(b)
SECC
NORTH SEA
EastIrishSea
Trinidad and Tobago
United Kingdom

JPM_0616-40
Maintain Strong Balance Sheet- Investment Grade Credit Ratings
Successful Efforts Accounting
Zero Goodwill
$2.7 Billion in Available Liquidity- $0.7 Billion Cash at March 31, 2016- $2.0 Billion Credit Facility – Undrawn at March 31, 2016
Increased Dividend 16 Times in 17 Years- Current Indicated Annual Rate $0.67 per Share
EOG Reserves Within 5% of Independent Engineering Analysis- Prepared by DeGolyer and MacNaughton - 28 Consecutive Years - Reviewed 86% of 2015 Proved Reserves

Copyright; Assumption of Risk: Copyright 2016. This presentation and the contents of this presentation have been copyrighted by EOG Resources, Inc. (EOG). All rights reserved. Copying of the presentation is forbidden without the prior written consent of EOG. Information in this presentation is provided “as is” without warranty of any kind, either express or implied, including but not limited to the implied warranties of merchantability, fitness for a particular purpose and the timeliness of the information. You assume all risk in using the information. In no event shall EOG or its representatives be liable for any special, indirect or consequential damages resulting from the use of the information.
Cautionary Notice Regarding Forward-Looking Statements: This presentation includes forward-looking statements within the meaning of Section 27A of the Securities Act of 1933, as amended, and Section 21E of the Securities Exchange Act of 1934, as amended. All statements, other than statements of historical facts, including, among others, statements and projections regarding EOG's future financial position, operations, performance, business strategy, returns, budgets, reserves, levels of production and costs, statements regarding future commodity prices and statements regarding the plans and objectives of EOG's management for future operations, are forward-looking statements. EOG typically uses words such as "expect," "anticipate," "estimate," "project," "strategy," "intend," "plan," "target," "goal," "may," "will," "should" and "believe" or the negative of those terms or other variations or comparable terminology to identify its forward-looking statements. In particular, statements, express or implied, concerning EOG's future operating results and returns or EOG's ability to replace or increase reserves, increase production, reduce or otherwise control operating and capital costs, generate income or cash flows or pay dividends are forward-looking statements. Forward-looking statements are not guarantees of performance. Although EOG believes the expectations reflected in its forward-looking statements are reasonable and are based on reasonable assumptions, no assurance can be given that these assumptions are accurate or that any of these expectations will be achieved (in full or at all) or will prove to have been correct. Moreover, EOG's forward-looking statements may be affected by known, unknown or currently unforeseen risks, events or circumstances that may be outside EOG's control. Important factors that could cause EOG's actual results to differ materially from the expectations reflected in EOG's forward-looking statements include, among others:
• the timing, extent and duration of changes in prices for, supplies of, and demand for, crude oil and condensate, natural gas liquids, natural gas and related commodities; • the extent to which EOG is successful in its efforts to acquire or discover additional reserves; • the extent to which EOG is successful in its efforts to economically develop its acreage in, produce reserves and achieve anticipated production levels from, and maximize reserve recovery from, its existing and future
crude oil and natural gas exploration and development projects; • the extent to which EOG is successful in its efforts to market its crude oil and condensate, natural gas liquids, natural gas and related commodity production;• the availability, proximity and capacity of, and costs associated with, appropriate gathering, processing, compression, transportation and refining facilities; • the availability, cost, terms and timing of issuance or execution of, and competition for, mineral licenses and leases and governmental and other permits and rights-of-way, and EOG’s ability to retain mineral licenses
and leases;• the impact of, and changes in, government policies, laws and regulations, including tax laws and regulations; environmental, health and safety laws and regulations relating to air emissions, disposal of produced
water, drilling fluids and other wastes, hydraulic fracturing and access to and use of water; laws and regulations imposing conditions or restrictions on drilling and completion operations and on the transportation of crude oil and natural gas; laws and regulations with respect to derivatives and hedging activities; and laws and regulations with respect to the import and export of crude oil, natural gas and related commodities;
• EOG's ability to effectively integrate acquired crude oil and natural gas properties into its operations, fully identify existing and potential problems with respect to such properties and accurately estimate reserves, production and costs with respect to such properties;
• the extent to which EOG's third-party-operated crude oil and natural gas properties are operated successfully and economically;• competition in the oil and gas exploration and production industry for the acquisition of licenses, leases and properties, employees and other personnel, facilities, equipment, materials and services; • the availability and cost of employees and other personnel, facilities, equipment, materials (such as water) and services;• the accuracy of reserve estimates, which by their nature involve the exercise of professional judgment and may therefore be imprecise;• weather, including its impact on crude oil and natural gas demand, and weather-related delays in drilling and in the installation and operation (by EOG or third parties) of production, gathering, processing, refining,
compression and transportation facilities;• the ability of EOG's customers and other contractual counterparties to satisfy their obligations to EOG and, related thereto, to access the credit and capital markets to obtain financing needed to satisfy their
obligations to EOG;• EOG's ability to access the commercial paper market and other credit and capital markets to obtain financing on terms it deems acceptable, if at all, and to otherwise satisfy its capital expenditure requirements;• the extent and effect of any hedging activities engaged in by EOG;• the timing and extent of changes in foreign currency exchange rates, interest rates, inflation rates, global and domestic financial market conditions and global and domestic general economic conditions;• political conditions and developments around the world (such as political instability and armed conflict), including in the areas in which EOG operates;• the use of competing energy sources and the development of alternative energy sources;• the extent to which EOG incurs uninsured losses and liabilities or losses and liabilities in excess of its insurance coverage;• acts of war and terrorism and responses to these acts; • physical, electronic and cyber security breaches; and• the other factors described under ITEM 1A, Risk Factors, on pages 13 through 21 of EOG’s Annual Report on Form 10-K for the fiscal year ended December 31, 2015 and any updates to those factors set forth in EOG's
subsequent Quarterly Reports on Form 10-Q or Current Reports on Form 8-K.
In light of these risks, uncertainties and assumptions, the events anticipated by EOG's forward-looking statements may not occur, and, if any of such events do, we may not have anticipated the timing of their occurrence or the duration and extent of their impact on our actual results. Accordingly, you should not place any undue reliance on any of EOG's forward-looking statements. EOG's forward-looking statements speak only as of the date made, and EOG undertakes no obligation, other than as required by applicable law, to update or revise its forward-looking statements, whether as a result of new information, subsequent events, anticipated or unanticipated circumstances or otherwise.
Oil and Gas Reserves; Non-GAAP Financial Measures: The United States Securities and Exchange Commission (SEC) permits oil and gas companies, in their filings with the SEC, to disclose not only “proved” reserves (i.e., quantities of oil and gas that are estimated to be recoverable with a high degree of confidence), but also “probable” reserves (i.e., quantities of oil and gas that are as likely as not to be recovered) as well as “possible” reserves (i.e., additional quantities of oil and gas that might be recovered, but with a lower probability than probable reserves). Statements of reserves are only estimates and may not correspond to the ultimate quantities of oil and gas recovered. Any reserve estimates provided in this presentation that are not specifically designated as being estimates of proved reserves may include "potential" reserves and/or other estimated reserves not necessarily calculated in accordance with, or contemplated by, the SEC’s latest reserve reporting guidelines. Investors are urged to consider closely the disclosure in EOG’s Annual Report on Form 10-K for the fiscal year ended December 31, 2015, available from EOG at P.O. Box 4362, Houston, Texas 77210-4362 (Attn: Investor Relations). You can also obtain this report from the SEC by calling 1-800-SEC-0330 or from the SEC's website at www.sec.gov. In addition, reconciliation and calculation schedules for non-GAAP financial measures can be found on the EOG website at www.eogresources.com.