jp morgan australia investment forum 2017 · 11/1/2017 · jp morgan australia investment forum...
TRANSCRIPT

JP Morgan Australia Investment Forum 20174 September 2017
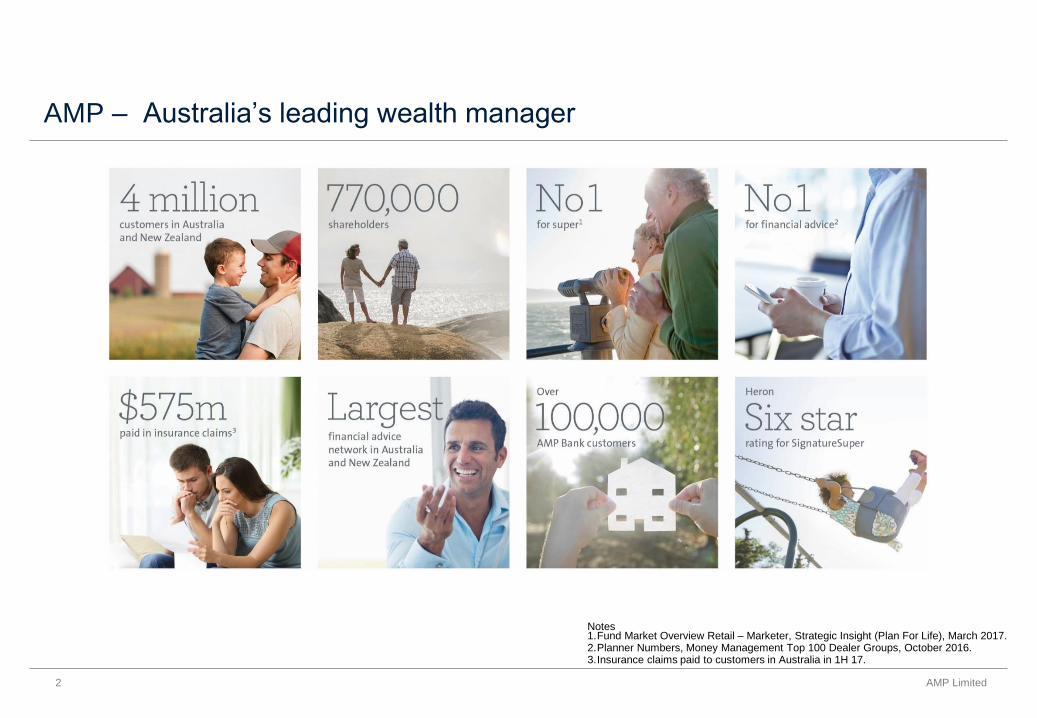
AMP – Australia’s leading wealth manager
Notes1.Fund Market Overview Retail – Marketer, Strategic Insight (Plan For Life), March 2017.2.Planner Numbers, Money Management Top 100 Dealer Groups, October 2016.3.Insurance claims paid to customers in Australia in 1H 17.
2 AMP Limited

About AMP
Key facts
– Largest financial advice network in Australia and New Zealand – with 3,370
aligned and employed financial advisers and planners
– Around 4 million retail customers
– More than A$245 billion in assets under management
– Around 770,000 shareholders
– 5,572 employees across Australia, New Zealand, Asia, United States, United
Kingdom and Europe
– Market capitalisation of $15.1 billion as at 30 June, 2017
AMP is the leading
independent wealth
management company
in Australia and New
Zealand
What Sets Us Apart
– Trusted and respected brand
– Market-leading distribution strength and breadth
– Scale and market-leading cost efficiency
– Investment management capability
– Execution strength in transformational change, integration, project delivery and
partnership management
3 AMP Limited
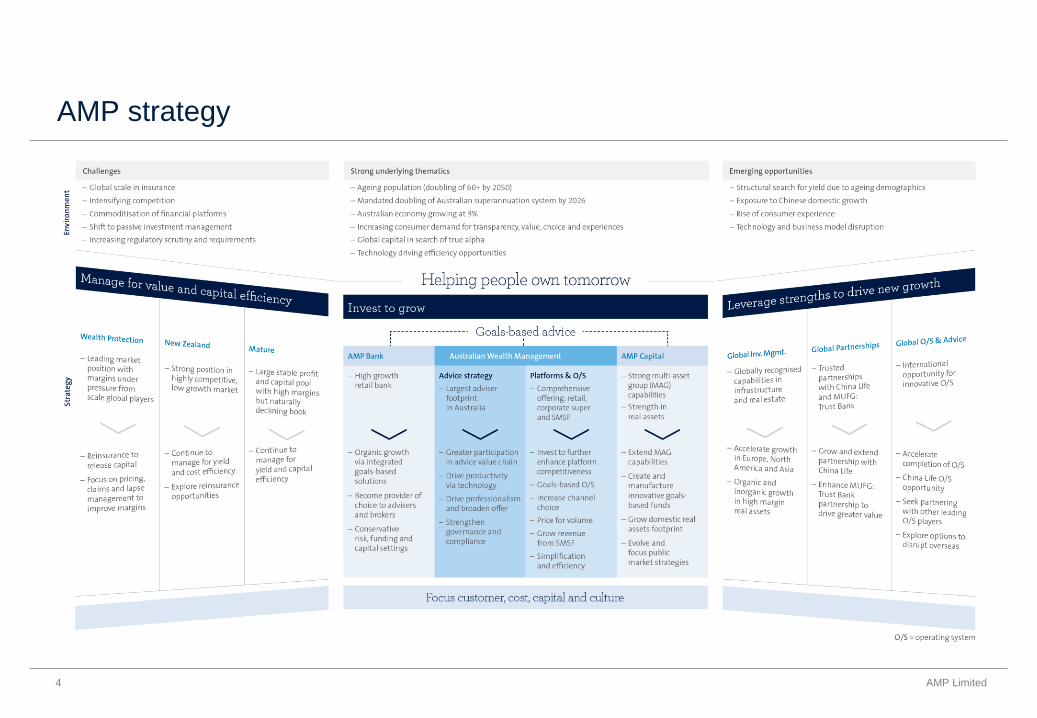
AMP strategy
4 AMP Limited

Delivering on strategy
Tilt investment to higher growth, less capital
intensive businesses
– Comprehensive program of reinsurance delivering significant capital release; retail book will be
effectively 65% reinsured for claims incurred from 1 November 2017
– Remain open-minded on best ways to emerge value from manage for value businesses
Complete the customer-centred transformation of
core Australian businesses
– On track to complete build of new goals-based operating system in 1H 18
– Leveraged new customer analytics and campaigns capability to drive cashflows ahead of super
changes
– Platform enhancements underway including fully integrated SMA capability
– Deployment of SMSF Connected Services portal in 2H 17
– Investment of A$50m in practice equity and client registers expected in 2H 17
– Implementation of Salesforce underway improving adviser productivity and customer experience
Manage costs across the group – 1H 17 controllable costs (ex AMP Capital) broadly flat on 1H 16
– 3% cost reduction expected in FY 17 (ex AMP Capital)
– Reaffirmed flat cost guidance for FY 18 (ex AMP Capital)
Expand internationally by leveraging core
strengths into new markets
– 27% growth in AMP Capital international institutional clients in 1H 17 to 252; 33% external AUM
managed on behalf of international clients
– CLPC: AUM grew 8% to RMB 408.2b (A$78.5b) in 1H 17; no 1 in trustee services by AUM
– CLAMP: AUM grew 22% to RMB 141b (A$27.1b) in 1H17; top 10 fund in China for equities
performance
– MUFG: Trust Bank: 13 retail funds and three institutional funds in market with combined AUM of
A$1.3b
Delivering on strategy
5 AMP Limited
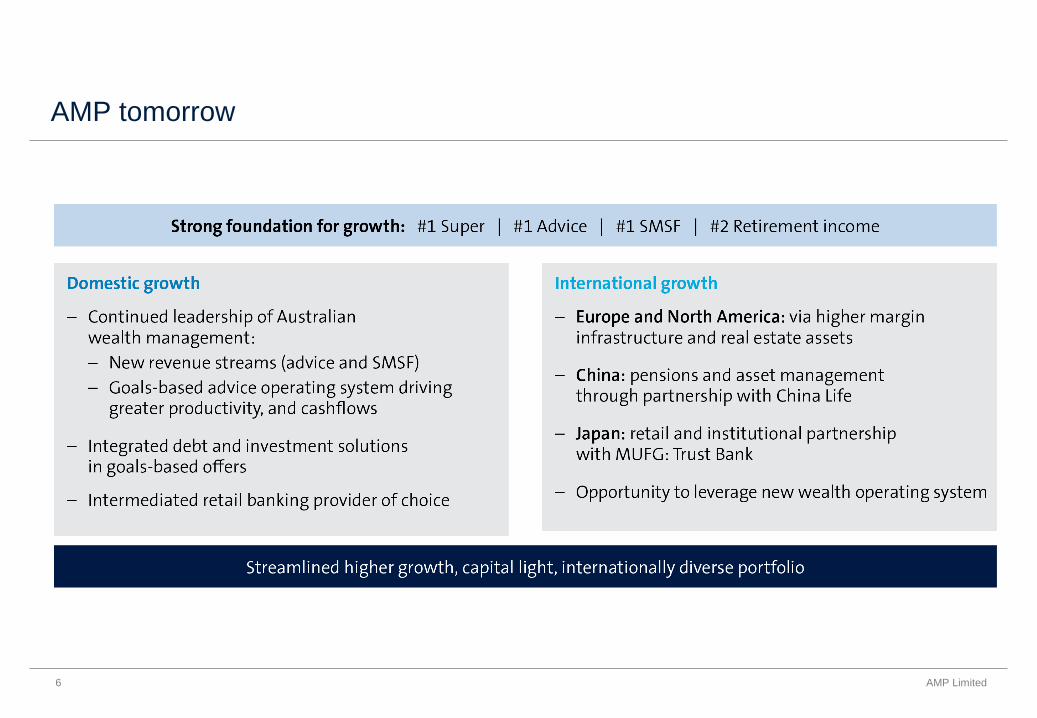
AMP tomorrow
6 AMP Limited

New reinsurance arrangements – deal structure
Existing Munich Re arrangement on AMP Life Australian retail book increased from 50% to 60% quota
share
New open-ended 60% quota share arrangement with Gen Re1 on the NMLA Australian retail book which
transferred to AMP Life on 1 January 2017
Recapture of 35 existing reinsurance arrangements and entry into a new retail surplus treaty with Gen
Re that applies after quota shares
Implementation 1 November 2017
Results in:
60% quota share covering AMP’s Australian retail book (including income protection and lump sum)
surplus treaty effectively takes overall reinsurance to 65% of retail book
Delivers capital release from AMP Life and assists with future earnings stability
Completes Australian reinsurance program to release capital and reduce volatility
Indicative financial impacts FY 17 Ongoing
Australian wealth protection profit margins (A$5m) (A$30m)
Capital release from AMP Life – subject to regulatory approvals
A$500m
Notes
1.Gen Re, a Berkshire Hathaway company, is AA+ rated from Standard & Poor’s.
7 AMP Limited
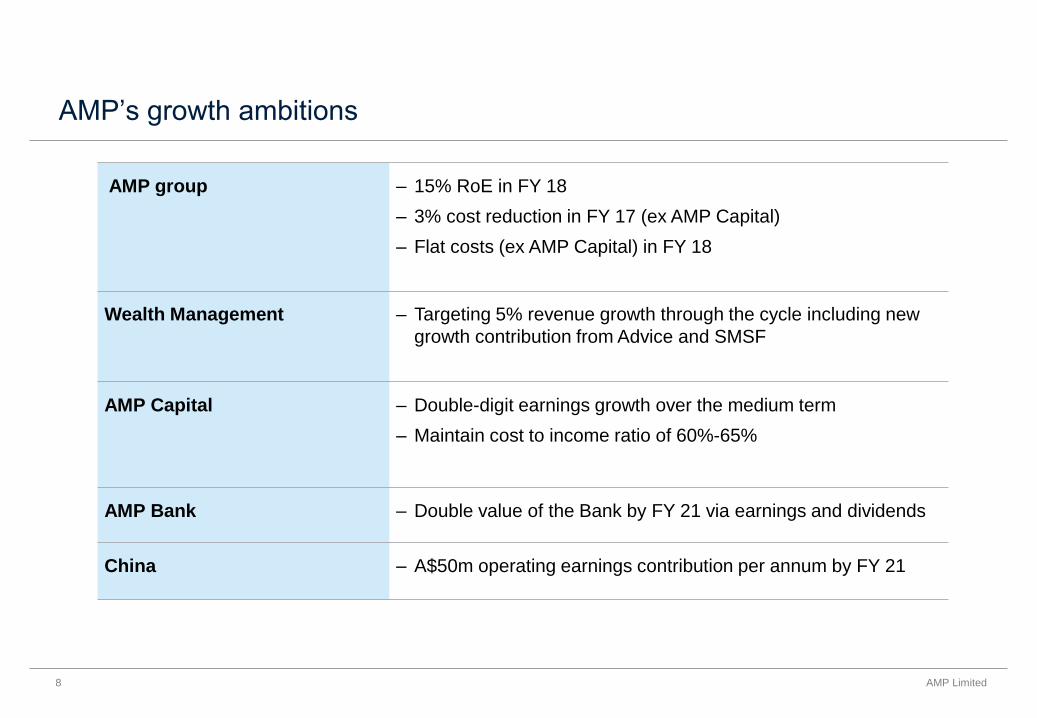
AMP’s growth ambitions
AMP group – 15% RoE in FY 18
– 3% cost reduction in FY 17 (ex AMP Capital)
– Flat costs (ex AMP Capital) in FY 18
Wealth Management – Targeting 5% revenue growth through the cycle including new
growth contribution from Advice and SMSF
AMP Capital – Double-digit earnings growth over the medium term
– Maintain cost to income ratio of 60%-65%
AMP Bank – Double value of the Bank by FY 21 via earnings and dividends
China – A$50m operating earnings contribution per annum by FY 21
8 AMP Limited


1H 17 profit summary
A$m 1H 17 1H 16 %
Australian wealth management 193 195 (1.0)
AMP Capital¹ 92 83 10.8
AMP Bank 65 59 10.2
Australian wealth protection 52 47 10.6
New Zealand financial services 65 62 4.8
Australian mature 75 69 8.7
BU operating earnings 542 515 5.2
Group Office costs (33) (30) (10.0)
Total operating earnings 509 485 4.9
Underlying investment income¹ 50 61 (18.0)
Interest expense on corporate debt (26) (33) 21.2
Underlying profit 533 513 3.9
Other items (9) (6) (50.0)
Business efficiency program costs - (12) n/a
Amortisation of acquired intangible assets¹ (43) (39) (10.3)
Profit before market adjustments and accounting mismatches
481 456 5.5
Market adjustments¹ (30) 63 n/a
Accounting mismatches (6) 4 n/a
Profit attributable to shareholders of AMP Limited 445 523 (14.9)
Notes
1. AMP Capital is 15% owned
by MUFG: Trust Bank
(formerly MUTB). AMP
Capital results, and any
other impacted line items,
are shown net of minority
interests.
10 AMP Limited

Wealth Mgt36%
AMP Capital17%
New Zealand12%
Mature14%
Insurance9%
AMP Bank12%
AMP – a balanced, diversified business
Contribution of business units to 1H 17 operating earnings
AUM-driven
businesses
represented 53% of
total 1H 17 BU
operating earnings
11 AMP Limited
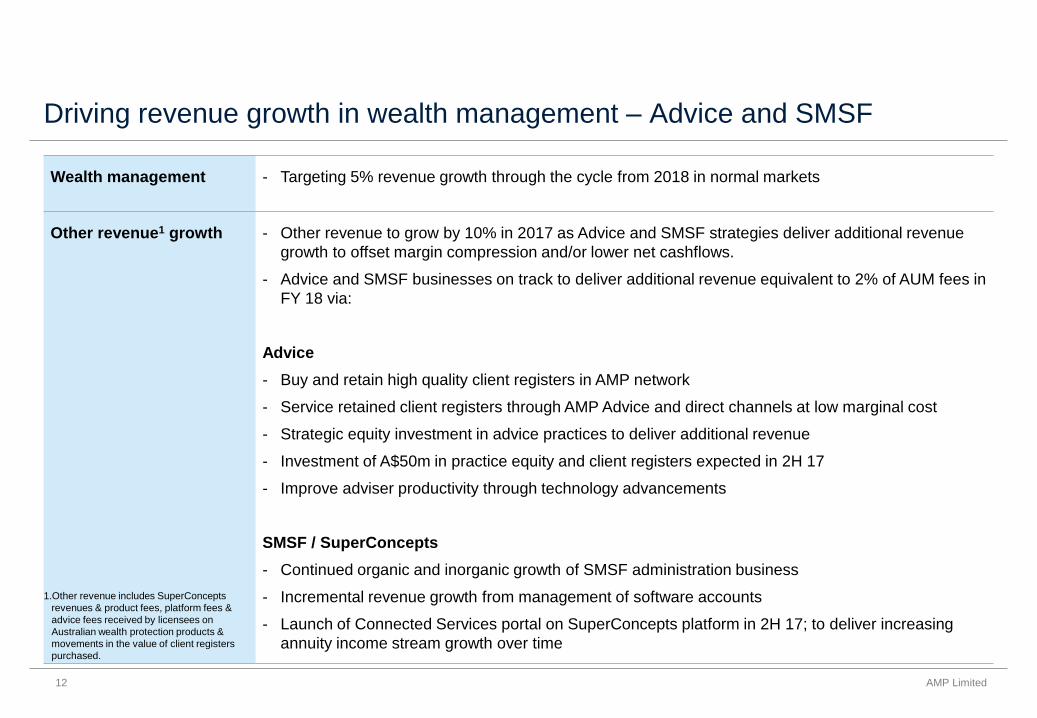
Driving revenue growth in wealth management – Advice and SMSF
Wealth management - Targeting 5% revenue growth through the cycle from 2018 in normal markets
Other revenue1 growth - Other revenue to grow by 10% in 2017 as Advice and SMSF strategies deliver additional revenue
growth to offset margin compression and/or lower net cashflows.
- Advice and SMSF businesses on track to deliver additional revenue equivalent to 2% of AUM fees in
FY 18 via:
Advice
- Buy and retain high quality client registers in AMP network
- Service retained client registers through AMP Advice and direct channels at low marginal cost
- Strategic equity investment in advice practices to deliver additional revenue
- Investment of A$50m in practice equity and client registers expected in 2H 17
- Improve adviser productivity through technology advancements
SMSF / SuperConcepts
- Continued organic and inorganic growth of SMSF administration business
- Incremental revenue growth from management of software accounts
- Launch of Connected Services portal on SuperConcepts platform in 2H 17; to deliver increasing
annuity income stream growth over time
12 AMP Limited
1.Other revenue includes SuperConcepts
revenues & product fees, platform fees &
advice fees received by licensees on
Australian wealth protection products &
movements in the value of client registers
purchased.

Driving new economics in wealth management1
13
Growth as % of average AUM
Investment markets +8%
Customer fees -1%
Margin compression -4%
Net cashflow +2%
Other revenue (inc. Advice & SMSF) 0
Growth 5%
@ 45% cost to income2 x1.8
Annual operating earnings growth 9%
Note:
Figures reflect back-tested actuals 2012-2017 (rounded).
1. This is an example only and is not intended to be an
indicator of future performance
2. Actual FY16 cost to income ratio: 45%
AMP Limited
Targeting growth in other revenue from Advice and SMSF
equivalent to 2% AUM fees to offset potential pressure on
margin compression and/or net cashflows in 2018
Targeting 5% revenue growth through the cycle from 2018 in normal markets
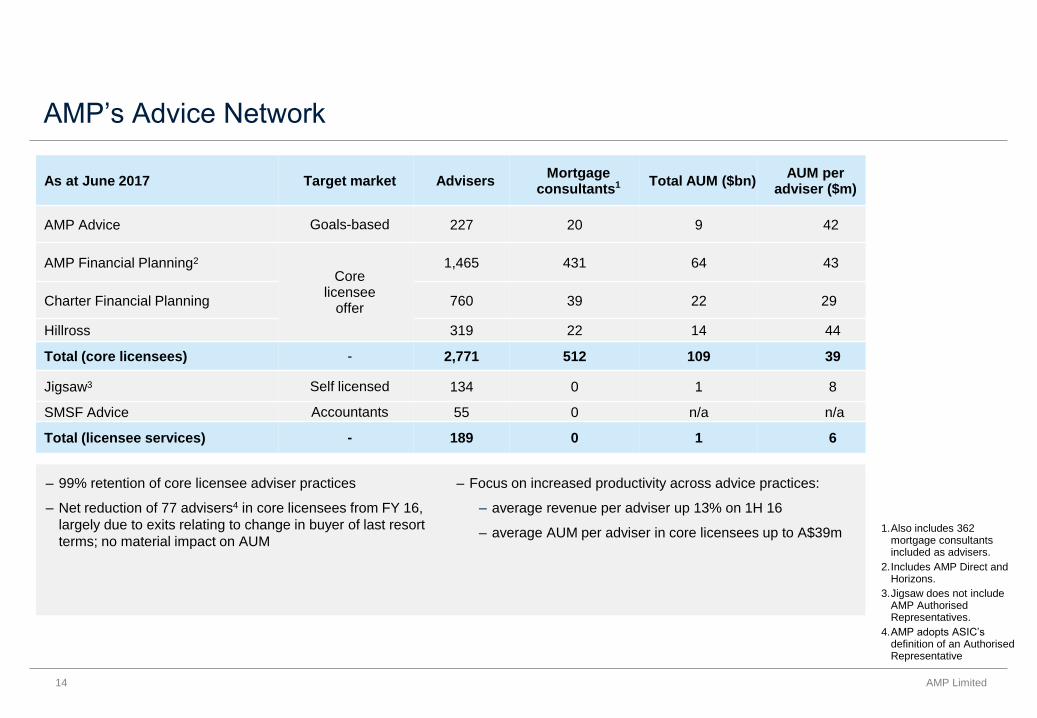
– 99% retention of core licensee adviser practices
– Net reduction of 77 advisers4 in core licensees from FY 16,
largely due to exits relating to change in buyer of last resort
terms; no material impact on AUM
– Focus on increased productivity across advice practices:
– average revenue per adviser up 13% on 1H 16
– average AUM per adviser in core licensees up to A$39m 1.Also includes 362 mortgage consultants included as advisers.
2.Includes AMP Direct and Horizons.
3.Jigsaw does not include AMP Authorised Representatives.
4.AMP adopts ASIC’s definition of an Authorised Representative
As at June 2017 Target market AdvisersMortgage
consultants1 Total AUM ($bn)AUM per
adviser ($m)
AMP Advice Goals-based 227 20 9 42
AMP Financial Planning2
Core licensee
offer
1,465 431 64 43
Charter Financial Planning 760 39 22 29
Hillross 319 22 14 44
Total (core licensees) - 2,771 512 109 39
Jigsaw3 Self licensed 134 0 1 8
SMSF Advice Accountants 55 0 n/a n/a
Total (licensee services) - 189 0 1 6
AMP’s Advice Network
14 AMP Limited

Adviser register acquisitions
– Largest financial advice network in Australia and New Zealand – with 3,370 aligned and employed financial
advisers
– AMP has historically maintained a strategy of buying and re-selling between $80-$100m worth of adviser
registers per annum – typically from retiring advisers at a multiple of around 4x revenue
– AMP will now strategically hold these high quality registers and service at low marginal cost through AMP
Advice and AMP Assist (new phone / tech-enabled channel)
– 1H 17: AMP adjusted the accounting for approximately $50m worth of existing registers currently held in
stock to intangibles
– 2H 17: AMP expects to invest a further $50m in practice equity and client registers
– The revenue from this investment results in an immediate uplift of WM “Other income” as a proportion of the
value paid
15 AMP Limited

Financial overview – balance sheet and regulatory capital
A$m 1H 17 FY 16 Change
Shareholder equity1 7,296 7,489 (193)
Total corporate subordinated debt1 951 951 0
Total corporate senior debt1 668 611 57
Total capital resources 8,915 9,051 (136)
Level 3 eligible capital 3,358 3,603 (245)
Level 3 eligible capital above MRR 1,887 2,195 (308)
Debt metrics and liquidity
Corporate gearing2 10% 9%
Interest cover (underlying) 10.7 times 9.2 times
Group cash (A$m) 516 181
Undrawn syndicated loan (A$m) 250 250
Level 3 eligible capital remains strong; well above
Minimum Regulatory Requirements (MRR)
Level 3 eligible capital above MRR (after 1H 17 interim
dividend) consists of A$802m related to life insurance
participating business and A$662m for the AMP
group’s other businesses
Reduction in Level 3 eligible capital above MRR is
largely due to on market share buy back and business
growth
Buy back paused as range of business growth
opportunities and changing regulatory requirements
considered
16 AMP Limited
Notes
1.For more detail see p27 of 1H 17 Investor Report.
2.Shown after accounting mismatches, cashflow hedge resources and other adjustments. For more detail see p27 of 1H 17 Investor Report.

Financial overview – 1H 17 movement in regulatory capital above MRR
Reduction in Level 3 eligible capital above MRR is due to:
$200m on market share buyback
$180m to support business growth including:
1. Strong growth in AMP Bank including strengthened regulatory
capital requirements
2. Investment of ~$50m in practice equity and client advice registers
3. Strong AUM growth resulting from positive investment markets and
good net cashflows.
$52m of negative market related impacts
$140m of other impacts, including tax adjustments relating to the netting
of deferred tax balances arising in AMP Life.
Reinsurance agreement to release up to $500m from AMP Life in 2H 17,
subject to regulatory approval. Options for this capital include:
- Further purchases of advice registers and practice equity investments
- Modest inorganic opportunities in AMP Capital, Advice & SMSF
- Accelerating the growth of AMP Bank
- Recommencing the on market share buyback
17 AMP Limited
2,1952,340
1,887
145
533
(200)(414)
(180) (52)(140)
0
500
1,000
1,500
2,000
2,500
3,000

Level 3 Eligible Capital above MRR
18 AMP Limited
1,703
1,943
2,322
1,917 1,887
0
500
1000
1500
2000
2500
1H13 1H14 1H15 1H16 1H17
$ m
illio
ns
Surplus above MRR
2.12.2
2.6
2.42.3
0
0.5
1
1.5
2
2.5
3
1H13 1H14 1H15 1H16 1H17
$ m
illio
ns
MRR Ratio
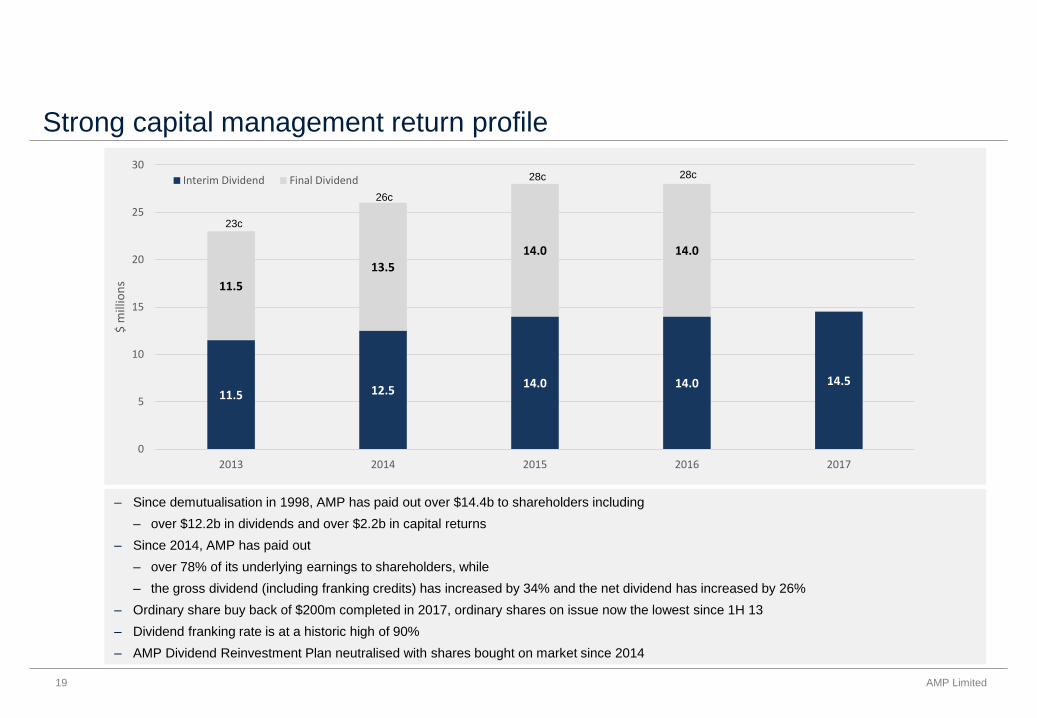
Strong capital management return profile
4040 40
40 40
40 40
– Since demutualisation in 1998, AMP has paid out over $14.4b to shareholders including
– over $12.2b in dividends and over $2.2b in capital returns
– Since 2014, AMP has paid out
– over 78% of its underlying earnings to shareholders, while
– the gross dividend (including franking credits) has increased by 34% and the net dividend has increased by 26%
– Ordinary share buy back of $200m completed in 2017, ordinary shares on issue now the lowest since 1H 13
– Dividend franking rate is at a historic high of 90%
– AMP Dividend Reinvestment Plan neutralised with shares bought on market since 2014
19 AMP Limited
11.5 12.514.0 14.0 14.5
11.5
13.5
14.0 14.0
0
5
10
15
20
25
30
2013 2014 2015 2016 2017
$ m
illio
ns
Interim Dividend Final Dividend
23c
26c
28c 28c
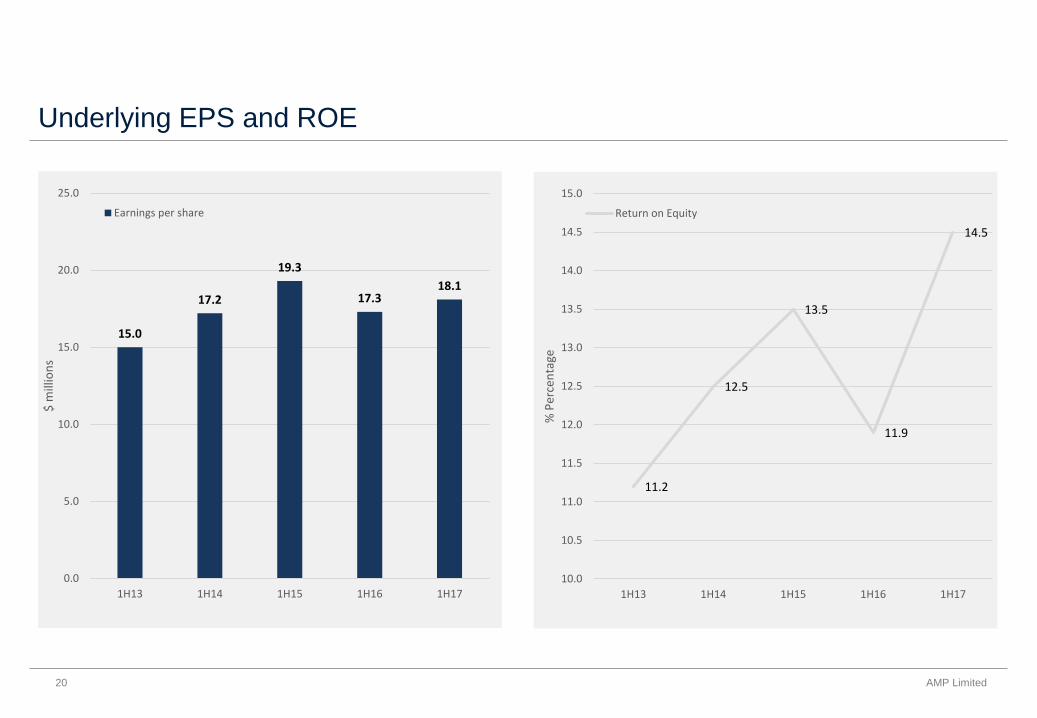
Underlying EPS and ROE
20 AMP Limited
15.0
17.2
19.3
17.318.1
0.0
5.0
10.0
15.0
20.0
25.0
1H13 1H14 1H15 1H16 1H17
$ m
illio
ns
Earnings per share
11.2
12.5
13.5
11.9
14.5
10.0
10.5
11.0
11.5
12.0
12.5
13.0
13.5
14.0
14.5
15.0
1H13 1H14 1H15 1H16 1H17
% P
erce
nta
ge
Return on Equity

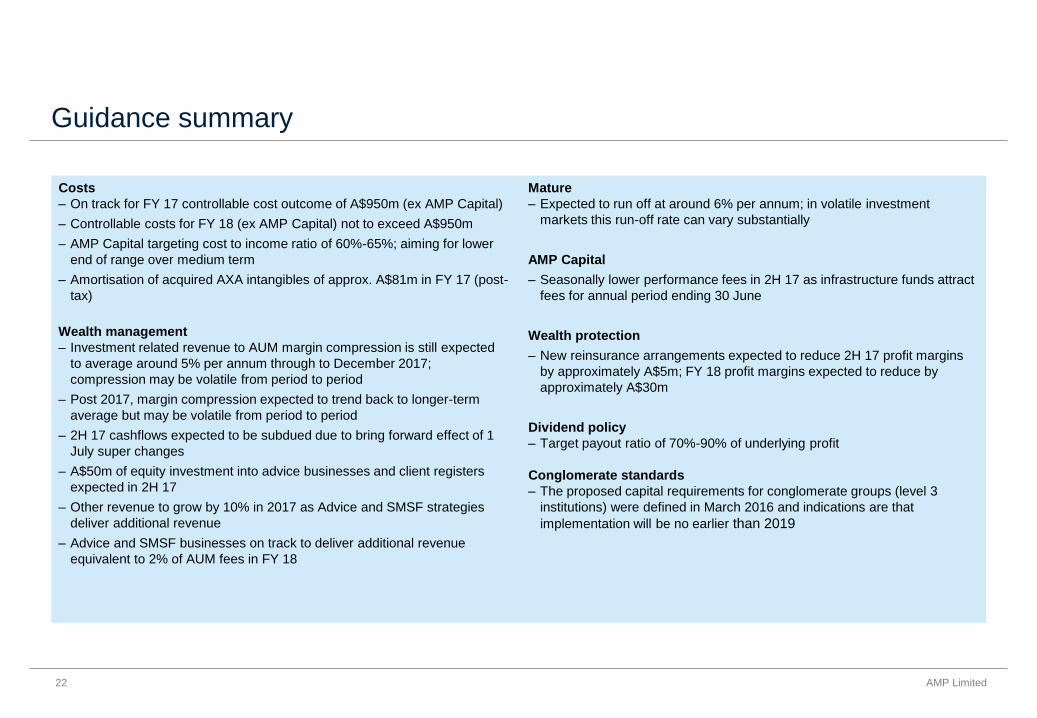
Guidance summary
Costs
– On track for FY 17 controllable cost outcome of A$950m (ex AMP Capital)
– Controllable costs for FY 18 (ex AMP Capital) not to exceed A$950m
– AMP Capital targeting cost to income ratio of 60%-65%; aiming for lower
end of range over medium term
– Amortisation of acquired AXA intangibles of approx. A$81m in FY 17 (post-
tax)
Wealth management
– Investment related revenue to AUM margin compression is still expected
to average around 5% per annum through to December 2017;
compression may be volatile from period to period
– Post 2017, margin compression expected to trend back to longer-term
average but may be volatile from period to period
– 2H 17 cashflows expected to be subdued due to bring forward effect of 1
July super changes
– A$50m of equity investment into advice businesses and client registers
expected in 2H 17
– Other revenue to grow by 10% in 2017 as Advice and SMSF strategies
deliver additional revenue
– Advice and SMSF businesses on track to deliver additional revenue
equivalent to 2% of AUM fees in FY 18
Mature
– Expected to run off at around 6% per annum; in volatile investment
markets this run-off rate can vary substantially
AMP Capital
– Seasonally lower performance fees in 2H 17 as infrastructure funds attract
fees for annual period ending 30 June
Wealth protection
– New reinsurance arrangements expected to reduce 2H 17 profit margins
by approximately A$5m; FY 18 profit margins expected to reduce by
approximately A$30m
Dividend policy
– Target payout ratio of 70%-90% of underlying profit
Conglomerate standards
– The proposed capital requirements for conglomerate groups (level 3
institutions) were defined in March 2016 and indications are that
implementation will be no earlier than 2019
22 AMP Limited

AMP Group - strong history of cost control
23 AMP Limited
494 490 484 471 473
489 494 483470
60
0
100
200
300
400
500
600
700
800
900
1000
1100
2013 2014 2015 2016 1H 17
$ m
illio
ns
1H Total Controllable Costs 2H Total Controllable Costs Restructuring costs
65.2%
63.0%
61.1%
62.1%
56.6%
52%
54%
56%
58%
60%
62%
64%
66%
2013 2014 2015 2016 1H 17
Pe
rce
nta
ge
AMP Group (excl AMP Capital) AMP Capital Cost to income ratio1
Notes
1.AMP Capital targets a cost to income ratio of 60-65% over the medium term

AMP’s growth businesses
AMP Australian Wealth Management
AMP Bank
AMP Capital
24 AMP Limited
75
95
115
135
155
175
195
215
20
40
60
80
100
120
140
1H14 1H15 1H16 1H17
Average AUM - $ billion (LHS) Operating Earnings - $ million (RHS)
0
10
20
30
40
50
60
70
0
5
10
15
20
1H14 1H15 1H16 1H17
Total Loans - $ billion (LHS) Operating Earnings - $ million (RHS)
0
20
40
60
80
100
0
50
100
150
200
1H14 1H15 1H16 1H17
Average AUM - $ billion (LHS)
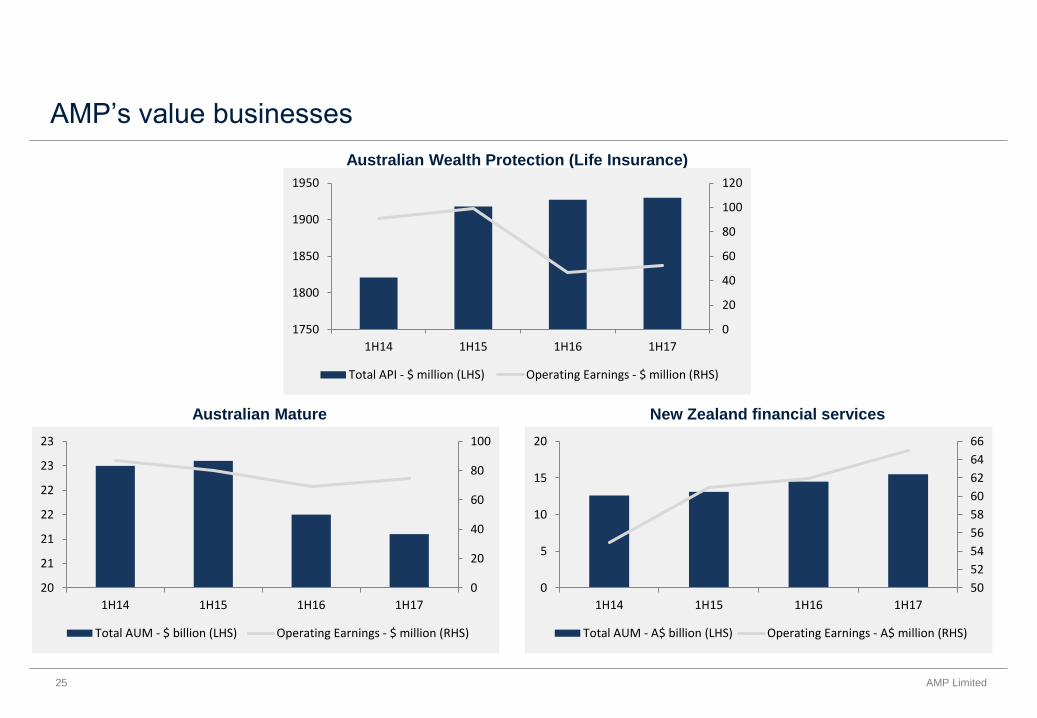
AMP’s value businesses
Australian Mature New Zealand financial services
Australian Wealth Protection (Life Insurance)
25 AMP Limited
0
20
40
60
80
100
20
21
21
22
22
23
23
1H14 1H15 1H16 1H17
Total AUM - $ billion (LHS) Operating Earnings - $ million (RHS)
50
52
54
56
58
60
62
64
66
0
5
10
15
20
1H14 1H15 1H16 1H17
Total AUM - A$ billion (LHS) Operating Earnings - A$ million (RHS)
0
20
40
60
80
100
120
1750
1800
1850
1900
1950
1H14 1H15 1H16 1H17
Total API - $ million (LHS) Operating Earnings - $ million (RHS)

AMP Group Leadership TeamAMP Group Leadership Team
26 AMP Limited
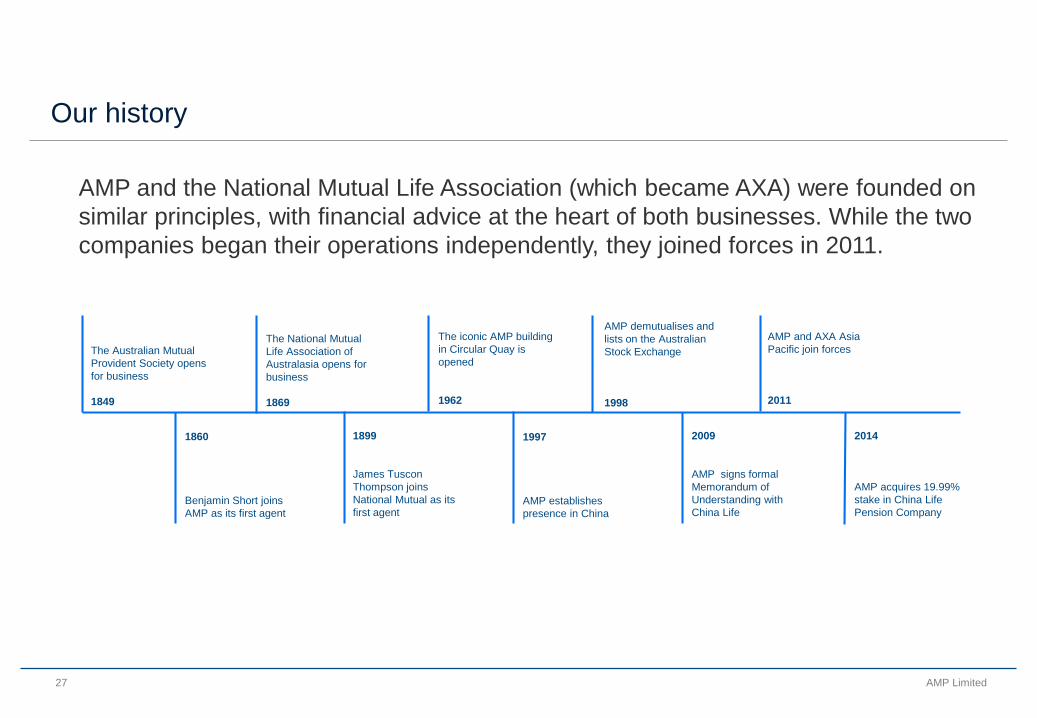
Our history
AMP and the National Mutual Life Association (which became AXA) were founded on
similar principles, with financial advice at the heart of both businesses. While the two
companies began their operations independently, they joined forces in 2011.
27 AMP Limited
1860
Benjamin Short joins
AMP as its first agent
The Australian Mutual
Provident Society opens
for business
1849
The National Mutual
Life Association of
Australasia opens for
business
1869
1899
James Tuscon
Thompson joins
National Mutual as its
first agent
The iconic AMP building
in Circular Quay is
opened
1962
1997
AMP establishes
presence in China
AMP demutualises and
lists on the Australian
Stock Exchange
1998
2009
AMP signs formal
Memorandum of
Understanding with
China Life
AMP and AXA Asia
Pacific join forces
2011
2014
AMP acquires 19.99%
stake in China Life
Pension Company

Sponsored ADR Program
AMP Limited maintains a sponsored Level 1 ADR program in the US. The ADRs trade on the over-the-counter market in the US
(OTC Markets).
ADR program details are as follows:
Ticker symbol AMLYY
CUSIP 0017EP202
Ratio 1 ADR : 4 Ordinary Shares
ADR depositary Deutsche Bank
Share price information www.otcmarkets.com or www.adr.db.com
Please contact the Deutsche Bank’s dedicated ADR broker desks:
Michael Tompkins (New York) Sven Haase (London) Xiaole Zhao (Hong Kong)
Tel: +1 212 250 1809 Tel: +44 20 754 58661 Tel: +852 22037854
Email: [email protected] Email: [email protected]@db.com Email: [email protected]
28 AMP Limited

Important disclaimer
Forward-looking statements in this presentation are based on AMP’s current views and assumptions and involve known and unknown
risks and uncertainties, many of which are beyond AMP’s control and could cause actual results, performance or events to differ materially
from those expressed or implied. These forward-looking statements are not guarantees or representations of future performance, and
should not be relied upon as such.
AMP undertakes no obligation to update any forward-looking statement to reflect events or circumstances after the date of this
presentation, subject to disclosure requirements applicable to AMP.
Information and statements in this presentation do not constitute investment advice or a recommendation in relation to AMP or any
product or service offered by AMP or any of its subsidiaries and should not be relied upon for this purpose. Prior to making a decision in
relation to AMP’s securities, products or services, investors or potential investors should consider their own investment objectives,
financial situation and needs and obtain professional advice.
29 AMP Limited