journalism & media audio and podcasting fact sheet · the median wage in 2017 for news...
TRANSCRIPT

SEARCH
NUMBERS, FACTS AND TRENDS SHAPING YOUR WORLD ABOUT FOLLOW DONATE
Journalism & Media
MENU RESEARCH AREAS
FACT SHEET
JULY 12, 2018
Audio and Podcasting Fact Sheet
MORE FACT SHEETS: STATE OF THE NEWS MEDIA
The audio news sector in the United States is split by modes of delivery: traditional terrestrial (AM/FM) radio and
digital formats such as online radio and podcasting. While terrestrial radio reaches almost the entire U.S. population
and remains steady in its revenue, online radio and podcasting audiences have continued to grow over the past
decade. Explore the patterns and longitudinal data about audio and podcasting below. Data on other public radio
beyond podcasting are available in a separate fact sheet.
Audience
The audience for terrestrial radio remains steady and high: In 2017, 90% of Americans ages 12 and older listened to
terrestrial radio in a given week, according to Nielsen Media Research data published by the Radio Advertising
Bureau, a figure that has changed little since 2009.
Note: This and most data on the radio sector apply to all types of listening and do not break out news, except where
noted. Nielsen lists news/talk among the most listened-to radio formats; in 2017, the news/talk format earned 9.9%
of radio audiences during any 15-minute period during the day.
Weekly terrestrial radio listenership
% of Americans ages 12 and older who listen to terrestrial (AM/FM) radio in a givenweek
Year% of Americans ages 12 and older
who listen to terrestrial (AM/FM) radio in a given week
2009 92%
2010 92%
2011 93%
2012 92%
2013 92%
2014 91%
2015 91%
2016 91%
2017 90%
Source: Nielsen Audio RADAR 136, March 2018, publicly available via Radio Advertising Bureau.
PEW RESEARCH CENTER
MY ACCOUNT
Audience
Economics
Ownership
Find out more
Chart Share EmbedData

According to “The Infinite Dial” report by Edison Research and Triton Digital, the portion of the public listening to
online radio continues to grow. As of early 2018, 64% of Americans ages 12 and older had listened to online radio in
the past month, while 57% had listened in the past week. This is up slightly from 61% and 53%, respectively, in 2017,
continuing online radio’s steady year-over-year growth.
Online radio listenership
% of Americans ages 12 and older who have listened to online radio in the past ...Year Month Week
2007 20% 12%
2008 21% 13%
2009 27% 17%
2010 27% 17%
2011 34% 22%
2012 39% 29%
2013 45% 33%
2014 47% 36%
2015 53% 44%
2016 57% 50%
2017 61% 53%
2018 64% 57%
Note: Edison Research and Triton Digital's survey is conducted in January or February of every year. Online radio includes
listening to terrestrial (AM/FM) radio stations online and/or listening to streamed audio content available only on the
internet.
Source: Edison Research and Triton Digital, "The Infinite Dial 2018."
PEW RESEARCH CENTER
Online radio listening in cars, such as listening to AM/FM stations online or streaming other online audio, continues
its steady increase. In 2018, 44% of U.S. cellphone owners have ever listened to online radio in a car using a phone, up
from just 6% in 2010.
Online radio listenership in cars by cellphone owners
% of U.S. cellphone owners who have ever listened to online radio in a car using aphone
Year % of U.S. cellphone owners who have ever listened to online radio in a car using a phone
2010 6%
2011 11%
2012 17%
2013 21%
2014 26%
2015 35%
2016 37%
2017 40%
2018 44%
Note: Edison Research and Triton Digital's survey is conducted in January or February of every year. Online radio includes
listening to terrestrial (AM/FM) radio stations online and/or listening to streamed audio content available only on the
internet.
Source: Edison Research and Triton Digital, "The Infinite Dial 2018."
Chart Share EmbedData
Chart Share EmbedData

PEW RESEARCH CENTER
The percentage of podcast listeners in America has also substantially increased over the past decade. In 2018, 44% of
Americans ages 12 and older have ever listened to a podcast, according to Edison Research and Triton Digital survey
data, and 26% have listened to a podcast in the past month, up from just 9% in 2008. Furthermore, 17% of those 12
and older said they have listened to a podcast in the past week, up from 7% when this was first measured in 2013.
(The data in this chart, as well as in the subsequent chart about podcasts, are for all types of listening and do not
break out news programs.)
Podcast listenership
% of Americans ages 12 and older who have listened to a podcast ...Year Ever In the past month In the past week
2006 11%
2007 13%
2008 18% 9%
2009 22% 11%
2010 23% 12%
2011 25% 12%
2012 29% 14%
2013 27% 12% 7%
2014 30% 15% 8%
2015 33% 17% 10%
2016 36% 21% 13%
2017 40% 24% 15%
2018 44% 26% 17%
Note: Edison Research and Triton Digital's survey is conducted in January or February of every year. Monthly podcast
listening data were first reported in 2008; weekly podcast listening data were first reported in 2013.
Source: Edison Research and Triton Digital, "The Infinite Dial 2018."
PEW RESEARCH CENTER
The average weekly unique users who download NPR podcasts, which include some of the most popular podcasts in
the iTunes library such as Up First and Planet Money, rose from 3.5 million in 2016 to 5.4 million in 2017, according
to NPR data from Splunk. (More information about public media is available in the public broadcasting fact sheet.)
NPR podcast users
Average weekly unique users who download NPR podcasts Year Average weekly unique users who download NPR podcasts
2014 2,000,000
2015 2,500,000
2016 3,538,004
2017 5,401,231
Source: NPR, based on podcast weekly users data via Splunk, 2017.
PEW RESEARCH CENTER
Chart Share EmbedData
Chart Share EmbedData
Economics
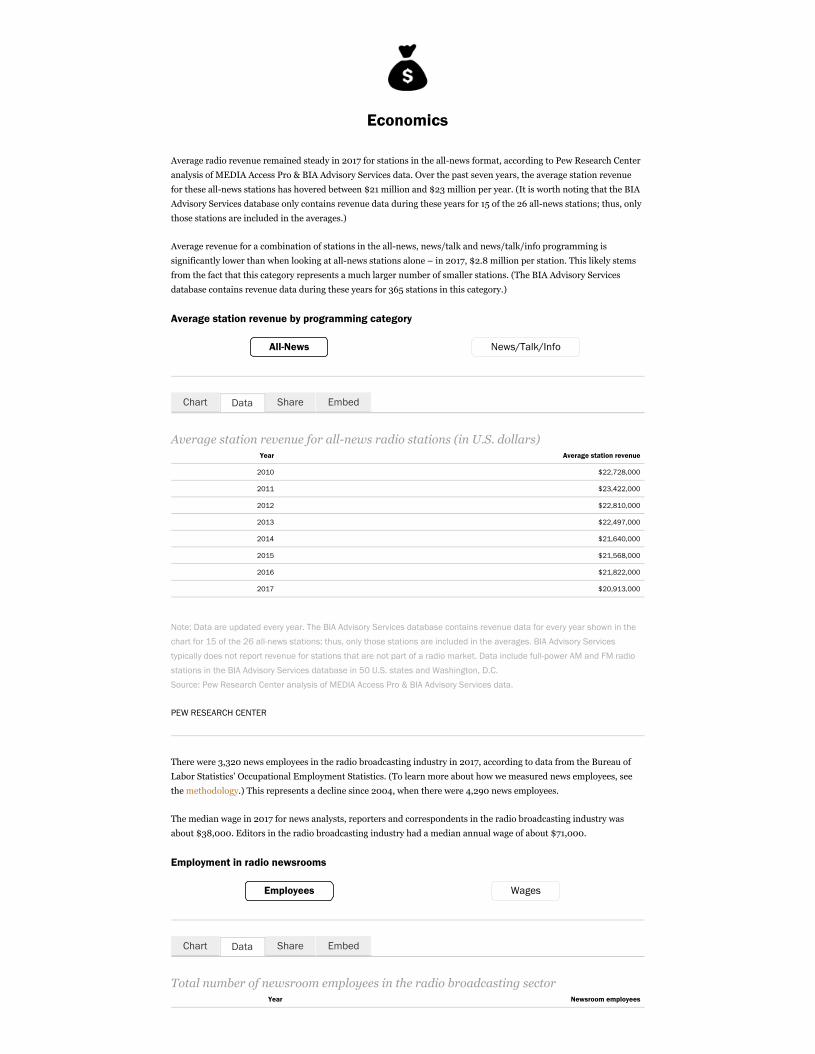
Average radio revenue remained steady in 2017 for stations in the all-news format, according to Pew Research Center
analysis of MEDIA Access Pro & BIA Advisory Services data. Over the past seven years, the average station revenue
for these all-news stations has hovered between $21 million and $23 million per year. (It is worth noting that the BIA
Advisory Services database only contains revenue data during these years for 15 of the 26 all-news stations; thus, only
those stations are included in the averages.)
Average revenue for a combination of stations in the all-news, news/talk and news/talk/info programming is
significantly lower than when looking at all-news stations alone – in 2017, $2.8 million per station. This likely stems
from the fact that this category represents a much larger number of smaller stations. (The BIA Advisory Services
database contains revenue data during these years for 365 stations in this category.)
Average station revenue by programming category
All-News News/Talk/Info
Average station revenue for all-news radio stations (in U.S. dollars)Year Average station revenue
2010 $22,728,000
2011 $23,422,000
2012 $22,810,000
2013 $22,497,000
2014 $21,640,000
2015 $21,568,000
2016 $21,822,000
2017 $20,913,000
Note: Data are updated every year. The BIA Advisory Services database contains revenue data for every year shown in the
chart for 15 of the 26 all-news stations; thus, only those stations are included in the averages. BIA Advisory Services
typically does not report revenue for stations that are not part of a radio market. Data include full-power AM and FM radio
stations in the BIA Advisory Services database in 50 U.S. states and Washington, D.C.
Source: Pew Research Center analysis of MEDIA Access Pro & BIA Advisory Services data.
PEW RESEARCH CENTER
There were 3,320 news employees in the radio broadcasting industry in 2017, according to data from the Bureau of
Labor Statistics’ Occupational Employment Statistics. (To learn more about how we measured news employees, see
the methodology.) This represents a decline since 2004, when there were 4,290 news employees.
The median wage in 2017 for news analysts, reporters and correspondents in the radio broadcasting industry was
about $38,000. Editors in the radio broadcasting industry had a median annual wage of about $71,000.
Employment in radio newsrooms
Employees Wages
Total number of newsroom employees in the radio broadcasting sectorYear Newsroom employees
Chart Share EmbedData
Chart Share EmbedData

Year Newsroom employees
2004 4,290
2005 4,000
2006 4,320
2007 4,140
2008 4,570
2009 4,330
2010 4,100
2011 3,540
2012 3,610
2013 3,700
2014 3,820
2015 3,380
2016 3,190
2017 3,320
Note: The OES survey is designed to produce estimates by combining data collected over a three-year period. Newsroom
employees include news analysts, reporters and correspondents; editors; photographers; and television, video and motion
picture camera operators and editors.
Source: Pew Research Center analysis of Bureau of Labor Statistics Occupational Employment Statistics.
PEW RESEARCH CENTER
Ownership
As of 2018, there were 26 AM or FM stations listed as “all-news” in the BIA Advisory Services database of radio
stations. Entercom (which merged with CBS Corp. last year) is currently the parent company of 10 of these 26
stations.
Ownership of all-news radio stations
Number of all-news stations, by parent companyCall 2014 2015 2016 2017
Entercom 0 0 0 10
CBS Corp. 10 10 10 0
Hubbard Broadcasting Inc. 3 3 3 3
Cox Media Group 2 2 2 2
Neal Ardman 2 2 2 2
Sinclair Broadcast Group Inc. 2 2 2 2
Cumulus Media Inc. 2 2 2 1
Genesis Communications Network 2 2 1 0
Talking Stick Communications LLC 1 1 1 1
Paskvan Media Inc. 1 1 1 1
CC Media Holdings Inc. 0 1 1 1
Jet Broadcasting Inc. 0 0 1 1
MultiCultural Radio Broadcasting Inc. 0 0 0 1
Storm Front Communications LLC 0 0 0 1
Radio Free Moscow Inc. 1 1 1 0
Chart Share EmbedData

Call 2014 2015 2016 2017
Calvary Inc. 1 1 1 0
Times-Shamrock Communications 1 1 1 0
Note: Data include full-power AM and FM radio stations in the BIA Advisory Services database in 50 U.S. states and
Washington, D.C. Entercom and CBS Radio merged in 2017.
Source: Pew Research Center analysis of MEDIA Access Pro & BIA Advisory Services data.
PEW RESEARCH CENTER
Find out more
This fact sheet was compiled by Research Associate Elisa Shearer.
Read the methodology.
Find more in-depth explorations of audio and podcasting by following the links below:
Public Broadcasting Fact Sheet, June 6, 2018
Covering President Trump in a Polarized Media Environment, Oct. 2, 2017
Americans’ online news use is closing in on TV news use, Sept. 7, 2017
Trump, Clinton Voters Divided in Their Main Source for Election News, Jan. 18, 2017


SEARCH
NUMBERS, FACTS AND TRENDS SHAPING YOUR WORLD ABOUT FOLLOW DONATE
Journalism & Media
MENU RESEARCH AREAS
FACT SHEET
JULY 25, 2018
Cable News Fact Sheet
MORE FACT SHEETS: STATE OF THE NEWS MEDIA
Cable TV is home to a set of television channels whose news broadcasts have become an important information
source for many Americans. In 2017, however, the evening news audience declined while the daytime audience
remained stable. Financially, these channels have set themselves apart from other news media with their
comparatively robust business model. Explore the patterns and longitudinal data about cable news below.
Audience
According to comScore TV Essentials® data, viewership declined for the three major cable news channels (CNN, Fox
News and MSNBC) in 2017. The average audience (defined as the average number of TVs tuned to a program
throughout a time period) for the evening news time slot (8 p.m. to 11 p.m.) of these three networks declined 12%, to
about 1.2 million. (Audience data for the three major financial networks – CNBC, Fox Business and Bloomberg – are
not included here.) The average audience for the daytime time slot (6 a.m. to 6 p.m.) remained relatively stable.
Average audience for cable TV news
Average number of TVs tuning to news programming during each time slot for CNN,Fox News and MSNBC
Year 2016 2017
Daytimenews 794,979 784,088
Eveningnews 1,311,210 1,154,876
Note: Numbers represent CNN, Fox News and MSNBC for the full year and include live viewership only. Average audience is
the average number of TVs tuned to an entity throughout the selected time frame. It is calculated by dividing the total hours
viewed by the length of the time frame (in hours). National news is defined as any telecast that has been flagged by
comScore (either by notification from clients, or from standard processes) as being a news-based program airing at
approximately the same time across a majority of markets. The evening news time slot is defined as prime news by
comScore and includes newscasts that air from 8 p.m. to 11 p.m.; the daytime news time slot includes newscasts that air
from 6 a.m. to 6 p.m.
Source: comScore TV Essentials , 2016 and 2017, U.S.
PEW RESEARCH CENTER
In 2018, Pew Research Center began using data from comScore TV Essentials for this audience analysis, and as such,
the current fact sheet includes figures for only the past two years. Previous versions of this fact sheet included data
stretching back to 2007 and used data from Nielsen Media Research. Those data are available in the 2017 archived
MY ACCOUNT
Audience
Economics
Newsroom investment
Find out more
Chart Share EmbedData
®
®
fact sheet. Because of various differences between the two sets of data points, figures from prior years are not directly
comparable with the data shown here.
Economics
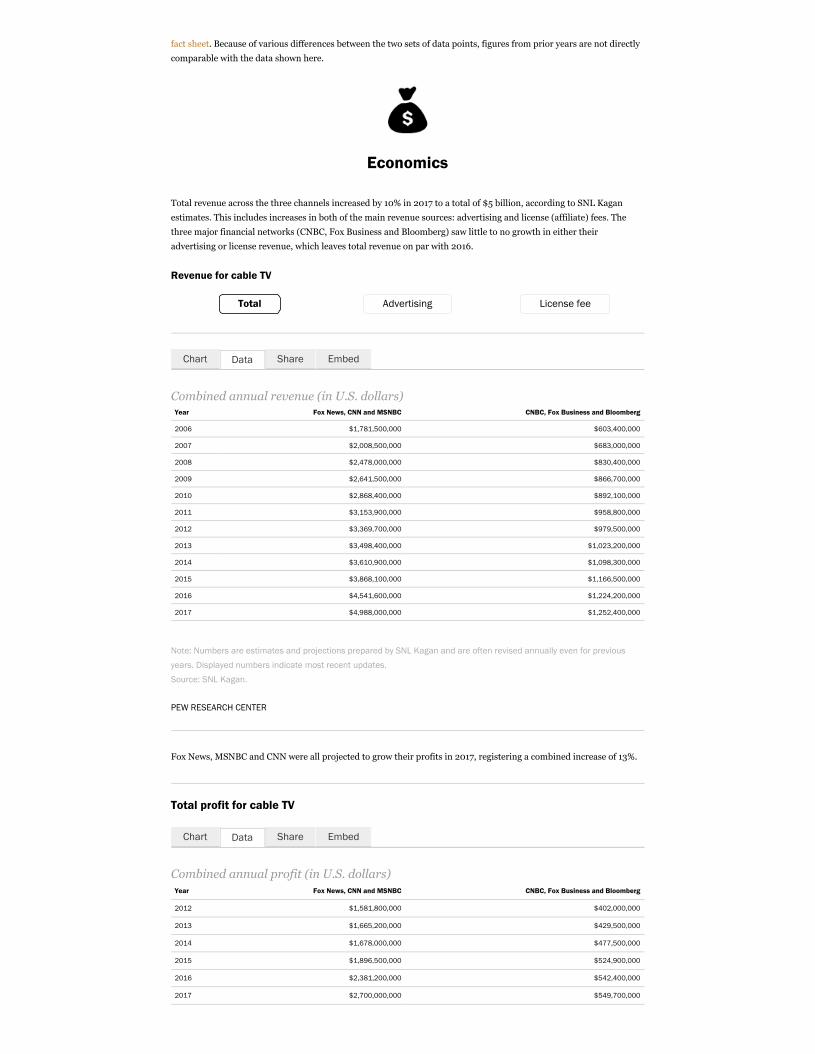
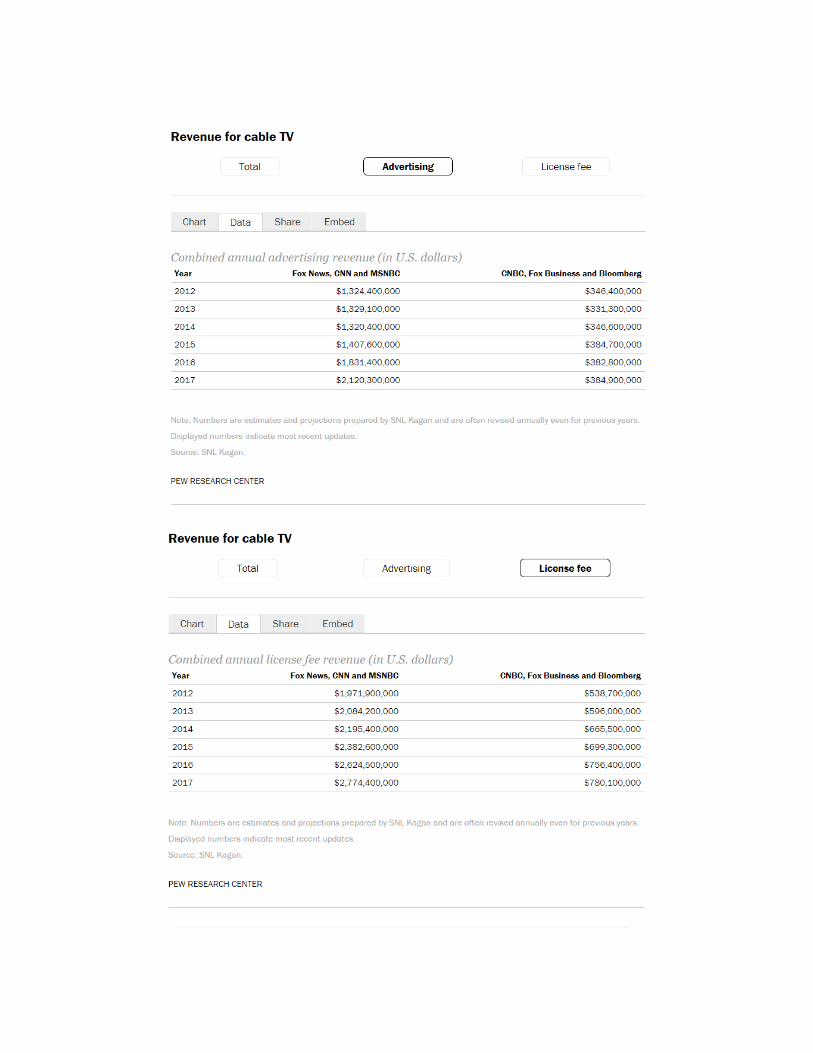
Total revenue across the three channels increased by 10% in 2017 to a total of $5 billion, according to SNL Kagan
estimates. This includes increases in both of the main revenue sources: advertising and license (affiliate) fees. The
three major financial networks (CNBC, Fox Business and Bloomberg) saw little to no growth in either their
advertising or license revenue, which leaves total revenue on par with 2016.
Revenue for cable TV
Total Advertising License fee
Combined annual revenue (in U.S. dollars)Year Fox News, CNN and MSNBC CNBC, Fox Business and Bloomberg
2006 $1,781,500,000 $603,400,000
2007 $2,008,500,000 $683,000,000
2008 $2,478,000,000 $830,400,000
2009 $2,641,500,000 $866,700,000
2010 $2,868,400,000 $892,100,000
2011 $3,153,900,000 $958,800,000
2012 $3,369,700,000 $979,500,000
2013 $3,498,400,000 $1,023,200,000
2014 $3,610,900,000 $1,098,300,000
2015 $3,868,100,000 $1,166,500,000
2016 $4,541,600,000 $1,224,200,000
2017 $4,988,000,000 $1,252,400,000
Note: Numbers are estimates and projections prepared by SNL Kagan and are often revised annually even for previous
years. Displayed numbers indicate most recent updates.
Source: SNL Kagan.
PEW RESEARCH CENTER
Fox News, MSNBC and CNN were all projected to grow their profits in 2017, registering a combined increase of 13%.
Total profit for cable TV
Combined annual profit (in U.S. dollars)Year Fox News, CNN and MSNBC CNBC, Fox Business and Bloomberg
2012 $1,581,800,000 $402,000,000
2013 $1,665,200,000 $429,500,000
2014 $1,678,000,000 $477,500,000
2015 $1,896,500,000 $524,900,000
2016 $2,381,200,000 $542,400,000
2017 $2,700,000,000 $549,700,000
Chart Share EmbedData
Chart Share EmbedData

Note: Numbers are estimates and projections prepared by SNL Kagan and are often revised annually even for previous
years. Displayed numbers indicate most recent updates.
Source: SNL Kagan.
PEW RESEARCH CENTER
Newsroom investment
Total newsroom spending by the three channels combined increased by 6% in 2017 to a total of $2.3 billion, according
to estimates by SNL Kagan. Newsroom spending at the three major financial networks was $703 million, a 3%
change.
Newsroom spending for cable TV
Combined newsroom spending (in U.S. dollars)Year Fox News, CNN and MSNBC CNBC, Fox Business and Bloomberg
2006 $1,225,400,000 $292,400,000
2007 $1,303,500,000 $400,500,000
2008 $1,417,500,000 $478,100,000
2009 $1,423,500,000 $472,200,000
2010 $1,525,700,000 $505,100,000
2011 $1,649,700,000 $538,600,000
2012 $1,787,900,000 $577,600,000
2013 $1,833,200,000 $593,700,000
2014 $1,932,900,000 $620,800,000
2015 $1,971,600,000 $641,600,000
2016 $2,160,400,000 $681,800,000
2017 $2,287,900,000 $702,700,000
Note: Numbers are estimates and projections prepared by SNL Kagan and are often revised annually even for previous
years. Displayed numbers indicate most recent updates.
Source: SNL Kagan.
PEW RESEARCH CENTER
About 2,900 employees worked as reporters, editors, photographers, camera operators and film and video editors in
cable TV newsrooms in 2017, according to data from the Bureau of Labor Statistics’ Occupational Employment
Statistics. This is on par with 2004 – in spite of fluctuations over the last 14 years – but is up 33% from 2014 when
about 2,200 people worked in cable TV newsrooms.
The median wage for editors was about $63,000 per year in 2017, followed by reporters at about $55,000 and
photographers at about $48,000. Data were not available in 2017 for camera operators and film and video editors.
Employment in cable TV newsrooms
Employees Wages
Chart Share EmbedData
Chart Share EmbedData

Total number of newsroom employees in the cable TV sector Year Total
2004 2,950
2005 3,110
2006 2,700
2007 2,820
2008 2,830
2009 3,260
2010 2,590
2011 2,190
2012 2,150
2013 2,720
2014 2,210
2015 2,760
2016 2,560
2017 2,940
Note: The OES survey is designed to produce estimates by combining data collected over a three-year period. Newsroom
employees include news analysts, reporters and correspondents; editors; photographers; and television, video and motion
picture camera operators and editors.
Source: Pew Research Center analysis of Bureau of Labor Statistics Occupational Employment Statistics data.
PEW RESEARCH CENTER
Find out more
This fact sheet was compiled by Senior Writer/Editor Elizabeth Grieco.
Read the methodology.
Find more in-depth explorations of cable news by following the links below:
Fewer Americans rely on TV news; what type they watch varies by who they are, Jan. 5, 2018
Trump, Clinton Voters Divided in Their Main Source for Election News, Jan. 18, 2017
The Modern News Consumer, July 7, 2016


SEARCH
NUMBERS, FACTS AND TRENDS SHAPING YOUR WORLD ABOUT FOLLOW DONATE
Journalism & Media
MENU RESEARCH AREAS
FACT SHEET
JUNE 6, 2018
Digital News Fact Sheet
MORE FACT SHEETS: STATE OF THE NEWS MEDIA
A vast majority of adults in the United States get at least some news online (either via a mobile device or desktop/laptop), and the online space has become a host for the digital homes of both legacy news outlets and new, “born on the web” news outlets.** Digital advertising revenue across all digital entities (beyond just news) continues to grow,
with technology companies playing a large role in the flow of both news and revenue. Explore the patterns and
longitudinal data about digital news below.
Audience
CORRECTION: This fact sheet was updated on June 19, 2018 to correct the source notes in the charts for uniquevisitors and visit duration. Those data were misattributed to an audit of the news outlets with the highest traffic.The charts use data on those outlets from comScore.
While online news includes the digital operations of many so-called “legacy” news organizations (those that
originated in print or broadcast), this audience section presents data about digital-native news publishers – those
originally founded on the web. (Data on the digital operations of legacy media outlets are included in other fact
sheets where available.)
The digital-native news outlets included in this analysis are those whose primary domain – the outlet’s flagship
website – averaged at least 10 million unique visitors per month from October-December of each year analyzed,
according to comScore, a cross-platform audience measurement company. There were 35 such outlets in 2017 (for a
full list of outlets and collection methods, see the methodology).
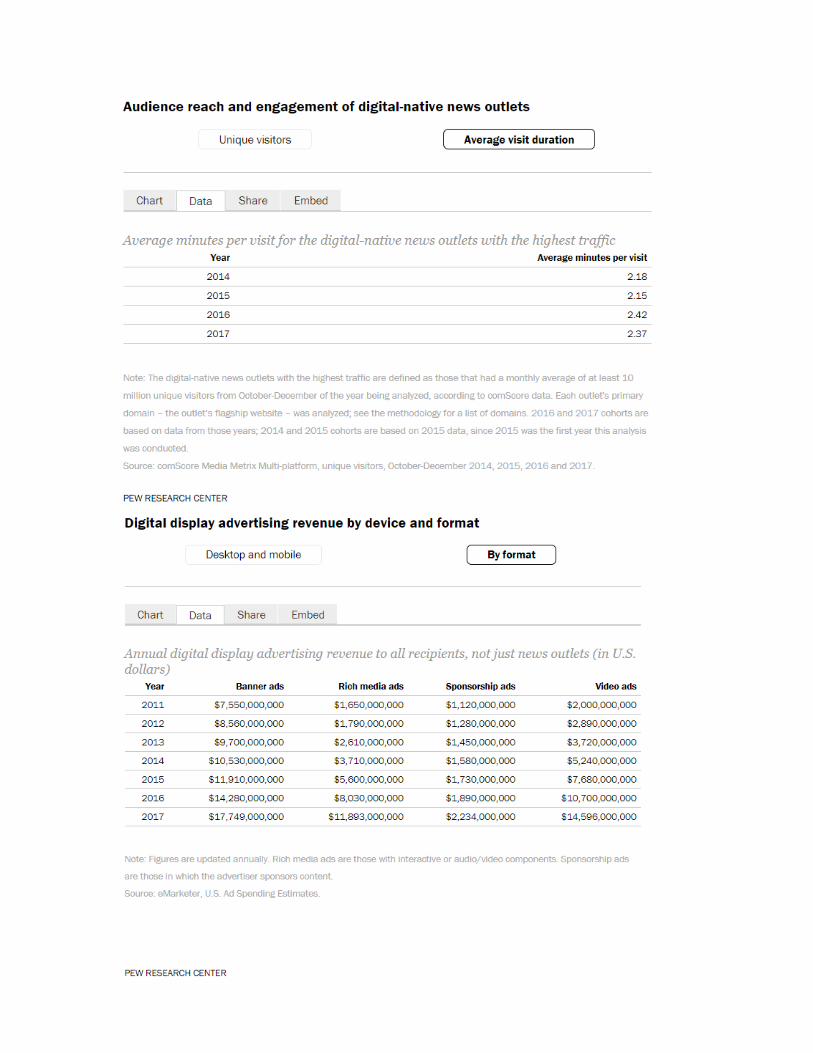
The average fourth quarter, monthly unique visitors for the primary domains of these outlets decreased 5% in 2017 to
22 million, compared with 23 million in 2016, according to comScore data. The average minutes per visit was 2.4
minutes, on par with 2016.
Audience reach and engagement of digital-native news outlets
Unique visitors Average visit duration
Average number of monthly unique visitors for the digital-native news outlets with thehighest traffic
Year Average monthly unique visitors
2014 18,978,777
2015 20,351,765
2016 22,805,209
2017 21,711,285
MY ACCOUNT
Audience
Economics
Newsroom investment
Find out more
Chart Share EmbedData
** (November 2019): We have removed a previously posted data point from this sentence because of methodological concerns about measuring total online news use using an online panel.
Note: The digital-native news outlets with the highest traffic are defined as those that had a monthly average of at least 10
million unique visitors from October-December of the year being analyzed, according to comScore data. Each outlet's
primary domain – the outlet’s flagship website – was analyzed; see the methodology for a list of domains. 2016 and 2017
cohorts are based on data from those years; 2014 and 2015 cohorts are based on 2015 data, since 2015 was the first
year this analysis was conducted.
Source: comScore Media Metrix Multi-platform, unique visitors, October-December 2014, 2015, 2016 and 2017.
PEW RESEARCH CENTER
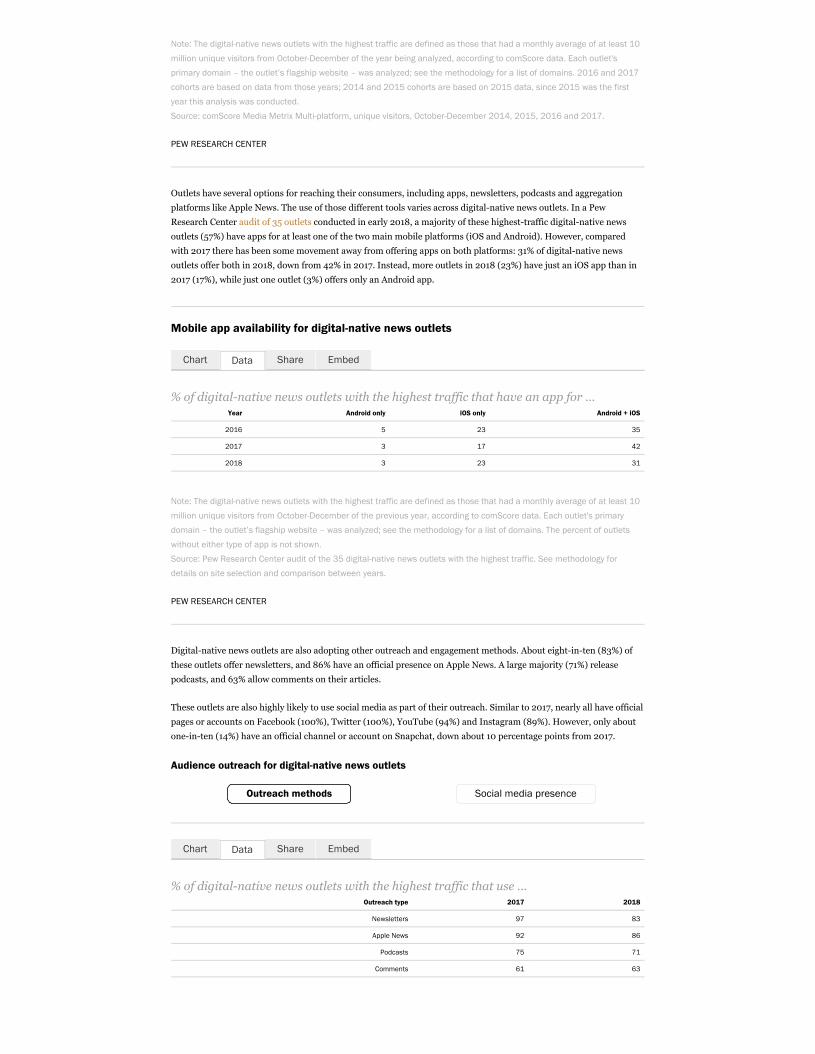
Outlets have several options for reaching their consumers, including apps, newsletters, podcasts and aggregation
platforms like Apple News. The use of those different tools varies across digital-native news outlets. In a Pew
Research Center audit of 35 outlets conducted in early 2018, a majority of these highest-traffic digital-native news
outlets (57%) have apps for at least one of the two main mobile platforms (iOS and Android). However, compared
with 2017 there has been some movement away from offering apps on both platforms: 31% of digital-native news
outlets offer both in 2018, down from 42% in 2017. Instead, more outlets in 2018 (23%) have just an iOS app than in
2017 (17%), while just one outlet (3%) offers only an Android app.
Mobile app availability for digital-native news outlets
% of digital-native news outlets with the highest traffic that have an app for …Year Android only iOS only Android + iOS
2016 5 23 35
2017 3 17 42
2018 3 23 31
Note: The digital-native news outlets with the highest traffic are defined as those that had a monthly average of at least 10
million unique visitors from October-December of the previous year, according to comScore data. Each outlet's primary
domain – the outlet’s flagship website – was analyzed; see the methodology for a list of domains. The percent of outlets
without either type of app is not shown.
Source: Pew Research Center audit of the 35 digital-native news outlets with the highest traffic. See methodology for
details on site selection and comparison between years.
PEW RESEARCH CENTER
Digital-native news outlets are also adopting other outreach and engagement methods. About eight-in-ten (83%) of
these outlets offer newsletters, and 86% have an official presence on Apple News. A large majority (71%) release
podcasts, and 63% allow comments on their articles.
These outlets are also highly likely to use social media as part of their outreach. Similar to 2017, nearly all have official
pages or accounts on Facebook (100%), Twitter (100%), YouTube (94%) and Instagram (89%). However, only about
one-in-ten (14%) have an official channel or account on Snapchat, down about 10 percentage points from 2017.
Audience outreach for digital-native news outlets
Outreach methods Social media presence
% of digital-native news outlets with the highest traffic that use …Outreach type 2017 2018
Newsletters 97 83
Apple News 92 86
Podcasts 75 71
Comments 61 63
Chart Share EmbedData
Chart Share EmbedData

Note: The digital-native news outlets with the highest traffic are defined as those that had a monthly average of at least 10
million unique visitors from October-December of the previous year, according to comScore data. Each outlet's primary
domain – the outlet’s flagship website – was analyzed; see the methodology for a list of domains.
Source: Pew Research Center audit of the 35 digital-native news outlets with the highest traffic. See methodology for
details on site selection and comparison between years.
PEW RESEARCH CENTER
Economics
Digital advertising continues to grow as a proportion of total advertising revenue, a trend driven in large part by
growth in advertising on mobile devices. The estimates below are for all digital advertising revenue, not just for news
outlets, and thus are an indicator of the general direction of the economic health of the digital realm rather than the
digital news sector specifically. (There is no available economic data specifically for the digital-native news outlets
studied above.)
In 2017, according to eMarketer estimates, digital advertising grew to $90 billion, an increase from $72 billion in
2016. It was estimated to comprise 44% of all advertising revenue, up from 37% in 2016.
Digital and non-digital advertising revenue
Annual advertising revenue to all recipients, not just news outlets (in U.S. dollars)Year Non-digital advertising Digital advertising
2011 $124,821,360,000 $31,998,790,000
2012 $126,908,330,000 $36,820,240,000
2013 $126,215,710,000 $43,026,350,000
2014 $125,629,150,000 $49,688,350,000
2015 $123,091,720,000 $59,821,250,000
2016 $123,253,560,000 $71,596,390,000
2017 $116,948,742,000 $90,391,816,000
Note: Figures are updated annually.
Source: eMarketer, U.S. Ad Spending Estimates.
PEW RESEARCH CENTER
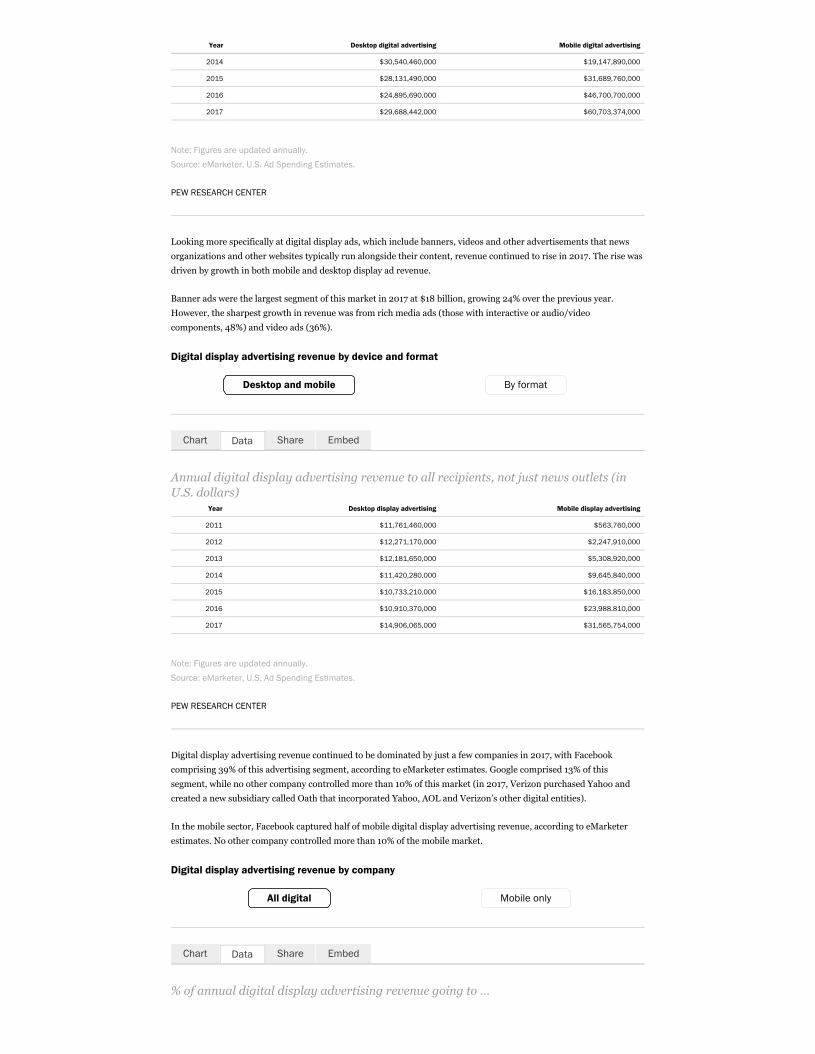
Mobile advertising revenue’s rapid growth continued in 2017, increasing from $47 billion in 2016 to $61 billion.
Although desktop advertising revenue also saw an increase in 2017, mobile advertising revenue comprised two thirds
of all digital advertising revenue.
Digital advertising revenue on desktop and mobile
Annual digital advertising revenue to all recipients, not just news outlets (in U.S.dollars)
Year Desktop digital advertising Mobile digital advertising
2011 $30,382,520,000 $1,616,270,000
2012 $31,971,450,000 $4,848,800,000
2013 $32,359,000,000 $10,667,350,000
Chart Share EmbedData
Chart Share EmbedData
Year Desktop digital advertising Mobile digital advertising
2014 $30,540,460,000 $19,147,890,000
2015 $28,131,490,000 $31,689,760,000
2016 $24,895,690,000 $46,700,700,000
2017 $29,688,442,000 $60,703,374,000
Note: Figures are updated annually.
Source: eMarketer, U.S. Ad Spending Estimates.
PEW RESEARCH CENTER
Looking more specifically at digital display ads, which include banners, videos and other advertisements that news
organizations and other websites typically run alongside their content, revenue continued to rise in 2017. The rise was
driven by growth in both mobile and desktop display ad revenue.
Banner ads were the largest segment of this market in 2017 at $18 billion, growing 24% over the previous year.
However, the sharpest growth in revenue was from rich media ads (those with interactive or audio/video
components, 48%) and video ads (36%).
Digital display advertising revenue by device and format
Desktop and mobile By format
Annual digital display advertising revenue to all recipients, not just news outlets (inU.S. dollars)
Year Desktop display advertising Mobile display advertising
2011 $11,761,460,000 $563,760,000
2012 $12,271,170,000 $2,247,910,000
2013 $12,181,650,000 $5,308,920,000
2014 $11,420,280,000 $9,645,840,000
2015 $10,733,210,000 $16,183,850,000
2016 $10,910,370,000 $23,988,810,000
2017 $14,906,065,000 $31,565,754,000
Note: Figures are updated annually.
Source: eMarketer, U.S. Ad Spending Estimates.
PEW RESEARCH CENTER
Digital display advertising revenue continued to be dominated by just a few companies in 2017, with Facebook
comprising 39% of this advertising segment, according to eMarketer estimates. Google comprised 13% of this
segment, while no other company controlled more than 10% of this market (in 2017, Verizon purchased Yahoo and
created a new subsidiary called Oath that incorporated Yahoo, AOL and Verizon’s other digital entities).
In the mobile sector, Facebook captured half of mobile digital display advertising revenue, according to eMarketer
estimates. No other company controlled more than 10% of the mobile market.
Digital display advertising revenue by company
All digital Mobile only
% of annual digital display advertising revenue going to …
Chart Share EmbedData
Chart Share EmbedData

Year Other Verizon Yahoo Amazon Twitter Oath Google FacebookYear Other Verizon Yahoo Amazon Twitter Oath Google Facebook
2014 45 4 6 0 4 0 16 25
2015 41 4 5 0 5 0 16 30
2016 40 3 4 0 4 0 14 35
2017 38 0 0 3 3 5 13 39
Note: Numbers may not add up to 100% due to rounding. From 2014-2016, Amazon was included in Other. In 2017,
Verizon purchased Yahoo and created a new subsidiary called Oath that incorporated Yahoo, AOL and Verizon's other
digital entities. Therefore Verizon and Yahoo are not broken out separately in 2017.
Source: eMarketer, U.S. Ad Spending Estimates.
PEW RESEARCH CENTER
Newsroom investment
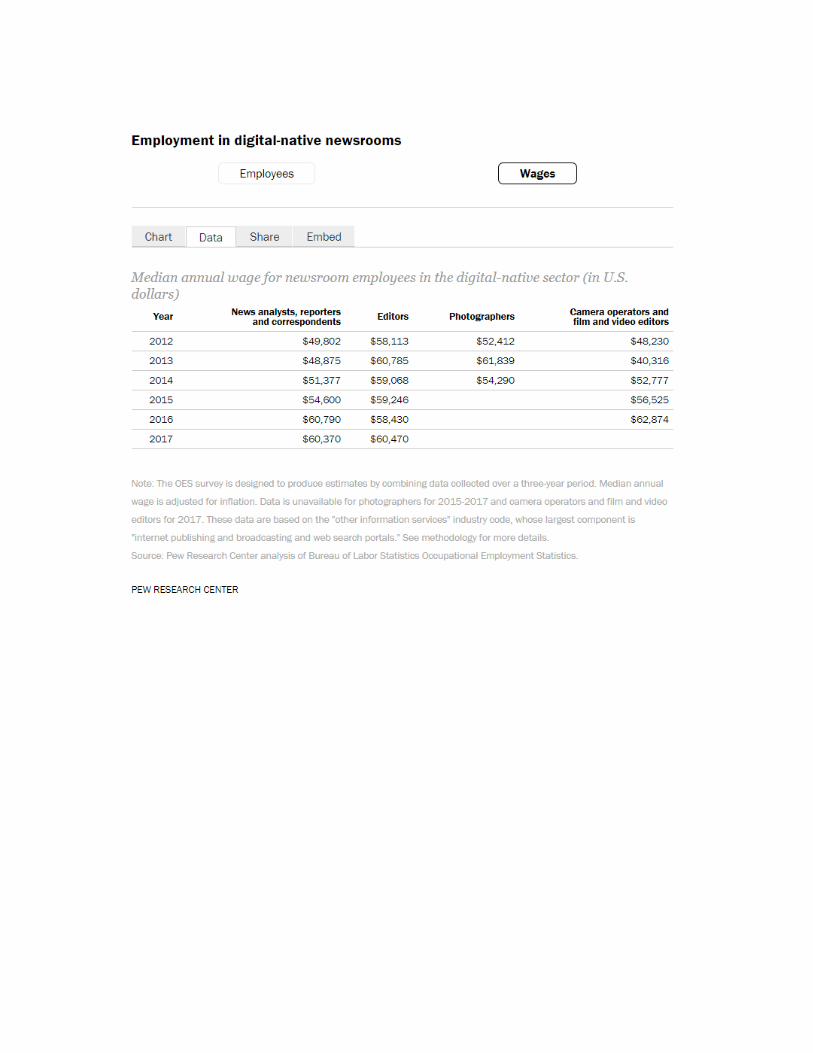
Roughly 13,000 employees worked as reporters, editors, photographers or videographers in the newsrooms of digital-
native outlets in 2017, according to data from the Bureau of Labor Statistics’ Occupational Employment Statistics.
(Digital-native newsroom employment and wage data are based on the “other information services” industry code,
whose largest component is “internet publishing and broadcasting and web search portals.” For details see the
methodology.) The median wage for reporters and editors was roughly $60,000 per year in 2017. (Data were not
available in 2017 for photographers or videographers.)
Employment in digital-native newsrooms
Employees Wages
Total number of newsroom employees in the digital-native sectorYear Newsroom employees
2008 7,400
2009 8,090
2010 8,090
2011 9,520
2012 10,750
2013 11,250
2014 11,180
2015 11,710
2016 12,830
2017 13,260
Note: The OES survey is designed to produce estimates by combining data collected over a three-year period. Newsroom
employees include news analysts, reporters and correspondents; editors; photographers; and television, video and motion
picture camera operators and editors. These data are based on the "other information services" industry code, whose
largest component is "internet publishing and broadcasting and web search portals." See methodology for more details.
Source: Pew Research Center analysis of Bureau of Labor Statistics Occupational Employment Statistics.
PEW RESEARCH CENTER
Chart Share EmbedData

Find out more
This fact sheet was compiled by Computational Social Scientist Galen Stocking.
Read the methodology.
Find more in-depth explorations of digital news by following the links below:
5 Facts about Americans and Facebook, April 10, 2018
Sources Shared on Twitter: A Case Study on Immigration, Jan. 29, 2018
Growth in mobile news use driven by older adults, June 12, 2017
Searching for News: The Flint Water Crisis, April 27, 2017
How Americans Encounter, Recall and Act Upon Digital News, Feb. 9, 2017
The Modern News Consumer, July 7, 2016

SEARCH
NUMBERS, FACTS AND TRENDS SHAPING YOUR WORLD ABOUT FOLLOW DONATE
Journalism & Media
MENU RESEARCH AREAS
FACT SHEET
JULY 25, 2018
Hispanic and African American NewsMedia Fact Sheet
MORE FACT SHEETS: STATE OF THE NEWS MEDIA
News media made by and for the two largest racial/ethnic minority groups in the United States – blacks and
Hispanics – have been a consistent part of the American news landscape. News media aimed at both of these groups
have seen recent declines in audience. Explore the patterns and longitudinal data about Hispanic- and black-oriented
news outlets below.
Audience
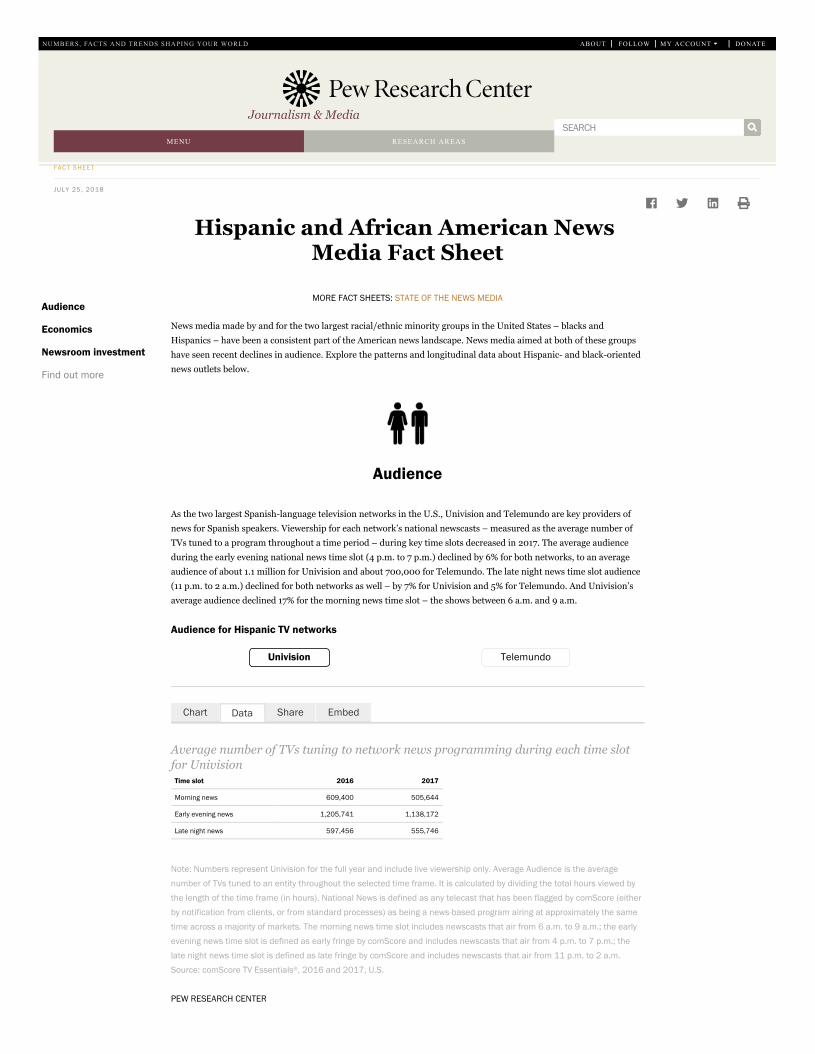
As the two largest Spanish-language television networks in the U.S., Univision and Telemundo are key providers of
news for Spanish speakers. Viewership for each network’s national newscasts – measured as the average number of
TVs tuned to a program throughout a time period – during key time slots decreased in 2017. The average audience
during the early evening national news time slot (4 p.m. to 7 p.m.) declined by 6% for both networks, to an average
audience of about 1.1 million for Univision and about 700,000 for Telemundo. The late night news time slot audience
(11 p.m. to 2 a.m.) declined for both networks as well – by 7% for Univision and 5% for Telemundo. And Univision’s
average audience declined 17% for the morning news time slot – the shows between 6 a.m. and 9 a.m.
Audience for Hispanic TV networks
Univision Telemundo
Average number of TVs tuning to network news programming during each time slotfor Univision
Time slot 2016 2017
Morning news 609,400 505,644
Early evening news 1,205,741 1,138,172
Late night news 597,456 555,746
Note: Numbers represent Univision for the full year and include live viewership only. Average Audience is the average
number of TVs tuned to an entity throughout the selected time frame. It is calculated by dividing the total hours viewed by
the length of the time frame (in hours). National News is defined as any telecast that has been flagged by comScore (either
by notification from clients, or from standard processes) as being a news-based program airing at approximately the same
time across a majority of markets. The morning news time slot includes newscasts that air from 6 a.m. to 9 a.m.; the early
evening news time slot is defined as early fringe by comScore and includes newscasts that air from 4 p.m. to 7 p.m.; the
late night news time slot is defined as late fringe by comScore and includes newscasts that air from 11 p.m. to 2 a.m.
Source: comScore TV Essentials , 2016 and 2017, U.S.
PEW RESEARCH CENTER
MY ACCOUNT
Audience
Economics
Newsroom investment
Find out more
Chart Share EmbedData
®

In 2018, Pew Research Center began using data from comScore TV Essentials and comScore StationView
Essentials for this audience analysis, and as such, the current fact sheet includes figures for only the past two years.
Previous versions of this fact sheet included data stretching back to 2013 and used data from Nielsen Media Research.
Those data are available in the 2017 archived fact sheet. Because of various differences between the two sets of data
points, figures from prior years are not directly comparable with the data shown here.
Both Univision and Telemundo have local affiliate stations that also carry their own original news programming. In
2017, average viewership for Univision affiliates’ late night news (11 p.m. to 2 a.m.) showed a large drop of 35%, while
early evening news (4 p.m. to 7 p.m.) viewership for Univision affiliates declined by 8%. Morning news for Univision
affiliates, which has far lower viewership overall, increased by 10%. Average viewership for Telemundo affiliates
during these time slots stayed somewhat steadier, with early evening news dropping 6%, late night news down 2%,
and morning news declining 11% in average audience.
Audience for Hispanic TV networks’ local affiliates
Univision Telemundo
Average number of TVs tuning to news programming during each time slot forUnivision affiliates
Time slot 2016 2017
Morning news 23,020 25,336
Early evening news 652,674 601,678
Late night news 353,686 231,519
Note: Numbers represent Univision affiliates for the full year and include live viewership only. Average Audience is the
average number of TVs tuned to an entity throughout the selected time frame. It is calculated by dividing the total hours
viewed by the length of the time frame (in hours). Local News is defined as any telecast that has been flagged by comScore
(either by notification from clients, or from standard processes) as being a news-based program airing on a local broadcast
affiliate of Univision. The morning news time slot includes newscasts that air from 6 a.m. to 9 a.m.; the early evening news
time slot is defined as early fringe by comScore and includes newscasts that air from 4 p.m. to 7 p.m.; the late night news
time slot is defined as late fringe by comScore and includes newscasts that air from 11 p.m. to 2 a.m.
Source: comScore StationView Essentials , 2016 and 2017, U.S.
PEW RESEARCH CENTER
In 2017, circulation declined by at least 18% for each of the three daily Hispanic newspapers for which there are 2017
data. For the top 20 Hispanic weekly and semiweekly newspapers, however, average per-paper circulation remained
steady, at about 92,000.
Circulation for Hispanic newspapers
Daily circulation Weekly/semiweekly circulation
Average Monday through Friday circulationYear El Nuevo Heraldo
(Brownsville, Texas)El Nuevo Herald
(Miami)La Opinión
(Los Angeles)El Diario La Prensa
(New York)
2014 3,368 50,859 64,260 32,150
2015 4,351 44,944 49,953 29,339
2016 3,839 40,134 37,998
2017 3,156 32,902 25,269
®
®
Chart Share EmbedData
®
Chart Share EmbedData

Note: Numbers represent audited average circulation, if an audited statement is available for that year; if not, the most
comparable publisher’s statement was used if it exists. The circulation presented here for La Opinión does not include the
average circulation for La Opinión Contigo, which is a free weekly insert. Sunday circulation is used for El Nuevo Heraldo.
Source: Alliance for Audited Media.
PEW RESEARCH CENTER
Black-oriented newspapers are a long-standing minority news sector in the U.S. The black press trade association
(National Newspaper Publishers Association) currently lists around 170 members on its website, but few of these
papers have regularly audited circulation figures, making it difficult to acquire audience figures for the sector as a
whole. There are, however, 10 black-oriented newspapers – most of which are weekly or semiweekly – with recent
audited circulation data that can serve as indicators. Among the five of these with paid circulation, circulation fell for
two, remained flat for one, and rose substantially for the final two – though those increases do not make up for the
loss in circulation for those outlets over the past decade. The remaining newspapers with audited circulation data,
which are primarily free distribution, experienced more year-over-year circulation stability, with all changing by 5%
or less from 2016 to 2017. (For newspapers with paid circulation in this analysis, at least 25% of each paper’s
circulation is paid; for the free newspapers, less than 1% of each paper’s circulation is paid.)
(Pew Research Center is not aware of any directory of black-oriented news radio or television stations, though the
National Association of Black Owned Broadcasters represents African-American-owned radio and TV stations in the
U.S.)
Circulation for African American newspapers
Paid circulation Free circulation
Average circulation for the period ending on Sept. 30
Year Michigan Chronicle
Chicago Defender
Philadelphia Tribune
New York Amsterdam News
New Pittsburgh Courier
Baltimore Afro-American
Washington Afro-American
Combined Baltimore and
Washington Afro-American
2006 26,674 13,175 3,997 11,224 11,557
2007 25,214 9,996 13,380 4,001 8,775 9,749
2008 25,292 16,207 11,958 4,123 9,971 10,853
2009 24,944 11,158 12,543 17,477 4,721 7,244 6,592
2010 21,761 8,603 14,177 9,750 4,226 6,923 7,211
2011 21,034 8,396 14,955 12,607 3,997 7,394 11,858
2012 20,978 7,737 13,320 14,042 3,480 6,840 6,007
2013 21,702 6,741 13,745 13,588 3,063 5,595 7,172
2014 20,201 5,477 19,265 10,470 2,591 5,146 5,948
2015 20,082 10,888 15,138 8,298 2,280 10,315
2016 22,231 11,882 9,114 7,843 2,231
2017 22,724 11,124 10,789 6,777 2,607
Note: Numbers represent audited average circulation for the period ending on Sept. 30, if one is available for that year; if
not, the most comparable publisher’s statement was used if it exists. At least 25% of each newspaper's total qualified and
verified circulation is paid. The print runs of the Baltimore Afro-American and the Washington Afro-American papers were
combined in June 2015. This chart tracks Tuesday's circulation for the Philadelphia Tribune.
Source: Alliance for Audited Media and Verified Audit Circulation.
PEW RESEARCH CENTER
Economics
Chart Share EmbedData

Univision’s total revenue remained steady at about $3 billion in 2017. (Telemundo’s revenue is not available for
analysis, as its parent company, Comcast, does not provide network-specific revenue.)
Revenue for Univision network
Total revenue (in U.S. dollars)Year Total revenue
2014 $2,911,400,000
2015 $2,858,400,000
2016 $3,042,000,000
2017 $3,016,400,000
Source: Univision press releases and SEC filings.
PEW RESEARCH CENTER
While audience data are not available for Spanish-language news radio, revenue data show relative stability. Average
station revenue for Spanish-language news stations that are listed in the BIA Advisory Services database declined 4%,
to $1.2 million.
Revenue for Spanish news radio stations
Average station revenue for Spanish news radio stations (in U.S. dollars) Year Station revenue
2010 $1,353,947
2011 $1,332,895
2012 $1,290,789
2013 $1,240,789
2014 $1,164,474
2015 $1,202,632
2016 $1,264,474
2017 $1,209,211
Note: Data are updated every year. Stations here include the formats Spanish News, Spanish News/Info, Spanish
News/Sports, Spanish News/Talk and Spanish News/Variety in BIA Advisory Services' database, which contains revenue
data for 21 stations in these formats. BIA Advisory Services typically does not report revenue for stations that are not part
of a radio market. Data include full-power AM and FM radio stations in the BIA Advisory Services database in 50 U.S. states
and Washington, D.C.
Source: Pew Research Center analysis of MEDIA Access Pro & BIA Advisory Services data.
PEW RESEARCH CENTER
There is no revenue data available for black-oriented newspapers, which are mostly privately held, and no database
that the Center is aware of that separates out black-oriented TV or radio news stations from all English-speaking news
outlets.
Chart Share EmbedData
Chart Share EmbedData

Newsroom investment
The portion of local TV newsroom staff who are black has remained at about 10% since 1995, according to a survey of
TV stations from RTDNA. In comparison, the percentage of television news directors who are black is smaller, at 5%;
in 1995, just 2% of local TV news directors were black. Hispanics, who made up 4% of both the TV news workforce
and TV news directors in 1995, now make up 11% of the TV news workforce and 7% of TV news directors.
Hispanic and African American staff in TV newsrooms
TV news workforce TV news directors
% of the TV news workforce who are ...Year African American Hispanic
1995 10.1% 4.2%
2000 11.0% 7.0%
2005 10.3% 8.7%
2010 11.5% 5.8%
2015 10.8% 8.2%
2016 11.1% 8.9%
2017 10.9% 10.5%
Source: RTDNA.
PEW RESEARCH CENTER
Find out more
This fact sheet was compiled by Research Associate Elisa Shearer.
Read the methodology.
Find more in-depth explorations of Hispanic and African American news media by following the link below:
Among U.S. Latinos, the internet now rivals television as a source for news, Jan. 11, 2018
Blacks more likely to follow up on digital news than whites, March 2, 2017
Chart Share EmbedData


SEARCH
NUMBERS, FACTS AND TRENDS SHAPING YOUR WORLD ABOUT FOLLOW DONATE
Journalism & Media
MENU RESEARCH AREAS
FACT SHEET
JULY 12, 2018
Local TV News Fact Sheet
MORE FACT SHEETS: STATE OF THE NEWS MEDIA
While television remains the most common place for Americans to get their news, with local TV outpacing cable and
network TV, local TV news saw its audience decline across most time slots studied this past year. Financially, local TV
companies generated less revenue in 2017 than in 2016, though this is consistent with a cyclical pattern in which
revenue rises in election years and falls in non-election years. Explore the patterns and longitudinal data about local
TV news below.
Audience
In 2017, viewership for network local affiliate news stations (ABC, CBS, Fox and NBC) declined in key time slots –
morning (6 a.m. to 9 a.m.), early evening (4 p.m. to 7 p.m.) and late night (11 p.m. to 2 a.m.), according to comScore
StationView Essentials data. The average audience (defined as the average number of TVs tuned to a program
throughout a time period) for the morning news time slot decreased 15% in 2017. Local TV average audience for the
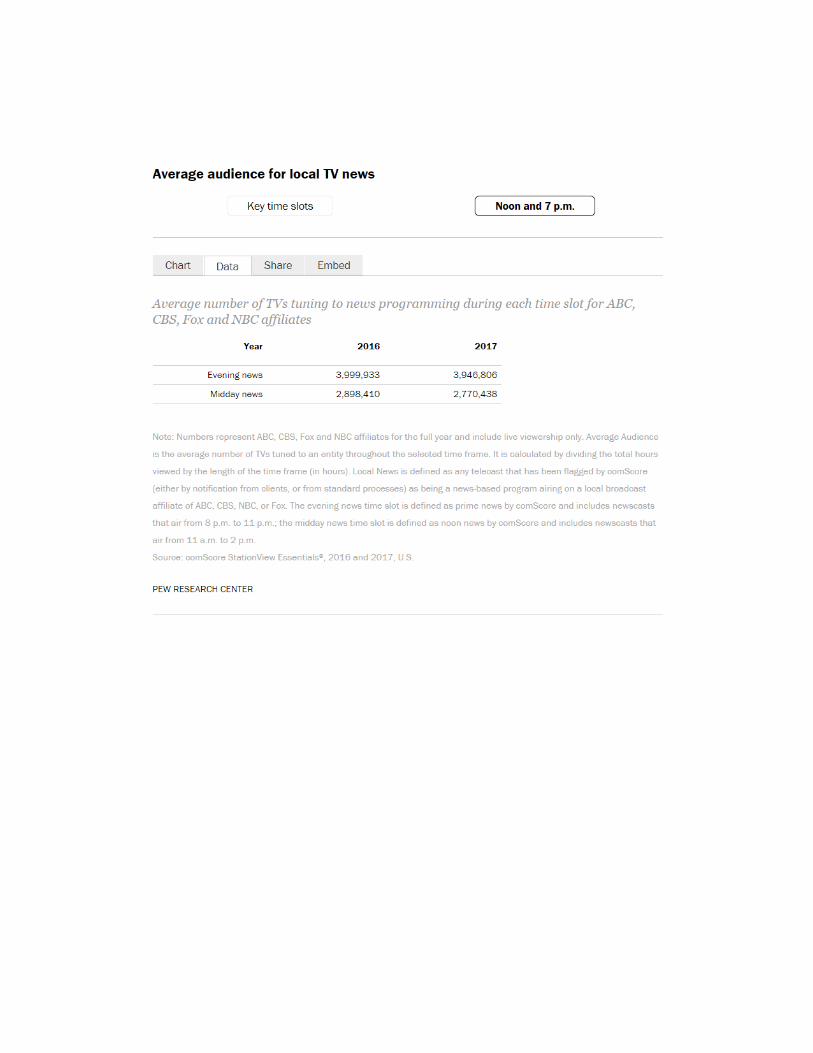
late night and early evening news time slots also declined (7% for both). Audience for the midday news time slot (11
a.m. to 2 p.m.) declined 4%, while evening news remained relatively stable.
Average audience for local TV news
Key time slots Noon and 7 p.m.
Average number of TVs tuning to news programming during each time slot for ABC,CBS, Fox and NBC affiliates
Year 2016 2017
Morning news 3,192,416 2,715,980
Early evening news 4,694,289 4,346,252
Late night news 4,643,964 4,323,572
Note: Numbers represent ABC, CBS, Fox and NBC affiliates for the full year and include live viewership only. Average
Audience is the average number of TVs tuned to an entity throughout the selected time frame. It is calculated by dividing
the total hours viewed by the length of the time frame (in hours). Local News is defined as any telecast that has been
flagged by comScore (either by notification from clients, or from standard processes) as being a news-based program airing
on a local broadcast affiliate of ABC, CBS, NBC, or Fox. The morning news time slot includes newscasts that air from 6 a.m.
to 9 a.m.; the early evening news time slot is defined as early fringe by comScore and includes newscasts that air from 4
p.m. to 7 p.m.; the late night news time slot is defined as late fringe by comScore and includes newscasts that air from 11
p.m. to 2 a.m.
Source: comScore StationView Essentials , 2016 and 2017, U.S.
MY ACCOUNT
Audience
Economics
Newsroom investment
Ownership
Find out more
®
Chart Share EmbedData
®
Note: Audience data for 2016 and 2017 has since been updated by Comscore to provide accurate trending for local TV that aligns with the national rollup (i.e., how the average audience for local newscasts are rolled up into a figure for the U.S. overall). For the most current data, please see the fact sheet at journalism.org/fact-sheet/local-tv-news.

PEW RESEARCH CENTER
In 2018, Pew Research Center began using data from comScore StationView Essentials for this audience analysis,
and as such, the current fact sheet includes figures for only the past two years. Previous versions of this fact sheet
included data stretching back to 2007 and used data from Nielsen Media Research. Those data are available in the
2017 archived fact sheet. Because of various differences between the two sets of data points, figures from prior years
are not directly comparable with the data shown here.
Economics
Local TV station revenue typically follows a cyclical pattern: increasing in election years and decreasing in non-
election years. In 2017, a non-election year, local TV over-the-air advertising revenue totaled $17.4 billion, a 13%
decrease over 2016, according to Pew Research Center analysis of MEDIA Access Pro & BIA Advisory Services data. In
comparison, local TV advertising revenue in other non-election years was $18.1 billion in 2015 and $18.0 billion in
2013.
Total digital advertising revenue for local TV stations increased 3% in 2017 (reaching a total of about $1 billion).
Digital advertising revenue accounts for a small portion of total ad revenue.
Advertising revenue for 830 local TV stations defined as “news-producing stations” (i.e., stations that have a news
director and are viable, commercial and English-language affiliates in the U.S.) was $14.1 billion, which is 81% of the
total $17.4 billion revenue for the local TV industry overall, according to the BIA Advisory Services database.
Advertising revenue for local TV
Total local TV advertising revenue (in U.S. dollars)Year Digital Over-the-air
2004 $22,400,000,000
2005 $21,000,000,000
2006 $22,800,000,000
2007 $21,542,700,000
2008 $20,621,200,000
2009 $16,013,400,000
2010 $400,000,000 $18,930,800,000
2011 $534,750,000 $17,420,800,000
2012 $625,870,000 $19,825,000,000
2013 $708,960,000 $17,986,600,000
2014 $834,400,000 $19,607,500,000
2015 $928,130,000 $18,075,200,000
2016 $1,024,650,000 $20,123,000,000
2017 $1,054,440,000 $17,419,100,000
2018* $1,121,720,000 $18,424,600,000
2019* $1,201,420,000 $17,520,300,000
2020* $1,289,180,000 $18,823,300,000
2021* $1,387,470,000 $17,927,300,000
2022* $1,495,150,000 $18,897,300,000
* 2018-2022 numbers are projections.
Note: Local TV advertising revenue figures include over-the-air (OTA) revenue and digital revenue. Digital revenue numbers
are not available prior to 2010. Numbers are updated annually.
Source: Pew Research Center analysis of MEDIA Access Pro & BIA Advisory Services data.
®
Chart Share EmbedData

PEW RESEARCH CENTER
Revenue from retransmission fees – the fees paid by cable and satellite systems to carry local channels – has been
increasing rapidly in the past decade, according to estimates from Kagan, a media research group within S&P Global
Market Intelligence. In 2017, retransmission revenue reached over $9 billion, up from $8 billion in 2016, and Kagan
projects that this figure will reach $12.8 billion by 2023.
Retransmission fee revenue for U.S. local TV stations
Total retransmission fee revenue (in U.S. dollars)Year Revenue
2006 $215,000,000
2007 $314,000,000
2008 $502,000,000
2009 $762,000,000
2010 $1,246,000,000
2011 $1,776,000,000
2012 $2,408,000,000
2013 $3,620,000,000
2014 $4,859,000,000
2015 $6,424,000,000
2016 $7,980,000,000
2017 $9,392,000,000
2018* $10,230,000,000
2019* $10,862,000,000
2020* $11,442,000,000
2021* $11,931,000,000
2022* $12,402,000,000
2023* $12,821,000,000
* 2018-2023 numbers are projections.
Note: Broadcast retransmission fees include owned and operated (O&O), affiliate station, reverse retransmissions and
estimated broadcast station carriage fees from the Virtual Service Providers or vMVPDs. Numbers are updated annually.
Source: Estimates and projections by Kagan, a media research group within S&P Global Market Intelligence.
PEW RESEARCH CENTER
Six major publicly held local TV station companies – Tribune, Nexstar, Sinclair, Tegna, Gray and Scripps – report
political advertising revenue separately from other types of revenues in their Securities and Exchange Commission
filings. In 2017, the six companies reported a total of $112 million in political advertising revenue, compared with
$124 million in 2015 and $50 million in 2013, the two most recent non-election years. (Data points for 2012-2016 also
include Media General, which was purchased by Nexstar in 2017.)
Political advertising revenue at local TV companies
Chart Share EmbedData
Chart Share EmbedData

Total political advertising revenue for six publicly held local TV station companies (inU.S. dollars)
Year Revenue
2012 $573,591,000
2013 $49,880,000
2014 $696,482,000
2015 $124,451,000
2016 $842,737,000
2017 $111,612,000
Note: Political advertising revenue includes both local and national political advertising. Meredith was not included because
it operates in a different fiscal year from the others. Data for 2012-2016 include Media General, which was purchased by
Nexstar in 2017.
Source: Individual company Securities and Exchange Commission filings for the full year ending on Dec. 31. Companies
included here are: Tribune, Nexstar, Sinclair, Tegna, Gray and Scripps.
PEW RESEARCH CENTER
Newsroom investment
Roughly 29,000 employees worked as reporters, editors, photographers or film and video editors in broadcast TV
newsrooms in 2017, according to data from the Bureau of Labor Statistics’ Occupational Employment Statistics.
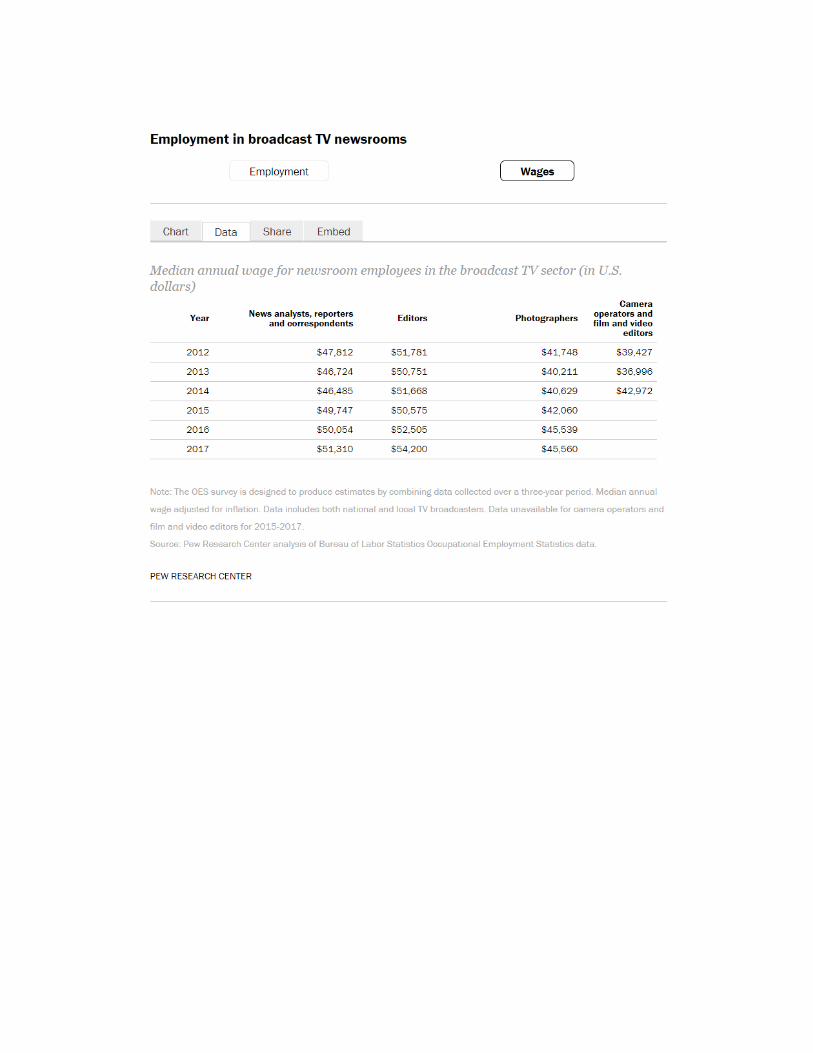
Median wages for editors in 2017 were about $54,000, while for reporters the figure was about $51,000. (Broadcast
TV newsroom employment and wage data includes both national and local TV broadcasters. For details, see the
methodology.)
Employment in broadcast TV newsrooms
Employment Wages
Total number of newsroom employees in the broadcast TV sector Year Total
2004 29,630
2005 28,550
2006 28,360
2007 27,600
2008 28,390
2009 28,040
2010 28,640
2011 28,050
2012 27,830
2013 25,650
2014 26,300
2015 28,430
2016 28,190
2017 28,900
Chart Share EmbedData

Note: The OES survey is designed to produce estimates by combining data collected over a three-year period. Newsroom
employees include news analysts, reporters and correspondents; editors; photographers; and television, video, and motion
picture camera operators and editors. Data includes both national and local TV broadcasters.
Source: Pew Research Center analysis of Bureau of Labor Statistics Occupational Employment Statistics data.
PEW RESEARCH CENTER
The average amount of weekday local TV news programming was steady in 2017, according to the RTDNA/Hofstra
University survey. Local TV stations dedicated an average of 5.6 hours to news programming per weekday in 2017,
similar to 5.7 hours in 2016.
Number of hours dedicated to local TV news
Average number of local TV news hours per weekdayYear Hours
2003 3.7
2004 3.6
2005 3.8
2006 4.1
2007 4.1
2008 4.6
2009 5.0
2010 5.3
2011 5.5
2012 5.4
2013 5.3
2014 5.3
2015 5.5
2016 5.7
2017 5.6
Note: Based on survey responses of news directors at all commercial local TV stations in the fourth quarter of each year
among operating, non-satellite television stations.
Source: RTDNA/Hofstra University Surveys.
PEW RESEARCH CENTER
Ownership
In 2017, 107 local TV stations changed hands at a cost of $4.7 billion, as annually reported by BIA Advisory Services.
This is down from $5.3 billion across 97 stations that experienced changes in ownership in 2016. (This does not
include Sinclair’s proposed purchase of Tribune, which has not yet been finalized.)
Mergers and acquisitions of local TV stations
Total value of local TV station mergers and acquisitions (in U.S. dollars)Year Revenue
Chart Share EmbedData
Chart Share EmbedData

Year Revenue
2000 $8,800,000,000
2001 $4,900,000,000
2002 $2,529,000,000
2003 $520,000,000
2004 $872,000,000
2005 $2,842,000,000
2006 $18,127,000,000
2007 $2,899,000,000
2008 $537,000,000
2009 $714,000,000
2010 $199,000,000
2011 $1,102,000,000
2012 $1,891,000,000
2013 $9,712,000,000
2014 $4,616,000,000
2015 $670,000,000
2016 $5,280,000,000
2017 $4,684,000,000
Note: Transaction totals include all that are announced as of the end of December for each year. Numbers from the
previous year may be updated to reflect new information.
Source: Pew Research Center analysis of MEDIA Access Pro & BIA Advisory Services data.
PEW RESEARCH CENTER
Find out more
This fact sheet was compiled by Associate Director Katerina Eva Matsa and Research Assistant Sophia Fedeli.
Read the methodology.
Find more in-depth explorations of local TV news by following the links below:
Fewer Americans rely on TV news; what type they watch varies by who they are, Jan. 5, 2018
Americans’ online news use is closing in on TV news use, Sept. 7, 2017
Buying spree brings more local TV stations to fewer big companies, May 11, 2017
Trump, Clinton Voters Divided in Their Main Source for Election News, Jan. 18, 2017

SEARCH
NUMBERS, FACTS AND TRENDS SHAPING YOUR WORLD ABOUT FOLLOW DONATE
Journalism & Media
MENU RESEARCH AREAS
FACT SHEET
JULY 25, 2018
Network News Fact Sheet
MORE FACT SHEETS: STATE OF THE NEWS MEDIA
Network TV news – appointment viewing for many Americans – saw its audience decline over the past year.
Financially, advertiser expenditure for the news programs of the three major networks – ABC, CBS and NBC – has
been steady in recent years. Explore the patterns and longitudinal data about network TV news below.
Audience
The average audience for the evening newscasts for ABC, CBS and NBC decreased by 7% in 2017, down to 5.2 million,
compared with 5.6 million in 2016, according to comScore TV Essentials® data. (Average audience is defined as the
average number of TVs tuned to a program throughout a time period.)
Average audience for network TV evening news
Average number of TVs tuning to news programming during the evening news timeslot for ABC, CBS and NBC
Year Evening news audience
2016 5,622,630
2017 5,223,985
Note: Numbers represent ABC, CBS and NBC for the full year and include live viewership only. Average Audience is the
average number of TVs tuned to an entity throughout the selected time frame. It is calculated by dividing the total hours
viewed by the length of the time frame (in hours). National News is defined as any telecast that has been flagged by
comScore (either by notification from clients, or from standard processes) as being a news-based program airing at
approximately the same time across a majority of markets. The evening news time slot is defined as early fringe by
comScore and includes newscasts that air from 4 p.m. to 7 p.m.
Source: comScore TV Essentials®, 2016 and 2017, U.S.
PEW RESEARCH CENTER
In 2018, Pew Research Center began using data from comScore TV Essentials® for this audience analysis, and as
such, the current fact sheet includes figures for only the past two years. Previous versions of this fact sheet included
data stretching back to 2008 and used data from Nielsen Media Research. Those data are available in the 2017
archived fact sheet. Because of various differences between the two sets of data points, figures from prior years are not
directly comparable with the data shown here.
Average audience for morning news programs from ABC, CBS and NBC also declined over the past year, down 10% in
2017, to about 3 million.
MY ACCOUNT
Audience
Economics
Find out more
Chart Share EmbedData

Average audience for network TV morning news
Average number of TVs tuning to news programming during the morning news timeslot for ABC, CBS and NBC
Year Morning news audience
2016 3,698,547
2017 3,324,744
Note: Numbers represent ABC, CBS and NBC for the full year and include live viewership only. Average Audience is the
average number of TVs tuned to an entity throughout the selected time frame. It is calculated by dividing the total hours
viewed by the length of the time frame (in hours). National News is defined as any telecast that has been flagged by
comScore (either by notification from clients, or from standard processes) as being a news-based program airing at
approximately the same time across a majority of markets. The morning news time slot includes newscasts that air from 6
a.m. to 9 a.m.
Source: comScore TV Essentials®, 2016 and 2017, U.S.
PEW RESEARCH CENTER
Average audience for the network TV Sunday morning political talk shows on ABC, CBS, Fox and NBC – This Week,
Face the Nation, Fox News Sunday and Meet the Press, respectively – remained stable, down 1% in 2017, staying at
about 2 million.
Average audience for network TV Sunday morning political talk shows
Average number of TVs tuning to Sunday morning political talk show newsprogramming for ABC's This Week, CBS's Face the Nation, Fox News Sunday andNBC's Meet the Press
Year Sunday morning political talk show audience
2016 2,377,826
2017 2,352,338
Note: Numbers represent ABC, CBS, Fox and NBC for the full year and include live viewership only. Average Audience is the
average number of TVs tuned to an entity throughout the selected time frame. It is calculated by dividing the total hours
viewed by the length of the time frame (in hours). National News is defined as any telecast that has been flagged by
comScore (either by notification from clients, or from standard processes) as being a news-based program airing at
approximately the same time across a majority of markets. Sunday morning political talk shows include ABC's This Week,
CBS's Face the Nation, Fox News Sunday and NBC's Meet the Press.
Source: comScore TV Essentials®, 2016 and 2017, U.S.
PEW RESEARCH CENTER
The average audience for the four newsmagazine shows aired by the networks – ABC’s 20/20, CBS’s 60 Minutes and
48 Hours, and NBC’s Dateline – declined in 2017, down 12% from 2016.
Average audience for network TV newsmagazines
Average number of TVs tuning to newsmagazine programming for ABC's 20/20,CBS's 48 Hours, CBS's 60 Minutes and NBC's Dateline
Chart Share EmbedData
Chart Share EmbedData
Chart Share EmbedData

Year Newsmagazine audienceYear Newsmagazine audience
2016 3,946,580
2017 3,467,870
Note: Numbers represent ABC, CBS and NBC for the full year and include live viewership only. Average Audience is the
average number of TVs tuned to an entity throughout the selected time frame. It is calculated by dividing the total hours
viewed by the length of the time frame (in hours). National News is defined as any telecast that has been flagged by
comScore (either by notification from clients, or from standard processes) as being a news-based program airing at
approximately the same time across a majority of markets. Newsmagazine network shows include ABC's 20/20, CBS's 48
Hours, CBS's 60 Minutes and NBC's Dateline.
Source: comScore TV Essentials®, 2016 and 2017, U.S.
PEW RESEARCH CENTER
Economics
Combined advertiser expenditures for the evening broadcast news programs, ABC’s World News Tonight, CBS
Evening News and NBC Nightly News, were $552 million, roughly the same as 2016, according to estimates from
Kantar Media. (These data reflect the amount of money paid by advertisers, rather than the amount of revenue
actually earned by networks.)
Advertiser expenditure for evening network news
Gross advertiser expenditures for network TV evening news programsYear Average expenditure
2013 $454,208,000
2014 $466,054,900
2015 $500,292,700
2016 $547,932,400
2017 $552,369,500
Note: The above figures only include Monday through Friday telecasts of ABC's World News Tonight, CBS Evening News and
NBC Nightly News. These figures reflect total payments by advertisers for purchase of commercial time. A proportion of
these payments are paid as commissions or fees to media buyers, and the balance are recognized by the network as
revenue.
Source: Kantar Media.
PEW RESEARCH CENTER
The three networks also saw no change in advertiser expenditures for the morning news programs from the previous
year, holding roughly steady at $1.1 billion in 2017.
Advertiser expenditure for morning network news
Gross advertiser expenditures for network TV morning news programsYear Average expenditure
Chart Share EmbedData
Chart Share EmbedData

Year Average expenditure
2013 $991,814,500
2014 $982,048,500
2015 $1,072,226,300
2016 $1,105,728,100
2017 $1,089,767,000
Note: The above figures only include Monday through Friday telecasts of ABC's Good Morning America, CBS This Morning
and NBC's Today. These figures reflect total payments by advertisers for purchase of commercial time. A proportion of
these payments are paid as commissions or fees to media buyers, and the balance are recognized by the network as
revenue.
Source: Kantar Media.
PEW RESEARCH CENTER
Find out more
This fact sheet was compiled by Associate Director Katerina Eva Matsa.
Read the methodology.
Find more in-depth explorations of network news by following the links below:
Fewer Americans rely on TV news; what type they watch varies by who they are, Jan. 5, 2018
Americans’ online news use is closing in on TV news use, Sept. 7, 2017
Trump, Clinton Voters Divided in Their Main Source for Election News, Jan. 18, 2017

SEARCH
NUMBERS, FACTS AND TRENDS SHAPING YOUR WORLD ABOUT FOLLOW DONATE
Journalism & Media
MENU RESEARCH AREAS
FACT SHEET
JUNE 13, 2018
Newspapers Fact Sheet
MORE FACT SHEETS: STATE OF THE NEWS MEDIA
Newspapers are a critical part of the American news landscape, but they have been hit hard as more and more
Americans consume news digitally. The industry’s financial fortunes and subscriber base have been in decline since
the early 2000s, even as website audience traffic has grown for many. Meanwhile, alt-weekly papers have also seen
their circulation drop. Explore the patterns and longitudinal data about U.S. newspapers below.
Audience
The estimated total U.S. daily newspaper circulation (print and digital combined) in 2017 was 31 million for weekday
and 34 million for Sunday, down 11% and 10%, respectively, from the previous year. Declines were highest in print
circulation: Weekday print circulation decreased 11% and Sunday circulation decreased 10%. (Note that in this fact
sheet, and in the chart below, data through 2014 are from Editor & Publisher, which were published on the website of
the News Media Alliance (NMA), known at the time as the Newspaper Association of America (NAA). Since then, the
NMA/NAA no longer supplies these data, so the Center determined the year-over-year change in total circulation for
those daily U.S. newspapers that report to the Alliance for Audited Media and meet certain criteria, as detailed in the
note of the chart below. This percentage change was then applied to the total circulation from the prior year – thus
the use of the term “estimated total circulation.”)
Total estimated circulation of U.S. daily newspapers
Total circulation of U.S. daily newspapersYear Weekday Sunday Weekday (estimated) Sunday (estimated)
1940 41,132,000 32,371,000
1945 48,384,000 39,860,000
1946 50,928,000 43,665,000
1947 51,673,000 45,151,000
1948 52,285,000 46,308,000
1949 52,846,000 46,399,000
1950 53,829,000 46,582,000
1951 54,018,000 46,279,000
1952 53,951,000 46,210,000
1953 54,472,000 45,949,000
1954 55,072,000 46,176,000
1955 56,147,000 46,448,000
1956 57,102,000 47,162,000
1957 57,805,000 47,044,000
1958 57,418,000 46,955,000
MY ACCOUNT
Audience
Economics
Newsroom investment
Find out more
Chart Share EmbedData

Year Weekday Sunday Weekday (estimated) Sunday (estimated)
1959 58,300,000 47,848,000
1960 58,882,000 47,699,000
1961 59,261,000 48,216,000
1962 59,849,000 48,888,000
1963 58,905,000 46,830,000
1964 60,412,000 48,383,000
1965 60,358,000 48,600,000
1966 61,397,000 49,282,000
1967 61,561,000 49,224,000
1968 62,535,000 49,693,000
1969 62,060,000 49,675,000
1970 62,108,000 49,217,000
1971 62,231,000 49,665,000
1972 62,510,000 50,001,000
1973 63,147,000 51,717,000
1974 61,877,000 51,679,000
1975 60,655,000 51,096,000
1976 60,977,000 51,565,000
1977 61,495,000 52,429,000
1978 61,990,000 53,990,000
1979 62,223,000 54,380,000
1980 62,202,000 54,676,000
1981 61,431,000 55,180,000
1982 62,487,000 56,261,000
1983 62,645,000 56,747,000
1984 63,340,000 57,574,000
1985 62,766,000 58,826,000
1986 62,502,000 58,925,000
1987 62,826,000 60,112,000
1988 62,695,000 61,474,000
1989 62,649,000 62,008,000
1990 62,328,000 62,635,000
1991 60,687,000 62,068,000
1992 60,164,000 62,160,000
1993 59,812,000 62,566,000
1994 59,305,000 62,295,000
1995 58,193,000 61,229,000
1996 56,983,000 60,798,000
1997 56,728,000 60,486,000
1998 56,182,000 60,066,000
1999 55,979,000 59,894,000
2000 55,773,000 59,421,000
2001 55,578,000 59,090,000
2002 55,186,000 58,780,000
2003 55,185,000 58,495,000
2004 54,626,000 57,754,000
2005 53,345,000 55,270,000
2006 52,329,000 53,179,000
2007 50,742,000 51,246,000
2008 48,597,000 49,115,000
2009 45,653,000 46,164,000
2010 -- --
2011 44,421,000 48,510,000
2012 43,433,000 44,821,000
Year Weekday Sunday Weekday (estimated) Sunday (estimated)
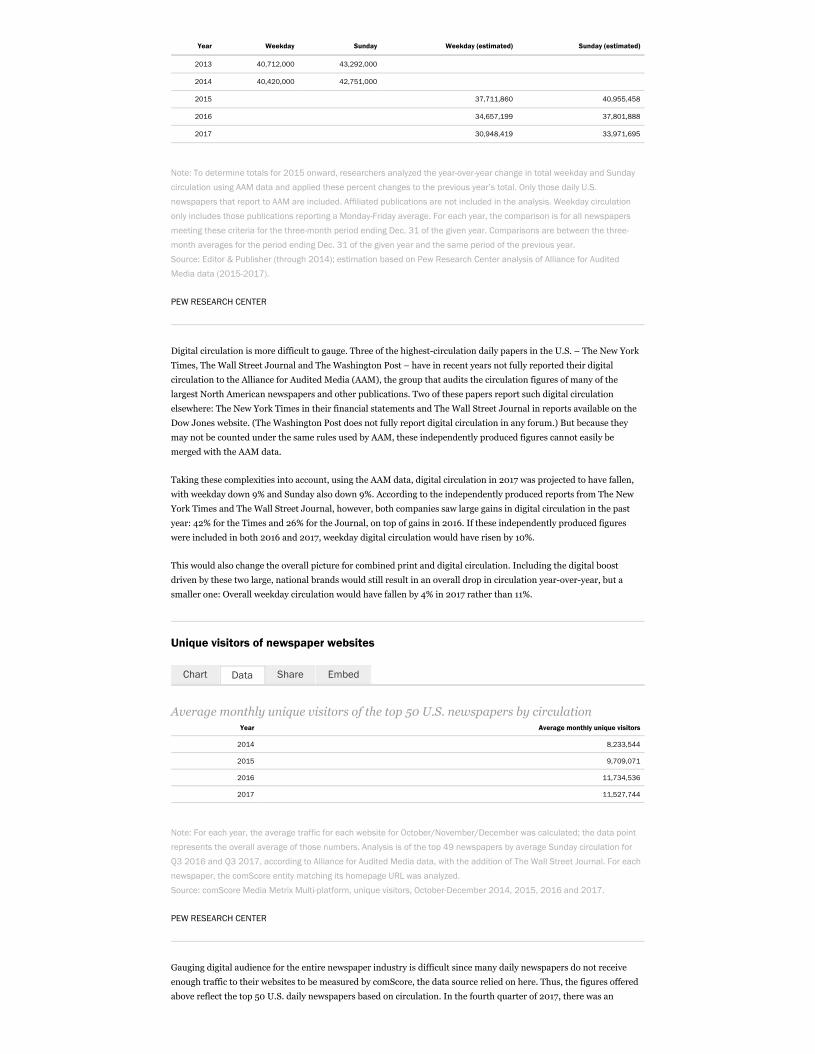
2013 40,712,000 43,292,000
2014 40,420,000 42,751,000
2015 37,711,860 40,955,458
2016 34,657,199 37,801,888
2017 30,948,419 33,971,695
Note: To determine totals for 2015 onward, researchers analyzed the year-over-year change in total weekday and Sunday
circulation using AAM data and applied these percent changes to the previous year’s total. Only those daily U.S.
newspapers that report to AAM are included. Affiliated publications are not included in the analysis. Weekday circulation
only includes those publications reporting a Monday-Friday average. For each year, the comparison is for all newspapers
meeting these criteria for the three-month period ending Dec. 31 of the given year. Comparisons are between the three-
month averages for the period ending Dec. 31 of the given year and the same period of the previous year.
Source: Editor & Publisher (through 2014); estimation based on Pew Research Center analysis of Alliance for Audited
Media data (2015-2017).
PEW RESEARCH CENTER
Digital circulation is more difficult to gauge. Three of the highest-circulation daily papers in the U.S. – The New York
Times, The Wall Street Journal and The Washington Post – have in recent years not fully reported their digital
circulation to the Alliance for Audited Media (AAM), the group that audits the circulation figures of many of the
largest North American newspapers and other publications. Two of these papers report such digital circulation
elsewhere: The New York Times in their financial statements and The Wall Street Journal in reports available on the
Dow Jones website. (The Washington Post does not fully report digital circulation in any forum.) But because they
may not be counted under the same rules used by AAM, these independently produced figures cannot easily be
merged with the AAM data.
Taking these complexities into account, using the AAM data, digital circulation in 2017 was projected to have fallen,
with weekday down 9% and Sunday also down 9%. According to the independently produced reports from The New
York Times and The Wall Street Journal, however, both companies saw large gains in digital circulation in the past
year: 42% for the Times and 26% for the Journal, on top of gains in 2016. If these independently produced figures
were included in both 2016 and 2017, weekday digital circulation would have risen by 10%.
This would also change the overall picture for combined print and digital circulation. Including the digital boost
driven by these two large, national brands would still result in an overall drop in circulation year-over-year, but a
smaller one: Overall weekday circulation would have fallen by 4% in 2017 rather than 11%.
Unique visitors of newspaper websites
Average monthly unique visitors of the top 50 U.S. newspapers by circulationYear Average monthly unique visitors
2014 8,233,544
2015 9,709,071
2016 11,734,536
2017 11,527,744
Note: For each year, the average traffic for each website for October/November/December was calculated; the data point
represents the overall average of those numbers. Analysis is of the top 49 newspapers by average Sunday circulation for
Q3 2016 and Q3 2017, according to Alliance for Audited Media data, with the addition of The Wall Street Journal. For each
newspaper, the comScore entity matching its homepage URL was analyzed.
Source: comScore Media Metrix Multi-platform, unique visitors, October-December 2014, 2015, 2016 and 2017.
PEW RESEARCH CENTER
Gauging digital audience for the entire newspaper industry is difficult since many daily newspapers do not receive
enough traffic to their websites to be measured by comScore, the data source relied on here. Thus, the figures offered
above reflect the top 50 U.S. daily newspapers based on circulation. In the fourth quarter of 2017, there was an
Chart Share EmbedData
average of 11.5 million monthly unique visitors (across all devices) for these top 50 newspapers. This is nearly the
same as in 2016 (11.7 million), making this the first year since we began tracking the trend that did not show a double-
digit rise in web traffic: There was, for example, a 21% increase from 2015 to 2016 and an 18% rise from 2014 to 2015.
(The list of top 50 papers is based on Sunday circulation but also includes The Wall Street Journal, which does not
have any Sunday circulation. It also includes The Washington Post and The New York Times, which make the top 50
even though they do not fully report their digital circulation to AAM. For more details and the full list of newspapers,
see our methodology.)
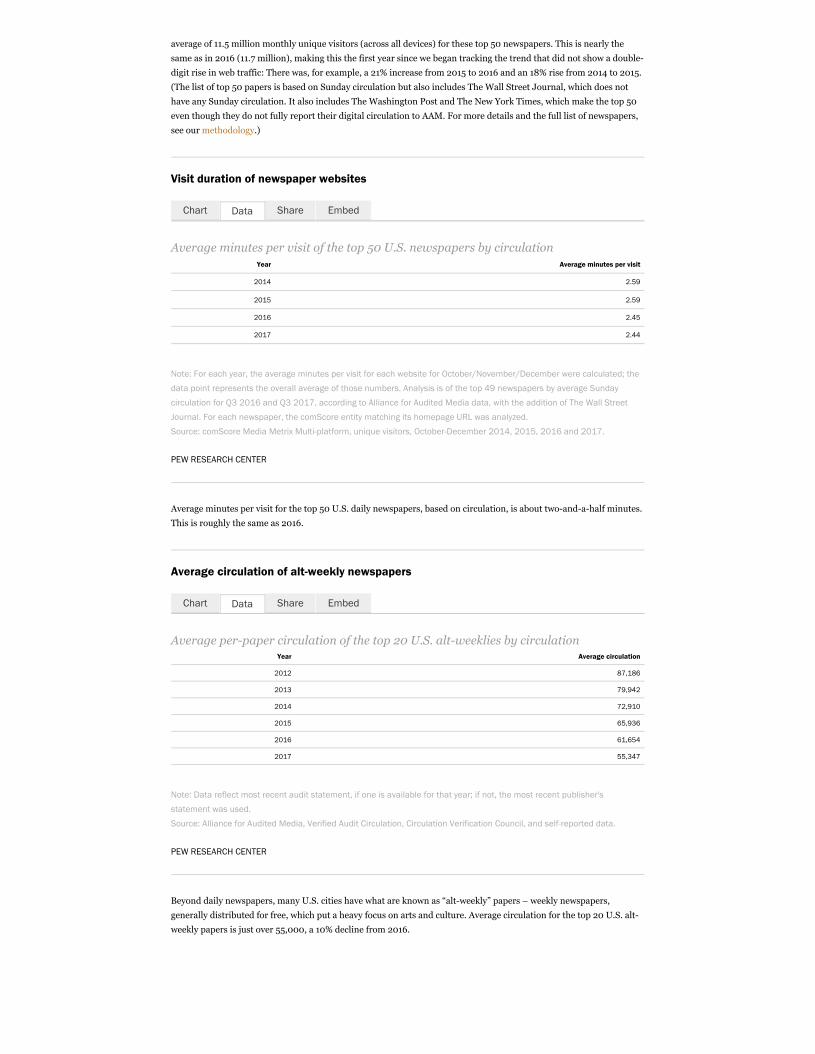
Visit duration of newspaper websites
Average minutes per visit of the top 50 U.S. newspapers by circulationYear Average minutes per visit
2014 2.59
2015 2.59
2016 2.45
2017 2.44
Note: For each year, the average minutes per visit for each website for October/November/December were calculated; the
data point represents the overall average of those numbers. Analysis is of the top 49 newspapers by average Sunday
circulation for Q3 2016 and Q3 2017, according to Alliance for Audited Media data, with the addition of The Wall Street
Journal. For each newspaper, the comScore entity matching its homepage URL was analyzed.
Source: comScore Media Metrix Multi-platform, unique visitors, October-December 2014, 2015, 2016 and 2017.
PEW RESEARCH CENTER
Average minutes per visit for the top 50 U.S. daily newspapers, based on circulation, is about two-and-a-half minutes.
This is roughly the same as 2016.
Average circulation of alt-weekly newspapers
Average per-paper circulation of the top 20 U.S. alt-weeklies by circulationYear Average circulation
2012 87,186
2013 79,942
2014 72,910
2015 65,936
2016 61,654
2017 55,347
Note: Data reflect most recent audit statement, if one is available for that year; if not, the most recent publisher's
statement was used.
Source: Alliance for Audited Media, Verified Audit Circulation, Circulation Verification Council, and self-reported data.
PEW RESEARCH CENTER
Beyond daily newspapers, many U.S. cities have what are known as “alt-weekly” papers – weekly newspapers,
generally distributed for free, which put a heavy focus on arts and culture. Average circulation for the top 20 U.S. alt-
weekly papers is just over 55,000, a 10% decline from 2016.
Chart Share EmbedData
Chart Share EmbedData

Economics
Turning back to the newspaper industry as a whole, the total estimated newspaper industry advertising revenue for
2017 was $16.5 billion, based on the Center’s analysis of financial statements for publicly traded newspaper
companies. This decreased 10% from 2016. Total estimated circulation revenue was $11 billion, which is changed only
slightly from 2016, up by 3%.
Estimated advertising and circulation revenue of the newspaper industry
Total revenue of U.S. newspapers (in U.S. dollars)Year Advertising Circulation Advertising (estimated) Circulation (estimated)
1956 $3,223,000,000 $1,344,492,000
1957 $3,268,000,000 $1,373,464,000
1958 $3,176,000,000 $1,459,013,000
1959 $3,526,000,000 $1,549,576,000
1960 $3,681,000,000 $1,604,228,000
1961 $3,601,000,000 $1,684,319,000
1962 $3,659,000,000 $1,819,840,000
1963 $3,780,000,000 $1,901,820,000
1964 $4,120,000,000 $1,983,809,000
1965 $4,426,000,000 $2,023,090,000
1966 $4,865,000,000 $2,109,050,000
1967 $4,910,000,000 $2,180,242,000
1968 $5,232,000,000 $2,288,215,000
1969 $5,714,000,000 $2,425,446,000
1970 $5,704,000,000 $2,634,402,000
1971 $6,167,000,000 $2,833,320,000
1972 $6,939,000,000 $2,929,233,000
1973 $7,481,000,000 $3,037,820,000
1974 $7,842,000,000 $3,581,733,000
1975 $8,234,000,000 $3,921,515,000
1976 $9,618,000,000 $4,087,303,000
1977 $10,751,000,000 $4,310,236,000
1978 $12,213,000,000 $4,534,779,000
1979 $13,863,000,000 $4,950,542,000
1980 $14,794,000,000 $5,469,589,000
1981 $16,527,000,000 $6,206,141,000
1982 $17,694,000,000 $6,656,661,000
1983 $20,581,000,000 $7,044,098,000
1984 $23,522,000,000 $7,368,158,000
1985 $25,170,000,000 $7,659,297,000
1986 $26,990,000,000 $8,052,148,000
1987 $29,412,000,000 $8,399,032,000
1988 $31,197,000,000 $8,046,287,000
1989 $32,368,000,000 $8,370,324,000
1990 $32,280,000,000
1991 $30,349,000,000 $8,697,679,000
Chart Share EmbedData
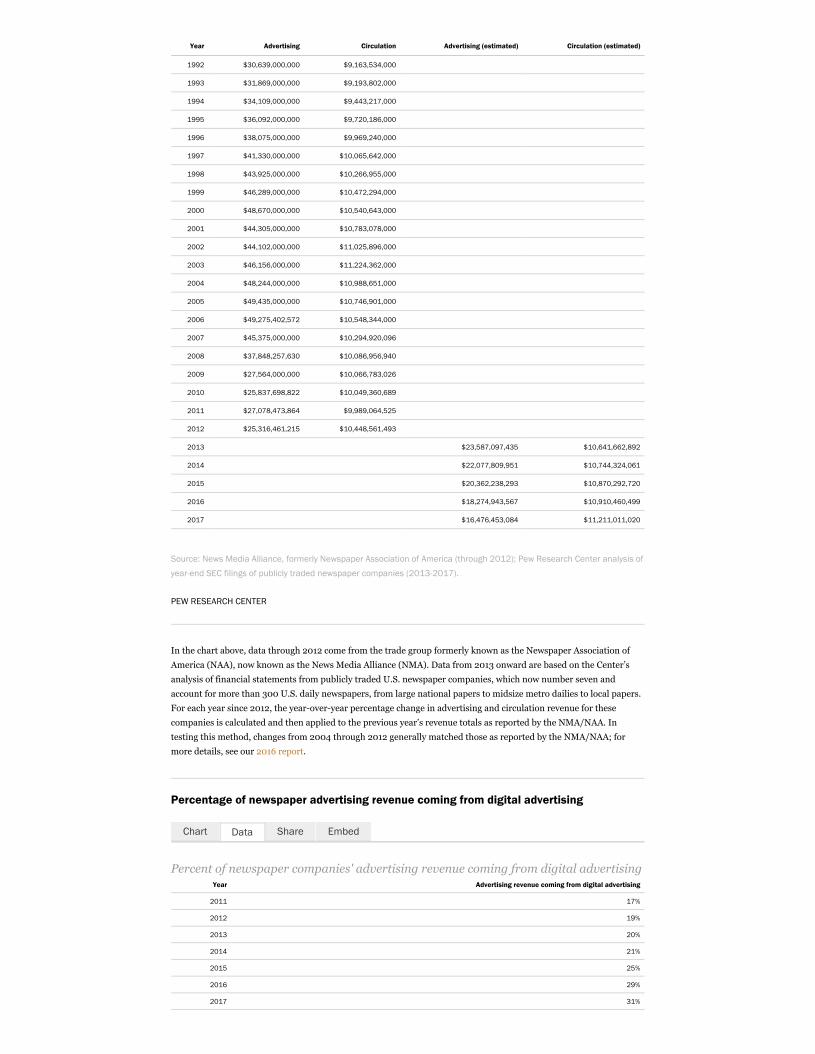
Year Advertising Circulation Advertising (estimated) Circulation (estimated)
1992 $30,639,000,000 $9,163,534,000
1993 $31,869,000,000 $9,193,802,000
1994 $34,109,000,000 $9,443,217,000
1995 $36,092,000,000 $9,720,186,000
1996 $38,075,000,000 $9,969,240,000
1997 $41,330,000,000 $10,065,642,000
1998 $43,925,000,000 $10,266,955,000
1999 $46,289,000,000 $10,472,294,000
2000 $48,670,000,000 $10,540,643,000
2001 $44,305,000,000 $10,783,078,000
2002 $44,102,000,000 $11,025,896,000
2003 $46,156,000,000 $11,224,362,000
2004 $48,244,000,000 $10,988,651,000
2005 $49,435,000,000 $10,746,901,000
2006 $49,275,402,572 $10,548,344,000
2007 $45,375,000,000 $10,294,920,096
2008 $37,848,257,630 $10,086,956,940
2009 $27,564,000,000 $10,066,783,026
2010 $25,837,698,822 $10,049,360,689
2011 $27,078,473,864 $9,989,064,525
2012 $25,316,461,215 $10,448,561,493
2013 $23,587,097,435 $10,641,662,892
2014 $22,077,809,951 $10,744,324,061
2015 $20,362,238,293 $10,870,292,720
2016 $18,274,943,567 $10,910,460,499
2017 $16,476,453,084 $11,211,011,020
Source: News Media Alliance, formerly Newspaper Association of America (through 2012); Pew Research Center analysis of
year-end SEC filings of publicly traded newspaper companies (2013-2017).
PEW RESEARCH CENTER
In the chart above, data through 2012 come from the trade group formerly known as the Newspaper Association of
America (NAA), now known as the News Media Alliance (NMA). Data from 2013 onward are based on the Center’s
analysis of financial statements from publicly traded U.S. newspaper companies, which now number seven and
account for more than 300 U.S. daily newspapers, from large national papers to midsize metro dailies to local papers.
For each year since 2012, the year-over-year percentage change in advertising and circulation revenue for these
companies is calculated and then applied to the previous year’s revenue totals as reported by the NMA/NAA. In
testing this method, changes from 2004 through 2012 generally matched those as reported by the NMA/NAA; for
more details, see our 2016 report.
Percentage of newspaper advertising revenue coming from digital advertising
Percent of newspaper companies' advertising revenue coming from digital advertisingYear Advertising revenue coming from digital advertising
2011 17%
2012 19%
2013 20%
2014 21%
2015 25%
2016 29%
2017 31%
Chart Share EmbedData

Source: Pew Research Center analysis of year-end SEC filings for publicly traded newspaper companies that break out
digital advertising revenue for each year.
PEW RESEARCH CENTER
Digital advertising accounted for 31% of newspaper advertising revenue in 2017, based on this same analysis of
publicly traded newspaper companies. The portion stood at 29% in 2016 and 17% in 2011.
Newsroom investment
According to data from the Bureau of Labor Statistics’ Occupational Employment Statistics, 39,210 people worked as
reporters, editors, photographers, or film and video editors in the newspaper industry in 2017. That is down 15% from
2014 and 45% from 2004. Median wages for editors in 2017 were about $49,000, while for reporters the figure was
about $34,000.
Employment in newspaper newsrooms
Employees Wages
Total number of newsroom employees in the newspaper sectorYear Total
2004 71,640
2005 72,600
2006 74,410
2007 73,810
2008 71,070
2009 60,770
2010 55,260
2011 54,050
2012 51,430
2013 48,920
2014 46,310
2015 44,120
2016 42,450
2017 39,210
Note: The OES survey is designed to produce estimates by combining data collected over a three-year period. Newsroom
employees include news analysts, reporters and correspondents; editors; photographers; and television, video, and motion
picture camera operators and editors.
Source: Pew Research Center analysis of Bureau of Labor Statistics Occupational Employment Statistics data.
PEW RESEARCH CENTER
Find out more
Chart Share EmbedData

This fact sheet was compiled by Research Associate Michael Barthel.
Read the methodology.
Find more in-depth explorations of U.S. newspapers by following the links below:
Newspaper employment dropped nearly a quarter in less than 10 years, with greatest decline atnewspapers, July 30, 2018
About a third of large U.S. newspapers have suffered layoffs since 2017, July 23, 2018
Covering President Trump in a Polarized Media Environment, Oct. 2, 2017
For election news, young people turned to some national papers more than their elders, Feb. 17, 2017
Trump, Clinton Voters Divided in Their Main Source for Election News, Jan. 18, 2017
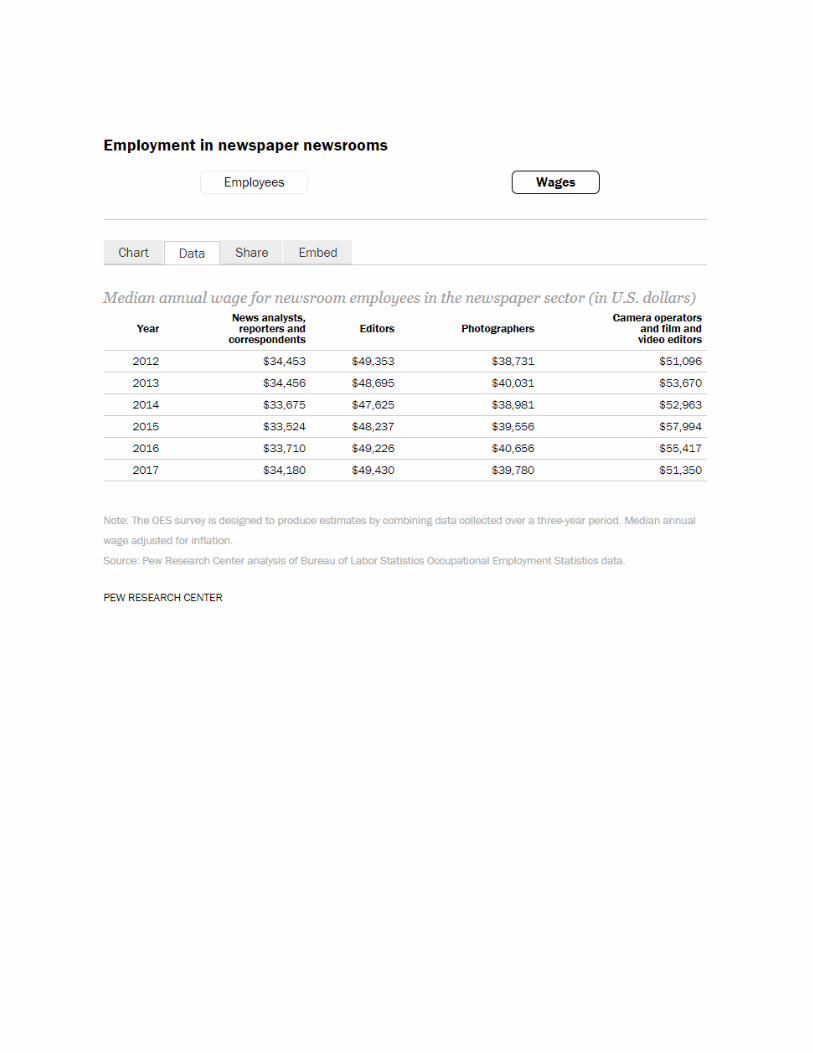

SEARCH
NUMBERS, FACTS AND TRENDS SHAPING YOUR WORLD ABOUT FOLLOW DONATE
Journalism & Media
MENU RESEARCH AREAS
FACT SHEET
JUNE 6, 2018
Public Broadcasting Fact Sheet
MORE FACT SHEETS: STATE OF THE NEWS MEDIA
Hundreds of local and regional radio and television stations comprise the U.S. public media system. On the audio
side, organizations such as NPR, American Public Media (APM) and Public Radio International (PRI) produce and
distribute programming, reaching audiences through local stations as well as digital channels. Individual stations,
such as New York’s WNYC and Chicago’s WBEZ, produce nationally syndicated original journalism as well. On the
television side, PBS NewsHour produces an evening newscast that airs on local PBS stations around the country. The
organization has a digital operation as well. On the whole, the news offerings of U.S. public broadcasters have been
marked by relative financial stability and, in the past year, moderate audience growth. Explore the patterns and
longitudinal data about public broadcasting below.
Audience
The top 20 NPR-affiliated public radio stations (by listenership) had on average a total weekly listenership of about 11
million in 2017, up from about 10 million in 2016. (This includes listeners of NPR programming as well as original or
other syndicated content aired on these stations.)
Weekly broadcast audience for top 20 NPR-affiliated radio stations
Average weekly terrestrial listenershipYear Average weekly terrestrial listenership
2015 8,724,100
2016 10,212,600
2017 11,210,500
Source: NPR, based on data from Nielsen Audio Nationwide, for persons 12+.
PEW RESEARCH CENTER
When looking specifically at NPR programming across all stations that carry it, terrestrial broadcast listenership
remained about the same between 2016 and 2017. (Traditional radio listening is “terrestrial,” i.e. coming from radio
broadcast towers rather than satellites or the internet.) About 30 million average weekly listeners tuned in to any NPR
programming during the year, about the same as in 2016, according to internal data provided by the organization.
Programming from PRI, which distributes programs such as The World and The Takeaway, reached a terrestrial
audience of about 9 million on average per week, the same as in 2016. Audience figures from American Public Media,
which produces Marketplace, increased to about 20.5 million average weekly listeners in 2017, up from approximately
19.1 million in 2016.
Weekly broadcast audience of NPR, PRI and APM
MY ACCOUNT
Audience
Economics
Newsroom investment
Find out more
Chart Share EmbedData
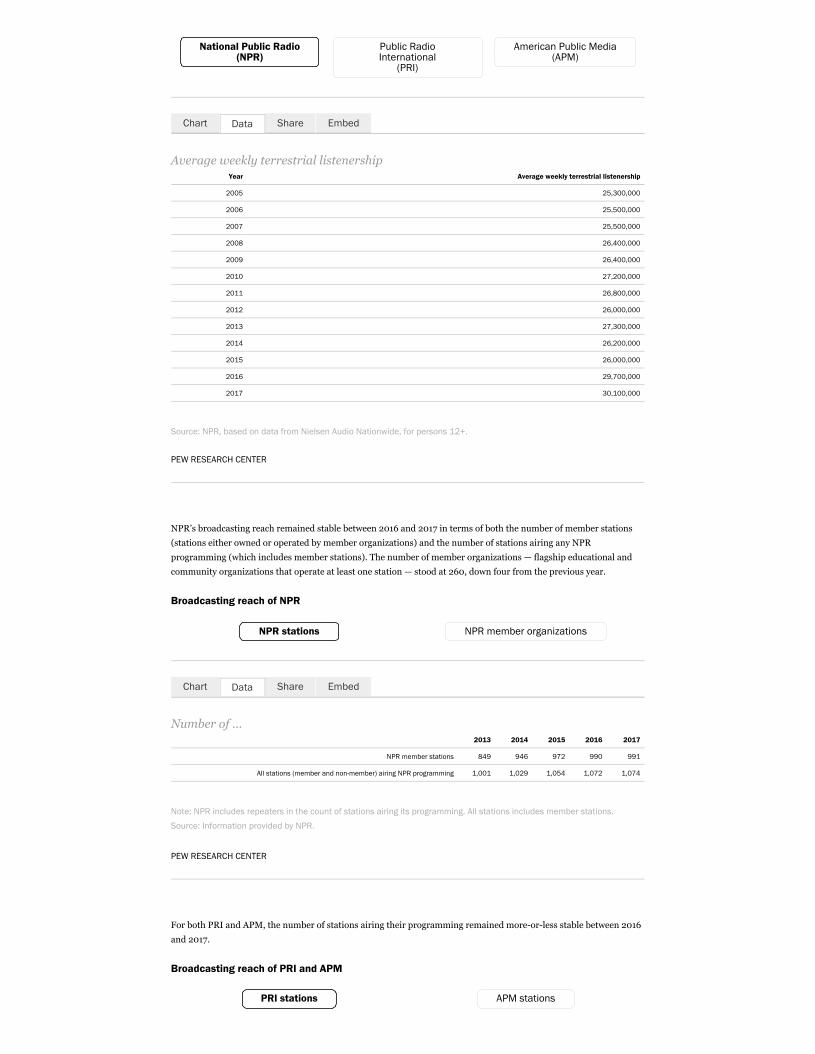
National Public Radio (NPR)
Public RadioInternational
(PRI)
American Public Media (APM)
Average weekly terrestrial listenershipYear Average weekly terrestrial listenership
2005 25,300,000
2006 25,500,000
2007 25,500,000
2008 26,400,000
2009 26,400,000
2010 27,200,000
2011 26,800,000
2012 26,000,000
2013 27,300,000
2014 26,200,000
2015 26,000,000
2016 29,700,000
2017 30,100,000
Source: NPR, based on data from Nielsen Audio Nationwide, for persons 12+.
PEW RESEARCH CENTER
NPR’s broadcasting reach remained stable between 2016 and 2017 in terms of both the number of member stations
(stations either owned or operated by member organizations) and the number of stations airing any NPR
programming (which includes member stations). The number of member organizations — flagship educational and
community organizations that operate at least one station — stood at 260, down four from the previous year.
Broadcasting reach of NPR
NPR stations NPR member organizations
Number of ...2013 2014 2015 2016 2017
NPR member stations 849 946 972 990 991
All stations (member and non-member) airing NPR programming 1,001 1,029 1,054 1,072 1,074
Note: NPR includes repeaters in the count of stations airing its programming. All stations includes member stations.
Source: Information provided by NPR.
PEW RESEARCH CENTER
For both PRI and APM, the number of stations airing their programming remained more-or-less stable between 2016
and 2017.
Broadcasting reach of PRI and APM
PRI stations APM stations
Chart Share EmbedData
Chart Share EmbedData
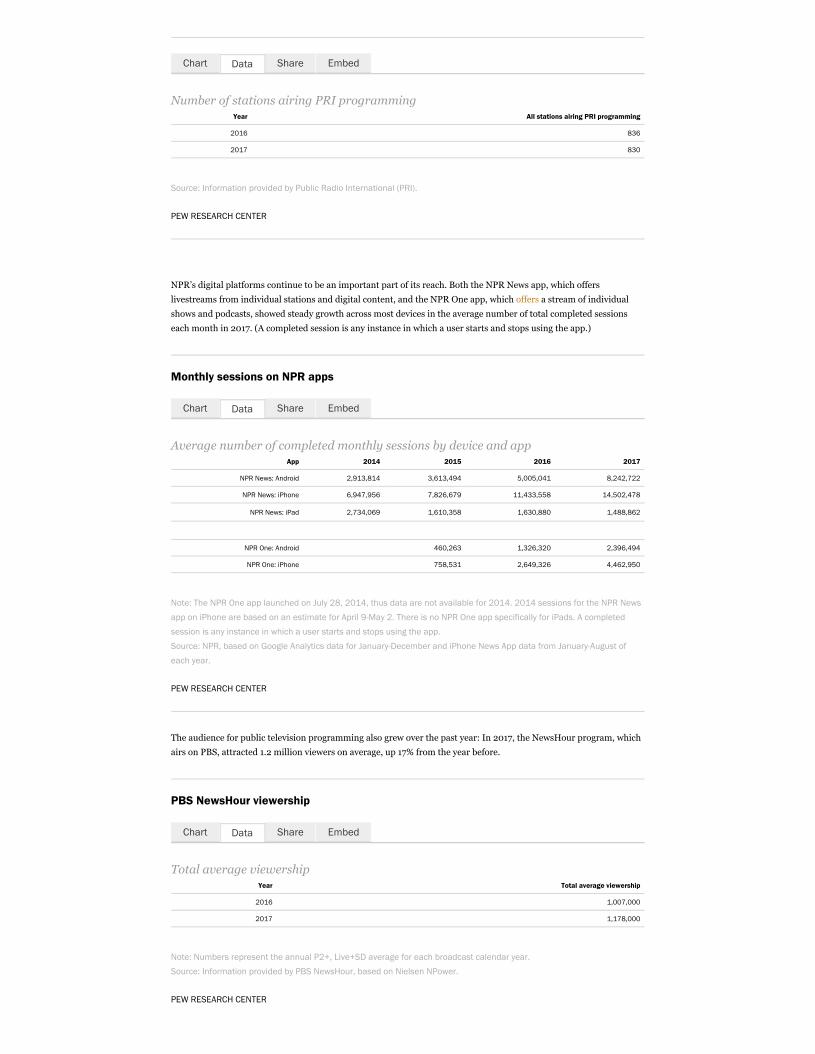
Number of stations airing PRI programming Year All stations airing PRI programming
2016 836
2017 830
Source: Information provided by Public Radio International (PRI).
PEW RESEARCH CENTER
NPR’s digital platforms continue to be an important part of its reach. Both the NPR News app, which offers
livestreams from individual stations and digital content, and the NPR One app, which offers a stream of individual
shows and podcasts, showed steady growth across most devices in the average number of total completed sessions
each month in 2017. (A completed session is any instance in which a user starts and stops using the app.)
Monthly sessions on NPR apps
Average number of completed monthly sessions by device and app App 2014 2015 2016 2017
NPR News: Android 2,913,814 3,613,494 5,005,041 8,242,722
NPR News: iPhone 6,947,956 7,826,679 11,433,558 14,502,478
NPR News: iPad 2,734,069 1,610,358 1,630,880 1,488,862
NPR One: Android 460,263 1,326,320 2,396,494
NPR One: iPhone 758,531 2,649,326 4,462,950
Note: The NPR One app launched on July 28, 2014, thus data are not available for 2014. 2014 sessions for the NPR News
app on iPhone are based on an estimate for April 9-May 2. There is no NPR One app specifically for iPads. A completed
session is any instance in which a user starts and stops using the app.
Source: NPR, based on Google Analytics data for January-December and iPhone News App data from January-August of
each year.
PEW RESEARCH CENTER
The audience for public television programming also grew over the past year: In 2017, the NewsHour program, which
airs on PBS, attracted 1.2 million viewers on average, up 17% from the year before.
PBS NewsHour viewership
Total average viewershipYear Total average viewership
2016 1,007,000
2017 1,178,000
Note: Numbers represent the annual P2+, Live+SD average for each broadcast calendar year.
Source: Information provided by PBS NewsHour, based on Nielsen NPower.
PEW RESEARCH CENTER
Chart Share EmbedData
Chart Share EmbedData
Chart Share EmbedData

Economics
The financial picture for news outlets in public broadcasting appears to be strong both locally and nationally.
At the national level, NPR increased its total operating revenue in 2017 to $233 million, up 9% from 2016 levels. APM
saw gains as well, rising 33% to about $168 million in total revenue for 2017. PRI’s total revenue, on the other hand,
went down 17% year over year, amounting to $18 million in 2017.
Total revenue for NPR, PRI and APM
NPR PRI APM
Total operating revenue (in U.S. dollars)Year Revenue
2015 $195,900,000
2016 $213,100,000
2017 $232,800,000
Source: Information provided by NPR.
PEW RESEARCH CENTER
At the local public radio level, an analysis of the public filings provided by the 123 largest news-oriented licensees
(organizations that operate local public radio stations) shows that in 2016 – the last year for which reliable data are
available – total revenue for this group was $829 million.
Local public radio station revenue
Total revenue for the 123 largest news-oriented public radio licensees (in U.S. dollars)Year Total revenue
2008 $662,255,028
2009 $635,097,527
2010 $680,632,046
2011 $736,772,807
2012 $742,374,640
2013 $775,779,526
2014 $821,923,867
2015 $806,928,542
2016 $829,367,948
Note: All figures are fiscal year, inflation-adjusted calculations. Data for these licensees were aggregated and provided by
Mark Fuerst, director of the consultancy Public Media Futures Forum, using the Annual Financial Reports submitted by
each licensee to the Corporation for Public Broadcasting (CPB).
Source: Public Media Futures Forum.
Chart Share EmbedData
Chart Share EmbedData

PEW RESEARCH CENTER
This revenue for local public radio comes from a range of streams, but individual giving (which includes member
revenue and major gifts) and underwriting (from both businesses and foundations and other nonprofit organizations)
are two key sources of funding. Among the 123 news-oriented licensees studied here, individual giving and
underwriting combined accounted for $556 million in revenue in 2016.
Individual giving and underwriting revenue for local public radio stations
Revenue for the 123 largest news-oriented public radio licensees (in U.S. dollars)Year Individual giving Underwriting
2008 $246,033,393 $186,811,947
2009 $260,202,855 $165,894,678
2010 $269,136,911 $166,988,900
2011 $289,700,081 $166,684,136
2012 $296,739,904 $180,117,773
2013 $311,323,553 $180,244,446
2014 $323,671,449 $192,482,447
2015 $339,148,175 $196,937,610
2016 $351,891,752 $203,778,343
Note: All figures are fiscal year, inflation-adjusted calculations. Data for these licensees were aggregated and provided by
Mark Fuerst, director of the consultancy Public Media Futures Forum, using the Annual Financial Reports submitted by
each licensee to the Corporation for Public Broadcasting (CPB).
Source: Public Media Futures Forum.
PEW RESEARCH CENTER
The total number of individual members – defined as anyone who has given money to one of the stations owned by
these 123 licensees in each calendar year – in 2016 was 2.1 million, about the same as the previous year.
Local public radio station membership
Total station membership for the 123 largest news-oriented public radio licenseesYear Total membership
2008 1,621,011
2009 1,701,256
2010 1,793,440
2011 1,943,306
2012 1,959,259
2013 2,019,808
2014 2,011,954
2015 2,050,438
2016 2,090,074
Note: Data for these licensees were aggregated and provided by Mark Fuerst, director of the consultancy Public Media
Futures Forum, using the Annual Financial Reports submitted by each licensee to the Corporation for Public Broadcasting
(CPB).
Source: Public Media Futures Forum.
PEW RESEARCH CENTER
Chart Share EmbedData
Chart Share EmbedData

On the television side, NewsHour derives its revenue from a variety of sources, including PBS, the Corporation for
Public Broadcasting (CPB) and a mix of “nonpublic” streams such as corporations, individual giving and foundations.
While the details about public sources of revenue were unavailable for this analysis, NewsHour did provide
information about its breakdown of nonpublic funding. In 2017, contributions from individuals comprised 13% of
total nonpublic funding. (Information on whether the total amount of this funding rose or fell was also unavailable.)
PBS NewsHour nonpublic funding makeup
% of PBS NewsHour's nonpublic funding revenueYear Individuals Corporations Foundations
2014 3% 41% 56%
2015 6% 23% 71%
2016 11% 19% 70%
2017 13% 17% 70%
Note: Numbers correspond to calendar year.
Source: Information provided by PBS NewsHour.
PEW RESEARCH CENTER
Newsroom investment
Program and production expenses for the 123 news-oriented local public radio licensees increased between 2015 and
2016 to $427 million, a growth rate of 7%. While program and production expenses comprise only a portion of overall
station expenses, an increase in these kinds of expenditures is an indicator that the stations are directing more dollars
towards the creation of news content.
Local public radio station expenses
Total program and production expenses for the 123 largest news-oriented public radiolicensees (in U.S. dollars)
Year Total program and production expenses
2008 $319,169,234
2009 $331,330,707
2010 $337,859,650
2011 $353,435,708
2012 $367,621,155
2013 $368,229,862
2014 $389,328,433
2015 $399,226,934
2016 $427,102,047
Note: All figures are fiscal year, inflation-adjusted calculations. Data for these licensees were aggregated and provided by
Mark Fuerst, director of the consultancy Public Media Futures Forum, using the Annual Financial Reports submitted by
each licensee to the Corporation for Public Broadcasting (CPB).
Source: Public Media Futures Forum.
PEW RESEARCH CENTER
Chart Share EmbedData
Chart Share EmbedData

Find out more
This fact sheet was compiled by Senior Writer/Editor Elizabeth Grieco.
Read the methodology.
Find more in-depth explorations of public broadcasting by following the link below:
Covering President Trump in a Polarized Media Environment, Oct. 2, 2017
Trump, Clinton Voters Divided in Their Main Source for Election News, Jan. 18, 2017
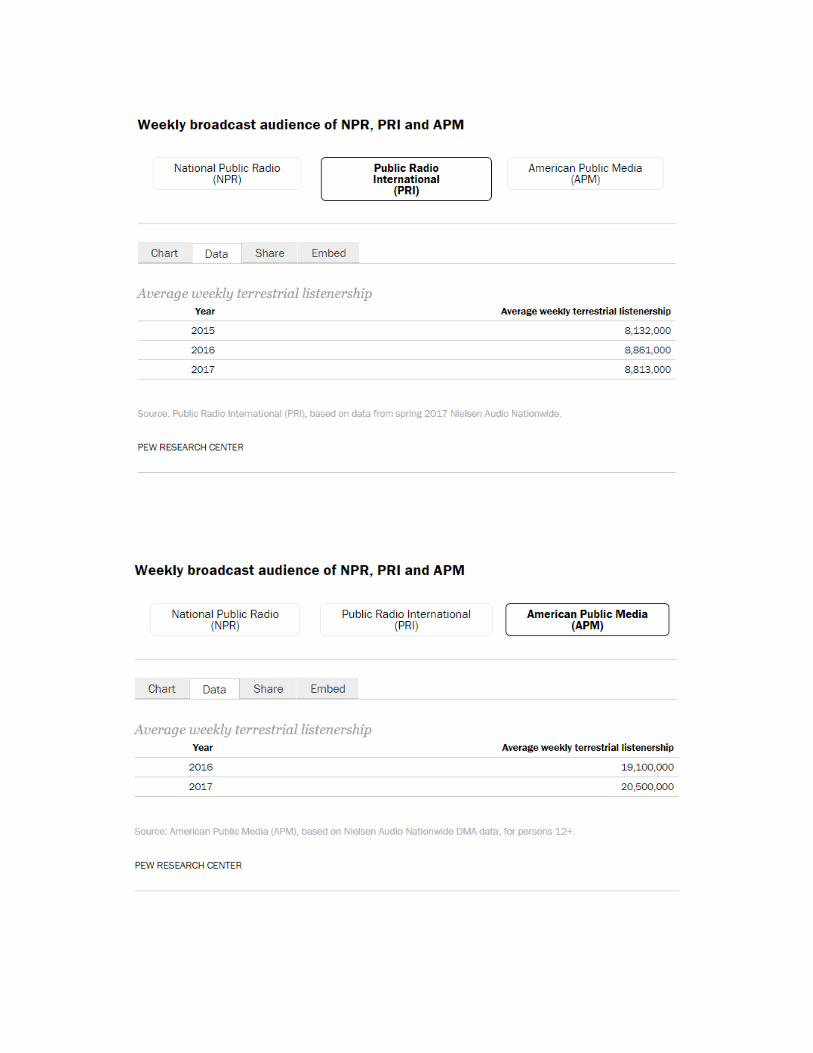


SEARCH
NUMBERS, FACTS AND TRENDS SHAPING YOUR WORLD ABOUT FOLLOW DONATE
Journalism & Media
MENU RESEARCH AREAS
JULY 25, 2018
State of the News Media MethodologyThe State of the News Media fact sheets use a range of different methodologies to study the health of the U.S. news industry,including custom analysis of news audience behavior, secondary analysis of industry data and direct reporting to solicitinformation unavailable elsewhere.
State of the News Media industry data
The State of the News Media fact sheets consist of data originally generated by other individuals or organizations that PewResearch Center then collected and aggregated.
For the data aggregated from other researchers, Pew Research Center’s team took several steps. First, Center researchers triedto determine what data had been collected and by whom for the media sectors studied. In many cases, this included securingrights to data through license fees or other means, and often included paying for use of the data.
Next, we studied the data closely to determine where elements reinforced each other and where there were apparentcontradictions or gaps. In doing so, Pew Research Center endeavored to determine the value and validity of each dataset.That, in many cases, involved going back to the sources that collected the research in the first place. Where data conflicted,the Center has included all relevant sources and tried to explain their differences, either in footnotes or in the narratives.
All sources are cited in footnotes or within the narrative and in all graphics in the report.
Analysis of comScore digital audience data
In order to provide as clear a sense as possible of the digital audience data of U.S. news organizations, researchers tookseveral steps using digital audience measurement data from comScore, a cross-platform measurement company.
After the initial selection process, each comScore entry representing an outlet or website (“entity”) was individually vetted byresearchers and unusual shifts in data over time were checked with comScore analysts. Using feedback from analysts, entitiesthat registered increases or declines in unique visitors over the time period studied (October 2014-December 2017) that werelikely due to inorganic changes in measurement or site structure were considered to not have trendable data and wereremoved from the analysis.
For all outlets, entities that are representative of an entire web domain (“total domain entities”) were used whenever possible.When domain entities were incomplete – i.e., when they did not represent traffic to an entire web domain – custom entitiesthat represent the total domain were used when available. Multiple entities of the same URL that were the result of a structurechange in the comScore database over time were considered comparable. Researchers consulted comScore analyststhroughout the entity selection process.
Selection
Newspapers: Researchers first assembled a list of the top 49 newspapers by average Sunday circulation for Q3 2015, Q3 2016and Q3 2017 according to the Alliance for Audited Media data. The Wall Street Journal was then added to the list, as it is oneof the largest papers in the U.S. but does not have a Sunday edition, to produce a list of the top 50 newspapers by circulation.Each was matched with its associated total-domain entities in comScore. Researchers then analyzed the comScore data forOctober, November and December in each year. The following 50 entities were used in 2017:
AJC.COM ARKANSASONLINE.COM AZCENTRAL.COM BALTIMORESUN.COM BOSTONGLOBE.COM BUFFALONEWS.COM CHICAGOTRIBUNE.COM CHRON.COM
MY ACCOUNT
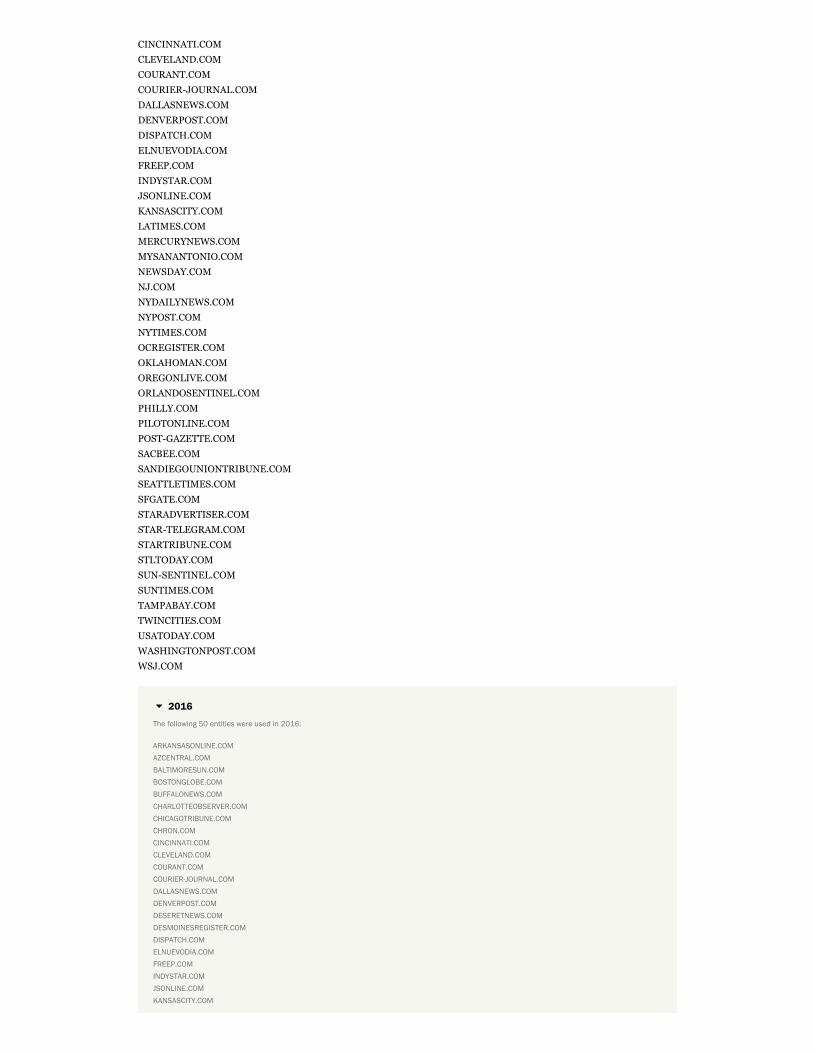
CINCINNATI.COM CLEVELAND.COM COURANT.COM COURIER-JOURNAL.COM DALLASNEWS.COM DENVERPOST.COM DISPATCH.COM ELNUEVODIA.COM FREEP.COM INDYSTAR.COM JSONLINE.COM KANSASCITY.COM LATIMES.COM MERCURYNEWS.COM MYSANANTONIO.COM NEWSDAY.COM NJ.COM NYDAILYNEWS.COM NYPOST.COM NYTIMES.COM OCREGISTER.COM OKLAHOMAN.COM OREGONLIVE.COM ORLANDOSENTINEL.COM PHILLY.COM PILOTONLINE.COM POST-GAZETTE.COM SACBEE.COM SANDIEGOUNIONTRIBUNE.COM SEATTLETIMES.COM SFGATE.COM STARADVERTISER.COM STAR-TELEGRAM.COM STARTRIBUNE.COM STLTODAY.COM SUN-SENTINEL.COM SUNTIMES.COM TAMPABAY.COM TWINCITIES.COM USATODAY.COM WASHINGTONPOST.COM WSJ.COM
2016
The following 50 entities were used in 2016:
ARKANSASONLINE.COM
AZCENTRAL.COM
BALTIMORESUN.COM
BOSTONGLOBE.COM
BUFFALONEWS.COM
CHARLOTTEOBSERVER.COM
CHICAGOTRIBUNE.COM
CHRON.COM
CINCINNATI.COM
CLEVELAND.COM
COURANT.COM
COURIER-JOURNAL.COM
DALLASNEWS.COM
DENVERPOST.COM
DESERETNEWS.COM
DESMOINESREGISTER.COM
DISPATCH.COM
ELNUEVODIA.COM
FREEP.COM
INDYSTAR.COM
JSONLINE.COM
KANSASCITY.COM

LATIMES.COM
MERCURYNEWS.COM
MIAMIHERALD.COM
MYSANANTONIO.COM
NEWSDAY.COM
NJ.COM
NORTHJERSEY.COM
NYDAILYNEWS.COM
NYPOST.COM
NYTIMES.COM
OCREGISTER.COM
OREGONLIVE.COM
ORLANDOSENTINEL.COM
PHILLY.COM
PILOTONLINE.COM
POST-GAZETTE.COM
SACBEE.COM
SANDIEGOUNIONTRIBUNE.COM
SEATTLETIMES.COM
SFGATE.COM
STAR-TELEGRAM.COM
STARTRIBUNE.COM
STLTODAY.COM
SUN-SENTINEL.COM
TWINCITIES.COM
USATODAY.COM
WASHINGTONPOST.COM
WSJ.COM
2014/2015
The 2014 cohort was compiled based on 2015 data, so the entities are the same. The 50 sites in those cohorts were:
AJC.COM
ARKANSASONLINE.COM
AZCENTRAL.COM
BALTIMORESUN.COM
BOSTONGLOBE.COM
BUFFALONEWS.COM
CHICAGOTRIBUNE.COM
CHRON.COM
CINCINNATI.COM
CLEVELAND.COM
COURIER-JOURNAL.COM
DAILYNEWS.COM
DALLASNEWS.COM
DENVERPOST.COM
DISPATCH.COM
ELNUEVODIA.COM
FREEP.COM
INDYSTAR.COM
JSONLINE.COM
KANSASCITY.COM
LATIMES.COM
MERCURYNEWS.COM
MYSANANTONIO.COM
NEWSDAY.COM
NJ.COM
NORTHJERSEY.COM
NYDAILYNEWS.COM
NYPOST.COM
NYTIMES.COM
OCREGISTER.COM
OREGONLIVE.COM
ORLANDOSENTINEL.COM
PHILLY.COM
POST-GAZETTE.COM
SACBEE.COM
SEATTLETIMES.COM
SFGATE.COM
STAR-TELEGRAM.COM
STARTRIBUNE.COM
STLTODAY.COM
SUN-SENTINEL.COM
TAMPABAY.COM
TBO.COM
TENNESSEAN.COM
TRIBLIVE.COM
TWINCITIES.COM

USATODAY.COM
UTSANDIEGO.COM and SANDIEGOUNIONTRIBUNE.COM (combined; publisher changed the listed name of their primary website in July 2015)
WASHINGTONPOST.COM
WSJ.COM
Digital-native news outlets: Researchers assessed all domains from 11 comScore categories (Business/Finance,Directories/Resources, Entertainment, Games, Lifestyles, News/Information, Regional/Local, Services, Social Media, Sportsand Technology) with at least 10 million average monthly unique digital visitors in the fourth quarter of 2017. From that set ofentities, they then selected digital-native news outlets using the following criteria:
1. Must be “born on the web,” i.e. not the website of a legacy news brand (Note: may be owned by a legacy mediacompany).
2. It is a publisher of original content about news, defined as current events affecting public life (can include both originalreporting and commentary/analysis). Sites are judged by an assessment of the material appearing on their home page. Areview of top stories on the home page must render some evidence of original reporting, such as interviews, eyewitnessaccounts or referral to source documents, by a dedicated reporter/editorial staff. Sites are also judged as news publishersif they self-describe as an organization that produces news, either in the subject headers/navigation bar and/or in their“about” or advertising section through usage of terms like “news,” “journalism,” “covering” or “informing.”
3. It is not entirely focused on reviews, advice, recipes or unedited raw data.
4. It is not primarily a user-generated or aggregated content platform (such as Medium, Reddit or Wikipedia). Brandedcontent such as NBA.com was also excluded.
The following 35 entities were used for 2017:
12UP.COM 247SPORTS.COM BGR.COM BLEACHERREPORT.COM BREITBART.COM BUSINESSINSIDER.COM BUSTLE.COM BUZZFEED.COM CNET.COM DEADSPIN.COM DIGITALTRENDS.COM EATER.COM ELITEDAILY.COM GAMESPOT.COM GIZMODO.COM HUFFINGTONPOST.COM IBTIMES.COM IGN.COM INVESTOPEDIA.COM JEZEBEL.COM MASHABLE.COM MAXPREPS.COM POLITICO.COM QZ.COM REFINERY29.COM SBNATION.COM SLATE.COM THEDAILYBEAST.COM THEVERGE.COM THRILLIST.COM TMZ.COM TOPIX.NET UPROXX.COM UPWORTHY.COM VOX.COM

A fresh cohort was chosen in each year using the criteria above. Audience information was calculated based on the cohort forthat year to reflect the characteristics of the most popular digital-native sites at the time.
2016
The 36 sites in the 2016 cohort were:
247SPORTS.COM
BLEACHERREPORT.COM
BREITBART.COM
BUSINESSINSIDER.COM
BUSTLE.COM
BUZZFEED.COM
CNET.COM
DEADSPIN.COM
DIGITALTRENDS.COM
ELITEDAILY.COM
FIVETHIRTYEIGHT.COM
GIZMODO.COM
HELLOGIGGLES.COM
HOLLYWOODLIFE.COM
HUFFINGTONPOST.COM
IBTIMES.COM
IFLSCIENCE.COM
IGN.COM
IJR.COM
MASHABLE.COM
MIC.COM
OPPOSINGVIEWS.COM
POLITICO.COM
QZ.COM
RAWSTORY.COM
REFINERY29.COM
SBNATION.COM
SLATE.COM
THEDAILYBEAST.COM
THEVERGE.COM
THRILLIST.COM
TMZ.COM
TOPIX.COM
UPROXX.COM
UPWORTHY.COM
VOX.COM
2014/2015
The 2014 cohort was compiled based on 2015 data, so the entities are the same. The 40 sites in those cohorts were:
247SPORTS.COM
APLUS.COM
BLEACHERREPORT.COM
BREITBART.COM
BUSINESSINSIDER.COM
BUSTLE.COM
BUZZFEED.COM
CHEATSHEET.COM
CINEMABLEND.COM
CNET.COM
DAILYDOT.COM
DEADSPIN.COM
DIGITALTRENDS.COM
ELITEDAILY.COM
ENGADGET.COM
GIZMODO.COM
HELLOGIGGLES.COM
HOLLYWOODLIFE.COM
HUFFINGTONPOST.COM
IBTIMES.COM
IJREVIEW.COM
MASHABLE.COM
MIC.COM
OPPOSINGVIEWS.COM
QZ.COM
RARE.US
RAWSTORY.COM
REFINERY29.COM
SALON.COM
SBNATION.COM

SLATE.COM
THEBLAZE.COM
THEDAILYBEAST.COM
THEROOT.COM
THEVERGE.COM
THRILLIST.COM
TMZ.COM
UPROXX.COM
UPWORTHY.COM
VOX.COM
Analysis
For each website, minutes per visit and unique visitors for October-December of each year were acquired from the comScoreMedia Metrix database for Total Digital Population.
Comparisons year over year are between monthly averages of October-December data in each year.
For sites that didn’t meet the reporting threshold for one month out of a quarter, we averaged across the two months forwhich we had data.
Digital-native news outlet audit
Researchers studied several outreach avenues that digital-native news outlets could take to engage with their audiences. Formobile apps, researchers searched the Google Play and iOS App Store for official apps from each outlet. For newsletters,researchers searched each outlet’s site for a sign-up form. For Apple News, researchers searched the Apple News app forofficial channels for the outlet. For podcasts, researchers searched the iTunes podcast store for podcasts from the outlet andperformed a search on each outlet’s site. An outlet was determined to support comments if at least one of the first five storieson its homepage supported comments at the time of analysis. For social media outreach, researchers searched for officialpages, accounts or channels for the outlet on each platform, as well as on the outlet’s primary website.
Employment and wage data
Fact sheets released after May 31, 2018, include employment and wage trends based on data from the Bureau of LaborStatistics (BLS) Occupational Employment Statistics (https://www.bls.gov/oes/oes_emp.htm) (OES) survey. We use the OESdata to estimate employment and median wages for four media-related occupations in five information-producing industries.The OES survey produces annual estimates of occupational employment and wage rates for full- and part-time wage andsalary workers (excluding the self-employed) in nonfarm establishments.
The Center’s analyses focus on five industries (https://www.census.gov/cgi-bin/sssd/naics/naicsrch?
chart_code=51&search=2012%20NAICS%20Search) : 1) newspaper publishers, 2) television broadcasting, 3) cable and othersubscription programming, 4) radio broadcasting and 5) other information services, which is the best match for digital-nativepublishers. (See below for more information on this category.)
Within each industry, the number of newsroom employees is limited to four occupations(https://www.bls.gov/soc/2010/2010_major_groups.htm) associated with news production: 1) news analysts, reporters andcorrespondents; 2) editors; 3) photographers (e.g., photojournalists) and 4) television, video, and motion picture cameraoperators and editors (e.g., news videographers, television news video editors). This allows a focus on newsroom staff rather
than those on the business or distribution side, such as advertising sales agents, printing press operators and delivery truckdrivers. (It does not allow for the inclusion of layout artists, designers or digital producers, as there are no occupation codesfor employees doing this work specifically in the group of media and communication equipment workers(https://www.bls.gov/soc/2010/2010_major_groups.htm) .)
The OES survey (https://www.bls.gov/oes/) produces employment and wage estimates annually for over 800 occupations.National occupational estimates for specific industries are also available. The wage data presented are adjusted for inflation,using annual averages from the BLS Consumer Price Index Research Series (https://www.bls.gov/cpi/research-series/home.htm)
(CPI-U-RS), with the latest year in the trend as the base year.
Using this single source of data allows for comparable employment estimates across the industry groups by standardizing theoccupations included rather than relying on estimates that are either specific to certain sectors of the news media industry orare not produced on an annual basis.
Few other surveys produce estimates of newsroom employees, but the OES data closely tracks those sources that are available.When compared with the annual census of full-time newspaper journalists performed by the American Society of NewsEditors (http://asne.org/newsroom_diversitysurvey) (ASNE), the employment estimates from OES for the newspaper publishersindustry are slightly higher – in part due to the inclusion of part-time employees in the OES data – but follow the samegeneral trend.
1

(https://www.journalism.org/pj_2018-06-06_state-of-the-news-media-
employment-and-wage-methodology_001/) The OES employmentestimates for the television broadcasting industry also closely followestimates of the number of local television station newsroomemployees published by the Radio Television Digital NewsAssociation (https://www.rtdna.org/channel/staffing_profitability)
(RTDNA).
No current, publicly available surveys provide comparableemployment statistics for the cable, radio or digital news industries.
OES data, however, does naturally carry some limitations. Forexample, OES uses the federal government’s Standard OccupationalClassification (https://www.bls.gov/soc/2010/2010_major_groups.htm)
system, making the occupations for which they have wage data notquite as fine-grained or industry-specific as the salary datapublished by RTDNA, which uses a classification system tailored toinclude specific occupations in the television and radio industries,such as weathercaster, sports anchor or tape editor.
Additionally, OES uses the federal government’s North AmericanIndustry Classification System(https://www.census.gov/eos/www/naics/) (NAICS), which subsumesthe category most closely corresponding to digital-native publishers– internet publishing and broadcasting and web search portals –under the broader other information services industry, and onlyallows the data to be broken out for this umbrella category.
We believe the estimates of this broader industry still reflect theemployment and wage trends of digital-native publishing for tworeasons. First, internet publishing and broadcasting and web searchportals make up about three-quarters (78%) of the otherinformation services industry, according to the 2017 CurrentEmployment Statistics (https://www.bls.gov/ces/) survey. Second, ithas represented 60% or more of the other information servicesindustry since 2008.
However, the number of digital-native newsroom employees overtime may be slightly elevated as they include newsroom employeesfrom other categories in the broader other information sourcesindustry, such as those from the news syndicates category. It alsomay include legacy news organizations that are now publishedexclusively on the web. Because of these limitations, and given thatdigital news is a rapidly-evolving industry, the most valuableinformation derived from these data are not annual employment and wage levels but trends over time.
Note that we show the employment data for the other information services industry starting from 2008. This is because OESswitched from the 2002 NAICS to the 2007 NAICS beginning with the May 2008 estimates, and the other informationservices industry is defined differently under the two systems. Data for the newspaper, radio, television and cable industrieswere not similarly affected. Additionally, OES may withhold from publication employment and wage data for someoccupations due to, for example, failure to meet Bureau of Labor Statistics quality standards or the need to protect theconfidentiality of survey respondents. Gaps in the trend data we present reflect these limitations in the OES data.
The OES survey (https://www.bls.gov/news.release/ocwage.tn.htm) produces annual estimates by combining six panels of datacollected over a three-year period. Every year, two new panels of data are added, and the two oldest panels are dropped,resulting in a moving average staffing pattern. The three years of employment data are benchmarked to represent the totalemployment for the reference period. Because annual estimates from overlapping three-year periods are based on nearly thesame data, it is difficult to make conclusive year-to-year comparisons. Comparisons are best made between non-overlappingperiods. OES data are not designed for making comparisons through time, and such comparisons should be interpreted withcaution.
Acknowledgments
In addition to those who compiled the fact sheets, Elizabeth Grieco developed the employment methodology. Assistance indata analysis was provided by Sophia Fedeli, Nami Sumida and Mason Walker. Ariana Rodriguez-Gitler, Sara Atske andMargaret Porteus provided web producing and graphic support, while Hannah Klein and Rachel Weisel provided

DONATE
communication support.
1. In applying this group of occupations across different sectors of the news media, we make the assumption that this fourth category – television, video and motion
picture camera operators and editors – includes people working as web video producers for websites and other digital products of newspapers or radio broadcasters. ↩
MAKE A FINANCIAL CONTRIBUTION TO SUPPORT OUR WORK