journal of volcanology and geothermal...
TRANSCRIPT

Journal of Volcanology and Geothermal Research xxx (2010) xxx–xxx
VOLGEO-04579; No of Pages 17
Contents lists available at ScienceDirect
Journal of Volcanology and Geothermal Research
j ourna l homepage: www.e lsev ie r.com/ locate / jvo lgeores
Emplacement dynamics of phonolite magma into maar-diatremestructures — Correlation of field, thermal modeling and AMS analogue modeling data
Prokop Závada a,⁎, Petr Dědeček a, Karel Mach b, Ondrej Lexa c, Marcel Potužák d
a Geophysical Institute, Academy of Sciences of the Czech Republic, Boční II/1401, 141 31 Prague 4, Czech Republicb Severočeské doly a.s., Doly Bílina, ul. 5. května 213, 418 29, Bílina, Czech Republicc Institute of Petrology and Structural Geology, Charles University,Prague, Czech Republicd CORNING Inc., SP-FR-04 R4S12F, Corning, NY 148 31, USA
⁎ Corresponding author. Tel.: +420 267 103313; FaxE-mail address: [email protected] (P. Závada).
0377-0273/$ – see front matter © 2010 Elsevier B.V. Aldoi:10.1016/j.jvolgeores.2010.07.012
Please cite this article as: Závada, P., et al., Ethermal modeling and AMS analogue mod
a b s t r a c t
a r t i c l e i n f oArticle history:Received 28 January 2010Accepted 18 July 2010Available online xxxx
Keywords:phonolitemaar-diatrememagma emplacement dynamicsthermal modelingAMS analogue modelingcavitation
Emplacement mode and original shape and dimensions of a well exposed phonolite body in the Českéstředohoří Mountains (Czech Republic) were reconstructed using combined techniques of structural analysisof magmatic fabrics and columnar jointing together with analogue and thermal mathematical modeling ofcooling for different shapes of experimental bodies. Phreatomagmatic rocks in the vicinity of some phonolitestocks in the area of interest suggest that the phonolite bodies were likely emplaced into maar-diatremes.Our modeling revealed that intrusion of magma into phreatomagmatic maar-diatreme craters can result incryptodomes, extrusive domes, lava lakes or branched intrusions. The fabric and columnar jointing pattern ofthe selected phonolite body reveals best fit with an asymmetric extrusive dome emplaced into the maarcrater. The scaling analysis and thermal modeling also suggest that the phonolite extrusion could haveformed within 6–66 days and cooled to the background temperature after 10,000 years. Combined analogueand thermal modeling also revealed that the phonolite extrusions into maar-diatreme craters are marked byupper tier (collonade) of vertical columns and lower tier of curved and outward flaring columns. Both tiers inthe phonolite extrusions are divided by a subhorizontal suture.
: +420 272 761549.
l rights reserved.
mplacement dynamics of phonolite magma ineling data..., J. Volcanol. Geotherm. Res. (2010
© 2010 Elsevier B.V. All rights reserved.
1. Introduction
Phonolite and trachyte bodies form expressive landmarks inseveral Tertiary intra-continental volcanic provinces in Europe.These provinces are associated with the rift systems of Rhein graben(Germany), Eger rift in Bohemian Massif (Czech Republic) andLimagne graben (France) that formed due to complex tectonicprocesses in the foreland of the Alpine orogeny (Fig. 1). Phonoliteand trachyte magmas were emplaced during the last evolution stagesof these rift systems (Camus, 1975; Kopecký, 1978).
The emplacementmechanism and original shapes of phonolite andtrachyte bodies are often poorly constrained, because of unknownpaleosurface level and poor exposure of the host rocks in theirsurroundings, although they likely represent eroded remnants ofcryptodomes, lava domes, laccoliths, lava flows or exposed volcanicconduits (Varet, 1971; Camus, 1975; Kopecký, 1978; Ulrych et al.,2000; Lorenz and Haneke, 2004; Závada et al., 2009b). A puzzlingevidence in the phonolite bearing volcanic provinces is that both low-aspect ratio (coulées or thin laccoliths) and high-aspect ratio bodies(e.g. cryptodomes) can be found, which reflects either different local
environment of themagma/lava emplacement (e.g. flat surface versusvolcanic crater) or less likely the large variation in rheologicalproperties of magma controlled by crystal content andmelt chemistry(Dingwell et al., 1996; Saar et al., 2001; Giordano et al., 2004). Anotherunresolved feature of phonolite magma emplacement is that someindividual phonolite bodies merge in plan-view with neighboringbodies, while others form solitarymonuments. Earlier detailed studiesof phonolites and trachytes attempted to define their emplacementmode using flow kinematics deduced from internal fabrics andfractures and considered the phonolite bodies as extrusion domesor “squeeze-upmounds” of highly viscousmagma on the paleosurface(Cloos and Cloos, 1927; Varet, 1971; Jančušková et al., 1992; Arbaretet al., 1993; Závada et al., 2009b). In some cases, slices of basementrocks were reported to be uplifted by viscous drag of themagma alongthe steep walls of the intrusions (Varet, 1971; Kopecký, 1978).
For a group of phonolite stocks close to Most town in the Českéstředohoří Mountains in Bohemia (Fig. 1), Kopecký (1985) suggestedthat these represent teardrop shaped intrusions into maar-diatremes,while Fediuk (1985) proposed that these are only remnants of adifferentially eroded coulée of phonolite lava. The first explanation issupported by outcrops of maar deposits in the vicinity of the phonolitestocks (Kopecký, 2000). Intrusion of magma into the maar-diatremes(phreatomagmatic volcanoes) is typical for the final stage of thephreatomagmatic volcano evolution, when the influx of water
to maar-diatreme structures — Correlation of field,), doi:10.1016/j.jvolgeores.2010.07.012

Fig. 1. Geological map and a vertical profile of the studied area (simplified andmodified after Kopecký (1991)). Position of the Eger rift in the structure of the European Variscides andextent of the České středohoří volcanic centre in the Eger graben (simplified after Cajz et al., 1999) is also depicted (RG— Rhein graben, RM— RhenishMassif, BM— BohemianMassif,AM — Armorican Massif, MS —Massif Central). Numbers designate specific phonolite bodies described in the text: 1 — Bořeň body, 2 — Želenický Hill, 3 — Zlatník, 4 — Červený Hill,5 — Hněvín, 6 — Široký Hill, 7 — Ryzelský Hill, 8 — basanitic maar 1 km S of village Liběšice, 9 — Kaňkov Hill, 10 — A large diatreme crater with a phonolite body revealed by drillingworks during coal mining exploration, 11 — Špičák. Inset of the vertical profile depicts a hypothetical geological setting at the time of the Bořeň phonolite body emplacement.Volcanic products of the 3rd volcanic phase (Cajz et al., 1999) are not present in the map.
2 P. Závada et al. / Journal of Volcanology and Geothermal Research xxx (2010) xxx–xxx
triggering the phreatomagmatic explosions in the root zone of thevolcano is terminated or insufficient (Konečný and Lexa, 2003;Lorenz, 2003; Martin and Németh, 2004, 2005; Auer et al., 2007).The mechanical interaction between intruding magma and host maarsediments or the tuff ring surrounding the phreatomagmaticvolcanoes was documented for basalts by Konečný and Lexa (2003)and Martin and Németh (2005), respectively. However, possibleintrusion/extrusion shapes and emplacement dynamics of magmainto the weakly consolidated explosive deposits of the maar-diatremesystems was not yet systematically evaluated, e.g. by numerical oranalogue modeling.
In this contribution, we constrain the shapes and emplacementdynamics of phonolite bodies emplaced into phreatomagmatic cratersusing a combined approach of field analysis of magmatic fabrics andcooling fractures together with analogue modeling and thermalmodeling of their cooling. At first, we measured the spatialdistribution of fabrics and columnar jointing on exceptionally wellexposed Bořeň u Bíliny phonolite body, which was probably emplacedinto a phreatomagmatic crater. Several analogue models of magmaemplacement into phreatomagmatic craters were then created to testthe similarity of their relative dimensions and internal fabrics withthose on the Bořeň phonolite body. Finally, thermal models based onthe geometry of selected analogue models and equipped withthermophysical parameters characterizing the rocks in the fieldwere constructed for comparison of the thermal models and thethermal structure of the Bořeň phonolite body. The shapes of analoguemodels ranged between teardrop shaped cryptodomes to lava domeswith outward flaring thick stems or lava lakes with flat bottom surfacedepending mainly on the degree of initial overpressure of theanalogue material and also on the “thickness” of the intruding
Please cite this article as: Závada, P., et al., Emplacement dynamics of phthermal modeling and AMS analogue modeling data..., J. Volcanol. Geot
material controlled by the mixing ratio of the analogue melt (water)and analogue crystals (plaster of Paris). Our modeling implies that themost probable geometry for the Bořeň body is an asymmetricalextrusion, where the model magma intruded the maar-diatremestructure through the center of the crater, partially pushed aside thefilling of the maar and extruded and extended laterally by inflationand diffluence on the crater floor. In some cases, intrusion of theanalogue material branched within the model diatreme and resultedin two subsequently emplaced extrusive bodies on the craterperiphery. Our results also suggest a new explanation for thegeological origin of both Devils Tower and Missouri Buttes phonolitebodies (WY, USA), which will be further elaborated in a special paper.
2. Geological setting
The Tertiary volcanic activity in the region of České středohoříMountains is associated with the SW–NE trending continental EgerRift corresponding to a reactivated first order Variscan tectonicboundary (Plomerová et al., 2003; Hrubcová et al., 2005. The rifting inthis area was accompanied with mantle upwelling and severaltectonic phases of reactivation of deep seated regional fabrics andfaults (Špičák and Horálek, 2001; Uličný, 2001).
The volcanic activity in the region can be divided into three mainperiods (Cajz et al., 1999): (1) low-differentiated, weakly crustal-contaminated upper mantle magmas — basanitic lavas (carryinglherzolite xenoliths) and volcanoclastics, 36–26 Ma in age, (2) trachy-basaltic magmas and volcanoclastics including trachytes and phono-lites of bimodal tephrite/basanite–phonolite suite, marked by crustaldifferentiation and assimilation of the primary mantle magma and bythe lack of lherzolite xenoliths, 31–25 Ma in age, and (3) flows of
onolite magma into maar-diatreme structures — Correlation of field,herm. Res. (2010), doi:10.1016/j.jvolgeores.2010.07.012
3P. Závada et al. / Journal of Volcanology and Geothermal Research xxx (2010) xxx–xxx
basanites, geochemically similar to the first group, dated at 24 Ma. Thefirst group of volcanic products forms subvertical dykes or lava flowsalong the major faults bounding the rift. The phonolites and trachytesof the second phase intrude the Cretaceous sediments and thevolcano–sedimentary sequences of the first phase along minor faultswithin the complex graben structure and are emplaced as shallowintrusive laccoliths, extrusive domes or intrusions into maar-diatremes (Kopecký, 1978; Ulrych et al., 2000). These bodies havecircular or elliptical form in the map and are aligned along the SW–NEtrending faults of the Eger rift system. The volcanic products of thethird phase are not present in the studied area and consist of basanitelava flows close to Děčín town.
The best exposed phonolite body in the České středohoříMountains is the Bořeň u Bíliny forming a prominent landmark inthe vicinity of Bílina town (Fig. 1, body no. 1). The Bořeň phonolite isclassified as a nephelinic phonolite, because it contains abundantnepheline (up to 5 vol.%) or simply as phonolite according to the USGSchemical classification (Le Bas et al., 1986; Hrouda et al., 2005). Otherphonolite bodies, Želenický Hill and Zlatník, of similar compositionand texture are aligned behind the Bořeň Hill at a distance of 2 and3 km, respectively, in the WSW direction. Other three large phonolitebodies occur further west on the periphery of the Most town. Two ofthem, Široký Hill and Hněvín, merge in the map on their circumfer-ence. Ryzelský Hill is the largest in areal extent and represents asolidified coulée of phonolite lava (Kavka, 1981). Other threesubcircular bodies are present east and northeast from Most town;Špičák (no. 11), Červený Hill (no. 4) and a phonolite plug revealed bycoal exploration drilling works under the Quaternary deposits 1 kmeast from Červený Hill (Fig. 1, body no. 10). Other irregular patches of
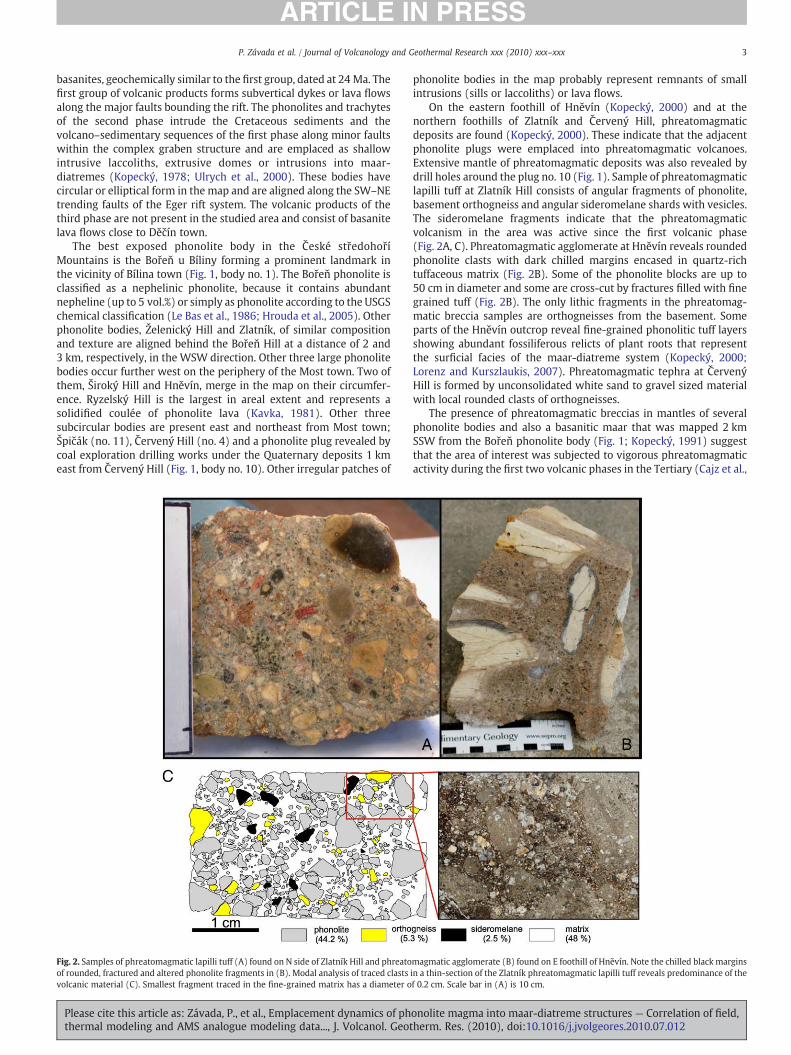
Fig. 2. Samples of phreatomagmatic lapilli tuff (A) found on N side of Zlatník Hill and phreatoof rounded, fractured and altered phonolite fragments in (B). Modal analysis of traced clastsvolcanic material (C). Smallest fragment traced in the fine-grained matrix has a diameter o
Please cite this article as: Závada, P., et al., Emplacement dynamics of phthermal modeling and AMS analogue modeling data..., J. Volcanol. Geot
phonolite bodies in the map probably represent remnants of smallintrusions (sills or laccoliths) or lava flows.
On the eastern foothill of Hněvín (Kopecký, 2000) and at thenorthern foothills of Zlatník and Červený Hill, phreatomagmaticdeposits are found (Kopecký, 2000). These indicate that the adjacentphonolite plugs were emplaced into phreatomagmatic volcanoes.Extensive mantle of phreatomagmatic deposits was also revealed bydrill holes around the plug no. 10 (Fig. 1). Sample of phreatomagmaticlapilli tuff at Zlatník Hill consists of angular fragments of phonolite,basement orthogneiss and angular sideromelane shards with vesicles.The sideromelane fragments indicate that the phreatomagmaticvolcanism in the area was active since the first volcanic phase(Fig. 2A, C). Phreatomagmatic agglomerate at Hněvín reveals roundedphonolite clasts with dark chilled margins encased in quartz-richtuffaceous matrix (Fig. 2B). Some of the phonolite blocks are up to50 cm in diameter and some are cross-cut by fractures filled with finegrained tuff (Fig. 2B). The only lithic fragments in the phreatomag-matic breccia samples are orthogneisses from the basement. Someparts of the Hněvín outcrop reveal fine-grained phonolitic tuff layersshowing abundant fossiliferous relicts of plant roots that representthe surficial facies of the maar-diatreme system (Kopecký, 2000;Lorenz and Kurszlaukis, 2007). Phreatomagmatic tephra at ČervenýHill is formed by unconsolidated white sand to gravel sized materialwith local rounded clasts of orthogneisses.
The presence of phreatomagmatic breccias in mantles of severalphonolite bodies and also a basanitic maar that was mapped 2 kmSSW from the Bořeň phonolite body (Fig. 1; Kopecký, 1991) suggestthat the area of interest was subjected to vigorous phreatomagmaticactivity during the first two volcanic phases in the Tertiary (Cajz et al.,
magmatic agglomerate (B) found on E foothill of Hněvín. Note the chilled black marginsin a thin-section of the Zlatník phreatomagmatic lapilli tuff reveals predominance of thef 0.2 cm. Scale bar in (A) is 10 cm.
onolite magma into maar-diatreme structures — Correlation of field,herm. Res. (2010), doi:10.1016/j.jvolgeores.2010.07.012

4 P. Závada et al. / Journal of Volcanology and Geothermal Research xxx (2010) xxx–xxx
1999). Abundance of orthogneiss basement fragments encased in thebreccias also reflects that the phreatomagmatic activity was estab-lished in hard-rock environment (Lorenz, 2003). Occurrence ofphreatomagmatic tephra in the vicinity of Zlatník Hill, conspicuousalignment trend of Zlatník, Želenický Hill and Bořeň phonolitesfollowing the major fault system active in the area during Tertiary(Kopecký, 1978, 1991) and circular plan-form of these bodies in plan-view suggest that all these bodies were emplaced into phreatomag-matic volcanoes that formed on a zone of structural weakness with ajoint aquifer (Auer et al., 2007; Lorenz, 2003). This is also supportedby their high-aspect ratio together with exposure of orthogneissbasement rocks on the western foothill of Bořeň. The mantles ofphreatomagmatic tephra around these bodies can be buried under thetalus of Holocene phonolite block accumulations.
3. Structural and fabric data of the Bořeň phonolite body
The Bořeň phonolite is a circular body in the map with an averagediameter of ca. 500 m. On western side of the body, it is in contactwith basement orthogneisses. Eastern side of the body is surroundedby thick Quaternary accumulations of blocky phonolite talus andoutcrops of Cretaceous sediments covered by basanite lavas of the firstvolcanic phase. Correlation of the exposure levels of Cretaceoussediments and basanite lavas in the surroundings of Bořeň suggeststhat each of these units covering the basement were approximately100 m thick at the time of Bořeň phonolite body emplacement (seeinset of profile in Fig. 1). In the central-SE part of Bořeň, steep wallsconfined by columnar joints encircle an elevated plateau (Fig. 3A),which forms a natural fortress. NW side of the body is shielded by asteep wall rising from the lowest exposure level of the body up to thetoe of the fortress, where it forms a small plateau.
The magmatic fabric in the massive and homogeneous green togrey (altered) phonolite is discernible only locally from the alignmentof tiny (0.5–1 cm) sanidine crystals. No macroscopic fold or shearstructures can be observed on the outcrops. Orthogneiss xenoliths up
Fig. 3. Contours of elevation in meters above sea level (A), contour diagram of column widt(C) and plunge angle and plunge direction of the columns (D) for the Bořeň cupola.
Please cite this article as: Závada, P., et al., Emplacement dynamics of phthermal modeling and AMS analogue modeling data..., J. Volcanol. Geot
to 8 cm in diameter are sparsely distributed in the phonolite. The bodyis affected by two jointing systems. Orientation of the first set of jointsis subparallel to the magmatic fabric and defines an asymmetric onionlike internal structure of the cupola (Fig. 3C) well known from otherphonolitic or trachytic bodies (Cloos and Cloos, 1927; Varet, 1971;Závada et al., 2009b). This system is analogous to flat lying joints (F-joints) known from high structural levels of plutons (Cloos, 1922).Second system is represented by columnar joints that define steepvertical columns up to 3 m wide in the central-SE part of the body(Fig. 3B, D). Vertical columns are about 30–50 m high and their dipdirections diverge as their dip angle decreases on the periphery of thebody, where the columns are only 0.5–1 m wide (Fig. 3B, D).Individual joint growth increments typical with transverse bands onthe columnswell known from solidified basalt lava flows (DeGraff andAydin, 1987) were detectable only in the NW margin of the body. Inthis location, joints confining horizontal, 1 m wide and few meterslong columns terminate in the vertical wall of massive phonolite.Looking on the Bořeň body from the SE on bright day one can see thatthe wide and vertical columns encircling the elevated part of the bodyare underlain by a set of narrower columns about 20 m below the topof the vertical walls and 50 m below the summit of Bořeň (Fig. 4). Thisdiscontinuity is interpreted as a suture between the “upper” and“lower colonnades” (Spry, 1962) that formed during cooling from theupper and lower boundaries of the original phonolite body. Detailedrelief model of the Bořeň body was created using photogrammetrictechnique from aerial photographs and used for plotting andinterpretation of the structural data.
3.1. Microstructural data acquisition
3.1.1. Magmatic fabric and orientation of cavitiesThe phonolite trachytic texture is defined by parallel alignment of
groundmass fine sanidine laths (20–100 μm) and nepheline columnarcrystals (20–100 μm) enclosing phenocrysts of sanidine, nepheline,clinopyroxene (aegirine–augite) and sodalite that range in size from
h (B), contour diagrams with structural marks of dip angle and dip direction of F-joints
onolite magma into maar-diatreme structures — Correlation of field,herm. Res. (2010), doi:10.1016/j.jvolgeores.2010.07.012
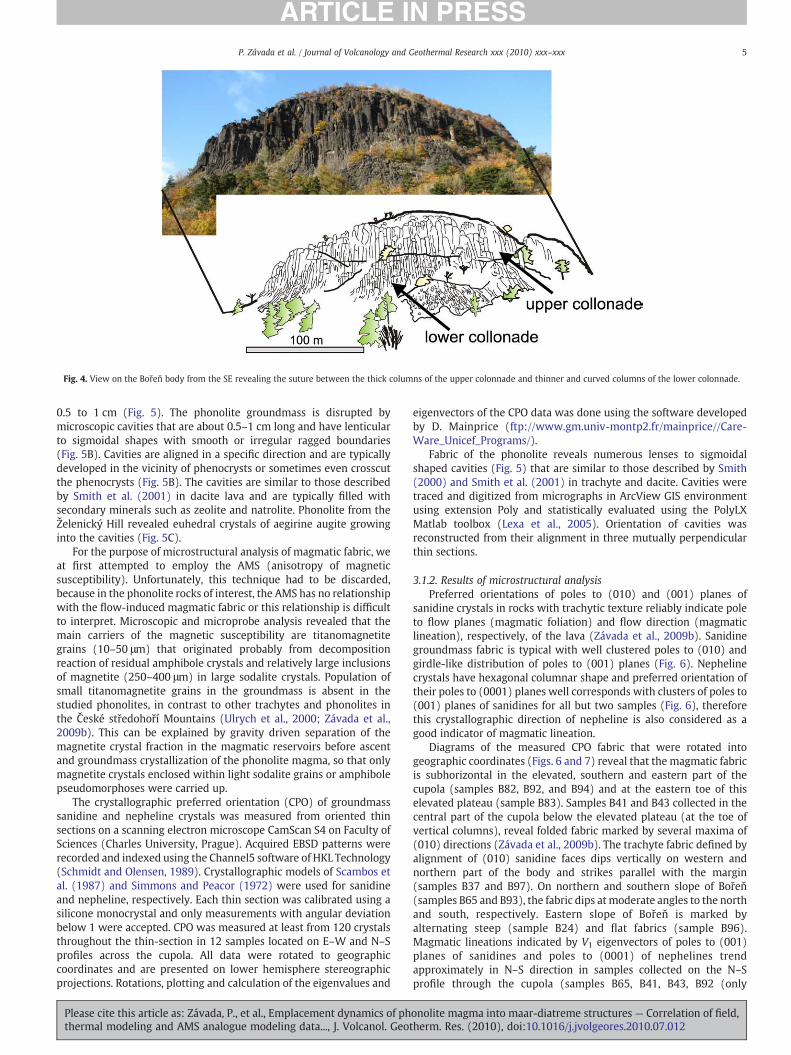
Fig. 4. View on the Bořeň body from the SE revealing the suture between the thick columns of the upper colonnade and thinner and curved columns of the lower colonnade.
5P. Závada et al. / Journal of Volcanology and Geothermal Research xxx (2010) xxx–xxx
0.5 to 1 cm (Fig. 5). The phonolite groundmass is disrupted bymicroscopic cavities that are about 0.5–1 cm long and have lenticularto sigmoidal shapes with smooth or irregular ragged boundaries(Fig. 5B). Cavities are aligned in a specific direction and are typicallydeveloped in the vicinity of phenocrysts or sometimes even crosscutthe phenocrysts (Fig. 5B). The cavities are similar to those describedby Smith et al. (2001) in dacite lava and are typically filled withsecondary minerals such as zeolite and natrolite. Phonolite from theŽelenický Hill revealed euhedral crystals of aegirine augite growinginto the cavities (Fig. 5C).
For the purpose of microstructural analysis of magmatic fabric, weat first attempted to employ the AMS (anisotropy of magneticsusceptibility). Unfortunately, this technique had to be discarded,because in the phonolite rocks of interest, the AMS has no relationshipwith the flow-induced magmatic fabric or this relationship is difficultto interpret. Microscopic and microprobe analysis revealed that themain carriers of the magnetic susceptibility are titanomagnetitegrains (10–50 μm) that originated probably from decompositionreaction of residual amphibole crystals and relatively large inclusionsof magnetite (250–400 μm) in large sodalite crystals. Population ofsmall titanomagnetite grains in the groundmass is absent in thestudied phonolites, in contrast to other trachytes and phonolites inthe České středohoří Mountains (Ulrych et al., 2000; Závada et al.,2009b). This can be explained by gravity driven separation of themagnetite crystal fraction in the magmatic reservoirs before ascentand groundmass crystallization of the phonolite magma, so that onlymagnetite crystals enclosed within light sodalite grains or amphibolepseudomorphoses were carried up.
The crystallographic preferred orientation (CPO) of groundmasssanidine and nepheline crystals was measured from oriented thinsections on a scanning electron microscope CamScan S4 on Faculty ofSciences (Charles University, Prague). Acquired EBSD patterns wererecorded and indexed using the Channel5 software of HKL Technology(Schmidt and Olensen, 1989). Crystallographic models of Scambos etal. (1987) and Simmons and Peacor (1972) were used for sanidineand nepheline, respectively. Each thin section was calibrated using asilicone monocrystal and only measurements with angular deviationbelow 1 were accepted. CPO was measured at least from 120 crystalsthroughout the thin-section in 12 samples located on E–W and N–Sprofiles across the cupola. All data were rotated to geographiccoordinates and are presented on lower hemisphere stereographicprojections. Rotations, plotting and calculation of the eigenvalues and
Please cite this article as: Závada, P., et al., Emplacement dynamics of phthermal modeling and AMS analogue modeling data..., J. Volcanol. Geot
eigenvectors of the CPO data was done using the software developedby D. Mainprice (ftp://www.gm.univ-montp2.fr/mainprice//Care-Ware_Unicef_Programs/).
Fabric of the phonolite reveals numerous lenses to sigmoidalshaped cavities (Fig. 5) that are similar to those described by Smith(2000) and Smith et al. (2001) in trachyte and dacite. Cavities weretraced and digitized from micrographs in ArcView GIS environmentusing extension Poly and statistically evaluated using the PolyLXMatlab toolbox (Lexa et al., 2005). Orientation of cavities wasreconstructed from their alignment in three mutually perpendicularthin sections.
3.1.2. Results of microstructural analysisPreferred orientations of poles to (010) and (001) planes of
sanidine crystals in rocks with trachytic texture reliably indicate poleto flow planes (magmatic foliation) and flow direction (magmaticlineation), respectively, of the lava (Závada et al., 2009b). Sanidinegroundmass fabric is typical with well clustered poles to (010) andgirdle-like distribution of poles to (001) planes (Fig. 6). Nephelinecrystals have hexagonal columnar shape and preferred orientation oftheir poles to (0001) planes well corresponds with clusters of poles to(001) planes of sanidines for all but two samples (Fig. 6), thereforethis crystallographic direction of nepheline is also considered as agood indicator of magmatic lineation.
Diagrams of the measured CPO fabric that were rotated intogeographic coordinates (Figs. 6 and 7) reveal that the magmatic fabricis subhorizontal in the elevated, southern and eastern part of thecupola (samples B82, B92, and B94) and at the eastern toe of thiselevated plateau (sample B83). Samples B41 and B43 collected in thecentral part of the cupola below the elevated plateau (at the toe ofvertical columns), reveal folded fabric marked by several maxima of(010) directions (Závada et al., 2009b). The trachyte fabric defined byalignment of (010) sanidine faces dips vertically on western andnorthern part of the body and strikes parallel with the margin(samples B37 and B97). On northern and southern slope of Bořeň(samples B65 and B93), the fabric dips atmoderate angles to the northand south, respectively. Eastern slope of Bořeň is marked byalternating steep (sample B24) and flat fabrics (sample B96).Magmatic lineations indicated by V1 eigenvectors of poles to (001)planes of sanidines and poles to (0001) of nephelines trendapproximately in N–S direction in samples collected on the N–Sprofile through the cupola (samples B65, B41, B43, B92 (only
onolite magma into maar-diatreme structures — Correlation of field,herm. Res. (2010), doi:10.1016/j.jvolgeores.2010.07.012

Fig. 5. Micrographs of the Bořeň phonolite thin-sections from samples collected in thecentral (A, sample B43) and western peripheral part (B, sample B96) of the cupola.Sample from the northern side of the quarry on phonolite body Želenický Hill(C) reveals cavities with inward grown euhedral aegirine–augites (indicated byarrows). Note close spatial relationship between the cavities (white) and thephenocrysts (grey), cavities crosscutting phenocrysts in the lower right corner ofimage (B) and sigmoidal cavities in sample B43 (A).
6 P. Závada et al. / Journal of Volcanology and Geothermal Research xxx (2010) xxx–xxx
nepheline), B94) and also in its eastern flat part (sample B82). Onnorthern and eastern margins (samples B37 and B97), lineations aresubhorizontal and parallel to the strike of the vertical fabrics.
Cavities in the phonolite lava typically dip at higher angles thanthe sanidine fabric (or in opposite direction for steep fabric in sampleB97) and follow a similar strike direction (Fig. 7). Cavities dip atmoderate to steep angles on the margins of the exposed body andstrike subparallel with the nearest margin. On the periphery of the flatand elevated part of the cupola (samples B24, B43, B92, and B83),cavities are sigmoidal, with their central and tail parts oriented at highangle and subparallel, respectively, to the trachytic fabric. In centralpart of the elevated plateau (sample B46), vertical cavities cut throughhorizontal fabric and strike E–W.
In southern flat part of the cupola (sample B94), the horizontalfabric is disrupted by microscopic shear zones dipping shallowly tothe north. While the cavities outside the 0.5 cm wide shear zones dip
Please cite this article as: Závada, P., et al., Emplacement dynamics of phthermal modeling and AMS analogue modeling data..., J. Volcanol. Geot
shallowly to SW, cavities within the shear zone are steep. Similarly, onthe eastern margin (sample B122), 0.1 cm wide subvertical shearzones with N–S strike and west side-up sense of shear divide domainswith subhorizontal fabric and cavities along large faces of phenocrystsdipping shallowly to the east. On one locality on the northern slope ofthe Bořeň body (close to sample locality B65, Fig. 7) the trachyte fabricis disaggregated into separate domains up to several centimeters indiameter with discordant internal fabrics.
4. Analogue modeling of magma emplacement intomaar-diatreme structures
Detailed analysis of fabrics and fracture systems throughout theBořeň phonolite body motivated the second part of this complexstudy, which combines the analogue modeling and finite elementnumerical modeling of cooling for selected geometries of magmaintrusions into model maar-diatreme volcanoes. Our earlier studiesrevealed that the understanding of internal structure and fabricpattern of eroded volcanic bodies can be conveniently resolved usinganalogue modeling (Závada et al., 2009a,b). Flow induced fabrics canbe analyzed from disrupted color layering of the analogue materialcorresponding to flow planes, and AMS fabric, which records the localdeformation/flow shapes, flow planes and flow directions from theparticles of admixed magnetite dust (Závada et al., 2009a).
The Bořeň body represents a remnant of an eroded phonolite bodythat was emplaced close to the paleosurface and probably intruded amaar-diatreme structure. To evaluate the similarity of the analoguemodels with the original (Bořeň body), at first, the shape of Bořeň andits relative dimensions in the probable maar-diatreme crater togetherwith its internal fabric pattern on NW–SE and SW–NE profiles wereprojected over the vertical sections of the sliced analogue models.Although an unknown volume of the phonolite was already eroded,the original vertical dimension of Bořeň is indirectly indicated by thelevel of the suture between the two collonades of columns that formedduring cooling of the body. This suture should correspond to the half-height of the original body, if we assume that the rate of cooling fromits top and bottom boundary was similar. In the second step, formodels that fulfill the dimensional preconditions and reveal similarfabric pattern as the Bořeň body, thermal modeling of cooling wasemployed to further test the similarity between the models and theoriginal. The columnar jointing pattern developed on Bořeň wascompared with the cooling patterns given by the thermal models. Arough preliminary outline of the original shape for the Bořeň phonolitecan be already estimated, considering the fact that the joints confiningthe columns grow perpendicular to the margins of original volcanicbodies during conductive cooling (Jaeger, 1961; DeGraff and Aydin,1987). The “inverted fan” like columnar jointing pattern should formduring cooling of a body with flat roof and a base that dips moderatelyto the vertical axis of the body. In other words, it should resemble abody with outward flaring funnel shaped stem and a horizontal roof.
4.1. Experimental apparatus and analogue materials
To model emplacement of magma into maar-diatreme structures,we employed a modified hydraulic squeezer apparatus used earlierfor modeling of lava domes (Závada et al., 2009a) and plaster of Parisas an analogue of magma. Plaster suspensions are good analogues formagmas that consist of low viscosity melt and large volumeproportion of crystals. Suspensions of plaster powder and water arecharacterized by similar viscosities when their yield strength isexceeded regardless of their mixing ratio (Závada et al., 2009a).However, increasing mixing ratio of the plaster powder and water(the thickness) is marked by increasing yield strength of thesuspension. Physical characteristics and preparation of the analoguematerial with admixed magnetite dust for tracing of AMS fabric andcoloring are described in our earlier experimental work (Závada et al.,
onolite magma into maar-diatreme structures — Correlation of field,herm. Res. (2010), doi:10.1016/j.jvolgeores.2010.07.012

Fig. 6. CPO (crystal preferred orientation) data for sanidine and nephelinemeasured from the thin-sections of samples collected throughout the Bořeň phonolite cupola. Contours arespaced at 0.5 multiples of uniform distribution for (001) direction of sanidine and (0001) direction of nepheline andmultiples of uniform distribution for (010) direction of sanidine.Number of CPO measurements per sample (N) is also indicated. Contours in the map correspond to elevation in meters above sea level. Positions of NW–SE and SW–NE profiles areshown for later reference.
7P. Závada et al. / Journal of Volcanology and Geothermal Research xxx (2010) xxx–xxx
2009a). During the experiment, the plaster of Paris suspension issqueezed out from a container at the bottom of the apparatus by ahydraulic squeezer force transmitted over a steel frame and a loadingboardwith a central hole (Fig. 8). The plaster then intrudes into a steelcone that is mounted on a vertical feeding conduit (20 cm long and4 cm wide) and filled with a mixture of sand and solid angular plasterchunks (b1 cm in diameter). This loose material represents thephreatomagmatic lapilli tuff or agglomerate, which is poorly consol-idated and agitated several times by subsequent phreatomagmaticexplosions shooting debris jets from the root zone towards the surface(Lorenz, 1986; Zimanowski, 1998; Ross et al., 2008). The taperingangle of the cone of 70° was chosen to mimic the diatreme slope inhard rock environment (Lorenz, 2003; Schulz et al., 2005). Above the30 cm long cone, a broader crater was modeled from kaoline clay toreflect relatively smaller dip angle of phreatomagmatic crater in soft-rock environment (Lorenz, 2003; Auer et al., 2007) like the Cretaceousmarlstones in the surroundings of the Bořeň phonolite body. For fiveof the experiments, a “lid” of clay and sand layers was created at thetop of the sand filled steel cone and in the lower part of the broadercrater to study the mechanical effect of stratified maar sediments onemplacement mode and shapes of the intrusions/extrusions into themaar-diatremes (Table 1). Experimental runs were controlledmanually keeping the extrusion rate as slow as possible except forfirst four models. The last 15 runswere captured asmovies on a digital
Please cite this article as: Závada, P., et al., Emplacement dynamics of phthermal modeling and AMS analogue modeling data..., J. Volcanol. Geot
camera. The measured parameters are the initial load of the squeezerpreceding each experiment, extrusion duration and maximum load ofthe squeezer at the end of each experiment. The three lastexperiments (D-31, D-32, and D-33) were motivated by the resultof one earlier experiment (D-18), where the intrusion of plasterbranched in the diatreme (Table 1, Fig. 9). In these experiments, thesource container was filled with three different plaster portions ofdifferent mixing ratio. A cylindrical cake of the thick plaster (mixingratio of plaster powder:water=2.5) placed in the middle of thesource container was surrounded by an annulus of more dilutedplaster portion (2.3) and the thinnest (2.2) filling the corners of therectangular container outside of the annulus. This setup was designedto mimic extrusion of magma from a magmatic chamber that isstratified in terms of increasing crystal content in its shallower levels.After each experimental run, solidified model bodies were excavated,sliced vertically and photographed. Outlined geometries of themodelsand traces of their flow planes from disrupted colored plaster ispresented in Fig. 9.
4.2. Experimental results
Experiments with relatively thick plaster of mixing ratio 2.5(weight of plaster powder/water) that were squeezed up rapidlyresulted in emplacement of asymmetric extrusions with a thick stem
onolite magma into maar-diatreme structures — Correlation of field,herm. Res. (2010), doi:10.1016/j.jvolgeores.2010.07.012
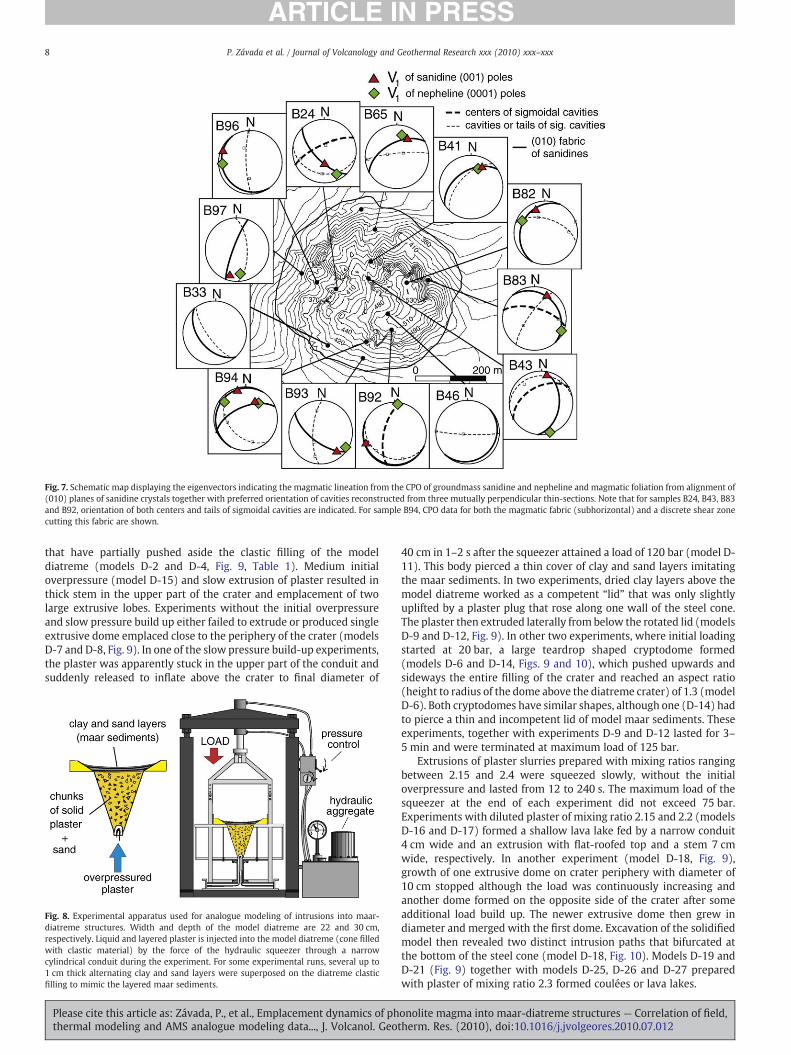
Fig. 7. Schematic map displaying the eigenvectors indicating the magmatic lineation from the CPO of groundmass sanidine and nepheline and magmatic foliation from alignment of(010) planes of sanidine crystals together with preferred orientation of cavities reconstructed from three mutually perpendicular thin-sections. Note that for samples B24, B43, B83and B92, orientation of both centers and tails of sigmoidal cavities are indicated. For sample B94, CPO data for both the magmatic fabric (subhorizontal) and a discrete shear zonecutting this fabric are shown.
8 P. Závada et al. / Journal of Volcanology and Geothermal Research xxx (2010) xxx–xxx
that have partially pushed aside the clastic filling of the modeldiatreme (models D-2 and D-4, Fig. 9, Table 1). Medium initialoverpressure (model D-15) and slow extrusion of plaster resulted inthick stem in the upper part of the crater and emplacement of twolarge extrusive lobes. Experiments without the initial overpressureand slow pressure build up either failed to extrude or produced singleextrusive dome emplaced close to the periphery of the crater (modelsD-7 and D-8, Fig. 9). In one of the slow pressure build-up experiments,the plaster was apparently stuck in the upper part of the conduit andsuddenly released to inflate above the crater to final diameter of
Fig. 8. Experimental apparatus used for analogue modeling of intrusions into maar-diatreme structures. Width and depth of the model diatreme are 22 and 30 cm,respectively. Liquid and layered plaster is injected into the model diatreme (cone filledwith clastic material) by the force of the hydraulic squeezer through a narrowcylindrical conduit during the experiment. For some experimental runs, several up to1 cm thick alternating clay and sand layers were superposed on the diatreme clasticfilling to mimic the layered maar sediments.
Please cite this article as: Závada, P., et al., Emplacement dynamics of phthermal modeling and AMS analogue modeling data..., J. Volcanol. Geot
40 cm in 1–2 s after the squeezer attained a load of 120 bar (model D-11). This body pierced a thin cover of clay and sand layers imitatingthe maar sediments. In two experiments, dried clay layers above themodel diatreme worked as a competent “lid” that was only slightlyuplifted by a plaster plug that rose along one wall of the steel cone.The plaster then extruded laterally from below the rotated lid (modelsD-9 and D-12, Fig. 9). In other two experiments, where initial loadingstarted at 20 bar, a large teardrop shaped cryptodome formed(models D-6 and D-14, Figs. 9 and 10), which pushed upwards andsideways the entire filling of the crater and reached an aspect ratio(height to radius of the dome above the diatreme crater) of 1.3 (modelD-6). Both cryptodomes have similar shapes, although one (D-14) hadto pierce a thin and incompetent lid of model maar sediments. Theseexperiments, together with experiments D-9 and D-12 lasted for 3–5 min and were terminated at maximum load of 125 bar.
Extrusions of plaster slurries prepared with mixing ratios rangingbetween 2.15 and 2.4 were squeezed slowly, without the initialoverpressure and lasted from 12 to 240 s. The maximum load of thesqueezer at the end of each experiment did not exceed 75 bar.Experiments with diluted plaster of mixing ratio 2.15 and 2.2 (modelsD-16 and D-17) formed a shallow lava lake fed by a narrow conduit4 cm wide and an extrusion with flat-roofed top and a stem 7 cmwide, respectively. In another experiment (model D-18, Fig. 9),growth of one extrusive dome on crater periphery with diameter of10 cm stopped although the load was continuously increasing andanother dome formed on the opposite side of the crater after someadditional load build up. The newer extrusive dome then grew indiameter and merged with the first dome. Excavation of the solidifiedmodel then revealed two distinct intrusion paths that bifurcated atthe bottom of the steel cone (model D-18, Fig. 10). Models D-19 andD-21 (Fig. 9) together with models D-25, D-26 and D-27 preparedwith plaster of mixing ratio 2.3 formed coulées or lava lakes.
onolite magma into maar-diatreme structures — Correlation of field,herm. Res. (2010), doi:10.1016/j.jvolgeores.2010.07.012
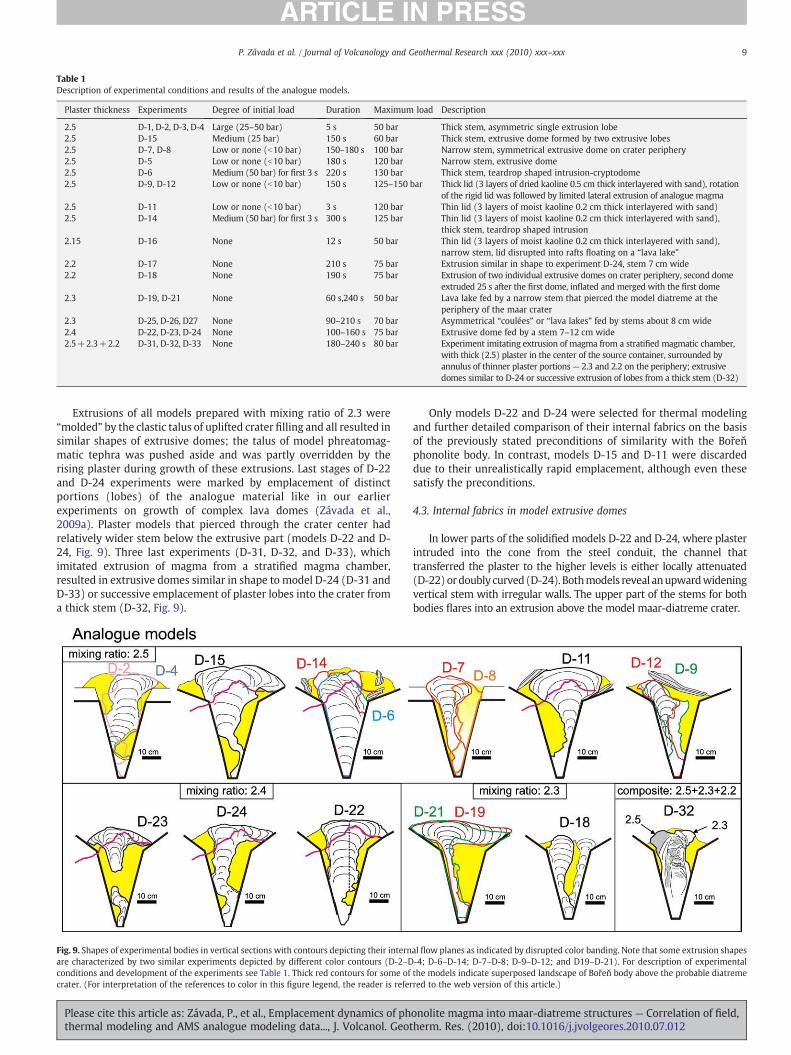
Table 1Description of experimental conditions and results of the analogue models.
Plaster thickness Experiments Degree of initial load Duration Maximum load Description
2.5 D-1, D-2, D-3, D-4 Large (25–50 bar) 5 s 50 bar Thick stem, asymmetric single extrusion lobe2.5 D-15 Medium (25 bar) 150 s 60 bar Thick stem, extrusive dome formed by two extrusive lobes2.5 D-7, D-8 Low or none (b10 bar) 150–180 s 100 bar Narrow stem, symmetrical extrusive dome on crater periphery2.5 D-5 Low or none (b10 bar) 180 s 120 bar Narrow stem, extrusive dome2.5 D-6 Medium (50 bar) for first 3 s 220 s 130 bar Thick stem, teardrop shaped intrusion-cryptodome2.5 D-9, D-12 Low or none (b10 bar) 150 s 125–150 bar Thick lid (3 layers of dried kaoline 0.5 cm thick interlayered with sand), rotation
of the rigid lid was followed by limited lateral extrusion of analogue magma2.5 D-11 Low or none (b10 bar) 3 s 120 bar Thin lid (3 layers of moist kaoline 0.2 cm thick interlayered with sand)2.5 D-14 Medium (50 bar) for first 3 s 300 s 125 bar Thin lid (3 layers of moist kaoline 0.2 cm thick interlayered with sand),
thick stem, teardrop shaped intrusion2.15 D-16 None 12 s 50 bar Thin lid (3 layers of moist kaoline 0.2 cm thick interlayered with sand),
narrow stem, lid disrupted into rafts floating on a “lava lake”2.2 D-17 None 210 s 75 bar Extrusion similar in shape to experiment D-24, stem 7 cm wide2.2 D-18 None 190 s 75 bar Extrusion of two individual extrusive domes on crater periphery, second dome
extruded 25 s after the first dome, inflated and merged with the first dome2.3 D-19, D-21 None 60 s,240 s 50 bar Lava lake fed by a narrow stem that pierced the model diatreme at the
periphery of the maar crater2.3 D-25, D-26, D27 None 90–210 s 70 bar Asymmetrical “coulées” or “lava lakes” fed by stems about 8 cm wide2.4 D-22, D-23, D-24 None 100–160 s 75 bar Extrusive dome fed by a stem 7–12 cm wide2.5+2.3+2.2 D-31, D-32, D-33 None 180–240 s 80 bar Experiment imitating extrusion of magma from a stratified magmatic chamber,
with thick (2.5) plaster in the center of the source container, surrounded byannulus of thinner plaster portions — 2.3 and 2.2 on the periphery; extrusivedomes similar to D-24 or successive extrusion of lobes from a thick stem (D-32)
9P. Závada et al. / Journal of Volcanology and Geothermal Research xxx (2010) xxx–xxx
Extrusions of all models prepared with mixing ratio of 2.3 were“molded” by the clastic talus of uplifted crater filling and all resulted insimilar shapes of extrusive domes; the talus of model phreatomag-matic tephra was pushed aside and was partly overridden by therising plaster during growth of these extrusions. Last stages of D-22and D-24 experiments were marked by emplacement of distinctportions (lobes) of the analogue material like in our earlierexperiments on growth of complex lava domes (Závada et al.,2009a). Plaster models that pierced through the crater center hadrelatively wider stem below the extrusive part (models D-22 and D-24, Fig. 9). Three last experiments (D-31, D-32, and D-33), whichimitated extrusion of magma from a stratified magma chamber,resulted in extrusive domes similar in shape to model D-24 (D-31 andD-33) or successive emplacement of plaster lobes into the crater froma thick stem (D-32, Fig. 9).
Fig. 9. Shapes of experimental bodies in vertical sections with contours depicting their internare characterized by two similar experiments depicted by different color contours (D-2–Dconditions and development of the experiments see Table 1. Thick red contours for some ofcrater. (For interpretation of the references to color in this figure legend, the reader is refer
Please cite this article as: Závada, P., et al., Emplacement dynamics of phthermal modeling and AMS analogue modeling data..., J. Volcanol. Geot
Only models D-22 and D-24 were selected for thermal modelingand further detailed comparison of their internal fabrics on the basisof the previously stated preconditions of similarity with the Bořeňphonolite body. In contrast, models D-15 and D-11 were discardeddue to their unrealistically rapid emplacement, although even thesesatisfy the preconditions.
4.3. Internal fabrics in model extrusive domes
In lower parts of the solidified models D-22 and D-24, where plasterintruded into the cone from the steel conduit, the channel thattransferred the plaster to the higher levels is either locally attenuated(D-22)ordoubly curved (D-24). Bothmodels reveal anupwardwideningvertical stem with irregular walls. The upper part of the stems for bothbodies flares into an extrusion above the model maar-diatreme crater.
al flow planes as indicated by disrupted color banding. Note that some extrusion shapes-4; D-6–D-14; D-7–D-8; D-9–D-12; and D19–D-21). For description of experimentalthe models indicate superposed landscape of Bořeň body above the probable diatremered to the web version of this article.)
onolite magma into maar-diatreme structures — Correlation of field,herm. Res. (2010), doi:10.1016/j.jvolgeores.2010.07.012
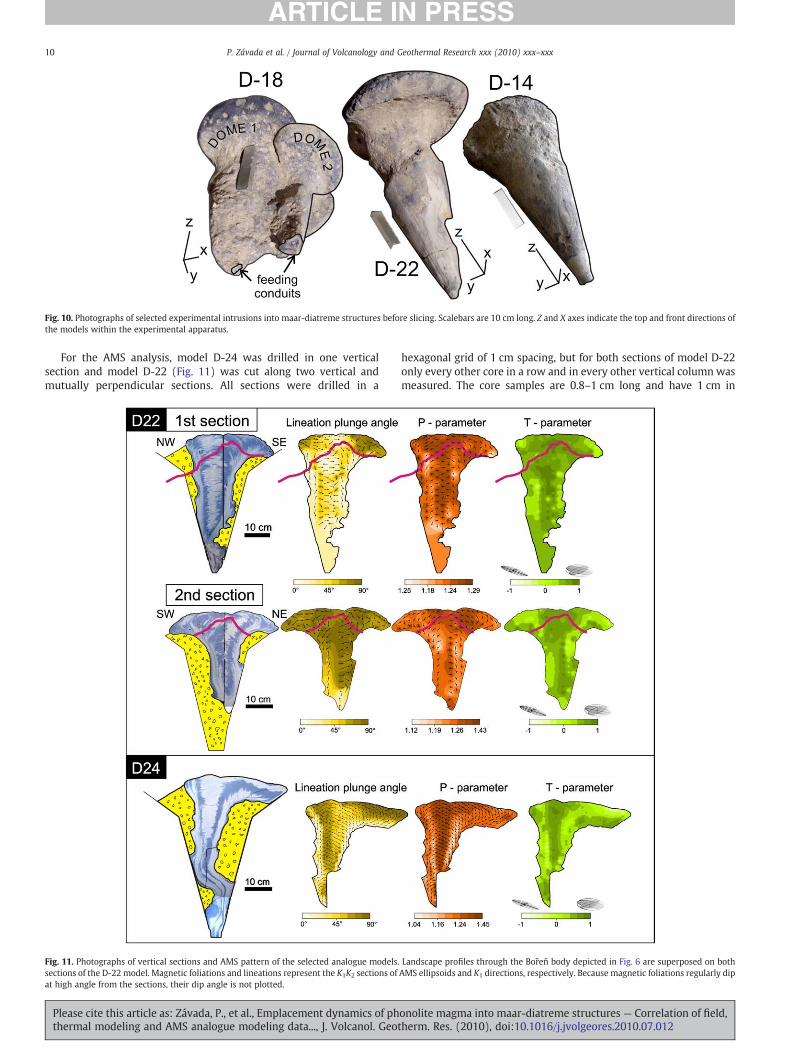
Fig. 10. Photographs of selected experimental intrusions into maar-diatreme structures before slicing. Scalebars are 10 cm long. Z and X axes indicate the top and front directions ofthe models within the experimental apparatus.
10 P. Závada et al. / Journal of Volcanology and Geothermal Research xxx (2010) xxx–xxx
For the AMS analysis, model D-24 was drilled in one verticalsection and model D-22 (Fig. 11) was cut along two vertical andmutually perpendicular sections. All sections were drilled in a
Fig. 11. Photographs of vertical sections and AMS pattern of the selected analogue models.sections of the D-22 model. Magnetic foliations and lineations represent the K1K2 sections ofat high angle from the sections, their dip angle is not plotted.
Please cite this article as: Závada, P., et al., Emplacement dynamics of phthermal modeling and AMS analogue modeling data..., J. Volcanol. Geot
hexagonal grid of 1 cm spacing, but for both sections of model D-22only every other core in a row and in every other vertical column wasmeasured. The core samples are 0.8–1 cm long and have 1 cm in
Landscape profiles through the Bořeň body depicted in Fig. 6 are superposed on bothAMS ellipsoids and K1 directions, respectively. Because magnetic foliations regularly dip
onolite magma into maar-diatreme structures — Correlation of field,herm. Res. (2010), doi:10.1016/j.jvolgeores.2010.07.012

11P. Závada et al. / Journal of Volcanology and Geothermal Research xxx (2010) xxx–xxx
diameter. The eccentricity (P parameter) and shape (T parameter) ofthe AMS ellipsoid can be characterized by the following parameters(Nagata, 1961; Jelínek, 1981).
P = K1 = K3T = 2η2−η1−η3ð Þ= η1−η3ð Þ
whereK1NK2NK3 are the principal susceptibilities, η1=ln K1, η2=ln K2,η3=ln K3. The P parameter indicates the intensity of preferredorientation of magnetite particles in plaster models. If 0bTb+1, theAMS ellipsoid is oblate (the magnetic fabric is planar); T=+1 meansthat the AMS ellipsoid is rotationally symmetric (uniaxial oblate).If−1bTb0 the AMS ellipsoid is prolate (the magnetic fabric is linear);T=−1 means that the AMS ellipsoid is uniaxial prolate. If T=0, theellipsoid is neutral.
The internal concave tracesofflowplanes envisagedby thedisruptedcoloredplaster correlatewith the strike alignmentofmagnetic foliations(Fig. 11). Second section of model D22 also reveals lastly emplaced lobeforming a bulge on the surface of the body. In the extrusive parts of bothmodels, the pattern of magnetic foliations and lineations resembles thatin our earlier models of plaster extrusions above a sand layer (Závada etal., 2009a);magnetic lineationsdipping to the center of the bodies at thebase of the extrusions and lineations perpendicular to the verticalsections in upper parts of extrusive lobes. Contour diagrams of P andTparameters for bothmodels revealhighly anisotropic (P=1.24−1.45)and oblate (T=0.4−1) fabrics in the central columnar domainsextending to the top of the extrusions and fabrics with low anisotropyin a narrow domain encompassing the highly anisotropic internal part.These low intensity fabric domains reveal neutral to prolate shapeswithT ranging from −0.55 to 0.1 and are also locally marked by lineationswith high plunge angles from the vertical section.
5. Columnar joint patterns constrained by thermalmathematical modeling
Finite element thermal mathematical modeling of cooling wascarried out for models D-22, D-24, and also for model D-6, since ateardrop shape of the Bořeň body and other phonolite intrusions wassuggested in earlier works (Kopecký, 1978, 1991; see the profile inFig. 1). For both models D-22 and D-24, thermal models and analysisof the thermal structure was done for two perpendicular verticalsections and compared with the columnar jointing pattern on theNW–SE and SW–NE sections through the Bořeň phonolite body(profiles depicted in Fig. 6). Similar comparison was done also for athree-dimensional thermal model using simplified geometry ofexperiment D-22.
All thermal models were provided with thermophysical para-meters of rocks collected around the Bořeň body; the basementorthogneiss, Cretaceous marls, Tertiary basanites, phreatomagmaticlapilli tuff collected at Zlatník Hill (Fig. 2a) and the phonolite (Table 2).
Table 2Physical parameters measured for all lithologies used in thermal models; k, cp, α and Tcorrespond to thermal conductivity, capacity, diffusivity and initial temperature ofspecific units at the onset of cooling in the model, respectively. For marlstone,anisotropy of α and k is characterized by two values, measured in direction parallel andperpendicular to sedimentary layering, respectively. Thermal capacity of phonolite isindicated by two values for solid and molten state. The higher value corresponds tomolten state. The “pumice” corresponds to a porous pumice found on the Kaňkov Hill.
k ρ cp α×10−6 T(W/m K) (kg/m3) (J/kg K) (m2/s) (°C)
Phonolite (1) 1.5 2600 850–1150 0.7 1100Phreat. lap. tuff (2) 1.25 2200 1000 0.6 20Marlstone (3) 2.2/1.7 1600 1000 1/0.8 20Basanite (4) 2 2900 810 0.9 20Orthogneiss (5) 3.5 2600 850 1.5 20Pumice (6) 0.8 1600 1000 0.5 20
Please cite this article as: Závada, P., et al., Emplacement dynamics of phthermal modeling and AMS analogue modeling data..., J. Volcanol. Geot
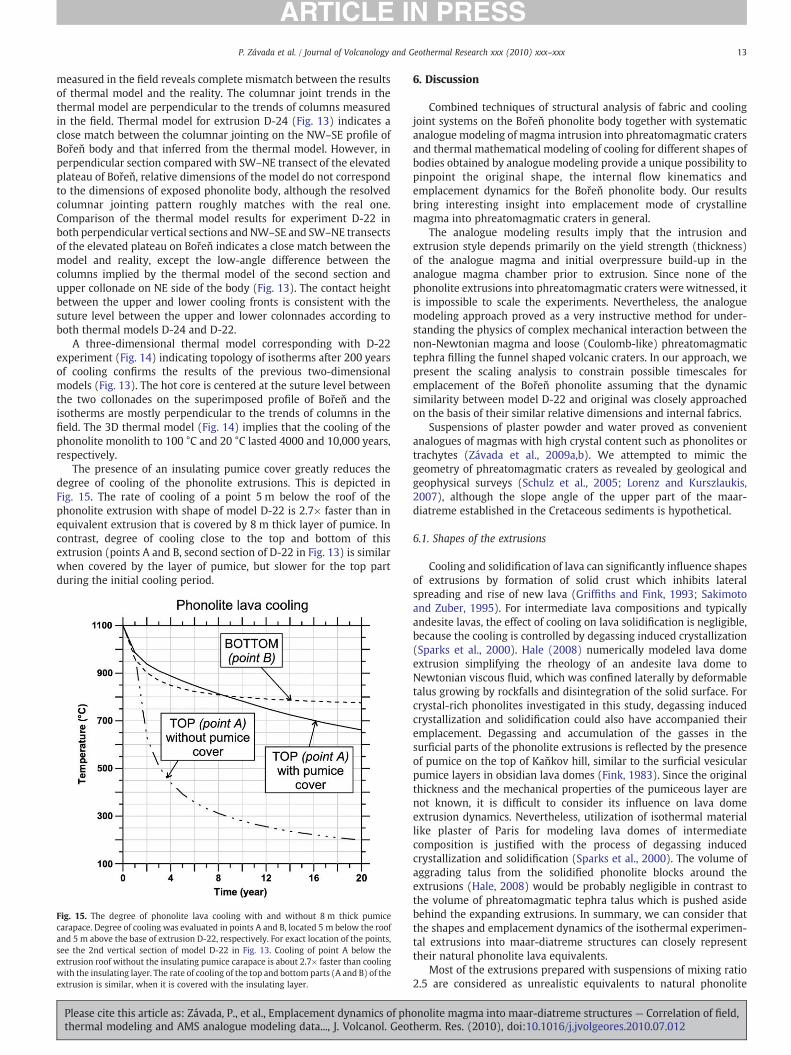
Thermal conductivities and capacities of the samples were measuredin laboratories of Institute of Geophysics ASCR using an instrument,which is based on optical scanning method (Popov et al., 1999).Thermal models were constructed using software Comsol andFracture (Kohl and Hopkirk, 1995). Initial temperature 1100 °C ofthe phonolite bodies in the model was calculated from compositionstability in minerals of the Želenický Hill phonolite by Pazdernik(1997). Latent heat of the phonolite of 300 kJ (Calkins et al., 2008),corresponding to the heat released during crystallization of lava, wasalso implemented in the model. A layer covering the extrusions about8–16 m thick is included in thermal models for bodies D-22 and D-24to account for possible presence of glassy and porous pumice that waslocally found in massive phonolite outcrops on the nearby Kaňkovphonolite body. We assume that the same porous pumice found onKaňkov could have formed a continuous carapace on the top of Bořeňbody, where it worked as an effective thermal insulant impeding thethermal flow during cooling of the phonolite. Similarly, porous scoriaformed capping units on the peperitic lava lake at Ság-hegy inHungary (Martin and Németh, 2004). We provide comparison for therate of cooling below the roof of phonolite extrusion in the D-22thermal with and without the surficial pumice layer. These rates ofcooling are also compared with that above the base of the same body.
To determine the temperature at which the columnar joints in thephonolite formed, the thermal expansion coefficient was measuredfrom three 0.8 cm wide and 1 cm long samples drilled perpendicularto the phonolite magmatic fabric and measured for thermal variationof thermal expansion coefficient α by Marcel Potužák on Ludwig-Maximilian University in Münich using Netzsch DIL 402C dilatometer.The measured curves of all three samples revealed almost identicalascending trend of α value with increasing temperature and twodistinct peaks at 620 and 920 °C (Fig. 12). The first peak at 620 °C isinterpreted to reflect transient expansion of the sample due to the lossof water from secondary minerals filling the cavities in the phonolite.Large increase in thermal expansivity coefficient value indicated bythe peak at 920 °C is considered to reflect the temperaturecorresponding to formation of columnar joints in cooling phonolitelava. To trace the trends of columnar joints that would form during
Fig. 12. Variation of thermal expansion coefficient with increasing temperaturemeasured on the Bořeň phonolite sample. Peak on the curve at 620 °C is interpretedto reflect the transient expansion of the sample due to loss of water released fromsecondary minerals in the cavities. Second peak at 920 °C is interpreted to reflect thetemperature corresponding to formation of columnar joints in cooling phonolite lava.
onolite magma into maar-diatreme structures — Correlation of field,herm. Res. (2010), doi:10.1016/j.jvolgeores.2010.07.012
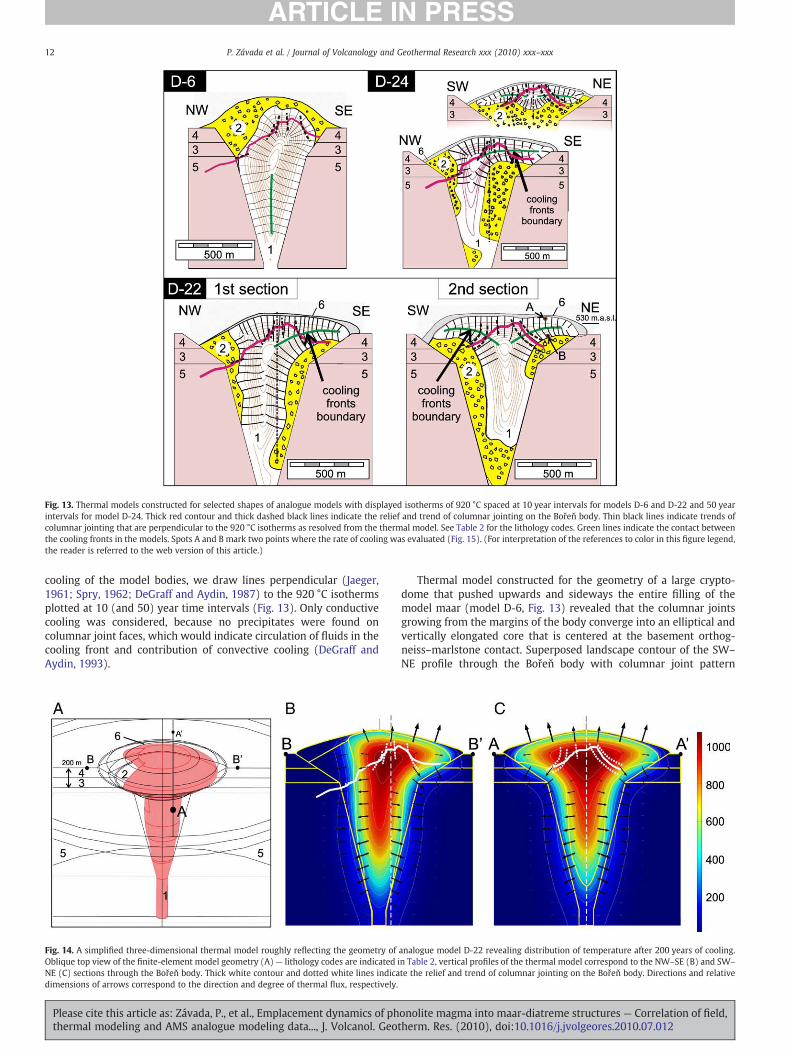
Fig. 13. Thermal models constructed for selected shapes of analogue models with displayed isotherms of 920 °C spaced at 10 year intervals for models D-6 and D-22 and 50 yearintervals for model D-24. Thick red contour and thick dashed black lines indicate the relief and trend of columnar jointing on the Bořeň body. Thin black lines indicate trends ofcolumnar jointing that are perpendicular to the 920 °C isotherms as resolved from the thermal model. See Table 2 for the lithology codes. Green lines indicate the contact betweenthe cooling fronts in the models. Spots A and B mark two points where the rate of cooling was evaluated (Fig. 15). (For interpretation of the references to color in this figure legend,the reader is referred to the web version of this article.)
12 P. Závada et al. / Journal of Volcanology and Geothermal Research xxx (2010) xxx–xxx
cooling of the model bodies, we draw lines perpendicular (Jaeger,1961; Spry, 1962; DeGraff and Aydin, 1987) to the 920 °C isothermsplotted at 10 (and 50) year time intervals (Fig. 13). Only conductivecooling was considered, because no precipitates were found oncolumnar joint faces, which would indicate circulation of fluids in thecooling front and contribution of convective cooling (DeGraff andAydin, 1993).
Fig. 14. A simplified three-dimensional thermal model roughly reflecting the geometry ofOblique top view of the finite-element model geometry (A) — lithology codes are indicated iNE (C) sections through the Bořeň body. Thick white contour and dotted white lines indicadimensions of arrows correspond to the direction and degree of thermal flux, respectively.
Please cite this article as: Závada, P., et al., Emplacement dynamics of phthermal modeling and AMS analogue modeling data..., J. Volcanol. Geot
Thermal model constructed for the geometry of a large crypto-dome that pushed upwards and sideways the entire filling of themodel maar (model D-6, Fig. 13) revealed that the columnar jointsgrowing from the margins of the body converge into an elliptical andvertically elongated core that is centered at the basement orthog-neiss–marlstone contact. Superposed landscape contour of the SW–
NE profile through the Bořeň body with columnar joint pattern
analogue model D-22 revealing distribution of temperature after 200 years of cooling.n Table 2, vertical profiles of the thermal model correspond to the NW–SE (B) and SW–
te the relief and trend of columnar jointing on the Bořeň body. Directions and relative
onolite magma into maar-diatreme structures — Correlation of field,herm. Res. (2010), doi:10.1016/j.jvolgeores.2010.07.012
13P. Závada et al. / Journal of Volcanology and Geothermal Research xxx (2010) xxx–xxx
measured in the field reveals complete mismatch between the resultsof thermal model and the reality. The columnar joint trends in thethermal model are perpendicular to the trends of columns measuredin the field. Thermal model for extrusion D-24 (Fig. 13) indicates aclose match between the columnar jointing on the NW–SE profile ofBořeň body and that inferred from the thermal model. However, inperpendicular section compared with SW–NE transect of the elevatedplateau of Bořeň, relative dimensions of the model do not correspondto the dimensions of exposed phonolite body, although the resolvedcolumnar jointing pattern roughly matches with the real one.Comparison of the thermal model results for experiment D-22 inboth perpendicular vertical sections and NW–SE and SW–NE transectsof the elevated plateau on Bořeň indicates a close match between themodel and reality, except the low-angle difference between thecolumns implied by the thermal model of the second section andupper collonade on NE side of the body (Fig. 13). The contact heightbetween the upper and lower cooling fronts is consistent with thesuture level between the upper and lower colonnades according toboth thermal models D-24 and D-22.
A three-dimensional thermal model corresponding with D-22experiment (Fig. 14) indicating topology of isotherms after 200 yearsof cooling confirms the results of the previous two-dimensionalmodels (Fig. 13). The hot core is centered at the suture level betweenthe two collonades on the superimposed profile of Bořeň and theisotherms are mostly perpendicular to the trends of columns in thefield. The 3D thermal model (Fig. 14) implies that the cooling of thephonolite monolith to 100 °C and 20 °C lasted 4000 and 10,000 years,respectively.
The presence of an insulating pumice cover greatly reduces thedegree of cooling of the phonolite extrusions. This is depicted inFig. 15. The rate of cooling of a point 5 m below the roof of thephonolite extrusion with shape of model D-22 is 2.7× faster than inequivalent extrusion that is covered by 8 m thick layer of pumice. Incontrast, degree of cooling close to the top and bottom of thisextrusion (points A and B, second section of D-22 in Fig. 13) is similarwhen covered by the layer of pumice, but slower for the top partduring the initial cooling period.
Fig. 15. The degree of phonolite lava cooling with and without 8 m thick pumicecarapace. Degree of cooling was evaluated in points A and B, located 5 m below the roofand 5 m above the base of extrusion D-22, respectively. For exact location of the points,see the 2nd vertical section of model D-22 in Fig. 13. Cooling of point A below theextrusion roof without the insulating pumice carapace is about 2.7× faster than coolingwith the insulating layer. The rate of cooling of the top and bottom parts (A and B) of theextrusion is similar, when it is covered with the insulating layer.
Please cite this article as: Závada, P., et al., Emplacement dynamics of phthermal modeling and AMS analogue modeling data..., J. Volcanol. Geot
6. Discussion
Combined techniques of structural analysis of fabric and coolingjoint systems on the Bořeň phonolite body together with systematicanalogue modeling of magma intrusion into phreatomagmatic cratersand thermal mathematical modeling of cooling for different shapes ofbodies obtained by analogue modeling provide a unique possibility topinpoint the original shape, the internal flow kinematics andemplacement dynamics for the Bořeň phonolite body. Our resultsbring interesting insight into emplacement mode of crystallinemagma into phreatomagmatic craters in general.
The analogue modeling results imply that the intrusion andextrusion style depends primarily on the yield strength (thickness)of the analogue magma and initial overpressure build-up in theanalogue magma chamber prior to extrusion. Since none of thephonolite extrusions into phreatomagmatic craters were witnessed, itis impossible to scale the experiments. Nevertheless, the analoguemodeling approach proved as a very instructive method for under-standing the physics of complex mechanical interaction between thenon-Newtonian magma and loose (Coulomb-like) phreatomagmatictephra filling the funnel shaped volcanic craters. In our approach, wepresent the scaling analysis to constrain possible timescales foremplacement of the Bořeň phonolite assuming that the dynamicsimilarity between model D-22 and original was closely approachedon the basis of their similar relative dimensions and internal fabrics.
Suspensions of plaster powder and water proved as convenientanalogues of magmas with high crystal content such as phonolites ortrachytes (Závada et al., 2009a,b). We attempted to mimic thegeometry of phreatomagmatic craters as revealed by geological andgeophysical surveys (Schulz et al., 2005; Lorenz and Kurszlaukis,2007), although the slope angle of the upper part of the maar-diatreme established in the Cretaceous sediments is hypothetical.
6.1. Shapes of the extrusions
Cooling and solidification of lava can significantly influence shapesof extrusions by formation of solid crust which inhibits lateralspreading and rise of new lava (Griffiths and Fink, 1993; Sakimotoand Zuber, 1995). For intermediate lava compositions and typicallyandesite lavas, the effect of cooling on lava solidification is negligible,because the cooling is controlled by degassing induced crystallization(Sparks et al., 2000). Hale (2008) numerically modeled lava domeextrusion simplifying the rheology of an andesite lava dome toNewtonian viscous fluid, which was confined laterally by deformabletalus growing by rockfalls and disintegration of the solid surface. Forcrystal-rich phonolites investigated in this study, degassing inducedcrystallization and solidification could also have accompanied theiremplacement. Degassing and accumulation of the gasses in thesurficial parts of the phonolite extrusions is reflected by the presenceof pumice on the top of Kaňkov hill, similar to the surficial vesicularpumice layers in obsidian lava domes (Fink, 1983). Since the originalthickness and the mechanical properties of the pumiceous layer arenot known, it is difficult to consider its influence on lava domeextrusion dynamics. Nevertheless, utilization of isothermal materiallike plaster of Paris for modeling lava domes of intermediatecomposition is justified with the process of degassing inducedcrystallization and solidification (Sparks et al., 2000). The volume ofaggrading talus from the solidified phonolite blocks around theextrusions (Hale, 2008) would be probably negligible in contrast tothe volume of phreatomagmatic tephra talus which is pushed asidebehind the expanding extrusions. In summary, we can consider thatthe shapes and emplacement dynamics of the isothermal experimen-tal extrusions into maar-diatreme structures can closely representtheir natural phonolite lava equivalents.
Most of the extrusions prepared with suspensions of mixing ratio2.5 are considered as unrealistic equivalents to natural phonolite
onolite magma into maar-diatreme structures — Correlation of field,herm. Res. (2010), doi:10.1016/j.jvolgeores.2010.07.012

Fig. 16. Schematic block diagram depicting the interpreted flow kinematics throughoutan extrusive dome emplaced into a phreatomagmatic crater as revealed by theanalogue models.
14 P. Závada et al. / Journal of Volcanology and Geothermal Research xxx (2010) xxx–xxx
extrusions, because these were emplaced rapidly within only fewseconds (D-2, D-4, and D-11) or were confined by too competent “lid”of maar sediments (D-9 and D-12, Fig. 9). In the experiments withthick plaster and medium to large initial overpressure (25–50 bar),the plaster pushed upwards and sideways large portion or the entirevolume of the crater filling, while in experiments with low or no initialoverpressure, the plaster formed narrow conduit below an extrusivedome. Although quite large magma overpressures would be requiredto form the cryptodomes D-6 and D-14 or extrusive domes D-7 and D-8, their geometries could correspond to high aspect ratio remnants ofphonolite bodies in the České středohoří Mountains or other Tertiaryvolcanic provinces in the foreland of Alpine orogeny (Cloos and Cloos,1927; Camus, 1975; Arbaret et al., 1993). In contrast, extrusion of thesame material on flat surface would result in low aspect ratio lavadomes or flows (Závada et al., 2009a) like the phonolite couléeforming the Ryzelský Hill (Fig. 1).
Experiments with plaster suspensions of mixing ratio 2.15–2.3resulted in different extrusion shapes ranging from asymmetricextrusions fed by stems of variable width to lava lakes and branchedintrusions. These different final geometries likely reflects light differ-ences in the packing density of the loose diatreme filling andinhomogeneities in the plaster suspension. The “intrusion branching”encountered in one of the experiments (D-18) could explain themerging phonolite cupolas of Hněvín and Široký Hills (Fig. 1) orcentrically distributed phonolite bodies of Missouri Buttes (WY, USA)(Halvorson, 1980). In nature, the intrusion branching could be inducedby subsequent rise of magma batches (e.g. from a stratified magmachamber) eachwith relatively lower yield strength owing to decreasingcrystal content. However, this explanation is not fully supported by thelast three experiments. In composite experiment D-32, the flowdiverged in the upper part of the diatreme, while in earlier experimentD-18 (homogeneous suspension, mixing ratio 2.2), intrusion branchedin the lower part of the diatreme. Alternatively, branching of magmaemplaced in volcanic craters could be also explained by sluggish orunsteady ascent rate of magma allowing the short-lived conduits tosolidify.
6.2. Fabric development in the extrusions
Interpolation of magmatic fabric manifested by alignment ofsanidine and nepheline (Fig. 6) throughout the investigated Bořeňbody evinces a concave cupola with flat fabrics in the SE-central partand steep fabrics on the margins. Similar cupola shaped fabric patternresulting from the upward plug-flow is typical for most of theanaloguemodels (Fig. 9). However, the internal fabric pattern, relativedimensions of the body and the thermal structure best correspondswith model D-22. For detailed comparison of fabric throughout theBořeň body and the analogue model D-22, we inspected sections cutparallel to the mirror symmetry of the exposed phonolite body (notethe indicated profiles in Fig. 6) and the analogue model and alsosections perpendicular to the first section and transecting the elevatedplateau for the Bořeň body. A number of samples from the central andSE-central part of Bořeň measured for CPO revealed magmaticlineations with shallow plunges and N–S to NW–SE trends (Fig. 6,samples B-24, B-65, B-41, B-43, B-82, and B-94). Same fabric pattern ischaracterized by the AMS in analogue model D-22 (note lineationssubparallel with the 1st section and at high angle to the 2nd section inupper parts of the model in Fig. 11). Fabric in both analogue modelsmeasured for AMS (Fig. 11) revealed highly anisotropic domainassociated with flat and oblate fabrics in the central columnar part ofthe stems below the extrusive parts of the models surrounded bydomains with low anisotropy, neutral to prolate shaped fabric andsubhorizontal lineations encircling the central part. This fabric couldbe explained by divergent flow on the periphery of the plug flowdomain during ascent of the viscously flowing material within anupward widening stem (Fig. 11). In contrast, fabric in the margins of
Please cite this article as: Závada, P., et al., Emplacement dynamics of phthermal modeling and AMS analogue modeling data..., J. Volcanol. Geot
the models, which are vertical and parallel with their boundaries(Figs. 11 and 16) can be explained by shearing and mechanicalcoupling of the vertically ascending material with the surroundingloose substrate. The flow kinematics in the extrusive parts of themodels is similar to previous analogue and numerical modelingresults (Buisson and Merle, 2004; Závada et al., 2009a) and originatedue to circumferential stretching in the upper lateral parts and radialstretching at the base of the extrusions (Buisson andMerle, 2002). Theoutlined pattern of flow kinematics throughout the extrusionsemplaced into maar-diatremes (Fig. 16) will be distorted forasymmetric extrusive bodies like both models D22 and D24 (Fig. 11).
Second measured microstructural elements are the lenticular tosigmoidal cavities in the phonolite lava. Detailed structural mappingof these cavities throughout a single volcanic body was not carried outbefore. The origin of mostly vertical cavities throughout the Bořeňcupola and sigmoidal cavities dipping at low angle toward cupolaperiphery is best illustrated using analoguemodel D-11. Although thismodel was previously discarded for further analysis because ofunrealistically rapid emplacement, it reveals macroscopic verticalcavities increasing in abundance and dimensions from the bottom ofthe stem towards the apical part of the extrusion and local sigmoidalcavities in the central part (Fig. 17). Similarly oriented, but lessdistinct and fewer cavities are also present in model D-22. Largecavities in model D-11 formed due to fast lateral diffluence anddivergent flow of plaster during extrusion from the narrow conduit.Since the general kinematic framework of emplacement for bothmodels is virtually identical and independent of the emplacementvelocity, we can use the cavities in model D-11 for the kinematicinterpretation of cavities throughout the Bořeň cupola.
The cavities form due to strain incompatibilities in the vicinity ofinhomogeneities (like larger phenocrysts in the phonolite) and reflectthe shear thickening rheology of the extruding material (Smith, 2000;Smith et al., 2001). In other words, cavities form in places, where localshearing of the material cannot be fully accommodated by slidingalong the groundmass microphenocrysts, which are mostly repre-sented by lath-like sanidine crystals in phonolite magma, or platyhemihydrate particles in plaster suspensions. Incipiently openingcavities drain the groundmass from residual interstitial liquids, whichis reflected by minute aegirine–augite crystals growing into thecavities from the Želenický Hill phonolite (Fig. 5c). The result of thisliquid transfer is hardening and transition from ductile to brittledeformation of the solid–liquid system at low melt volumes and isanalogous to cavitation controlling creep failure ofmetamorphic rocksdeformed in grain boundary sliding regime (Závada et al., 2007;Rybacki et al., 2008). Progressing failure of the cavitated lava shouldbe manifested by increased abundance of cavities, faulting anddismemberment of the homogeneous texture by ductile tearing and
onolite magma into maar-diatreme structures — Correlation of field,herm. Res. (2010), doi:10.1016/j.jvolgeores.2010.07.012

Fig. 17. Vertical section photograph (B) and traced flow fabric trends and cavities in model D-11 (A). This model was emplaced rapidly in 3 s after sudden release of highlyoverpressured plaster from the container. Note mostly vertical cavities throughout the model and locally sigmoidal cavities in central part of the extrusion (A). The latter reflectdistortion of lenticular cavities formed at high shear stresses (C) into sigmoidal shaped cavities by resumed ductile flow at decreased shear stresses.
Table 3Physical properties of analogue model D-22, the Bořeň phonolite body and the scalingratios. Properties of analogue material are taken from Závada et al. (2009a), viscosity ofphonolite melt from Giordano et al. (2001). Viscosity of the model material refers toviscosity of water in the plaster suspension.
Model Original Model ratios
Size (m) 0.22 500 λ=3.9×10⁻⁴
Magma propertiesViscosity (Pa s) 0.001 10−4 ψ=10−7
Density (kg/m3) 2300 2530 δ=0.91Yield strength (Pa) 195 99,277 σ=3.6×10⁻⁴
15P. Závada et al. / Journal of Volcanology and Geothermal Research xxx (2010) xxx–xxx
break up of the homogeneous fabric into individual domains that aredifferentially rotated and bend, fold or extend separately, which isevident from the phonolite texture in the margins of the cupola,specifically on locality B65.
Lenticular cavities form parallel to local maximum compressivestress direction during shearing of the crystal-rich lava (Fig. 17c).Sigmoidal cavities that dip at shallow angles to the periphery of thecupola (samples B43, B92, and B94 on Bořeň, Fig. 7; upper part ofmodel D-11, Fig. 17) are interpreted as distorted lenticular cavitiesthat formed due to non-coaxial diffluence of lava. Increasing rate oflayer parallel stretching from the core to the apical part of theextruding cupola, indicated by upwardly diverging serrated layers ofcolored plaster (Fig. 17b), generates non-coaxial flow with top to theperiphery sense of shear. Fast non-coaxial flow, associated with highshear stresses (Smith, 1997), results in dilation hardening andproduces cavities inclined at low angle to the sanidine crystal fabric(Fig. 17c). Resumed, but limited ductile flow at decreased shear stressthen deforms the originally lenticular cavities into sigmoidal shape.Sigmoidal cavities with different strike of central and tail parts suggestthat the sense of shear changed during the lava extrusion (Fig. 7).
6.3. Thermal structure of the models and natural phonolite bodies
Application of finite element thermalmodeling on shapes of bodiesobtained using analogue modeling is a powerful tool for structuralanalysis of fabric and fracture patterns of irregular volcanic bodies.Fracture patterns that develop during cooling of irregular volcanicbodies were previously solved theoretically and only for simplifiedgeometries (Jaeger, 1961; Spry, 1962). Ourmodeling results imply thatif columnar joints would form in the teardrop shaped cryptodomes,theywould converge to their cores. In contrast, thermalmodels for theextrusive domes predict that cooling joints growing from the upperand lower boundaries of the bodies will confine columns of upper andlower collonades divided by a subhorizontal suture (Fig. 13). Columnsof the upper collonade are typically wider than the outward flaringcolumns of the lower collonadeon the phonolite “towers” like Bořeň orDevils Tower (WY, USA). This contrasts with thick basal columns andthinner columns in the upper parts of basalt lava flows (DeGraff andAydin, 1987; Lyle, 2000) that develop by slow conductive cooling atthe base and faster conductive and convective cooling progressingfrom the upper surface and master joints in the upper collonade,respectively (DeGraff and Aydin, 1993; Lyle, 2000). Thicker columns ofthe upper collonade on Bořeň body are attributed to relatively slowercooling of the top part due to presence of an insulating layer of pumiceand blocky lava. Insulating properties of blocky covers derived fromthe lava arewell known from acidic lava flows (Harris et al., 2002). The
Please cite this article as: Závada, P., et al., Emplacement dynamics of phthermal modeling and AMS analogue modeling data..., J. Volcanol. Geot
reconstruction of the original thickness for the insulating carapacelayer is impossible, because, (1) thermal properties of this layer areprobably not well represented by thermal properties measured from ahand-specimen of phonolite pumice, and (2) the relationship betweencolumn width and thermal gradient is known only qualitatively(DeGraff and Aydin, 1993). Nevertheless, our evaluation of the coolingwith the 8 m thick insulating layer (Fig. 15) revealed that for the initialperiod of cooling (8 years in point A) the cooling is slower than at thebottom of the extrusion, which is compatible with thicker columns atthe top of Bořeň body.
6.4. Emplacement dynamics of the Bořeň body constrained by analogueand thermal modeling
Considering that the original shape of the Bořeň phonolite body isbest reflected by the analoguemodel D-22 on the basis of their relativedimensions within the probable maar-diatreme crater, similar fabricpattern and thermal structure, we attempt to estimate the emplace-ment time of the Bořeň body using the scaling principles of analoguemodeling (Hubbert, 1937; Ramberg, 1981). Assuming that the impactof cooling on the emplacement dynamics of Bořeň phonolite wasnegligible, that the dynamic similarity between themodel and originalwas attained and that the inertial forces are negligible for slowlyemplaced magma and analogue material, time of Bořeň extrusion tocan be calculated by the following equation: to = δ⋅λ =ψð Þ⋅tm, whereδ,λ,ψ are the ratios betweenmodel and original for densities, sizes andviscosities (Table 3) and tm=160 s is extrusion time for the model.Considering viscosities of the residualmelt in the phonolite of 104–105
measured for crystal free phonolite glasses (Giordano et al., 2001),extrusion time for the Bořeň body ranges between 6 and 66 days. Wecan also indirectly calculate the yield strength of phonolite magmafrom the shape of Ryzelský Hill coulée (height 100 m, radius 1250 m)usingNye's analytical solution for axisymmetric dome in static balance
onolite magma into maar-diatreme structures — Correlation of field,herm. Res. (2010), doi:10.1016/j.jvolgeores.2010.07.012

16 P. Závada et al. / Journal of Volcanology and Geothermal Research xxx (2010) xxx–xxx
(Nye, 1952; Závada et al., 2009a), which gives a value of 99,277 Pa.Because the model ratio of yield strength calculated from equationσ=δ ⋅λ (Hubbert, 1937) is σ=3.6×10⁻⁴, value of yield strength forthe model material should be 35 Pa. This value is only about six timesless than 195 Pa measured for plaster suspensions with mixing ratiosof 2.4 (Závada et al., 2009a), which further justifies the dynamicsimilarity between model and original and our scaling approach.
6.5. Conclusions
Combined techniques of structural analysis of fractures and fabricson natural phonolite bodies together with analogue and thermalmathematical modeling revealed that the Bořeň phonolite bodyprobably represents a remnant of an asymmetric extrusive domeemplaced into a phreatomagmatic maar-diatreme crater within timeperiod of 6–66 days and cooled down to a background temperature in10,000 years. Series of analogue experiments revealed that intrusionof magma into maar-diatremes can result in emplacement ofcryptodomes, extrusive domes or branched intrusions producingextrusive domes on crater periphery. Analysis of internal fabric ofanalogue models corresponding to Bořeň body revealed a domain ofcircumferential flow around highly anisotropic fabric associated withupward plug-flow in the vertical stems underlying the extrusivedomes. Mostly vertical microscopic cavities throughout the exposedbody resulted from rapid lateral diffluence of the magma above themaar crater. Comparison of thermal models with columnar jointingpattern on the Bořeň phonolite body suggests that the extrusivedomes or lava lakes emplaced into maar-diatreme craters are markedby subhorizontal suture between the colonnades of columns. Thevertical level of the suture between the collonades, dimensions of theerosive remnant and the host maar, together with internal fabrics andorientation of the columns in the solidified lava allow to reconstructoriginal dimensions and shape of the bodies emplaced into maar-diatremes.
Acknowledgements
This work was funded in the frame of project ME09011 of theprogram KONTAKT of the Ministry of Education of the Czech Republicand from the “Junior grant” of the Grant Agency of the Czech Academyof Sciences (GAAV), No. B301110703. Fieldwork with V. Rapprich onthe Kaňkov hill providing the glassy phonolite pumice is alsoacknowledged.
References
Arbaret, L., Diot, H., Launeau, P., 1993. Le Suc phonolitique du Petit Gerbier (Velay,Massif Central); fabriques magnétique et magmatique. Comptes Rendus del'Academie des Sciences, Serie 2, Mécanique, Physique, Chimie, Sciences del'Univers. Sciences de la Terre 316 (11), 1603–1610.
Auer, A., Martin, U., Németh, K., 2007. The Fekete-hegy (Balaton Highland Hungary)“soft-substrate” and “hard-substrate” maar volcanoes in an aligned volcaniccomplex — implications for vent geometry, subsurface stratigraphy and thepalaeoenvironmental setting. Journal of Volcanology and Geothermal Research159, 225–245.
Buisson, C., Merle, O., 2002. Experiments on internal strain in lava dome cross sections.Bulletin of Volcanology 64 (6), 363–371.
Buisson, C., Merle, O., 2004. Numerical simulation of strain within lava domes. Journalof Structural Geology 26 (5), 847–853.
Cajz, V., Vokurka, K., Balogh, K., Lang, M., Ulrych, J., 1999. The České středohoří Mts.:volcanostratigraphy and geochemistry. Geolines 9, 21–28.
Calkins, J., Oppenheimer, C., Kyle, P.R., 2008. Ground-based thermal imaging of lavalakes at Erebus volcano, Antarctica. Journal of Volcanology and GeothermalResearch 177 (3), 695–704.
Camus, G., 1975. La Chaîne des Puys (Massif Central français), étude structurale etvolcanologique. Ph.D. thesis, Univ. Clermont-Fd., Sér.Géol.Minéral., 56, fasc. 27:319 p., Clermont-Ferrand, France.
Cloos, H., 1922. Tektonik und Magma. Untersuchungen zur Geologie der Tiefen.Abhandlungen der Preussischen Geologischen Landesanstalt 1 (89).
Cloos, H., Cloos, E., 1927. Die Quellkuppe des Drachenfels am Rhein. Ihre Tektonik undBildungsweise. Zeitschrift für Vulkanologie XI, 33–40.
Please cite this article as: Závada, P., et al., Emplacement dynamics of phthermal modeling and AMS analogue modeling data..., J. Volcanol. Geot
DeGraff, J.M., Aydin, A., 1987. Surface-morphology of columnar joints and itssignificance to mechanics and direction of joint growth. Geological Society ofAmerica Bulletin 99 (5), 605–617.
DeGraff, J.M., Aydin, A., 1993. Effect of thermal regime on growth increment andspacing of contraction joints in basaltic lava. Journal of Geophysical Research, SolidEarth 98 (B4), 6411–6430.
Dingwell, D.B., Romano, C., Hess, K.U., 1996. The effect of water on the viscosity of ahaplogranitic melt under P–T–X conditions relevant to silicic volcanism. Contribu-tions to Mineralogy and Petrology 124 (1), 19–28.
Fediuk, F., 1985. Pánevní krystalické břidlice a vulkanity na listu mapy 1:25 000 02-332Most (in Czech) (Basin crystalline slates and volcanics in map 1:25000 02-332Most). Czech Geological Survey report.
Fink, J.H., 1983. Structure and emplacement of a rhyolitic obsidian flow: Little GlassMountain, Medicine Lake Highland, northern California. Geological Society ofAmerica Bulletin 94, 362–380.
Giordano, D., Dingwell, D., Romano, C., 2001. Viscosity of a Teide phonolite in thewelding interval. Journal of Volcanology and Geothermal Research 103 (1–4),239–245.
Giordano, D., Romano, C., Papale, P., Dingwell, D.B., 2004. The viscosity of trachytes, andcomparison with basalts, phonolites, and rhyolites. Chemical Geology 213 (1–3),49–61.
Griffiths, R.W., Fink, J.H., 1993. Effects of surface cooling on the spreading of lava flowsand domes. Journal of Fluid Mechanics 252, 667–702.
Hale, A.J., 2008. Lava dome growth and evolution with an independently deformabletalus. Geophysical Journal International 174 (1), 391–417.
Halvorson, D. L., 1980. Geology and petrology of the Devils Tower, Missouri Buttes, andBarlow Canyon area, Crook County, Wyoming. Ph.D. thesis, Grand Forks, Universityof North Dakota.
Harris, A.J.L., Rose, W.I., Matías, O., Flynn, L.P., 2002. The thermal stealth flows ofSantiaguito dome, Guatemala: implications for the cooling and emplacement ofdacitic block-lava flows. Geological Society of America Bulletin 114 (5), 533–546.
Hrouda, F., Chlupáčová, M., Schulmann, K., Šmíd, J., Závada, P., 2005. On the effect of lavaviscosity on the magnetic fabric intensity in alkaline volcanic rocks. StudiaGeophysica et Geodetica 49 (2), 191–212 Castle Meeting.
Hrubcová, P., Sroda, P., Špičák, A., Guterch, A., Grad, M., Keller, G.R., Brueckl, E., Thybo,H., 2005. Crustal and uppermost mantle structure of the Bohemian Massif based onCELEBRATION 2000 data. Journal of Geophysical Research, Solid Earth 110 (B11)Art. No. B11305.
Hubbert, M.K., 1937. Theory of scale models as applied to the study of geologicstructures. Geological Society of America Bulletin 48 (10), 1459–1519.
Jaeger, J.C., 1961. The cooling of irregularly shaped igneous bodies. American Journal ofScience 259, 721–734.
Jančušková, Z., Schulmann, K., Melka, R., 1992. Relation entre fabrique de la sanidine etmise en place des magmas trachytiques (exemple de massif de Hradište; Bohêmedu Nord). Geodinamica Acta 5 (4), 235–244.
Jelínek, V., 1981. Characterization ofmagnetic fabric of rocks. Tectonophysics 79, 63–67.Kavka, J., 1981. Petrologie znělce z Ryzelského vrchu (in Czech). Translated title:
Petrology of phonolite from Ryzelský hill. Appendix to final report of O. Hašlar:Most-Hořany. Geoindustria, n.p. Praha. Geofond Archive. Prague.
Kohl, T., Hopkirk, R.J., 1995. Fracture — a simulation code for forced fluid-flow andtransport in fractured, porous rock. Geothermics 24 (3), 333–343.
Konečný, V., Lexa, J., 2003. Evolution of the phreatomagmatic/extrusive/intrusivecomplex of the Bulhary maar-diatreme volcano in Southern Slovakia. Geolines 15,47–51.
Kopecký, L., 1978. Neoidic taphrogenic evolution and young alkaline volcanism of theBohemian Massif. Sborník Geologických Věd: Geologie (Journal of GeologicalSciences: Geology). 91–107.
Kopecký, L., 1985. Geology of the north-Bohemian coal bearing basin and itssurroundings. In: Malkovský, M. (Ed.), Neovolcanic rocks (Paleogene/Neogene)(in Czech), pp. 138–147.
Kopecký, L., 1991. Basic Geological Map ČSFR, Scale 1:25000, Sheet 02-341, Bílina.Czech Geological Survey, Prague.
Kopecký, L., 2000. Fossil maar examples of the Eger rift in the territory of CzechRepublic. Terra Nostra 6, 239–244.
Le Bas, M., Le Maitre, R., Streckeisen, A., Zanettin, B., 1986. A chemical classification ofvolcanic rocks based on the total alkali–silica diagram. Journal of Petrology 27,745–750.
Lexa, O., Štípská, P., Schulmann, K., Baratoux, L., Kröner, A., 2005. Contrasting texturalrecord of two distinct metamorphic events of similar P–T conditions and differentdurations. Journal of Metamorphic Geology 23 (8), 649–666.
Lorenz, V., 1986. On the growth of maars and diatremes and its relevance to theformation of tuff-rings. Bulletin of Volcanology 48, 265–274.
Lorenz, V., 2003. Maar-diatreme volcanoes, their formation, and their setting in hard-rock or soft-rock environments. Geolines 15, 72–83.
Lorenz, V., Haneke, J., 2004. Relationship between diatremes, dykes, sills, laccoliths,intrusive–extrusive domes, lava flows, and tephra deposits with unconsolidatedwater-saturated sediments in the late Variscan intermontane Saar-Nahe Basin, SWGermany. Physical Geology of High-Level Magmatic Systems 234, 75–124.
Lorenz, V., Kurszlaukis, S., 2007. Root zone processes in the phreatomagmatic pipeemplacement model and consequences for the evolution of maar-diatremevolcanoes. Journal of Volcanology and Geothermal Research 159 (1–3), 4–32.
Lyle, P., 2000. The eruption environment of multi-tiered columnar basalt lava flows.Journal of the Geological Society of London 157, 715–722.
Martin, U., Németh, K., 2004. Peperitic lava lake-fed sills at Ság-hegy, western Hungary:a complex interaction of a wet tephra ring and lava. Physical Geology of High-LevelMagmatic Systems 234, 33–50.
onolite magma into maar-diatreme structures — Correlation of field,herm. Res. (2010), doi:10.1016/j.jvolgeores.2010.07.012

17P. Závada et al. / Journal of Volcanology and Geothermal Research xxx (2010) xxx–xxx
Martin, U., Németh, K., 2005. Eruptive and depositional history of a Pliocene tuff ringthat developed in a fluvio-lacustrine basin: Kissomlyo volcano (western hungary).Journal of Volcanology and Geothermal Research 147 (3–4), 342–356.
Nagata, T., 1961. Rock Magnetism. Maruzen, Tokyo.Nye, J.F., 1952. The mechanics of glacier flow. Journal of Glaciology 2, 82–93.Pazdernik, P., 1997. Compositional variations in the sodalite-bearing nepheline
phonolite from Želenický vrch hill, north bohemia. Acta Universitatis Carolinae —
Geologica 41 (2), 65–79.Plomerová, J., Achauer, U., Babuška, V., Granet, M., Boušková, A., Brauer, K., Brož, M.,
Brunner, M., Fischer, T., Funke, S., Geibler, W., Heuer, B., Horálek, J., Jedlička, P.,Kampf, H., Kind, R., Klinge, K., Kolář, P., Korn, M., Lindemann, M., Málek, J.,Malischewski, P., Nehybka, V., Novotný, O., Plenefisch, T., Plomerová, J., Robler, D.,Ružek, B., Stammler, K., Vavryčuk, V., Vecsey, L., Wendt, S., Zedník, J., BohemaWorking Group, I, 2003. BOHEMA 2001–2003; passive seismic experiment to studylithosphere–asthenosphere system in the western part of the Bohemian Massif.Studia Geophysica et Geodetica 47 (3), 691–701.
Popov, Y.A., Pribnow, D.F.C., Sass, J.H., Williams, C.F., Burkhardt, H., 1999. Character-ization of rock thermal conductivity by high-resolution optical scanning.Geothermics 28 (2), 253–276.
Ramberg, H., 1981. Gravity, Deformation and the Earth's Crust, 2nd ed. Academic Press,New York.
Ross, P.-S., White, J., Zimanowski, B., Büttner, R., 2008. Rapid injection of particles andgas into non-fluidized granular material, and some volcanological implications.Bulletin of Volcanology 70 (10), 1151–1168.
Rybacki, E.,Wirth, R., Dresen, G., 2008. High-strain creep of feldspar rocks: implications forcavitation and ductile failure in the lower crust. Geophysical Research Letters 35 (4).
Saar, M.O., Manga, M., Cashman, K.V., Fremouw, S., 2001. Numerical models of the onsetof yield strength in crystal-melt suspensions. Earth and Planetary Science Letters187 (3–4), 367–379.
Sakimoto, S.E.H., Zuber, M.T., 1995. The spreading of variable-viscosity axisymmetricalradial gravity currents — applications to the emplacement of Venusian pancakedomes. Journal of Fluid Mechanics 301, 65–77.
Scambos, T., Smyth, J., McCormick, T., 1987. Crystal structure refinement of a naturalhigh sanidine of upper mantle origin. American Mineralogist 72 (9–10), 973–978.
Schmidt, N., Olensen, N., 1989. Computer-aided determination of crystal-latticeorientation from electron-channelling patterns in the SEM. Canadian Mineralogist28, 15–22.
Schulz, R., Buness, H., Gabriel, G., Pucher, R., Rolf, C., Wiederhold, H., Wonik, T., 2005.Detailed investigation of preserved maar structures by combined geophysicalsurveys. Bulletin of Volcanology 68 (2), 95–106.
Please cite this article as: Závada, P., et al., Emplacement dynamics of phthermal modeling and AMS analogue modeling data..., J. Volcanol. Geot
Simmons, W., Peacor, D., 1972. Refinement of the crystal structure of a volcanicnepheline. American Mineralogist 57, 1711–1719.
Smith, J.V., 1997. Shear thickening dilatancy in crystal-rich flows. Journal ofVolcanology and Geothermal Research 79 (1–2), 1–8.
Smith, J.V., 2000. Textural evidence for dilatant (shear thickening) rheology of magmaat high crystal concentrations. Journal of Volcanology and Geothermal Research 99(1–4), 1–7.
Smith, J.V., Miyake, Y., Oikawa, T., 2001. Interpratation of porosity in dacite lava domesas ductile–brittle failure textures. Journal of Volcanology and Geothermal Research112 (1), 25–35.
Sparks, R.S.J., Murphy, M.D., Lejeune, A.M., Watts, R.B., Barclay, J., Young, S.R., 2000.Control on the emplacement of the andesite lava dome of the Soufriere HillsVolcano, Montserrat by degassing-induced crystallization. Terra Nova 12 (1),14–20.
Špičák, A., Horálek, J., 2001. Possible role of fluids in the process of earthquake swarmgeneration in the West Bohemia/Vogtland seismoactive region. Tectonophysics336 (1–4), 151–161.
Spry, A., 1962. The origin of columnar jointing, particularly in basalt flows. AustralianJournal of Earth Sciences 8 (2), 191–216.
Uličný, D., 2001. Depositional systems and sequence stratigraphy of course-graineddeltas in a shallow-marine, strike-slip setting; the Bohemian Cretaceous Basin,Czech Republic. Sedimentology 48 (3), 599–628.
Ulrych, J., Novák, J., Langrová, A., Melka, K., Cajz, V., Adamovič, J., Pertlik, F., Wiesner, T.,Žid, L., Radoň, M., 2000. Tertiary phonolite laccolith of Mariánská hora hill, N.Bohemia: geological, petrological and mineralogical characteristics. Acta MontanaIRSM AS CR 15 (116), 5–44.
Varet, J., 1971. Structure etmise en place des massifs phonolitique du Cantal (Auvergne,France). Geologische Rundschau 60 (3), 948–968.
Závada, P., Schulmann, K., Konopásek, J., Ulrich, S., Lexa, O., 2007. Extreme ductility offeldspar aggregates — melt-enhanced grain boundary sliding and creep failure:rheological implications for felsic lower crust. Journal of Geophysical Research,Solid Earth 112 (B10210). doi:10.1029/2006JB004820.
Závada, P., Kratinová, Z., Kusbach, V., Schulmann, K., 2009a. Internal fabric developmentin complex lava domes. Tectonophysics 466 (1–2), 101–113.
Závada, P., Schulmann, K., Lexa, O., Hrouda, F., Haloda, J., Týcova, P., 2009b. Themechanism of flow and fabric development in mechanically anisotropic trachytelava. Journal of Structural Geology 31, 11.
Zimanowski, B., 1998. From magma to tephra. In: Freundt, A., Rosi, M. (Eds.), Ch.Phreatomagmatic Explosions. : Devel. Volcanol., 4. Elsevier, Amsterdam, pp. 25–54.
onolite magma into maar-diatreme structures — Correlation of field,herm. Res. (2010), doi:10.1016/j.jvolgeores.2010.07.012