journal of vibration and control - university of houstonmece2hv/papers/t_pdf2.pdfjournal of...
TRANSCRIPT

http://jvc.sagepub.com
Journal of Vibration and Control
DOI: 10.1177/1077546308091459 2009; 15; 773 originally published online Feb 4, 2009; Journal of Vibration and Control
Charudatta S. Mehendale, Ian J. Fialho and Karolos M. Grigoriadis A Linear Parameter-varying Framework for Adaptive Active Microgravity Isolation
http://jvc.sagepub.com/cgi/content/abstract/15/5/773 The online version of this article can be found at:
Published by:
http://www.sagepublications.com
can be found at:Journal of Vibration and Control Additional services and information for
http://jvc.sagepub.com/cgi/alerts Email Alerts:
http://jvc.sagepub.com/subscriptions Subscriptions:
http://www.sagepub.com/journalsReprints.navReprints:
http://www.sagepub.co.uk/journalsPermissions.navPermissions:
http://jvc.sagepub.com/cgi/content/refs/15/5/773 Citations
at UNIV HOUSTON on June 29, 2009 http://jvc.sagepub.comDownloaded from

A Linear Parameter-varying Framework for AdaptiveActive Microgravity Isolation
CHARUDATTA S. MEHENDALEGE Global Research Center, Niskayuna, NY 12309, USA ([email protected])
IAN J. FIALHOKAROLOS M. GRIGORIADISDepartment of Mechanical Engineering, University of Houston, Houston, TX 77204, USA
(Received 15 May 2007� accepted 31 January 2008)
Abstract: This paper presents a novel approach to the design of adaptive active vibration isolation systemsusing linear parameter-varying (LPV) control techniques. The proposed LPV controller is scheduled basedon the relative position of the vibrating system, as well as a parameter that characterizes the harshness of thebase motion. By scheduling on relative position, the controller is able to shift its focus from a “soft” settingto a “stiff” setting depending on the need for acceleration minimization or relative displacement reduction.An outer loop that is scheduled based on a parameter that quantifies base motion harshness controls theway in which the system transitions between the “soft” and “stiff” settings. Parameter-dependent weightingfunctions are used to achieve these objectives. A single degree-of-freedom rack-level microgravity vibrationisolation model is used to demonstrate the proposed adaptive design framework. The objective is to providestringent closed-loop isolation characteristics and at the same time restrict the relative motion of the system,so as to prevent it from bumping into its hardstop bumpers. Simulations show that the parameter-varyingcontroller provides excellent isolation with simultaneous position control despite the large variability in theharshness of environmental disturbances.
Keywords: Microgravity isolation, adaptive control, linear parameter-varying systems.
1. INTRODUCTION
One of the main purposes of the International Space Station (ISS) is to act as a laboratoryfor carrying out microgravity experiments. In order to perform these acceleration-sensitiveexperiments and maintain a microgravity environment, the vibro-acoustic disturbances gen-erated due to station activity need to be attenuated (National Research Council, 2000). Thestrict microgravity isolation requirements along with the wide range of the excitation fre-quencies make this an extremely challenging vibration isolation problem. Low-frequencyexcitations (less than 0�001 Hz) are due to gravity gradient forces and atmospheric drag.Intermediate range vibrations (from 0�001 to 1 Hz) are mostly transient in nature due to as-tronaut motion and thruster firings. High-frequency vibrations (above 1 Hz) are caused by
Journal of Vibration and Control, 15(5): 773–800, 2009 DOI: 10.1177/1077546308091459
��2009 SAGE Publications Los Angeles, London, New Delhi, Singapore
Figures 2–3, 6 appear in color online: http://jvc.sagepub.com
at UNIV HOUSTON on June 29, 2009 http://jvc.sagepub.comDownloaded from

774 C. S. MEHENDALE ET AL.
sinusoidal steady-state sources, such as pumps, compressors, exercise equipment and fans,as well as transient sources, such as impacts. Disturbance attenuation is accomplished on-board the ISS by a host of passive and active isolation techniques, and both classical andmodern control approaches have been proposed to address this microgravity vibration isola-tion control problem (Knopse et al., 1991� Hampton et al., 1996� Grodsinsky and Whorton,2000� Fialho and Thampi, 2000� Fialho, 2000).
One of the main challenges in designing active microgravity isolation systems is thefact that vibration isolation must be achieved within a very restricted rattlespace. Therefore,in addition to meeting stringent isolation requirements, the control system must restrict therelative motion of the isolated system, so as to prevent it from bumping onto its hardstopbumpers. The requirements of vibration isolation and relative displacement minimizationare mutually conflicting.
In the present paper, an adaptive linear parameter-varying (LPV) approach is proposed toachieve good vibration isolation performance subject to the hard constraint on maximum rel-ative displacement. In contrast to traditional gain scheduling methods, LPV gain-schedulingprovides a systematic framework for gain-scheduled control with guarantees on stability andperformance and requiring the solution of computationally efficient linear matrix inequal-ity (LMI) optimization problems (Becker and Packard, 1994� Apkarian and Gahinet, 1995�Wu, 1995� Apkarian and Adams, 1998). The proposed LPV controller is scheduled on thereal-time measurement of relative position, such that the controller focuses on good isolationperformance when the relative displacement is small, and on minimizing displacement whenhardstop limits are approached. In other words, with the proposed controller, the isolatedsystem behaves similar to a system with a soft spring (good vibration isolation with largerrelative displacements) when the relative displacement is small, and the isolated system be-haves similar to a system with a stiff spring (displacement minimization with deterioratedisolation) when the relative displacement is large.
Furthermore, the manner in which the proposed adaptive controller changes its focusfrom a “soft” to “stiff” setting must depend on the operating environment, that is, be environ-ment-adaptive. When the base motion is small, the switch from “soft” to “stiff” shouldbe carried out very rapidly as the hardstop limits are approached. Since in this case theprobability that the system will approach its hardstops is small, the controller can focuson good isolation performance over a wider range of relative displacements. On the otherhand, in situations where base motion is significant, it would be best to start stiffening thecontrolled system gradually so that bumping is avoided. In this paper, we discuss the designof such an adaptive active isolation system using LPV gain-scheduling. LPV controllersallow transitions between different performance settings with guarantees on stability andperformance, and also take into account sensor noise and robustness issues. The presentapproach has similarities to the one proposed for adaptive active suspension design by Fialhoand Balas (2002).
The paper is organized as follows. Section 2 first describes the generic vibration isolationmodel used in this paper. Next, a novel two-level adaptive control approach is motivated andthe formulation of the general microgravity isolation problem as a single degree-of-freedomvibration isolation problem is justified. In Section 3, the main control design objectivesand constraints are stated and the adaptive control problem is formulated as an LPV controlproblem by the choice of appropriate parameter-dependent weights reflecting the differentperformance requirements. Section 4 presents the frequency-response characteristics and the
at UNIV HOUSTON on June 29, 2009 http://jvc.sagepub.comDownloaded from

ADAPTIVE ACTIVE MICROGRAVITY ISOLATION 775
Figure 1. Spring-mass vibration isolation system.
nonlinear time-domain simulations for the microgravity isolation system with the proposedadaptive LPV controller. Section 5 concludes the paper.
2. THE GENERIC VIBRATION ISOLATION PROBLEM
In this paper, we consider a simplified one-dimensional model of a vibration isolation systemwhose rigid body dynamics is represented schematically in Figure 1.
Here, M represents the mass of the isolated platform, K represents a stiffness element,Fext represents a control force applied between the isolated platform and the base, and xon ,xof f represent onboard and offboard displacements respectively. The corresponding differ-ential equation of motion is
M �xon � K�xon � xof f
� � Fext � (1)
Defining x1 :� xon � xof f , x2 :� �xon � �xof f , d :� �xof f , u � Fext and y :� [ �xon� x1]T ,Equation (1) can be written in state-space form as follows:
�x1 � x2� (2a)
�x2 � � K
Mx1 � 1
Mu � d� (2b)
y1 � � K
Mx1 � 1
Mu� (2c)
y2 � x1� (2d)
The main performance objective is to achieve a specified level of isolation, defined as theratio of isolated platform (onboard) acceleration to acceleration of the base (offboard). Fig-ure 2 shows a typical target isolation curve used for microgravity isolation devices onboard
at UNIV HOUSTON on June 29, 2009 http://jvc.sagepub.comDownloaded from

776 C. S. MEHENDALE ET AL.
Figure 2. Typical microgravity isolation curve.
the ISS. As can be seen, the target isolation curve has a �20 dB/decade rolloff in the regionbetween 0�01 Hz and 10 Hz, and levels off at �60 dB thereafter. Hence, we demand goodisolation performance above 0�01 Hz. This frequency is denoted as frollof f .
Another important performance metric is the maximum allowable relative displacement.The isolated system is restricted to operate in limited sway-space enforced by hardstops.The event of the isolated system bumping into the hardstops represents an extreme loss ofisolation performance. Hence, in addition to good motion isolation, it is also necessary toensure that the relative displacement does not exceed rattlespace limits. It is well knownthat linear controllers that focus only on isolation performance run the risk of bumping ontothe hardstops in the presence of disturbances that result in significant base motion. Thiscan be explained from the fact that lower onboard accelerations require larger relative dis-placements. Hence, most microgravity isolation platforms implement some sort of nonlinearouter-loop controller that activates when bumping is imminent (Grodsinsky and Whorton,2000). This fundamental problem of the trade-off between acceleration minimization andrestricting the relative displacement is the focus of this paper. Next, we propose an adaptivevibration isolation approach where the controlled system gradually changes focus betweenthe requirements of isolation and displacement minimization based on the measured relativedisplacement.
2.1. Adaptive Vibration Isolation
The main performance objective in design of active vibration isolation devices is to achievea specified level of isolation subject to a hard constraint on relative displacement. A typical
at UNIV HOUSTON on June 29, 2009 http://jvc.sagepub.comDownloaded from

ADAPTIVE ACTIVE MICROGRAVITY ISOLATION 777
Figure 3. Isolation characteristics for the stiff setting.
target isolation curve corresponding to good isolation performance was shown in Figure 2.An isolated system with characteristics conforming to the target isolation curve (Figure 2)is called soft in this paper. Such an isolated system behaves similar to a system with a softspring, achieving good isolation performance with large relative displacements for worst-case offboard disturbance profiles.
Now consider the isolation characteristics shown in Figure 3. Here, the target isolationcurve has a �20 dB/decade rolloff in the region between 0�1 Hz and 100 Hz, and levelsoff at �60 dB thereafter. Hence, we demand isolation performance above frollof f � 0�1Hz as compared to the requirement for good isolation performance above frollo f f � 0�01Hz in Figure 2. Therefore, an isolated system with characteristics shown in Figure 3 hasworse isolation response over the range of frequencies, but restricts the maximum relativedisplacement. Such an isolated system is said to be stiff in this paper, as it behaves similarlyto a system with a stiff spring. To have even greater emphasis on displacement minimization,frollo f f can be further increased.
The proposed adaptive vibration isolator is designed to change focus between the soft( frollo f f � 0�01 Hz) and the stiff ( frollo f f � 0�1 Hz) settings as the need arises. In particular,the adaptation is carried out based on the magnitude of the relative displacement. When therelative displacement is small, the isolator should focus on minimizing the acceleration re-sponse, that is, operate in the soft setting, as there is no danger of bumping into the hardstops.On the other hand, when the relative displacement is large and there is a high probability ofthe rack bumping into the hardstops even for small disturbances, the isolator should operatein the stiff setting, minimizing the relative displacement while allowing degraded isolationperformance.
at UNIV HOUSTON on June 29, 2009 http://jvc.sagepub.comDownloaded from
778 C. S. MEHENDALE ET AL.
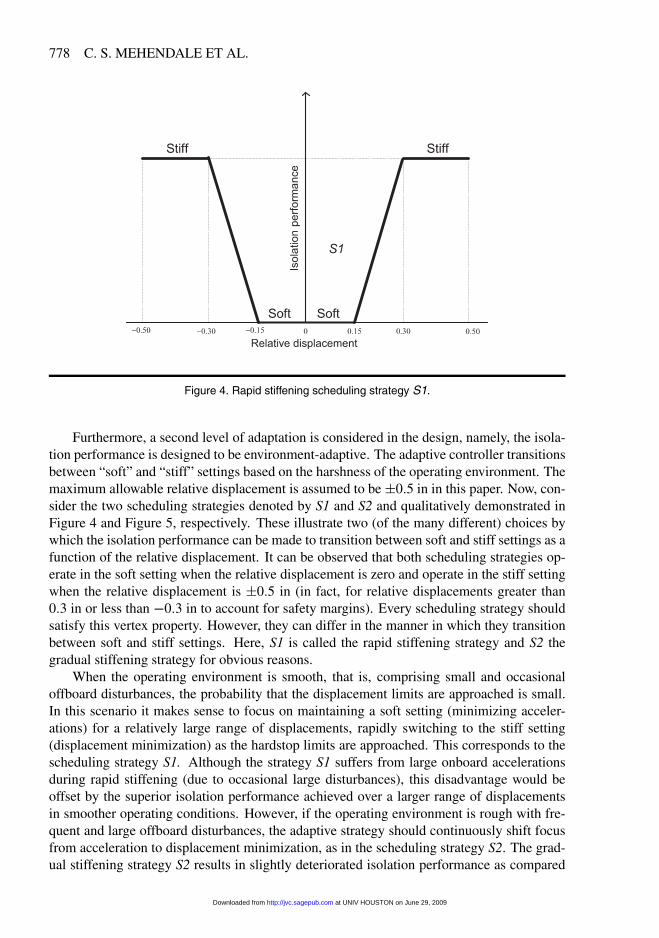
Figure 4. Rapid stiffening scheduling strategy S1.
Furthermore, a second level of adaptation is considered in the design, namely, the isola-tion performance is designed to be environment-adaptive. The adaptive controller transitionsbetween “soft” and “stiff” settings based on the harshness of the operating environment. Themaximum allowable relative displacement is assumed to be �0�5 in in this paper. Now, con-sider the two scheduling strategies denoted by S1 and S2 and qualitatively demonstrated inFigure 4 and Figure 5, respectively. These illustrate two (of the many different) choices bywhich the isolation performance can be made to transition between soft and stiff settings as afunction of the relative displacement. It can be observed that both scheduling strategies op-erate in the soft setting when the relative displacement is zero and operate in the stiff settingwhen the relative displacement is �0�5 in (in fact, for relative displacements greater than0�3 in or less than �0�3 in to account for safety margins). Every scheduling strategy shouldsatisfy this vertex property. However, they can differ in the manner in which they transitionbetween soft and stiff settings. Here, S1 is called the rapid stiffening strategy and S2 thegradual stiffening strategy for obvious reasons.
When the operating environment is smooth, that is, comprising small and occasionaloffboard disturbances, the probability that the displacement limits are approached is small.In this scenario it makes sense to focus on maintaining a soft setting (minimizing acceler-ations) for a relatively large range of displacements, rapidly switching to the stiff setting(displacement minimization) as the hardstop limits are approached. This corresponds to thescheduling strategy S1. Although the strategy S1 suffers from large onboard accelerationsduring rapid stiffening (due to occasional large disturbances), this disadvantage would beoffset by the superior isolation performance achieved over a larger range of displacementsin smoother operating conditions. However, if the operating environment is rough with fre-quent and large offboard disturbances, the adaptive strategy should continuously shift focusfrom acceleration to displacement minimization, as in the scheduling strategy S2. The grad-ual stiffening strategy S2 results in slightly deteriorated isolation performance as compared
at UNIV HOUSTON on June 29, 2009 http://jvc.sagepub.comDownloaded from

ADAPTIVE ACTIVE MICROGRAVITY ISOLATION 779
Figure 5. Gradual stiffening scheduling strategy S2.
to S1 over small displacements, but prevents the isolated system from reaching displacementlimits when operating in rough environments.
In conclusion, we implement two levels of adaptation. The first level of adaptationis due to change of focus between soft and stiff settings as relative displacement changes.The second level is environment-adaptation. In this paper, we let S1 and S2 represent thevertices of the adaptive behavior corresponding to smooth and rough operating environments,respectively. Later, we show that this two-level adaptive performance problem can be posedas an LPV problem. In the next subsection the general microgravity isolation problem isintroduced and the validity of the simplified single degree-of-freedom model is justified.
2.2. Microgravity Isolation Systems and Past Approaches
Several microgravity vibration isolation systems have been developed in the past decade andthey have been tested on various orbiting platforms (see Grodsinsky and Whorton, 2000,and the references therein). Examples include the suppression of transient accelerationsby levitation (STABLE), the microgravity vibration isolation mount (MIM), the gloveboxintegrated microgravity isolation technology (g-LIMIT), and the active rack isolation system(ARIS). The first three are experiment payload level isolators, while ARIS is the only systemthat isolates a complete payload rack.
In all these systems the mass M represents the flotor or isolated platform. Power, data,cooling fluid and other resources must be passed to the isolated payload via umbilicals, andthis is captured by the stiffness element K . The force u :� Fext represents active forcesapplied by the control actuators, while y1 :� �xon and y2 :� xon� xof f are the inertial acceler-ation of the isolated platform and relative displacement between the platform and the base. Inmost of these isolation devices, kinematic and dynamic decoupling is employed to account
at UNIV HOUSTON on June 29, 2009 http://jvc.sagepub.comDownloaded from

780 C. S. MEHENDALE ET AL.
for mass and inertia properties, stiffness cross-coupling, and skewed location of actuatorsand sensors. This decoupling reduces the control design problem to six independent degreesof freedom (three translation and three rotation). Accordingly, the single degree-of-freedommodel (1) is well justified from an engineering perspective, and is not merely a theoreti-cal simplification (Grodsinsky and Whorton, 2000). However, it should be emphasized thatthe proposed adaptive LPV control approach for vibration isolation is not limited to singledegree-of-freedom systems and that the method proposed in this paper is applicable in themultivariable extension.
There have been many applications of H� and H2 control to vibration isolation prob-lems. Hyde and Crawley (1995) investigated the application of H2 synthesis methods (LQG)to the generic active vibration isolation problem. Frequency weighting was introduced toshape the closed-loop transmissibility and accommodate robustness requirements. An ap-proach to selecting frequency weighting design filters, for the design of H2 and mixed-normcontrollers with desired stability and performance characteristics, taking into account thekinematic coupling among states in the microgravity vibration isolation problem, was de-veloped by Hampton and Whorton (2000). The paper by Whorton (2002) compares activemicrogravity vibration isolation design using both H� and H2 control design methods. Inparticular, the nominal performance and robustness to parametric uncertainties is compared.It is noted that H2 designs typically result in good nominal vibration isolation performance.However, the significant benefit of the H��� synthesis methods is the robustness to model-ing errors and parametric uncertainties inherent in umbilical and payload dynamics, whichcan be explicitly factored into the design process. Using a homotopy approach, Whorton(2005) investigated a mixed-norm (H2��) design wherein mean-squared (or H2) nominalperformance is desired along with stability robustness to parametric uncertainties and lowcontroller order. H� theory has been applied to the ARIS to achieve nominal vibration isola-tion performance, gain-stabilization of high-frequency unmodeled dynamics and robust sta-bility to low-frequency variations due to umbilical hysteresis (Fialho, 2000). Past approacheshave focused on the design of fixed controllers to provide desired stability robustness and vi-bration isolation performance characteristics.
In the present paper, the vibration isolation, displacement minimization and robustnessrequirements are specified in terms of induced L2 norms, as is standard in the H� con-trol theory, following the approach by Fialho (2000). Additionally, in contrast to previousapproaches the controller gains are scheduled based on real-time measurements of relativedisplacement and the estimation of vibration environment characteristics. The proposed LPVvibration isolation methodology is systematic and provides guaranteed closed-loop stabilityand performance despite the variability of the adaptation parameters. It is noted that theapproach in the present work can be easily extended to accommodate H2 or mixed-normcontroller synthesis, using a similar LPV framework and employing efficient numerical al-gorithms based on the solutions of LMIs.
3. CONTROL DESIGN FORMULATION AND SOLUTION
The values chosen for payload mass and umbilical stiffness in the present work are represen-tative of a typical rack-level isolation system such as ARIS (Grodsinsky and Whorton, 2000�
at UNIV HOUSTON on June 29, 2009 http://jvc.sagepub.comDownloaded from

ADAPTIVE ACTIVE MICROGRAVITY ISOLATION 781
Figure 6. Example of a rack-level isolator – ARIS.
Fialho and Thampi, 2000� Fialho, 2000). The mass of the rack is assumed to be M � 1320lb. The spring constant K is assumed to lie between 0 and 60 lbf/ft in order to capture non-linear hysteretic variation in the stiffness of the umbilicals (Fialho, 2000). A schematic ofthe rack-level ARIS system is shown in Figure 6.
The control system senses rack acceleration via three tri-axial accelerometer heads, anduses eight push-rods driven by rotary-type voice coil actuators to perform active vibrationisolation. Position sensors housed in the actuator assembly are used to sense the relativeposition between the rack and the station. Electrical power, data and other essential resourcesare routed through a set of umbilicals that are attached to the bottom of the rack. The rackmust operate within the �0�5 in rattlespace enforced by hardstop bumpers. The controlleruses measurements of the onboard acceleration y1 and the relative displacement y2.
3.1. Control Design Objectives
The single degree-of-freedom model (2) put forward in the last section is used to illustratethe proposed adaptive vibration isolation design procedure. In addition to the primary ob-
at UNIV HOUSTON on June 29, 2009 http://jvc.sagepub.comDownloaded from

782 C. S. MEHENDALE ET AL.
jective of adaptive performance, the controllers should also take into account the followinguncertainties and disturbances occurring in a typical microgravity isolation problem.
3.1.1. Plant Uncertainty
Umbilical hysteresis: Umbilicals do not have a constant stiffness K over the whole range ofrelative displacement, but generally have a hysteretic characteristics that causes stiffness tovary over the range of relative displacement. In our system it is assumed that this variationlies between 0 and 60 lbf/ft. This parametric uncertainty is taken into account in the LPVdesign by modeling it as an input divisive uncertainty.
Rack structural dynamic uncertainty: The simplified model shown in Figure 1 is a rigidbody model of the rack and is therefore valid only for low frequencies. In reality, rackflexible modes come into play at higher frequencies and the acceleration loop must thereforebe rolled off to gain-stabilize against these modes. This places a constraint on allowablecontrol bandwidth.
3.1.2. Noise
Accelerometer noise: Accelerometers tend to be noisy at low frequency due to a varietyof effects, such as measurement biases, drift and electronic noise. The controller sensesthis false acceleration and attempts to cancel it, thereby inducing relative motion. This canbe mitigated by ensuring that the transfer function from accelerometer noise to onboardacceleration is small at low frequencies.
Position sensor noise: Position sensors tend to be noisy at high frequency. In order to rejectthis noise, the position control loop must be adequately rolled off at high frequency.
3.1.3. Secondary Design Objectives
To account for plant uncertainty and sensor noise, the secondary design objectives are:
to achieve robust stability and performance in the face of parametric stiffness uncertainty� to gain-stabilize flexible modes by rolling off the acceleration open loop transfer function
appropriately� to reject accelerometer noise and position sensor noise effects on onboard acceleration
and relative position response.
3.1.4. Summary of Control Design Problem
The control problem considered in this paper is the use of output feedback y� i.e. inertialacceleration and relative position, to stabilize robustly the closed-loop system and achievea level of disturbance rejection from the external disturbance d (i.e. offboard acceleration)to the measured output y. In addition to good isolation performance, it is also necessary to
at UNIV HOUSTON on June 29, 2009 http://jvc.sagepub.comDownloaded from

ADAPTIVE ACTIVE MICROGRAVITY ISOLATION 783
ensure that the relative displacement does not exceed rattlespace limits. Thus the proposedactive microgravity isolation design is a trade-off between the competing objectives of dis-turbance isolation and limiting displacement. The next section formulates the above designproblem as an LPV control problem. The controller synthesis is posed as a LMI optimiza-tion problem which is solved using efficient interior point optimization methods (Boyd et al.,1994� Gahinet et al., 1995� Skelton et al., 1998).
3.2. LPV Formulation
In this section we formulate the adaptive performance problem described in the previoussection as a LPV control problem scheduled on the parameter � � �
�d� �e
�, where �e is a
function of the harshness of the environment and �d is a function of the relative displacementx1 and �e. The parameter �d is an even function of x1, due to the obvious symmetry indesired performance (soft or stiff) as a function of displacement (see Figures 4 and 5). Theapproach followed in this paper is similar to the one investigated by Fialho and Balas (2002)for adaptive active suspension design. In addition to the specifications and constraints ofthe microgravity isolation problem, the LPV formulation used in this paper is distinct� theparameter design space is reduced to one dimension in the present work as opposed to atwo-dimensional parameter space employed by Fialho and Balas (2002). This leads to asimplified representation of the parameter-dependent weighting functions.
3.2.1. Environment Adaptation via Scheduling on �e
The roughness of the environment is quantified by the parameter �e� The parameter �e isassumed to lie in the interval [0� 1] � with �e � 0 corresponding to a smooth environmentwith minimal offboard disturbances, and �e � 1 to a rough environment with persistenttransient disturbances. Furthermore, �e is assumed to be slowly varying. Based on thediscussion in Section 2.1, we use the scheduling strategy S1 when �e � 0 and the schedulingstrategy S2 when �e � 1� Recall that S1 is the rapid stiffening strategy and S2 the gradualstiffening strategy. Strategy S1 operates in the soft setting ( frollo f f � 0�01 Hz) for x1 �0�15 in, and in the stiff setting ( frollo f f � 0�1 Hz) for x1 � 0�3 in. For 0�15 � x1 � 0�3 in,we have 0�01 � frollo f f � 0�1. The gradual stiffening strategy S2 operates in the stiff setting( frollo f f � 0�1 Hz) for x1 � 0�3 in, with 0�01 � frollof f � 0�1 for 0 � x1 � 0�3�
In general, for any value of �e [0� 1] the scheduling strategy is determined as follows.We assume that the controller focus is exclusively on acceleration minimization for smalldisplacements, that is, for displacements in an interval 0 � x1 � q. We assume that thefocus shifts to displacement minimization for large displacements, that is, for displacementsin an interval 0�30 � x1 � 0�50, and varies linearly its focus on acceleration versus dis-placement in the intermediate interval q � x1 � 0�30. We define q
��e
�to denote the
switching point of the adaptive stiffening strategy. In this work q is chosen to vary linearlyfrom 0�15 to 0 as �e changes from 0 to 1. Clearly, �e � 0� q � 0�15 recovers the schedulingstrategy S1 and �e � 1� q � 0 corresponds to the scheduling strategy S2.
Based on the above discussion, in this paper, we use the following rules to compute�e.
at UNIV HOUSTON on June 29, 2009 http://jvc.sagepub.comDownloaded from

784 C. S. MEHENDALE ET AL.
1. If x1 � 0�15 in, then �e � 1�2. If x1 � 0�15 for 100 s, then �e � 0�3. The transitions between �e � 0 and �e � 1 are slow.
It is clear that other rules can be used to determine �e�
3.2.2. Scheduling on �d
The scheduling strategy is used to define the mapping�x1� �e
� �� �d � For example, for thescheduling strategy S1 (�e � 0),
�d �
�������0� x1 � 0�15�
3�33 �x1 � 0�15� � 0�15 � x1 � 0�30�
0�5� x1 � 0�30�
Similarly for strategy S2 (�e � 1),
�d �
1�66 x1 � 0 � x1 � 0�30�
0�5� x1 � 0�30�
In this paper, we choose �d [0� 0�5]. The mapping from x1 to �d allows us to decouplethe scheduling strategies from the desired performance during the design phase. This canbe explained as follows. Based on our previous discussion the target isolation curve rollofffrequency frollo f f is a function of both the relative displacement and the selected schedulingstrategy (S1 or S2). Thus, we have a two-dimensional parameter space spanned by the para-meters x1 and �e� By defining �d as an intermediate design parameter, we can make frollof f afunction of a single parameter �d � This makes it possible to solve the LPV synthesis problemover a one-dimensional parameter space. In this paper, we set
frollo f f � 10��2�2�d � Hz
such that frollof f � 0�01 Hz (soft setting) for �d � 0 and frollo f f � 0�1 Hz (stiff setting) for�d � 0�5�
The performance requirements are specified in terms of induced�2 norms, as is standardin the �� control theory, by appropriately weighting the signals of interest. This frame-work is appropriate as it supports the specification of both robust stability and performancerequirements. Some of the frequency-dependent weighting functions that are used in theproposed design are functions of the parameter �d in order to meet the parameter-dependentperformance requirements. The augmented control design interconnection is shown in Fig-ure 7. The LPV controller uses the real-time measurements of onboard acceleration (y1) andrelative rack displacement (y2). The objective is to stabilize robustly the open-loop systemand minimize the energy-to-energy gain from the disturbance signal � [1� � � � � 5]T tothe error signal z � [z1� z2� z3]T . The disturbance vector consists of the offboard accel-eration �1�, fictitious signals that account for parametric and unstructured high-frequency
at UNIV HOUSTON on June 29, 2009 http://jvc.sagepub.comDownloaded from

ADAPTIVE ACTIVE MICROGRAVITY ISOLATION 785
Figure 7. Control design interconnection.
uncertainties �2� 3�, and acceleration and position sensor noises �4� 5�. The error sig-nal z is composed of the weighted onboard acceleration �z1�, the weighted relative position�z2�, and the weighted control signal �z3�.
3.2.3. Selection of the Weighting Functions
The shape of the frequency response of the transfer function from the offboard to the onboardacceleration determines the achievable performance. The desired isolation curve given byFigure 2 for the soft setting and Figure 3 for the stiff setting can be obtained by weightingthe transfer function from �xof f to �xon by roughly the inverse of the desired isolation curve.The weight on the offboard acceleration disturbance W Tacc� shown in Figure 8, along withthe parameter-dependent weight W Ttrans� filters the offboard acceleration and shapes thetransfer function from the offboard to the onboard acceleration. The parameter-dependentperformance requirement is enforced in the design by using a parameter-dependent weightW Ttrans . The functional dependence of W Ttrans on � is given by
W Ttrans��� � 0�5� 0�8� �d � (3)
at UNIV HOUSTON on June 29, 2009 http://jvc.sagepub.comDownloaded from

786 C. S. MEHENDALE ET AL.
Figure 8. Offboard acceleration disturbance weight W Tacc.
The action of W Ttrans can be described as scaling the weight W Tacc� so that the transferfunction from offboard to onboard acceleration achieves the desired shape. For example,when �d � 0�5, W Ttrans�0�5� � 0�1, and this is equivalent to the desired isolation curverolling off at 0�1 Hz, resulting in the appropriate weight for the stiff setting.
The other main parameter-dependent weight is the weight on the relative rack displace-ment, denoted by W Tpos��d� (Figure 9). The position weight penalizes the rack displacementand seeks to minimize the effect of the offboard acceleration on the position of the rack. Weselect
W Tpos
��d
� � 10��3�2�d� � s � 210��2�6�d �
s � 210��8�6�d ��
For �d � 0 the position weight crossover is at 10�5 Hz and for �d � 0�5 the positionweight crosses over at 0�1 Hz. Notice that higher crossover frequencies correspond to astiffer position loop and provide better control over the rack displacement.
The weights W Tnoise for acceleration sensor noise, W Tposnoise for the position sensornoise, and W Tact for the control effort are selected to be constants. The system uncertaintyintroduced by assuming rigid body dynamics is modeled as an output multiplicative uncer-tainty. W Tuncout enforces the gain stabilizing constraint so as to achieve robustness againstthis uncertainty (Figure 10). The parametric uncertainty due to the hysteretically varying um-bilical stiffness is modeled as input divisive, and the weight W Tuncin is used to compensatethis uncertainty (Figure 11).
at UNIV HOUSTON on June 29, 2009 http://jvc.sagepub.comDownloaded from

ADAPTIVE ACTIVE MICROGRAVITY ISOLATION 787
Figure 9. Position weights W Tpos for �d � 0 and �d � 0�5.
Figure 10. Output uncertainty rolloff weight W Tuncout .
at UNIV HOUSTON on June 29, 2009 http://jvc.sagepub.comDownloaded from

788 C. S. MEHENDALE ET AL.
Figure 11. Input uncertainty weight W Tuncin .
It is emphasized that the parameter-dependent weights W Ttrans and W Tpos are functionsof �d . In other words, the set of performances to be achieved (as defined by the proper choiceof these weighting functions) is parameterized by �d .
3.3. LPV Controller Synthesis
The augmented control design interconnection in Figure 7 has eight state variables. Thesynthesis of the proposed LPV controller for this interconnection involves solving a set ofthree parameter-dependent linear matrix inequalities (Apkarian and Adams, 1998). Theseinequalities can be reduced to a set of finite-dimensional LMIs, firstly by choosing appropri-ate basis functions that define the functional dependence of the Lyapunov functions X ��d�and Y ��d�� and then by gridding the parameter space and solving the inequalities at the gridpoints. However, for validation the constraints have to be checked later with a much densergrid. For the problem at hand we select the following form for the Lyapunov parametermatrices:
X ��d� � X0�
Y ��d� � Y0 � �dY1 � �2d
2Y2�
The choice X ��d� � X0, a constant Lyapunov matrix, allows the LPV controllers to bedesigned so that they are rate independent (Apkarian and Adams, 1998). In other words, the
at UNIV HOUSTON on June 29, 2009 http://jvc.sagepub.comDownloaded from

ADAPTIVE ACTIVE MICROGRAVITY ISOLATION 789
LPV controller will not be a function of the rate of variation of the parameter �d allowingeasy practical implementation. Gain-scheduled controllers that do not require a measurementof the rate of variation of the parameters are said to be practically valid by Apkarian andAdams (1998). Practically valid LPV controllers can be obtained by making one or both ofX ��d� and Y ��d� constant. However, the choice of X ��d� and Y ��d� depends on the specificproblem. Also, it is worth noting that the performance levels achieved in the design dependgreatly on the state-space realizations used to represent the parameter-dependent weights(Fialho and Balas, 2002).
The maximum velocity of the rack is assumed to be 0�008 in/s, that is �x1 � 0�008However, due to our choice of scheduling strategies, the rate of variation of the parameter�d lies in the set [�0�025� 0�025]. This follows from the fact that the maximum slope is3�33 (for scheduling strategy S1). As ��d appears linearly in the LMIs (see Theorem A.1,Appendix A), we only need to check the corresponding LMIs at the extreme points �0�025and 0�025 of the interval. Designing rate-independent controllers does not mean that rateinformation is not used during design. The LPV controllers are guaranteed to work when therate bounds on parameter variations are respected. The inequalities are solved over a sparsedesign grid of ten equally spaced points in the interval [0� 0�5] � and the solutions X ��d� andY ��d� are then verified to satisfy the constraints over a 500-point dense grid.
4. CONTROLLER VALIDATION
The proposed adaptive LPV controller is validated via frequency-response analysis and time-domain simulations. The LPV controller is scheduled on the value of the parameter �d . Forevery measured value of
�x1� �e
�� the parameter �d�x1� �e� is calculated and the controller
state-space matrices are computed using the formulae given in Apkarian and Adams (1998)and Wu (1995) (see Theorem A.2, Appendix A).
4.1. Frequency-Domain Analysis
The isolation performance with the LPV controller is shown in Figure 12 for the two vertexvalues of �d and a nominal stiffness value of K � 60 lbf/ft. For �d � 0� the isolation curverolls off at approximately 0�006 Hz and lies completely below the target isolation curve(Figure 2, the dotted line in Figure 12). Hence, we have excellent isolation performance inthe soft setting. The rolloff for �d � 0�5 occurs at a higher frequency of 0�1 Hz, whichresults in stiffer position loops.
Hence, it can be seen that isolation response varies in a desirable manner as the value ofthe parameter �d changes. Comparable plots may be obtained for all values of the parameter�d and for all values of stiffness K in the interval [0� 60] lbf/ft, but these plots are excludeddue to space considerations.
4.2. Time-domain Simulations
Finally, a representative offboard position disturbance profile (Figure 13) is applied to therack to demonstrate the benefits of the proposed adaptive stiffening strategy. This distur-
at UNIV HOUSTON on June 29, 2009 http://jvc.sagepub.comDownloaded from

790 C. S. MEHENDALE ET AL.
Figure 12. Isolation performance for �d �0� 0�5�.
Figure 13. Representative position disturbance profile.
at UNIV HOUSTON on June 29, 2009 http://jvc.sagepub.comDownloaded from
ADAPTIVE ACTIVE MICROGRAVITY ISOLATION 791
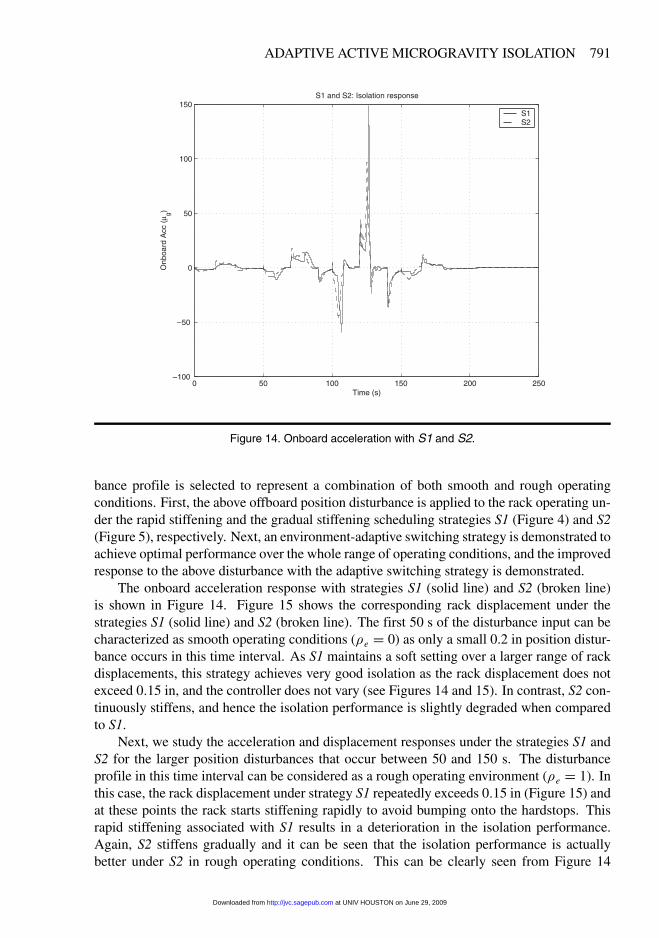
Figure 14. Onboard acceleration with S1 and S2.
bance profile is selected to represent a combination of both smooth and rough operatingconditions. First, the above offboard position disturbance is applied to the rack operating un-der the rapid stiffening and the gradual stiffening scheduling strategies S1 (Figure 4) and S2(Figure 5), respectively. Next, an environment-adaptive switching strategy is demonstrated toachieve optimal performance over the whole range of operating conditions, and the improvedresponse to the above disturbance with the adaptive switching strategy is demonstrated.
The onboard acceleration response with strategies S1 (solid line) and S2 (broken line)is shown in Figure 14. Figure 15 shows the corresponding rack displacement under thestrategies S1 (solid line) and S2 (broken line). The first 50 s of the disturbance input can becharacterized as smooth operating conditions (�e � 0) as only a small 0.2 in position distur-bance occurs in this time interval. As S1 maintains a soft setting over a larger range of rackdisplacements, this strategy achieves very good isolation as the rack displacement does notexceed 0�15 in, and the controller does not vary (see Figures 14 and 15). In contrast, S2 con-tinuously stiffens, and hence the isolation performance is slightly degraded when comparedto S1.
Next, we study the acceleration and displacement responses under the strategies S1 andS2 for the larger position disturbances that occur between 50 and 150 s. The disturbanceprofile in this time interval can be considered as a rough operating environment (�e � 1). Inthis case, the rack displacement under strategy S1 repeatedly exceeds 0�15 in (Figure 15) andat these points the rack starts stiffening rapidly to avoid bumping onto the hardstops. Thisrapid stiffening associated with S1 results in a deterioration in the isolation performance.Again, S2 stiffens gradually and it can be seen that the isolation performance is actuallybetter under S2 in rough operating conditions. This can be clearly seen from Figure 14
at UNIV HOUSTON on June 29, 2009 http://jvc.sagepub.comDownloaded from

792 C. S. MEHENDALE ET AL.
Figure 15. Rack displacement with S1 and S2.
where the peak onboard acceleration under S2 (broken line) is only 96�6 �g compared to thepeak value of 148�7 �g under strategy S1.
Summarizing, we conclude that over small position inputs (smooth operating conditions)S1 provides superior isolation, whereas over large inputs (rough operating conditions) strat-egy S2 provides better isolation. Both strategies appropriately restrict the relative position ofthe rack (see Figure 15). However, the isolation performance of S1 deteriorates over largedisturbances due to rapid stiffening of the controller, whereas the stiffening under S2 is grad-ual.
We now use the proposed environment-adaptive switching strategy that schedules therate of stiffening of the controller based on changing �e to obtain improved isolation perfor-mance over the full range of operating conditions. Under this environment-adaptive switch-ing strategy, the rack initially operates under S1. When the absolute relative position exceeds0�15 in, we smoothly switch to strategy S2, and remain in S2 as long as the absolute rela-tive position does not stay below 0�15 in for more than 100 s, whence we smoothly switchback to S1. In other words, if the displacement increases beyond 0�15 in we consider thatthe operating environment has changed from smooth to rough. On the other hand, when thedisplacement decreases and stays below 0�15 in for 100 s we consider the operating environ-ment to be smooth again. It can be seen that the first 0�2 in input disturbance constitutes asmooth environment whereas the next three disturbances of 0�5, 1�0 and 0�2 in, respectively,constitute a rough operating environment.
Figure 16 and Figure 17 compare the acceleration and displacement responses for S1(solid line) and the environment-adaptive switching rule (broken line). Notice that, overthe first 0�2 in position input the adaptive strategy is at S1 and hence its response coincides
at UNIV HOUSTON on June 29, 2009 http://jvc.sagepub.comDownloaded from

ADAPTIVE ACTIVE MICROGRAVITY ISOLATION 793
Figure 16. Onboard acceleration with S1 and the adaptive switching.
Figure 17. Rack displacement with S1 and the adaptive switching.
at UNIV HOUSTON on June 29, 2009 http://jvc.sagepub.comDownloaded from

794 C. S. MEHENDALE ET AL.
Figure 18. Onboard acceleration with S2 and the adaptive switching.
with S1. Next, during the subsequent 0�5 in position input, the rack displacement exceeds0�15 in, and both S1 and the environment-adaptive switching rule exhibit degraded onboardacceleration responses. At the time instant t � 57�49 s, where the rack displacement exceeds0�15 in, the environment-adaptive switching strategy switches smoothly to S2. The spike inthe acceleration response in S1 occurs due to the rapid stiffening of the LPV controller. Theacceleration spike in the environment-adaptive switching rule occurs due to the switch fromS1 to S2 (the switch from smooth to rough environment setting) at this time instant. Theslightly higher environment-adaptive switching transient on the 0�5 in input is due to thefilter setting that controls the rate of transition of the scheduling parameter �e. This transientcan be reduced by a slight lowering of the filter bandwidth, if necessary. Next, over the 1�0 indisturbance input the isolation response of strategy S1 again exhibits significant accelerationspikes due to rapid stiffening of the LPV controller. However, the environment-adaptiveswitching rule now operates in S2, and hence the peak onboard acceleration is significantlyreduced. Therefore, the environment-adaptive switching strategy exhibits improved isolationperformance by appropriately switching between S1 and S2 as �e changes.
Figure 18 and Figure 19 compare the onboard acceleration and rack displacement re-sponses for the position disturbance under S2 (solid line) versus the environment-adaptiveswitching rule (broken line). Notice that over the first 0�2 in input the environment-adaptiveswitching rule operates as S1 and the isolation performance is superior than that with S2, atthe cost of slightly larger rack displacement (Figure 19). The environment-adaptive switch-ing rule switches to S2 over the 0�5 in disturbance input and the subsequent behavior of theadaptive switching strategy (after the switching transients have subsided) follows that of S2.
at UNIV HOUSTON on June 29, 2009 http://jvc.sagepub.comDownloaded from

ADAPTIVE ACTIVE MICROGRAVITY ISOLATION 795
Figure 19. Rack displacement with S2 and the adaptive switching.
The results and the discussion above show that the environment-adaptive switching strat-egy provides improved acceleration performance over the full range of inputs and operatingconditions. Notice that, based on the switching rule, the switch back to S1 takes place after250 s (i.e. outside the interval of the above simulations) where the rack displacement hasbeen kept under 0�15 in for over 100 s.
For comparison purposes, the results of nonlinear time-domain simulations with the“pure isolation” controller ��d fixed to 0� are shown in Figure 20. We observe that thefixed controller provides excellent isolation performance over the whole range, but it doesnot sufficiently restrict the rack displacement. The resulting maximum displacement forthe position disturbance (Figure 13) is greater than 0�5 in and the rack will bump into thehardstops. In contrast, the LPV controllers with the S1, S2 and the environment-adaptiveswitching strategy provide isolation over a wide range of displacements without letting therack displacement approach the hardstop limits.
5. CONCLUDING REMARKS
In this paper we have considered the design of an adaptive LPV controller with parameter-dependent performance requirements for active microgravity isolation. Designs are carriedout for a simplified model of a rack-level microgravity isolation system. The LPV controlleris scheduled on two parameters, namely the relative displacement and the harshness of theoperating environment. This strategy provides good isolation over a large range of parame-
at UNIV HOUSTON on June 29, 2009 http://jvc.sagepub.comDownloaded from

796 C. S. MEHENDALE ET AL.
Figure 20. Acceleration and position response with isolation controller ��d � 0�.
ter values, and at the same time prevents the rack from bumping into the hardstops. This isaccomplished by appropriate variation of the LPV weights based on the roughness of the op-erating environment. Hence, based on the selection of the stiffening scheduling strategy thedesigner can provide trade-offs between rack displacement minimization and isolation per-formance. Numerical simulations have been used to illustrate the proposed adaptive designframework.
APPENDIX A. LPV CONTROLLER SYNTHESIS
Consider a linear parameter-varying (LPV) plant G��� with state-space realization
�x � A���x � B1��� � B2���u�
z � C1���x � D11��� � D12���u�
y � C2���x � D21���� (A.1)
where x�t� Rn is the system state, �t� Rm1 is the vector of exogenous inputs, u�t� Rm2 is the vector of control inputs, z�t� Rp1 is the vector of controller outputs, and y�t� Rp2 is the vector of measured outputs. We assume that the state-space matrices are known
at UNIV HOUSTON on June 29, 2009 http://jvc.sagepub.comDownloaded from

ADAPTIVE ACTIVE MICROGRAVITY ISOLATION 797
continuous functions of a time-varying parameter vector ��t� whose value can be measuredin real time. In addition, the following are assumed to hold.
1. Each parameter � i in � � ��1� �2� � � � � �L�T is assumed to lie between known extremal
values � i and � i , i.e.
� i�t� � i � � i
�� for all t � 0� 1 � i � L � (A.2)
2. The rate of variation �� i is well defined at all times and
��i�t� ��i � �i
�� for all t � 0� 1 � i � L � (A.3)
where �i � �i are known bounds on �� i .
The gain-scheduled output feedback control problem is to find a dynamic controllerK ��� with state-space realization
�xk � Ak��� ���x � Bk��� ���y�u � Ck��� ���x � Dk��� ���y (A.4)
such that the closed-loop system is internally stable and guarantees an upper bound � on the�2 gain of the closed-loop system (A.1) and (A.4) from the disturbance signal to the errorsignal z, i.e. � T
0zT zdt � � 2
� T
0Tdt� for all T � 0 (A.5)
for all admissible trajectories ��� ��� and zero state initial conditions.The following theorem gives sufficient conditions for the existence of such a gain-
scheduled controller (A.4). The dependence of data and variables on � and �� is suppressedfor simplicity.
Theorem A.1. (Apkarian and Adams, 1998). Consider the LPV plant (A.1), with pa-rameter trajectories constrained by (A.2) and (A.3). There exists a gain-scheduled outputfeedback controller (A.4) enforcing internal stability and a bound � on the �2 gain of theclosed-loop system (A.1) and (A.4), if there exist parameter-dependent symmetric matricesY ��� and X ��� such that for all pairs ��� ��� the following inf inite-dimensional LMI problemis feasible:
NX 0
0 I
�T
�����X � X A � AT X X B1 CT
1
BT1 X �� I DT
11
C1 D11 �� I
����
NX 0
0 I
�� 0� (A.6)
at UNIV HOUSTON on June 29, 2009 http://jvc.sagepub.comDownloaded from

798 C. S. MEHENDALE ET AL.
NY 0
0 I
�T
����� �Y � AY � Y AT Y CT
1 B1
C1Y �� I D11
BT1 DT
11 �� I
����
NY 0
0 I
�� 0� (A7)
X I
I Y
� 0� (A.8)
where NX and NY denote any bases of the null spaces of�
C2 D21
�and
�BT
2 DT12
��
respectively.
Furthermore, making the non-restrictive assumption that D12 and D21 have full-columnand full-row rank, respectively, the gain-scheduled controller can be constructed using thenext result.
Theorem A.2 (Apkarian and Adams, 1998). Assume that the conditions of Theorem A.1hold for a pair �X�Y � and some performance level � . Then, a gain-scheduled controllerthat satisf ies the requirements of Theorem A.1 can be constructed for any pair ��� ��� by thefollowing scheme.
Compute a solution Dk to
�max�D11 � D12 Dk D21� � � (A.9)
and set Dcl � D11 � D12 Dk D21�
Compute solutions �Bk and �Ck to the linear matrix equations����0 D21 0
DT21 �� I DT
cl
0 Dcl �� I
���� �BT
k
�
�� �
����C2
BT1 X
C1 � D12 DkC2
���� � (A.10)
����0 DT
12 0
D12 �� I Dcl
0 DTcl �� I
���� �Ck
�
�� �
����BT
2
C1Y
�B1 � B2 Dk D21�T
���� � (A.11)
Compute
�Ak � ��A � B2 DkC2�T � � X B1 � �Bk D21 �C1 � D12 DkC2�
��
�� I DTcl
Dcl �� I
��1 �B1 � B2 Dk D21�
T
C1Y � D12 �Ck
�� (A.12)
at UNIV HOUSTON on June 29, 2009 http://jvc.sagepub.comDownloaded from

ADAPTIVE ACTIVE MICROGRAVITY ISOLATION 799
Solve for N�M� the factorization problem
I � XY � N MT �
Compute Ak� Bk, and Ck using
Ck � � �Ck � DkC2Y �M�T � (A.13)
Bk � N�1� �Bk � X B2 Dk�� (A.14)
and
Ak � N�1�X �Y � N �MT � �Ak � X �A � B2 DkC2�Y � �BkC2Y � X B2 �Ck�M�T � (A.15)
It can be shown that a rate-independent gain-scheduled controller can be obtained byfixing one of the Lyapunov functions X or Y to be constant (Apkarian and Adams, 1998).
REFERENCES
Apkarian, P. and Adams, R. J., 1998, “Advanced gain-scheduling techniques for uncertain systems,” IEEE Transac-tions on Control Systems Technology 6(1), 21–32.
Apkarian, P. and Gahinet, G., 1995, “A convex characterization of gain-scheduled H� controllers,” IEEE Transac-tions on Automatic Control 40(5), 853–864.
Becker, G. and Packard, A., 1994, “Robust performance of linear parametrically varying systems using parametrically-dependent linear feedback,” Systems and Control Letters 23(3), 205–215.
Boyd, S. P., El Ghaoui, L., Feron, E., and Balakrishnan, V., 1994, Linear Matrix Inequalities in Systems and ControlTheory, SIAM, Philadelphia, PA.
Fialho, I. J., 2000, “H� control design for the active rack isolation system,” in Proceedings of the American ControlConference, pp. 2082–2086, Chicago, IL.
Fialho, I. J. and Balas, G. J., 2002, “Road adaptive active suspension design using linear parameter-varying gain-scheduling,” IEEE Transactions on Control Systems Technology 10(1), 43–54.
Fialho, I. J. and Thampi, S., 2000, “The interplay between hardware and control system design in the developmentof the active rack isolation system,” in Proceedings of the 41st AIAA Structures, Structural Dynamics andMaterials Conference, Atlanta, GA.
Gahinet, P., Nemirovski, A., Laub, A. J., and Chilali, M., 1995, LMI Control Toolbox User’s Guide, The MathWorks,Inc.
Grodsinsky, C. M. and Whorton, M. S., 2000, “Survey of active vibration isolation systems for microgravity appli-cations,” AIAA Journal of Spacecraft and Rockets 37(5), 586–596.
Hampton, D. R., Knopse, C. R., and Grodsinsky, C. M., 1996, “Microgravity isolation system design: A moderncontrol synthesis framework,” Journal of Spacecraft and Rockets 33(1), 101–109.
Hampton, D. R. and Whorton, M. S., 2000, “Frequency-weighting filter selection for H2 control of microgravityisolation systems: A consideration of the ‘implicit frequency weighting’ problem,” IEEE Transactions onInstrumentation and Measurement 49(2), 265–269.
Hyde, T. T. and Crawley, E. F., 1995, “H2 synthesis for active vibration isolation,” in Proceedings of the AmericanControl Conference, pp. 3835–3839, Seattle, WA.
Knopse, C. R., Hampton, D. R., and Allaire, P. E., 1991, “Control issues of microgravity vibration isolation,” ActaAstronautica 25(11), 687–697.
National Research Council, 2000, Microgravity Research in Support of Technologies for the Human Exploration andDevelopment of Space, Washington, DC.
at UNIV HOUSTON on June 29, 2009 http://jvc.sagepub.comDownloaded from

800 C. S. MEHENDALE ET AL.
Skelton, R. E., Iwasaki, T., and Grigoriadis, K. M., 1998, A Unif ied Algebraic Approach to Linear Control Design,Taylor and Francis, London.
Whorton, M. S., 2002, “Robust control for microgravity vibration isolation with parametric uncertainty,” Proceed-ings of the American Control Conference, pp. 256–261, Anchorage, AK.
Whorton, M. S., 2005, “Robust control for microgravity vibration isolation, Journal of Spacecraft and Rockets,”42(1), 152–160.
Wu, F., 1995, “Control of linear parametrically varying systems,” PhD Thesis, Department of Mechanical Engi-neering, University of California at Berkeley, CA.
at UNIV HOUSTON on June 29, 2009 http://jvc.sagepub.comDownloaded from