journal of university of shanghai for science and
TRANSCRIPT

Formulation Of Beta Capm Index With Weighted Average Methods And Market Risk
Comparison Of Listed Banks During Post-Global Crisis Period 2011-2020
Dinh Tran Ngoc Huy, MBA, PhD candidate (corresponding)
Banking University HCMC, Ho Chi Minh city Vietnam
Le Thi Thanh Huong, PhD Dai Nam University, Vietnam
Nguyen Thi Hang, PhD
Thai Nguyen University, University of Information and Communication Technology,
Vietnam
Vu Quynh Nam, PhD
Thai Nguyen University of Economics and Business Administration (TUEBA), Vietnam
ABSTRACT
In emerging markets such as Vietnam, stock markets has been developing with fast growth
and implies risk, hence, we need to focus on risk management strategies.
One of this study’s purposes is to state formulation of weighted beta Capm index, a
development from traditional beta Capm formula by Sharpe (1964) and Lintner (1965).
We chose 3 cases of market risk measures in listed banks in Vietnam including ACB – Asia
commercial bank, NVB- Navibank (later became National citizen bank NCB) and Weighted
beta index. We also select the post-global crisis time 2011-2020 in the survey to conduct
market risk comparison among Vietnam banks.
By using OLS regression which is a reliable method, our research results tell that ror internal
effects, we see that CPI has negative correlation and IN has positive correlation with beta in
all 3 cases (weighted beta, NVB beta and ACB beta).
In addition to, CPI, G, R anf Rf have higher impacts on beta values.
Therefore, our study can be expanded for other markets.
Key words: weighted beta formulation, risk policies, Vietnam banks, beta CAPM, market
risk comparison
JEL: M21, G30, G32, G38
ABBREVIATION
Từ viết tắt Nguyên nghĩa Tiếng Việt Nguyên nghĩa Tiếng Anh
CAPM Mô hình định giá tài sản vốn Capital Asset Pricing Model
Journal of University of Shanghai for Science and Technology ISSN: 1007-6735
Volume 23, Issue 8, August - 2021 Page-207

1.Introduction
First, There are many documents analyzing the factors affecting the stock market and
stock prices. Some authors emphasize on macroeconomic indicators (e.g. Kaluge, 2019;
Vigliarolo, 2020). Other authors point to external shocks, such as terrorist activity
(Masood et al., 2020), changes in oil prices (Masood et al., 2019). Some authors point to
the impact of industry and firm performance (Ahmed et al., 2018), dividend policy
(Kumaraswamy et al., 2019).
Next, Quantitatively, risk is often assessed by looking at historical outcomes. In finance,
standard deviation is a common measure associated with risk. Standard deviation
provides a measure of the volatility of asset prices relative to their historical average over
a given time frame.
Research issue
What are implications for management from analysis and comparison of beta CAPM of
three cases of market risk in banks ?
2. Literature review
Then, We summarize previous studies as follows:
Table 1 – Summary of previous studies
Arnes 2014 In case of Istanbul stock market,
Ex_rate Ty gia Exchange rate
FDI Đầu tư trực tiếp nước ngoài Foreign Direct Investment
FIT Minh bạch thông tin tài chính Financial Information
Transparency
R Lãi suất cho vay Lending rate
Rf Lãi suất phi rủi ro Risk free rate
SBV Ngân hàng nhà nước Việt Nam State Bank of Vietnam
NHTM Ngân hàng thương mại Commercial bank
OECD Tổ chức Hợp tác và Phát triển Kinh tế Organization for Economic
Cooperation and Development
G Tăng trưởng GDP GDP growth
Journal of University of Shanghai for Science and Technology ISSN: 1007-6735
Volume 23, Issue 8, August - 2021 Page-208

Depending on the sector, the effects of
changes in macroeconomic variables will
also vary. However, for policymakers and
legislators, our findings indicate that
keeping interest rates low has been a
good policy for the past 20 years.
Emilios 2015 Said about bank leverage and financial
stability, mentioned Leverage cycles can
cause financial instability and the impact
of leverage constraints on bank
governance performance.
Gay 2016 In paper about macro impacts on Russia,
Brazil, India and China, stated
Hypothetically, the relationship between
exchange rate and stock prices should be
positive.
Celebi and Honig 2019 In study of macro effects on Germany
stock market, author stated The
composite index (OECD), the Institute of
Economic Research's Export
Expectations index, the climate index,
exports, the consumer price index CPI, as
well as the 3-year German government
bond yields have an impact delay to stock
returns
Kumaresan 2019 In a study of Impact of macro on
Starbucks, author stated Compared with
the internal factors of the company,
macroeconomic factors (exchange rates)
have a greater influence on the
performance of the company.
Huy, D.T.N, Loan,
B.T.T, & Anh, P.T
2020 Suggest build risk model under macro
effects for Vietcombank stock price in
Vietnam
3. Methodology
Journal of University of Shanghai for Science and Technology ISSN: 1007-6735
Volume 23, Issue 8, August - 2021 Page-209

Method and Data
This study mainly use combination of quantitative methods and qualitative methods including
synthesis, inductive and explanatory methods.
For quantitative analysis, the study is supported with OLS regression.
Data is collected from reliable internet sources and websites.
Beta CAPM, also known as market risk, is an important risk factor in the CAPM - capital
asset pricing formula. The CAPM model was introduced independently by Jack Treynor
(1961, 1962), William F. Sharpe (1964), John Lintner (1964) and Jan Mossin (1966),
built on the foundation of previous research by Mr. Harry Markowitz on modern portfolio
and diversification theory.
ERi=Rf+βi(ERm−Rf)
Với:
ERi= return expected for asset i
Rf= Risk free rate
βi= Beta CAPM of the investment (which is the sensitivity of excess asset yield expectations to
market yield expectations)
(ERm−Rf)= market premium (difference between expected market return and risk-free rate)
ERi- Rfis risk premium
Then, authors develop a weighted beta formal as below:
Weighted Beta CAPM(time t) average = ( Beta of (Commercial bank i at time 0) +…+ Beta
of bank i at time t) x market value of stock of (Commercial bank i at time t) / Total (Market
value of stocks of banks)
Beta (Commercial bank i at time t) is calculated in traditional formula of Beta CAPM with
weekly data.
Seeing descriptive statistics below, we see that:
- standard deviation of SP500 and exchange rate are highest values. (see figure
1, 2 and 3)
- standard deviation of G and Rf are lowest (see figure 1, 2)
Figure 1- Weighted beta and macro descriptive stat
(source: author calculation and stock exchange)
Journal of University of Shanghai for Science and Technology ISSN: 1007-6735
Volume 23, Issue 8, August - 2021 Page-210
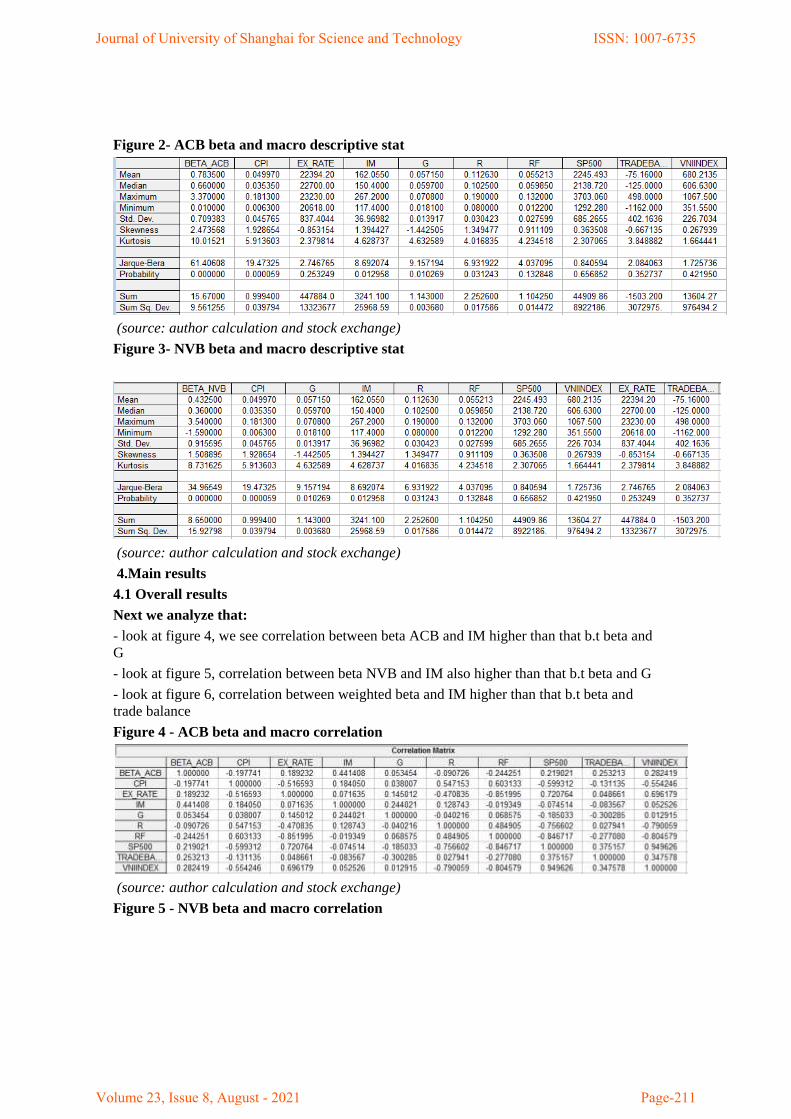
Figure 2- ACB beta and macro descriptive stat
(source: author calculation and stock exchange)
Figure 3- NVB beta and macro descriptive stat
(source: author calculation and stock exchange)
4.Main results
4.1 Overall results
Next we analyze that:
- look at figure 4, we see correlation between beta ACB and IM higher than that b.t beta and
G
- look at figure 5, correlation between beta NVB and IM also higher than that b.t beta and G
- look at figure 6, correlation between weighted beta and IM higher than that b.t beta and
trade balance
Figure 4 - ACB beta and macro correlation
(source: author calculation and stock exchange)
Figure 5 - NVB beta and macro correlation
Journal of University of Shanghai for Science and Technology ISSN: 1007-6735
Volume 23, Issue 8, August - 2021 Page-211

(source: author calculation and stock exchange)
Figure 6 - Weighted beta and macro correlation
(source: author calculation and stock exchange)
4.2 OLS Regression results
In below section, we run OLS for 1 factor and see that:
- because coefficient calculated of -1.3.06, CPI and beta ACB has negative correlation (see
figure 7)
- because coefficient calculated of 0.008, IM and beta ACB has positive correlation (see
figure 8)
- because coefficient calculated of 0.0008, VNIndex and beta ACB has positive correlation
(see figure 9)
- because coefficient calculated of -7.9, CPI and weighted beta has negative correlation (see
figure 10)
- because coefficient calculated of 0.004, IM and weighted beta has positive correlation (see
figure 11)
- because coefficient calculated of 0.001, VNIndex and weighted beta has positive correlation
(see figure 12)
Figure 7 - ACB beta and OLS for CPI
Journal of University of Shanghai for Science and Technology ISSN: 1007-6735
Volume 23, Issue 8, August - 2021 Page-212

(source: author calculation and stock exchange)
Figure 8 - ACB beta and OLS for IM
Figure 9 - ACB beta and OLS for VNIndex
Journal of University of Shanghai for Science and Technology ISSN: 1007-6735
Volume 23, Issue 8, August - 2021 Page-213

(source: author calculation and stock exchange)
Figure 10 - Weighted beta and OLS for CPI
(source: author calculation and stock exchange)
Figure 11 - Weighted beta and OLS for CIM
Journal of University of Shanghai for Science and Technology ISSN: 1007-6735
Volume 23, Issue 8, August - 2021 Page-214

(source: author calculation and stock exchange)
Figure 12 - Weighted beta and OLS for VNIndex
(source: author calculation and stock exchange)
Figure 13 - NVB beta and OLS for CPI
Journal of University of Shanghai for Science and Technology ISSN: 1007-6735
Volume 23, Issue 8, August - 2021 Page-215

(source: author calculation and stock exchange)
Figure 14 - NVB beta and OLS for IM
(source: author calculation and stock exchange)
Figure 15 - NVB beta and OLS for VNIndex
Journal of University of Shanghai for Science and Technology ISSN: 1007-6735
Volume 23, Issue 8, August - 2021 Page-216

(source: author calculation and stock exchange)
Next we look at below tables:
Table 2 - Run OLS for external factors and comparison
Coefficient
Weighted beta NVB beta ACB beta
Exchange rate 0.00022 -0.0003 0.0001
SP500 5.11E 0.0005 -1.56E
Trade balance 0.00026 -0.0002 0.0004
C -4.3 6.06 -2.5
SER 0.17 0.96 0.7
Akaike info
criteria
1.98 2.9 2.3
(source: author calculation and stock exchange)
Table 3 - Run OLS for 3 internal factors and comparison
Coefficient
Weighted beta NVB beta ACB beta
CPI -8.9 -2.8 -4.4
G 5.9 0.7 -3.0
IM 0.005 0.01 0.009
C -0.05 -1.4 -0.4
R-squared 0.53 0.23 0.27
SER 0.44 0.87 0.65
Journal of University of Shanghai for Science and Technology ISSN: 1007-6735
Volume 23, Issue 8, August - 2021 Page-217

Akaike info
criteria
1.39 2.7 2.1
(source: author calculation and stock exchange)
Table 4 - Run OLS for 4 internal factors and comparison
Coefficient
Weighted beta NVB beta ACB beta
CPI -10.6 -0.1 -4.4
G 6.7 -0.4 -3.0
IM 0.005 0.01 0.009
R 4.8 -7.6 -0.01
C -0.5 -0.6 -0.4
R-squared 0.57 0.27 0.27
SER 0.43 0.87 0.67
Akaike info
criteria
1.4 2.7 2.2
(source: author calculation and stock exchange)
Table 5 - Run OLS for 5 internal factors and comparison
Coefficient
Weighted beta NVB beta ACB beta
CPI -8.9 -0.9 -3.7
G 7.8 -1.0 -2.5
IM 0.005 0.01 0.009
R 6.06 -8.2 0.5
Rf -5.7 2.7 -2.4
C -0.3 -0.7 -0.3
R-squared 0.61 0.27 0.28
SER 0.43 0.9 0.69
Akaike info
criteria
1.4 2.8 2.3
(source: author calculation and stock exchange)
Table 6 - Run OLS for 6 factors and comparison
Coefficient
Weighted beta NVB beta ACB beta
CPI -9.0 -1.3 -4.0
G 8.5 2.8 0.5
Journal of University of Shanghai for Science and Technology ISSN: 1007-6735
Volume 23, Issue 8, August - 2021 Page-218

IM 0.005 0.01 0.009
R 7.01 -3.0 4.7
Rf -4.3 10.1 3.5
SP500 8.73E 0.0004 0.0003
C -0.7 -2.9 -2.1
R-squared 0.62 0.29 0.29
SER 0.44 0.96 0.7
Akaike info
criteria
1.5 3.0 2.4
(source: author calculation and stock exchange)
Table 7 - Run OLS for 7 factors and comparison
Coefficient
Weighted beta NVB beta ACB beta
CPI -9.0 -1.2 -4.4
G 7.7 2.7 -4.1
IM 0.004 0.02 0.008
R 7.3 -3.2 6.7
Rf -4.2 10.2 3.8
SP500 -1.39E 0.0003 -0.0001
VNIndex 0.0003 0.0001 0.001
C -0.7 -2 -1.9
R-squared 0.62 0.4 0.31
SER 0.46 0.5 0.73
Akaike info
criteria
1.6 3.0 2.5
(source: author calculation and stock exchange)
Table 8 - Run OLS for 8 internal factors and comparison
Coefficient
Weighted beta NVB beta ACB beta
CPI -8.7 -0.9 -4.3
G 14.7 12.5 -2.9
IM 0.005 0.01 0.008
R 5.9 -4.8 6.5
Rf -14.0 -3.8 2.1
SP500 0.0002 0.0008 -0.0001
Journal of University of Shanghai for Science and Technology ISSN: 1007-6735
Volume 23, Issue 8, August - 2021 Page-219

VNIndex -0.0006 -0.001 0.001
Exchange rate -0.0003 -0.0005 -6.85E
C 8.0 9.7 -0.4
R-squared 0.68 0.34 0.31
SER 0.44 0.97 0.76
Akaike info
criteria
1.5 3.0 2.6
(source: author calculation and stock exchange)
4. Discussion
During post-global crisis time: 2011-2020 period
For internal effects, we see that CPI has negative correlation and IN has positive correlation
with beta in all 3 cases. (table 8)
In addition to, CPI, G, R anf Rf have higher impacts on beta values. (see table 8)
For external effects, we see that exchange rate and trade balance have higher effects on
market risk than SP500. (see table 2)
5. Conclusion
Because CPI has negative correlation and IM has positive correlation with beta in all
3 cases, relevant agencies need to control CPI not increase too much as well as
increasing IM toward benefits for managing risk.
Al-Quaisi (2011) studied the Amman stock market in Jordan, which is considered
representative of the emerging Arab financial markets. and found that a number of
factors including size, financial leverage, government deficits, and inflation rates
significantly affect the value of a firm's systematic risk.
Huy, DTN et al (2020) have presented research showing that GDP growth rate and
lending interest rate and risk-free rate increase have a significant impact on VCB stock
price appreciation with high impact coefficient. First, the second is a decrease in the
exchange rate, and finally the S&P 500 is slightly lower.
Limitation of research
We can expand our research model for other industries and other markets.
Acknowledgement
Thank you editors, friends and brothers to support this publishing.
Journal of University of Shanghai for Science and Technology ISSN: 1007-6735
Volume 23, Issue 8, August - 2021 Page-220

References
1. Al-Qaisi., K.M. 2011, 'The Economic Determinants of Systematic Risk in the
Jordanian Capital Market', International Journal of Business and Social Science,
vol.2, no.20, pp. 85-95.
2. Duong Thi Tinh, Nguyen Thu Thuy, Dinh Tran Ngoc Huy. (2021). Doing
Business Research and Teaching Methodology for Undergraduate, Postgraduate and
Doctoral Students-Case in Various Markets Including Vietnam , Elementary
education online, 20(1).
3. Dinh Tran Ngoc Huy, Nguyen Thi Hang. (2021). Factors that affect stock price
and Beta CAPM of Vietnam Banks and Enhancing Management infomation system -
Case of Asia Commercial Bank, Revista geintec Inovacao E Tecnologias, 11(2).
4. Das, N.M., & Rout, B.S. (2020). Impact of COVID-19 on Market Risk: Appraisal
with Value-at-risk Models, The Indian economic journal, 1.
https://doi.org/10.1177/0019466220981824
5. Dinh Tran Ngoc Huy, Pham Ngoc Van, Nguyen Thi Thu Ha. (2021). Education
and computer skill enhancing for Vietnam laborers under industry 4.0 and evfta
agreement, Elementary education online, 20(4).
6. Dinh Thi Hien, Dinh Tran Ngoc Huy, Nguyen Thi Hoa. (2021). Ho Chi Minh
Viewpoints about Marxism Moral Human Resource for State Management Level in
Vietnam , Psychology and education, 58(5).
7. Dinh Tran Ngoc Huy. (2021). Banking sustainability for economic growth and
socio-economic development–case in Vietnam , Turkish Journal of computer and
mathematics education, 12(2).
8. Dimitrov V, Jain PC. (2006). The Value Relevance of Changes in Financial
Leverage, SSRN Working Paper
9. Emilios, A. 2015, Bank Leverage Ratios and Financial Stability: A Micro-and
Macroprudential Perspective&, Working Paper No.849, Levy Economics
Institute
10. Eugene FF, French KR. (2004). The Capital Asset Pricing Model: Theory and
Evidence, Journal of Economic Perspectives, 18(3).
11. González, Mariano & Nave, Juan & Rubio, Gonzalo, 2018.
Macroeconomic determinants of stock market betas ," Journal of Empirical
Finance , Elsevier, vol. 45(C), pages 26-44.
12. Grabowska, A.M., & Orlowski, L.T. (2020). Financial market risk and
macroeconomic stability variables: dynamic interactions and feedback effects,
Journal of Economics and Finance volume 44, pages655–669 (2020)
13. Gunaratha V. (2013). The Degree of Financial Leverage as a Determinant of
Financial Risk: An Empirical Study of Colombo Stock Exchange in Sri Lanka, 2nd
International Conference on Management and Economics Paper.
14. Hac, L.D., Huy, D.T.N., Thach, N.N., Chuyen, B.M., Nhung, P.T.H., Thang,
T.D., Anh, T.T. (2021). Enhancing risk management culture for sustainable growth
of Asia commercial bank -ACB in Vietnam under mixed effects of macro factors ,
Entrepreneurship and Sustainability Issues, 8(3).
15. Hang, T.T.B., Nhung, D.T.H., Hung, N.M., Huy, D.T.N., Dat, P.M. (2020).
Where Beta is going–case of Viet Nam hotel, airlines and tourism company groups
after the low inflation period , Entrepreneurship and Sustainability Issues, 7(3).
16. Huy, D.T.N. (2015). The Critical Analysis of Limited South Asian Corporate
Governance Standards After Financial Crisis, International Journal for Quality
Research, 9(4): 741-764.
17. Huy, D.T.N. (2012). Estimating Beta of Viet Nam listed construction companies
groups during the crisis , Journal of Integration and Development,15 (1), 57-71
Journal of University of Shanghai for Science and Technology ISSN: 1007-6735
Volume 23, Issue 8, August - 2021 Page-221

18. Huy, D. T.N., Loan, B. T., and Anh, P. T. (2020). Impact of selected factors on
stock price: a case study of Vietcombank in Vietnam, Entrepreneurship and
Sustainability Issues, vol.7, no.4, pp. 2715-
2730. https://doi.org/10.9770/jesi.2020.7.4(10)
19. Huy, D. T.N., Dat, P. M., và Anh, P. T. (2020). Building and econometric model
of selected factors’ impact on stock price: a case study, Journal of Security and
Sustainability Issues, vol.9(M), pp. 77-93. https://doi.org/10.9770/jssi.2020.9.M(7)
20. Huy D.T.N., Nhan V.K., Bich N.T.N., Hong N.T.P., Chung N.T., Huy P.Q.
(2021). Impacts of Internal and External Macroeconomic Factors on Firm Stock Pr
ice in an Expansion Econometric model—A Case in Vietnam Real Estate Industry,
Data Science for Financial Econometrics-Studies in Computational Intelligence,
vol.898, Springer. http://doi-org-443.webvpn.fjmu.edu.cn/10.1007/978-3-030-48853-
6_14
21. Huy, D.T.N. , An, T.T.B. , Anh, T.T.K. , Nhung, P.T.H. (2021). Banking
sustainability for economic growth and socio-economic development – case in
Vietnam, Turkish Journal of Computer and Mathematics Education, 12(2), pp.2544–
2553
22. Huy, D.T.N. , An, T.T.B. , Anh, T.T.K. , Nhung, P.T.H. (2021). Banking
sustainability for economic growth and socio-economic development –case in
Vietnam, Turkish Journal of Computer and Mathematics Education, 12(2), pp. 2544–
2553
23. Hung, J.H., & Liu, Y.C. (2005). An examination of factors influencing airline
beta values, Journal of Air Transport Management 11(4):291-296.
DOI:10.1016/j.jairtraman.2005.01.004
24. Khwaja, Asim Ijaz., and Mian, Atif. (2005). Unchecked intermediaries:Price
manipulation in an emerging stock market, Journal of Financial Economics 78, 243 –
241
25. Kumaresan, R. 2019, 'The Effects of Macroeconomics Factors towards the
Starbucks Corporation', MPRA Paper No. 97243. Retrieved from:https://mpra.ub.uni-
muenchen.de/97243/1/MPRA_paper_97243.pdf
26. Melicher, R.W. (1974). Financial Factors which Influence Beta Variations within
an Homogeneous Industry Environment, The Journal of Financial and Quantitative
Analysis, 9(2): 231-241
27. Nguyen Thi Hang, Dinh Tran Ngoc Huy. (2021). Better Risk Management of
Banks and Sustainability-A Case Study in Vietnam , Revista geintec Inovacao E
Tecnologias, 11(2).
28. Nguyen, T. P. L., Tran, N. M., Doan, X. H., & Nguyen, V. H. (2019). The
impact of knowledge sharing on innovative work behavior of Vietnam
telecommunications enterprises employees. Management Science Letters, 10(2020),
53-62.
29. Nguyen Thi Hoa, Nguyen Thi Hang, Nguyen Thanh Giang, Dinh Tran Ngoc
Huy. (2021). Human resource for schools of politics and for international relation
during globalization and EVFTA , Elementary education online, 20(4).
30. Pham Minh Dat, Nguyen Duy Mau, Bui Thi Thu Loan, Dinh Tran Ngoc Huy.
(2020). Comparative China corporate governance standards after financial crisis,
corporate scandals and manipulation, Journal of security & sustainability issues, 9(3).
31. Pham Van Hong, Huynh Xuan Nguyen, Dinh Tran Ngoc Huy, Le Thi Viet Nga,
Nguyen Thi Ngoc Lan, Nguyen Ngoc Thach, Hoang Thanh Hanh.(2021). Sustainable
bank management via evaluating impacts of internal and external macro factors on
lending interest rates in Vietnam, Linguistica Antverpiensia, Issue 1, pp.76-87.
32. Perkovic, A. (2011). Research of Beta As Adequate Risk Measure - Is Beta Still
Alive?, Croatian Operational Research Review (CRORR), vol. 2, pp.102-111.
Journal of University of Shanghai for Science and Technology ISSN: 1007-6735
Volume 23, Issue 8, August - 2021 Page-222

33. Puspitaningtyas, Z. (2017). Estimating systematic risk for the best investment
decisions on manufacturing company in Indonesia, Investment Management and
Financial Innovations, vol.14, no.1, pp. 46-54. doi:10.21511/imfi.14(1).2017.05
34. Park, J.C, Ali, F.D., Mbanga, C. (2019). Investor sentiment and aggregate stock
returns: the role of investor attention, Review of Quantitative Finance and
Accounting, 53(2), 397 - 428.
35. Phung Tran My Hanh, Nguyen Thi Hang, Dinh Tran Ngoc Huy, Le Ngoc Nuong.
(2021). Enhancing Roles of Banks and the Comparison of Market Risk and Risk
Policy Implications in Group of Listed Vietnam Banks During 2 Stages: Pre and
Post-Low Inflation Period , Revista geintec-gestao Inovacao e Tecnologias,
Vol.11(2).
Journal of University of Shanghai for Science and Technology ISSN: 1007-6735
Volume 23, Issue 8, August - 2021 Page-223