journal of theoretical biology - uce
TRANSCRIPT

Journal of Theoretical Biology 403 (2016) 45–58
Contents lists available at ScienceDirect
Journal of Theoretical Biology
http://d0022-51
n CorrE-m
v.moult
journal homepage: www.elsevier.com/locate/yjtbi
INDISIM-Paracoccus, an individual-based and thermodynamic modelfor a denitrifying bacterium
Pablo Araujo Granda a,b,n, Anna Gras b, Marta Ginovart c, Vincent Moulton d
a Chemical Engineering Faculty, Central University of Ecuador, Ciudad Universitaria – Ritter s/n y Bolivia, P.O. Box. 17-01-3972, Quito - Ecuadorb Department of Agri-Food Engineering and Biotechnology, Universitat Politècnica de Catalunya, Edifici D4, Esteve Terradas 8, 08860 Castelldefels, Barcelona - Spainc Department of Mathematics, Universitat Politència de Catalunya, Edifici D4, Esteve Terradas 8, 08860 Castelldefels, Barcelona - Spaind School of Computing Sciences, University of East Anglia, Norwich Research Park, Norwich NR4 7TJ - United Kingdom
H I G H L I G H T S
G R A P H I C A L A� An IBM to study denitrification thatuses thermodynamics for the cellularactivity.
� The simulator facilitates interactionbetween modelers and experts indenitrification.
� The thermodynamic properties em-bedded into individual cells formodeling.
x.doi.org/10.1016/j.jtbi.2016.05.01793/& 2016 Elsevier Ltd. All rights reserved.
esponding autor.ail addresses: [email protected], paraujo@[email protected] (V. Moulton).
B S T R A C T
The individual-based model approach with the thermodynamics embedded as an intracellular modeldefines the behavior-rule of the individual cell for maintenance and biomass generation to study thedenitrification products dynamics, especially the greenhouse gas N2O, carried out by denitrifying bac-terium Paracoccus denitrificans.
a r t i c l e i n f o
Article history:Received 17 December 2014Received in revised form5 May 2016Accepted 7 May 2016Available online 11 May 2016
Keywords:DenitrificationParacoccus denitrificansBacterial yield predictionIndividual-based modelThermodynamic Electron EquivalentsModelNetLogoINDISIM
a b s t r a c t
We have developed an individual-based model for denitrifying bacteria. The model, called INDISIM-Paracoccus, embeds a thermodynamic model for bacterial yield prediction inside the individual-basedmodel INDISIM, and is designed to simulate the bacterial cell population behavior and the product dy-namics within the culture. The INDISIM-Paracoccus model assumes a culture medium containing suc-cinate as a carbon source, ammonium as a nitrogen source and various electron acceptors such as oxygen,nitrate, nitrite, nitric oxide and nitrous oxide to simulate in continuous or batch culture the differentnutrient-dependent cell growth kinetics of the bacterium Paracoccus denitrificans. The individuals in themodel represent microbes and the individual-based model INDISIM gives the behavior-rules that theyuse for their nutrient uptake and reproduction cycle. Three previously described metabolic pathways forP. denitrificans were selected and translated into balanced chemical equations using a thermodynamicmodel. These stoichiometric reactions are an intracellular model for the individual behavior-rules formetabolic maintenance and biomass synthesis and result in the release of different nitrogen oxides to themedium. The model was implemented using the NetLogo platform and it provides an interactive tool toinvestigate the different steps of denitrification carried out by a denitrifying bacterium. The simulator canbe obtained from the authors on request.
& 2016 Elsevier Ltd. All rights reserved.
.edu.ec (P. Araujo Granda), [email protected] (A. Gras), [email protected] (M. Ginovart),
P. Araujo Granda et al. / Journal of Theoretical Biology 403 (2016) 45–5846
1. Introduction
Denitrification is one of the key processes of the global nitrogencycle driven by bacteria (Blackburn, 1990; Zumft, 1997). One of thereasons for studying denitrification is that it contributes to nitrousoxide (N2O) emissions when denitrifying bacteria do not completethe metabolic pathway implicated (Davidson et al., 1991; Snyderet al., 2009). The global warming potential of N2O is 296 timesgreater than a unit of CO2 (Richardson et al., 2009). In agriculturalsoils, N2O emissions are of great importance due to the largeamount of N-fertilizer in crops and soil organic matter miner-alization which depends on the conditions the microorganismencounters in its surrounding environment (Snyder et al., 2009;Woolfenden et al., 2013).
In conditions of low oxygen (O2) availability, such as water-logged soils, certain bacteria are able to use nitrate (NO3
�) as afinal electron acceptor and carry out respiratory metabolism inanaerobic conditions (denitrification). These bacteria are known asheterotrophic denitrifying bacteria and are widespread in agri-cultural soils (Felgate et al., 2012; Richardson et al., 2009). Thebacterium Paracoccus denitrificans is one of the best-characterizedprokaryotes and one of the paradigm species for studies of thebiochemistry and regulatory biology of denitrification (Bergaustet al., 2010; Caspi et al., 2012).
To model the dynamics of a bacterial denitrification systemwith P. denitrificans at least three metabolic pathways must beconsidered as follows. In the aerobic phase it can execute “Aerobicrespiration” with the oxygen (O2) as the electron acceptor, and“Nitrate reduction - Dissimilatory” with nitrate (NO3
�) as the elec-tron acceptor (Baker et al., 1998; Beijerinck, 1910; Caspi et al.,2012), and in anoxic conditions it executes the “Nitrate reduction -Denitrification process” because it is capable of anaerobic growth inthe presence of NO3
� , nitrite (NO2�), nitric oxide (NO) or N2O as
electron acceptors (Baumann et al., 1996; Bergaust et al., 2010,2012; van Verseveld et al., 1983).
The choice of a modeling approach to study a bacterial system,either population-level (top-down, usually continuous with dif-ferential equations) or individual-based (bottom-up, discrete andcomputational model) is an important decision depending on theproject’s specific aspects, the characteristics of the system and thequestions to be answered (Ferrer et al., 2008). A number of deni-trification models have been reviewed by Heinen (2006). Most ofthem incorporate a large number of parameters including NO3
� ,soil moisture, soil temperature and pH. The simplest models areobtained by adjusting empirical functions to the experimentalresults used for their studies. More recently, Kampschreur et al.(2012) and Woolfenden et al. (2013) published specific deni-trification models describing the process carried out by microbesin terms of a set of differential equations according to Monod andMichaelis–Menten kinetics. Therefore, the population-level mod-els deal with population variables and fix a set of governing laws(equations) which are based on, or at least consistent with, anassemblage of assumptions about the individual behavior ofmicrobes.
Alternatively, it is possible to simulate the interactions of au-tonomous agents (individual and collective entities) and theirenvironment, using agent-based models or, more specifically, In-dividual-Based Models (IBMs) that are defined by agents whichmodel living entities (Grimm, 1999). IBMs have the ability to si-mulate variability among individuals, local interactions, completelife cycles and individual behavior according to the changing in-dividual internal and external conditions, linking mechanisms atthe individual level to behavior at the population level (Grimm,1999; Mantzaris, 2007). IBMs consider individuals as discrete en-tities that follow behavior-rules that drive how the individuals
interact with their surrounding environment and other in-dividuals, so that the individual and the environment can changeand adapt their characteristics over time. This makes it possible toexplore connections between micro-level behaviors of individualsto macro-level patterns that emerge from their interactions (Pratset al., 2008; Wilensky, 1999).
The two approaches, the continuous-macroscopic and the dis-crete-microscopic approaches, are not incompatible or exclusive,but are complementary. Population-level approaches are mostlyused for predictive purposes, due to their simplicity and compu-tational efficiency. Moreover, they have been widely tested and,nowadays, many modeling frameworks exist. IBMs have had theirown place in microbial research and have also been used for somepredictive purposes, but their strength lies in the means they offerto disentangle and understand the dynamics of bio-systems(Hellweger and Bucci, 2009; Kreft et al., 2013).
In summary, in addition to the characteristics just described,IBMs are useful to study the relations between experimental dataand theoretical proposals, allowing testing of the consistency ofdifferent microbial models, and supplying holistic knowledge ofthe systems under study (Ferrer et al., 2008).
Ginovart et al. (2002) developed a discrete simulation model tostudy bacterial cultures called INDISIM. This model has been usedas the core for other models such as INDISIM-SOM (Ginovart et al.,2005), INDISIM-YEAST (Ginovart and Cañadas, 2008), INDISIM-COMP (Prats et al., 2010) and INDISIM-Saccha (Portell et al., 2014)to deal with soil organic matter dynamics, to study yeast fer-mentations and multi-species composting, and to analyze thedynamics of Saccharomyces cerevisiae anaerobic cultures, respec-tively. For a review of some microbial system evolutions using theIBM methodology see, for instance, (Bley, 2011; Ferrer et al., 2008;Hellweger and Bucci, 2009; Kreft et al., 2013; Lee et al., 2009; Resatet al., 2012).
Several approaches have been reported to develop a rigorousthermodynamic description for biomass yield prediction (Chris-tensen and McCarty, 1975; Heijnen and Van Dijken, 1992; Liu et al.,2007; Maskow and von Stockar, 2005; McCarty, 1971; Rittmannand McCarty, 2001; Tijhuis et al., 1993; von Stockar and van derWielen, 1997; Xiao and VanBriesen, 2006). These approachesconsider the Gibbs energy for cell synthesis from C-sources andN-sources, the energy available from substrate transformation, thespecific Gibbs energy consumption for cellular maintenance, andthe energy efficiency transfer to the overall process to describegrowth of micro-organisms in a standard mathematical and ther-modynamic model.
To tackle and understand the environmental factors that con-trol the denitrification process it is convenient to investigate thebacterial denitrification dynamics in a controlled environmentsuch as a bioreactor (Baker et al., 1998; Baumann et al., 1996;Felgate et al., 2012; Richardson et al., 2009). In this paper we will:(i) Design, implement, and parameterize thermodynamic beha-vior-rules for a P. denitrificans model in the INDISIM methodologycontext; (ii) Simulate a bioreactor containing a culture mediumwhere P. denitrificans develop and grow in order to mimic theexperimental protocols presented by Felgate et al. (2012); and (iii)Investigate the effects of the priority in the use of different elec-tron acceptors at the microbial level formulating two hypothesesabout the order in which the reactions are followed by the bacteriaP. denitrificans while the denitrification process occurs, and testthese hypotheses with the simulator developed, comparing thesimulation outputs with experimental data reported in Felgateet al. (2012).

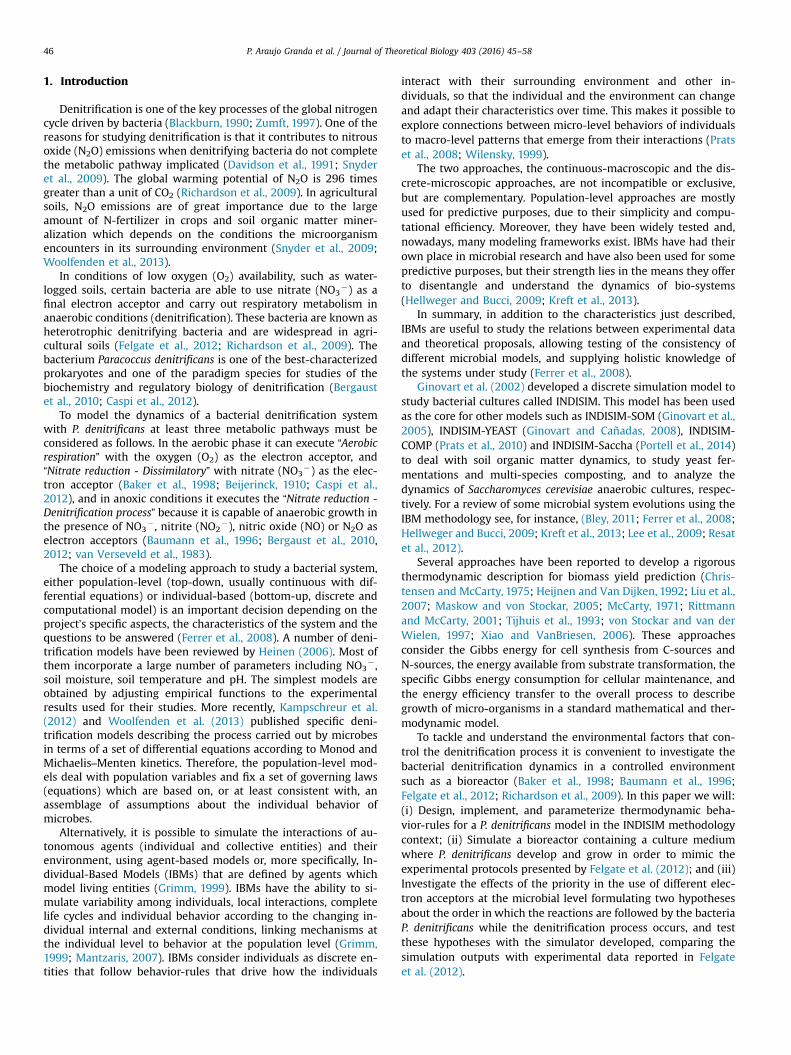
Fig. 1. Schematic representation of TEEM, adapted from (Rittmann and McCarty,2001).
P. Araujo Granda et al. / Journal of Theoretical Biology 403 (2016) 45–58 47
2. Materials and methods
2.1. INDISIM
The IBM approach to studying bacterial cultures called INDISIMwas proposed by Ginovart et al. (2002) in order to simulate thegrowth and behavior of bacterial populations. Using this as a core,we establish the INDISIM-Paracoccus model in which each simu-lated individual represents a single bacterial cell of P. denitrificans,each of them follows the individual behavior-rules concerningtheir motion, nutrient uptake and reproduction in the INDISIMframework.
2.2. Thermodynamic approach
With the word metabolism we could summarize all the bio-chemical and physiochemical processes that happen within a micro-bial cell. In brief, the microbial metabolism is comprised of two gen-eral sub-processes, catabolism and anabolism. Catabolism is all theprocesses involved in the substrates oxidation or in the use of sunlightin order to gain metabolic energy, and anabolism is the synthesis ofcellular components from C-sources and N-sources through thecatabolic energy coupling. Therefore, the energy required by theanabolic processes could come from catabolic processes (Heijnen,1999). The micro-organisms obtain this energy for maintenance andcell growth from biochemical reactions that involve several chemicalspecies, usually an electron donor and an electron acceptor.
The second version of the Thermodynamic Electron EquivalentsModel (TEEM2) (McCarty, 2007) can make an adjustment betweencell synthesis reaction (Rs), which represents the microbial ana-bolism, and the energy reaction (Re), which represents the mi-crobial catabolism to predict bacterial yield (Yc/c) with the asso-ciated Gibbs free energies for these reactions.
Re is the combination of the reduction-half-reaction for theelectron donor (Rd) with the reduction-half-reaction for the elec-tron acceptor (Ra). Rs is the combination of Rd with the half-re-action for the biomass synthesis (Rc) which considers ammoniumor other nitrogen sources for new biomass generation (Rittmannand McCarty, 2001).
TEEM2 is based on terms from the Gibbs free energy involvedin how the energy between catabolism and anabolism is coupledusing a term of energy-transfer-efficiency (ε) and the relation withthe electrons involved in both processes. The electrons that comefrom the electron-donor will be divided into two portions. Thefirst portion (feo) is transferred to the electron acceptor to generateenergy (catabolism) and the other portion of electrons (fso) istransferred to the N-source for cell synthesis (anabolism). TEEM2calculates the relationship between feo and fso using: (i) Gibbsstandard free energy of Rd, Ra and Rc, (ii) other Gibbs energy po-tential terms, and (iii) a term for energy-transfer efficiency (ε). Thisterm is included because TEEM2 considers that a fraction of thethermodynamic free energy involved is lost at each energytransfer between catabolism and anabolism. The ε value is con-sidered by McCarty (1971) to be in the range between 0.2 and 0.8.Christensen and McCarty (1975) and VanBriesen (2002) suggesteda value of 0.2–0.3 for aerobic heterotroph micro-organisms, andMcCarty (2007) and Xiao and VanBriesen (2006, 2008) proposed avalue between 0.4 and 0.7 for anaerobic heterotroph micro-organisms. Fig. 1 shows the TEEM schematic diagram.
2.3. Experimental data
To examine the denitrification process, Felgate et al. (2012)cultured P. denitrificans in a bioreactor growing under batch con-ditions in an oxygen-saturated medium for 24 h. The aeration wasthen shut down and the system switched to continuous culture
with a dilution rate of 0.05 h�1. Under these conditions two ex-periments took place, one in which the reservoir medium feedcontained 20 mM NO3
� , 5 mM succinate and 10 mM NH4þ which
was designed to achieve an electron donor-limited/electron ac-ceptor-sufficient steady state (succinate-limited/NO3
�-sufficient).In the other experiment the reservoir medium feed contained5 mM NO3
� , 20 mM succinate and 10 mM NH4þ to achieve an
electron donor-sufficient/electron acceptor-limited steady state(succinate-sufficient/NO3
�-limited). The data was collected from0 to 120 h (Felgate et al., 2012).
Therefore, the bacteria in our model will grow and develop intwo different conditions: the first during the aerobic phase (from0 to 24 h) in a batch culture, and the second one during theanaerobic phase (from 24 to 120 h) in a continuous culture. Alsothe bacteria will be handled in two different experiments: (i) inconditions of succinate-sufficient/NO3
�-limited (experiment E1),and (ii) in conditions succinate-limited/NO3
�-sufficient (experi-ment E2). The two hypotheses proposed (the metabolic hypothesisand the Gibbs' hypothesis) will be tested using the model andtaking into account all these laboratory conditions.
2.4. Programming environment and model analysis
The model is implemented in the widely used, free and opensource IBM software platform NetLogo, a multi-agent program-ming language and modeling environment for simulating naturalphenomena (Wilensky, 1999).
Given that the main purposes of the virtual experiments withthe computational model obtained are principally exploratory asto the nature and dynamics of the bio-system, the model is notdesigned for predictive purposes; a best-fit calibration (i.e., a ca-libration aiming for one unique set of parameter values givingmodel results best matched to some exact criteria) was avoided.Instead a categorical calibration, which searches for parametervalues producing results within a category or range defined asacceptable was performed (Railsback and Grimm, 2012).
The multiple outputs used to test models is one of the mainfeatures of the pattern-oriented modeling strategy and very va-luable for IBMs. Once a system representation is built, a depthexploration of how well the model really explains observed phe-nomena can be carried out with a quantitative analysis (Thieleet al., 2014). To assess the two hypotheses (the metabolic hy-pothesis and the Gibbs' hypothesis) and to facilitate parameterestimation, we established multiple fitting criteria using theparameter uptake-rate for all nutrients involved with the experi-mental data of Felgate et al. (2012). The basic idea is to find rangesof these uptake-rate values that make it possible to roughly re-produce the evolution of a set of focus variables or patterns ob-served in the two experiments.

Table 1Inorganic and organic half-reactions and their Gibbs standard free energy accord-ing to Rittmann and McCarty (2001).
Reduction-half-reaction ΔGo (kJ/eeq)
Rd 1/7 CO2 þ 1/7 HCO3� þ Hþ þ e� - 1/14 (C4H4O4)2� þ 3/7
H2O29.090
Ra(1) ¼ O2 þ Hþ þ e� - ½ H2O � 78.719Ra(2) 1/8 NO3
� þ 5/4 Hþ þ e� - 1/8 NH4þ þ 3/8 H2O � 35.11
Ra(3) ½ NO3� þ Hþ þ e� - ½ NO2
� þ ½ H2O �41.650Ra(4) 2Hþ þ NO2
� þ e� - NO þ H2O � 33.718Ra(5) Hþ þ NO þ e� - ½ N2O þ ½ H2O �115.829Ra(6) Hþ þ ½ N2O þ e� - ½ N2 þ ½ H2O � 133.469Rc 9/49 CO2 þ 3/49 NH4
þ þ 3/49 HCO3� þ Hþ þ e�
- 4/49 C3H5.4O1.45N0.75 þ 106/245 H2O20.398a
a This value was estimated from reported value of 18.8 kJ/eeq for an assumedcell relative composition of C5H7O2N (Rittmann and McCarty, 2001) and consider-ing NH4
þ as source for cell synthesis of C3H5.4O1.45N0.75 (van Verseveld et al., 1983).
Table 2Balanced energy reactions (Re) for cellular maintenance in aerobic and anaerobicphase. Re¼Ra – Rd according to (Rittmann and McCarty, 2001).
Aerobic maintenance with succinate and oxygen:(C4H4O4)2� þ 3.5 O2 - 2 CO2 þ 2 HCO3
� þ H2OAnaerobic maintenance with succinate and nitrate:(C4H4O4)2� þ 7 NO3
� - 2 CO2 þ 2 HCO3� þ 7 NO2
� þ H2OAnaerobic maintenance with succinate and nitrite:(C4H4O4)2� þ 14 NO2
� þ 14 Hþ - 14 NO þ 2 CO2 þ 2 HCO3� þ 2 H2O
Anaerobic maintenance with succinate and nitric oxide:(C4H4O4)2� þ 14 NO - 7 N2O þ 2 CO2 þ 2 HCO3
� þ H2OAnaerobic maintenance with succinate and nitrous oxide:(C4H4O4)2� þ 7 N2O - 7 N2 þ 2 CO2 þ 2 HCO3
� þ H2O
P. Araujo Granda et al. / Journal of Theoretical Biology 403 (2016) 45–5848
Taking into account that the bacteria grow in aerobic andanaerobic conditions, to calibrate the model in aerobic conditionswe combined the uptake-rates for succinate (uSuccinate) and ni-trate in aerobic phase (uNitrate-a). To calibrate the model inanaerobic conditions we first combined the uptake-rates for suc-cinate and nitrate in anaerobic phase (uNitrate-x). After that wecombined the uptake-rate of nitrate-x with the uptake-rates ofnitrite, nitric oxide and nitrous oxide. Then we combined the up-take-rate of nitrite with the uptake-rates of nitric oxide and ni-trous oxide. And finally we combined the uptake-rate of nitricoxide with the uptake-rate of nitrous oxide. Therefore, the para-meters are combined in pairs, and in all cases two parameterschange and the others remain constant.
To assess whether a certain combination of parameter valuesleads to acceptable model output, we calculate a score based onthe evaluation of the seven patterns controlled for each of theexperiments E1 and E2. Therefore, to appraise: (i) in each of thetemporal evolutions of microbial biomass, nitrate, nitrite and ni-trous oxide, if the simulation result agrees well with the experi-mental data 1 point is assigned, if agreement is fair 0.5 points areassigned and if agreement is poor 0 points are assigned, (ii) the NOconcentration in the culture medium, 1 point is assigned if themaximum NO value is under 10�3 mM, 0.5 points if the value is inthe range [10�3, 0.5] mM and 0 points in all other cases, iii) the N2
production, 1 point is assigned if the N2 production is in the rangereported by Felgate et al. (2012) and 0 points in other cases, and(iv) the role of succinate or nitrate as a limited-nutrient during thesteady state, if the simulation result agrees well with the experi-mental data 1 point is assigned, if agreement is fair 0.5 points areassigned and if agreement is poor 0 points are assigned.
Taking into account the sum of points achieved for each combi-nation and each experiment (7 patterns x 2 experiments¼14 itemsassessed), we use a percentage to represent a global model adequacyfor the experimental data. This percentage is represented usingbubble graphs, where the bubble radius is proportional to the per-centage. The tool “Behavior-Space” incorporated in NetLogo was usedfor running simulation experiments with varying parameters andwriting model outputs to files that were used for the fitting criteria.
Additionally, in order to compare the simulation results withthe experimental data we also used the geometric reliability index(GRI) values, a statistical method to determine the reliability of amodel (Jachner et al., 2007). This coefficient can deal with precisenotions of model accuracy. For models with simulation resultsreasonably close to experimental observations this GRI shows aresulting factor of 1 to 3, with 1 corresponding to 100% accuracy(Leggett and Williams, 1981).
3. INDISIM-Paracoccus modeling
3.1. Metabolic reactions
To develop the individual behavior-rule for cell maintenance itis necessary to write the energy reactions for aerobic and anae-robic conditions. For the aerobic phase we consider the reactionbetween succinate (which is always the electron donor) andoxygen (as electron acceptor), while for the anaerobic phase theelectron acceptors are nitrogen oxides. To formulate maintenancereactions and calculate the corresponding stoichiometric coeffi-cients, we used the reduction-half-reactions for Rd and differentRa shown in Table 1 to write the energy reactions (Table 2). Withthese energy reactions and appropriate maintenance require-ments, we then designed the individual rule for cell maintenance(see Supplementary material for details).
To develop the individual behavior-rule for biomass synthesis itis necessary to write the metabolic pathways for aerobic and
anaerobic conditions. To formulate these reactions (R1 to R6) andcalculate the corresponding stoichiometric coefficients we usedthe TEEM2 methodology. In all reactions succinate is the universalelectron donor (Rd) and C-source, and ammonia is the universalN-source to the cell synthesis (Rc), and the nutrients used aselectron acceptors (Ra) are different, in aerobic conditions they areO2 and NO3
� and in anaerobic conditions they are NO3� , NO2
� ,NO and N2O (Table 1). The stoichiometric coefficients for eachmetabolic pathway were obtained (Table 3) from Gibbs free energyfor each half-reaction with a different assigned ε value for eachreaction in the range proposed for McCarty (1971, 2007) andRittmann and McCarty (2001). With TEEM2 methodology eachmetabolic pathway accomplishes balances for carbon, nitrogen,electron and energy (see supplementary material for details).
3.2. INDISIM-Paracoccus model description
To describe our model we use the ODD protocol (“Overview,Design concepts, and Details”) which helps to ensure that themodel explanation is complete (Grimm, 1999; Grimm et al., 2010;Railsback and Grimm, 2012).
3.2.1. PurposeTo develop a computational model for the denitrification pro-
cess carried out by the bacteria P. denitrificans growing in batchand continuous culture, in aerobic and anaerobic growing condi-tions, in order to reproduce a bioreactor experimental protocoland explore the consequence of different priorities in the in-dividual use of nutrients on the system dynamics. The first hy-pothesis (the Gibbs hypothesis) is that the denitrification reactionssucceed sequentially according to their standard Gibbs energy,assuming that the bacterium goes first for the more spontaneousreactions. Reactions with lower Gibbs energy are expected to occur

Table 3Balanced chemical equations (R) for biomass synthesis in aerobic and anaerobicphase. (R¼ feoRa þ fsoRc – Rd) according to TEEM2 (McCarty, 2007).
R1 Aerobic conversion of succinate:(C4H4O4)2� þ 0.60 NH4
þ þ 1.04 O2 - 0.81 C3H5.4O1.45N0.75 þ 0.19 CO2
þ 1.40 HCO3� þ 0.34 H2O
R2 NO3� conversion in aerobic phase:
(C4H4O4)2� þ 0.08 NH4þ þ 0.52 NO3
� þ 1.05 Hþ þ 0.18 H2O - 0.80C3H5.4O1.45N0.75 þ 0.20 CO2 þ 1.40 HCO3
�
R3 NO3� reduction with succinate (anaerobic phase):
(C4H4O4)2� þ 0.30 NH4þ þ 4.55 NO3
� - 0.40 C3H5.4O1.45N0.75 þ 4.55NO2
� þ 1.10 CO2 þ 1.70 HCO3� þ 0.67 H2O
R4 NO2� reduction with succinate (anaerobic phase):
(C4H4O4)2� þ 0.58 NH4þ þ 4.55 NO2
� þ 4.55 Hþ - 0.77 C3H5.4O1.45N0.75
þ 4.55 NO þ 0.26 CO2 þ 1.42 HCO3� þ 2.64 H2O
R5 NO reduction with succinate (anaerobic phase):(C4H4O4)2� þ 0.58 NH4
þ þ 4.55 NO - 0.77 C3H5.4O1.45N0.75 þ 2.28 N2Oþ 0.26 CO2 þ 1.42 HCO3
� þ 0.36 H2OR6 N2O reduction with succinate (anaerobic phase):
(C4H4O4)2� þ 0.58 NH4þ þ 2.28 N2O- 0.77 C3H5.4O1.45N0.75 þ 2.28 N2 þ
0.26 CO2 þ 1.42 HCO3� þ 0.36 H2O
P. Araujo Granda et al. / Journal of Theoretical Biology 403 (2016) 45–58 49
first. In this case the order is: R3, R6, R5 and R4 (see supplemen-tary material for details). The second hypothesis (the metabolichypothesis) is that the bacterial cell prioritizes the use of thosenitrogen oxides with a higher degree of oxidation over others,which is the common order established in the denitrificationpathway (Caspi et al., 2012). In this case the order is: R3, R4, R5and R6.
3.2.2. Entities, state variables, and scalesThe INDISIM-Paracoccus model has two types of entities: in-
dividuals and square patches of culture medium. Each individualrepresents a unique bacterium of P. denitrificans and has thevariables: unique identification number, location (XY grid cell co-ordinates of where it is), mass, reproduction mass, and countersfor each metabolic pathway and reproduction cycle. Therefore, themodel assumes that the smallest individual represents a bacter-ium with a diameter of �0.5 μm and the largest one a bacteriumwith a diameter of �0.9 μm (Holt et al., 1994). All bacteria havespherical shape and their individual mass is deduced from cellvolume by assuming the microbial mass density equal to1.1 g cm�3, which has been used in previous INDISIM models (Graset al., 2011). In order to characterize the composition of the mi-crobial cells, the model uses the empirical formula C3H5.4N0.75O1.45
(van Verseveld et al., 1979, 1983) so that each bacterium is as-sumed to have this elementary cell composition.
A two-dimensional lattice of 25�25 grid cells represents thebioreactor that contains the culture medium; each cell represents1 pl, so that the total bioreactor volume is 625 pl. The spatial cellvariables are: unique position identifier in XY coordinates, totalamount of each nutrient: succinate, NH4
þ , O2, NO3� , and meta-
bolic products, NO2� , NO, N2O, N2 and CO2. All microbial and
culture medium processes are discretized in time steps. One timestep represents 5 min; for the current work the simulations wererun for 1440 time steps (120 h). With these units, graphical andnumerical model outputs are the molar concentration of nutrientsand metabolic products expressed in millimolar (mM) or micro-molar (mM) and dry mass in mg ml�1.
3.2.3. Process overview and schedulingThe initial configuration of our model has two parts: the first
one for the system and the second one for the entities (culturemedium and bacteria). The initial system setup sets the world sizeand topology, and the time scaled factor (time step). The topologyof the world is programmed using the torus mode; therefore,rectangular periodic boundary conditions were used. The initial
culture medium concentrations and the initial bacterial populationare established using random variables, normal probability dis-tributions with mean values that are determined by the experi-mental procedure (Felgate et al., 2012).
At each time step a group of individuals are controlled using aset of time-dependent variables for each bacterium. All individualsperform the following processes: nutrient uptake, cellular main-tenance, biomass synthesis, metabolic products generation andbipartition. Culture medium processes are different depending onthe management bioreactor protocol, but in any case the culturemedium is randomly homogenized to simulate chemostat agita-tion. At the beginning of the simulation the bioreactor works as abatch culture with oxygen saturated conditions (236 μM), and theuser can choose at what time to end this phase, and switch tocontinuous culture in anoxic conditions, with input-output culturemedia (with nutrients, metabolic products and micro-organisms)according to the dilution rate fixed. For each time step the time-dependent variables of microorganisms and culture medium arecalculated, updating the graphics and digital outputs according tothe time scale proposed. The model also controls the whole carbonand nitrogen mass inside and outside of the system to ensure thecarbon and nitrogen are balanced. During the simulation processesthe bacteria are called in a different random order in each timestep and the state variables changes are immediately assignedgenerating an asynchronous update. Fig. 2 shows the INDISIM-Paracoccus schematic diagram.
3.2.4. Design concepts3.2.4.1. Basic principles. The model has two kinds of behavior-rules, rules for the individuals (bacteria) and different rules for theenvironment (culture medium). The set of individuals and theenvironment is called the system (bioreactor). All of the rules areused at the level of the sub-models and they are explained in thecorresponding section. The individual rules are: (i) nutrient up-take, (ii) cellular maintenance (Table 2), (iii) cellular growth whena micro-organism executes any of the metabolic reactions adjustedby TEEM2 (Table 3), and (iv) cellular division following binaryfission. The system rules are those that mimic the general bior-eactor procedures when it works as: (i) a batch culture withconstant oxygenation, with O2 input flow, (ii) a continuous culturewith a dilution rate, with the entrance of fresh medium, andoutput of medium and bacteria, and (iii) the stirring culture, withredistribution of compounds, which permits the exclusion of localdiffusion limitations.
3.2.4.2. Emergence. The system dynamics emerge as the result ofthe interaction between bacteria and the culture medium thatthey find inside of the bioreactor. The model outputs are: thebiomass evolution, nutrient consumption, metabolic and/or deni-trification products generation, or other parameters that appear atthe system level as a consequence, and from, the individual bac-terial activity.
3.2.4.3. Adaptation. All the individuals (bacteria) are programmedwith the same rules, some of these rules will be executed andothers not, depending on the internal changes of the individualsand/or the characteristics of their local environments. Individualsact one after another, not in parallel. Hence, after one individualcarries out all of its actions the composition of the spatial cellwhere it lives changes and the next individual meets a differentmedium composition in relation to the previous acting or post-acting individuals. In particular, the metabolic pathway that itmight employ could be different. The first individual rule is how torespond to the O2 dissolved level in the culture medium: if the O2
dissolved level in the spatial cell is lower than a threshold value(O2-MIN) the bacterium uses the anaerobic metabolism and

Fig. 2. Flow chart of the INDISIM-Paracoccus model.
P. Araujo Granda et al. / Journal of Theoretical Biology 403 (2016) 45–5850
otherwise it uses the aerobic metabolism. The second individualrule is performing biomass synthesis (Table 3) to growth andmetabolic product generation. This rule is executed only when theamounts of nutrients taken in the uptake are enough to accom-plish the maintenance requirement (Table 2) and after updatedamounts also allow execution of the corresponding synthesis re-action (Table 3) in the aerobic or anaerobic phase. The third in-dividual rule is whether to divide or not, depending on whether ornot it has reached the minimum reproduction mass. The re-production mass (mR) is the mass the bacterium must reach tostart the bipartion (mR is obtained from a normal random dis-tribution with a mean value of 75% of the larger bacterium size)(Table 4).
3.2.4.4. Interaction. P. denitrificans is the only bacteria species inthe virtual bioreactor. The micro-organisms interact with theculture medium; therefore there is an indirect interaction in whichnutrient competition takes place among the bacteria that share thesame spatial cell.
3.2.4.5. Collective. The simulated bacteria do not form aggregates;each individual acts uniquely.
3.2.4.6. Stochasticity. Several processes are modeled on criteria ofrandomness: (i) the reproduction sub-model, (ii) a portion of theuptake sub-model, (iii) some parameters involved in the bior-eactor management or operating protocol, and (iv) a part of theinitial system configuration. Inside of the reproduction sub-modelwe consider that the reproduction threshold biomass for eachbacterium is determined using a value from a normal randomdistribution (Table 4). For the physical separation of the two bac-teria the original mass is separated into two new bacteria withmasses according to a value from the normal random distributionwith mean value 0.5 and standard deviation 0.075 (Table 4). Thus,the mass of the original bacterium does not divide exactly in theproportion 50–50.
Inside the uptake sub-model we consider that at each timestep, each individual nutrient uptake-rate (ui) for each nutrient isestablished from a normal random distribution with the meanvalue shown in Table 4 and a standard deviation of 5% of thisvalue. Regarding the bioreactor management: (i) the dilution rateparameter, for each input–output, is obtained by using the normalrandom distribution with mean value 0.05 h�1 and standard de-viation 0.0025, in order to represent experimental error, and (ii)each bacterium position randomly changes at some time steps inorder to represent the mixing effects from the stirred tank. For theinitial system configuration we consider that the initial culturemedium composition, the initial population biomasses and O2-MIN
threshold value are established from normal distributions withmean values determined by the experimental procedure (Table 4)and standard deviations of 5% of these values. To represent thesmall reactor with constant agitation, we introduce a redistribu-tion of nutrients and metabolic products in random time steps.When the simulation starts each bacterium has a position ran-domly assigned in the culture medium.
3.2.4.7. Observation. The graphical and numerical outputs of themodel are the concentration (mmol l�1 or umol l�1) of each culturemedium component (succinate, NH4
þ , O2, NO3� CO2, HCO3
� , NO2� ,
NO, N2O and N2), microbial biomass (mg ml�1) and the populationbiomass distribution at each time step (the user can obtain all si-mulated data in the output file with the extension “.txt”).

Table 4INDISIM-Paracoccus model parameters values.
Nutrient Culture medium initial concentra-tion [mM] according to Felgate et al.(2012)
Availability coefficient – ai –(h�1) fixed according to Dab
Uptake-rate – ui – (molnutrient �molmass�1 h�1)
Testing values Calibrated values
Low (L) Medium (M) High (H)
Succinate 5 c – 20 d 0.28 a,b,e,f 0.065 0.13 0.52 g 0.52 a,b,e,f
Ammonium 10 c,d 0.84 a,b,e,f – – 0.31 g 0.31 a,b,e,f
Oxygen 0.236 c,d 0.79 a,b,e,f – – 0.54 g 0.54 a,e,f
Nitrate-a (aerobic) 4.9983 d–21.6095 c 0.63 a,b,e,f 0.034 0.068 0.27 g 0.27 a,e,f
Nitrate-x (anaerobic) 0.019 0.119 1.19 g,h 0.119 b,e,f
Nitrite 0.0255 c–0.0112 d 0.79 a,b,e,f 0.0062 0.062 0.62 g,h 0.062 b,e – 0.62 b,f
Nitric Oxide – 1.00 a,b,e,f 0.0000062 0.00062 0.62 g,h 0.62 b,e,f
Nitrous Oxide 0.003 c–0.000028 d 0.50 a,b,e,f 0.0031 0.031 0.31 g,h 0.31 b,e,f
Other bacterial parameters
Parameter Testing range Calibrated value Reference
Cellular maintenance(gCdonor gCmic
�1 h�1)– 0.0020 a–0.0040 b Gras et al. (2011) and van Verseveld et al. (1983)
Mass split – 0.50 (15% coefficient of variation) Derived from (Ginovart et al., 2002)Small bacterium size (μm) 0.4–0.6 a,b 0.5 a,b Holt et al. (1994)Big bacterium size (μm) 0.8–1.0 a,b 0.9 a,b
Minimum bacterium size atreproduction
– 75% of big bacterium size (15% coefficientof variation)
Derived from (Gras et al., 2011) and (Ginovartet al., 2002)
Phase: (a) Aerobic, (b) Anaerobic. Experiment: (c) Succinate-limited/NO3�-sufficient, (d) Succinate-sufficient/NO3
�-limited. Hypothesis: (e) Metabolic, (f) Gibbs. The values(g) are the result of perform calculations between the maximum growth rate (μmax¼0.418 h�1, van Verseveld et al., 1983) and the stoichiometric coefficients of eachmetabolic reaction adjusted by TEEM2 (Table 3). The values (h) are the result of divide each high uptake-rate by 4 due to the maximum growth rate is achieved when the fourreactions are carried out by the bacterium.
P. Araujo Granda et al. / Journal of Theoretical Biology 403 (2016) 45–58 51
3.2.5. InitializationThe user can adjust: (i) the culture medium composition
(mmol l�1) of succinate, NH4þ , O2 and NO3
� , (ii) O2-MIN valuewhich is in the range of 0.01–0.31 mM O2, (iii) dilution rate (h�1),(iv) initial amount of viable micro-organisms (bacteria), (v) totalsimulation time (h), (vi) step time (min), (vii) time (h) for shut-down O2 input flow, and (viii) the maintenance energy require-ment for aerobic and anaerobic phases (gCdonor gCmic
�1 h�1).
3.2.6. Sub modelsThe bipartition reproduction process is a sub model that is ta-
ken from INDISIM, the generic and core bacterial model (Ginovartet al., 2002). Thus, we only describe the individual sub-modelsthat we designed particularly for the P. denitrificans.
3.2.6.1. Uptake. Each nutrient uptake depends on the individualcapacity to capture nutrients through the cell membrane-asso-ciated proteins (Button, 1998) and on the nutrient availability inthe medium (Gras et al., 2011). In our model, to determine theamount of each nutrient captured (absorbed) by each bacterium ateach time step, two values are compared, the maximum uptakecapacities (Ui, molnutrient h�1) of the bacterium and the nutrientavailable in the culture medium (Ai, molnutrient h�1), and thelowest value is chosen.
Ui is assumed to be proportional to the individual mass and tothe uptake-rate (ui) being i the nutrient, so:
= * − ( )uUi individual mass 1i
ui is a model parameter which represents the amount of nutrientthat could be absorbed per unit of time and mass, its units aremolnutrient molmass
�1 h�1, where molmass denotes the moles ofmicrobial mass (the microbial mass equals C3H5.4N0.75O1.45).
Ai is assumed to be proportional to the nutrient amount in eachspatial cell and to the availability coefficient (ai) being i the nu-trient, so:
= * − ( )aAi nutrient amount 2i
ai is a model parameter directly related to the nutrient character-istics and not to the types of micro-organisms involved, which re-presents the fraction of each nutrient in a spatial cell that is ac-cessible per unit of time and for the individual, its units are h�1.
Following the INDISIM framework (Gras et al., 2011) the max-imum population growth rate (μmax) has been used to estimate theindividual maximum uptake-rates (ui). vanVerseveld et al. (1983)reported for P. denitrificans a growth rate value equal to 0.418 h�1
which was obtained in the change from a culture growing inanaerobic nitrate-limited conditions to aerobic succinate-limitedconditions. Using this value and performing calculations with thestoichiometric coefficients of each metabolic reaction adjusted byTEEM2, we obtained the maximum uptake-rate for each nutrient(see Supplementary material for details). In order to give values tothe availability coefficient (ai), and only as a macro reference tosort and represent numerically the availabilities of the nutrients inthe culture medium, the Fick’s law binary diffusion coefficients(Dab) in water was used. Therefore we assumed in the modelingprocess that the nutrient with maximum Dab has the highestavailability; the other availability values are assigned proportion-ally (Table 4).
3.2.6.2. Maintenance. Before biomass synthesis, it is necessary thateach bacterium achieve some energetic requirements to ensure itsviability. The cellular maintenance sub-model has two maincomponents, the maintenance requirement and the energy reac-tions (Re) written with TEEM2 (Table 2). The maintenance re-quirements are proportional to individual's mass. The coefficientsdetermine an amount of nutrients per time step for cellularmaintenance. Gras et al. (2011) consider an appropriate main-tenance requirement for soil heterotrophic microorganisms of0.002 gCdonor gCmic
�1 h�1, which was assumed in the model foraerobic phase. For P. denitrificans in anaerobic phase growth andtaking succinate as electron donor and NO3
� as electron acceptor,van Verseveld et al. (1977) give a maintenance coefficient of0.004 gCdonor gCmic
�1 h�1 which was assumed for anaerobicphase. The energy reactions (Table 2) indicate the stoichiometry

P. Araujo Granda et al. / Journal of Theoretical Biology 403 (2016) 45–5852
that the nutrients follow when each bacterium executes this ac-tion or rule. Each bacterium achieves its maintenance when theamount of nutrients taken in is enough to accomplish the main-tenance requirement and these amounts also allow it to executethe corresponding energy reaction. Performing calculations withthe energy reactions (Table 2), we establish the maintenance re-quirements for aerobic and anaerobic phases (see Supplementarymaterial for details). When the individual carries out its main-tenance, the CO2 and the reduced electron acceptors are expelledto the culture medium except for the NO2
� , which is added to itscorresponding intake. In anaerobic phase the first individual op-tion is to accomplish the maintenance requirement carrying outthe energy reaction with succinate and nitrate, if the bacteriumcannot reach its maintenance requirements, it can try it withsuccinate and another electron acceptor following other reactionsaccording to the hypothesis test. After the maintenance, if theremaining succinate uptaken and the quantity of electron accep-tors are higher than zero, the individual can perform biomasssynthesis.
3.2.6.3. Biomass synthesis and metabolic products. With the nu-trient intakes updated and using the stoichiometric coefficients ofeach metabolic reaction adjusted by TEEM2, each bacterium di-vides the amount of each nutrient uptaken by its respective stoi-chiometric coefficient and selects the smallest value (the limitingnutrient). This information provides the demands of each one ofthe nutrients and drives the creation of new mass and metabolicproducts generation. After executing any metabolic reaction theCO2 produced is released to the culture medium. When the bac-terium executes the reactions of denitrification, nitrogen oxidesare produced, and they are not expelled into the culture medium;only the nitrogen gas is expelled, and the amounts of nitrogenoxides generated are added to its corresponding intakes. The ex-ecution of each metabolic reaction is limited to the existence ofsufficient quantities of electron donors and acceptors. After this, ifthere are any intakes, the microbe can perform the next metabolicreaction. When this condition is not fulfilled the syntheses finishand the remaining intakes are returned to the culture medium.
The sub models related to the bioreactor’s procedure are: (i)Agitation. To represent the agitation inside of the small experi-mental reactor, which causes homogeneity in the culture medium,nutrients and metabolic products are redistributed in various timesteps. In the culture medium the micro-organism positions changerandomly, (ii) Input flow. The bioreactor is refilled with fresh cul-ture medium (succinate, NH4
þ and NO3�) with a composition
equal to the initial one, and (iii) Output flow. A fraction of the in-dividuals and culture medium are randomly removed. The inputand output flows are performed according to the dilution rateparameter.
4. Results and discussion
INDISIM-Paracoccus was implemented in the NetLogo plat-form. It is straightforward to change parameter values, to modifythe source code of the model and to investigate alternative me-chanisms or add additional processes relevant to a particularstudy. It is hoped that this NetLogo simulator will facilitate newfruitful interactions between modelers and experts in the field ofdenitrification.
We used a variety of measures and basic techniques in order toverify that our implementation was in accordance with the con-ceptual model and its quantification. For instance, to ensure thatthe stoichiometry and the bioreactor inputs/outputs are accuratelyimplemented, one of the main tasks was to control the differencesbetween carbon and nitrogen levels, to ensure that the simulator
accomplished balances for C and N. For each time step the fol-lowing is controlled: (i) the entrance and exit of the all chemicalspecies involved, (ii) the product generations and nutrient con-sumptions from each balanced chemical equation executed, and(iii) the bacteria inside and outside of the system.
At the end of every time step, from each one of the patches, thesimulator obtains the amount of each nutrient and metabolicproduct, and for each one of the bacteria the value of its mass. Toensure that the carbon and nitrogen are balanced, the model im-plementation summarizes all of the carbon and nitrogen insideand outside of the system and compares this value with the samecalculation obtained in the previous time step. We expected thatthese two values should be the same, but there exist small dif-ferences (not higher than 0.05%). This procedure is repeated andthe simulator registers these numbers and presents them as gra-phical and numerical outputs (in Supplementary material, Fig. S1).
We also tested that the individuals were able to carry out all ofthe reactions in a variety of culture media compositions. In addi-tion, we systematically investigated internal model logic and be-haviors by collecting global and individual data through the si-mulation, which were numerically and visually tested (Fig. S1).The control of the different metabolic pathways used in each timestep and for each bacterium is programmed in the computer code,and the simulator facilitates which pathways are in use and whichnot. The main metabolic differences are present when the modelruns with different conditions from experiments (E1 or E2), cor-responding to the experimental condition of succinate limited ornitrate limited. Also, in the anaerobic conditions, it is possible tofollow (control) the number of bacteria, which do not completethe denitrification pathway or follow (control) the metabolicpathway (synthesis or maintenance) that is the most used by thebacteria. This control is a graphical output in the model’s im-plementation on NetLogo that appears in the user interface of thesimulator (Fig. S1). Such tests are essential for increasing the re-liability of the computational model, and for contributing to theunderstanding of the virtual system and the consequences of themodeling assumptions (Scheller et al., 2010).
We have carried out simulations varying the size of the system,from 25�25¼625 patches of culture medium to 100�100¼10,000 patches. The number of individuals in these simula-tions was increased as well, from 3000 (in the smallest system) toaround 50,000 individuals (in the biggest system). The model’soutputs for these sets of simulations were very similar (Figs. S2and S3). With the increase of the system sizes the time spent inthe simulations increased along with computational requirements.Taking into account these results we decided to establish a systemsize that was not too large, but was sufficient to allow us to obtainsimulation results that we could compare with the experimentaldata available. Also, we investigated the time step before fixing itin our simulations, and finally, this was established at 5 min. Wetested the model using values from 1 to 10 min (Figs. S4 and S5).This is one of the parameters that can be changed in the in-itialization of the system before starting the simulation.
During the development of the model some parameters valueswere obtained from biological constraints or references and wereused in all simulations performed (Table 4), but others were notfixed due to the uncertainty in, or complete lack of, observationaldata.
We used the uptake-rate parameters with a set of simulationseries during the categorical calibration process (Table 4). The si-mulation outputs were compared with the experimental data underthe two different scenarios corresponding to the two experimentalconditions of Felgate et al. (2012): succinate-sufficient/NO3
� limited(Experiment E1) and succinate-limited/NO3
�-sufficient (Experi-ment E2) and for each of the hypotheses considered (the metabolichypothesis and the Gibbs' hypothesis). The simulated cultures were

Fig. 3. INDISIM-Paracoccus model calibration outputs for the aerobic phase. Each color line represents the mean of three simulations obtained with different combinationsof the values for the parameters uptake-rate (ui) for succinate and nitrate in aerobic phase. The ui values are reported in Table 4 (being L¼ low, M¼medium and H¼high).Points (squares, crosses and sums) are the experimental data presented by Felgate et al. (2012). For the experiment E1, succinate-limited/NO3
�-sufficient (A and B) and forthe experiment E2, succinate-sufficient/NO3
�-limited (C and D). The aerobic phase (from 0 to 24 h) in batch culture, and the anaerobic phase (from 24 to 120 h) incontinuous culture. The metabolic hypothesis has been assumed in the simulator to generate these results. (For interpretation of the references to color in this figure legend,the reader is referred to the web version of this article.)
P. Araujo Granda et al. / Journal of Theoretical Biology 403 (2016) 45–58 53
initially grown under batch aerobic conditions (from 0 to 24 h)following the switch to continuous culture where the populationsshift to anaerobic metabolism (from 24 to 120 h). It is not possibleto perform model calibration separately for these unknown para-meters (uptake-rates) because the individual processes in whichthey are involved are highly dependent on one another.
Each curve in Figs. 3–5 represents the simulation result for onecombination of values of the parameters “uptake-rate” for thedifferent nutrients. The bacteria in our model grow and develop intwo very different conditions: the first condition occurs in aerobicphase (from 0 to 24 h) in batch culture, and the second one occursin anaerobic phase (from 24 to 120 h) in continuous culture.
The first series of simulations (Fig. 3) were carried out to ex-plore the succinate and nitrate uptakes-rates values during theaerobic phase (Table 4). In all cases, some simulation resultsshown in Figs. 3A, B and C reproduce in a better way the experi-mental trend (Felgate et al. 2012) than other simulation resultsshown in Fig. 3D, but in any case the state achieved in the aerobicphase determined the subsequent denitrification. As the two hy-potheses we tested (metabolic and Gibbs) do not play any role inthe aerobic phase, the results obtained with a different combina-tion of uptake-rates values for succinate and nitrate in the aerobicphase are a consequence of nutrient usage. When the uptake-ratefor nitrate in aerobic phase takes the value of the maximum nu-trient uptake-rate (uNitrate-a¼0.27 molnitrate-a molmass
�1 h�1, thehigh value in Table 4) (see Supplementary material for details) thefit of the model is acceptable (Fig. 6A).
With the uptake-rate value of nitrate (aerobic phase) fixed, oursecond series of simulations explored combinations of uptake-rates for succinate (uSuccinate) and nitrate in the anaerobic phase(uNitrate-x) (Figs. 4 and 5). In Fig. 4 we present the simulationresults with the experimental data corresponding to experimentE1 and in Fig. 5 to experiment E2. These results are generatedusing the metabolic hypothesis and compared with the experi-mental temporal evolutions of biomass, NO3
� , NO2� and N2O.
Therefore, we can see the model behavior during the denitrifica-tion process. Taking into account these series of simulations whenthe uptake-rate for succinate takes the value of the maximumnutrient uptake-rate (uSuccinate¼0.52 molsuccinate molmass
�1 h�1)the model accuracy is good (Figs. 6A and B).
When the electron donor (succinate) is not a limiting nutrient(experiment E1), the model results regarding the time evolutions ofnitrite and nitrous oxide shows values equal or close to zero (Figs. 4Cand D). This is due to the fact that there exist electron donor, and theelectron acceptors can be reduced. When the electron donor (suc-cinate) is limited (experiment E2) the model shows low sensitivity inthe time evolution of nitrite (Fig. 5C) and in the nitrous oxide(Fig. 5D). For both experiments (E1 and E2) and for the two hy-potheses (Gibbs hypothesis and metabolic hypothesis) the modelshows a good response and sensitivity to the time evolutions of drymass (Figs. 4A and 5A) and nitrate (Figs. 4B and 5B). This is becausenitrate is the nutrient by which the denitrification process beginswhen bacteria meet in its environment anoxic conditions.
In the bubble charts of Fig. 6, each circle radius represents the

Fig. 4. INDISIM-Paracoccus model calibration output for the experiment succinate-sufficient/NO3� limited (E1). Time evolutions of: (A) Biomass, (B) Nitrate, (C) Nitrite and
(D) Nitrous oxide. Each color line represents the mean of three simulations obtained with different combinations of the values for the parameters uptake-rate (ui) forsuccinate and nitrate in anaerobic phase. The ui values are reported in Table 4 (being L¼ low, M¼medium and H¼high). Points (squares and crosses) are the experimentaldata presented by Felgate et al. (2012). The metabolic hypothesis has been assumed in the simulator to generate these results. (For interpretation of the references to color inthis figure legend, the reader is referred to the web version of this article.)
P. Araujo Granda et al. / Journal of Theoretical Biology 403 (2016) 45–5854
percentage of the global adequacy of the model compared withthe experimental data presented by Felgate et al. (2012). By ex-amining the bubble charts corresponding to Figs. 6C, D and E, thevalue of Unitrate-x that best fits the simulation results with theexperimental points, for both experiments and hypotheses, is0.119 molnitrate-x molmass
�1 h�1. Looking at the bubble charts ofFigs. 6F, G and H, it is possible to say that the model’s sensitivity islow with the changes of the values corresponding to the uptake-rates of nitrite, nitric oxide and nitrous oxide, since the radius ofthe circles are similar to each other. Taking into account this ca-libration process, the calibrated values for all the uptake-rate nu-trients, and for both hypothesis, are presented in Table 4. None ofthe tested parameter combinations met 100% of the calibrationcriteria defined with the 14 assessment criteria, but some areconsiderably better than others. The multiple fitting criteria resultsused to explore these values and to contrast the two hypothesesare presented in bubble charts, which offer some hints as to thedelimited range of values and help to discern between the twohypotheses. In all of the cases the metabolic hypothesis shows abigger radius of the circle than the Gibbs hypothesis (Fig. 6).
In general, fitting a single response variable is straight-forward,but a global fitting for the whole system is much more demandingand challenging to achieve, and even more so if there are differentexperimental medium conditions jointly with aerobic and anae-robic metabolisms (Woolfenden et al., 2013). We prioritized thediversity of the results because we are convinced that the use ofmultiple outputs (patterns) to test models is one of the main and
most relevant features of the pattern-oriented modeling strategyused in the framework of IBMs (Grimm et al., 2005).
The GRI values for both hypotheses, for the four-temporalevolutions studied (biomass, nitrate, nitrite and nitrous oxide) andfor the two experiments (E1 and E2), are shown in Table 5. For theGibbs hypothesis the GRI values are higher than the GRI values ofthe metabolic hypothesis. It is noteworthy that the temporalevolutions of nitrite and nitrous oxide are outside of the adequateGRI range for both hypotheses and for the two experiments, whichsuggests it is necessary to include new elements in the individualrules for this denitrifying bacteria which must be relevant in thedynamic of this oxide. Further developments of this model willneed to take into account the role of the nitrous oxide in themetabolic reactions and specific experimentation could help toidentify the key factors, which control the amount of this product.
5. Conclusions
The Gibbs hypothesis seemed a plausible and attractive strat-egy at individual level because it represents the spontaneity of areaction carried out by a micro-organism, but the adequacy of themodel outputs is slightly better for the metabolic hypothesis. Inaddition, the metabolic hypothesis links better with the idea of thesequential use of the synthesis and consumption of electron do-nors, which is probably linked to individual mass degradation toreduce cytotoxic products to complete the denitrification pathway,

Fig. 5. INDISIM-Paracoccus model calibration output for the experiment succinate-limited/NO3� sufficient (E2). Time evolutions of: (A) Biomass, (B) Nitrate, (C) Nitrite and
(D) Nitrous oxide. Each color line represents the mean of three simulations obtained with different combinations of the values for the parameters uptake-rate (ui) forsuccinate and nitrate in anaerobic phase. The ui values are reported in Table 4 (being L¼ low, M¼medium and H¼high). Points (squares, crosses and sums) are theexperimental data presented by Felgate et al. (2012). The metabolic hypothesis has been assumed in the simulator to generate these results. (For interpretation of thereferences to color in this figure legend, the reader is referred to the web version of this article.)
P. Araujo Granda et al. / Journal of Theoretical Biology 403 (2016) 45–58 55
the expression of denitrifying enzymes and the consequent in-dividual activity.
If the bacterial cell prioritizes the use of those nitrogen oxideswith a higher degree of oxidation over others during the deni-trification process (metabolic hypothesis), the simulation resultsare in better agreement with the experimental data presented byFelgate et al. (2012), than when the bacterial cell goes first for themore spontaneous reaction inside the denitrification pathway(Gibbs hypothesis). The idea that the metabolic hypothesis worksbetter at the individual level than Gibbs hypothesis is supportedusing the values of the statistic GRI (Table 5) as a reference andfrom the radius of the circles in bubble charts obtained in thecalibration process (Fig. 6).
Based on our results, it appears that TEEM2, one of the ther-modynamic models based on bioenergetics growth efficiency,seems to be a useful tool for modeling the individual behavior-rules for maintenance and mass generation in the INDISIM-Para-coccus model.
INDISIM-Paracoccus is a promising tool to model P. denitrificansin batch and continuous cultures under both aerobic and anaerobicconditions. In contrast to previous modeling approaches, our modelis the first attempt to study denitrification process using the IBMapproach jointly with thermodynamic reactions for the cellularactivity. The capacity to embed thermodynamic properties into in-dividual cells, which can simulate the behavior of the bacterialpopulation more realistically and mechanistically than other
modeling approaches, makes this model very attractive for futureinvestigations. Besides, the NetLogo implementation of the modelallows the user to have control of the input parameters and initialconditions for the simulations from a very friendly interface, as wellas giving easy access to the computer code for future adaptations.
The development and application of IBMs with some in-tracellular detail and complexity constitutes the key advantage ofthis model to study and understand the different steps of deni-trification carried out by a denitrifying bacterium. Exploring modelbehavior regarding its input parameters and assessing alternativesubmodels provides a way to advance the construction of a com-plete simulator to control factors that help to understand howmajor or minor N2O generation is a consequence of this denitrifiermetabolic individual activity. In particular, it is hoped that thisNetLogo simulator will facilitate new fruitful interactions betweenmodelers and experts in the field of denitrification. For example,this denitrification model could be incorporated into INDISIM-SOM to complement the mineralization and nitrification processesalready incorporated to deal with a mixed microbial community tounderstand in silico what the consequences are of different mediaconditions and different microbial functional groups (hetero-trophs, autotrophs and denitrifies) on the N2O emissions and othernitrous oxide productions.

Fig. 6. Bubble charts to illustrate the model adequacy for different uptake-rate values (ui). The ui values come from Table 4. Each circle radius represents the global adequacyof the model versus seven experimental time evolutions for two experiments (E1 and E2) presented by Felgate et al. (2012). Continuous blue line assuming the metabolichypothesis, and dashed red line assuming Gibbs hypothesis. (For interpretation of the references to color in this figure legend, the reader is referred to the web version of thisarticle.)
P. Araujo Granda et al. / Journal of Theoretical Biology 403 (2016) 45–5856

Table 5Values of the geometric relatively index (GRI) for the temporal evolutions of biomass, nitrate, nitrite and nitrous oxide, taking into account the INDISIM-Paracoccus outputsversus experimental data presented by Felgate et al. (2012).
Hypothesis Experiment Biomass Nitrate Nitrite Nitrous oxide
Metabolic Succinate-limited/NO3�-sufficient 1.22 1.26 2.05 12.94
Succinate-sufficient/NO3�-limited 1.66 9.39 17.79 7.10
Gibbs Succinate-limited/NO3�-sufficient 1.22 1.26 11.79 11.77
Succinate-sufficient/NO3�-limited 1.64 9.40 17.87 10.37
P. Araujo Granda et al. / Journal of Theoretical Biology 403 (2016) 45–58 57
Acknowledgements
The financial support of the Ecuador National Secretary ofScience and Technology (SENESCYT) (Grant no. ConvocatoriaAbierta 2011 - No. 94-2012) and the Plan Nacional IþDþ i from theSpanish Ministerio de Educación y Ciencia (MICINN, CGL2010-20160). We would also like to thank David Richardson and AndrewGates for helpful discussions at early stages in this project and forproviding us with the full dataset presented (Felgate et al., 2012).
Appendix A. Supporting information
Supplementary data associated with this article can be found inthe online version at http://dx.doi.org/10.1016/j.jtbi.2016.05.017.
References
Baker, S.C., Ferguson, S.J., Ludwig, B., Page, M.D., Richter, O.-M.H., van Spanning, R.J.M., 1998. Molecular genetics of the genus paracoccus: metabolically versatilebacteria with bioenergetic flexibility. Microbiol. Mol. Biol. Rev. 62, 1046–1078.
Baumann, B., Snozzi, M., Zehnder, A., Van Der Meer, J., 1996. Dynamics of deni-trification activity of Paracoccus denitrificans in continuous culture duringaerobic–anaerobic changes. J. Bacteriol. 178, 4367–4374.
Beijerinck, M.W., M.D., 1910. Bildung und Verbrauch von Stickoxydul durch Bak-terien. Int. J. Med. Microbiol. 2, 30–63.
Bergaust, L., Mao, Y., Bakken, L.R., Frostegård, A., 2010. Denitrification responsepatterns during the transition to anoxic respiration and posttranscriptionaleffects of suboptimal pH on nitrous [corrected] oxide reductase in Paracoccusdenitrificans. Appl. Environ. Microbiol. 76, 6387–6396. http://dx.doi.org/10.1128/AEM.00608-10.
Bergaust, L., van Spanning, R.J.M., Frostegård, A., Bakken, L.R., 2012. Expression ofnitrous oxide reductase in Paracoccus denitrificans is regulated by oxygen andnitric oxide through FnrP and NNR. Microbiology 158, 826–834. http://dx.doi.org/10.1099/mic.0.054148-0.
Blackburn, T.H., 1990. Denitrification in Soil and Sediment. Springer, US, Boston, MAhttp://dx.doi.org/10.1007/978-1-4757-9969-9.
Bley, T., 2011. From single cells to microbial population dynamics: modelling inbiotechnology based on measurements of individual cells. Adv. Biochem. Eng.Biotechnol. 124, 211–227. http://dx.doi.org/10.1007/10_2010_79.
Button, D.K., 1998. Nutrient uptake by microorganisms according to kinetic para-meters from theory as related to cytoarchitecture. Microbiol. Mol. Biol. Rev. 62,636–645.
Caspi, R., Altman, T., Dreher, K., Fulcher, C.A., Subhraveti, P., Keseler, I.M., Kothari, A.,Krummenacker, M., Latendresse, M., Mueller, L.A., Ong, Q., Paley, S., Pujar, A.,Shearer, A.G., Travers, M., Weerasinghe, D., Zhang, P., Karp, P.D., 2012. TheMetaCyc database of metabolic pathways and enzymes and the BioCyc collec-tion of pathway/genome databases. Nucleic Acids Res. 40, D742–D753. http://dx.doi.org/10.1093/nar/gkr1014.
Christensen, D., McCarty, P., 1975. Multi-process biological treatment model. J.Water Pollut. Control Fed. 47, 2652–2664.
Davidson, E.A., Rogers, J., Whitman, W.B., 1991. Fluxes of Nitrous Oxide and NitricOxide from Terrestrial Ecosystems, pp. 219–235.
Felgate, H., Giannopoulos, G., Sullivan, M.J., Gates, A.J., Clarke, T.A., Baggs, E., Rowley,G., Richardson, D.J., 2012. The impact of copper, nitrate and carbon status on theemission of nitrous oxide by two species of bacteria with biochemically distinctdenitrification pathways. Environ. Microbiol. 14, 1788–1800. http://dx.doi.org/10.1111/j.1462-2920.2012.02789.x.
Ferrer, J., Prats, C., López, D., 2008. Individual-based modelling: an essential tool formicrobiology. J. Biol. Phys. 34, 19–37. http://dx.doi.org/10.1007/s10867-008-9082-3.
Ginovart, M., Cañadas, J.C., 2008. INDISIM-YEAST: an individual-based simulator ona website for experimenting and investigating diverse dynamics of yeast po-pulations in liquid media. J. Ind. Microbiol. Biotechnol. 35, 1359–1366. http://dx.doi.org/10.1007/s10295-008-0436-4.
Ginovart, M., López, D., Gras, A., 2005. Individual-based modelling of microbialactivity to study mineralization of C and N and nitrification process in soil.Nonlinear Anal. Real World Appl. 6, 773–795. http://dx.doi.org/10.1016/j.nonrwa.2004.12.005.
Ginovart, M., López, D., Valls, J., 2002. INDISIM, an individual-based discrete si-mulation model to study bacterial cultures. J. Theor. Biol. 214, 305–319. http://dx.doi.org/10.1006/jtbi.2001.2466.
Gras, A., Ginovart, M., Valls, J., Baveye, P.C., 2011. Individual-based modelling ofcarbon and nitrogen dynamics in soils: Parameterization and sensitivity ana-lysis of microbial components. Ecol. Modell. 222, 1998–2010. http://dx.doi.org/10.1016/j.ecolmodel.2011.03.009.
Grimm, V., 1999. Ten years of individual-based modelling in ecology: what have welearned and what could we learn in the future? Ecol. Modell. 115, 129–148.http://dx.doi.org/10.1016/S0304-3800(98)00188-4.
Grimm, V., Berger, U., DeAngelis, D.L., Polhill, J.G., Giske, J., Railsback, S.F., 2010. TheODD protocol: a review and first update. Ecol. Modell. 221, 2760–2768. http://dx.doi.org/10.1016/j.ecolmodel.2010.08.019.
Grimm, V., Revilla, E., Berger, U., Jeltsch, F., Mooij, W.M., Railsback, S.F., Thulke, H.-H., Weiner, J., Wiegand, T., DeAngelis, D.L., 2005. Pattern-oriented modeling ofagent-based complex systems: lessons from ecology. Science 310, 987–991.http://dx.doi.org/10.1126/science.1116681.
Heijnen, J.J., 1999. Bioenergetics of microbial growth. Encycl. Bioprocess Technol.Ferment. Biocatal. Biosep. . http://dx.doi.org/10.1002/0471250589
Heijnen, J.J., Van Dijken, J.P., 1992. In search of a thermodynamic description ofbiomass yields for the chemotrophic growth of microorganisms. Biotechnol.Bioeng. 39, 833–858. http://dx.doi.org/10.1002/bit.260390806.
Heinen, M., 2006. Simplified denitrification models: overview and properties.Geoderma 133, 444–463. http://dx.doi.org/10.1016/j.geoderma.2005.06.010.
Hellweger, F.L., Bucci, V., 2009. A bunch of tiny individuals—individual-basedmodeling for microbes. Ecol. Modell. 220, 8–22. http://dx.doi.org/10.1016/j.ecolmodel.2008.09.004.
Holt, J., Krieg, N., Sneath, P., Staley, J., Williams, S., 1994. International Edition:Bergey’s Manual of Determinative Bacteriology.
Jachner, S., van den Boogaart, K.G., Petzoldt, T., 2007. Statistical methods for thequalitative assessment of dynamic models with time delay (R Package qualV). J.Stat. Softw. 22, 1–30.
Kampschreur, M.J., Kleerebezem, R., Picioreanu, C., Bakken, L., Bergaust, L., de Vries,S., Jetten, M.S.M., van Loosdrecht, M.C.M., 2012. Metabolic modeling of deni-trification in Agrobacterium tumefaciens: a tool to study inhibiting and acti-vating compounds for the denitrification pathway. Front. Microbiol. 3, 370.http://dx.doi.org/10.3389/fmicb.2012.00370.
Kreft, J.-U., Plugge, C.M., Grimm, V., Prats, C., Leveau, J.H.J., Banitz, T., Baines, S.,Clark, J., Ros, A., Klapper, I., Topping, C.J., Field, A.J., Schuler, A., Litchman, E.,Hellweger, F.L., 2013. Mighty small: observing and modeling individual mi-crobes becomes big science. Proc. Natl. Acad. Sci. USA 110, 18027–18028. http://dx.doi.org/10.1073/pnas.1317472110.
Lee, M.W., Vassiliadis, V.S., Park, J.M., 2009. Individual-based and stochastic mod-eling of cell population dynamics considering substrate dependency. Bio-technol. Bioeng. 103, 891–899. http://dx.doi.org/10.1002/bit.22327.
Leggett, R.W., Williams, L.R., 1981. A reliability index for models. Ecol. Modell. 13,303–312. http://dx.doi.org/10.1016/0304-3800(81)90034-X.
Liu, J.-S., Vojinović, V., Patiño, R., Maskow, T., von Stockar, U., 2007. A comparison ofvarious Gibbs energy dissipation correlations for predicting microbial growthyields. Thermochim. Acta 458, 38–46. http://dx.doi.org/10.1016/j.tca.2007.01.016.
Mantzaris, N.V., 2007. From single-cell genetic architecture to cell population dy-namics: quantitatively decomposing the effects of different population het-erogeneity sources for a genetic network with positive feedback architecture.Biophys. J. 92, 4271–4288. http://dx.doi.org/10.1529/biophysj.106.100271.
Maskow, T., von Stockar, U., 2005. How reliable are thermodynamic feasibilitystatements of biochemical pathways? Biotechnol. Bioeng. 92, 223–230. http://dx.doi.org/10.1002/bit.20572.
McCarty, P., 1971. Energetics and bacterial growth. Org. Compd. Aquat. Environ 1,157–172.
McCarty, P.L., 2007. Thermodynamic electron equivalents model for bacterial yieldprediction: modifications and comparative evaluations. Biotechnol. Bioeng. 97,377–388. http://dx.doi.org/10.1002/bit.
Portell, X., Gras, A., Ginovart, M., 2014. INDISIM-Saccha, an individual-based modelto tackle Saccharomyces cerevisiae fermentations. Ecol. Modell. 279, 12–23. http://dx.doi.org/10.1016/j.ecolmodel.2014.02.007.
Prats, C., Ferrer, J., Gras, A., Ginovart, M., 2010. Individual-based modelling and si-mulation of microbial processes: yeast fermentation and multi-species com-posting. Math. Comput. Model Dyn. Syst. 16, 489–510. http://dx.doi.org/

P. Araujo Granda et al. / Journal of Theoretical Biology 403 (2016) 45–5858
10.1080/13873954.2010.481809.Prats, C., Giró, A., Ferrer, J., López, D., Vives-Rego, J., 2008. Analysis and IbM simu-
lation of the stages in bacterial lag phase: basis for an updated definition. J.Theor. Biol. 252, 56–68. http://dx.doi.org/10.1016/j.jtbi.2008.01.019.
Railsback, S.F., Grimm, V., 2012. Agent-Based and Individual-Based Modeling: APractical Introduction. Princeton University Press.
Resat, H., Bailey, V., McCue, L.A., Konopka, A., 2012. Modeling microbial dynamics inheterogeneous environments: growth on soil carbon sources. Microb. Ecol. 63,883–897. http://dx.doi.org/10.1007/s00248-011-9965-x.
Richardson, D., Felgate, H., Watmough, N., Thomson, A., Baggs, E., 2009. Mitigatingrelease of the potent greenhouse gas N(2)O from the nitrogen cycle - couldenzymic regulation hold the key? Trends Biotechnol. 27, 388–397. http://dx.doi.org/10.1016/j.tibtech.2009.03.009.
Rittmann, B.E., McCarty, P.L., 2001. Environmental Biotechnology: principles andapplications. Biotechnology.
Scheller, R.M., Sturtevant, B.R., Gustafson, E.J., Ward, B.C., Mladenoff, D.J., 2010.Increasing the reliability of ecological models using modern software en-gineering techniques. Front. Ecol. Environ. 8, 253–260. http://dx.doi.org/10.1890/080141.
Snyder, C.S., Bruulsema, T.W., Jensen, T.L., Fixen, P.E., 2009. Review of greenhousegas emissions from crop production systems and fertilizer management effects.Agric. Ecosyst. Environ. 133, 247–266. http://dx.doi.org/10.1016/j.agee.2009.04.021.
Thiele, J.C., Kurth, W., Grimm, V., 2014. Facilitating parameter estimation and sen-sitivity analysis of agent-based models: a cookbook using NetLogo and “R.”. J.Artif. Soc. Soc. Simul. 17, 11.
Tijhuis, L., Van Loosdrecht, M.C., Heijnen, J.J., 1993. A thermodynamically basedcorrelation for maintenance gibbs energy requirements in aerobic and anae-robic chemotrophic growth. Biotechnol. Bioeng. 42, 509–519. http://dx.doi.org/10.1002/bit.260420415.
van Verseveld, H.W., Boon, J.P., Stouthamer, A.H., 1979. Growth yields and the
efficiency of oxidative phosphorylation of Paracoccus denitrificans during two-(carbon) substrate-limited growth. Arch. Microbiol. 121, 213–223. http://dx.doi.org/10.1007/BF00425058.
van Verseveld, H.W., Braster, M., Boogerd, F.C., Chance, B., Stouthamer, A.H., 1983.Energetic aspects of growth of Paracoccus denitrificans: oxygen-limitation andshift from anaerobic nitrate-limination to aerobic succinate-limitation. Arch.Microbiol. 135, 229–236. http://dx.doi.org/10.1007/BF00414485.
van Verseveld, H.W., Meijer, E.M., Stouthamer, A.H., 1977. Energy conservationduring nitrate respiration in Paracoccus denitrificans. Arch. Microbiol. 112,17–23. http://dx.doi.org/10.1007/BF00446649.
VanBriesen, J.M., 2002. Evaluation of methods to predict bacterialyield usingthermodynamics. Biodegradation 13, 171–190. http://dx.doi.org/10.1023/A:1020887214879.
von Stockar, U., van der Wielen, L.A.M., 1997. Thermodynamics in biochemicalengineering. J. Biotechnol. 59, 25–37. http://dx.doi.org/10.1016/S0168-1656(97)00167-3.
Wilensky, U., 1999. NetLogo [WWW Document]. Center for Connected LearningComputer-based Modeling Northwest University Evanston, IL. (URL) ⟨http://ccl.northwestern.edu/netlogo/⟩ (accessed 03.05.14).
Woolfenden, H.C., Gates, A.J., Bocking, C., Blyth, M.G., Richardson, D.J., Moulton, V.,2013. Modeling the effect of copper availability on bacterial denitrification.Microbiologyopen 2, 756–765. http://dx.doi.org/10.1002/mbo3.111.
Xiao, J., VanBriesen, J.M., 2008. Expanded thermodynamic true yield predictionmodel: adjustments and limitations. Biodegradation 19, 99–127. http://dx.doi.org/10.1007/s10532-007-9119-5.
Xiao, J., VanBriesen, J.M., 2006. Expanded thermodynamic model for microbial trueyield prediction. Biotechnol. Bioeng. 93, 110–121. http://dx.doi.org/10.1002/bit.20700.
Zumft, W., 1997. Cell biology and molecular basis of denitrification. Microbiol. Mol.Biol. Rev. 61, 533–616.