journal of the association for research in otolaryngology · 2018-07-07 · simple mastoidectomy...
TRANSCRIPT

Complex Stapes Motions in Human Ears
JAE HOON SIM,1 MICHAIL CHATZIMICHALIS,1 MICHAEL LAUXMANN,2 CHRISTOF RÖÖSLI,1 ALBRECHT EIBER,2
AND ALEXANDER M. HUBER1
1University Hospital Zurich, Zurich, Switzerland2University of Stuttgart, Stuttgart, Germany
Received: 28 November 2008; Accepted: 10 January 2010; Online publication: 18 February 2010
ABSTRACT
It has been reported that the physiological motion ofthe stapes in human and several animals in responseto acoustic stimulation is mainly piston-like at lowfrequencies. At higher frequencies, the patternincludes rocking motions around the long and shortaxes of the footplate in human and animal ears.Measurements of such extended stapes motions arehighly sensitive to the exact angulation of the stapesin relation to the measurement devices and tomeasurement errors. In this study, velocity in aspecific direction was measured at multiple points onthe footplates of human temporal bones using aScanning Laser Doppler Vibrometer (SLDV) system,and the elementary components of the stapesmotions, which were the piston-like motion and therocking motions about the short and long axes of thefootplate, were calculated from the measurements.The angular position of a laser beam with respect tothe stapes and coordinates of the measurement pointson the footplate plane were calculated by correlationbetween the SLDV measurement frame and thefootplate-fixed frame, which was obtained frommicro-CT images. The ratios of the rocking motionsrelative to the piston-like motion increased withfrequency and reached a maximum around 7 kHz.
A novel method for quantitatively assessing mea-surements of complex stapes motions and errorboundaries of the motion components is presented.In the frequency range of 0.5 to 8 kHz, themagnitudes of the piston-like and two rockingmotions were larger than estimated values of thecorresponding upper error bounds.
Keywords: stapes, piston-like motion, rockingmotion, Laser Doppler Vibrometer (LDV), micro-CT
INTRODUCTION
Békésy (1960) and Kirikae (1960) described motions ofthe stapes footplate in human ears as a combination oftranslational motions along the longitudinal axis of thestapes (piston-like motions) and rotational motions(rockingmotions). It has been reported that the humanstapes motions are piston-like at low frequencies andinclude rocking motions along the long and short axesof the footplate at high frequencies (Heiland et al. 1999;Huber et al. 2001; Hato et al. 2003). Studies of rockingmotions have been extended to other animals such ascat (Decraemer et al. 2000) and gerbil (Decraemer et al.2007; Ravicz et al. 2008). Most of the current humancochlear models do not represent the effects of therocking motions because these motions are believed toproduce no net volume displacement on the ovalwindow and have negligible effects on hearing mecha-nisms (Kolston and Ashmore 1996; Dodson 2001; Limand Steele 2002). On the measurement side, a previousstudy by de la Rochefoucauld et al. (2008) reported thatmotion components other than the piston-like motiondid not produce scala-vestibuli pressure in gerbil ears.However, a recent study by Huber et al. (2008) showedthat enhancement of the rocking motions of the stapesby mechanical stimulation affected the cochlearresponse in guinea pigs, as demonstrated by changesin compound action potentials (CAP). It is anticipatedthat there will be further investigation of the relationbetween the rocking motions and fluid-flux inside thecochlea, and methods to measure stapes motions,
Correspondence to: Jae Hoon Sim & University Hospital Zurich & Zurich,Switzerland. email: [email protected]
JARO 11: 329–341 (2010)DOI: 10.1007/s10162-010-0207-6D 2010 Association for Research in Otolaryngology
329
JAROJournal of the Association for Research in Otolaryngology

particularly the rockingmotions, need to be systemicallystudied.
Laser Doppler Vibrometer (LDV) systems havebeen widely used to measure stapes motions, andseveral methods to measure all or a subset of the 3-Dmotion components of the stapes have been devel-oped using the LDV system. Hato et al. (2003)measured velocities at five points on the footplateand calculated the piston-like and two rockingmotions of the stapes. Eiber et al. (2007) alsocalculated the piston-like and two rocking motionsfrom 3-D velocity components at a point on the stapeshead measured using a 3-D LDV system. In theirmeasurements and resulting calculations, the positionand direction of the stapes in the measurement framewere estimated, and location of the measurementpoints on the stapes and the relative angular positionof the laser beam with respect to the stapes wereobtained based on the estimation. Inaccuracy in suchestimations can cause significant errors in the calcu-lated motion components, especially on small-sizedstapes such as that of guinea pigs. In a study byDecraemer et al. (2007), 3-D components of motionsat multiple points on the stapes were measured bychanging the angular position of the laser beam usinggoniometers, and six rigid body motion componentsof the stapes in gerbil ears were calculated. In thatstudy, coordinates of the observation points were readfrom the xyz-positioning system. A computed tomog-raphy (CT) model of the stapes was registered in theposition of the stapes during the experiment usingthese coordinates to fully describe the experimentalgeometry. However, complicated setups with thegoniometers were required for this accurate assess-ment of the angular position of the laser beam withrespect to the stapes.
In our study, velocities at multiple points on thestapes footplate were measured using SLDV. The piston-like and two rocking motions of the stapes werecalculated as a response to physiological sound stimulifor six human ears. An accurate way to relate the SLDVmeasurement frame to the footplate-fixed frame andthus determine coordinates of measurement points andthe laser beam direction in the footplate-fixed frame wasintroduced using micro-CT technology.
Detailed investigation of the quantitative assess-ment of the effects of measurement errors on therigid body motion components of the stapes wasanother goal of this study. In the work by Hato et al.(2003), reverse calculation of velocities at the mea-surement points from identified rigid body motioncomponents was used to verify consistency of mea-surement and calculation of the overall stapesmotions. However, if contribution of a specific rigidbody motion component to the entire stapes motionis relatively small, then good agreement between the
original measurement and the reverse calculationdoes not guarantee accuracy of the rigid body motioncomponent. In this study, the error boundaries of themotion components were examined and comparedwith the components of the stapes motions obtainedfrom the measurements.
MATERIAL AND METHODS
Specimen preparation
Six temporal bones (TBs) from the right side ofhuman cadavers (an average age of approximately60 years) were used in this study. The human TBswere harvested within 24 h after death and wereplaced in 0.1% Cialit (sodium-2-ethylmercurimer-capto-benzoxazol-5-carbonide) solution, at 4°C. TheTBs were inspected using an operating microscope forpossible abnormalities. All experiments were performedwithin 7 days of the explantation. After removal of allconnective tissues and muscles, the external ear canalwas drilled down to 2 mm from the tympanic annulus. Asimple mastoidectomy with posterior tympanotomy,which included removal of the mastoid and a part ofthe tympanic segment of the facial nerve and surround-ing bone, was performed in order to obtain a clear andnear-perpendicular view of the stapes footplate. Thetympanic membrane (TM), ossicles, stapedius muscle,and tendon were left intact. All temporal bones wereperiodically moistened with physiological saline solu-tion to prevent drying during preparation.
Velocity measurement
The loudspeaker (ER-2, Etymotic Research, USA) andthe microphone probe (ER-7C, Etymotic Research,USA) were placed in an artificial external ear canal nearthe TM. The artificial external ear canal (AEEC) wasattached and sealed acoustically using silicone and bonywax to the bony rim of the former external ear canal,creating an acoustic chamber of about 0.5 ml volume.The distance between the microphone probe and theTM center was maintained at approximately 3 mm.
A multi-frequency sound consisting of harmonicsound waves with 32 different frequencies in therange of 0.5 to 8 kHz was generated by a functiongenerator (HP 33120A, Hewlett Packard, USA) anddelivered via the loudspeaker. The frequency steps inthe multi-frequency sound were 100 Hz from 0.5 to2 kHz, 200 Hz from 2 to 3 kHz, 300 or 400 Hz from 3to 4 kHz, and 500 Hz from 4 to 8 kHz. The soundpressure level (SPL) in the ear canal was measured bythe microphone probe in front of the TM, andamplitude of stimulation at each frequency wasadjusted by HLV 1.01 software (Polytec GmbH,Germany), such that the SPL had a flat spectrum
330 SIM ET AL.: Complex Stapes Motions in Human Ears

within 5 dB along the measured frequency range. Thefinal SPL with adjusted amplitudes was in the range of94 to 105 dB. The magnitude and phase of thevelocities at multiple points (150 to 200 points) on thefootplate were measured using an OFV-3001 SLDVsystem (Polytec GmbH, Germany), and the X and Ycoordinates of the measurement points in the SLDVmeasurement frame were recorded by PSV V8.5software (Polytec GmbH, Germany). A samplingfrequency of 25.6 kHz was chosen to prevent aliasing,and the frequency resolution was set at 12.5 Hz.
Frame registration
The XYZ coordinate system of the SLDV measurementframe was set such that the laser beam was along the Zdirection and the XYplane was normal to the laser beam,while the xyz coordinate system of the footplate-fixedframe was determined such that the xy plane was best fitto the lateral-side surface of the footplate (the surface towhich the stapes crura are attached), and the origin wason the centroid of the surface. The 3-D feature of thestapes obtained from micro-CT images was used forcalculation of the footplate-fixed frame. In the footplate-fixed frame, the long axis of the footplate was set as the xaxis, the short axis of the footplate as the y axis, and thedirection normal to the xy plane as the z axis. Theposterior, inferior, and lateral directions were set aspositive directions for the x, y, and z axes for the right ear.
Because an inaccurate estimation of position anddirection of the footplate in the SLDV measurementframe may produce significant errors in calculation ofthe rigid body motion components, an accurate wayof obtaining the relation between the SLDV mea-surement frame and the footplate-fixed frame wasdeveloped using micro-CT technology. Five to sevenretro-reflective glass beads of 50-micron diameter
were placed on the footplate and/or the anteriorcrus of the stapes. The beads were attached beforevelocity measurements and were held in position bycapillary adhesion during the measurements. Afterthe velocity measurements, while maintaining theSLDV measurement frame, the laser beam waspositioned on the beads and the X and Y coordinatesof the beads in the SLDV measurement frame wererecorded by the PSV V8.5 software. Next, the stapeswith glass beads in position was carefully removedfrom the TBs, and the glass beads were glued onto thestapes. To avoid any displacement of the beads due tothe manipulation, a gel-type glue was used, and it wasapplied from the direction perpendicular to the bonysurfaces where the beads were placed. The stapes withglass beads attached was scanned by the micro-CTscanner with a 12-micron resolution to determinetheir coordinates in the footplate-fixed frame.
Figure 1 illustrates the 3-D shapes of the stapes andmicro-glass beads reconstructed from the micro-CTimages. The micro-glass beads were clearly visible anddistinguishable from bones in the micro-CT imagesbecause they were retro-reflective and had muchlarger x-ray attenuation than the bones. When thegray-scale level on the image was linearly scaled suchthat the maximum attenuation and no attenuationcorresponded to values of 1,000 and 0, the gray-scalevalues of the bones were below 500 and the values ofthe beads were above 980. With coordinate values ofthe glass beads in the SLDV measurement frame andfootplate-fixed frame, the relation between these twoframes is given by the following equation (Sim 2007).
Xb
Yb
Zb
8<:
9=; ¼ Q
xb � xshiftyb � yshiftzb � zshift
8<:
9=;; ð1Þ
where
Q ¼cos f cos � sin f cos � � sin �
cos f sin � sin’� sin f cos’ sin f sin � sin’þ cos f cos’ cos � sin’cos f sin � cos’þ sin f sin’ sin f sin � cos’� cos f sin’ cos � cos’
24
35:
Xb, Yb, and Zb are coordinates of the glass beads in theSLDV measurement frame, while xb, yb, and zb are thecorresponding coordinates in the footplate-fixed frame.xshift, yshift, and zshift indicate the offsets of the originsbetween the two frames. Three Eulerian angles of φ, θ,and f, which were rotation angles of the footplate-fixedframe with respect to z, y, and x axes in sequence (Type I,Greenwood 1988), and the offsets xshift, yshift, and zshift werecalculated by correlation of the coordinate values of theglass beads in both frames. To get three Eulerian anglesfrom five or seven reference points, the Levenberg-
Marquardt method, a nonlinear least-square errormethod provided in Matlab (The MathWorks Inc.), wasused. Because the Z coordinate values of the glass beads(Zb) cannot be detected from the SLDV System, Eq. (1)has two setsof theEulerianangles asa solution.Toavoidanunexpected solution set and “local minimum” in the non-linear least-square error method, approximate adjustingwasperformedmanuallybefore thenumerical calculation.
With the obtained relation between the SLDVmeasurement frame and the footplate-fixed frame,coordinates Xm and Ym of a measurement point m in
SIM ET AL.: Complex Stapes Motions in Human Ears 331

the SLDV measurement frame, which were recordedduring the velocity measurement by the PSV V8.5software, were converted into the correspondingcoordinates xm, ym, and zm in the footplate-fixed frame.
xmymzm
8<:
9=; ¼ Q�1
Xm
Ym
Zm
8<:
9=;þ
xshiftyshiftzshift
8<:
9=; ð2Þ
Because the Z coordinate value Zm of the measure-ment point could not be measured, Eq. (2) was solvedassuming the measurement points were on the xyplane (zm=0) of the footplate-fixed frame. Figure 2illustrates the stapes registered in the footplate-fixedframe and measurement points (black dots on thefigure) aligned on the xy plane. With the micro size ofthe glass beads, the relation between the measure-ment frame and the footplate-fixed frame could beprecisely obtained.
Calculation of the elementary componentsin the stapes motion
Rigid body motions of the stapes can be describedwith three translational components and three rota-tional components about a reference point in a givenreference frame. If the annular ring restricts in-planemotions of the stapes footplate considerably, thenonly three substantial motions of the footplateremain: one translational component in the z direc-tion at the footplate center and two rotationalcomponents about the long and short axes of thefootplate (Fig. 3). The translational motion of thefootplate center in the z direction is usually called apiston-like motion, and the two rotational motions arecalled rocking motions.
In previous studies (Békésy 1960; Kirikae 1960;Heiland et al. 1999; Hato et al. 2003), it has beenassumed that due to the shape of the annularligament and the mechanical stress and strain distri-bution in it, the in-plane motions of the footplate,which resulted from translational displacements inthe x and y directions and rotations around the z axis,are much smaller by magnitudes than the piston-likeand rocking motions. Though the restriction of the in-plane motion of the footplate has not been provedand there still exists the possibility that the magnitudeof the other components are comparable to thepiston-like and rocking motions, it is assumed in thisstudy that the piston-like and two rocking motions arethe elementary components of the stapes motions.
Denoting the rotational velocity along the x axis asωx, the rotational velocity along the y axis as ωy, andthe translational velocity of the footplate center (theorigin of the footplate-fixed frame) along the z axis asvoz, these rigid body motion components are relatedto the velocity component vmz of the measuredvelocity at a point m on the footplate plane (zm=0)as follows:
vmz ¼ voz þ wxym � wyxm : ð3ÞThe velocity at the point has only a z-component
because in-plane motions along the footplate planeare assumed to be negligible (ωz=vmx=vmy=0). With
FIG. 1. 3-D feature of the stapes with micro-glass beads recon-structed from micro-CT images. After velocity measurements, theglass beads were glued to avoid any displacement during the micro-CT scanning.
FIG. 2. The stapes of a human ear and measurement points alignedin the footplate-fixed frame. Coordinates of the measurement pointsin the footplate-fixed frame were calculated by correlation betweenthe SLDV measurement frame XYZ and footplate-fixed frame xyz,which was obtained from coordinates of the glass beads in bothframes. All measurement points were assumed to be on the xy planeof the footplate-fixed frame.
332 SIM ET AL.: Complex Stapes Motions in Human Ears

an angle θL between the laser beam direction and thez axis (shown in Fig. 2), the relation betweenmeasured velocities and rigid body motion compo-nents of the stapes can be expressed as
vm ¼ cos �LAvr ð4Þwhere vm is a vector with measured velocities, A is thematrix determined from x and y coordinates of the nmeasurement points on the footplate, and vr is avector with rigid body motion components
vm ¼v1v2...
vn
26664
37775 ¼ e iwt
v1j je i’1
v2j je i’2
..
.
vnj je i’3
26664
37775;
A ¼1 y1 �x11 y2 �x2... ..
. ...
1 yn �xn
26664
37775;
vr ¼vozwx
wy
24
35 ¼ e iwt
vozj je i’oz
wxj je i’x
wy�� ��e i’y
24
35:
Where ω is an angular frequency, ’m is the phase ofthe velocity of the measured vm, and ’oz , ’x , and ’z
indicate the phases of the rigid body motion compo-nents voz, ωx, and ωy. Taking more than three non-colinear measurement points into account, themethod of least squares error is used to express vr bythe following relationship
vr ¼ 1cos �L
ATA� ��1
ATvm� �
: ð5Þ
In the calculation with Eq. (5), the velocities weretaken as complex numbers from their magnitude andphase data.
The phases were recorded for both ear canalpressure and velocities of the points on the footplate,and the phase φm of the measured velocity vm wasobtained as the relative phases with respect to thephase φEC of ear canal pressure PEC. Consequently, thephases φoz, φx, and φz of the stapes motion compo-nents voz, ωx, and ωy were also calculated with respectto the phase of the ear-canal pressure. The phases ofthe rotational velocity components were taken in thepositive x (posterior), y (inferior), and z (lateral)directions. The distance between the microphone and
FIG. 3. Rigid body motion components of the stapes. A Transla-tional motion voz of the footplate center (piston-like motion), Brotational motion ωx around the long axis of the footplate (rockingaround the long axis of the footplate), and C rotational motion ωy
around the short axis of the footplate (rocking around the short axisof the footplate).
R
SIM ET AL.: Complex Stapes Motions in Human Ears 333

the TM was much smaller than the wavelengths of thesound waves at the measurement frequencies; there-fore, the effects of the phase delay in the ear canal onthe measurement data were negligible.
Error analysis
The maximum possible error (MPE) in each rigidbody motion component was introduced as anestimation of the maximum possible error of themotion component (Eqs. (A.19–A.21)), and the errorratio (ER) was obtained as a ratio of the MPE to themagnitude of the corresponding rigid body motioncomponent (Eqs. (A.22–A.24)).
In calculation of the MPE, the actual measurementerror at a measurement point could not be measured,and a measurement error measure, as defined inEq. (A.18) was used. This measurement error mea-sure at a measurement point was calculated from thedifference between the measured velocity and therecalculated velocity, which was reversely calculatedfrom the rigid body motion components. In calculat-ing the difference, the complex numbers of the twovelocities were taken to consider both magnitude andphase. The difference was also weighted by a factorthat described the contribution of the measuredvelocity to calculation of the rigid body motioncomponents. Definitions and details of the mathemat-ical formulations may be found in the “Appendix.”
RESULTS
Motions of the stapes
Figure 4 illustrates the piston-like and rockingmotions calculated from two separate measurementsin a temporal bone. The magnitudes of the motioncomponents were normalized by the magnitude |PEC|of the ear canal pressure, and the phases of themotion components were calculated for the positive x,y, and z axes relative to the phases φEC of the ear canalpressure, as described in the “Calculation of theelementary components in the stapes motions.” Theblack lines represent the first measurement, whilethe gray lines represent the second measurements inthe temporal bone. In both magnitude (A) and phase(B), the two measurements showed very good (voz, ωy)and good (ωx) repeatability.
Figure 5 illustrates translational velocities voz in thez direction at the center of the footplate normalizedby the ear canal pressure as well as their mean valuesin comparison with the data of Asai et al. (1997) andHato et al. (2003).
The magnitude of this normalized piston-like motionshowed amplitudes between the results from Asai et al.(1997) and Hato et al. (2003) below 2.5 kHz and were
similar to Asai et al. (1997) above 2.5 kHz. The averagedmagnitude had its peak around 1.0 kHz, and theminimum values were around 6.5 kHz. Variation of thephase of the translational motion in the consideredfrequency range was less than 2 cycles. The six bonemeasurements showed considerable individual differ-ences in magnitude.
Figure 6 illustrates rotational velocities ωx along thelong axis (x axis) of the footplate normalized by theear canal pressure (A: magnitude and B: phase).
The averaged magnitude had its peak around1.0 kHz and the minimum values were around6.0 kHz. At low frequencies around 500 Hz, the phaseof the rotational velocity component in the positive xdirection showed about a half-cycle difference fromthe phase of the translational velocity component inthe positive z direction at the footplate center
FIG. 4. Comparison of the two measurements in a temporal bone.A Magnitudes |voz|, |ωx|, and |ωy| and B phases ϕoz, ϕx, and ϕy ofthe piston-like and rocking motion components calculated from thetwo separate measurements (black: first measurement, gray: secondmeasurement) in a temporal bone. The magnitudes were normalizedby the magnitude |PEC| of ear canal pressure, and the phases werecalculated relative to the phase ϕEC of the ear canal pressure, for thepositive x (posterior), y (inferior), and y (lateral) directions.
334 SIM ET AL.: Complex Stapes Motions in Human Ears

(Fig. 6B). The phase of the rotational velocitycomponent in the positive x direction decreased withfrequency, showing less than a 2-cycle variationbetween 0.5 and 8 kHz.
Figure 7 illustrates the rotational velocities ωy alongthe short axis of the footplate (y axis), also normalizedby the ear-canal pressure (A: magnitude and B: phase).
This component also showed considerable individualdifferences, especially above 2 kHz. In comparison withthe individual data, the magnitude of the rotationalvelocity along the short axis was not proportional to themagnitude of the rotational velocity along the long axis,and a relation between the twomagnitudes could not befound. Around 0.5 kHz, the rotational velocity compo-nent in the positive y direction was almost in-phase withthe translational velocity component in the positive zdirection at the footplate center. The phase delay of therotational velocity along the short axis also tended toincrease with frequency. The variation of the phasebetween 0.5 and 8 kHz was around 1 cycle for the four
measurements and more than 1.5 cycles for the othertwo measurements.
Comparison of the magnitude of the rotationalvelocities with the magnitude of the translationalvelocity at the footplate center cannot be directlydone. To show the effect of the rotation, the linearvelocities at the inferior and posterior edges of thefootplate generated by the rotational velocities werecalculated (Heiland et al. 1999; Hato et al. 2003). Inthis article, the edge velocities are defined as thevelocities at the edges only due to the rotationalvelocities ωx and ωy. The rotational velocity compo-nent ωx was multiplied by the half length of thefootplate short axis (about 0.6 mm) for the inferior-edge velocity vinf, and the rotational velocity compo-nent ωy was multiplied by the half length of thefootplate long axis (about 1.5 mm) for the posterior-edge velocity vpos. Figure 8 illustrates relative magni-tudes (A: inferior-edge velocity and C: posterior-edgevelocity) and phases (B: Inferior-edge velocity and D:Posterior-edge velocity) of the edge velocities withrespect to the footplate-center velocity in the z
FIG. 5. Translational velocity (piston-like motion) voz in the zdirection at the footplate center (piston-like motion) normalized bythe ear-canal pressure PEC in comparison to data from Asai et al.(1997, dotted) and Hato et al. (2003, dashed). A Magnitude |voz| andB phase ϕoz. The phases were taken from the translational velocitycomponents in the negative z direction (medial direction).
FIG. 6. Rotational velocity (rocking motion) ωx around the long axisnormalized by the ear-canal pressure. A Magnitude |ωx| and B phaseϕx. The phases were taken from the rotational velocity componentsin the positive x direction (posterior direction).
SIM ET AL.: Complex Stapes Motions in Human Ears 335

direction. The relative phases of the edge velocitieswere calculated by subtracting the phase of thefootplate-center velocity in the positive z directionfrom the phases of the edge velocities.
The mean ratio of the inferior-edge velocity to thefootplate-center velocity began at approximately −14 dBat 0.5 kHz, and reached the maximum of −7 dB around7.5 kHz. The mean ratio reported by Hato et al. (2003)had the maximum of about 5.5 dB around 5.5 kHz. Incontrast, our values for this ratio were larger below2 kHz and smaller above 2 kHz than the values by Hatoet al. The relative phases of the inferior-edge velocitieswere about −0.5 cycle up to 2 kHz in the averaged valueand showed large individual differences above 2 kHz.This means that the rotational motion along thenegative x axis (anterior direction) is in-phase with thepiston-like motion in the positive z direction (lateraldirection) at low frequencies.
The mean ratio of the posterior-edge velocity to thefootplate-center velocity tended to increase with fre-quency, and reached the maximum of 7 dB around7 kHz. Our values for this ratio were larger than the
corresponding values reported byHato et al. (2003) andHeiland et al. (1999) below 4 kHz. The relative phase ofthe posterior-edge velocity was around zero (That is, therotational motion along the inferior direction was in-phase with the piston-like motion in the lateral direc-tion) below 1.5 kHz. Above 1.5 kHz, the relative phase ofthe posterior-edge velocity tended to increase withfrequency for the four measurements, while the relativephase did not increase with frequency for the other twomeasurements.
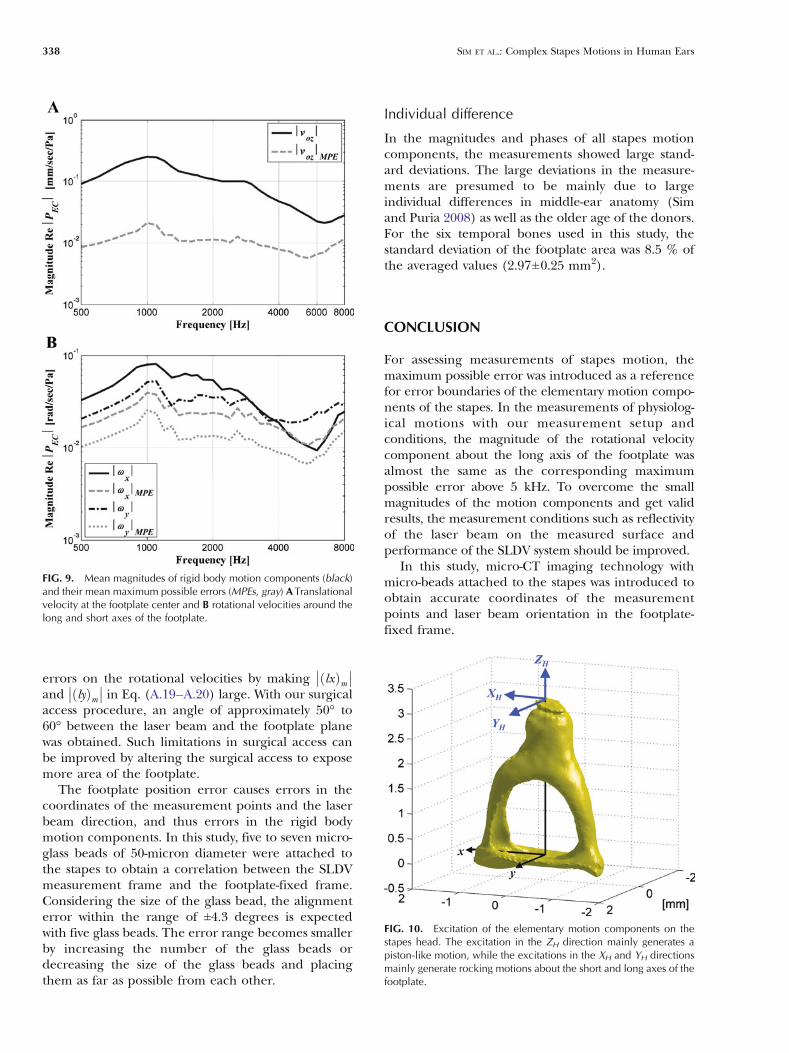
Maximum possible error of stapes motioncomponents
Figure 9 illustrates the mean magnitudes of the rigidbody motion components normalized by the ear-canalpressure |voz|, |ωx|, and |ωy| and the correspondingMPE |voz|MPE, |ωx|MPE, and |ωy|MPE.
The mean magnitude of the translational velocityat the footplate center normalized to the ear canalsound pressure was much larger than the correspond-ing maximum possible error across frequency(Fig. 9A). The mean magnitude of the rotationalvelocity component about the long axis (solid inFig. 9B) was above the corresponding MPE (dashedin Fig. 9B) up to 5 kHz. The mean magnitude of therotational velocity component along the short axis(dot-dashed in Fig. 9B) was above the correspondingMPE through the whole measurement frequencyrange (dotted in Fig. 9B).
DISCUSSION
Rocking motions
In our measurements, there existed rocking motionscomparable to the piston-like motion in the frequencyrange of measurement (Fig. 8). Such rocking motionsare presumed to be caused by the stimuli parallel to thefootplate, on the stapes head (excitations in the XH andYH in Figure 10, Eiber et al. 2007; Huber et al. 2008).
The excitation in the ZH direction mainly generatesa piston-like motion, while the excitations in the XH
and YH directions mainly generate rocking motionsabout the short and long axes of the footplate.Considering the middle-ear anatomy of the human,stimuli for the rocking motions are expected. Theanterior part and posterior parts of the TM in humanears, which are divided by its attachment to themanubrium, have different shapes and sizes. Thenon-symmetric modes of the TM motions betweenthe anterior and posterior aspects in human ears cancause torsional motions of the malleus (Puria et al.2007a). Existence of such torsional motions isenhanced by the cross-sectional shape of the malleushandle, which has a circular shape in human (Puria et
FIG. 7. Rotational velocity (rocking motion) ωy around the shortaxis normalized by the ear-canal pressure. A Magnitude |ωy| and Bphase ϕy. The phases were taken from the rotational velocitycomponents in the positive y direction (inferior direction).
336 SIM ET AL.: Complex Stapes Motions in Human Ears

al. 2007b). The circular cross-section of the humanmalleus handle has an isotropic strength againstforces in all directions, including the torsional stimuli.The torsional motions of the malleus in human earsare expected to be transferred as various stimulationsto the stapes through the deformable joint betweenthe malleus and incus. It is known that cat ears alsohave a non-symmetric TM, a circular cross-sectionalshape in the malleus handle, and a deformable jointbetween the malleus and incus (Puria et al. 2007a).The vibrational modes of the cat stapes have beenstudied previously (Guinan and Peake 1967;Decraemer and Khanna 1999; Decraemer et al.2000), and it was demonstrated that complex modesof stapes motion occur, including rocking motions.
Error on the motion components
Considering the magnitudes of the rigid body com-ponents reconstructed from measurements and the
corresponding maximum possible errors in physio-logical motions (Fig. 9), the translational velocitycomponent at the footplate's center is valid, butvalidities of the rotational velocity components arelimited. The rotational velocity around the short axis(y axis) has good validity along the whole measure-ment frequency range (0.5 to 8 kHz), while therotational velocity around the long axis (x axis) hasgood validity only below 5 kHz. To get better resultsfor assessing the rocking motion, the signal-to-noiseratio in the LDV measurement should be increasedwith improved measurement conditions such asreflectivity of the laser beam on the measured surfaceand performance of the SLDV system. A wider rangeof measurement area closer to the footplate centerand a laser beam direction more perpendicular to thefootplate are also desired for better accuracy (seesection A.1 in Appendix). However, obtaining such ameasurement setup is limited by the surgical access tothe stapes. The small measurement area causes large
FIG. 8. Relative magnitudes and phases of the edge velocities due to the rocking of the footplate with respect to the footplate-center velocity(piston-like motion) A Relative magnitude and B phase of the inferior-edge velocity vinf due to the rocking of the footplate along the long axis, andC relative magnitude and D phase of the posterior-edge velocity vpos due to the rocking of the footplate along the short axis.
SIM ET AL.: Complex Stapes Motions in Human Ears 337
errors on the rotational velocities by making lxð Þm�� ��
and lyð Þm�� �� in Eq. (A.19–A.20) large. With our surgical
access procedure, an angle of approximately 50° to60° between the laser beam and the footplate planewas obtained. Such limitations in surgical access canbe improved by altering the surgical access to exposemore area of the footplate.
The footplate position error causes errors in thecoordinates of the measurement points and the laserbeam direction, and thus errors in the rigid bodymotion components. In this study, five to seven micro-glass beads of 50-micron diameter were attached tothe stapes to obtain a correlation between the SLDVmeasurement frame and the footplate-fixed frame.Considering the size of the glass bead, the alignmenterror within the range of ±4.3 degrees is expectedwith five glass beads. The error range becomes smallerby increasing the number of the glass beads ordecreasing the size of the glass beads and placingthem as far as possible from each other.
Individual difference
In the magnitudes and phases of all stapes motioncomponents, the measurements showed large stand-ard deviations. The large deviations in the measure-ments are presumed to be mainly due to largeindividual differences in middle-ear anatomy (Simand Puria 2008) as well as the older age of the donors.For the six temporal bones used in this study, thestandard deviation of the footplate area was 8.5 % ofthe averaged values (2.97±0.25 mm2).
CONCLUSION
For assessing measurements of stapes motion, themaximum possible error was introduced as a referencefor error boundaries of the elementary motion compo-nents of the stapes. In the measurements of physiolog-ical motions with our measurement setup andconditions, the magnitude of the rotational velocitycomponent about the long axis of the footplate wasalmost the same as the corresponding maximumpossible error above 5 kHz. To overcome the smallmagnitudes of the motion components and get validresults, the measurement conditions such as reflectivityof the laser beam on the measured surface andperformance of the SLDV system should be improved.
In this study, micro-CT imaging technology withmicro-beads attached to the stapes was introduced toobtain accurate coordinates of the measurementpoints and laser beam orientation in the footplate-fixed frame.
FIG. 9. Mean magnitudes of rigid body motion components (black)and their mean maximum possible errors (MPEs, gray) ATranslationalvelocity at the footplate center and B rotational velocities around thelong and short axes of the footplate.
FIG. 10. Excitation of the elementary motion components on thestapes head. The excitation in the ZH direction mainly generates apiston-like motion, while the excitations in the XH and YH directionsmainly generate rocking motions about the short and long axes of thefootplate.
338 SIM ET AL.: Complex Stapes Motions in Human Ears

In the frequency range of 0.5 to 8 kHz, themagnitudes of the rocking motions were comparable tothe magnitude of the piston-like motion, although therewere large individual differences. Regardless of whetherthe rocking motions are desirable or not, a considerableamount of these motions exist, at least in human.Therefore, the detailed contribution of the rockingmotions to hearing should be investigated in the future.
APPENDIX: MAXIMUM POSSIBLE ERRORAND ERROR RATIO
Equation (4) can be written as the following form
ATA� �
vr ¼ 1cos �L
AT vm ; ðA:1Þ
with ATA ¼
nPnm¼1
ym � Pnm¼1
xm
Pnm¼1
ymPnm¼1
ym2 � Pnm¼1
xmym
� Pnm¼1
xm � Pnm¼1
xmymPnm¼1
xm2
26666664
37777775;
ATvm ¼
Pnm¼1
vm
Pnm¼1
ymvm
� Pnm¼1
xmvm
26666664
37777775:
Because in-plane motions of the footplate areassumed to be constrained (“Calculation of the elemen-tary components in the stapes motions”), velocities atpoints on the footplate plane have only the componentin the z direction. The motion of a point on a rigid bodycan be expressed with translations of a reference pointand rotations of the rigid body. Choosing the centroidof the measurement points (xc, yc) as the referencepoint, the velocity components in the z direction voz atthe origin of the footplate-fixed frame can be describedwith the velocity component in the z direction vcz at thecentroid of the measurement points and the tworotational velocity components ωx and ωy of the stapes.
voz ¼ vcz � wxyc þ wyxc ; ðA:2Þ
where xc ¼Pnm¼1
xm
n and yc ¼Pnm¼1
ym
n , assuming that themeasurements points on the footplate plane (xy plane)are equally spaced in the x and y directions. Thetranslational velocity in the z direction at the centroidof the measurement points can be obtained from
vcz ¼Pnm¼1
vm
n cos �L: ðA:3Þ
The rotational part of the stapes footplate motionsfollows as
Pnm¼1
�ym2 � Pn
m¼1�xm�ym
� Pnm¼1
�xm�ymPnm¼1
�xm2
2664
3775 wx
wy
� �¼ 1
cos �L
Pnm¼1
�ymvm
� Pnm¼1
�xmvm
8>><>>:
9>>=>>;;
ðA:4Þwhere �xm ¼ xm � xc and �ym ¼ ym � yc indicate thedistances of measurement points from the centroid.As a consequence from Eq. (A.4) the angularvelocities follow as
wx ¼ 1cos �L
Xnm¼1
lxð Þmvm and ðA:5Þ
wy ¼ 1cos �L
Xnm¼1
lyð Þmvm ; ðA:6Þ
where lxð Þm ¼ymPni¼1
x 2i �xm
Pni¼1
xi yi
Pni¼1
x 2i
Pni¼1
y 2i �
Pni¼1
xi yi
� �2
and lyð Þm ¼��xm
Pni¼1
�yi2 þ �ym
Pni¼1
�xi�yi
Pni¼1
�xi2Pni¼1
�yi2 � Pn
i¼1�xi�yi
� �2 :
In above equations,Pni¼1
�xi2 andPni¼1
�yi2 are determined
by the size of the measurement area, whilePni¼1
�xi�yi
is determined by the shape of the measurement area.In the case that the scan area is symmetric with respectto the axes,
Pni¼1
�xi�yi becomes zero. The measured
velocities vm contain a true velocity v Tm and a measure-
ment error vmE
vm ¼ vTm þ vEm : ðA:7Þ
Substituting Eq. (A.3) and (A.7) into Eqs. (A.2),(A.5), and (A.6), the following equations are obtained.
wx ¼ wTx þ w E
x ¼ 1cos �L
Xnm¼1
lxð Þm vTm þ v Em
� �; ðA:8Þ
wy ¼ wTy þ w E
y ¼ 1cos �L
Xnm¼1
lyð Þm vTm þ v Em
� �; ðA:9Þ
vToz þ v Eoz ¼
Pnm¼1
vTm þ v Em
� �n cos �L
� wTx þ w E
x
� �yc
þ wTy þ w E
y
xc : ðA:10Þ
SIM ET AL.: Complex Stapes Motions in Human Ears 339

From Eqs. (A.8)–(A.10), it follows,
wEx ¼ 1
cos �L
Xnm¼1
lxð Þmv Em ; ðA:11Þ
w Ey ¼ 1
cos �L
Xnm¼1
lyð Þmv Em ; ðA:12Þ
v Eoz ¼
Pnm¼1
v Em
n cos �L� w E
x yc þ w Ey xc : ðA:13Þ
Observing Eqs. (A.11) and (A.12), errors in angularvelocities due to measurement errors become smallerwith the smaller magnitudes of (lx)m and (ly)m. Themagnitudes of (lx)m and (ly)m can be reduced byincreasing the size of the measurement area. In Eq.(A.13), it is shown that error in the piston-like motion(translational components at the footplate center) isrelated to the location of the scan area. When the scanarea is farther from the center of the footplate (that is,the magnitudes of xc and yc are larger), errors in angularmotions are more reflected into the calculated transla-tional motion of the footplate center. It is also obviousthat the smaller θL results in smaller errors.
The magnitudes of the velocity component errors inEqs. (A.11)–(A.13) can be bounded by the followingrelations
w Ex
�� �� � 1cos �L
Xnm¼1
lxð Þm�� �� v E
m
�� ��; ðA:14Þ
w Ey
��� ��� � 1cos �L
Xnm¼1
lyð Þm�� �� v E
m
�� ��; ðA:15Þ
v Eoz
�� �� � 1cos �L
�Pnm¼1
v Em
�� ��n
þ ycj jXnm¼1
lxð Þm�� �� v E
m
�� ��þ xcj jXnm¼1
lyð Þm�� �� v E
m
�� ��0BB@
1CCA:
ðA:16ÞIf measurement error at each measurement point
could be estimated, then the error boundaries of therigid body motion components could be obtained byEqs. (A.14)–(A.16). In actual measurements, themeasurement error at each point is not known, andit is difficult to estimate. If we reversely calculate thevelocity at a measurement point k from the rigid bodymotion of the stapes, then we get
v0k ¼ vcz þ wx�yk � wy�xk� �
cos �L : ðA:17ÞThe magnitude of the difference between re-
calculated velocity from the rigid body components(Eq. (A.17)) and original measured velocity can be used
as a measure of the magnitude of error at the point(Hato et al. 2003). However, in calculation of therotational velocities, the velocity at each point is weightedby the corresponding distance from the centroid of thescan area (Eqs. (A.5) and (A.6)). Therefore, when therotational velocity components are large, the differencebetween recalculated velocity and original measuredvelocity becomes smaller for the points farther from thecentroid and larger for the points closer to the centroid.This results in a reduced measure of the measurementerror for the farther points and a magnified measure ofthe error for the closer points. To get a more reasonablemeasure of the measurement error, we define εk as ameasurement error measure at a measurement point k,
"kj j ¼ v0k � vkj j� vczj j þ wxj j �yk�� ��þ wy
�� �� �xkj jvczj j þ wxj j �yi
�� ��mean
þ wy�� �� �xij jmean
!;
ðA:18Þ
where xij jmean ¼Pni¼1
xij jn and yi
�� ��mean
¼Pni¼1
yij jn are the
average distances from the centroid to the measure-ment points on the stapes footplate in x and y axes. Inthe definition of the measurement error measure above(Eq. (A.18)), the difference between the measured andrecalculated velocities is weighted by a factor thatdescribes the contribution of the velocity at a measure-ment point k to calculation of the rigid body motioncomponents. Substituting vmEj j ¼ "mj j into Eqs. (A.14)–(A.16), the following MPEs are derived as
wxj jMPE ¼ 1cos �L
Xnm¼1
lxð Þm�� �� "mj j; ðA:19Þ
wy�� ��
MPE¼ 1
cos �L
Xnm¼1
lyð Þm�� �� "mj j; ðA:20Þ
vozj jMPE ¼ 1cos �L
�Pnm¼1
"mj jn
þ ycj jXnm¼1
lxð Þm�� �� "mj jþ xcj j
Xnm¼1
lyð Þm�� �� "kj j
0BB@
1CCA:
ðA:21ÞConsequently, the error ratio as the ratio of the
MPE to the magnitude of the corresponding calcu-lated motion component is calculated as follows:
wxð ÞER ¼ wxj jMPE
wxj j ¼Pnm¼1
lxð Þm�� �� "mj jwxj j cos �L ; ðA:22Þ
wy� �
ER¼
wEy
��� ���MPE
wy�� �� ¼
Pnk¼1
lyð Þm�� �� "mj jwy�� �� cos �L ; ðA:23Þ
340 SIM ET AL.: Complex Stapes Motions in Human Ears

vozð ÞER ¼ vozEj jMPE
vozj j
¼Pnm¼1
"mj jþn ycj jPnk¼1
lxð Þm�� �� "mj jþn xcj jPn
m¼1lyð Þm�� �� "mj j
vozj jn cos �L:
ðA:24Þ
REFERENCES
ASAI M, ROBERSON JB, GOODE RL (1997) Acoustic effect of malleushead removal and tensor tympani muscle section on middle earreconstruction. Laryngoscope 107(9):1217–1222
BÉKÉSY G (1960) Experiments in Hearing. New York, McGraw-HillDE LA ROCHEFOUCAULD O, DECRAEMER WF, KHANNA SM, OLSON ES
(2008) Simultaneous measurements of ossicular velocity andintracochlear pressure leading to the cochlear input impedancein gerbil. JARO 9(2):161–177
DECRAEMER WF, KHANNA SM (1999) IN: ROSOWSKI JJ, MERCHANT S (EDS)New insight in the functioning of the middle-ear; The functionand mechanics of normal, diseased, and reconstructed middleears. Kugler Publication, The Hague, The Netherlands, pp 23–38
DECRAEMER WF, KHANNA SM, FUNNELL WRJ (2000) Measurement andmodeling of the three-dimensional vibration of the stapes in cat.Proceeding of the Symposium on Recent Developments inAuditory Mechanics. In: Wada H, Takasaka K, Ikeda K, PhyamaK, Koike T (eds). World Scientific. pp 36–43
DECRAEMER WF, DE LA ROCHEFOUCAULD O, DONG W, KHANNA SM,DIRCKX JJ, OLSON ES (2007) Scala vestibuli pressure and three-dimensional stapes velocity measured in direct succession ingerbil. J Acoust Soc Am 121(5):2774–2791
DODSON JM (2001) Efficient finite element methods/ Reduced-ordermodelling for structural acoustics with applications to trans-duction. Ph.D. Thesis, University of Michigan, Ann Arbor, MI
EIBER A, BREUNINGER C, SEQUEIRA D, HUBER A (2007) Mechanicalexcitation of complex stapes motion in guinea pigs. In: Huber A,Eiber A (eds) Middle ear mechanics in research and otology,Zurich, Switzerland. World Scientific Press, Singapore, pp 123–129
GREENWOOD DT (1988) Eulerian angles. In: Principles of dynamics.Prentice Hall, New Jersey, pp 354–358
GUINAN JJ, PEAKE WT (1967) Middle-ear characteristics of anesthe-tized cats. J Acoust Soc Am 41:1237–1261
HATO N, STENFELT S, GOODE RL (2003) Three-dimensional stapesfootplate motion in human temporal bones. Audiol Neurootol8:140–152
HEILAND KE, GOODE RL, ASAI M, HUBER AM (1999) A humantemporal bone study of stapes footplate movement. AMJ Otol20:81–86
HUBER AM, LINDER T, FERRAZZINI M, SCHMID S, DILLIER N, STOECKLI S,FISCH U (2001) Intraoperative assessment of stapes movement.Ann Otol Rhinol Laryngol 110:31–35
HUBER AM, SEQUEIRA D, BREUNINGER C, EIBER A (2008) The effect ofcomplex stapes motion on response of the cochlea. Otology &Neurotology 29(8):1187–1192
KIRIKAE J (1960) The structure and function of the middle ear.Tokyo, University of Tokyo Press
KOLSTON PJ, ASHMORE JF (1996) Finite element micromechanicalmodelling of the cochlea in three dimensions. J Accoust Soc Am99:455–467
LIM KM, STEELE CR (2002) A three-dimensional nonlinear activecochlea model analyzed by the WKB-numeric method. Hear Res170:190–205
PURIA S, SIM JH, SHIN M, STEELE CR (2007A) A gear in the middle ear.The 30th Association for Research in Otolaryngology WinterResearch Meeting, Denver, Colorado
PURIA S, SIM JH, SHIN M, TUCK-LEE J, STEELE CR (2007B) Middle earmorphometry from cadaveric temporal bone micro-CT imaging.In: Huber A, Eiber A (eds) Middle ear mechanics in researchand otology, Zurich, Switzerland. World Scientific Press, Singa-pore, pp 259–268
RAVICZ ME, COOPER NP, ROSOWSKI JJ (2008) Gerbil middle-ear soundtransmission from 100 Hz to 60 kHz. J Acoust Soc Am 124:363–380
SIM JH (2007) Imaging, physiology, and biomechanics of the malleus-incus complex. Ph.D. Thesis at Stanford University, Stanford, CA,USA
SIM JH, PURIA S (2008) Soft tissue morphometry of the malleus-incuscomplex from micro-CT imaging. JARO 9:5–21
SIM ET AL.: Complex Stapes Motions in Human Ears 341