journal of sustainable development, issn 1913-9063, vol. 1
TRANSCRIPT


Journal of Sustainable Development March, 2008
1
Contents Construction of Environmental Knowledge: Experiences from India 2Deepak Gopinath & Manik D Gopinath Recycle Economy in Industry Aggregation: A View of Institutional Supply 9Haiyan Shang Human Disturbance, Natural Resilience and Management Futures: The Coral Reefs of Todos Os Santos Bay, Bahia, Brazil
13
Leo X.C. Dutra & Robert J. Haworth Zinc Bioremoval from Wastewater of Rubber Glove Industry 31Azizah Abu-Bakar, Rakmi Abd-Rahman, Abu Bakar Mohamad, Abdul Amir Hassan Kadhum, Siti Rozaimah Sheikh Abdullah Modelling Household Travel Behaviour to Promote Educational Values of Sustainability 36Karen S Donegan, Gerry J McAleavy, Henry A Donegan Discussion on the Cultivation System Construction of Sustainable Innovation Ability for Small and Medium Enterprises
54
Xuelian Yang Corruption and the Distortion of Technology Transfer and Marketing Processes: An Insight into Africa’ Economic Malaise and the Decadence of Its Social Fabric
58
Ernest Kadembo Diversity Status and Sustainable Uses of Some Minor Forest Products in Ban Thung Soong Community Forest in Krabi Province, Thailand
69
Hardawati Yahya, S. Bhumibhamon, D. Sookchaloem Information Communications Technology (ICT) Effect on Sustainable Development in Cameroon’s Fragile Economy
75
Johnnes Arreymbi & Esther A. Agbor A Discussion on Relevant Issues about Levying Real Estate Tax in China 86Hong Zhang Managing Sustainable Mangrove Forests in Peninsular Malaysia 88Kamaruzaman Jusoff & Dato’ Hj Dahlan bin Hj Taha Climate Change and Architecture: Mitigation and Adaptation Strategies for a Sustainable Development 97Sergio Altomonte Developing Small and Medium Enterprises (SMEs) in a Transitional Economy-from Theory to Practice: An Operational Model for Vietnamese SMEs
113
Thanh Hai Nguyen, Quamrul Alam, Daniel Prajogo

Vol. 1, No. 1 Journal of Sustainable Development
2
Construction of Environmental Knowledge: Experiences from India Deepak Gopinath
Department of Town and Regional Planning, University of Sheffield Winter Street, Sheffield, S10 2TN, United Kingdom
Tel: 44-114-2226913 E-mail: [email protected] Manik D Gopinath
Former Research Associate, School of Planning and Architecture, Delhi, India Sheffield, United Kingdom
Tel: 44-7733402251 E-mail: [email protected] Abstract This paper explored key issues in how knowledge of the environment is constructed in the Third World. Drawing on which, it showed that there are both explicit and implicit ways in which this knowledge is contested. Particularly, it discussed how implicit forms of contestation are problematic in Third World economies because they are exclusionary and also where such issues become ‘headlines’ only after environmental damage and accompanying social injustices have resulted. It concludes by raising crucial questions for environmental research in the Third World where there is limited role of governments and communities in protecting their environment. Keywords: Environment, Knowledge construction, Roles of actors, Ski Village project, India, Third World 1. Background Despite the existence of international guidelines such as Principle 10 of the Rio Declaration passed in the 'Earth Summit' of 1992 (UNCED 1992), it is not still clear how and whether the issues of environment are integrated into the policy process. Positioned amidst ambiguity, are the tensions in how knowledge about the environment is constructed and by whom (Guha 1989). The significance of knowledge of the environment in the policy process is of great concern in the developing world which is rapidly exploiting natural resources to meet the rising demands of its population. A key aspect of this knowledge construction is in conceptualizing who should be involved in making decisions on the environment and how. Particularly in developing countries with a federal structure of government (where multiple levels of government including central, regional and/or local are involved in decision making), construction of the knowledge on the environment and the design of appropriate policy interventions is problematic. For instance, in the India, environment is a subject in the central list (exclusive authority of central government to legislate), land and water are subjects in the state list (exclusive authority of state government to legislate), and forest is a subject in the concurrent list (where both central and state governments have authority to legislate). More recently, the multiplicity of institutions has become particularly posed challenges with the inclusion of multinational enterprises (or corporate actors) in the policy arena. Thus, on one hand, the competing role of multiple institutions has created ambiguity in who should decide and why. While on the other hand, there are arguments to involve individual citizens in environmental governance (DoE 1994; DETR 1999; Barr 2003). Following on this path, Environment Canada (the federal ministry of the environment) coined the phrase ‘environmental citizenship’ as a broad concept to help different actors to think through their rights and duties as inhabitants of planet Earth (Szerzynski 2006). However, such a conceptualization has been vague and brings on board competing sets of arguments. The first is the inherent rights of different stakeholders on matters concerning their environment, such as rights to clean air, a safe environment, or a right to be involved in decision making. The second relates to the values and practices used to nudge citizens to be environmentally aware and responsible in their everyday practices, such as conserving water, switching off lights and so forth (Horton 2006). These theorizations of environmental citizenship seem to suggest a rights-based as well as a responsibility-based approach, and this reflects the two broad traditions underpinning the notion of citizenship: a liberal notion, based on citizen rights, and a republican notion based on citizen responsibilities (Dobson and Bell 2006). However, such approaches are problematic in the Third World, where communities plagued by poverty and unemployment are more concerned on the different means for livelihood, and are to a lesser degree aware of their environmental rights – rights to clean air or the right to be involved in decision making. Also, responsible behavior to the environment is usually nudged through environmental regulations

Journal of Sustainable Development March, 2008
3
that are generally weak and prone to corrupt practices in developing economies. This has in many ways created ambiguity in what the roles of different stakeholders might be in engaging with the environment. 1.1 Different forms of contestations Due to a lack of clear understanding on how to decide on the environment particularly in developing economies, competing arguments of ‘who should construct knowledge of the environment’ have broadly resulted in two forms of contestations. In some cases, competing arguments of who should construct knowledge of the environment are not explicitly stated. Such forms of ‘implicit’ contestation become particularly problematic in Third World economies where such environmental issues become ‘headlines’ only after the occurrence of environmental damage and accompanying social injustices. With the advent of global players in making decisions of local environments, this has in different ways shaped the roles of governments and communities in the Third World. This has raised concerns about when, how and why actors beyond the local communities should become involved in the decision-making process. Some of these encounters have produced ‘implicit’ contestations within the Indian context (as in the Himalayan Ski Village project). The contestations are ‘implicit’ since such concerns have not reached the attention of the academic and research community, which Smith (2003) rightly notes is partly due to limited awareness of where to look for emerging environmental debates and conflicts. This is also to a certain extent due to the insistence in academic scholarship of ‘reporting after something has happened’ and as a result there is hardly an academic paper that discusses the Ski Village project. On matters relating to the environment and particularly in sensitive eco-systems, opportunities for facilitating basis research to inform policy and applied research appear to be severely limited. In this regard, Hinchliffe and Blowers (2003) argue that environmental disasters are not chance events and that the context should be examined at various levels including an exploration of the socio-political context. Such an approach seems to imply of the need to research the environment starting with the possibility of involving more stakeholders in the decision making process so that there might be limited ecological damage and minimal social impacts. But ‘implicit’ forms of contestation present challenges for environmental research in knowing how such issues can be studied. In this regard, this paper first examines ‘explicit’ contestations, and through an example, brings out a set of questions that can be used as a framework to explore ‘implicit’ forms. More commonly, contestations are explicitly played out through different modes of ‘head-on’ confrontation among different stakeholders supplemented by media publicity (Bingham 2003). For instance in the Indian context, and particularly with respect to the environment, water management practices in north-western India provide a useful insight into the nature of ‘explicit’ contestations. It was reported in the local media that following the ineffective intervention of multiple institutions in providing water supply to drought-prone areas in north-western India (Mago 2000), communities had explicitly contested the notion ‘that they were living in a water scarce environment’. Particularly, in the states of Gujarat (Das 2000) and Rajasthan (Nanda 2000), the traditional systems of water supply including large tanks, canals and aqueducts were cleaned up so that rainwater in the form of surface run-off could be collected and used for domestic consumption. This then provides one of the possibilities to unpack the tensions in how knowledge of the environment is being constructed – how did the state engage with the local context in constructing knowledge of the environment? Drawing on this inquiry, detailed studies were carried out in the desert city of Jodhpur in western Rajasthan (Gopinath 2001a). During the fieldwork however, it started to emerge that such forms of head-on confrontation and social action started to wither away particularly when quantities of public water supply became more readily available. Such tensions were generally treated as mere ‘cause and effect’- that individuals challenge notions ‘that they are living in a water scare environment’ on the basis of self-interest, i.e. to survive. And when the right to survive is not threatened, then they do not contest. However, such explanations appeared simplistic and did not in any way provide an understanding of the socio-political context. Detailed semi-structured interviews were then carried out with different stakeholders including state actors and community members. Discussions with state actors revealed how knowledge of the environment (that they were living in a water scarce environment) was constructed independent of understanding the local context (Gopinath 2001a). State actors were more concerned in using ‘scientific’ approaches in managing water – including pricing policy, augmenting water supply from neighboring states. More importantly, the state actors did not find the relevance of creating a platform for engaging with communities for whom water management measures were being designed. On the other hand, through the discussions with community members, it was learnt that there are underlying forces (such as the caste system) that were not visible even within ‘explicit’ forms (Gopinath 2001a). The caste system is a form of social organization drawing on the ‘Brahmanic’ traditions and has existed for many centuries in many parts of India. At the top of the caste hierarchy, are the upper castes consisting of Brahmins (priests), Rajputs (kings) who have historically controlled the land. The middle stratum consists of peasant castes. And, at the bottom, are the landless communities including the group of Untouchables. The respondents revealed how ‘access to water’ was shaped by an individual’s caste identity. Prior to the introduction of public water supply, residents in Jodhpur relied on traditional systems of water supply. However at that time, settlements were designed in such a way that upper caste households were located on higher ground. This design consideration ensured that water was first consumed by the upper-castes as

Vol. 1, No. 1 Journal of Sustainable Development
4
it emerged from the rain-fed canals. After which, the water drained to further tanks on the plains where lower castes could access water. But in contemporary Jodhpur and especially in times of severe water shortage, such caste differentiations have been ignored and people come together to challenge notions ‘that they are living in a water scare environment’. But when more quantities of public water supply became available, then traditional water systems are no longer maintained and as a result precious rainwater is lost. At this point, caste differentiations deter communities from making collective action. This then suggested the possibility that underlying factors might be embedded within ‘explicit’ forms of contestation. Thus, this provides a second possibility to unpack the tensions in how knowledge of the environment is being constructed - whether and how the views of communities within their local socio-political context have been taken into consideration while constructing knowledge of the environment? This section brought out two questions that explored the challenges in constructing knowledge of the local environment. Drawing on these two questions, the following section will build an understanding of the range of ch allenges within ‘implicit’ forms of contestation through the example of the Himalayan Ski Village project in northern India. Such an inquiry has particularly become problematic in Third World where there is the lack of a guiding framework for environmental research. More significantly, ‘implicit’ contestations become ‘headlines’ only after the occurrence of environmental damage and accompanying social injustices. 2. Himalayan Ski Village and ‘implicit’ forms of contestation This section first provides a backdrop to the influence of global forces on developing economies and discusses how tourism investment has been used by multinational enterprises to engage with the environment. The ‘implicit’ form of contestation that has largely been under-researched is then discussed by examining the Himalayan Ski Village project in northern India. 2.1 Under-development in the Third World: tourism as a solution? Amidst the lack of sound institutional arrangements in developing countries, there has been the surge in multinational investments particularly within the tourism industry. This has been supported by claims that tourism investment is a means to reduce poverty and inequality (Cater 1995; Ashley, Boyd, and Goodwin 2000; Erb 2000) – through increased foreign exchange revenues and enhanced employment opportunities for the local population. The range of advantages suggests that the logic of tourism investment is linked to notions of ‘development’. The notion of ‘development’ was initially argued as a path to be traversed by ‘backward societies along the road to civilization’ (Rist 2002). Then with the advent of the ‘new development age’, agendas of ‘development’ as ‘modernization’, was reinforced by leading development models, including Walt Rostow’s ‘unilinear’ model (1960). The Rostovian Take-off model (as it sometimes called) is a linear theory of development which categorizes economies into primary, secondary and tertiary sectors by observing the patterns of change in the history of developed nations (Rostow 1960). This model was based on the premise that ‘development’ is a defining feature of advanced industrial economies and that regions in the Third World can progress toward development only by treading the same path, earlier traversed by advanced industrial economies. This was later followed by the Lewis model which regarded industrialization as the essence of development (Ranis 2004). It however accepted the classical British roadmap to development – of going through a phase of agricultural revolution first (and thus raising agricultural surplus) and then moving into a phase of industrial revolution (Figueroa 2004). Further it also assumed that for overpopulated nations a strategy of industrialization could help transform the subsistence (primary) sector through a process of labor transfer and growth of employment in the industrial sector (Figueroa 2004; Todaro 2000). These linear models of development attempted to reinforce the notion that there were no alternative paths to ‘development’ other than ‘modernization’ and by integrating into the world system. These had influences in the constitution of new international development agencies including the World Bank, and how development was normatively constructed by them. But ‘development’ as ‘modernization’ has been confronted by the ‘dependency school’ – which argues that ‘modernization’ in an unequal international system would not create autonomous entities but rather will force backward regions (the ‘periphery’) into a state of great dependence on advanced industrial nations (the ‘centre’) (Rist 2002). While ‘development as modernization’ has been used by multinational enterprises as a guiding principle for tourism investment in the developing economies, dependency theory has been used to explain how Third World countries can assume only a passive role in deciding the nature of tourism projects implemented within their borders (Mowforth and Munt 2003; Britton 1982). But the modernization school of thought has been criticized for adopting technocratic approaches such as cost-benefit analysis; rather than taking into consideration the needs and priorities of local communities (de Kadt 1979). Drawing on these arguments, many have cautioned on the perceived advantages of tourism in addressing persistent poverty and rising inequalities in the developing world (Britton 1982). In addition, based on the experience of past decades, such claims appear to be more of rhetoric than reality. For instance, studies have brought out far-reaching social and environmental impacts caused by tourism projects on local communities (Mathieson and Wall 1987; Wheeller 1997). The debates linking notions of ‘development’ to the environment raises crucial questions as to what the role of governments and communities in the Third World might be in protecting their

Journal of Sustainable Development March, 2008
5
environment and as a result, how they can and should engage with the activities of multinational enterprises (MNE), or enterprises that carry out its commercial operations outside its home or ‘parent’ economy (Bull 1991). To understand the implication of MNE activity and the resultant contestations, the next section takes up the case of the Himalayan Ski Village that is being developed by a multinational enterprise, the Himalayan Ski Village Project Company headed by Alfred Ford. 2.2 The Himalayan Ski Village Project The northern state of Himachal Pradesh in India is an environmentally sensitive region where more than two-thirds of land area comes under forest land (Winrock International India 2004). Over the last decade, there has been a rampant sanction of projects in Himachal Pradesh ranging from dam constructions to the recent ski-village project. In this regard, Although the extent of the Himalayan environmental degradation received scholarly attention in the early 1980s (Ives and Messerli 1989), recent studies reveal an alarming situation with dwindling fuel wood supplies, and more frequent occurrence of landslides (Sharma, Goel, and Minhas 1991). Of particular concern has been the increased soil erosion: this has lead to increased sediment load in the rivers and has reduced the efficiency and lifespan of the many hydroelectric projects in Himachal Pradesh that provide power not only to the mountain communities but also to the neighboring states (Sharma and Minhas 1993). Of the total potential of hydroelectric power of 97000 MW in India, 21229 MW comes from Himachal Pradesh (Winrock International India 2004). Such large scale projects in sensitive environmental regions have also affected the lives of local communities who are dependent on natural resources for their subsistence. In this regard, many have advocated ‘sustainable livelihoods’ approach in mitigating the effects of such projects on the livelihoods of local communities (Chambers and Conway 1992; Stonich 1998; Scoones 1998). However, amidst such alarming concerns in how large-scale projects have started to affect the livelihoods of local communities, one of the biggest tourism projects in India was sanctioned in Himachal Pradesh in 2006 – the Himalayan Ski Village project. The Himalayan Ski Village project was set up at Kullu valley in the state of Himachal Pradesh by Alfred Ford, the great-grandson of Henry Ford (founder of Ford motors) who is keen on holding international ski tournaments including the Winter Olympic Games. Drawing on his company’s success in running a ski resort at Vedli in Colorado (USA), the Himachal Pradesh state cabinet approved the Preliminary Project Report (PPR) for the setting up of the Rs.3500 Crore (700 million USD) Himalayan Ski Village in November 2005. This tourism project, also called the ‘Fort’ is considered to be one of the biggest FDI (foreign direct investment) in India (The scale of the investment is interesting as according to 2006-07 budget estimates, the HP state annual income is around Rs.8000 Crore or 1.6 billion USD). In addition, the ski village project has been presented as ‘very local-friendly’, by promising to provide over 70 percent employment to the local population. The marketing schedule of the project has been spread over a period of five years starting in 2006. The first phase of the project started early in 2007 with the establishment of the training institute for winter sports. By early 2008, the presale of chalets and condo hotel rooms is expected to commence. The ski village is expected to be fully ready for commercial operations by early 2011 including the development of 700 hotel rooms, restaurants along with an 'Indian Village' shopping experience, twenty thousand square feet of convention facility and an entertainment/performing arts centre. 2.3 Unpacking ‘implicit’ contestations This section examines the Ski Village Project through the two questions developed earlier in this paper. Firstly, of how the state had engaged with the local context in constructing knowledge of the environment .The role of the Himachal Pradesh state government appears to be caught between a social objective of providing welfare support to rural areas and to protect the environment, and an economic objective of responding to challenges and constraint of a global market (Mathew 2005). It is true that the role of the state has been quite pronounced in Himachal Pradesh with the National Institute of Rural Development placing the state government’s effort in first position with respect to indicators on human development and infrastructure provision in rural areas across the country (Sanan 2004). However, the upcoming investment opportunities in Himachal Pradesh owing to its tourism potential have in different ways put pressure on the state government to respond adequately. This is clearly reflected in the Memorandum of Understanding (MoU) signed by the state government and the Himalayan Ski Village (HSV) project company in 2006 (Sethi 2006). For instance, the opportunities for investment in property by the elites as well as the commencement of new chartered flights to the region, in contrast to the development of rural roads and infrastructure, seem to suggest that role of the state has become rather insignificant. Also, Section VII of the MoU gives the Ski Village company “water rights in the Project Area, including the tapping of unused nallas /ground water and for building retention ponds for snowmaking and supply to the resort village” (Sethi 2006). In addition, the sheer scale of the investment in the Ski Village project (700 million USD) in relation to the state government’s annual budget (1.6 billion USD) point to the state in the Third World as being a ‘passive player’ in development. Thus, rather than engaging with the local context in constructing knowledge of the environment, the state seems to have accepted the notion of ‘environment’ as conceived by the multinational enterprise promoting the Ski Village project – ‘that tourism investment as a means to reduce poverty and inequality, will result in a sustainable development of the local environment’.

Vol. 1, No. 1 Journal of Sustainable Development
6
Secondly, of whether the views of communities within their local socio-political context were taken into consideration? Based on the Memorandum of Understanding signed in 2006, the Ski Village project excludes local/indigenous knowledge of the environment from the policy process (Sethi 2006). In this regard, Gardner and Dekens (2007) have shown how local/indigenous knowledge has been used to protect communities from devastating floods in the Kullu valley – by locating the settlements at regular intervals on the hill slopes and surrounding them with areas of cultivated land. But more recently, the value of such local/indigenous knowledge has been ignored, and where rapid deforestation and intensification of human activities have increased the frequency and impact of floods and the damage they cause to the fragile eco-system (Gardner 2002). So on one hand, while the local communities conceive ‘a safe and protected environment’, the advocates of the Ski village project conceptualize the environment as synonymous with ‘rapid deforestation’ and ‘intensification of human activities’. It becomes further problematic when local communities are excluded from the policy process and do not have voice over ‘common property resources’. For instance, Section VII of the MoU gives the Ski Village company “irrevocable license for the use of ski trails and making of snow and ice on such trails for the duration of the [land] lease and for the construction of trail markers, retention ponds, underground water lines and water pumps...”(Sethi 2006). These contradictory understandings of engaging with the environment are seldom made explicit and where local communities remain passive players in the policy process. In addition, previous research seems to suggest the existence of implicit forms of knowledge construction prior to implementation of the Ski Village project – varied infrastructure provisions for different types of villages (highway villages, remote villages etc.), cultural differences between host and tourist populations etc. (Gopinath 2001b). Thus, being positioned in a culture that does not explicitly challenge notions of ‘environment’ conceptualized by powerful stakeholders, presents problems for protecting the fragile eco-system. Moreover, the exploitation of natural resources through large-scale tourism investments raises questions of whether it has compromised the livelihood opportunities of rural communities (Ellis-Jones 1999). Based on fieldwork carried out in 2000, rural populations of the Kullu valley have sustained a traditional way of engaging with members outside their community – through a form of community tourism – and have relied on a defined rural economic base for their survival (Gopinath 2001b). The rural households engaging in tourist activities have traditionally welcomed tourists into their ‘personal space’ in the form of family owned guest houses. Further, tourists are largely considered as members of rural community and not as a community beyond the rural population. By segregating the new, elite tourists from the host rural community, would in some ways create the notion of a ‘gated community’. However in literature, emergence of gated communities is generally viewed as an urban phenomenon where communities (mostly upper-class families) by virtue of their ability to pay, demand a homogenous social culture, a sense of privacy and security from an outside, seemingly alien world (Roitman 2003). And also justification for creation of such communities has been based on prevalence of urban violence and crime (Blakely and Snyder 1997; Caldeira 2000). The debates on ‘gated communities’ becomes interesting in the context of Himalayan Ski Village Project in Kullu valley where the residential development is neither in an urban context nor based on a need for security. But, the notion of development here in Kullu valley, is one of restricted access where public spaces are being privatized (Blakely and Snyder 1997; Goolbar 2002) and new lines are being drawn between an emerging, elite tourists and the host rural community. The sustainability of community tourism now appears threatened especially with the introduction of large scale projects like the Himalayan Ski village project. Thus, there are also concerns that the Ski Village project will bring about greater inequality in the region; particularly through the emergence of an elite-driven, tourism agendum (and for private use) as opposed to a traditional, community-based tourism. 3. Conclusion This paper explored key issues in how knowledge of the environment is developed in the Third World. Cutting across the different aspects of such arguments, the paper showed that there are both explicit and implicit ways in which knowledge is contested. In particular, since implicit forms are under-researched, this paper brought out key challenges by discussing the Ski Village project. Firstly, the paper raises concerns that environmental degradation and accompanying social impacts caused by the Ski Village project are not explicitly revealed. Such concerns point to the influence of competing interest groups within the Kullu valley. Particularly, powerful stakeholders including those who wish to cater for an ‘elite’ tourist population at the Ski Village project seem to be shaping the notion of ‘environment’ in Kullu valley. That the less powerful, local communities are not involved in decisions shaping the environment seems to downplayed in the policy process. This seems to suggest why constructions of the ‘environment’ are implicit and exclusionary. However, such implicit forms of contestations will not prevent environmental degradation and accompanying social impacts. But after such damage has been done, it will provide material for a range of impact studies. Thus, the implementation of a large-scale tourism project such as the Himalayan Ski Village project in rural areas in the developing world raises many concerns particularly in who gets to decide on the nature of such projects. In addition, the paper also raises more general concerns. It brings out challenges in the context of a developing nation where the livelihoods of communities are greatly connected to their immediate environment. Closely linked to this are concerns that existing approaches to environmental planning and management do not adequately make provisions for

Journal of Sustainable Development March, 2008
7
stakeholder involvement in making policy decisions (Oduwaye 2006). This is particularly important because environmental projects that have been implemented without the involvement of intended beneficiaries have had limited success (Sharp 1992). These wider understandings are hoped to inform policy in re-examining the basis for creating knowledge of the environment particularly in the Third World particularly where such issues become ‘headlines’ only after environmental damage and accompanying social injustices have resulted. References Ashley, C., Boyd, C., & Goodwin, H. (2000). Pro-poor tourism: putting poverty at the heart of the tourism agenda. Natural Resource Perspectives 51 (Mar), 1-12. Barr, S. (2003). Strategies for sustainability: citizens and responsible environmental behavior. Area 35 (3), 227-40. Bingham, N. (2003). Introduction. In N. Bingham, A. Blowers & C. Belshaw (Eds.), Contested Environments. Chichester: John Wiley & Sons Ltd. in association with The Open University. Blakely, E. J., & Snyder, M. G. (1997). Fortress America: Gated Communities in the United States. Cambridge, MA: Brookings Institution Press and Lincoln Institute of Land Policy. Britton, S. G. (1982). The political economy of tourism in the Third World. Annals of Tourism Research 9 (3), 331-358. Bull, A. (1991). The Economics of Travel and Tourism. Melbourne, Australia: Pitman Publishing. Caldeira, T. P. R. (2000). City of Walls. Crime, Segregation and Citizenship in Sao Paulo. California: University of California Press. Cater, E. (1995). Consuming spaces: global tourism. In J. Allen & C. Hamnett (Eds.), A Shrinking World? Global Unevenness and Inequalities. Milton Keynes: Oxford University Press (in association with Open University Press). Chambers, R., & Conway, G. R. 1992. Sustainable rural livelihoods: practical concepts for the 21st century, IDS discussion paper 296. Brighton: Institute of Development Studies (IDS), University of Sussex. Das, R. (2000). Jamnagar cleans up Lakhota lake. Hindustan Times, 28 April 2000, national newspaper published by HT Media Limited, Delhi, India. de Kadt, E. (1979). Social planning for tourism in the developing countries. Annals of Tourism Research 6 (1), 36-48. Department of Environment (DoE). (1994). Sustainable Development: The UK Strategy. London: HMSO. Department of Environment Transport and the Regions (DETR). (1999). A Better Quality of Life: A Strategy for Sustainable Development for the UK. London: The Stationary Office. Dobson, A., & Bell, D. (2006). Introduction. In A. Dobson & D. Bell (Eds.), Environmental Citizenship. Cambridge, MA: The MIT Press. Ellis-Jones, J. (1999). Poverty, land care, and sustainable livelihoods in hillside and mountain regions. Mountain Research and Development 19 (3), 179-190. Erb, M. (2000). Understanding tourist: interpretations from Indonesia. Annals of Tourism Research 27 (3), 709-36. Gardner, J. S. (2002). Natural hazards risk in the Kullu district, Himachal Pradesh, India. The Geographical Review 92 (2), 282-306. Gardner, J. S., & Dekens, J. (2007). Mountain hazards and the resilience of social-ecological systems: lessons learned in India and Canada. Natural Hazards 41 (2), 317-336. Goolbar, A. (2002). Outside the walls: urban gated communities and their regulation within the British Planning System. European Planning Studies 10 (3), 321-334. Gopinath, D. (2001a). Water Management in Arid Areas: Case Study of Jodhpur City. Dissertation submitted for the Master of Planning degree (with specialization in Urban Planning), Department of Urban Planning, School of Planning and Architecture, New Delhi, India. Gopinath, M. D. (2001b). Impact of Tourism on Village Development: Case Study of Kullu Valley, Himachal Pradesh, India. Dissertation submitted toward the Master of Planning degree (with specialization in Regional Planning), Department of Regional Planning, School of Planning and Architecture, New Delhi, India. Guha, R. (1989). The Unquiet Woods: Ecological Change and Peasant Resistance in the Himalayas. Oxford: Oxford University Press. Hinchliffe, S. J., & Blowers, A. T. (2003). Environmental responses: radioactive wastes and uncertainty. In S. J. Hinchliffe & A. T. Blowers (Eds.), Environmental Responses. Chichester: John Wiley & Sons Ltd. in association with The Open University.

Vol. 1, No. 1 Journal of Sustainable Development
8
Horton, D. (2006). Demonstrating environmental citizenship? A study of everyday life among green activists. In A. Dobson & D. Bell (Eds.), Environmental Citizenship. Cambridge, MA: The MIT Press. Ives, J. D., & Messerli, B. (1989). The Himalayan Dilemma: Reconciling Development and Conservation. London: Routledge. Mago, C. (2000). Too many water-related ministries leave people high and dry. The Times of India, 24 April 2000, national newspaper published by the Times Group, Delhi, India. Mathew, P. M. (2005). Rural industries and the international market - some issues. Journal of Rural Development 24 (2), 247-70. Mathieson, A., & Wall, G. (1987). Tourism: Economic, Physical, and Social Impacts. Harlow: Longman Scientific & Technical. Mowforth, M., & Munt, I. (2003). Tourism and Sustainability - Development and New Tourism in the Third World. London: Routledge. Nanda, R. (2000). Wellsprings of hope - recharge traditional water systems. Hindustan Times, 11 May 2000, national newspaper published by HT Media Limited, Delhi, India. Oduwaye, L. (2006). Citizen participation in environmental planning and management in Nigeria: suggestions. Journal of Human Ecology 20 (1), 43-48. Rist, G. (2002). The History of Development: From Western Origins to Global Faith. London: Zed Books. Roitman, S. (2003). Who segregates whom? Paper read at Conference on Gated communities: building social division or safer communities? 18-19 September, 2003 at University of Glasgow, Glasgow, United Kingdom. Sanan, D. (2004). Delivering basic public services in Himachal Pradesh - is the success sustainable? Economic and Political Weekly 39 (9), 975-78. Scoones, I. (1998). Sustainable rural livelihoods: a framework for analysis, IDS working paper 72. Brighton: Institute of Development Studies (IDS), University of Sussex. Sethi, A. (2006). On thin ice. Frontline, Volume 23, Issue 7, 8-21 April, 2006, national fortnightly published by the Hindu Group, Chennai, India. Sharma, P. D., Goel, A. K., & Minhas, R. S. (1991). Water and sediment yields into the Sutlej river from the high Himalaya. Mountain Research and Development 11 (2), 87-100. Sharma, P. D., & Minhas, R. S. (1993). Land use and the biophysical environment of Kinnaur district, Himachal Pradesh, India. Mountain Research and Development 13 (1), 41-60. Sharp, R. (1992). Organizing for change: people-power and the role of institutions. In J. Holmberg (Ed.) Policies for a Small Planet. London: Earthscan. Smith, J. (2003). Making environment news. In N. Bingham, A. Blowers & C. Belshaw (Eds.), Contested Environments. Chichester: John Wiley & Sons Ltd. in association with The Open University. Stonich, S. (1998). Political ecology of tourism. Annals of Tourism Research 25 (1), 25-54. Szerzynski, B. (2006). Local landscapes and global belonging: toward a situated citizenship of the environment. In A. Dobson & D. Bell (Eds.), Environmental Citizenship. Cambridge, MA: The MIT Press. United Nations Conference on Environment and Development (UNCED). (1992). Agenda 21: Action Plan for the Next Century. Rio de Janerio: United Nations. Wheeller, B. (1997). Tourism's troubled times: responsible tourism not the answer. In L. France (Ed.) The Earthscan Reader in Sustainable Tourism. London: Earthscan. Winrock International India. (2004). Markets for Watershed Protection Services and Improved Livelihood’s in India: A Policy Brief, 2004. Gurgaon, India: Winrock International India.
Journal of Sustainable Development March, 2008
9
Recycle Economy in Industry Aggregation: A View of Institutional Supply Haiyan Shang
School of Economics, Shandong University of Finance, Jinan 250014, China E-mail: [email protected]
Abstract Industry aggregation is based on the division of related industries. This kind of aggregation saves costs of transaction, enhance further innovation and economy of scale, and at the same time, create preconditions for internal recycle economy. Generally speaking, a nice institution can drive division. Therefore, the government should guarantee the institutional supply properly, pushing the division of recycle economy. Keywords: Industry aggregation, Recycle economy, Division, Institutional supply 1. Introduction Along with the exhaust of certain key human resources, recycle economy is gradually becoming one of the goals pursued by human being during the development of economy. The idea of recycle economy appeared firstly in developed countries. In 60s 20th century, Boulding, an American economist, thought that the human economy is like an airship flying in the universe, which flies by consuming self energy. In his opinion, if people fail to explore energy rationally and destroy the environment, what lead to a result beyond the bear of the earth, it will be ruined like an airship. Therefore, it is a must to turn the present linear development way that focused on consumption into an ecological development way that focused on feedback. Since the emergence of recycle economy, it has gradually aroused a revolution of regulating the economics in the academic field, and it has permeated into every field of economics, including the industrial economy. Here we will discuss the recycle economy in the industry aggregation. 2. The evolution mechanism of industry aggregation The germination of industry cluster theory can be initially traced back to Adam Smith’s Theory of Division. His discussion on the relationship between division and market scope includes some economic thoughts related with industry cluster. The theory of industry cluster is originated from the “exterior economy” described in Alfred Marshall’s Principles of Economics. Thereof, the three key elements are the sharing labor market, the semi-product investment, and the technology overflow. It is Max Weber, an economist in the industrial location field, who firstly put forward the economic concept of aggregation. In his “On Industrial Location” written in 1909, he has developed the theory of industry cluster further. It was the work of Potter and Krugman that made the industry cluster theory become mature and gain popularization and attention in 90s of 20th century. Potter (1990) advanced the industry cluster theory of neo-competitive economics, disclosing the mechanism of the industry cluster’s emergence and operation. Considering the mechanism, social division causes increasing transaction costs. In order to reduce the transaction costs, enterprises choose to integrate with each other in space, which leads to the appearance of industrial cluster. Regional division causes an industry cluster with regional features. Social division causes the emergence of specialized market. And specialized market deepens the social division. The mutually affected mechanism between social division and specialized market pushes the continuous development of industry cluster. There is a positive correlativity between the development of regional industry cluster and the degree of market integration. Generally speaking, a better mechanism environment can drive division, extend industrial division chain, detail division, reduce production costs, improve production efficiency, reduce transaction costs, improve transaction efficiency, produce industry cluster, and sustain its constant competitive advantage. Reversely, a mechanism environment may restrict division, increase transaction costs, and decrease transaction efficiency, what can not help to generate the industry cluster. Even if there is an industry cluster, but if there is no sufficient mechanism supply, it may reduce the industry cluster’s competence or even make it decline or disappear. As far as the generation path of division is concerned, one is spontaneous, which produces the primary division. It depends on the national or regional internal industry chain, and the advantages of market and system resources, and generates the primary industry cluster. The other is exterior compulsion, which produces the exterior-resource division. It is kind of government-dominated division, which generates the derivative industry aggregation dominated by government policy.

Vol. 1, No. 1 Journal of Sustainable Development
10
3. The endogenesis of recycle economy in industry aggregation The recycle economy is an ecological system, similar to its circular path and food chain “producer --- consumer --- decomposer”. It creates a path for resources “explorer --- processor and consumer --- waste handler”, changing the former closed matter and energy circulation toward the flowing circular economy, namely “resources --- products --- renewable resources --- renewable products”, breaking the matters’ traditional linear flow, namely “resources --- products --- consumption --- exhaust”. The recycle economy, as a new ideal product at the post-industry stage, replaces the “three high” (high consumption, high waste, and high pollution) production way with the “two-low and one-high” (low consumption, low waste, and high quality) production way. As far as the industry aggregation way is concerned, three reasons contribute to the internal generation of recycle economy in industry aggregation. 3.1 Division leads to recycle economy A nice system can help to cause industry division. And industry aggregation can extend toward its lower chain further. The waste treatment industry can be derived from the division internally, which is the recycle economy in a sense. The relationship between enterprises in the industry cluster includes specialized division and cooperation. That is the base for clusters. The longer the value chain of one product, the more possible to disintegrate the production procedure technically is. The stronger the connection between different enterprises that focus on different production rings, the easier the industry cluster comes into being. It is the specialized market, that greatly decreases the cost of coordination at the primary stage of division, and helps the division develop further among enterprises. Besides, lots of bargainers choose to focus on specialized production and give up pure trade activities, as they know about relevant industries, master key technologies, and accumulate amount of capitals, or as there is a better investment chance, what also contributes to the expansion of industry aggregation. Here it includes the reuse of waste. Many cases, especially certain industry development modes in China rural areas, have already proved this point. For example, the tin processing industry cluster in Pingyi county, Shandong province, include sorts of waste treatment industries that are based on the tin processing industry. The number of these industries is as follow (Table 1). Here is another example for the industry aggregation. There is a industry aggregation area in Hei Longjiang province. The power plant uses the lignite to generate power. The waste of slags, cinders produced during the course of coal mining, power generation and chemical processing of coal will be used to produce building material and to restore the ecology of the coal mine area. While the power plant and the chemical processing project are producing, they offer each other resourced needed (electric energy, heat and circulate water, etc.).Then the recycle production is realized. Coter (1997) holds that the enterprise in the ecological region would acquire much more benefit than the total sum of an individual behaviors. This can be regarded as an internal motivation. Yang Jinghui (2004) also holds that the outer economy formed by the interacting system, and the internal representation of the no economy are the internal basis of division. All those examples prove our ideas. From the above, it is obviously that an industry cluster may include a waste treatment industry, which extends the industry chain further. But this extension is based on certain preconditions. It is the industry aggregation that reduces the space transportation costs greatly, creating favorable conditions for division. Comparing with separate production, the division under the recycle economy in industry aggregation has more advantages. 3.2 Innovation produces recycle economy According to Potter’s theory of industry cluster, the industry cluster with high competence can inspire innovation. Nothing but innovation can create and sustain the necessary competitive advantage in a cluster. An industry cluster can gain its competitive advantages by enterprises’ mutual cooperation, competition, and coordination in one cluster in aspects of production costs, products differentiation, regional marketing, and market competition. At the same time, the cluster can promote its innovation ability by means of forming a regional innovation system that is based on the mutual effects between supportive institutions and enterprises. The innovation can drive the reuse of resources, reducing costs. Take some Japanese hotels in tourist regions for example. Before the application of internal recycle economic mode, these hotels have to pay the government 30 million Japanese Yen for burning the waste. In May, 1999, they invented a food recycling machine. This machine can mix the abandoned food together with water, and generate 700 kg high-quality fertilizer that may be sold or used for rose garden. As a result, this invention brings about considerable environmental and economic benefits. Besides, these hotels can wrap uneaten food for guests and retain their wine. 3.3 Scale economy produces recycle economy Recycling economy needs enterprises to concentrate in a certain space, so as to form an industrial chain cycle, to achieve a regional scale of the recycling use of resources, and then achieve the economies of scale of economic cycle in the region. Therefore, the industrial policy must improve and encourage enterprises to large-scale production. Without the economies of scale, the unit output minimum consumption of resources cannot be achieved. In this sense, the cycle of the economy requires us to continuously push forward the regional concentration of industries, to form larger and

Journal of Sustainable Development March, 2008
11
more professional circle of economic enterprises. For example, the treatment of pollution in the Huai River valley is very difficult. And this difficult is greatly related to the industries’ distribution. The distribution is too decentralized and not conducive to the use of recycled water and the integrated treatment of a vital relationship. However, in Shandong province, small paper mills, whose production capacity of 50,000 tons were shut down years ago. The Government supports the establishment of a group of large-scale paper mills, which have the black liquor treatment and water recycling capacity. The result is an increase of the output of paper, the expansion of the economic scale, such as COD emissions of pollutants has dropped. This example shows that economic growth does not necessarily bring about the increase in the total pollution emissions. Because of industry aggregation, waste treatment enterprises can deal with the waste at a large scale, which reduces costs further. In order to escape from the pollution tax, enterprises choose to associate together to treat the waste, which realizes an economy of scale. But from a viewpoint of value chain, this extension is based on certain preconditions as follow. (1) Concession of value chain. Waste treatment has costs. But it is impossible to improve the price of the reusing waste, because only when the reusing cost is lower than the cost of primary use, can enterprises support the mode of recycle economy. However, present technologies can not help to achieve this goal. It means that a price concession is necessary, which can not be realized under the price mechanism. (2) Growth of green demand. Green demand is an important dynamic source for the recycle economy. Green demand can properly evaluate enterprises’ costs for recycle economy, and inspire the industry’s further division, driving the generation of waste treatment industry. Therefore, in the process of forming the recycle economy, the market acceptance and demand of enterprises’ green products is one of important dynamic sources for developing the recycle economy. Based on analysis above, although the recycle economy is based on internal factors, its dependence on these factors is limited. Therefore, the government can adopt some effective measures to drive the generation of the recycle economy. 4. The institutional supply of government (1) Encourage green consumption and pull green demand’s institutional supply. The government can advocate green consumption, inspire people’s green demand, and enlarge the distance between green consumption and common consumption. And levying consumption tax can solve this distance. Surely, it is impossible for the cultivation of green demand exerting effect at once. The government can adopt a step-by-step way to enhance people’s consciousness of green demand. (2) Reduce waste treatment companies’ costs by favorable tax policies. Due to technologies, the high costs for reusing the waste stop enterprises’ step toward the recycle economy. The government should provide with favorable taxes for the waste treatment industry. For the waste treatment companies, the government can further decrease the value-added tax, driving the reuse of waste. What is gratifying is that the Ministry of Finance has already begun to make relevant efforts. Li Jinghui, the Ministry of Finance official, says that supporting resource conservation and environmental protection are the important directions of China's future tax reform and adjustment. The Chinese government is planning the reform of income tax and the merge of the domestic and foreign-invested enterprises, and all of these will consider resource conservation and environmental protection. At the same time, China will adjust the import and export tax policies, including the cancellation of some of the resources-products export tax rebates, resource-based products exempt from import tax. He says that Finance Ministry will also promote sewage, waste disposal industry, and market oriented, including the introduction of sewage and waste disposal standards. He points out that China's resource price is too low, and this is one of the important reasons, which lead to high consumption of resources and environmental pollution. Therefore, China will adjust resources prices. Only by price adjustments of resources, financial investment and taxation policies can play an important role. (3) Encourage scientific and technological innovation, and encourage individuals to make scientific and technological innovation for recollecting and reusing the waste. The government can inspire enterprises to make scientific and technological innovation by legalization. At the same time, enhance the cooperation between enterprises and scientific research institutions. Improve enterprises’ ability of scientific and technological innovation. Science and technology innovation and system innovation is mutually stimulating, and therefore science and technology innovation needs a series of supporting policies, such as intellectual property rights, financing systems and industrial policy, to provide protection. Efforts must be done to enhance government’s service function, and then create the comfortable and free system environment for the science and technology innovation. The government is not only the policymaker of the science and technology innovation activities, but also the direct participant of the science and technology innovation. The government’s main work should turn from the direct organization and intervention of science and technology innovation to macro-control, creating environment and supplying services, and then supply system guarantee for the science and technology innovation. The main measures include: to make policies for the development of high-tech industry and high-tech support innovative industry; to make policies to encourage high-tech

Vol. 1, No. 1 Journal of Sustainable Development
12
entrepreneurship personnel; to make policies to support the development of independent innovation of the government procurement; to make policies to encourage scientific and technological innovation of the fiscal and taxation, and improve investment in science and technology policies; to improve strengthening of intellectual property laws and regulations, such as the supervision of law enforcement policy, the establishment of evaluation of the value of science and technology innovation system, and to build technical and social service system. In addition, the government should concentrate its limited funds and the main force to break through key technology, and plays a guiding role in the direction of guiding scientific and technological enterprises. (4) Construct and perfect an integrated decision-making mechanism for environment and development. Local government at different levels should set up a management decision-making mechanism for cluster’s ecological development, what can help to perfect the ecological management system for cluster. It can organize, coordinate, and supervise the execution of cluster’s ecological development strategy. Meanwhile, change the former improper policy and constitute an ecological development strategy. Authorize a field with development priority. Make up a series of measures that encourage individuals, enterprises, and institutions to participate in ecological cluster organization. Build up a production chain that realizes resources share and economic benefits. (5) Perfect the evaluation system for an ecological cluster. In the aspect of environment protection, it is a must to control it in advance. Therefore, a reasonable standard for environment protection is necessary. The setup of green standards can increase the requirements for products entering market, improving enterprises’ motivation in developing new environment-friendly products. Meanwhile, enterprises’ pursuit for environment protection can further drive the appearance of division, which can accelerate the development of relevant research institutions and industries. Under the condition with relatively sufficient information, constituting standards is good for enterprises. 5. Conclusion Apparently, industry aggregation can generate the recycle economy internally, especially in rural areas where there are sufficient labors. Applying the recycle economy thought to the aggregation economy can improve the use efficiency of resources to a great degree, and reduce the exhaust of waste, which contributes to the protection of environment. Meanwhile, it can help to realize a win-win development of enterprises, society and environment. However, this internally generated recycle economy merely exerts limited effects. From a view of division, a nice system can drive further division. As long as the government can provide with necessary institutions, further division of industry aggregation can be realized, and so does the recycle economy. It is necessary to apply the recycle economy thought to the industry aggregation process. At the same time, we should take two facts into consideration that China does not own sufficient resources and enterprises need amounts of resources for further investment. References Coter Smolinaars. (1997). Surpprting Pilias for Iindustrial Ecosystem Journal of Clearner Production No. 5(1-2)67-74. Feng, Zhixun. (2004). On Recycle Economy. Beijing: People’s Publishing House. Hu, Haijun. (2007). A review on the trends of recycle economy. Contemporary Economics. No.10. Liu, Xuexia. (2007). The Development Strategy of recycle economy in industry aggregation. Contemporary Economic Research. No.10. Michael E. Porter. (2003). On Competition. Beijing: China Citic Press. Yang, jinghui, Wu, chunyou & zhang wenbo. (2004). The economic mechanism of analyzing ecological region by using theoretical analysis of the external.China Resource Comprehensive Utilization. No.4. Zhang, Hui. (2003). The economic mechanism of industry cluster competition. China Soft Science. No.1. Table 1.
Dominant industry Number
Tin processing industry 11
Waste treatment industry
Seedcase collecting 3
Cullet collecting 2
Pip collecting 2

Journal of Sustainable Development March, 2008
13
Human Disturbance, Natural Resilience and Management
Futures: The Coral Reefs of Todos Os Santos Bay, Bahia, Brazil Leo X.C. Dutra
Palaeo Group, Geography and Planning University of New England, Armidale New South Wales, 2351, Australia
Tel: +61 2 6773 3986 E-mail: [email protected] Robert J. Haworth
Discipline of Geography and Planning University of New England, New South Wales, 2351, Australia
Tel: +61 2 6772 3088 E-mail: [email protected] Abstract Between 1962 and 2003 significant coral species changes within reef assemblages at Todos os Santos Bay (TSB), Bahia (Brazil) have taken place, following what appears to have been a 400 year contraction of coral reefs from the inner, landward reaches of the bay. The last 40 years in particular encompassed rapid and extensive urban and industrial development its surrounding lands, which contributed to coral reef changes. However, changes in this environment have influenced coral reef resilience since the arrival of the Portuguese in the XVI century, creating knock-on effects that modified and simplified coral reef ecosystems in the bay. Clues to the limits of coral resilience may be found in natural and human disturbance regimes to which the corals have been subjected in the past, and for that reason we listed and categorized what little is known about Holocene and historical conditions in TSB, proposing alternatives for a resilience management of the bay. Keywords: Ecological history, Resilience, Phase shift, Coral reefs, Recôncavo, Todos os Santos Bay, Brazil 1. Introduction One of us (LXCD) took part in work in 2002 logging species changes in coral reefs at Todos os Santos Bay (TSB), Bahia state, Brazil (Dutra, Kikuchi, & Leão, 2006a). In this survey we noted a marked simplification and decline of species since the only previous comprehensive survey in 1962 (Laborel, 1969a). As the large-scale urban and industrial growth of the bay area from ~1950 had likely been a factor in this change, the question arose as to whether the resilience of local systems was sufficiently robust to cope with future man-induced traumas to their environment. We decided to piece together what little evidence there is in the historical and ecological record to ascertain what kind of shocks the coral reefs of TSB might withstand in the future based on what they have survived and evolved from in the near and distant past, in short, the limits of their resilience. Resilience refers to the potential for continuity and survival in both human and natural systems. An assessment of resilience should try to measure the persistence of relationships within a system and their ability to absorb change of state variables, and still survive with some integrity. The resilience of any given natural system has, of course, evolved from a background of cyclical environmental change punctuated with catastrophes. Even in the relatively stable Holocene, coral reef resilience must have been tested many times at TSB. With the advent of European colonization 500 years ago, human impact on the corals increased through a series of sharp fluctuations following successive land use changes. Whether better management practices in the future can work with nature to improve the reefs’ natural resilience is an open question. The best hope to promote sustainability and environmental conservation at TSB in the future is by carefully targeted adaptive management practices (Holling, 1978). The changes that prevailed since Portuguese settlement led to policies and practices that caused further environmental degradation in a positive feedback loop. This paper does not seek to resolve the debate on what could have been done and what caused which impact, but rather, to contribute a management logic that all parties to the debate may find useful. This encompasses adaptive collaborative management (ACM) and should apply to biodiversity conservation both in and beyond formal protected areas (Schelhas, Buck, & Geisler, 2001).
Vol. 1, No. 1 Journal of Sustainable Development
14
2. Description of the study area 2.1 General Aspects Todos os Santos Bay is a largely land–locked embayment covering an area of over 1000 km2 on the east Brazilian coast between 12o and 13o latitude south of the equator. The passive continental margin represented by the present Brazilian coast developed into its present general form after the final rifting from Africa at 90 Ma (Cesero, Thomaz-Filho, Mizusaki, & Milani, 2000). Over the last 2 Ma of the Quaternary sea level has fluctuated many times by up to 150 m over the narrow (< 50 km) continental shelf. The region is part of the Recôncavo Basin, formed by Lower Cretaceous fault lines (Medeiros, & Ponte, 1981) associated with continental rifting. The bay itself is delimited by fault scarps, overlain with the sediments of fluvial and tidal deltas (Carvalho, 2000). The surrounds of the bay are composed of Jurassic and Cretaceous sedimentary rocks except for a small area, in the city of Salvador, where the pre-Cambrian basement outcrops along the Salvador Fault. On the northern and western shores, as well as in the various islands inside the bay, Lower Cretaceous shale, siltstone and sandstone (Santo Amaro Group) are the most prominent rocks. The present bay was formed by the flooding of the lower valley of the Paraguaçu River and its tributaries from 8000 years ago by rising post-glacial seas. Only after the rate of rise abated in the early to mid-Holocene could present coral reef ecosystems be established, though the cumulative disturbance history over the entire Holocene would set the resilience regime, and which species would survive or re-establish. TSB (Figure 1) is the second largest bay on the Brazilian coast with an area, excluding its 91 islands, of 1223 km2 during high tides and 919 km2 during low tides and with the inner bay perimeter of 1175 km (Santos, Carvalho, & Lessa, 2003). The Bay has an indented aspect with several attenuated islands providing still more shoreline (Figure 1). Itaparica Island is the largest one, delimiting two channels of water exchange with the open ocean: (i) Itaparica Channel, a shallow-depth passageway in the southwest portion and (ii) Salvador Channel, in the east, deeper than the former with an average depth of 25 m – maximum 102 m. The 10 km wide Salvador Channel provides most of the water exchange between the bay and the ocean (Bittencourt, Ferreira, & di Napoli, 1976; Lessa, Dominguez, Bittencourt, & Brichta, 2001). Coral reefs presently occur mainly along the ocean-facing southeastern part of Itaparica Island, and on the marine-influenced shores of Frade and Maré Islands (Araujo, 1985; Laborel, 1969a; Leão, & Brichta, 1996) (Figure 1). Reefs are also present elsewhere adjacent to the Salvador Channel, such as Mangueira reef and Periperi reefs on the eastern shores of the bay (Laborel, 1969a) (Figure 1A). The eastern shore of the channel (Figures 1A and B) was also the location of the initial Portuguese settlement and the earliest intense sugarcane production (Diffie, 1987: 71). The Gaituba reefs and those surrounding the Frade channel, between Maré and Frade Islands are, like all surviving reefs, exposed to the E-SE swell through the ocean entrance (Lessa, Bittencourt, Brichta, & Dominguez, 2000). However, a 1764 chart of the bay (Bellin, 1764) clearly shows extensive coral reefs in the inner, estuarine part of the bay, quite far from the marine influence of the Salvador Channel. Local fishermen report that there may still be remnant coral reefs in this northwestern portion of the bay, near Mêdo Island and northwest of Itaparica Island (Dutra, Kikuchi, & Leão, 2006a), but if so they are mere fragments of the 3 km long reefs shown on the XVIII Century map. Leão (1997) (quoted in Lessa, Bittencourt, Brichta, & Dominguez, 2000) believed that present high levels of water turbidity in the inner (western) bay preclude the existence of living coral. 2.2 Environmental Settings The climate around the Bay is tropical humid, with a ten-year average mean air temperature of 25.3ºC close to Salvador, and a 30 year mean rainfall of about 1900 mm/y (Lessa, Dominguez, Bittencourt, & Brichta, 2001). Three main catchments drain into the TSB conveying an average of 120 m3/s of freshwater into the Bay. However, since 1985 much of the catchment water yield has been held by the Pedra do Cavalo Dam in the Paraguaçu River (Lessa, Dominguez, Bittencourt, & Brichta, 2001) (Figure 1C), thus reducing the amount and discharge variation of freshwater and sediment reaching the bay (Lessa, Bittencourt, Brichta, & Dominguez, 2000), and thus also probably the general level of water turbidity. The seasonal variation of water discharge from the Paraguaçu River exhibits higher outflows concentrated during summer months (maximum of 3,500 m3/s) (Lessa, Dominguez, Bittencourt, & Brichta, 2001). These latitudes are dominated by constant northeasterly and easterly trade winds during the summer and southerly winds in winter (Dominguez, Bittencourt, & Martin, 1992). Hurricanes do not form in the South Atlantic Ocean, and strong seismic disturbance is also rare, so coral resilience in Brazilian waters has not adapted to counter the sharp shocks of these kinds of disturbance (Dominguez, Bittencourt, & Martin, 1992; Leão, 2002). Therefore, local coral reefs are unlikely to have recovery strategies similar to Indo-Pacific and Caribbean assemblages, which are affected by hurricanes/cyclones seasonally and earthquakes intermittently. The relatively low coral diversity of the reefs at TSB, 10 coral species registered in 2003 (Dutra, Kikuchi, & Leão, 2006a), may be a result of this low frequency of acute disturbance (as suggested by the ‘intermediate disturbance hypothesis’ (Connell, 1978)). 3. A resilience framework to analyze Todos os Santos Bay coral reefs A resilience framework is needed to assess the impact of historical socio-cultural events compared to natural events on
Journal of Sustainable Development March, 2008
15
the TSB coral reef ecosystems. But what is meant by ecological, or for that matter socio-cultural, ‘resilience’? Resilience determines the persistence of relationships within a system and is a measure of the ability of these systems to absorb ‘change of state’ variables, and still persist. Ecological resilience (Holling, 1973; Holling, 1996) ‘emphasizes conditions far from any equilibrium steady state, where instabilities can flip a system into another regime of behavior’ (Holling, 1996: 33). Ecological resilience assumes that an ecosystem can exist in alternate self-organized or ‘stable’ states. At each point at which a new organization emerges, the system may branch off into one of a number of possible states. The direction of self-organization will depend on such things as the system’s history; it is path dependent and difficult to predict (Berkes, Colding, & Folke, 2003a: 6). Resilience encompasses the change required to move the ecosystem from being organized around one set of mutually reinforcing structures and processes to another (Peterson, Allen, & Holling, 1998). It is a necessary but usually not a sufficient condition for sustainability (Folke, Colding and Berkes, 2003: 354). In relation to social-ecological systems (SES) - referred to here as the integrated concept of humans-in-nature (Berkes, Colding, & Folke, 2003a: 3) -, resilience is the magnitude of disturbance that can be tolerated before a SES moves to a different state controlled by a different set of processes (Carpenter, Walker, Anderies, & Abel, 2001), as followed the well-known Mayan socio-ecological collapse of the 9th Century. Unlike sustainability, resilience can be desirable or undesirable. For example, system states that decrease social welfare, such as polluted water supplies or dictatorships, can be highly resilient. In contrast, sustainability is an overarching moral goal that includes assumptions or preferences about which system states are desirable (Carpenter, Walker, Anderies, & Abel, 2001). 3.1 Past Disturbance Regimes at Todos os Santos Bay Prior to 1500 AD disturbance mostly took the form of cyclical climatic and sea level shifts, which even though comparatively muted during the Holocene were still probably sufficient to force major adjustments of coral ecosystems. There may also have been some small impact from indigenous subsistence practices (fire stick farming, slash and burn agriculture, shellfish harvesting, etc.), but even though these could have been occasionally devastating (for instance, if a severe El Niño drought coincided with a bout of anthropogenic burning) they would have been limited by a small population producing only for local consumption. Background environmental disturbances must always have influenced coral assemblages. What natural disaster, sea level change or climate cycle might equal or be a proxy for modern human impact? In order to sort out possible past disturbance regimes, Holocene time divisions are outlined below. 3.2 Holocene Disturbance Time Divisions for TSB 3.2.1 20 000 to 8000 years BP With the present ocean entrance to TSB over 100 m deep, and ocean temperatures at latitude 13o S never likely to have fallen below 20o C even in the last Glacial Maximum 20 000 years ago, the ocean could never have been far from the present site of TSB. However, the rapidity of sea level rise up to the early Holocene precludes any stable coral reef ecosystem either on the rapidly changing outer coast or the shores and shallows of the deepening and expanding bay, until it filled to approximately its present level sometime after 8000 BP (Cruz Jr, et al., 2005; Stute, et al., 1995). 3.2.2 8000 to 5000 years BP Coral reef initiation and stabilization occurred during the Holocene climatic optimum. Sea level on the Brazilian coast reached a maximum 5 m above present (Martin, Dominguez and Bittencourt, 2003; Martin, Flexor, Villas-Boas, Bittencourt, & Guimarães, 1979). The rate of reef growth was probably higher than the rate of sea level rise, representing a “catch-up” mode of growth (Leão, Kikuchi, Dutra, & Oliveira, 2006; Leão, Kikuchi, & Testa, 2003). However, rapidly rising sea level would allow minimum shore zone for mangrove development or shore stability; with an early period of destabilizing sedimentation as catchment streams and shorelines adjusted to new and changing base levels. This suggests coral assemblages took some time to stabilize, but it also indicates the strong resilience of most coral species in what must have been frequent minor to major adjustments. 3.2.3 5000 to 3000 years BP El Niño-like events strengthened in the region after 5100 yr BP (Martin, et al., 1993). The El Niño cycle produces large rainfall anomalies and changes in wind patterns, thus affecting sediment transport, salinities and sea surface temperatures, that cause impacts on coral reefs (for more about El-Niño and impacts on coral reefs see Glynn, 1993; Hoegh-Guldberg, 1999; Migotto, 1997). Sea level fluctuated by up to 2.5 m. It dropped from 5m to present sea level at 4 ky BP, quickly rising again from 4 to 3.8 ky BP, lowering again to a 2m about 2 ky BP (Martin, Dominguez, & Bittencourtt, 2003). Reef tops would have endured alternating exposure and inundation, with fluctuating turbidity caused by sedimentation as catchment streams adjusted to new base levels. This again indicates that coral reefs can cope and adapt to considerable natural change and that reef corals were likely to be resilient enough to cope with sea level

Vol. 1, No. 1 Journal of Sustainable Development
16
changes within TSB. 3.2.4 3000 years BP to 1500 years AD This period is characterized by a net lowering of sea level, possibly with less fluctuation than the early period (Baker, Haworth and Flood, 2001), but still impacting on vertical growth of the reef surfaces. Reef growth would be inhibited with a slow and relatively steady sea level fall. Over the last 3 ky, the corals have declined significantly in total cover and colony size, as well as undergoing changes in major reef builder species, from the dominance of Mussismilia braziliensis to more sediment-tolerant species (Kikuchi, 2000; Kikuchi, & Leão, 1998; Leão, Kikuchi, Maia, & Lago, 1997). However, Carvalho (2000) reported more marine-influenced corals present in the landlocked Paraguaçu Channel around 2300 cal years BP, where all corals are now completely absent. The long-term effects of lowering sea level would be to enlarge shorelines and establish fringing mangroves, if the rivers could deliver the sediment. As the ENSO-like systems were deepening at this time, increased sedimentation was likely (Dominguez, Bittencourt, & Martin, 1992), thus testing the limits of coral reef resilience. Indigenous folk began slash and burn horticulture in the region during the mid to late Holocene (McNeill, 1986). Extended shorelines and increased bay island areas would both change natural conditions for the reefs and facilitate human use of bay resources, including coastal reefs. 3.2.5 The last 500 years The limits of ecological resilience have been tested by the events of the last 500 years, following the establishment of an extractive European plantation economy in the region. The process of settlement and development of Brazil since 1500 AD has been characterized by an ongoing destructive exploitation of land and resources (Delson, & Dickenson, 1984). Throughout this period extra-regional forces have driven local ecosystem degradation, namely, Brazil’s changing role in the world economy from a peripheral colonial state to a semi-peripheral industrializing economic giant (Wallerstein, 1974). In the colonial period it was the stripping of local resources to send to the metropolitan power that led to environmental degradation: in the modern (post-1950) period it is the addition of imported materials to create exports for the global market that is powering pollution and degradation. Impacts affecting the coral reefs from 1500 AD are related to policies and practices, which took little account of maintaining local ecological sustainability. The next section discusses in detail the human impacts on TSB over the last 500 years. 4. The historical era and its impacts As a generalization, the extractive economy 1500-1950 would have most affected the inner, enclosed part of the bay, while post-1950 it was the outer bay around the marine channel that was the focus of development disturbance, and consequent fouling of the waters that support the corals. The first detailed description of TSB reefs (Laborel, 1969a) fortunately recorded species composition close to this ‘turning point’. That earlier impacts associated with development disturbance back to the XVI and XVII centuries contributed to the bay degradation and subsequent ecological shifts in the coral fauna is strongly suggested by Hartt’s (1870) recording of a turbidity-intolerant coral species (Favia leptophylla) not noted during surveys inside the bay from 1962 (Laborel, 1969a) or 2003 (Dutra, Kikuchi, & Leão, 2006a), but registered by Araújo (1985) in Itaparica reefs (close to the entrance of the bay Figure 1D). This example strongly suggests that coral reef environments and their resilience have been under pressure since the Portuguese arrived in 1500 AD. The 1870 survey showing contraction in Zone B combined with the 1764 chart, showing now largely absent reefs in Zone C, are likely continuations of a trend from 1500 AD towards a simplified assemblage of turbidity–tolerant species, and away from those waterways most likely to be affected by turbidity, that is, the more land-locked areas of the bay. In this view, Laborel’s 1960s description was a moment in a long-term trend of erosion of coral reef resilience. After Laborel’s description, there was a 40-year gap (Dutra, Kikuchi, & Leão, 2006a), during which time enormous changes in coral reef ecosystems probably had already occurred due to the shift in land use in the bay’s surroundings. Using land use history and its likely enhancement of turbidity as a proxy, coral decline may reasonably be separated into four historical periods: (i) pre 1500; (ii) from 1500 to 1850; (iii) from 1850 to 1950 and; (iv) after 1950 (Table 1). 4.1 Historical Disturbances: From 1500 to 1850 When the Portuguese first arrived in 1500, the Recôncavo was heavily forested (Schwartz, 1985: 77) with only a few indigenous groups practicing agriculture (McNeill, 1986). The introduction of commercial agriculture (Miller, 1997: 147) affected soil through the enlargement of land clearing areas, especially for the establishment of sugarcane plantations, and involved large scale forest clearing for sugarcane and sugar-mill fuel in zones A, B, and C (Miller, 1997: 137). Livestock, cotton and tobacco production followed, and shipbuilding for Portugal’s worldwide navy exacted a further toll on forest resources (Diffie, 1987: 176; McNeill, 1986; Miller, 2003; Morton, 1978; Silva, 1987). In a high rainfall area of steep relief erosion was inevitable, and the waters of TSB carried the sediment burden with its potential to impact the reefs through enhanced turbidity. Evidence from other parts of the European colonial frontier (Gale, & Haworth, 2005; Haworth, Gale, Short, & Heinjes,

Journal of Sustainable Development March, 2008
17
1999) shows that initial clearance and disturbance of new lands usually results in a massive leap in erosion and sedimentation until the easily available sources of sediment are depleted, and a new ecosystem state is established. This condition will last until disturbed by the next wave of development, with early opening of lands for commercial agriculture and later infrastructure development often tapping into different sources of sediment. Thus one would expect a pattern of high magnitude sediment dumps followed by lower and steady state sedimentation over the last 500 years, with the boom and decline of certain agricultural products and resources (see Table 1) reflected in different high sedimentation events. These are the land-based events that are most likely to have affected coral reefs. A 1764 map (Bellin, 1764) indicates coral reef areas in the northwest coast of Itaparica Island (Figure 1D) where they are not present today. Interestingly, this coincides with the date when fierce resistance by the native Americans was finally overcome and the southern area of the Bay (zone D) was opened to land clearing and commercial plantation production already established in the north and east areas (C, B, and A) from the XVI century (Schwartz, 1985: 32). The shock of initial commercial development was apparently of sufficient magnitude to overcome the resilience of inner estuary reefs. The XVIII Century event was indirectly recorded by the mapping of what had been, and we know is now all but gone. It is reasonable to assume that an earlier contraction of coral coverage and assemblage had occurred in the northern part of the bay. As well as geographical shifts in cultivation around the Bay over five centuries, each change in demand and fashion of the world market led to a boom or decline of a given product, with knock-on effects to resource extraction and depletion that through erosion and sedimentation would eventually manifest themselves in reef degradation and change. The natural resources of the bay, exemplified in healthy ecosystems such as coral reefs, allowed the local peoples to survive these boom-bust cycles. However, the erratic and predatory nature of the plantation economy appears to have been gradually undermining the resilience of these resources: benefits were mostly transferred overseas, while land and water degradation problems were left for the locals to negotiate. 4.2 Historical Disturbances: From 1850 to 1950 The economic development of Bahia state had stagnated by 1872 (Furtado, 1963: 104), with the rate of growth dropping to zero, with abandoned land haphazardly exploited in a new pattern by subsistence farmers, who also depended heavily on marine resources. Hartt (1870) provides an example of changes in coral communities for this period. He describes the presence of a coral species (Favia leptophylla) in the fringing reefs of Itaparica Island not present in the later surveys (Dutra, Kikuchi, & Leão, 2006a; Laborel, 1969a). Hartt (1870) also registered mining on the coral reefs of the seaward side of Itaparica Island, with coral burned to produce lime. However, coral mining had started at least by the second half of the XVI century, when Soares de Souza (quoted in Miller, 1997: 152) mentioned “three lime producers on the Island of Itaparica where quarried chunks of limestone [probably from Itaparica reefs] were placed in vaulted kilns and pulverized by the heat from large wood fires burning day and night”. Laborel (1969a) suggested that such exploitation had contributed to the degradation of Itaparica reefs. Salvador’s economic development stagnated during the first four decades of the twentieth century, though the city remained a commercial entrepôt for the region. New economic activity with far reaching effects on Bay ecology started in 1939, when oil was found within the city limits of Salvador in the surrounds of Tainheiros cove. By 1941, four Bahian wells were producing 230 barrels a day (Herold, 2004). Major disturbances and impacts on coral reefs are indicated in Table 1. 4.3 Historical Disturbances: From 1950 to the Present Economic growth within the Recôncavo region driven by oil production greatly increased industrial and domestic runoff into the bay. A cement plant constructed in 1954 in Zone A increased muddy sediment supply to TSB. Marine carbonate deposits within TSB were exploited and processed in this cement plant. The muddy residue waste dumped in the bay increased water turbidity (Dutra, Kikuchi, & Leão, 2006a). The 1960s were the most intense industrialization period in the Recôncavo. The landscape changed from predominantly agricultural to industrial in Zone A (Herold, 2004). Around 200 industries were established in the region, including metallurgic, textile, and chemical plants (Wasserman, & Queiroz, 2004). Paredes et al. (1995) argue that environmental quality at TSB was aggravated during the decade between 1982-1992, particularly on the estuarine waters of Subaé River on Zone B, where all concentrations of heavy metals sharply increased in sediment. Heavy metal concentrations in some areas of TSB exceeded permissible concentrations. A successful industrial economy meant contamination of the TSB waters. Population growth (Table 2), associated with industrial development, added to the degradation of the bay (Wasserman, & Queiroz, 2004). More sediment and sewage were discharged into runoff entering the bay waters. There was also an increase in fishing pressure, including the use of illegal practices, such as dynamite fishing (Dutra, Kikuchi, & Leão, 2006a). Uncontrolled ornamental fish collection helped to decrease reef stocks and reef habitats (Rosa, Sampaio, & Barros, 2006). Increased ship traffic resulted in ships running aground on the coral reefs (the last one recorded in TSB

Vol. 1, No. 1 Journal of Sustainable Development
18
in 1998). In addition, alien species were accidentally introduced into TSB waters competing with native species with the potential to impact marine biodiversity (Sampaio, & Rosa, 2006). The growth of Salvador city, in 2000 with around 2.4 million inhabitants (Table 2) (IBGE, 2006), required the construction of the Pedra do Cavalo Dam in 1985, 20 km upstream from the estuary on the Paraguaçu River (Paredes, et al., 1995) (Zone C), which debouches on the west side of TSB. This marked a change of continuous low-level of stormwater inwash and sedimentation by random urban development disturbance, as opposed to the previous regime of high-magnitude freshwater floods and sedimentation in the wet season to high-saline low-sedimentation in the drier season. This interacted with the industrial changes of the previous decades to create a qualitatively new marine turbidity environment that the corals have to cope with, and almost certainly presage marked changes in the coral fauna and assemblages in the immediate future. We argue that changes in TSB waters, as a result of land clearing, which increased sediment levels of runoff (from 1500 to 1950) likely affected coral communities through ecological shifts. The period from 1950 to 2006 is characterized by stronger urban population growth and industrial development. This expressed itself as greatly increased nearfield disturbance of the coral reef areas with a countervailing decrease of farfield sources of sedimentation by river damming. A countervailing force is explicit state policies aimed at improving water quality in the Bay, but which have not yet had time to take effect. 5. Discussion of resilience prospects of TSB reefs The new conformation assumed by coral reefs after a disturbance will depend on several factors, including: (i) connectivity through larvae supply from non-impacted reefs (Roberts, 1997); (ii) ecological relationships (predation, competition) within the reef; and (iii) water quality. These are influenced by the development and growth occurring in Recôncavo lands. Regional industrial growth has come at the expense of environmental damage through habitat destruction impacting traditional communities that depend on extraction of natural resources from the Bay. If this pressure exceeds certain environmental limits it risks irreversible decline of regional ecosystems (van den Bergh, 1995), damaging social-ecological resilience. Typically, components of resilience are allowed to decline or are deliberately eliminated because their importance is not appreciated until a crisis occurs. Human-sourced degradation of coral reefs increases vulnerability to natural impacts, such as storms. Instead of absorbing recurrent disturbances as they have done for millennia, many overfished and polluted reefs undergo radical regime shifts. Coral populations may fail to rebuild after external shocks and instead are replaced by other ecological states (Adger, Hughes, Folke, Carpenter, & Rockström, 2005). These authors suggest that re-building resilience - by improving water quality and maintaining adequate stocks of herbivores (fish, sea urchins) - can promote the regenerative capacity of corals to recurrent disturbances. The intensity and pattern of human-induced disturbances on the ecological states of TSB coral reefs present an unprecedented test of their resilience. 5.1 Coral Reef Resilience After 1950 Dutra, Kikuchi, & Leão (2006a) indicated that in most reefs surveyed at TSB in 2003, filamentous algae dominated reef tops. Filamentous algal turfs are typically the first macroscopic colonists of reef substrata after storms, bleaching events and anthropogenic perturbations (Witman, 1992). However, the persistence of corals or algae is dependent on external factors that may favor the development of a coral-dominant or algae-dominant state. Vulnerability (the opposite of resilience) can be high, as a consequence of human-induced impacts, such as herbivorous overfishing, and/or by die-offs of other herbivorous groups (Hughes, 1994) and runoff pollutants affecting the corals (Table 1). Although the Brazilian coral fauna developed in the context of turbid waters (Laborel, 1969a, 1969b; Leão, 1982), there is strong evidence indicating that threshold levels of blanketing turbidity have been reached for reef corals, with consequent decline of coral reef resilience. The difference between the 1962 and 2003 surveys is mainly in the disappearance of coral species that are least resistant to water turbidity and sedimentation (Dutra, Kikuchi, & Leão, 2006a) (Table 3). Disturbance changes that have occurred in the landscape since Portuguese settlement and until 1950 in the Recôncavo were all along the lines of increasing sedimentation and turbidity, but in a more piecemeal fashion than post-1950, so that damage to one area could be repaired by larvae from elsewhere in the Bay. The changes since 1950 have been those of both degree, and following the damming of the river and industrialization of the eastern shore, changes of kind. 5.2 Geological Evolution of TSB Reefs Analyzed Through a Resilience Perspective During the last 8000 years of geological evolution of coral reefs at TSB, three different coral reef states – in relation to dominance and size of coral colonies – can be identified (Table 4). Data from Dutra, Kikuchi, & Leão (2006a), Kikuchi, & Leão (1998), Leão, & Kikuchi (1999), Leão, Kikuchi, Dutra, & Oliveira (2006) and Leão, Kikuchi, Maia, & Lago (1997) were used in this analysis.

Journal of Sustainable Development March, 2008
19
In the first phase of reef development, throughout the first transgressive phase of the sea level (from 8 to 5 ky BP), large and widespread colonies of Mussismilia braziliensis were the main reef builders. This situation is found in present coral reefs located 70 km off the south coast of Bahia in Abrolhos reefs (Kikuchi, et al., 2003). A second (regressive) phase (after 5ky BP) is characterized by increase in turbidity and sedimentation – and its damage to reef corals (for more on deleterious impacts of sedimentation and turbidity in reef corals see Abdel-Salam, & Porter, 1988; Dutra, Kikuchi, & Leão, 2006b; Rogers, 1990; Te, 1992; Woolfe, & Larcombe, 1999), associated with a falling sea level and consequently a probable reworking of newly exposed littoral sediments, which approached coral reefs to shorelines favoring an ecological state constituted by small colonies of M. braziliensis and changes in the dominant reef coral species. A third phase occurred sometime between 1962 and 2003, characterized by the absence of M. braziliensis within the bay and changes in species composition, which favored the species most adaptable to high sedimentation and turbidity (Table 4). Changes in coral communities from 1500 AD were an indirect result of an extractive economy stripping the land and speeding sediment transport to the bay: changes after 1950 were a result of pollution inputs often from far away to a new industrializing economy, and in the case of the dam a starving of previous sediment and fresh water transport. 6. Current Management Practices at Todos os Santos Bay Much of natural resource management has been an effort to control nature in order to harvest its products, reduce its threats, and establish highly predictable outcomes for the short-term benefit of humanity (Holling, & Meffe, 1996). For Berkes, Colding, & Folke (2003a: 15) a resilient social-ecological system is synonymous with ecological, economic, and social sustainability: human aspirations are thwarted if the commons of land, air and water are debased and depleted. Any system with low resilience has limited sustainability; it may not survive for long without flipping into another state. This approach to solving problems may be collectively referred to as “command-and-control” (Holling, & Meffe, 1996). The command-and-control approach implicitly assumes that the problem is well bounded, clearly defined, relatively simple, and generally linear with respect to cause and effect. But when these same methods of control are applied to a complex, nonlinear, and poorly understood natural world (such as the coral reefs and catchments of TSB), and when the same predictable outcomes are expected but rarely obtained, severe ecological, social, and economic repercussions may result. These repercussions have occurred since the arrival of the colonial economy. The combined impact of 500 years of exploitative development saw the decline of local coral reefs. By the middle of the XX Century, after the long decline of the colonial plantation economy, an increased national emphasis on industrialization resulted in widespread industrial activity, increased shipping, and urban expansion along the eastern shoreline of the bay. This was also where earlier Portuguese plantation production had been most intense and, coincidentally, the most important coral reef area. After about 1950, industrial pollution, urban contaminants (e.g., untreated sewage), ship traffic, overfishing (with the use of wasteful and destructive fishing practices), in association with the already high levels of sedimentation of TSB waters contributed to a shift in coral species composition of TSB reefs (see Figure 1; Table 3). In the last 25 years government policies have recognized the damage done and attempts have been made at legislative control and planning for sustainability (see Federal Act 6902 from 27/04/1981(Editora Saraiva, 2006)). Well meaning laws and regulations, however, are often frustrated by sectional interests who can export the costs of their operations to others in the form of environmental degradation, and an insufficient public understanding that individual well-being is dependent on clean air and water as well as narrow economic development. There are three main issues concerning the conflict between urban development in the Recôncavo and the environmental impacts affecting the reefs (van den Bergh, 1995): (i) by exporting pollution, or importing natural resource materials, regions may develop quickly but at the cost of extra-regional environments; (ii) extra-regional support of development and growth may push a local economy beyond certain regional environmental limits, at the risk of irreversible destruction of the area’s ecosystems; and (iii) the risk may become more serious when factors outside the region strongly push internal growth 7. The role of adaptive management at Todos os Santos Bay ACM contrasts sharply to current natural resource and environmental management applied at TSB, where nature was (and maybe still is) seen as a trove of latent commodities awaiting harvest. From what was described in section 4, environmental stability and resource permanence were vaunted management goals. Uncertainty, disorder, and unpredictability - elements naturally and inevitably present throughout the Holocene - were anathemas. During the historical era, policy-makers and managers had little appreciation of chaos or the dynamic uncertainties of nature. Ecosystem services were segmented and defined in anthropocentric terms (Schelhas, Buck, & Geisler, 2001: xx). Adaptive collaborative management is an approach to understanding, justifying, and implementing policies that affect the environment (Norton, 2005: 92). It is a management strategy where the ideas of both natural resource managers and local communities are put together and used in experimental fashion. It includes community learning and intentionality in participation based on knowledge (academic, practical, traditional) and explicit assumptions. With this method all
Vol. 1, No. 1 Journal of Sustainable Development
20
approaches are valid for natural resources managers if they contain the following three key tenets (Norton, 2005: 92): 1). Experimentalism. Adaptive management emphasizes experimentalism, taking action capable of reducing uncertainty in the future: The method used by adaptive managers is a commitment to using experience to reduce uncertainty and to adjust goals and commitments. Experimentalism implies that nothing should be taken for granted and that wherever possible assumptions should be replaced with beliefs based on experimentation and careful observation. Goals and objectives set for policy, as well as physical models, should be open to amendment. The very goal of sustainable living is a moving, changing target, to be defined as part of a process as more experience pours in. 2). Multi-scalar analysis. Adaptive managers understand, model, and monitor natural systems on multiple scales of space and time: One important aspect of this second characteristic is a commitment to open systems, to understanding nature and the environment as a complex and multi-scalar interaction of parts. Since the parts change at different rates, multi-scalar understanding introduces the possibility of emergent qualities, qualities of larger wholes that cannot be understood as the sum of actions of parts. This second characteristic allows us to interpret impacts that emerge on different scales in terms of a single, integrated model and allows the integration of models over multiple levels. 3). Place sensitivity. Adaptive managers adopt local places, understood as humanly occupied geographic places, as the perspective which multi-scalar management orients. The third characteristic of adaptive management is localism, a commitment to examine each problem in its particular context and to pay attention to differences that matter in a “place”. Environmental management as community adaptation to a “place” is thus locally based. This is not to say, of course, that regional and global systems never impact local systems - but rather to say that the survival of the community takes place against the back-drop of changing systems on many scales, as these are viewed from the perspective of the local community. These complex, interlocking dynamics must be understood from a specific, local place, from a given perspective within a multi-scalar system. Based on these tenets, ACM is seen as a strategy that: (a) proceeds in a learning process mode rather than according to a universal a priori blue print; (b) considers errors, mistakes, and failures not in normative terms but as normal occurrences resulting from policy experiments; (c) engages both local and non-local stakeholders in a participatory process of goal setting, planning, management experimentation, and evaluation; and (d) utilizes a variety of methods to generate knowledge that keeps pace with ecosystem change resulting naturally or from expanding human activity (Schelhas, Buck, & Geisler, 2001: xix). Building coral reef resilience at TSB requires the maintenance of crucial ecosystem elements outside the marine habitat, such as the soil. It is unlikely that resilience will be achieved through traditional approaches, such as command-and-control. The complex relationships between humans and nature require adaptive management practices that are inclusive and flexible, able to deal with uncertainty and surprise (Berkes, Colding, & Folke, 2003a). ACM seems to be the most suitable strategy to foster coral reef resilience at TSB because it seeks to accommodate the power of both science and lay knowledge for building management models, testing them, learning from them, and - ultimately - applying them to conservation and sustainable development (Schelhas, Buck, & Geisler, 2001: xx). 8. What resilience represents for sustainable coral reef management at Todos os Santos Bay? Given that change to coral reef systems at Todos os Santos Bay has accelerated in both degree and kind, what may be options for managing social-ecological resilience? Coral reefs are highly productive hotspots of biodiversity that in TSB have supported traditional low-key fishing and gathering. Their protection, therefore, is a socio-economic, as well as an environmental imperative (Hughes, et al., 2003). Managing coral reef resilience at TSB requires a complex view that the ‘normal’ state of nature is not one of balance and repose but the one to be recovering from the last impact (Urry, 2005). If the ecosystem is resilient enough, changes will occur but ecological services will still be provided. Coral reefs have complex marine environments where relevant scales in time and space are many and varied (see Hughes, 1994; Hughes, Ayre, & Connell, 1992; Hughes, et al., 2003; Hughes, Bellwood, Folke, Steneck, & Wilson, 2005; McManus, & Polsenberg, 2004; Wood, 1998; Wood, 2001). Coral reef management must account for their wise use, and the social and cultural values of local and traditional people (Fernandes, Ridgley, & van't Hof, 1999). The reestablishment of an individual coral reef will depend on a matrix of reefs in the surrounding seascape and in their resilience (Nyström, & Folke, 2001), as well as on the resilience of related ecosystems, such as riparian forests, wetlands and mangroves. It means that reefs and other ecological areas must be connected through a network of protected areas (PA) (Bellwood, Hughes, & Nyström, 2004; Hughes, et al., 2003; Hughes, Bellwood, Folke, Steneck, & Wilson, 2005). TSB is part of the Bahian PA network subjected to State regulations (Bahia State Act 7595 in Constituição do Estado da Bahia, 2005). The coast of Bahia includes a network of PAs covering coral reefs, mangroves, and rainforests from north to south with limited functionality, however. In addition there is the Abrolhos Marine National Park, a federal PA in the south of the state, created by the Federal Act 88218 from 6/4/1983 (Editora Saraiva, 2006). Legislation must be enforced and PAs have to be strongly linked because connectivity promotes resilience

Journal of Sustainable Development March, 2008
21
(2003). Coral reefs have large extensions, they are dependent on decisions taken elsewhere and thus their conservation and sustainable use requires an effective landscape-seascape perspective. In relation to dynamite fishing, along the coast of the state of Bahia all reefs are protected by the Bahia State Act 215 Chapter VIII (Constituição do Estado da Bahia, 2005) as areas of permanent protection. However, Leão, Kikuchi, & Testa (2003) argue that legislation enforcement is not yet effective, which still allows widespread use of destructive techniques at TSB coral reefs. The aim is to make legislation effective by creating the moral climate where such practices are abhorrent to the general consensus. The creation of PAs without incorporating local communities’ needs and visions reinforce the thesis that legislative attempts will not be effective unless their ethical underpinning is accepted by the affected human communities. If PAs are to be created within TSB and other parts of the Bahia state, they should encompass alternatives (ecotourism jobs, sustainable resource exploration) with local communities. PAs to be effective should provide not only ecological benefits, but social and economic as well. Berkes, Colding, & Folke (2003a: 15) emphasize that in operationalizing resilience, managing for sustainability in socio-economic system means not pushing the system to its limits but maintaining diversity and variability, leaving some slack and flexibility. For Berkes, Colding, & Folke it also means learning how to enhance adaptability, and understanding when and where it is possible to intervene in management. ‘Soft’ management approaches are preferable to ‘hard’ management involving quantitative targets. ‘Hard’ management tends to be incomplete or even misleading in the management of the ecosystems of the world. Alternatives to manage reef resilience preclude command-and-control approaches (Hughes, Bellwood, Folke, Steneck, & Wilson, 2005). Instead, reef resilience management requires an ability to detect and react to social-ecological-economic feedbacks (Berkes, Colding, & Folke, 2003b). Hughes, Bellwood, Folke, Steneck, & Wilson (2005) state that currently, feedbacks from damaged ecosystems are often masked by selling off natural capital to maintain short-term incomes (i.e. by mining resources until they become economically unviable), a common approach since the XVI Century at TSB. These economic substitutions through serial depletion of resources temporally or spatially also masked reef ecological decline. It is more than likely that the first deteriorations in coral reefs (reduced coral cover and fisheries, for instance) were masked by the economic growth associated to logging, sugar and other crops. Schwartz (1985: 82) reports some areas within TSB were already over-fished by the second half of the XVI Century. Hughes, Bellwood, Folke, Steneck, & Wilson (2005) proposed that successful approaches to SES management require four attributes: embracing uncertainty and change, building knowledge and understanding of resource and ecosystem dynamics, developing management practices that measure, interpret and respond to ecological feedback and supporting flexible institutions and social networks in multi-level governance systems. An alternative to cope with unpredictability is to actively engage stakeholders through bottom-up strategies. Meppem, & Gill’s (1998) alternative is to develop a process to better understand the socio-cultural context of the environmental and economic information and judgment underlying development scenarios. In this approach, the task of planners and managers is to catalyze bottom-up solutions. Policy makers should facilitate learning and seek leverage points with which to direct progress towards integrated economic, ecological and socio-cultural approaches for all human activity. An important issue is public awareness about the state of TSB. In order to engage interested parties in active management participation, inhabitants of the Recôncavo area and Salvador must be made aware of depletion or improvements of the social, ecological and economic states around the Bay. Identity and sense of place are complex concepts, considered to be linked to practical activities of people, people's perceptions of an ecosystem, and the relational networks that people build within an ecosystem (Davidson-Hunt, & Berkes, 2003: 73). An example of an approach within the ACM framework is provided by Dutra (2007). He described a detailed methodology to deal with the management of coral reef resilience in a fishing village in East-Timor. His methodology included methods from ‘Organizational Learning’ (OL), a term borrowed from the business literature, which involves the detection and correction of errors in business organizations (Argyris, & Schön 1978: 2-3). Systems Thinking provides the context to use OL methods, such as Systems Dynamics (SD) modeling and conversation-based collaborative processes, which emphasizes that the activity of conversation itself is the key process through which forms of organizing are dynamically sustained and changed (Shaw, 2002: 10). The use of SD was useful for testing policies in models that integrated ecological, socio-cultural and economic concerns. Overall, a public awareness campaign and an argument for jobs in tourism and environmental protection are good alternatives. However it must be a diffuse solution and should encompass the collaboration of a diverse set of actors operating at different socio-economic and ecological scales. The chronic disturbance factors are diffuse, so it must be a ‘whole of catchment’, ‘whole of Bay’ and ‘whole of society’ solution - a sense of local ownership and stewardship for the locals, and 'wise use' conservation ethic everywhere and informing government policies. One hopeful sign,

Vol. 1, No. 1 Journal of Sustainable Development
22
paradoxically, may be the large and increasingly diverse population. While raw population growth has caused many of the problems, nonetheless the evolving community is not just a small group of resource exploiters far from the public eye, but also the increasingly sophisticated and aware citizens of a rapidly industrializing nation. The last few decades have seen the great cities of the world cleaned up from rabid and extreme pollution (whales sighted in the River Thames) - as Brazil takes its place as a leading nation of the world, there is no reason why national pride cannot be channeled to effect an environmental improvement, just as it has elsewhere in the developed world. 9. Conclusions The process of settlement and development in Salvador and the Recôncavo since 1500 AD has been characterized by destructive exploitation of land and natural resources. Such deleterious practices have operated over the five centuries since the arrival of the Portuguese. The ‘cultural landscapes’, which have evolved over that time with the growth of farms, sugar mills, towns, and industries are not merely the products of such negative processes, but are at least in part the consequences of deliberate strategies by central authorities seeking to shape the path of development (Delson, & Dickenson, 1984). As in other parts of the world industry has treated the environment at TSB as provider of resources and a recipient for residues from production and consumption. This attitude has caused widespread environmental destruction and contamination of air, water and soil (Gutberlet, 2005), impacting communities and the environment at the same time. The consequences of different phases of development have impacted the coral reefs since 1500. It is more than likely that reefs at TSB changed their ecological composition several times between 6000 BP (the Holocene highstand) and 1500 AD as a result of climatic and/or sea level cycles, and maybe shifted as many times in the last 500 years from anthropogenic impacts. The changes of the last 50 years, and what threatens in the next few decades, could well lead to a radical loss of ecological resilience, causing impacts in the social ecological system, i.e. when the state of the ecosystem is so altered that can be irreversible (Holling, Schindler, Walker, & Roughgarden, 1995; Moberg, & Folke, 1999). There is little likelihood that reef recovery to pre-1500 states will take place. However, changes in coral reef ecological conditions will be achieved only if water quality is improved within the Recôncavo area and its catchments, which would also be of immense benefit to the burgeoning human population of the state and their legitimate aspirations for a clean environment. This will be possible only with the inclusion of socio-cultural, economic and ecological interests in one framework, for management, governance and policy-making purposes. Adaptive collaborative management provides the best framework to incorporate these interests. The loss of social-ecological resilience is affecting the capacity for renewal of coral reefs and thereby the quality and quantity of their delivery of ecological goods and services. Coral reefs in the context of the Brazilian economy are passive receivers of decisions taken elsewhere. Their ecological resilience faces an unprecedented challenge from human disturbance in Todos os Santos Bay: only human intervention and management based on a whole landscape-seascape perspective (Moberg, & Folke, 1999) can ensure their survival by policies where sustainable ecological and socio-economic health is promoted together. Acknowledgments The authors would like to thank Dr Zelinda MAN Leão (Geosciences Institute of the Federal University of Bahia) for revising this manuscript and Dr Guilherme C. Lessa (Geosciences Institute of the Federal University of Bahia) with the help to find relevant references about TSB. We are in debt with Mr Julio Cesar Marques (Sea View PADI Dive Centre) for his valuable comments and knowledge about TSB coral reefs. We also would like to acknowledge the staff and research personnel of the Centre for Ecological Economics and Water Policy Research (University of New England): Dr Roderic Gill, Mr Michael Drielsma, Mr Stephen Marchant, Mr M. Nazrul Islam, Dr Michael Evans, Mr David Essaw, Mr Michael O’Loughlin, and Ms Manuela Taboada for the discussions around the topic of resilience and adaptive collaborative management. References Abdel-Salam, H. A., & Porter, J. W. (1988). Physiological effects of sediment rejection on photosynthesis and respiration in three Caribbean reef corals. Paper presented at the 6th International Coral Reef Symposium, Australia. Adger, W. N., Hughes, T. P., Folke, C., Carpenter, S. R., & Rockström, J. (2005). Social-ecological resilience to coastal disasters. Science, 309(5737), 1036-1039. Araujo, T. M. F. (1985). Morfologia, composição, sedimentologia e história evolutiva do recife de coral da ilha de Itaparica, Bahia. Unpublished MSc thesis, Universidade Federal da Bahia, Salvador. Argyris, C., & Schön, D. A. (1978). Organizational learning: a theory of action perspective. Sydney: Addison-Wesley Publishing Company.
Journal of Sustainable Development March, 2008
23
Bak, R. P. M., & Elgerhuizen, J. H. B. W. (1976). Patterns of oil-sediment rejection in corals. Marine Biology, 37, 105-113. Baker, R. G. V., Haworth, R. J., & Flood, P. G. (2001). Warmer or cooler late Holocene marine palaeoenvironments?: interpreting southeast Australian and Brazilian sea-level changes using fixed biological indicators and their O-18 composition. Palaeogeography, Palaeoclimatology, Palaeoecology, 168(3-4), 249-272. Bellin, J. N. (Cartographer). (1764). Carte de la Baye de Tous les Saints a la Coste du Bresil. In: Le Petit Atlas Maritime : recueil de cartes et plans des quatre parties du monde / J. N. Bellin. - [Paris : S. Bellin, 1764]. - Vol. II, [mapa] nº 52. Bellwood, D. R., Hughes, T. P., & Nyström, M. (2004). Confronting the coral reef crisis. Nature, 429(6994), 827-833. Berkes, F., Colding, J., & Folke, C. (2003a). Introduction. In F. Berkes, J. Colding & C. Folke (Eds.), Navigating Social-Ecological Systems: building resilience for complexity and change (pp. 1-32). Cambridge: Cambridge University Press. Berkes, F., Colding, J., & Folke, C. (Eds.). (2003b). Navigating Social-Ecological Systems: building resilience for complexity and change. Cambridge: Cambridge University Press. Bittencourt, A. C. S. P., Ferreira, Y. A., & di Napoli, E. (1976). Alguns aspectos da sedimentação na Baía de Todos os Santos, Bahia. Revista Brasileira de Geociências, 6, 246-263. Carpenter, S., Walker, B., Anderies, J. M., & Abel, N. (2001). From metaphor to measurement: resilience of what to what? Ecosystems, 4, 765-781. Carvalho, J. B. (2000). Caracterização Morfoestratigráfica do Preenchimento Sedimentar da Baía de Iguape, Bahia: influência das variações eustáticas do nível no mar e atividades tectônicas recentes. Unpublished MSc Thesis, Universidade Federal da Bahia, Salvador. Cesero, P., Thomaz-Filho, A. T., Mizusaki, A. M. P., & Milani, E. J. (2000). Rifting and magmatism associated with the South America and Africa breakup Revista Brasileira de Geociências, 30(1), 17-19. Connell, J. H. (1978). Diversity in tropical rain forests and coral reefs. Science, 199, 1302-1310. Constituição do Estado da Bahia. (2005). Constituição do Estado da Bahia - Promulgada em 05 de outubro de 1989. Atualizada e acompanhada dos textos das Emendas Constitucionais nos: 01, de 05 de julho de 1990; 02, de 12 de junho de 1991; 03, de 02 de dezembro de 1991; 04, de 03 de junho de 1994; 05, de 06 de setembro de 1994; 06, de 27 de setembro de 1995; 07, de 18 de janeiro de 1999; 08, de 20 de dezembro de 2000; 09, de 28 de maio de 2003 e 10, de 24 de julho de 2003. Salvador. Cruz Jr, F. W., Burns, S. J., Karmann, I., Sharp, W. D., Vuille, M., Cardoso, A. O., et al. (2005). Insolation-driven changes in atmospheric circulation over the past 116,000 years in subtropical Brazil. Nature, 434, 63-66. Davidson-Hunt, I. J., & Berkes, F. (2003). Nature and society through the lens of resilience: toward a human-in-ecosystem perspective. In F. Berkes, J. Colding & C. Folke (Eds.), Navigating Social-Ecological Systems: building resilience for complexity and change (pp. 53-82). Cambridge: Cambridge University Press. Delson, R. M., & Dickenson, J. P. (1984). Perspectives on landscape change in Brazil. Journal of Latin American Studies, 16(1), 101-125. Diffie, B. W. (1987). A history of colonial Brazil: 1500-1792. Malabar, Florida: Robert E. Krieger Publishing Company. Dominguez, J. M. L., Bittencourt, A. C. S. P., & Martin, L. (1992). Controls of Quaternary coastal evolution of the east-northeastern coast of Brazil: roles of sea-level history, trade winds and climate. Sedimentary Geology, 80, 213-232. Dutra, L. X. C. (2007). An integrated methodology for the management of coral reef systems: a Beloi (East-Timor) case study. Unpublished PhD, University of New England, Armidale. Dutra, L. X. C., Kikuchi, R. K. P., & Leão, Z. M. A. N. (2006a). Todos os Santos Bay coral reefs, Eastern Brazil, revisited after 40 years. Paper presented at the 10th International Coral Reef Symposium, Okinawa. Dutra, L. X. C., Kikuchi, R. K. P., & Leão, Z. M. A. N. (2006b). Effects of sediment accumulation on reef corals from Abrolhos, Bahia, Brazil. Journal of Coastal Research, SI 39, 633-638. Editora Saraiva. (2006). Código Civil e Constituição Federal (57 ed.). São Paulo: Editora Saraiva. Fernandes, L., Ridgley, M. A., & van't Hof, T. (1999). Multiple criteria analysis integrates economic, ecological and social objectives for coral reef managers. Coral Reefs, 18, 393-402. Folke, C., Colding, J., & Berkes, F. (2003). Synthesis: building resilience and adaptive capacity in social-ecological systems. In F. Berkes, J. Colding & C. Folke (Eds.), Navigating Social-Ecological Systems: building resilience for

Vol. 1, No. 1 Journal of Sustainable Development
24
complexity and change (pp. 352-387). Cambridge: Cambridge University Press. Furtado, C. (1963). The economic growth of Brazil: a survey from colonial to modern times (R. W. Aguiar & E. C. Drysdale, Trans.). Berkeley and Los Angeles: University of California Press. Gale, S. J., & Haworth, R. J. (2005). Catchment-wide soil loss from pre-agricultural times to the present: transport- and supply-limitation of erosion. Geomorphology, 68(3-4), 314-333. Glynn, P. W. (1993). Coral reef bleaching: ecological perspectives. Coral Reefs, 12, 1-17. Gutberlet, J. (2005). The impacts of industrial development in Brazil. In Regional Sustainable Development Review: Brazil, from Encyclopedia of Life Support Systems (EOLSS), Developed under the Auspices of the UNESCO. Retrieved July 2nd, 2005, from http://www.eolss.net Guzmán, H. M., & Guevara, C. A. (1998). Arrecifes coralinos de Bocas del toro, Panama: I. Distribucion, estructura y estado de conservacion de los arrecifes continentales de la Laguna Chiriqui y la Bahia Almirante. Revista de Biologia Tropical, 46(3), 601-623. Hartt, C. F. (1870). Geology and Physical Geography of Brazil: Scientific results of a journey to Brazil by Louis Agassiz. Boston: Fields Osgood & Co. Haworth, R. J., Gale, S. J., Short, S., & Heinjes, H. (1999). Land use and lake sedimentation on the New England Tablelands of New South Wales, Australia. Australian Geographer, 30, 51-74. Herold, M. W. (2004). Between sugar and petroleum: Bahia and Salvador, 1920–1960. Revista Espaço Acadêmico, 42([online]: http://www.espacoacademico.com.br/042/42cherold.htm). Hetzel, B., & Castro, C. B. (1994). Corais do sul da Bahia. Rio de Janeiro: Editora Nova Fronteira. Hoegh-Guldberg, O. (1999). Climate change, coral bleaching and the future of the world's coral reefs. Marine and Freshwater Research, 50(8), 839-866. Holling, C. S. (1973). Resilience and stability of ecological systems. Annual Review of Ecology and Systematics, 4, 1-23. Holling, C. S. (Ed.). (1978). Adaptive environmental assessment and management. Chichester, New York, Brisbane, Toronto: International Institute for Applied Systems Analysis. Holling, C. S., Schindler, D. W., Walker, B. W., & Roughgarden, J. (1995). Chapter 2: Biodiversity in the function of ecosystems: an ecological synthesis. In C. Perrings, K. G. Mäler, C. Folke, C. S. Holling & B. O. Jansson (Eds.), Biodiversity loss: economic and ecological issues (pp. 44-83). Cambridge: Cambridge University Press. Holling, C. S. (1996). Engineering resilience versus ecological resilience. In P. C. Schulze (Ed.), Engineering within ecological constraints (pp. 31-44). Washington, D.C.: National Academy of Engineering. Holling, C. S., & Gunderson, L. H. (2002). Chapter 2: Resilience and adaptive cycles. In L. H. Gunderson & C. S. Holling (Eds.), Panarchy: Understanding transformations in human and natural systems (pp. 25-62). Washington, DC: Island Press. Holling, C. S., & Meffe, G. K. (1996). Command and control and the pathology of natural resource management. Conservation Biology, 10(2), 328-337. Hughes, T. P. (1994). Catastrophes, phase shifts, and large-scale degradation of a Caribbean coral reef. Science, 265(5178), 1547-1551. Hughes, T. P., Ayre, D., & Connell, J. H. (1992). The evolutionary ecology of corals. Trends in Ecology and Evolution, 7, 292-295. Hughes, T. P., Baird, A. H., Bellwood, D. R., Card, M., Connolly, S. R., Folke, C., et al. (2003). Climate Change, human impacts, and the resilience of coral reefs. Science, 301, 929-933. Hughes, T. P., Bellwood, D. R., Folke, C., Steneck, R. S., & Wilson, J. W. (2005). New paradigms for supporting the resilience of marine ecosystems. Trends in Ecology and Evolution, 20(7), 380-386. IBGE. (2006). IBGE Cidades [Online] Available: http://www.ibge.org.br (March 27, 2006) Kikuchi, R. K. P. (2000). Evolução dos recifes e das comunidades de corais hermatípicos da plataforma continental norte da Bahia durante o Holoceno. Unpublished PhD Thesis, Universidade Federal da Bahia, Salvador. Kikuchi, R. K. P., & Leão, Z. M. A. N. (1998). The effects of sea level fluctuation on reef development and coral community structure, Northern Bahia, Brazil. Anais da Academia Brasileira de Ciências, 70(2), 159-171. Kikuchi, R. K. P., Leão, Z. M. A. N., Testa, V., Dutra, L. X. C., Sampaio, C. L. S., Spanó, S., et al. (2003). AGRRA indicators of Abrolhos reefs, Eastern Brazil (Part 1: stony corals and algae). In J. C. Lang (Ed.), Atoll Research Bulletin

Journal of Sustainable Development March, 2008
25
(Vol. 496, pp. 172-187). Washington, D.C.: National Museum of Natural History, Smithsonian Institution. Laborel, J. (1969a). Les peuplement de madreporaires des côtes tropicales du Brésil. Annales de l'Université d'Abidjan, Serie E- II(fascicule 3), 260. Laborel, J. (1969b). Madreporaires et hydrocorallieres recifaux des côtes brésiliennes. Systematique, écologie, répartition verticale et geographique. In Resultats Scientifiques des Campagnes de la Calypso, IX Campagne de la Calypso au large dês côtes Atlantiques de l'Amerique du Sud (1961-1962) (Vol. XXXVI, pp. 15-229). Paris: Masson et Cie. Leão, Z. M. A. N. (1982). Morphology, geology and development history of the southernmost coral reefs of Western Atlantic, Abrolhos bank, Brazil. Unpublished PhD thesis, University of Miami, Miami. Leão, Z. M. A. N. (2002). Abrolhos, BA - O complexo recifal mais extenso do Atlântico Sul. In C. Schobbenhaus, D. A. Campos, A. T. Queiroz, M. Winge & M. L. C. Berbet-Born (Eds.), Sítios Geológicos e Paleontológicos do Brasil (Vol. 1, pp. 345-359). Brasília: SIGEP. Leão, Z. M. A. N., & Brichta, A. (1996). A plataforma continental. In J. S. F. Barbosa & J. M. L. Dominguez (Eds.), Texto explicativo para o Mapa Geológico do Estado da Bahia - Escala 1:1000000 (pp. 185-198). Salvador: SME. Leão, Z. M. A. N., & Kikuchi, R. K. P. (1999). The Bahian coral reefs – from 7.000 years B.P. to 2.000 years A.D. Ciência e Cultura, 51(3/4), 262-273. Leão, Z. M. A. N., Kikuchi, R. K. P., Dutra, L. X. C., & Oliveira, M. D. M. (2006). The status of Eastern Brazil coral reefs since 5000 years ago. Paper presented at the 10th International Coral Reef Symposium, Okinawa. Leão, Z. M. A. N., Kikuchi, R. K. P., Maia, M. P., & Lago, R. A. L. (1997). A catastrophic coral cover decline since 3.000 years B.P., Northern Bahia, Brazil. Paper presented at the 8th International Coral Reef Symposium. Leão, Z. M. A. N., Kikuchi, R. K. P., & Testa, V. (2003). Corals and coral reefs of Brazil. In J. Cortés (Ed.), Latin American Coral Reefs (pp. 9-52). Amsterdam: Elsevier Science B.V. Lessa, G. C., Bittencourt, A. C. S. P., Brichta, A., & Dominguez, J. M. L. (2000). A reevaluation of the late Quaternary sedimentation in Todos os Santos Bay (BA), Brazil. Anais da Academia Brasileira de Ciências, 72(4), 573-590. Lessa, G. C., Dominguez, J. M. L., Bittencourt, A. C. S. P., & Brichta, A. (2001). The tides and tidal circulation of Todos os Santos Bay, Northeast Brazil: a general characterization. Anais da Academia Brasileira de Ciências, 73(2), 245-261. Martin, L., Flexor, J. M., Villas-Boas, G. S., Bittencourt, A. C. S. P., & Guimarães, M. M. M. (1979). Courbe de variation du niveau relatif de la mer au cours des 7000 dernières annés sur un secteur homogéne du littoral Brésilien (nord de Salvador-Bahia). Paper presented at the 1978 International Symposium on coastal evolution in the Quaternary, São Paulo. Martin, L., Fournier, M., Mourguiart, P., Sifeddine, A., Turcq, B., Absyl, M. L., et al. (1993). Southern oscillation signal in South-American paleoclimatic data of the last 7000 years. Quaternary Research, 39(3), 338-346. McManus, J. W., & Polsenberg, J. F. (2004). Coral-algal phase shifts on coral reefs: ecological and environmental aspects. Progress in Oceanography, 60, 263-279. McNeill, J. R. (1986). Agriculture, Forests, and Ecological History: Brazil, 1500-1984. Environmental Review, 10, 122-133. Medeiros, R. A., & Ponte, F. C. (1981). Roteiro geológico da bacia do Recôncavo, Bahia. Salvador: Petrobrás/SEPES/DIVEN/Setor de Ensino na Bahia. Meppem, T., & Gill, R. A. (1998). Planning for sustainability as a learning concept. Ecological Economics, 26(2), 121-138. Migotto, A. (1997). Anthozoa bleaching on the southeastern coast of Brazil in the summer of 1994. Paper presented at the 6th International Conference of Coelenterate Biology. Miller, S. (1997). Fuelwood in colonial Brazil: the economic consequences of fuel depletion for the Bahian Recôncavo, 1540-1820. In H. Wheatley (Ed.), Agriculture, Resource Exploitation, and Environmental Change (pp. 135-159). Brookfield: Variorum. Miller, S. W. (2003). Stilt-root subsistence: colonial mangroves and Brazil’s landless poor. Hispanic American Historical Review, 83(2), 223-253. Moberg, F., & Folke, C. (1999). Ecological goods and services of coral reef ecosystem. Ecological Economics, 29, 215-233. Morton, F. W. O. (1978). The Royal timber in late colonial Bahia. The Hispanic American Historical Review, 58(1),

Vol. 1, No. 1 Journal of Sustainable Development
26
41-61. Norton, B. G. (2005). Sustainability: a philosophy of adaptive ecosystem management. Chicago and London: The University of Chicago Press. Nyström, M., & Folke, C. (2001). Spatial resilience of coral reefs. Ecosystems, 4, 406-417. Paredes, J. F., Queiroz, A. F. S., Carvalho, I. G., Ramos, M. A. S. B., Santos, A. L. F. V., & Mosser, C. (Eds.). (1995). Heavy metals in estuarine sediments: mangrove swamps of the Subaé and Paraguaçú tributary rivers of Todos os Santos Bay, Bahia, Brazil (Vol. 9). Rio de Janeiro: CETEM/CNPq. Peterson, G., Allen, C. R., & Holling, C. S. (1998). Ecological resilience, biodiversity, and scale. Ecosystems, 1, 6-18. Roberts, C. M. (1997). Connectivity and Management of Caribbean coral reefs. Science, 278(5342), 1454-1457. Rogers, C. S. (1990). Responses of coral reefs and reef organisms to sedimentation. Marine Ecology Progress Series, 62, 185-202. Rosa, I. L., Sampaio, C. L. S., & Barros, A. T. (2006). Collaborative monitoring of the ornamental trade of seahorses and pipefishes (Teleostei:Syngnathidae) in Brazil: Bahia State as a case study. Neotropical Ichthyology, 4(2), 247-252. Sampaio, C. L. S., & Rosa, I. L. (2006). Predation of an alien species of crab (Charybdis hellerii Milne Edwards) by a native Octopus species on NE Brazilian reefs. Coral Reefs, 25, 58. Santos, C. B., Carvalho, R. C., & Lessa, G. (2003). Distribuição dos manguezais na Baía de Todos os Santos e seu impacto no balanço hídrico. Paper presented at the II Congresso sobre Planejamento e Gestão das Zonas Costeiras dos Países de Expressão Portuguesa, IX Congresso da Associação Brasileira de Estudos do Quaternário, II Congresso do Quaternário dos Países de Línguas Ibéricas, Recife, Pernambuco. Schelhas, J., Buck, L. E., & Geisler, C. C. (2001). Introduction: the challenge of adaptive collaborative management. In L. E. Buck, C. C. Geisler, J. Schelhas & E. Wollenberg (Eds.), Biological Diversity: balancing interests through adaptive collaborative management (pp. xix-xxxv). Boca Raton: CRC Press LLC. Schwartz, S. B. (1985). Sugar plantations in the formation of Brazilian society: Bahia 1550-1835. Cambridge: Cambridge University Press. Schwartz, S. B. (1987). Plantations and peripheries, c. 1580 - c. 1750. In L. Bethell (Ed.), Colonial Brazil (pp. 67-144). Cambridge: Cambridge University Press. Shaw, P. (2002). Changing conversations in organizations: a complexity approach to change. London and New York: Routledge. Silva, A. M.-D. (1987). Imperial re-organization, 1750-1808. In L. Bethell (Ed.), Colonial Brazil (pp. 244-283). Cambridge: Cambridge University Press. Stute, M., Forster, M., Frischkorn, H., Serejo, A., Clark, J. F., Schlosser, P., et al. (1995). Cooling of tropical Brazil (5o C) during the last glacial maximum. Science, 269, 379-383. Te, F. T. (1992). Response to higher sediment loads by Pocillopora damicornis planulae. Coral Reefs, 11, 131-134. Torres, J. L., & Morelock, J. (2002). Effect of terrigenous sediment influx on coral cover and linear extension rates of three Caribbean massive coral species. Caribbean Journal of Science, 38(3-4), 222-229. Torres, R., Chiappone, M., Geraldes, F., Rodriguez, Y., & Vega, M. (2001). Sedimentation as an important environmental influence on Dominican Republic reefs. Bulletin of Marine Science, 69(2), 805-818. Urry, J. (2005). The Complexity Turn. Theory, Culture & Society, 22(5), 1-14. van den Bergh, J. C. J. M. (1995). Dynamic analysis of economic development and natural environment on the Greek Sporades Islands. In J. W. Milon & J. F. Shagren (Eds.), Integrating Economic and Ecological Indicators: Practical Methods for Environmental Policy Analysis (pp. 109-128). Westport: Praeger. Veron, J. E. N. (2000). Corals of the World (Vol. 1). Townsville: Australian Institute of Marine Science. Wallerstein, I. (1974). The modern world system: capitalist agriculture and the origins of the European world economy in the sixteenth Century. New York: Academic Press. Wasserman, J. C., & Queiroz, E. L. (2004). The attenuation of concentrations model: a new method for assessing mercury mobility in sediments. Quimica Nova, 27(1), 17-21. Witman, J. D. (1992). Physical disturbance and community structure of exposed and protected reefs: a case study from St. John, U.S. Virgin Islands. American Zoologist, 32(6), 641-654. Wood, R. (1998). The ecological evolution of coral reefs. Annual Review of Ecology and Systematics, 29, 179-206.

Journal of Sustainable Development March, 2008
27
Wood, R. (2001). Biodiversity and the history of reefs. Geological Journal, 36(3-4), 251-263. Woolfe, K. J., & Larcombe, P. (1999). Terrigenous sedimentation and coral reef growth: a conceptual framework. Marine Geology, 155, 331-345.
Figure 1. Map of Todos os Santos Bay including coral reef and mangrove areas (based on Lessa, et al., 2000) and source areas of impacts
A) Initial Portuguese settlement producing sugarcane, cotton and other plantation crops in the XVI Century; Area subjected to intense industrialization in 1960s and 1970s; B) Establishment of sugar plantations in the late XVI Century which became the second largest sugar production area; Mataripe oil refinery built in 1950s and; establishment of two industrial zones contributing to industrial and domestic runoff into the Bay’s waters; C) Establishment of sugarcane plantations in the late XVI Century; area devoted to livestock grazing and manioc cultivation around the towns of Acupe and Saubara; Tobacco production area; D) Only opened to settlement in the XVIII Century, with manioc farming during the colonial period; timber and firewood reserve for whole region; lime mining on ocean-facing Itaparica reefs in the 1860s.
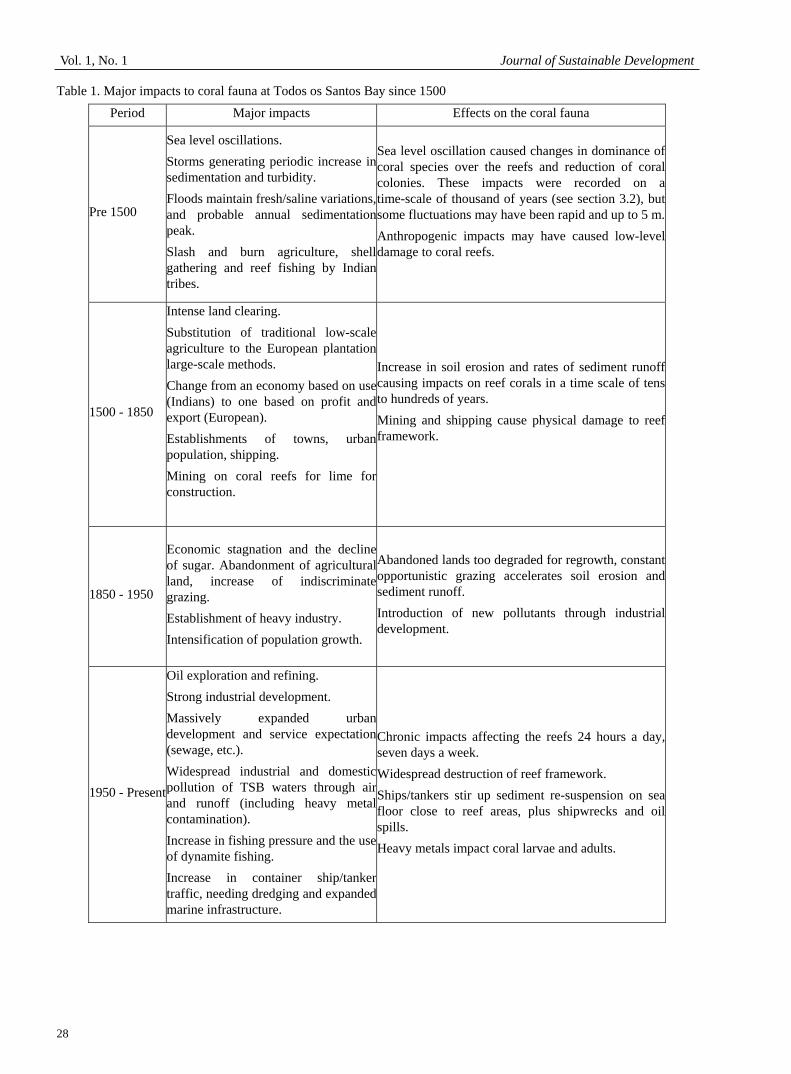
Vol. 1, No. 1 Journal of Sustainable Development
28
Table 1. Major impacts to coral fauna at Todos os Santos Bay since 1500
Period Major impacts Effects on the coral fauna
Pre 1500
Sea level oscillations. Storms generating periodic increase in sedimentation and turbidity. Floods maintain fresh/saline variations, and probable annual sedimentation peak. Slash and burn agriculture, shell gathering and reef fishing by Indian tribes.
Sea level oscillation caused changes in dominance of coral species over the reefs and reduction of coral colonies. These impacts were recorded on a time-scale of thousand of years (see section 3.2), but some fluctuations may have been rapid and up to 5 m.Anthropogenic impacts may have caused low-level damage to coral reefs.
1500 - 1850
Intense land clearing. Substitution of traditional low-scale agriculture to the European plantation large-scale methods. Change from an economy based on use (Indians) to one based on profit and export (European). Establishments of towns, urban population, shipping. Mining on coral reefs for lime for construction.
Increase in soil erosion and rates of sediment runoff causing impacts on reef corals in a time scale of tens to hundreds of years. Mining and shipping cause physical damage to reef framework.
1850 - 1950
Economic stagnation and the decline of sugar. Abandonment of agricultural land, increase of indiscriminate grazing. Establishment of heavy industry. Intensification of population growth.
Abandoned lands too degraded for regrowth, constant opportunistic grazing accelerates soil erosion and sediment runoff. Introduction of new pollutants through industrial development.
1950 - Present
Oil exploration and refining. Strong industrial development. Massively expanded urban development and service expectation (sewage, etc.). Widespread industrial and domestic pollution of TSB waters through air and runoff (including heavy metal contamination). Increase in fishing pressure and the use of dynamite fishing. Increase in container ship/tanker traffic, needing dredging and expanded marine infrastructure.
Chronic impacts affecting the reefs 24 hours a day, seven days a week. Widespread destruction of reef framework. Ships/tankers stir up sediment re-suspension on sea floor close to reef areas, plus shipwrecks and oil spills. Heavy metals impact coral larvae and adults.

Journal of Sustainable Development March, 2008
29
Table 2. Population of the city of Salvador from 1585 to 2000
Year Salvador Population 1585 14 000 (Schwartz, 1987: 129) 1620 21 000 (Herold, 2004) 1724 25 000 (Schwartz, 1987: 129) 1750 40 000 (Schwartz, 1987: 129) 1950 417 235 (Herold, 2004) 2000 2 443 107 inhabitants (IBGE, 2006)
Table 3. Presence of coral species in 1962 (Laborel, 1969a) and in 2003 (Dutra, Kikuchi and Leão, 2006a)
Coral species 1962 2003 Observations
Madracis decactis Not reported Uncommon Adapted to unfavorable conditions in water quality (Guzmán, & Guevara,1998)
Agaricia agaricites Not reported Uncommon
Siderastrea stellata
Main reef top builder
Main reef topbuilder
Resistant to high turbidity (Laborel, 1969b); the genus Siderastrea is adapted to low luminosity environments (Guzmán, & Guevara, 1998)
Porites astreoides Not reported Uncommon Resists turbid environments well. (Laborel, 1969b) and is very resistant tosedimentation (Torres, & Morelock, 2002)
Porites branneri Abundant Not reported Low resistance to water turbidity (Hetzel, & Castro, 1994; Laborel,1969b; Veron, 2000)
Favia gravida Abundant Uncommon Is highly tolerant to environmental oscillations in temperature, salinityand turbidity (Laborel, 1969b).
Montastrea cavernosa
Main reef top builder
Main reef topbuilder
A sediment-tolerant species (Bak, & Elgerhuizen, 1976; Torres, Chiappone, Geraldes, Rodriguez, & Vega, 2001); present in turbid conditions (Laborel, 1969b), and is adapted to low light level environments (Guzmán, & Guevara, 1998).
Mussismilia harttii Abundant Uncommon Tolerates well a certain amount of turbidity (Laborel, 1969b) and is
associated with shallow, turbid reef environments (Veron, 2000).
Mussismilia hispida Abundant Common Tolerates well a certain amount of turbidity (Laborel, 1969b) and is
associated with shallow, turbid reef environments (Veron, 2000).
Mussismilia braziliensis
Main reef top builder Not reported Low resistance to water turbidity (Hetzel, & Castro, 1994; Laborel,
1969b; Veron, 2000).
Scolymia wellsi Not reported Common Common in cryptic environments, with moderate or low light level(Laborel, 1969b).
Meandrina braziliensis Abundant Not reported Low resistance to water turbidity (Hetzel, & Castro, 1994; Laborel,
1969b; Veron, 2000). Stephanocoenia michelini Abundant Not reported
Millepora alcicornis
Main reef top builder Uncommon
Millepora nitida Abundant Not reported

Vol. 1, No. 1 Journal of Sustainable Development
30
Table 4. A preliminary plan of ecological reef states at Todos os Santos Bay since the Holocene
Ecological state 1 From 8 ky to 5 ky BP
Ecological state 2 After 5ky BP
Ecological state 3 1962 - 2003
Large colonies of Mussismilia braziliensis
Smaller colonies of Mussismilia braziliensis Absence of Mussismilia braziliensis
Dominance of Mussismilia braziliensis
Changes in dominant species covering the reefs
Changes in species composition favouring those more adapted to turbidity and sedimentation

Journal of Sustainable Development March, 2008
31
Zinc Bioremoval from Wastewater of Rubber Glove Industry Azizah Abu-Bakar
Department of Chemical and Process Engineering, Faculty of Engineering Universiti Kebangsaan Malaysia (UKM), 43650 Bangi, Malaysia
Tel: +603-89216428 E-mail: [email protected] Rakmi Abd-Rahman
Department of Chemical and Process Engineering, Faculty of Engineering Universiti Kebangsaan Malaysia (UKM), 43650 Bangi, Malaysia
E-mail: [email protected] Abu Bakar Mohamad
Department of Chemical and Process Engineering, Faculty of Engineering Universiti Kebangsaan Malaysia (UKM), 43650 Bangi, Malaysia
E-mail: [email protected] Abdul Amir Hassan Kadhum
Department of Chemical and Process Engineering, Faculty of Engineering Universiti Kebangsaan Malaysia (UKM), 43650 Bangi, Malaysia
E-mail: [email protected] Siti Rozaimah Sheikh Abdullah
Department of Chemical and Process Engineering, Faculty of Engineering Universiti Kebangsaan Malaysia (UKM), 43650 Bangi, Malaysia
E-mail: [email protected] The research is financed by Asian Regional Research Programme on Environmental Technology (ARRPET II) and Ministry of Science, Technology and Environment, Malaysia (IRPA 08-02-02-0003 EA094 Grant). Abstract Conventional physicochemical processes for removing heavy metals from industrial effluents are high in chemical usage and produce large amounts of chemical sludges, which in turn needs secured disposal. Biological processes to overcome these problems have been developed for treating wastewaters containing heavy metals. The bioremoval and biorecovery of zinc ions from rubber glove mill effluent on a sequencing batch biofilm reactor (SBBR) was studied. Without adding any precipitant, the processes could achieve Zn and COD removal of 40-60% and 50-70% respectively. In order to recover the metal, the sludge was digested in an anaerobic digestion reactor. This study revealed that anaerobic digestion with longer hydraulic retention time could increase the recovery of heavy metals. This recovery prevents metal discharge to the environment and conserves resources. Keywords: Biofilm, Anaerobic digestion, SBBR 1. Introduction Increasing awareness of accumulation of heavy metals in the environment has led to a quest for new and improved “clean” technologies. The contamination of the environment by heavy metals is of growing concern because of the numerous health risks to animals and humans following exposure (Costley and Wallis 2001). Common sources of metal polluted wastewaters include electroplating plants and other, metal finishing operations, as well as many mining, nuclear and electronics industries. All of these contribute to anomalously high concentrations of metals in the environments relative to the normal background levels (Neytzell-De Wildes 1991). Wastewater treatment plants are expected to control the discharge of heavy metals to the environment. However, with new stricter regulations aimed at protecting the environment, wastewater treatment authorities are facing with disposal

Vol. 1, No. 1 Journal of Sustainable Development
32
problems of heavy metal laden sludge (Chipasa 2003). Toxicity of heavy metals is well documented (Nies 1999). The problems associated with heavy metals in the environment are their accumulation in the food chain and their persistence in nature. Heavy metal ions are accumulated by microorganisms, and a number of investigators have shown that microorganisms are valuable tools in removing and recovering metals from waste streams. Microbial metal accumulation has received much attention during recent years, due to the potential use of microorganisms for treatment at metal polluted water or wastewater streams (Zouboulis et al. 2004). Biological processes have shown potential for heavy metal removal (Volesky 1987; Bux et al. 1994). In a biofilm processes, dissolved organic materials and nutrients are directly absorbed from bulk phase to the biofilm by means of concentration gradient, whereas dissolved heavy metals are generally adsorbed onto the biofilm surface as a result of interactions between metal ions and the negatively charged microbial surfaces, gradually reducing the aqueous metal concentration (Jang et al. 2001). Hence, this research aims to investigate the efficiency of metal removal and recovery in rubber glove mill wastewater via a biosorption process. 2. Method and Material 2.1 Bioremoval and biorecovery process A laboratory scale sequencing batch biofilm reactor (SBBR) was set up as shown in Figure 1. The reactor of volume 1 L was operated at hydraulic retention time (HRT) of one day. At start up, it was seeded with a mixed culture acclimatized to simple and complex organics. Real industrial wastewater from a rubber glove mill was taken as the influent for the reactor. After sampling, samples were taken to the laboratory and immediately analyzed. After being treated in the SBBR for a period of time, the resultant sludge with the biomass was separated from the effluent. The sludge was digested in an anaerobic digestion reactor of 500 mL for metal recovery. HRTs of 5 and 10 days were used for the digestion process to compare the metal recovery. Metal contents in the sludge after and before anaerobic digestion treatment was analyzed using AAS through acid digestion method. Additionally, a water displacement system was used to collect the gas which was produced as a result of the anaerobic digestion process. 2.2 Sample Analysis Effluent samples from the SBBR were filtered through a 0.45 µm pore membrane filter (Whatman) and the filtrate was analyzed for COD and heavy metals. The metal contents were analyzed using Atomic Absorption Spectroscopy (AAS). COD was spectrophotometrically analysed using HACH DR2000 Spectrophotometer. Analysis of methane in the collected gas was achieved by a gas chromatography equipped with a flame ionization detector (FID). Table 1 summarizes the method and the instrument used in sample analysis and Table 2 lists the operating parameters for the gas chromatography. 3. Results and Discussion The results of sample analysis of the raw rubber mill wastewater are shown in Table 3. The wastewater contained high concentrations of organic matter, suspended solids and zinc which exceeded the standard limits set by Malaysian government. The removal rate of zinc metal is recorded and presented in figure 2. The zinc content in the effluent were below its standard limit of 1 mg/L. The removal range for zinc is about 40-60%. According to Oliver and Cosgrove (1974), metal removal occurs in a biological reactor through biosorption process. This bioremoval of zinc does not require chemical addition and result in biological sludge whose volume and weight can be further reduced. Furthermore, a good COD removal in the range of about 50-70% was also achieved in the system (Figure 3). The zinc content in the sludge before and after the digestion process is presented in figure 4. It was observed that anaerobic digestion process caused an increase in the content of heavy metals. Longer HRT of 10 days gave a better recovery of the metal compared to a shorter HRT of 5 days. It showed that longer time was required for an effective digestion process to occur in the system. The increases in metal contents in the digested sludge was expected because during anaerobic digestion, biodegradable organic and inorganic matter are de-composed to end products of CH4, CO2, N2, H2S and many other gases as reported by Tchobanouglous et al. (2004). Gas production from anaerobic digestion process was recorded daily using water displacement system. Identification and quantitative analysis of methane in the collected gas were performed using gas chromatography and a result of this analysis was shown in Figure 5. The chromatogram of methane gas found at a retention time of 1.52 min in compare to authenticated methane sample proved that methane gas was produced in this anaerobic digestion reactor. 4. Conclusions This study has shown that the biofilm process applied can be used to substantially remove both organics and heavy metal from wastewaters and has the potential to be further developed into a cheaper, environmentally friendly process for treating wastewaters containing organics and heavy metals. This technology, which is based on nucleated

Journal of Sustainable Development March, 2008
33
precipitation of heavy metals onto biomass surface in a sequencing batch bioreactor, is viable for removing heavy metals from industrial wastewater. References Bux, F., Swalaha, F. M. & Kasan, H. C. (1994). Microbiological transformation of metal contaminated effluents. Water Research Commission Report No 357/1/94. Chipasa, K. B. (2003). Accumulation and fate of selected heavy metals in a biological wastewater treatment system. Waste Management. 23: 135-143. Costley, S. C. & Wallis, F. M. (2001). Bioremediation of heavy metals in a synthetic wastewater using a rotating biological contactor. Water Research. 35: 3715-3723. Jang A., Kim S. M., Kim, S. Y., Lee, S. G. & Kim, I. S. (2001). Effect of heavy metals (Cu, Pb and Ni) on the compositions of EPS in biofilms. Water Science Technology. 43: 41-48. Neytzell-De Wildes, F. G. (1991). Reassessment of the strategy with respect to industrial effluent discharge with special reference to advanced technology treatment methods: Phase I. Industrial effluent discharge problem areas. Water Research Commission Report No. 407/1/92. Nies, D. H. (1999). Microbial heavy metal resistance. Applied Microbiology and Biotechnology. 51: 730–750. Oliver, B. G. & Cosgrove, E. G. (1974). The efficiency of heavy metal removal by a conventional activated sludge treatment plant. Water Research. 8: 869-874. Tchobanoglous, G., Burton, F. L. & Stensel, H. D. (2004). Wastewater Engineering: Treatment and Reuse (fourth edition). New York: McGraw-Hill. Volesky, B. (1987). Biosorbents for metal recovery. Trends in Biotechnology. 5: 96-101. Zouboulis, A. I., Loukidou, M. X. & Matis, K. A. (2004). Biosorption of toxic metals from aqueous solutions by bacteria strains isolated from metal-polluted soils. Process Biochemistry. 39: 909-916. Table 1. Details of analysis parameters and instruments used
Parameter Method Instruments
COD Digestion Method (EPA
approved) HACH DR2000
Metal contents Flame Atomic Absorption Spectrometry
Atomic Absorption Spectroscopy (5100PC, Perkin Elmer, U.S.A)
Table 2. Gas chromatographic parameter for methane gas determination
Parameter Analytical conditions
GC Model Hewlett Packard (HP 5890)
Detector FID (Flame Ionization Detector)
Column HP Innowax, L=30 m, ID=0.25 mm, Film thickness = 0.25µm
Carrier Gas Helium
Retention time, Rt 1.52 min
Detector temp. 220 0C
Injector temp. 160 0C
Program 600C hold for 1 min, 50C/min up to 1300C

Vol. 1, No. 1 Journal of Sustainable Development
34
Table 3. Characteristics of wastewater from rubber glove mill
Parameter Unit Value
pH - 8.33 COD mg/L 4320 Suspended solid mg/L 515 Color PtCo 7380 Copper mg/L 0.002 Zinc mg/L 1.169* Nickel mg/L 0.009 Sodium mg/L 16.410 Potassium mg/L 0.852 Calcium mg/L 0.734 *Standard limit of Zn (Malaysian Environmental Quality Act 1979) = 1.0 mg/L
Figure 1. Schematic diagram of bioremoval and biorecovery process
0
0.2
0.4
0.6
0.8
1
1.2
1.4
0 5 10 15 20 25 30Tim e (days )
Zinc
(mg/
L)
Figure 2. Zinc content in the influent and effluent of SBBR
Effluent
Gas Reactor
metal SBBR
Magnetic stirrer
Sludge
Anaerobic digestion unit
Influent
Clarifier
Water displacement unit

Journal of Sustainable Development March, 2008
35
Figure 3. Biomass concentration and COD in the influent and effluent of SBBR
Figure 4. Zinc content after the anaerobic digestion process of different HRTs
Figure 5. Chromatogram of methane gas
0
1000
2000
3000
4000
5000
0 5 10 15 20 25 30Tim e (days )
CO
D (
mg
/L
0
500
1000
1500
2000
Bio
mas
s (m
g/L
COD influent COD effluent B iomass
02468
101214
1 2Time
Zn co
ntent
(mg/g
)
undigested digested
Vol. 1, No. 1 Journal of Sustainable Development
36
Modelling Household Travel Behaviour to Promote
Educational Values of Sustainability Karen S Donegan
Waterman Boreham Ltd, 51-53 Fountain Street, Belfast Co. Antrim, BT1 5EB, Northern Ireland, UK
Tel: +44 (0) 28 90 727680 E-mail: [email protected] Gerry J McAleavy
Faculty of Social Sciences, University of Ulster, Jordanstown Campus, Newtownabbey Co Antrim, BT37 0QB, Northern Ireland, UK
Tel: +44 (0) 28 90 366911 E-mail: [email protected] Henry A Donegan
School of Computing and Mathematics, University of Ulster, Jordanstown Campus, Newtownabbey Co Antrim, BT37 0QB, Northern Ireland, UK
Tel: +44 (0) 28 90 366841 E-mail: [email protected] Abstract The emergence of concern about global sustainability raises questions about the nature of travel behaviour and its potential effect on the sustainability of households. This potential, generated through an understanding of what is meant by travel behaviour sustainability, must be addressed by way of education. The paper attempts to characterise this type of sustainability using a coarse multiattribute model that reduces the concept to five measurable attributes. These can be readily integrated with a public educational programme designed to enable households to assess and reflect on their behaviour as a result of a household sustainability index of travel behaviour. Results from a large survey of households in the Belfast City Region are presented to illustrate the tangibility of the modelling methodology (Belfast is the capital city of Northern Ireland). Keywords: Travel behaviour, Sustainability, Multi-criteria analysis, Expert opinion, Agenda 21 1. Introduction Universal government policy is sensitive to the problems attached to global warming and the desire to control and minimise the present high levels of adverse transport activity on the environment is one of the most important demands facing policy makers in their efforts to secure sustainable development. In light of the many definitions of sustainable development [Pezzey (1989) lists some sixty definitions and Pearse et al. (1989) exhibit thirty in their Gallery of Definitions] the notion put forward by the Brundtland Commission is adopted herein – namely: Sustainable development meets the needs of the present without compromising the ability of future generations to meet their own needs. The paper argues the potential for enhancing public response to governmental policies (e.g. Agenda 21) by enabling householders to learn how sustainability relates to their ecological identity. The United Nations Conference on Environment and Development Education (1992) established the Agenda 21 policy on promoting sustainability and stated that (ibid:36.1), “Education is critical for promoting sustainable development and improving the capacity of the people to address environment and development issues”. It was emphasised that “Both formal and non-formal education are indispensable to changing people's attitudes so that they have the capacity to assess and address their sustainable development concerns. It [education] is also critical for achieving environmental and ethical awareness, values and attitudes, skills and behaviour consistent with sustainable development and for effective public participation in decision-making”. Local Agenda 21 (LA21) is the local version of the U.N. policy both internationally and within the U.K. In line with this policy, District Councils have been tasked with establishing partnerships with Non-Governmental Organisations
Journal of Sustainable Development March, 2008
37
(NGOs), both in pursuit of sustainable enterprise development and the “implementation of participatory democracy (Section 27.1)”. In the U.K. “all local authorities signed up to the deal, and through the use of LA21 Officers, aimed to make an impact on their local community’s attitudes to recycling and many other actions related to the environment”. (DEFRA, 2005, 1.3). It was, also, required that all schools should have links with the local authority concerning environmental issues, specifically through an LA21 Officer. DEFRA research (ibid) found that not all schools did link with a local authority but those that did were “more likely than average to say that the issues featured do affect what they teach” (ibid). The findings suggest the need for holistic and ‘joined-up’ policies if the concept of sustainability is to be embedded across communities and the rising generation of children. The introduction of such policies will entail a new and radical approach to public education both in terms of the role of schools and the different arms of government, including local authorities. DEFRA (2003:3) through the ‘Learning to Last’ strategy has emphasised that “all parts of the education system” and “all organisations involved in local and regional governance” should apply their respective capacities to addressing sustainability. It has been suggested (Blewitt, 2005), however, that a paradigmatic shift in government thinking is required, informed by the metaphor of natural capital (Daly and Cobb, 1994) which provides a different mode of ecosystem analysis. Clearly this is a major project and will, ultimately, be dependent on the capacity of government to influence public behaviour. A starting point, however, for the enhancement of public education would be to identify clearly the individual behaviours that are detrimental to sustainable living and to utilise this data to support the development of effective public health policies and practices. The outcome of this study is intended to inform public education by providing findings that can assist in informing decision-making through examination of household behaviour. It has already been shown through publicly funded project studies that behavioural changes are possible, albeit incremental at their stage of enquiry. See for example, Haq et al (2004), Cairns et al (2004) and the Community Survey and Marketing Campaign for the South Perth Travel Smart Pilot Project Third Evaluation Report (September 2000). By taking the household as a focus in terms of its occupant travel behaviour, this article presents the reader with the outline of a simple model designed to link expert knowledge of travel behaviour with corresponding household data abstracted from a large household survey, see Donegan et al (2007). The outcome is an index of travel behaviour sustainability - referred to as the household sustainability index (HSI). This gives the household an indication, measured on a percentage basis, of how well it is performing with respect to its travel behaviour. Such an indicator has the potential from an educational perspective to motivate a household’s consideration of a more sustainable approach to its travel behaviour habits. This could be achieved via a profile of performance across the range of fixed and variable travel behaviour attributes that are an integral part of the model. The points-scheme used to abstract the household attribute data will be described in some detail. Policy makers can also benefit from the indexing concept. For example, the aggregation of individual household indices over a range of developments within settlements across the urban-rural spectrum would offer policymakers an opportunity to compare the travel behaviour performance of settlements when judged against corresponding sustainability benchmarks. Such judgements could be used to enhance any particular transport initiative or potential innovations related to an educational provision whether formal or informal. There may be a concern that, currently, education in sustainability is too broadly directed and this information can contribute to a more focused approach which takes account of recent settlement patterns and, moreover, contributes to an understanding of how the process of persuading individuals to consider alternative choices regarding place of abode. The results arising from the model’s application to the survey data raises a question concerning suburbanisation. Does household travel behaviour result from a residual culture of behaviour? For example in Northern Ireland, does the popular trend for the provision of homes in suburbanised settlements mean that many of the occupants of these settlements continue to use former amenities, which could result in unnecessary and greater travel distances associated with private transport modes and journey frequencies? Put another way: do people in selecting their locations fail to reconcile their lifestyle and travel patterns with sustainability? Public education, to date, has been largely concerned with how individuals address sustainability in their current abodes. By providing the public with empirical evidence concerning their decisions regarding settlement, individuals will be better informed in terms of making a transition to a more sustainable mode of living. If the public do not have this knowledge they may not be able to capitalise on values they may have espoused regarding sustainability. 2. The Modelling Perspective 2.1 The Model Concept The model was derived from a primary hypothesis derived from the above question – namely “people in selecting their living environment fail to harmonise their lifestyle and travel patterns with appropriate sustainability indicators”. To this end a large survey comprising almost 1000 households was conducted along a key commuter corridor of greater Belfast to yield a picture of relative travel behaviour sustainability (TBS) across a selection of settlements. Taking any single settlement, it would be naive to claim that its global TBS is related solely to, for example, the minimisation of car
Vol. 1, No. 1 Journal of Sustainable Development
38
ownership. There are other related attributes linked to higher levels of social, economic and environmental criteria - see for example, SDS (1998) and Newman and Kenworthy (1999). The attributes are identified and measured using a range of expert opinion and then integrated into the decision making process - hence the need to employ a multi-attribute methodology that can accommodate both qualitative and quantitative input. There is a vast literature on methods of multi criteria evaluation, see for example Zietsman and Rilett, (2002), Goodwin and Wright, (1998); Taha, (1997); Saaty, (1995); French, (1988); Bunn, (1984); Edwards and Newman (1982); Keeney and Raiffa, (1976). It assists decision-makers in the task of prioritising or selecting from a finite set of alternatives with respect to multiple and usually conflicting criteria. The mechanisation of multi-criteria evaluation, interpreted from the above literature listing, is characterised in Figure 1, adapted from Donegan (2003), which shows how the expert opinion weights are linked to selected attribute values. (These are numerical scores abstracted from household survey data using a points scheme that will be described in Section 3). The alternatives in this investigation are identified with households sampled in the settlements of Moira, Knockmore, Fourwinds and Brownfield Sites within Belfast's CBD, all from the key southern approach route into Belfast and ordered respectively by distance from the CBD. 2.2 The Meaning of Attributes Attributes are the key elements in the eventual ranking of alternatives (households in this study). Together with any higher level criteria they form the baseline of a decision or analytic hierarchy (Saaty, 1980), sometimes referred to as a value-tree to facilitate the judgement process. In a more formal sense, attributes are the dimensions along which alternatives are represented (French, 1988). For example, if alternatives are to be judged against three attributes, picture these as the three axes X, Y and Z shown in Figure 2. An alternative a (in this study, a particular household) with attribute preference valuations - a1, a2, a3, is effectively an attribute preference vector (a1, a2, a3) with a1 in the X - dimension, a2 in the Y - dimension and a3 in the Z - dimension. Another alternative household b could have value co-ordinates b1, b2, and b3 and so on. This research draws on five key attributes, which for each household, yields a 5-dimensional preference vector (a1, a2, a3, a4, a5). The attribute values of each household are determined by means of a points-scheme applied to activity data retrieved from a household survey. Attribute preference vectors, however, do not readily assist the direct comparison of households. It is necessary to take a weighted sum of the respective attribute values using expertly determined weights of importance. This (the basis of multi-attribute utility theory) is necessary because attributes, although chosen by experts for their direct relevance, do not have equal merit in their representation of households. The resulting weighted-sums for each household are used to rank the households. That is if wi )10( ≤≤ iw is the level of importance of attribute i and vi )1000( ≤≤ iv represents its resultant survey value in points awarded, then ii vwΣ is the weighted or composite score in the range 0 to 100, for that particular household. (Since the weights wi sum to 1, there is no need to divide this expression by Σwi). Normally a formal process is used to arrive at a credible consensus in the levels of importance identified by experts – the process may be as informal as the Delphi (See End Note 1) procedure (Schiebe et al., 1975) or as formal as Saaty’s (1980) Analytic Hierarchy Process (AHP). These are tried and tested methods, which can readily be adapted to any particular form of enquiry - it is not the purpose of this paper to dwell on their respective technical merits or methodologies. 2.3 Selecting and Using the Attributes Since policy makers have targeted travel behaviour in recent years, the public has been subjected to a host of exhortations regarding how citizens might consider changing their travel behaviour. The precise impact of the different decisions that might be made has not, however, always been clear, hence the construction of a set of appropriate travel behaviour indicators that can be embedded within a hierarchy of attributes and significant criteria, can make an important contribution to public debate and understanding. In pursuit of key words that could assist with travel behaviour questionnaire design, Donegan (2003) produced a typology of key words, distilled from a vast selection of literature linking travel behaviour and sustainability. This list, reproduced in Table 1, was used as an aide memoire in the selection of attributes and criteria to be identified with the proposed model of household travel behaviour sustainability. In line with Parker's (1972) recommendation, a panel of experts drawn from both the public and private sectors, together with academics having key research skills, ratified the final choice and hierarchy illustrated in Figure 3. Dalkey’s (1969) work for the RAND Corporation shows that there is only a marginal difference in the average group error between an expert group of size 10 and a group of size 29. This is important in the management of a Delphi enquiry since it is much more convenient to administer 10 responses than 29. In this study it was convenient to use the consensus opinion of twelve experts with a cross-section of experiences from the fields of sustainability, planning and
Journal of Sustainable Development March, 2008
39
transport. Each expert had at least ten years experience in his/her field of knowledge and, moreover, retaining their anonymity enabled their participation as a Delphi group in the weighting of the attributes. The decision hierarchy shown in Figure 3 was discussed and agreed with the experts to assist them with attribute comparison evaluations. Although the process is labour intensive, the use of a hierarchy enables quantitative base-line attribute comparisons to be made relative to each of the criteria in the next highest level and so on, up the chain of criteria. A relevant discussion on consensus and decision hierarchies, along with example calculations, can be found in Donegan et al. (1998). The end result is a set of attribute weights relative to the top element of the hierarchy – sustainable development. This procedure reduces the remoteness of decision-making when seeking attribute comparisons (Shields, 1991) and it leads to greater precision in the decision-making process. The baseline attributes along with a household’s knowledge of its travel behaviour sustainability can readily advance an educational opportunity for any household to upgrade the sustainability of its travel behaviour. This suggests that government, at central or local levels, should review and reconsider policies, as it would appear that a new model of public education is required. This model would be informed by knowledge of the degree of flexibility pertaining to the different attitudes to be addressed; consequently, policies designed to support education for change could incorporate drivers directed towards the targeted attitudes. Assuming that a household is aware of its Index of Sustainability, the baseline attributes: a. mode [of transport used for travelling to/from activities] b. frequency [of activity participation] and c. location [of activities] facilitate the opportunity for a household to make positive changes to its occupant lifestyle as policy is reviewed. For example, choosing a more sustainable mode of transport, reducing the frequency associated with certain activities and choosing localised activities where possible. The attributes: d. proximity [to public transport] and e. the numbers of vehicles and/or licence holders [associated with a household] are less flexible to change, requiring much more radical intervention. When the expert consensus weights are logged for each attribute, the set of baseline attributes also defines a basis for obtaining the household values, which when appropriately weighted by the logged expert-opinion, provides the household comparison indices. The household’s resultant value for each baseline attribute is obtained through an averaging process carried out over an agreed set of activities – namely: bulk shopping, occasional shopping, leisure, entertainment, health/medical, business, worship, education and employment. Each household activity rates a score determined from the survey database and a well-defined points scheme. The points scheme used in the present study is outlined in Section 3. Using this information, and recalling the weighted sum ii vwΣ mentioned previously, gives the formula for a household’s index of travel behaviour sustainability, namely:
Household Sustainability Index (HSI) = ii vwΣ (bounded by 0 ≤ HSI ≤ 100), where wi is the consensus of the expert weightings for each baseline attribute i and vi is the corresponding harmonic mean of a specific household’s activity values. [One hundred is the maximum sustainability score for a household – this is explained at the end of Section 3]. Table 2 illustrates a typical calculation for a household's index of travel behaviour sustainability. Later in Table 7, the calculation of the latter is illustrated in detail for two sample households. 3. Household Travel Behaviour Sustainability Valuations 3.1 The Points Scheme and Evaluation of the HSI The household questionnaire and points-scheme were designed around sets of sub- attributes associated with mode, frequency, location, proximity and vehicle/licences. It is well known that setting points against sub-attributes is a subjective exercise and in order to minimise subjective shortcomings a number of experts from the Delphi panel offered assistance in reaching a points scoring consensus. The sets of sub-attributes are bulleted as follows: MODE (method of commuting): a. travelling by car b. travelling by motorcycle c. travelling by taxi

Vol. 1, No. 1 Journal of Sustainable Development
40
d. travelling by bus e. travelling by train f. travelling by bicycle g. walking h. immobile (non participation) FREQUENCY (of trips): a. daily b. weekly c. fortnightly d. monthly e. zero frequency (non participation) LOCATION (of activity relative to household): actual distances (d) provided by respondents PROXIMITY (of a public transport halt to the household estimated in minutes (t)): a. a nil response b. time t (mins) such that t ≥ 20 c. time t (mins) such that 15 ≤ t < 20 d. time t (mins) such that 10 ≤ t < 15 e. time t (mins) such that 5 ≤ t < 10 f. time t (mins) such that 0 ≤ t < 5 NUMBER OF VEHICLES AND OR LICENCES a. number of licences/household and number of motor vehicles/household. Points-schemes have an extensive literature in decision-theory, see for example Watts (2002), Cole (1997), Doxsey (1994), Prior (1993) and Stollard (1984). Fundamentally, the value or utility that can be attributed to an attribute can be mapped on to a common numerical scale designed to accommodate the admissible range of expected values (Edwards and Newman, 1982). The HSI scale ranges from zero (no value) to one hundred (maximum value within the confines of the model) – the higher the score the greater the travel behaviour sustainability relative to the measured attribute. The points scoring strategy for each of the baseline attributes is summarised below, starting with the transport mode used in getting to and from activities. A fuller discussion takes place in Donegan (2003). Although 0 (the least score) and 100 (the maximum score) identify with particular sub-attributes in this study, there is no reason to restrict the sub-attributes in a future project. For example it could well be that in the future there would be something more sustainable than zero travel such as a future mode that produces power, improves air quality etc. Indeed it would be possible to think of a mode less sustainable than the private car if sub-classifications of emissions were to be taken into consideration. However, the reader should not lose sight of the fact that this is a coarse model designed to assist with household education and over-precision could swamp any benefit that would emerge from a future policy on travel behaviour sustainability. 3.1.1 Mode of Transport In terms of this model, expert opinion ranked the modes from 1 ['most' sustainable], to 8 ['least' sustainable], as shown in Table 3. The absolute maximum points score of 100 identifies with non-participation and the remaining modes are weighted by a method suggested in Edwards and Newman (1982), namely: according to their inverse rank position where Car = 1 through to Non-participant Mode = 8. Here, each rank is divided by the sum of the ranks and then a multiplier is chosen (450 in this case) to make the most sustainable mode identify with a score of 100. Such a strategy provides for the inclusion of additional modes. For example, had this project been carried out in the USA then it is probable that the ‘SKATE-Board’ would have been identified as a self-propelled mode, perhaps ranking between walking and cycling. The scores would then be adjusted accordingly. 3.1.2 Location of Activities This refers to the distance of activities from the household. The zero distance caters for the category of household occupancy that does not participate in certain activities outside the confines of the home. Distances to activities were deduced using a combination of mapping and location addresses. As the distance d increases, the points awarded reduce
Journal of Sustainable Development March, 2008
41
according to the relationship p = (100 - 2d). Here d represents the one-way actual distance as given by the respondent and p represents the points score. This formula is based on the assumption that an activity located ≥50 miles from the home would rate zero in terms of sustainability. The data revealed some participants with a journey to work in excess of 50 miles. 3.1.3 Trip Frequency Table 4 shows the corresponding points that are identified with each frequency. Clearly the fewer the number of trips to an activity the greater the influence on sustainability. Five points were allocated for a daily frequency and on a pro rata basis thereafter. 3.1.4 Proximity to Public Transport In this instance, the householder provides an estimate of the time for an able-bodied occupant to walk to the nearest public transport halt/stop - see Table 5. The closer a household is to a public transport halt the greater is the sustainability potential – this is an area where education can play a key role. For example, the DfES action plan (2003: 2.5) recommends the use of public transport as part of the education strategy but does not take this issue further by suggesting that availability of public transport should be a factor in choosing a domicile. Since the Department has the opportunity to educate young people who will, in the near future be selecting a location for adult life, this would appear to be a significant omission. 3.1.5 Household Motor Vehicles / Licence Holders The scoring strategy for numbers of household vehicles and licence holders is based on the law of diminishing returns. The simplest formulation of this association is given by the twin hyperbolic relationships: (k + 1) × p = 100 and (n + 1) × p = 100, where k is the number of cars, n is the number of licence holders and in either case, p represents the points awarded. Either no cars or no licence holders identify with the 'most' sustainable score, namely, 100 points. Table 6 illustrates the corresponding points awarded for the various permutations of licence holders and car ownership. 3.1.6 Sample Output A significant feature of the modelling process is the interpretation of non-participation in an activity. A household failing to participate in a particular activity would obviously not engage in any associated travel behaviour. Hence, that activity would register a top mark of 100 in terms of travel behaviour. It is important to recognise that the scoring profiles are related to travel behaviour only and not to generic household sustainability. It is for this reason that a score of 100 identifies with non-participation in an activity. The data shows that only a few activities within the range would rate a score of 100 – for example, households that do not have children in education, see household B129 in Table 7. Also, although the present sample did not reveal such cases, there are arguable exceptions that need to be accommodated within any scoring system – situations where there is no travel involved, for example, householders suffering from immobility or those with agoraphobia. In such cases, the model could be adapted to mirror 'travel behaviour to' rather than 'travel behaviour from within' the household. In terms of the journey to work, there is evidence in the data that some individuals reside in their place of work or use an internet/electronic office – so they obviously work, but are non-participants in relation to 'travel to work'. Others are currently unemployed and some are currently housewives/husbands (the latter is treated as an occupation). The data also shows occupants who are retired and have jobs. The potential exists for all these types to 'travel to work'. Consequently, for the purpose of developing a travel behaviour sustainability index, such occupants are allocated a 'non-participant status'. These individuals have greater sustainability. Hence it is evident that: a. Working at home – yields a higher HSI (a positive consequence of new technology) b. Being unemployed – results in a higher HSI (interesting consequences for full employment) c. Housewives/husbands – contribute to a higher HSI (negative consequences for working wives/husbands) d. Being retired – yields a higher HSI (positive consequence of an ageing population). The reader will appreciate that being classified as non-participant in 'the journey to work' may be offset by other activities – for example, a retired occupant might do more shopping or get involved in more entertainment etc. Sample outputs, which illustrate activity scoring for two households are given in Table 7. Namely, B129 from a Brownfield site location in Belfast and M037 from the suburbanised village of Moira. The specified activities down the left-hand side show that both education and employment are evaluated using the number of participants associated with each. Notice that for B129, the household does not attend a place of worship and correspondingly rates a score of 100 for non-participation across mode, frequency and location, similarly since there are no children in the home it rates a score of 100 for its non-participation in education. The specified activities down the left-hand side show that both education and employment are evaluated using the number of participants associated with each. Notice that for B129, the household does not attend a place of worship and

Vol. 1, No. 1 Journal of Sustainable Development
42
correspondingly rates a score of 100 for non-participation across mode, frequency and location, similarly since there are no children in the home it rates a score of 100 for its non-participation in education. The household in Belfast with its HSI of 63.6 is clearly more sustainable from a travel behaviour perspective than the household sample from Moira with its score of 48.2 where none of the attribute scores exceed the urban household scores. This significant difference is essentially due to the respective occupancy profiles – the home with no children attending school has a major impact on the final score. The distinctions in other activities are effectively smoothed out in the harmonic mean averaging process. 4. Educational Factors Although each household has an implicit Household Sustainability Index of travel behaviour it is of no real significance unless it becomes explicit and is accompanied by the necessary education linking its travel behaviour to the meaning of generic sustainability. Essentially the educational processes that underpin sustainability need to be embedded within the common practices adopted throughout communities for significant change in behaviour to take place. It has been shown explicitly in a number of projects that education has a part to play, for example The York Intelligent Travel Project (Haq et al, 2004) and the Individualised Marketing Project in Perth Western Australia (Sept. 2000). Clearly there is a role for schooling and the Department for Education and Science in the UK has proposed a strategy for learning about sustainable development (DfES, 2005). It may well be, however, that the impact of institutional policies may impact less on sustainability than the development of local initiatives and the growth of social consciousness in relation to the impact of community activities on the environment. It has been suggested (eg Kelly, 2004) that peer education effectiveness derives from the fact that, as individuals interact more frequently and with more emotional impact with peers (than non-peers) and consider peers to be a credible source of information, they are therefore more likely to be persuaded by peers. The data shows an interesting consequence of this phenomena when the duration of occupancy is partitioned into ESTABLISHED RESIDENTS and NEWCOMER RESIDENTS (An occupant is a Newcomer if the length of residency is less than 5 years.). Figure 4 shows that for the village of Moira the modal distributions are similar for both Newcomers and Established Residents, which is not the case for central Belfast. The close community spirit associated with a rural village could offer an explanation where newcomers have a greater opportunity to absorb and imitate peer behaviour, unlike the newcomer in an urban environment removed from a community spirit of involvement. Peer education programmes to date, however, have, generally been concerned with the dissemination of health information and attempts to change health practices. Peer influence, though, is a valuable resource for changing habits, as the health programmes have shown, and it may be timely to commence the implementation of similar programmes in relation to embedding concepts of sustainability within the everyday living habits of communities. This process is likely to be dependent on the recognition and valuing of the validity of implicit forms of knowing (Polanyi, 1966) and drawing on the shared understanding of communities. These understandings may be conceived of as a form of shared cognition initiated and continued through the formation of communities of practice (Wenger, 1998) where interactions between individuals based on their joint purpose and their endeavours lead towards agreed common goals. Creating such communities may entail a comprehension of Habermas’s view that people are embedded within their “lifeworld” which consists of the cultural and linguistic traditions in which they participate (Habermas, 1987). The lifeworld is a storehouse of unquestioned cultural givens from which those participating in communication draw agreed-upon patterns of interpretation for use in their efforts to address the everyday choices perceived to be available to them. The current pattern of settlement may suggest that movement to Greenfield suburban destinations has come to be viewed as a routine life choice. The provision of evidence that challenges this perception has the potential to encourage communities to reconsider choices that may, by now, have become embedded and intergenerational. Habermas (1987) places a high premium on the use of rational discourse in encounters among learners and argues that, in a democracy, such encounters can only lead to understanding if there is a level playing field for all the participants. From the work of Habermas, Bourdieu and Passeron (1990) has emerged the notion of ‘habitus’. This is the view that while there are many alternatives for action in particular situations for individuals, they are not usually considered in everyday life. Individuals, drawing on community norms are dependent on a resource of scripts and bodies of knowledge, which govern daily choices. In order to challenge common modes of understanding, it will be necessary for communities to develop a greater consciousness of the nature and implications of choice. In fact this is not an impossible aspiration and is already taking place as instanced by the considerable growth in the purchase of goods offered at higher cost, marketed as being 'fair trade' or 'organic'. Since the Agenda 21 policy is predicated on the devolution of demographic powers to local communities as the UK Government and other EU States are committed to implementing the policy across regions and local councils there is now, therefore, a statutory basis for a community policy to address educational change within communities. Within

Journal of Sustainable Development March, 2008
43
communities there is also an infrastructure for change in terms of pressure groups, voluntary organisations and the social economy bodies. The time may have come to examine the potential for synergy between local councils, local organisations and community educational initiatives. Discussing and negotiating change on the basis of respect for participatory and democratic modes of working within communities, as required by the Agenda 21 rubric, has the potential to lead to real changes in behaviours. These changes could lead to more sustainable household occupancies and household groupings in respect of their travel behaviour. 5. Relevant Outcomes 5.1 Summary of HSI Results The summary of HSI results for the complete spectrum of 958 household responses is given in Table 8. The corresponding distribution of HSIs is illustrated in Figure 5. The profile exhibits a quasi normal distribution with a slight negative skew. This would accord with expectation - in the sense that current transport strategies are perhaps just beginning to have an overall positive effect on sustainability, with environmental policies such as Agenda 21 and LA21 now beginning to have impact. Perhaps, in a resulting climate of TBS education, if this study were to be repeated five years hence, the distribution would exhibit a significant negative skew with many more households moving towards a higher sustainability index. As it stands, the normality in the distribution identifies with a state of equilibrium based on years of indifference towards environmental awareness. Table 9 is of particular interest as it disaggregates the mean HSIs for each settlement class by residential classification for each of the five base-line attributes. 5.2 Interpretation of Results In every case the HSI global totals for Established Residents exceeds the total for Newcomers and moreover, this is generally true when reading across the table for each attribute. Analysis of the data shows that the residential classification (Established Resident -V- Newcomer) has a statistically significant bearing on HSI; [F (1, 984) = 7.914, p < 0.5]. By considering only dominant cases of the difference: [HSI for Established Residents – HSI for Newcomers], the following observations can be made. a. Belfast - mode, distance and car/licence availability are key distinguishing attributes b. Fourwinds - distance is the strongest distinguishing attribute, but there is a large negative anomaly for proximity c. Knockmore - proximity is the key distinguishing attribute d. Moira - there are no significant distinguishing attributes. Some of these could have a bearing on educational policy formulation. For example, why would Fourwinds have a large negative anomaly for proximity? The data shows that this edge of city settlement is the least sustainable settlement class along the surveyed corridor and comprises mainly of newcomer residents (sustainability here means travel behaviour sustainability). Perhaps the anomaly can be attributed to the possibility that the newcomers were motivated to become aware of a recent CityBus-service upgrade. Also of educational interest is the fact that for Fourwinds the mean walk time to a public transport halt is 13 minutes. This is significantly greater than 5 to 9 minutes, which, across all settlements, was deemed to be an acceptable walk time from home to a public halt. Clearly, the notion that 13 minutes does not identify with an acceptable walking distance is a socially and historically constructed attitude, a consequence of familiarity with modern modes of transport and the growth of a habitus of restricted personal effort in relation to mobility. There is much current concern in the media regarding public health and lack of exercise. Linking health education to sustainability may make the public more aware of the multiple benefits to be gained through greater use of public transport. A more holistic approach to public education in these areas may enable citizens to begin to consider breaking their current routines and exploring new ways of living that may benefit health as well as enhance sustainability. Another interesting feature deducible from Table 9 is the fact that Fourwinds records the least overall HSI value and yet it exhibits the largest HSI value for the frequency of activity. This result displays a generic behaviour pattern for both Newcomers and Established Residents consistent with remoteness from readily accessible activities and the corresponding low HSI score for proximity to public transport would support this. Turning to Belfast, which is the most sustainable settlement from a travel behaviour perspective it is easy to see why mode, distance and car/licence attributes each constitute significantly greater HSI means for the Established Residents. Generally, the data shows that they rely more on public transport, travel shorter distances and have fewer vehicles and licences at their disposal. Although the Newcomers lag the Established Residents on HSI scoring, it is illuminating to note that their global HSI of 60.209 is much greater than any other settlement’s Established Resident total. This promotes the argument that if Established Residents from other settlements can be persuaded to move to a brownfield
Vol. 1, No. 1 Journal of Sustainable Development
44
site it follows that their brownfield newcomer status will enhance sustainability in general. This is a fundamental key to educational policy. With proximity dominating the HSI difference in favour of Established Residents in Knockmore it follows that as a dormitory settlement close to the large town of Lisburn (now with City status), the travel-behaviour benefits from the close proximity of established public transport halts to numerous developments. If an educational promotion were put in place directed at newcomer residents by the bus and train service providers it is possible that the newcomers would start to behave more in line with their brownfield counterparts. The data for Moira showing that there are no distinguishing attributes of travel behaviour illustrates the earlier arguments put forward in terms of peer education. While the results of this investigation point to a clear and unambiguous result in respect of the Belfast City Region, it is worth reflecting on the work of De Weerdt et al. (1996). They observe that the way people live their daily lives is determined to a large extent by the planning and design of settlements. For example, someone living in a city within southern California is more likely to use the car for going to work, for shopping and for recreation activities because local planning in California promotes mono-functional areas, low-density housing and very limited public transport. On the other hand, someone living in inner city Paris or New York is likely to travel by public transport because of the compactness of these cities, the mix of residential and other functions and their extensive metro system coupled with the difficulty of finding a parking space. In Amsterdam and Beijing many people use self propelled transport, a mode that would be totally unacceptable in LA, where distances to be covered are long. Hence in designing educational programmes based on HSI comparisons to promote more efficient travel behaviour, it is essential to seek expert opinion profiles appropriate to the city being investigated. 6. Conclusion The study points to the need to consider the impact of demographic mobility on sustainable behaviour and the role that learning may play in enabling incomers to communities to become aware of existing sustainable lifestyles within the communities they have gravitated towards. It was also pointed out in Cairns et al, (2005) that travellers do not adjust their behaviour instantaneously. Governments, on a global scale, are now committed to supporting local partnerships between local councils and schools to promote sustainable practices across communities. This entails a recognition that the development of more sustainable policies requires a profound reconsideration of the ways in which people can become involved in local decision-making and contribute to the creation of cultures of sustainability in their communities. The study suggests that, where incomers have demonstrated a broad acceptance of the local culture, they are more likely to adopt sustainable policies. The finding that brownfield developments may have greater potential for developing awareness of sustainable polices and practices emphasise the need to value existing community culture residues of positive knowledge and social capital regarding sustainability. In a climate where schools are often under pressure to produce continually improving examination results, there must be a concern that a focus on narrow academic achievement may impede schools from fully participating in the process of liaising with local councils to improve consciousness of sustainability. Smith (2004: 73) has asserted that “educators concerned about moving our society in these directions [towards ecological sustainability and social justice] must find ways to engender a sense of connectedness and responsibility in their students”. Equally, Jucker (2004:10) has argued that “it is impossible to look at educational issues before we develop a clear understanding of the dominant ideologies that currently perpetuate unsustainability”. The creation and durability of a form of education that will support sustainability is, clearly, a formidable challenge. A challenge that will involve policymakers and practitioners in both local councils and education adopting a critical approach to the analysis of current ideologies underpinning educational, social and educational policies in order to identify both barriers to sustainability and opportunities for a more closely connected approach to improving sustainability. It is clear that travel behaviour plays a significant role in the sustainability debate - supported by the value of opportunity offered by planning and transport policies. This paper seeks to promote consideration of educational policies as an essential pathway to the further enhancement of sustainability, but it leaves open one of the most obvious questions emanating from this research, namely: 'can the behaviour of the individual be altered and can individual hedonism be reduced?' For individual behaviour to change without outside direction, or for individuals to accept and even support political and other action that could result in change, there has to be individual awareness of the need to change. For example an individual can learn about the impact of a motor car on global warming but the car in pursuit of pleasure is likely to outweigh any potential concern. Here lies the crux that needs to be examined by a programme of research on the psychology of educational influence where an individual can be persuaded to trade-off hedonism for the future good of mankind. OECD (2002) has identified the following barriers to the attainment of environmentally sustainable transport:

Journal of Sustainable Development March, 2008
45
a. Lack of awareness of the need for change b. Lack of concern for future generations c. Fear of change, and thus resistance to change d. Attractiveness of present transport modes e. Absence of transport alternatives f. Resistance to collective alternatives g. Car ownership and h. Lack of adequate professional advice These if coupled with the model and findings described herein could provide the elements of a contextual framework designed to underpin an educational programme devoted to improving travel behaviour sustainability. However, if human behaviour and individual hedonism are to be altered and transportation sustainability plans are to be effective, there is a need to employ a combination of strategies aimed at improving travel choices, pricing and road design incentives. These have the potential to encourage more efficient travel choices, land use patterns that minimise the need to travel and encourage use of alternative modes. Acknowledgements The leading author extends her gratitude to the Transport Research Institute of Napier University Edinburgh UK who provided funding for the modelling aspect of this research. She also points out that the views expressed in this paper do not necessarily reflect the views of Waterman Boreham Ltd. References Blewitt, J.D. (2005). Education for sustainable development, natural capital and sustainability: Learning to Last. Environmental Education Research, 11(1), 71-82. Bourdieu, P. and Passeron, J.C. (1990). Reproduction in Education, Society and Culture. New York: Sage. Brundtland Commission Report (1987). Our Common Future. Oxford University Press Bunn, D.W. (1984). Applied Decision Analysis. McGraw-Hill. Cairns, S., Slowman, L., Newson, C., Anabel, J., Kirkbride, A. and Goodwin, P. (July, 2004). Smarter Choices – Changing the Way we Travel. Department for Transport, London. Cole, R.J. (1997). Prioritising Environmental Criteria in Building Design and Assessment. In: Brandon, P.S., Lombardi, P.L., Bentivegna, V. (Eds), Evaluation of the Built Environment for Sustainability (pp. 183-199) E & F.N. Spon, London. Daly, H, Cobb, J. (1994). For the Common Good. New York: Beacon Press. Dalkey, N.C. (1969). The DELPHI Method – An Experimental Study of Group Opinion. The Rand Corporation USA. Department for Environment, Food and Rural Affairs (2003). Learning to Last. London: DEFRA. Department for Environment, Food and Rural Affairs (2005). Sustainable Development Education Panel, London: DEFRA. http://www.defra.gov.uk/environment/sustainable/educpanel/educationsurveys/04.htm De Weerdt, H, Van Assche, J. and Devuyst, D. (1996). The Role of Local Authorities in Achieving Sustainable Development. In B. Nath, L. Hens and D. Devuyst (Eds), Sustainable Development. VUBPress, Brussels. Department for Education and Skills (2003). Sustainable development action plan for Education and Skills. London: DfES Department for Education and Skills (2005). Learning About Sustainable Development. London: DfES. http://www.dfes.gov.uk/aboutus/sd/objective3.shtml Donegan, K.S., Smyth, A.W. and Donegan, H.A. (1998). Using Consensus and Hierarchical Cross Impact Analysis in Modelling Residents’ Perceptions in their Choice of a Dormitory Settlement. In J.D. Griffiths (Ed), Mathematics in Transport Planning and Control (pp. 227-236). Pergamon. Donegan, K.S. (2003). Travel Behaviour - Its Impact on Sustainability Arising from The Suburbanisation of Dormitory Settlements. PhD Thesis, TRI Napier University, Edinburgh, UK. Donegan, K.S., Adamson, G. and Donegan, H.A. (2007). Indexing the contribution of household travel behaviour to sustainability. Journal of Transport Geography,15, 245-261.

Vol. 1, No. 1 Journal of Sustainable Development
46
Doxsey, W.L. (1994). The City of Austin - Green Builder Program. In Fanney et al (Eds), NIST Special Publication #863 (US Green Building Conference – 1994) pp. 21-31. US Department of Commerce, Technology, Administration. Edwards, W. and Newman, J.R. (1982). Multiattribute Evaluation. Paper No. 26, Sage Publications, London. French, S. (1988). Decision Theory - An introduction to the mathematics of rationality. Ellis Horwood. Goodwin, P. and Wright, G. (1998). Decision Analysis for Management Judgement. Wiley. Habermas, J. (1987). Theorie des kommunikativen Handelns. In T. McCarthy (Ed), The theory of communicative action: Vol 2, Lifeworld and System, a Critique of Functionalist Reason. Polity, Cambridge. Haq, G., Whitelegg, J., Cinderby, S. and Johnson, D. (2004). Intelligent Travel - Personalised Travel Planning in the City of York. Stockholm Environment Institute. http://www.sei.se/intelligenttravel/ Jucker, R. (2004). Educational Studies. Journal of the American Educational Studies Association. 36(1), 10-26. Keeney, R.L. and Raiffa H. (1976). Decisions with Multiple Objectives: Preferences and Value Trade offs. New York: Wiley. Kelly, JA. (2004). Popular opinion leaders and HIV prevention peer education: Resolving discrepant findings and implications for the development of effective community programmes. AIDS Care. 16(2), 139-150. Newman, P. and Kenworthy, J. (1999). Sustainability and Cities - Overcoming automobile dependence. Washington DC: Island Press. Pallant, J. (2001). SPSS Survival Manual - A step by step guide to data analysis using SPSS. Buckingham (UK) and Philadelphia (USA): Open University Press. Parker, J. (1972). Prediction in the Social Sciences: An Application of the Delphi Technique to Public Personnel. Michigan, USA: University Microfilms International. Pearse, D., Markandya, A. and Barbier, E.B. (1989). Blueprint for a Green Economy. London: Earthscan Publications. Pezzey, J. (1989 March). Economic Analysis of Sustainable Growth and Sustainable Development. Environment Department Working Paper No.15, World Bank. Washington DC. Polanyi, M. (1966). The Tacit Dimension. ISBN: 0-385-06988-X. Garden City, N.Y.: Doubleday and Co. Prior, J. (1993). Building Research Establishment Environmental Assessment Method, (BREEAM) Version 1/93, (2nd Ed.) U.K. BRE Report. Saaty, T.L. (1980). The Analytic Hierarchy Process. New York: McGraw-Hill. Saaty, T.L. (1995). Transport Planning with Multiple Criteria: The Analytic Hierarchy Process. Applications and Progress Review. Journal of Advanced Transportation, 29 (1), 81-126. Schiebe, M., Scutsch, M. and Schofer, J. (1975). Experiments in Delphi Methodology. In H.A. Lindstone and M. Turoff (Eds), The Delphi Method: Techniques and Applications (pp. 262-282), Addison-Wesley. SDS (Sustainable Development Systems) (1998). Agenda 21and Sustainable Development - with particular reference to Northern Ireland. Sustainable Development Systems, Belfast, UK. Smith, G. A (2004). Educational Studies: Journal of the American Educational Studies Association. 36(1), 73-92. Shields, T.J. (1991). A Fire Safety Evaluation for Dwellings. DPhil Thesis, University of Ulster. Stollard, P. (1984). The Development of a Points Scheme to Assess Fire Safety in Hospitals. Fire Safety Journal, 7(2), 145-153. Taha, H. A. (1997). Operations Research. Prentice Hall. The individualised marketing project in Perth Western Australia (Sept. 2000). http://www.dpi.wa.gov.au/mediaFiles/tsmart_southperthpilot3.PDF Watts, J.M. (2002). Fire Risk Indexing. SFPE Handbook of Fire Protection Engineering (pp.5\125-5\142). NFPA (USA). Wenger, E. (1998). Communities of Practice. Cambridge, UK: Cambridge University Press. Zietsman, J. and Rilett, L.R. (2002). Sustainable Transportation: Conceptualization and Performance Measures, SWUTC/02/167403-1. Southwest Region University Transportation Center, College Station, TX.

Journal of Sustainable Development March, 2008
47
Notes Note 1. A method ideally controlled by a co-ordinator who solicits collective specialist and mutually exclusive opinions from a number of previously appointed remote experts, called the Delphi panel. The co-ordinator summarises the various opinions as to the global consensus or otherwise and feeds this information back to the Delphi panel so that members can revise or sustain their previous opinions. The process is repeated until the co-ordinator is satisfied that the opinion has stabilised. See Linstone and Turoff (1975) for a detailed description of the Delphi Process. Table 1. Key Words in Travel Behaviour
Global Key Word Parametric Key Word
Mobility Journey Mode Income Goods/Services Social Economic Distance
Car Ownership Public Transport Locations Visited Accessibility Occupational Status Demography Motivation
Activity Health Leisure Low/High Order ShoppingEntertainment Commerce
Opportunities Constraints Family Make-up Occupational Status Travel Pattern
Lifestyle Household Individual Dependants Age Profile
Time Allocation Life Cycle Travel Frequency Destination Choice
Car Ownership Level of Ownership Impact on Other Modes Car Availability Licence Holders
Car-pools Utility Convenience
People Factor Suburbanisation Established Residents Newcomers Environment Community Attractiveness Security
Recreation Employment Education Development Transport Facilities Housing
Public Transport Infrastructure Convenience Reliability Fare Structure
Cleanliness Scheduling User Friendliness Comfort Factor
Used as an aide memoire in the selection of attributes and criteria to be identified with the proposed model of household travel behaviour sustainability.
Table 2. Typical Household Sustainability Index (HSI) Calculation
Baseline Attributes Mode Frequency Location Proximity Vehicles &
Licences
Mean Points Value vi 18.1 16.1 96.8 1.00 50.0 Expert Weight ( iw ) 0.216 0.155 0.322 0.193 0.114 Product wi vi 3.91 2.50 31.2 0.19 5.70 HSI = Σ wivi = 43.5
This table shows how a typical household’s mean points scores for each attribute are combined with the generic expert weightings for each attribute to produce an index of travel behaviour sustainability.
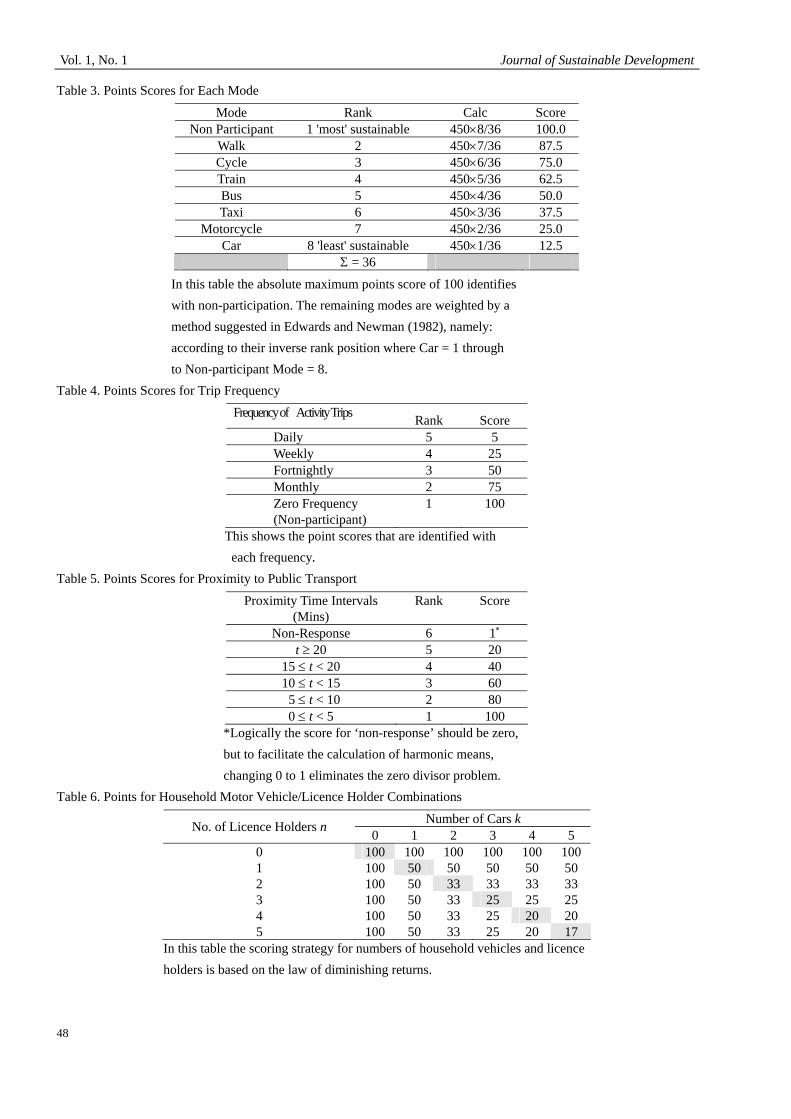
Vol. 1, No. 1 Journal of Sustainable Development
48
Table 3. Points Scores for Each Mode
Mode Rank Calc Score Non Participant 1 'most' sustainable 450×8/36 100.0
Walk 2 450×7/36 87.5 Cycle 3 450×6/36 75.0 Train 4 450×5/36 62.5 Bus 5 450×4/36 50.0 Taxi 6 450×3/36 37.5
Motorcycle 7 450×2/36 25.0 Car 8 'least' sustainable 450×1/36 12.5
Σ = 36
In this table the absolute maximum points score of 100 identifies with non-participation. The remaining modes are weighted by a method suggested in Edwards and Newman (1982), namely: according to their inverse rank position where Car = 1 through to Non-participant Mode = 8.
Table 4. Points Scores for Trip Frequency
Frequency of Activity Trips Rank Score Daily 5 5 Weekly 4 25 Fortnightly 3 50 Monthly 2 75 Zero Frequency (Non-participant)
1 100
This shows the point scores that are identified with each frequency.
Table 5. Points Scores for Proximity to Public Transport
Proximity Time Intervals (Mins)
Rank Score
Non-Response 6 1∗
t ≥ 20 5 20 15 ≤ t < 20 4 40 10 ≤ t < 15 3 60 5 ≤ t < 10 2 80 0 ≤ t < 5 1 100
*Logically the score for ‘non-response’ should be zero, but to facilitate the calculation of harmonic means, changing 0 to 1 eliminates the zero divisor problem.
Table 6. Points for Household Motor Vehicle/Licence Holder Combinations
Number of Cars k No. of Licence Holders n 0 1 2 3 4 5 0 100 100 100 100 100 100 1 100 50 50 50 50 50 2 100 50 33 33 33 33 3 100 50 33 25 25 25 4 100 50 33 25 20 20 5 100 50 33 25 20 17
In this table the scoring strategy for numbers of household vehicles and licence holders is based on the law of diminishing returns.

Journal of Sustainable Development March, 2008
49
Table 7. Two Cases of HSI Software Output - B129 (Belfast household - no children) and M037 (Moira household – with children)
M = Mode of Transport; F = Frequency; L = Location (Distance); P = Proximity and V/L = Vehicles & licences
The HSI for B129 is given by ∑=
5
1iii vw = 8.75 + 2.74 + 31.0 + 15.44 + 5.7 = 63.6 and the HSI for M037 is given by
∑=
5
1iii vw = 4.17 + 1.31 + 25.4 + 11.6 + 5.7 = 48.2.
Table 8. Descriptive Statistics: Overall HSI
Statistic HSI Mean 52.2600Median 52.3227Std. Deviation 9.345 Minimum 12.60 Maximum 84.37 Interquartile Range 8.6985
This table shows the summary of HSI results for the complete spectrum of 958 household responses.

Vol. 1, No. 1 Journal of Sustainable Development
50
Table 9. Mean HSI Values by Location and Residential Classification
LOCATION
BELFAST
(Inner-city)
FOURWINDS
(Edge of City)
KNOCKMORE
(Dormitory Area)
MOIRA
(Suburbanised)
ATTRIBUTE New Est New Est New Est New Est
Mode 6.586 8.453 3.635 3.927 3.403 4.028 3.705 3.869
Frequency 2.590 2.792 3.020 3.306 2.622 2.616 2.842 3.079
Distance 28.632 30.297 28.426 31.334 28.562 29.507 24.862 25.612
Proximity 16.735 17.724 9.586 6.834 12.688 14.424 14.019 14.168
Car/Licence Avail 5.667 6.867 4.656 5.198 4.606 4.776 4.560 4.491
Total 60.209 66.134 49.322 50.598 51.882 55.351 49.987 51.219
New = Newcomer, Est = Established Resident
It is clear from this table that for every location the HSI global totals for Established Residents exceeds the total for Newcomers and moreover, in most cases this is true when reading across the table for each attribute.

Journal of Sustainable Development March, 2008
51

Vol. 1, No. 1 Journal of Sustainable Development
52
Transport Modes
0 10 20 30 40 50 60 70 80 90
100
Belfast NEWCOMER
Belfast ESTABLISHED
MoiraNEWCOMER
Moira ESTABLISHED
Residential Split
Self Prop Private Public
Figure 4. Modal Distributions for Newcomers -V- Established Residents
Percent

Journal of Sustainable Development March, 2008
53
HSI
82.5
72.5
62.5
52.5
42.5
32.5
22.5
12.5
Freq
uenc
y
200
180
160
140
120
100
80
60
40
20
0
Std. Dev = 9.34Mean = 52.3N = 958.00
Figure 5. Household Sustainability Index: Overall Distribution
Vol. 1, No. 1 Journal of Sustainable Development
54
Discussion on the Cultivation System Construction of Sustainable
Innovation Ability for Small and Medium Enterprises Xuelian Yang
Department of Business and Management, International Business College Qingdao University, Qingdao 266071, China
Tel: 86-532-8595 3403 E-mail: [email protected] The research is supported by the research project of Qingdao Municipal Social Science Layout of 2007. Abstract Innovation is the soul of modern enterprise, and sustainable innovation is the essential for enterprises to keep their long-term energies. Small and medium enterprises should start from the construction of interior sustainable innovation ability cultivation system, cultivate innovational leading thinking, establish innovational enterprise culture, improve innovational encouragement system, walk out the difficulty of the second venture by right of sustainable innovation ability, and realize sustainable and long-term developments of enterprises. Keywords: Sustainable innovation ability, Small and medium enterprises Small and medium enterprises are the important economic part in the economy, which has been the unassailable question. For a long time, the thesis to puzzle small and medium enterprises can be concluded as two problems, and one is the venture success of enterprises, i.e. once venture success, and the other is how to survive in the long-term when the venture is succeed. The venture is the first innovation for small and medium enterprises, and the venture needs to select good project. Good project must accord with these following standards. First, the project has market demands. Second, the competition is not furious. Third, the project possesses business mode with some values including considerable profit space, development foreground, the possibility to quickly increase, and the difference ability which can not be followed. Numerous small and medium enterprises will be born in any country in every year. They grasp the space that large enterprises cannot consider, favorably make up the market vacancy, and successfully begin their own enterprise career. The innovation of market opportunity offers developments for small and medium enterprises, but one time innovation can bring up a small profitable enterprise, but can not make this enterprise become long-time enterprise. Just like people want to pursue life, every enterprise want to survival for a long-term, so when small and medium enterprises experience successful one time venture, they need consider where their development impulsions are. 1. The sustainable innovation is the only choice to ensure the second successful venture for small and medium enterprises In the knowledge economic age, enterprise thought the headspring of competition and development is the innovation, but the temporary innovation only brings temporary resplendence to enterprise, and the sustainable innovation ability is the root of competition. KFC possesses unique fired prescription in the world, which is the special advantage that other enterprises cannot obtained, but if only depending on this, KFC cannot become present KFC which spreads all over the world to more than eighty countries and possesses over nine thousands and six hundreds multiple shops. In China market, KFC will produce a sort of new product in average two weeks, and the quick speed of innovation makes all competitors amazing, so it does, more and more customers join into the loyal customer group of KFC, and now in the world, over six millions customers are enjoying delicious foods provided by KFC in every day. The magic weapon of KFC is not its secret prescription any more, but the enterprise sustainable innovation ability formed in a long term. What is the enterprise sustainable innovation ability? The enterprise sustainable innovation ability is the ability that enterprise can continually push and implement new technical innovation project (including innovations in techniques, product, raw material, organization, management and market), and constantly translate innovations into economical benefits. For a long term, people always thought those reasons that small and medium enterprises lack innovation abilities are the deficiency of interior capitals and technical strength and the absence of exterior support policies, but they ignore the

Journal of Sustainable Development March, 2008
55
inherent deficiency, i.e. enterprises have not established systematic cultivation system with sustainable innovation ability. The cultivation of innovation ability is a long-term and sustainable systems engineering, and the exterior power of innovation comes from market demands, and the interior power comes from the innovation culture in the interior of the enterprise and the innovation thinking of enterprise members, and integrated enterprise innovation system is the effective guarantee to keep innovation ability for the enterprise. The cultivation system of interior sustainable innovation ability is the source that small and medium enterprises acquire sustainable innovation ability, and is their advantage comparing with large sized enterprises. The innovation advantage of large sized enterprises rests with abundant R&D capitals, rich innovation experiences and advanced technical force in the industry. The sustainable innovation advantages of small and medium enterprises are embodied in that the leader’s individual thinking has more influential power than large sized enterprises and small and medium enterprises have small and flexible organizations which make the reform of organization become more flexible and easier, and the function of encourage system is more indirect and obvious. Therefore, the urgent problem to be solved is whether small and medium enterprises can quickly construct interior sustainable innovation ability cultivation system and offer original power for the growth and development of enterprises in their second venture stage. 2. Structure of small and medium enterprises interior sustainable innovational ability cultivation system The interior sustainable innovational ability cultivation system for small and medium enterprises includes three modules, i.e. innovational leading thinking, innovational enterprise culture and innovational encouragement system. To cultivate enterprise sustainable innovational ability, first, the leaders of the enterprise should possess innovation thinking and confirm sustainable innovate as the basic management concept of the enterprise, and constitute the development strategy taking innovation as the core, and inspire the formation of all members’ innovation thinking. Second, to establish and abstract innovational organizational culture and form sharing and good innovational atmosphere in all departments of the enterprise is the fertile soil to make sustainable innovational ability growth for the enterprise. Third, the enterprise needs establishing the interior innovational encouragement system. The innovational encouragement system is the impetus to make innovation translation and the direct transformer between the enterprise innovation result and economical benefits. In addition, the enterprise sustainable innovation always accompanies the reform of the organization, and the reform is the result of innovation and the impetus to implement innovation, and the favorable implementation of the reform has close relation with leaders, organizational culture and encouragement system. 3. How small and medium enterprises construct the cultivation system of interior sustainable innovational ability? 3.1 Establishment and influences of innovational leading thinking First, leaders should have innovational consciousnesses and earnestly practice what they advocate. The innovational thinking of all members is the direct spring of enterprise sustainable innovational ability, and every employee in the enterprise needs possessing innovational thinking and the innovation the process that all employees take part in. The cultivation of all member innovational thinking is a process from up to down, and the superior leaders are the sponsors and advocators in the process and the most important propellants of the innovation. The CEO or board chairman of small and medium enterprises is the founder of the enterprise, and in the early venture and growth stage, because leaders devote their much time and energies to deal with various confused business, so it make them usually lack the concept of comprehensive innovation and generally ignore the important function of innovation to the development of the enterprise, more blindly orient the object of the enterprise as the expansion of enterprise scale, and have no consciousness that the absence of sustainable innovation make the growth of the enterprise lose stable continuous powers. In every day, many enterprises quit the arena of the market because of deficient power of sustainable innovation. For example, past “IDILL” and “CHANGHONG” in Ni-Runfeng age induced the deviation of enterprise development strategy all because their leaders lacked innovational consciousnesses. Therefore, leaders of small and medium enterprises should cultivate their own innovational consciousnesses and innovational spirits first, bring innovation into the basic management concept of the enterprise, continually develop their thinking domain in practice, constitute the development strategy taking innovation as the core, and decompose and carry out innovational strategy into the objects of the enterprise. Just as Mayun, the CEO of Alibaba which is the leading enterprise in China Internet industry said “Whether traditional enterprises or new enterprises all need continual innovation, development, and growth in the failure. Enterprises should study foreign experiences and make their own views deeper, farther, and wider.” Second, enterprises should fully understand that employees are the main body of the enterprise innovation. For small and medium enterprises, every employee is the precious innovation source, and the innovation is not few managers or technical personnel’s business any more. Whether leaders of the enterprise emphasize the exertion of all

Vol. 1, No. 1 Journal of Sustainable Development
56
employees’ enthusiasm and creation is the important embodiment of the innovational leading thinking. The leading thinking will form a sort of leading fashion with characters of innovation, i.e. the innovation ability is an important standard to select employees, and the enterprise should pay attention to cultivate employees’ individual independence, personality and agility, encourage innovation, and fully exert all employees’ creative enthusiasms and harmonious “team spirit”. Third, enterprises should treat employees equally without discrimination and give all employees abundant respects. To treat every employee equally and fairly offers a guarantee to spread innovational thinking. Skeleton employees are easier to find real problems in their works. Shi Yuzhu, the CEO of Giant Group who put on “successful arriving” in China enterprise, summarized the reason that his teams didn’t abandon him when the enterprise is in the difficulty was to respectably and equally treat his every employee. The cultivation of all employees’ innovation thinking needs leaders of the enterprise have a sort of equal and just management consciousnesses and offer premises and guarantees for employees’ innovational thinking and innovational practices. In a word, only leaders of the enterprise possess comprehensive innovational thinking, utilize their own influences to teach by personal example as well as verbal instruction in the interior of the enterprise, extend and carry out the practice of the innovational thinking, the all employees’ innovational consciousnesses of the enterprise can be inspired, and the stable superstructure can be established to cultivate sustainable innovational ability. 3.2 Establishing innovational enterprise organizational culture and forming dense enterprise innovational atmosphere The enterprise culture construction of small and medium enterprises is generally weak, and the important enterprise task in the second venture stage is to implement systematic enterprise culture construction. When enterprises complete original accumulation, they need scanning their own organizational mission, enterprise responsibility and willing, and abstracting enterprise value standard and organizational tenet. Innovational enterprise culture is the soil of sustainable development of small and medium enterprises, and the important model of sustainable innovational ability cultivation system of small and medium enterprises. These following aspects are needed to establish innovational enterprise culture. First, enterprise should take the team cooperation spirit as the guidelines of innovational enterprise culture. Innovation is a sort of creative activity with high independence, which depends on the mutual communication and collision of different ideas and opinions, and all employees’ active participation and sincere devotion. The innovation is the result that enterprise draws on the wisdom of the masses. The team cooperation spirit is the allowance and active action to mistake and failure, just as the founder of Intel, Robert Noyce often said one sentence to encourage his employees, “don’t worry, just do it”. The establishment of the team cooperation spirit makes employees obtain intense adscription senses and consistently identify with organizational tenet and willing, feel occupational value and meaning, form a sort of good atmosphere with harmonious relationship and identical aim in the interior of the organization, and encourage employees’ enthusiasms to take part in innovation. So, every employee will actively think and make suggestions for the development of the enterprise. Second, the enterprise should establish interior experience platform to realize sharing of organizational knowledge. The construction of innovational organizational culture can not be accomplished in an action, and it needs the enhancement of management practice, the accumulation of experience. The spread and communication of interior experience is the important part to accumulate innovational experiences for small and medium enterprises, and the free communication and channel of interior information is the guarantee to establish innovational enterprise culture. The establishment of enterprise interior experience platform can realize complete sharing of organizational knowledge to reduce learning costs of knowledge and enhance the innovational level of all organizational members. Third, the enterprise should cultivate employees’ sustainable learning ability and make learning become a sort of occupational habit. Learning enterprise culture is an important character of innovational enterprise culture. Because knowledge is the spring of innovation, only continual learning, acquirement and accumulation of knowledge and experience can make sustainable innovation become possible. To establish learning organization is not the aim that only large sized enterprise needs and has ability to realize, and the learning habit needs to be cultivated since the enterprise is founded. To learn observation, thinking, communication, cooperation, and take learning as one part of daily work, every employee of the enterprise should be a person who should make learning as a sort of natural ability of the organization with sustainable learning habit and ability, and the sustainable innovational ability can be really cultivated and enhanced. 3.3 Establishment and perfection of innovational encouragement system From innovational thinking to innovational motivation and to the transform of innovational action, and the power of
Journal of Sustainable Development March, 2008
57
sustainable innovation all need comprehensive encouragement system as the guarantee, so enterprises need establishing innovational encouragement system to promote continual production of innovational results. To establish highly effective innovational encouragement system, the enterprise should institute the all-directional innovational encouragement plan which has no difference in department and post, and only employee puts forward valuable advices, the enterprise should give him innovational encouragement according to his actual economical contribution. For example, the AOKANG Group which is the first enterprise in China shoemaking industry early established the “Gold Idea Award Fund” and appropriates millions Yuan every year to award employees who find out problems and advice for the enterprise. Second, high effective innovational encouragement system needs to be constantly implemented. The quick and fair encashment of innovational encouragement is the representation with the maximum encouragement function, and the encouragement plan and system are not only temporary and face project. Only the innovational encouragement becomes the system which is trusted and identified by organizational members, employees’ innovation enthusiasms and creation will be inspired fully, and the sustainable innovational ability will grow in the interior of the organization and really become the original power to improve the development of the enterprise. Third, enterprise should bring innovation into the performance evaluation system of personnel or enterprise and establish good encouragement system. The good encouragement system needs taking the checking of innovational ability and enthusiasm as the important factor of the employee performance evaluation, and taking the implementation of innovational results as one standard of the enterprise performance evaluation. This process needs decomposing and quantifying innovational ability to implement comprehensive evaluation combining with economical contributions of the enterprise produced by innovation. 4. Conclusions The innovational consciousness of one nation needs begin from child, and the innovational ability cultivation of one enterprise needs begin from the foundation of the development of the enterprise, i.e. the construction of the interior sustainable innovational cultivation system. At present, small and medium enterprises face opportunity and challenge, and the sustainable innovation is the only choice to realize the second venture for the enterprise. The cultivation of thinking innovation will make managers of small and medium enterprises realize the importance of innovational consciousness to the development of enterprises, and the value to set up knowledge innovational enterprise. The cultivation of cultural innovation will make the interior of small and medium enterprises establish a sort of interior environment and active atmosphere fit for technical innovation, service innovation, product innovation and quality innovation. The cultivation of management system and organization innovation will offer stable interior support and encourage mechanism for sustainable innovational strategy. The cultivation of exterior innovational environment will eliminate obstacles for the implementation of innovational strategy. Finally, all these cultivation will build up the sustainable innovational ability of enterprises to enhance the core competition of small and medium enterprises and become real century enterprises. The tomorrow of small and medium enterprises must be better in the future. References Chen, Naixing. (2006). Problems and Countermeasures of Innovation System Construction for Small and Medium Enterprises. Venture Capital. No.12. Li, Jianjun. (2005). Enterprise Culture and System Innovation. Beijing: Tsinghua University Press. Lin, Ronghui. (2006). Rational Selection of China Small and Medium Enterprise Innovation Mode. Special Zone Economy. No.3.

Vol. 1, No. 1 Journal of Sustainable Development
58
Corruption and the Distortion of Technology Transfer and Marketing
Processes: An Insight into Africa’ Economic Malaise and the
Decadence of Its Social Fabric Ernest Kadembo
Department of Marketing, the Business School, University Centre Oldham Oldham Business Centre, Oldham, OL1 1BB, England, UK Tel: 0161 213 5049 E-mail: [email protected]
Abstract Corruption is an economic and social cancer afflicting industry and society at large the world over and is a major drawback to economic and social prosperity. It is the contention of this paper that corruption is a devastating form of social and economic injustice that has devastated the prospects for the dark continent of Africa. The root cause of corruption is the greediness of the leadership. Unfortunately corruption breeds corruption across the social divide as the leadership seeks to consolidate and protect themselves in the various facets of the economy, business and society. The solution to the corruption menace lies in changing the leadership which is entrenched in power and would be unwilling to vacate the powerful influential positions. Economic prosperity is largely driven by government policy that creates a conducive business environment, technology transfer, marketing activities which shape needs and demand patterns for economies. Corruption tends to distort marketing process and thereby hinder economic prosperity. The free play of market forces is hampered, economic aid from the donor community becomes almost impossible to attract and international investors shun the corrupt environments to the detriment of the economies and communities of the respective countries. There are various tools that can be used to combat the corruption menace, but without the will power on the part of the leadership the process becomes a futile exercise. This paper recommends a fresh start for Africa but the problem is that the perpetrators of the corrupt practices are the people in positions of influence and are not least interested in seeing a genuine fight against corruption. It is not impossible though as countries like Botswana, South Africa, Zambia, Egypt have demonstrated that it is not impossible to tackle corruption. Keywords: African economic and social development, Marketing, Corruption, Technology transfer 1. Introduction “In response to this demand of the people, and in its desire to rid our country of the vice of corruption my government has adopted an attitude of zero tolerance of the scourge and has accordingly made the crusade against corruption a top priority.” Nevers Mumba, VP Zambia Frisch (1996) boldly states that corruption is common across society’s facets and has probably been around since the creation of mankind. Frisch further points out that in the last two decades corruption has been on the rise unabated. This view could not have been nearer the crux of the matter in respect of the phenomenon of corruption and the new order of business, politics and society. The phenomenon of corruption is part of the daily news but often goes unpunished to the detriment of the prosperity of the community at large. Meghji, (http://www.asce.org/files/ppt/global/revisedrafikmeghi.ppt, accessed 6.01.07)an engineer with the Tanzania Association of Engineers argued in a seminar paper that, in Africa there are two killers- aids and corruption and he goes on to equate aids with corruption, thus suggesting that they have a similar effect on the society. The best brains in Africa flee from corruption, poverty and repression. The global call for internationalisation sounds like what they are responding to. The crisis in Africa is multifaceted, devoid of solutions and repulsive to informed criticism, incompatible with divine intervention and wholly enmeshed in disasters, war, hunger, political repression, pollution, environmental degradation, catastrophic epidemics, debt crisis, sloppy public services, tattered infrastructures and worse still outright wantom abuse of national resources for personal gain by the leadership. The democracy which

Journal of Sustainable Development March, 2008
59
the fathers want to call African democracy is intolerant to voices of dissent and ready to institute permanent exclusion through elimination. The exploiters’ club, that is the political leadership insists on the so-called African brotherhood all veiled in the naivity that criticism of other African leaders is tantamount to colonial mentality are instruments of protecting repression and corruption and subsequently protecting the chosen few at the expense of the poor majority. Much of Africa is enmeshed in a “crisis of development” which manifests itself in the general incapacity to generate a sustained improvement in the standard of living (Stein and Nissake, 1999). Economic crime and corruption are destructive ills which destroy both the social and economic fabrics of nations. In the main these ills militate against marketing processes which shape social and economic aspirations and thereby hamper development in the developing world to which Africa is the worst affected. Forums throughout the world have been convened to address corruption not only in Africa but throughout the world. The focus of this article is to underpin the notion of corruption and its impact on the various facets of business, society and governance and further investigate how corruption has destroyed the momentum for marketing in Africa. If one was to reflect on the infrastructure which is dilapidated in Africa credit goes to the colonialists for putting it in place in the first instance, but the sons of the soil as they want to be called have blatantly destroyed it. In pointing out that Africans are destroying Africa is not equal to saying that Africans are less equal to other races. The custodians of governance in Africa have acted irresponsibly and subjected their people to abject poverty and dehumanised them through various instruments within their own countries and outwith, particularly in the developed world where they go as economic immigrants and face all kinds of abuses veiled in so-called immigration controls. Addressing the failure of privatisation in Sub-Saharan Africa (Stein and Nwanko, 2001) suggest that the implementation failures are rooted in two most pernicious prevalences: (first) absolute corruption and mismanagement, and (second) poverty absolute and unattended. The question everyone of good intention would ask about the destiny of mother Africa within and beyond Africa is, Is Africa’s demise beyond redemption? This question is largely centred around the issue of governance. It is the leadership that shapes the destiny of a country or an organisation. Equally the question might be put across as Can African leadership in governance be redeemed to renew the fortunes of the highly resource endowed continent and banish the suffering of its people? This question is not only intriguing but also dangerous particularly if one raised it within the lootocracy (the government of fraudsters) forum. The sensitivity of this matter cannot be over emphasized, journalist have met their deaths in mine shafts or tortured for the dead, eliminated in dubious road accidents or in drums of acid simply because they dared scratch the evil of the chosen few. The G8 Evian Summit at its June 2003 meeting put corruption high on the political agenda under the theme “Action on fighting corruption and improving transparency” (OECD, 2003). Hopefully this will see more pressure ratcheted on the leadership of Africa to be more accountable in their governance and resource utilisation. Corruption, extortion and bribery are crimes, but very few politically powerful rarely get prosecuted for such crimes particularly in developing countries because the system of governance protects them. There appears to be two laws – one for the political leaders and their cronies and another for the ordinary people who are poor and defenceless. The law for the ordinary seems a lot fair because the emphasis is on the so-called rule of law- thoroughly investigated and prosecuted. The law for the rich seems to attract “lazy and tired” law enforcement agents. The same law is literally bent and straightened when it suits the “barons”. This is serfdom reincarnated at its best. These practices make a mockery of all the sacrifices for majority rule in Africa, actually these diabolic acts by the leadership vindicate the heinous acts of colonialism. George Orwell’s novel, Animal Farm is a true reflection of the case of Africa – African leaders are merely senior animals, the pigs, as the common saying goes – “All animals are equal but others are more equal than others”. 1.1 The study objectives The objectives of this paper are, to investigate the concepts behind the phenomenon of corruption, explore the extend it can become an acceptable way of life, raise arguments on how it distorts the marketing process, assess the cost of corruption to African nations and to suggest arguments on how to tackle the problem of corruption. Essentially the paper will take into account experiences from other continents and bring them into perspective in relation to Africa. There is no way this paper could be exhaustive in addressing the phenomenon of corruption. The extent of the enormity of corruption is huge and its impact on society and business is devastating. This discussion will cut an edge in that discussion by identifying the nature and bring into perspective how such practices have undermined development in the developing world with particular focus on Africa. The paper provides radical arguments about renewing Africa in the face of degradation which lies at the doorstep of its leadership in both the public and private sectors. 1.2 Research Methodology The research is largely based on an in-depth study of data from diverse published sources in a comprehensive analytical manner. Sources of Information include the USA Information Department, Transparency International, World Bank Reports, UK government, national publications within Africa and beyond from the internet and other publications. The data used is both quantitative and qualitative. A lot of reference will be made to the works of various chapters of
Vol. 1, No. 1 Journal of Sustainable Development
60
Transparency International, an organisation whose work is focused on increasing accountability, transparency and integrity of governments. The information gathered is analysed with a full understanding of the ramifications of renewing Africa. The Corruption Perception Index used by Transparency International will be used in trying to better understand the phenomenon of corruption and the extent to which it is embedded within the African democracy. 2. Definining the phenomenon of corruption and its causes According to The World Bank corruption is the misuse of public office for private gain. This definition is not comprehensive as it only brings up two aspects, public office and private gain. At the same time the definition does not capture the diversity of corrupt activities. Transparency International (TI) has defined it as “Corruption is an inappropriate or illegal behaviour of the public sector official (politician or public officer) by misusing the entrusted power for private gain of the person or related people.” Corruption is an activity, outside the constitutional government process, involving the sale of publicly produced goods and by government employees for payments or “bribes” not sanctioned by the government and is vilified as it is indicative of government failing its chief function of reducing government transaction costs and its consequences are the retardation of economic development and inertia and is a problem particularly in developing countries (Goorha, 200). Ultimately corruption is symptomatic of the intention to abuse absolute power without accountability. It is an issue of morals and greediness with blunt conscience about the suffering many whose crime is being powerless subjects who can only watch in total confusion as to why fate has had it that bad for them. Having considered multitudes of perspectives on corruption I would like to advance my definition of corruption as – Any act, intentional or unintentional, paid for financially or otherwise to gain an unfair advantage in influencing decisions for personal or group gain largely transacted for by political power, bottom power, financial stamina, authority or any other form of influence that can be used to arm twist or palm grease in one’s favour. For some nations whether in Africa or beyond corruption has become a way of life. Even for those whose duty is to act or perform specific functions would require, if not demand a direct inducement to act. Their wheels of motion can only be kick–started with the appropriate oiling, that is the payment for such services or otherwise. The higher the benefit the sharper and prompt will be the execution of the task. Olowu (1999: p608) quotes the Botswana Directorate of Corruption and Economic Crime as suggesting the most important aspects of economic crime and corruption as bribery; conflict of interest; diversion of public revenue and possession of unexplained property (living above one's visible income). All these issues adversely affect the functions of government and industry at large and ultimately economic and social well-being for the community at large. This is the real menace of corruption, that is, its devastation of the innocent majority. Evans writing on corruption for Tearfund, a charity organisation suggests a definition of corruption that it is “the act by which ‘insiders’ profit at the expense of ‘outsiders’ ”. This leads to abuse of position where corruption equals monopoly plus discretion minus accountability (C=M+D-A), offending against relationships, and underhandedness. Riley in Evans, http://tilz.tearfund.org/webdocs/Website/Campaigning/Policy%20and%20research/The%20cost%20of%20corruption.pdf, accessed 7.01.07: p7, categorises corruption under three headings as follows: “The first is incidental corruption. This is small-scale. It involves junior public officials, such as policemen or customs officers; it produces profound public alienation; it has little macro-economic cost, but it is often hard to curb. Secondly, there is systematic corruption. This is corruption that affects, for example, a whole government department or parastatal. It can have a substantial effect on government revenues; it may divert trade and/or development; it can only be dealt with by sustained reform. Thirdly, there is systemic corruption, that is, kleptocracy or government by theft. In this situation honesty becomes irrational, and there is a huge developmental impact.” 3. Is corruption a good business strategy The fact that corruption is a practice that cuts across all cultures, business and nationalities it certainly goes without question that it has substantial benefits to the peddlers. The fact that businesses commit or lose millions to corruption is evidence that corruption is big business. Corruption is rooted in unfair means of obtaining resources or favours deriving from the influence of power or resources. According to the submissions at the Roundtable discussion on corruption (OECD, 2003) there are four aspects of benefits from which arguments were advanced.

Journal of Sustainable Development March, 2008
61
1) The collective interest of the business sector- organisations are looking for business opportunities and not corruption opportunities. If the organisation could access such opportunities without being corrupt then it serves them money not to be corrupt. In any case to enjoy the favours organisations have to pay. 2) Sectoral interests- if firms in a particular industry are seen to be corrupt this is then used to bracket all firms in that industry. 3) Individual employees in individual companies- while a decision to bribe could boost career prospects through gaining lucrative contracts and ultimately getting promoted, it tends to cost the organisation. 4) Corruption costs for companies are huge, even for those operating in environments where corruption is commonplace- once a company starts paying bribes, it may find itself subject to escalating pressures to pay more. On the other hand if an organisation starts by establishing a credible non-corrupt approach it will lower its vulnerability to extortion, and solicitation; improved positioning in the honest segments of the company’s market. Ng (2006: 822) quotes the World Bank arguing that corruption is “the single greatest obstacle to economic and social development. It undermines development by distorting the rule of law and weakening the institutional foundation on which economic growth depends”. Ng (2006) further asserts that corruption is a serious social problem that adversely impacts on various aspects of society and is associated with a wide range of social and economic problems, including lower economic growth, foreign direct investment, infant mortality rate, and military spending. From the foregoing it is clear that corruption is a menace to humanity in Africa where it is rampant and that is largely one of the main reasons for economic degradation and social decadence. It would sound logical to argue that corruption is a curse to humanity- a destructive virus capable of attacking the core of humanity, that is the resources and values for sustaining development particularly because it thrives if the leadership promote and practise it. While the impact of corruption is abuse of resources and the suffering of the majority, the business processes and marketing in particular are distorted and give way to the black markets but at the same time hamper the development of the economy. 3.1 Forms of corruption The phenomenon of corruption is a complex issue embracing a diversity of practices all blended with the abuse of authority for some illegally obtained personal gain at the expense of the public. Misappropriation is a typical case of theft often described as misdirecting resources. During the Great Depression, over the period 1932 – 1933 Franklin Delano governor of New York gave money for the poor to Tammany Hall officials who lined up their pockets and the city ended up overborrowing under the mayor, James T Walker who had to leave office. The abuse of society through the exploitation of authority through sexual favours in return for promotion or a new job often associated with carpet interviews is corrosive to values and eats into the cultural fabric. Many senior positions have often been awarded to married women or single women through the so-called bottom power. In purchasing high value items often the buyer demands a payback before they can place the order. Ultimately this tends to raise the cost of goods by 20% according the USA Department of Federal Trade. The cost of such paybacks is passed on to the ordinary people through increased taxes. Nepotism is a practice where an official in the public or private sector favours his/ her own race or tribe or people he is related to. In a sense this is a very political act as it seeks to create a certain degree of security. Nepotism undermines productivity through employing unqualified people. At the heart of the failure of Africa particularly in reforming institutions is the issue of government failure (Nwanko and Richards, 2001). The different government forms that essentially compliment the failures are split into three categories of outright military dictatorships, pseudo-military democracies and paternalistic democracies. Such types of governments essentially are bent on enriching the few at the expense of the public good. A bribe, a type of fraud, is a business transaction, albeit an illegal or unethical one, that has the effect of corrupting economic and governance systems as it bestows an unfair advantage upon those paying the bribe (Pacini, Swingen and Rogers, 2002). The bribes could be split into two categories of according-to-rule and against-the-rule in which case both aspects refer to the maneuvering of somebody for benefit. The types of corruption in health Transparency International suggests that corruption in the health sector can take the following forms: Embezzlement and theft from the health budget or user-fee revenue. This can occur at central or local government level or at the point of allocation to a particular health authority or health centre. Medicines and medical supplies or equipment may be stolen for personal use, use in private practice or resale.

Vol. 1, No. 1 Journal of Sustainable Development
62
Corruption in procurement. Engaging in collusion, bribes and kickbacks in procurement results in overpayment for goods and contracted services, or in failure to enforce contractual standards for quality. In addition, hospital spending may include large investments in building construction and purchase of expensive technologies, areas of procurement that are particularly vulnerable to corruption. Corruption in payment systems. Corrupt practices include waiving fees or falsifying insurance documents for particular patients or using hospital budgets to benefit particular favoured individuals; illegally billing insurance companies, government or patients for services that are not covered or services not actually provided, in order to maximise revenue; falsification of invoice records, receipt books or utilisation records, or creation of ‘ghost’ patients. Other forms of corruption that relate to payment structures are: buying business from physicians by creating financial incentives or offering kickbacks for referrals; physicians improperly referring public hospital patients to their private practice; and performing unnecessary medical interventions in order to maximise fee revenue. Corruption in the pharmaceutical supply chain. Products can be diverted or stolen at various points in the distribution system; officials may demand ‘fees’ for approving products or facilities for clearing customs procedures or for setting prices; violations of industry marketing code practices may distort medical professionals’ prescribing practices; demands for favours may be placed on suppliers as a condition for prescribing medicines; and counterfeit or other forms of sub-standard medicines may be allowed to circulate. Corruption at the point of health service delivery can take many forms: extorting or accepting under-the-table payments for services that are supposed to be provided free of charge; soliciting payments in exchange for special privileges or treatment; and extorting or accepting bribes to influence hiring decisions and decisions on licensing, accreditation or certification of facilities. Source: Transparency Internatioonal, http://www.transparency.org/publications/gcr/download_gcr#download accessed 6.01.2007 The definitions of the different forms of corruption show that the majority of the people and are powerless to extricate themselves from their demise. 4. The state of corruption in Africa According to the site, (http://www.u4.no/helpdesk/helpdesk/queries/query20.cfm, accessed 6.01.2007) besides the financial costs of corruption, there is also the cost of the retarded development and increased inequalities - which are far less easy to quantify. The union estimated that corruption costs African economies in excess of 148bn dollars a year. The figure includes both direct and indirect costs of corruption, is thought to represent 25% of Africa's GDP and to increase the cost of goods by as much as 20% as reported by (BBC News, 18/09/02; The Economist, 19/09/02]. In 1996, it was estimated that up to 30bn dollars in aid for Africa found its way to private accounts in foreign banks, an amount equal to twice the annual GDP of Ghana, Kenya and Uganda as quoted from Celarier(1996) in an article, The Cost of Corruption.. The African Development Bank suggests that corruption leads to a loss of approximately 50% of tax revenue, which in some instances is a greater amount than a country's total foreign debt. The African Development Bank estimates that lower income households spend an average 2-3% of their income on bribes, while rich households spend an average of 0.9% of their income. These figures demonstrate that there is a huge cost that comes with corruption. The cost impacts on society and business at large and hence the distortion of the pricing process in marketing which often pushes up the prices. 5. The impact of corruption on the marketing process Kotler (1988) defines marketing as “… a social and managerial process by which individuals and groups obtain what they need and want through creating and exchanging products and value with others.” The American Marketing Association defines marketing as: “…the process of planning and executing the conception, pricing, promotion and distribution of ideas, goods and services to satisfy individual and organisational objectives.” Pride and Ferrell (1988) state that “Marketing consists of the individual and organisational activities that facilitate and expedite satisfying exchange relationships in a dynamic environment through the creation, distribution, promotion, pricing of goods, services, and ideas.” The central issue in the definition of marketing is the satisfaction of consumer needs and wants in a dynamic environment. However, it is important to note that if there are impediments in the environment the execution of the marketing function can be distorted. The different authors are agreed on marketing being a social process, so is the notion of corruption. Corruption takes place whenever the delivery of value is abused for gain. This is facilitated by the use of power, it be in business or in politics, that is, in governments.

Journal of Sustainable Development March, 2008
63
Simkin (2000: p154) lists the common themes in most explanations of marketing as: 1) The ability to satisfy customers; 2) The exchange of product or service for payment or donation; 3) The need to create an edge over competitors; 4) The identification of favourable marketing opportunities; 5) Profits or financial surpluses to enable a viable future for the organisation; 6) That resources are utilised shrewdly to maximise a business's market position; and 7) The aim is to increase market share in priority target markets. This set of variables is authentic and presumes a normal business environment with scope for the play of market forces. In the case of a business environment fraught with corruption such forces may be hampered. Competition the driver for marketing may be curtailed and so will international investment whose security against processes like expropriation and bribes may not be guaranteed. Bathie and Sarkar (2001) provide a cycle of activities that epitomise the execution of the marketing function. The first stage of that process is the understanding of customer value requirements which may not be better analyzed if the marketing environment is distorted.
Figure 1. Customer Focused Exchange (Source: Bathie and Sarkar 2002: p242)
According to Bathie and Sarker (2002: p241) presents factors required in the operationalisation of a marketing orientation as: 1) Recognise that organisational objectives are only achieved through exchanges with customers 2) Recognise the primacy of customers in the exchange process 3) Organise organisational activities around a focus on customers receiving value for exchange with the organisation

Vol. 1, No. 1 Journal of Sustainable Development
64
4) Create an exchange relationship with customers that are mutually beneficial as a basis for continued relationships. In order to realise these circumstances the environment should be conducive for good business. However a corrupt environment is detrimental to good business. Despite the glaring impediments to development in a corrupt environment there are some pundits who would argue that such practices are good for development as they enable things which might either never happen or take too long to happen to take place much faster. But that argument does not address the cost of favouring the paying somebody and the cost to those who do not enjoy either political or economic power for abuse. According to Appiah –Adu (1997) the main impediments to marketing in the developing world include the complex socio-cultural, poorly functioning governmental systems, laws, political and economic environments and other factors as poor growth, high inflation rates, rigid trade barriers, political instability and frequent changes in business laws, inadequate communications, sub-standard infrastructure and high political risk serve as barriers to development. Frisch (1996) makes a number of pertinent observations in respect of the impact of corruption on the market as summarised below: 1) Bribes have become substantial (sometimes 20% of the transaction) in international transactions and this demonstrates how corrosive the practice is on the market and stalls the development process 2) While awareness on the devastating effects of corruption on markets, development and society at large there had been no sustained efforts to contain the menace, with the breakthrough coming in 1994 through the creation of Transparency International. 3) The process of tackling corruption is complicated by some practices of European Union member states whose laws directly support corruption by allowing tax deduction for bribes in international transacting and these practices distort competition and gives advantage to the corrupt players. 4) “Not only does corruption increase the cost of goods and services, and thus add to the receiving country’s debt, but all too often priorities are determined by crooked officials, resulting in projects which, instead of addressing real development needs end up in ‘white elephants’ graveyards”. Frisch (1996) available at (http://www.europeanvoice.com/archive/article.asp?id=2731, accessed 3.01.2007.) From the foregoing it is very clear the development of the marketing discipline tends to flourish in environments where the play of market forces is dominant. Where market forces are constrained or inhibited that stifles innovation and the freedom to choose on the part of both the supplier and the customer. It is certainly an irony that the developing countries where marketing is needed most are rife with restrictive instruments that militate against the play of market forces while the developed world tends to be more liberal with innovation and boost the marketing function. 6. The cost of corruption to Africa Olowu (1999) points out that corruption has come to centre stage of state reform and governance improvement programmes of many developing countries but largely more focused on African countries in particular in the 1990s because: 1) Its effects are as devastating as the AIDS epidemic or armed insurrection. 2) Africa is too dependent on other countries to sustain itself because of the continent's debilitating poverty and corruption tends to thrive. 3) Most of the programmes for economic, political and institutional reforms hinge on the integrity of the emerging political and administrative systems. Investment and aid resources are dependent on the transparency of the receiving countries making it difficult for corrupt states to get aid. 4) Most African countries are experiencing multiple dimensions of change, economically, socially and politically and that is providing a rich breeding ground for corrupt practices. According to the Corruption Perception Index (June, 2001, October 2003) published by Transparency International, Bangladesh is the most corrupt country in the world. Only in October 2003 a US$150 million project on Total Literacy Movement was abandoned as corruption took root. In Africa the most corrupt country is Nigeria followed by Angola as per the October 2003 Perception Index released in October 2003. The International Monetary fund (IMF) has estimated that global monetary laundering is at between 2% and 5% of global gross domestic product. As of 1996 this stood at between US$590 million and US$1.5 trillion (Carlson, 2000). A report by Elizabeth Blunt (2002) suggests that corruption costs Africa US$150 bn per year a phenomenal amount which if contained could wipe out all the misery that abounds this poor continent. This serves to provide a clue about the cost of corruption. For a moment if one was take into account the cost of non-quantifiable elements in the form of
Journal of Sustainable Development March, 2008
65
deaths resulting from abuse of resources, torture as an instrument for repression and thereby retain power the figure could treble. The cost in monetary terms means very little in comparison to the total picture when health hazards created by abuse of power are taken into account, risks created through shody pieces of work as collapsing infrastructures, loss of incomes for multitudes of families and a multitude of lost opportunities are to be taken into account. Overally development is stalled because of corruption and the poor suffer. The dictators suck the sweat of the many and in the process create a whole legion of their own supporters to continue the culture of corrupt practices. To a large extent competent management, made insensitive by military or political connections, culminating in inefficient management, political manipulation and corruption have effectively turned state-owned enterprises into national liabilities (Stein and Nwanko, 2001). False claims about the state of resources like in the case of Enron who misrepresented the state of their accounts and led to a major shake-up of the stock market is a case in point about the effects of corruption to the public good- shareholders, employees and the public lost out. Mobutu consolidated his power by sharing the country’s wealth with political allies, a system often described as a kleptocracy and is reporteded to have absconded with billions of dollars in Western aid and export earnings generated by the country's mineral wealth, and is said to have amassed a vast personal fortune, believed to have peaked at $4 billion in the mid-1980s. Meanwhile a potentially wealthy country, plagued with corruption and mismanagement, suffered economic ruin (Fegley, http://encarta.msn.com, accessed 22.12.2003). The cost of the plundering of resources surpasses the estimated US$4 billion when human suffering, torture and the lost opportunity for national advancement are taken into consideration, issues that cannot be easily quantified in monetary terms. 7. Towards a solution for the corruption crisis The will to resolve the corruption crisis is far fetched. Corruption is so rooted in the culture that reducing it is dangerous and almost impossible given the powers that pedal it. The generations of regimes passing on power to the next seem to share the same philosophy that authority comes with non-accountability. There are various instruments that have been proposed by different institutions. The government that can muster the destiny for a new Africa devoid of corruption must be “New” in all conceivable senses of the word in which case there has to be newness in composition, focus, orientation, and socio-economic emphasis (Stein and Nwanko, 2001). This is a mammoth task as it challenges the real fabric of African governance. It would appear the leadership in Africa is of the persuasion that the public owes it to them to survive. It is serfdom at its best. The leaders are untouchable and twist all arms of governance for their own good. They make laws to protect themselves when it suits them. The new era is far-fetched and obviously dangerous territory to tread on. The populations are naïve. They fear the powers of those in leadership. It is a reversal of the convention of government of the people by the people. It is a government of the leaders and their cronies who mortgage nations for their own good. The framework for redressing failure in Sub-Saharan Africa may take the following dimensions (Gordon, 1996): 1) Changing the role of government and strengthening government capacity; 2) Enhancing political capacity for policy implementation 3) Nurturing civil society; and 4) Establishing the institutional foundations While these are noble propositions the reality of it all is what comes into question. The governments are strangers to accountability and are resistant to accountability and diversity. The problem lies with the warped beliefs where leaders are seen as fathers of society whose powers cannot be challenged. Well intentioned as it may the leadership has simply found it worthwhile to abuse such values of the general African Society. Political leaders find it worthwhile to abuse all systems and stifle any divergent voices so that they remain unchallenged and unfortunately those who come through the ranks tend to come from the same school of leadership and continue to perpetrate the misery of the many people. Mupuchi (2003) refers to Nevers Mumba, then Vice President of Zambia as suggesting that the Zambian government has realised that the prevention of corruption is better than cure and that there would be zero tolerance of corruption. It is easier said than done to suggest a ruthless approach to dealing with corruption. Essentially this has become a political gimmick to try and woodwink the public into believing a serious commitment to vote winning ideals. The reality of the whole matter is that if this was real then all Africa will be without corruption for many have said it in the past to no avail. The leadership code as a tool is meant to provide some kind of register for monitoring politicians’ wealth. This is often abused by simply using fronts for investment. Legislation no matter how well intentioned is handled by corrupt judges, hence in Kenya only in October 2003 suspended a number of corrupt judges who were alleged to be corrupt.

Vol. 1, No. 1 Journal of Sustainable Development
66
Transparency International as an organ for accountability, transparency and integrity is inadequate as it is not entrenched in governance hence does not command much power. The World Bank and IMF can push for significant change by providing conditional loans. However, its main weakness lies in monitoring the usage of such loans as false claims can be made by the corrupt regimes over expenditure. In the case of Slovakia for a common citizen, solving corruption cases and allegations relating to top positions would be a signal that there is a genuine will to address the issue and scandals as seen today can have a positive impact because they can create public pressure for systematic changes but at the moment nothing is happening to fix laws in big politics (Daniela Zemanovicova, 2003). Skinner (2003) argues that to earn trust Shell is driven by the following activities 1) Engage with critics – Essentially for the leadership in Africa this should not amount to confrontation 2) Demonstrate clear principles- this should be driven by accountability and good intention in all dealings 3) Live up to commitments- In the case of politicians the multitudes made during electioneering are normally swept aside immediately after winning 4) Be transparent – In most cases information about governance is not readily available and nobody is accountable. 5) Communicate effectively – This should be a genuine effort to tell the truth about issues of common concern rather than mere spin to drum up propaganda. Skinner further argues that profits must be linked with ethics and that the challenges for the future lie in economic trends, social responsibility and the environment. These values will go a long way if adopted by domestic, multinational companies, central and local governments in Africa. Corruption is a containable national and international phenomenon with the extremely debilitating stand being that it is a common practice among the developing countries (Richards et al, 2003). The paradox of corruption is that the criminals are in charge – they shape the law, decide on who gets prosecuted, change the law when it suits them and decide on who gets sacrificed for daring to sniff principled governance and of cause the intensity of the punishment. It is obviously of utmost importance that workable recommendations are put forward without having to be wishful about how to end the trajedy of corruption. In actual fact the issue is not about ending corruption but reducing it because its so embedded in the cultures to a point that certain children grow up to accept that corruption is normal because they are nurtured in it. 8. Recommendations on tackling corruption The real corruption crisis goes beyond mere legislation and operationalising instruments to curb corruption. Every recommendation put forward will be analysed for objectivity and practicality in meeting the desired result of curbing corruption. The first recommendation is the creation of principled governments that respect the rule of law and are transparent in governance and accountability. This immediately calls on starting afresh. The only problem will be who and where to start, as all the powers that control the past and strongly positioned for the future are firmly imbedded in the systems. If the failing governments of Africa were to be cornered by international agencies they would always claim sovereignty and vehemently demand their independence over their internal affairs. Surprisingly the same states will clamour for aid to resolve crises to the same agencies which should not interfere with their sovereignty. The second recommendation is the educations of the people so that they can be more organised and take up the challenge to question the leadership or demand accountability. The challenge for this recommendation is the resources and who picks up the initiative to educate the masses. There is scope for Transparency International but the question is the extentto which it can muster resources to drive this agenda forward. The third recommendation is legislation and monitoring. This mechanism tends to deal with small levels of corruption and tends to spare the big fish because they tend to mustle their way through against the law. The fourth recommendation is the call by well intentioned citizens of Africa to seek the support of the international community to make accountability and transparency a conditionality for accessing important aid. There is a limit to this as in most cases the whole accounting system is simply cooked up to meet the requirements of donor institutions. Transparency International (2006) recommends the following instruments in fighting corruption within the pharmaceuticals industry, 1) Transparency 2) Codes of conduct 3) Civil society participation and oversight
Journal of Sustainable Development March, 2008
67
4) Whistleblower protection 5) Reducing incentives for corruption 6) Conflict of interest rules 7) Integrity pacts and debarment 8) Rigorous prosecution These suggestions are well founded and very effective provided the intention and authority are in place to ensure their execution. These tools have helped starve off corrupt activities in the developed countries because the implementation is genuine and thorough whereas in Africa its sanctioned by the big powers who are the main beneficiaries of the corrupt activities who make an effort to weaken the activities for fighting corruption. 9. Conclusion The phenomenon of corruption in Africa is a disastrous cancer costing millions in lost resources that could have been utilised for the national good. The corruption crisis tends to have its roots at the echelons of power, whether in the public or private sector. Much of the disasters Africa faces are as a result of corruption which stalls development and hinder social and economic advancement thereby permanently mortgaging much of the citizens of Africa to permanent poverty and continued suffering. It is important to note that this discussion does not suggest that there is no corruption in the developed world but that there are a number of instruments in place which minimise the adverse effects of corruption in the developed world. The various scandals which have been well publicised in the western world bear testimony to the existence of this disastrous cancer. However, it is the defacto legalisation of this menace in Africa which is an issue for concern as it allows the practice to flourish and destroy society and economies at large. While so many progressive institutions have weighed their views on the corruption menace in Africa the solutions are far fetched as the leadership who should protect society from this menace are found wanting in this respect. References Anonymous. (1985), AMA Approves a new Marketing Definition, Marketing News. Bathie, D. and Sarkar, J. (2002). Total quality marketing (TQMK)- a symbiosis, Management Audit Journal, Volume 17, No 5, pp 241- 244. Goorha, P. (2000). “Corruption: theory and evidence through economies in transition”, International Journal of Social Economics, 27,12; pp1180 – 1204. Kotler, P. (1988). Marketing Management, Analysis, Planning, Implementation and Control, Prentice-Hall International. Appiah-Adu, K. (1997). Marketing in emerging countries: evidence from a liberalized economy, Marketing Intelligence & Planning, Vol. 15, No 6, pp291–298. Nwanko S. and Richards D. C., “Privatisation: The myth of free market orthodoxy in sub-Saharan Africa”, The International Journal of Public Sector Management, vol 14 no 2, 2001, pp 165 – 179. Nze C. F. and Nkamnebe A.D. (2003). Internalising effectiveness and accountability for the public good: strategic choices for public sector bureaucracies in Africa, Management Decision, Vol41 No 3, pp 281 – 286. Pacinin, C., swingen J. and Rogers H. (2002). The OECD Convention and bribery in international business transactions: implications for auditors, Managerial Auditing Journal Vol 17 No. 4, pp 205 – 215. Pride, O.C. and Ferrell, K. (1988). Marketing, Concepts and Strategies, Houghton Mifflin. Richards, D. et al. (2003). “Debt burden and corruption impacts: African market dynamism, Management Decision, Vol 41 No4, pp304 -310. OECD. (2003). Roundtable on Corporate Responsibility: Enhancing the Role of Business in the fight against Corruption- Making the most of the OECD for Multinational Enterprises. Simkin, L. (2000). Marketing is marketing maybe!; Marketing Intelligence & Planning, Volume 18, No. 3, pp 154-158 Skinner P. (2003). “Shell’s bid to build its reputation”, Strategic Direction, Vol 19, November 7, pp 9-11. Olowu, B. (1999). Combatting corruption and economic crime in Africa: An evaluation of the Botswana Directorate of Corruption and Economic Crime; The International Journal of Public Sector Management, Vol. 12 No. 7, pp. 604-614.

Vol. 1, No. 1 Journal of Sustainable Development
68
World Bank. (1989). Sub-Saharan Africa: From Crisis to Sustainable Growth, World Bank, Washington, DC. Electronic Sources Evans R.M., http://tilz.tearfund.org/webdocs/Website/Campaigning/Policy%20and%20research/The%20cost%20of%20corruption.pdf, accessed 7.01.07 Frisch, D. (1996), Curbing international corruption; European Voice Vol. 2 No. 41, available on http://www.europeanvoice.com/archive/article.asp?id=2731, accessed 3.01.2007. Meghji, M.R., http://www.asce.org/files/ppt/global/revisedrafikmeghi.ppt, accessed 6.01.07. Mupuchi S., “Corruption has become a cancer, Says Mumba”, The Post, www.allafriac.com/stories., Accessed 10.10.2003 Pisarova M., “Corruption keeps drinking society’s blood”, www.slovakspectator.sk/clanok.asap, Accessed 13/10/2003. Randall Arlin, “Mobutu Sese Seko,” Microsoft Encarta Online Encyclopedia 2004,http://encarta.msn.com 1997-2004 Microsoft Corporation. Accessed 22.12.2003 Transparency International, http://www.transparency.org/policy_research/surveys_indices/cpi/2006, accessed 6.01.2007. Transparency International, http://www.transparency.org/publications/gcr/download_gcr#download accessed 6.01.2007 U4 Anti-Corruption Resource Centre (1996), http://www.u4.no/helpdesk/helpdesk/queries/query20.cfm, accessed 6.01.2007.

Journal of Sustainable Development March, 2008
69
Diversity Status and Sustainable Uses of Some Minor Forest Products in
Ban Thung Soong Community Forest in Krabi Province, Thailand Hardawati Yahya
School of International Tropical Forestry, Universiti Malaysia Sabah Lockeg Bag 2073, 88999 Kota Kinabalu, Sabah, Malaysia
Tel: +6088-320000 ext: 8604 E-mail: [email protected] S. Bhumibhamon
Department of Silviculture, Faculty of Forestry, Kasetsart University, 50, Phaholyothin Road Chatuchak, Bangkok, 10900 Thailand
Tel: +662- 3796937 E-mail: [email protected] D. Sookchaloem
Department of Forest Biology, Faculty of Forestry, Kasetsart University 50, Phaholyothin Road Chatuchak, Bangkok, 10900 Thailand
Tel: +662- 579-0176 ext: 518 E-mail: [email protected] Abstract The diversity status and sustainable uses of some Minor Forest Products in Ban Thung Soong Community Forest in Krabi Province were evaluated based on Important Value Index (IVI) analysis, utilizing method and quantitative ecological data based on local wisdom. The studies were found that at the highest level of 200-300 m altitude, the number of trees and total basal area was the highest than at level elevations of 0-100 m and 100-200 m from 12 stands (20x50 m2/stand). From IVI analysis, there were 65 species of plants found in Ban Thung Soong Community Forest (BTSCF). Analysis of IVI were found that the Xylia xylocarpa (Roxb.) Taub. var. kerrii (Craib & Hutch.) I.C.Nielsen shows the highest IVI with 22.37%. The highest percentage of relative density, relative frequencies and relative dominance were found in Homalium undulatum King with 7.50%, and 7.55% with Xylia xylocarpa (Roxb.) Taub. var. kerrii (Craib & Hutch.) I.C.Nielsen respectively. The numbers of species in BTSCF were 49+65 species ha-1 and comprises of number of trees, saplings and seedlings ha-1 were 4,697; 119,166 and 252,500 of trees ha-1 respectively. There were 49 species categorized as Minor Forest Products (MFPs) which include medicinal plants, edible plants, and non-edible plants. Keywords: Minor-forest products, Plant diversity, Sustainable uses, Community forestry, Important value index 1. Introduction In Thailand, Minor Forest Products (MFPs) refer to all forest products other than timber, charcoal and fuelwood (Subansenee, 1994). MFPs are essential to the livelihood and well-being of Thai rural communities. In the past, MFPs received only modest attention from the Royal Forest Department (RFD), and the quantity and diversity has decreased for four reasons: adverse impact of deforestation and environmental degradation, over-exploitation, use of traditional, unimproved methods in harvesting and lack of information and inadequate training. Now, the direct and indirect values of MFPs are more clearly recognized and receiving interest from the government of Thailand. The selection of Ban Thung Soong (BTS) as the study area was because BTS had good management of community forest and people were willing to conserve the sustainable resources of MFPs. BTS Community Forest is one of the good examples of community forestry management in the Southern provinces of Thailand. People in BTS not only conserve their community forest but also sustain forest resources without destroying or disturbing the natural resources. The study of MFPs was as indicators to determine the sustainable uses of forest resources in the natural habitat and indicate which species of MFPs were important and under threat. Through Important Value Index study, the importance of plant species indicates the dominant species that exist in the forest. Some MFPs were chosen based on the species composition in BTS Community Forest.

Vol. 1, No. 1 Journal of Sustainable Development
70
The important and sustainable uses of natural resources can improve the development of forest resources management. Through this study, the importance of MFPs in the natural habitat will help to improve rural peoples’ awareness to sustain the uses of MFPs. The effort to conserve forest resources through community forestry management will sustain the composition of MFPs in the natural habitat. The traditional knowledge of local parataxonomist is also important to ensure the sustainable uses of MFPs for the future generation and research development will be continuous and improved. Therefore, this study was undertaken to determine the diversity status and sustainable uses of some MFPs in BTSCF and specifically to study MFPs that existed in natural habitats and were used by the villagers for their livelihood. 2. Research Materials and Methods Field data were collected in Ban Thung Soong Community Forest (BTSCF) determined from three elevation levels at 0-100 m with three stands (20x50 m2/stand) of ten sample plots (10x10 m2/plot), at 100-200 m altitude with four stands and at 200-300 m altitude with five stands. Totally there were 12 stands selected for survey the plant species vegetation distribution in community forest area. All stands and all trees with DBH from 4.5 cm and height with 1.30 m above ground level in 20x50 m2 (10 sample plots of 10x10 m2) were collected and measured in each stand. Saplings with height over 1.30 m above ground level but DBH less than 4.5 cm were measured and recorded in 4x4 m2 plot. For seedling collection, plants with height lower than 1.30 m from ground level were measured and recorded in each 1x1 m2. 2.1 Study area The study was conducted in Ban Thung Soong Community Forest (BTSCF) in Krabi province. Krabi area is approximately 4,708.5 km2 (2,942 820 rai) with about 336,210 people and population density is 71 in/km2. Krabi is located 814 kilometers from Bangkok and between latitude 7030’ and 8030’ North and 98030’ and longitude 99030’ East with altitude about 6 m above sea level on land. The province consists of mountains, hills (solitary limestone hills, plains and mangrove forest, Rain Evergreen Forest, Dry Evergreen Forest, Beach Forest and Fresh Water Swamp Forest including more than 130 large and small islands. Recently, there are 66 Community Forest (CF) areas in Krabi Province, which are Muang Krabi (17 CF), Khao Phanom (11 CF), Ko Lanta (8 CF), Khlong Thom (7 CF), Ao Luek (12 CF), Plai Phraya (1 CF), Lam Thap (2 CF) and Nuea Khlong (8 CF). BTS village was classify as a flat and hill terrain with the ground surface at the 30 to 350 m above Mean Sea Level (MSL). People in BTS village were conserved and protected Kuan Ying Wua Forest as Community Forest for 50 years. There are 12 stands (20x50 m2/10 stands) were established for study the plant species vegetation. The forest type of BTS Community Forest (Kuan Ying Wua Hill) was Tropical Moist Forest or Evergreen Forest. 2.2 Statistical Analysis In this study, quantitative ecological methods were used such as the Important Value Index (IVI) to show the number of dominant plant species in community forest. The IVI analysis was used to determine the dominant and species composition in community forest as well as to indicate the diversity status and sustainable uses of MFPs among people in BTS. The IVI indicates the figure of ecological importance of a plant species (Curtis and McIntosh 1951; Risser and Rice 1971). According to Sukwong (1982), the IVI can be used to indicate the ecological succession of plant occupying the areas. The species that has high IVI is the dominant tree. It plays an important role in the community. Since each component value has a maximum value of 100, the IVI of any species in communities range between 0-300. 3. Results and discussion 3.1 Species composition The number of trees in the previous and present studies in BTSCF including saplings and seedlings in stands (20x50 m2) (Table 1). In the previous research by Sawatdee (2002), there were 61 species of trees, 30 saplings and 31 seedlings and as comparison to the present study, the number of trees, saplings and seedlings were 65; 59 and 32 respectively were found in BTSCF. The different between previous and present studies was because of using different stands. In the previous study the stands were used 40x40 m2 and the present study with 20x50 m2. This study shows the differing from Sawatdee (2002) because the sizes, number of stands, and number of species are different. Compare to the others Moist Evergreen Forest in the Southern Provinces such as at Khao Chong, Trang, Khao Pra Taew, and Phuket had 150+22 species ha-1 respectively (Kiratiprayoon, 1986). According to Glumphabutr (2004), the number of plant species in the Moist Evergreen Forest and Dry Evergreen Forest were 135 and 138 species respectively shows slightly higher than in the Hill Evergreen Forest with 129 species number. The study also indicates that the number of species at the high elevation at 200-300 m attitude was higher than at the lower elevation (0-100 m altitude). From this study, the composition of species from the 12 stands (20x50 m2) indicates that at 0-100 m altitude, the numbers of trees were about 338 trees with 3 stands, at 100-200 m altitude were comprised of 478 trees with 4 stands and at level 200-300 m were consisted of 593 trees with 5 stands. The compositions of trees from the three altitude

Journal of Sustainable Development March, 2008
71
levels are not much different. The number of trees, saplings and seedlings per ha in BTSCF are 4,697; 119,166 and 252,500 of trees ha-1 respectively. Sawatdee (2002) indicates that the density of trees, saplings and seedlings per ha in BTSCF were 1,638 trees, 18,906 saplings and 141,251 seedlings. According to Gardner et al. (2000), the common emergent trees in Tropical Moist Evergreen Forest were Atrocarpus fraxinifolius, Hopea odorata Roxb., Dipterocarpus alatus Roxb. ex G.Don, Ficus spp. and Tetrameles nudiflora R.Br. In BTSCF the emergent trees are including Xylia xylocarpa (Roxb.) Taub. var. kerrii (Craib & Hutch.) I.C.Nielsen, Homalium undulatum King, Mangifera caloneura Kurz, Lithocarpus collettii A. Camus, Vatica stapfiana (King) Slooten, and Eurya acuminata DC. var. acuminata. Glumpahabutr (2004) indicates that the dominant trees in Moist Evergreen Forest in Chantaburi Province consist of Dipterocarpus alatus Roxb. ex. G.Don, Anisoptera costata Korth, Sterculiaceae campanulata Wal, Hopea odorata Roxb., Irvingia malayana Oliv. ex A. W.enn. and etc. There are 36 families and 65 species comprised in BTSCF. The compositions of species were influenced by forest type in BTS which are Tropical Moist Evergreen Forest and some plants are native of Southern of Thailand, for example Bouea oppositifolia (Roxb.) Meisn., Canarium denticulatum Blume, Prismatomeris sp., Bhesa indica (Bedd.) Ding Hou, Diospyros cauliflora Blume, Fagraea racemosa Jack and Cryptocarya ferea Blume. The result shows that the BTSCF were consisted 42 species of trees, 9 species of shrub/trees, 7 species of shrub/shrubby trees and shrubs with 7 species. The highest numbers of trees were found in Euphorbiaceae which consisted of 5 species, 4 species of Dipterocarpaceae, 4 species of Moraceae, 3 species of Rubiaceae, Lauraceae, Leguminosae-Mimosoideae and Myrtaceae respectively. There were 28 families with 49 species from 65 species founded in BTSCF were categories as MFPs. The highest MFPs families were Moraceae with 5 species, 3 species of Euphorbiaceae, Rubiaceae and Myrtaceae respectively. The medicinal plants show the highest composition with 23 families and 32 species were found in BTSCF. The medicinal plants were including Bouea oppositifolia (Roxb.) Meisn. Mangifera caloneura Kurz, Diospyros cauliflora Blume, Cinnamomum iners Reinw. ex Blume, Schima wallichii (DC.) Korth., and Eurya acuminata DC. var. acuminata. The result also indicates that there were 10 families and 13 species of MFPs were edible plants which can be use as food. The species such as Bouea oppositifolia (Roxb.) Meisn., Cratoxylum maingayi Dyer, Azadirachta indica A.Juss. var. siamensis Valeton, Ficus hispida L.f. and Eurya acuminata DC. var. acuminata were edible plants. Most of people use leaves, fruits, seeds, flowers, young shoots and sprouts as food. The non-edible plants consist of ornamental plants, chemical components (exudates and extracts), non-industrial timber, fibers and leaves. There were 18 families and 22 species of non-edible plants namely Diospyros cauliflora Blume, Diospyros undulata Wall. ex G.Don var. undulata, Aporosa villosa (Wall. ex Lindl.) Baill., Homalium undulatum King, Xylia xylocarpa (Roxb.) Taub. var. kerrii (Craib & Hutch.) I.C.Nielsen, Memecylon garcinioides Blume, Artocarpus sp., Cryptocarya ferea Blume, Vitex pinnata L. and Ixonanthes reticulata Jack. The uses of wood from MFPs were defining only for non-industrial timber and own uses such as pole, house flooring, household tools, and etc. People in BTS use wood from Xylia xylocarpa (Roxb.) Taub. var. kerrii (Craib & Hutch.) I.C.Nielsen as pole, house flooring, and etc. 3.2 Species density The density of tree ha-1 with DBH>4.5 cm in were 4,697 trees ha-1 with 65 species found in BTSCF. The densities of saplings were 119,166 saplings ha-1 with 50 species and seedlings were consisted of 252,500 seedlings ha-1 with 49 species. According to the study in BTSCF by Sawatdee (2002), the species density of trees with DBH>4.5 cm, saplings and seedlings were consisted of 1,638 trees ha-1, 18,906 saplings ha-1 and 141,251 seedlings ha-1 respectively. As comparison, the density of trees in Moist Evergreen Forest and Dry Evergreen Forest in Chantaburi Province were consisted of 1,510 trees ha-1 and 1,355 trees ha-1 respectively which lower than in the Hill Evergreen Forest with 2,513 trees ha-1 (Glumphabutr, 2004). The result shows that the density of trees with DBH>4.5 cm in BTSCF were higher than the Hill Evergreen Forest in Chantaburi Province. The density of trees was higher because of the composition of the small trees. The mean DBH for Hill Evergreen Forest trees was lower with 10.8 cm than Moist Evergreen Forest and Dry Evergreen Forest were 13.7 cm and 13.1 cm respectively. The average DBH of trees in BTSCF was 14.53 cm. The average diameter at breast height was determined the size of trees will influence the composition of species in the plot area. 3.3 Diameter at breast height and basal area The distribution of tree species were categorized to three elevation levels from 0-100 m, 100-200 m and 200-300 m in BTSCF. The DBH ranges from 4.5 cm to 84.5 cm. The result shows that at the level 0-100 m altitude, the diameter classes from 4.5 cm to 9.5 cm were comprised the highest number of trees with 204 trees. The Homalium undulatum King consist the highest number of trees with 30 trees at DBH 4.5 to 9.5 cm. At 100-200 m altitude the diameter classes from 4.5 to 9.5 cm comprise the highest number of trees with 221 trees. In this altitude, the tree of Homalium undulatum King shows the highest number of trees with 39 trees at DBH classes 4.5 to 9.5 cm. The DBH of trees at 200-300 m altitude with the diameter classes from 4.5 to 9.5 cm comprise the highest number of trees with 294 trees, but the others diameter classes such as 9.5 to 54.5 cm also comprise moderate quantity of trees from 9 to 87 trees. In

Vol. 1, No. 1 Journal of Sustainable Development
72
this level the Mangifera caloneura Kurz consist the highest number of trees with 32 trees which followed by Vatica stapfiana (King) Slooten with 31 trees and 27 trees of Madhuca kerrii H.R.Fletcher at DBH classes 4.5 to 9.5 cm respectively. The result indicates that at 0-100 m altitude, Xylia xylocarpa (Roxb.) Taub. var. kerrii (Craib & Hutch.) I.C.Nielsen and Homalium undulatum King comprise the highest total basal area with 0.6174 and 0.5147 m2 respectively. The highest numbers of individual trees are Homalium undulatum King and Schima wallichii (DC.) Korth. with 44 trees respectively. At 100-200 m altitude, Cratoxyllum maingayi Dyer and Crypteronia paniculata Blume indicates the highest total basal area about 1.3780 and 1.3474 m2 with number of individual trees were 24 and 23 trees respectively. At 200-300 m altitude, the highest total basal area was found in Lithocarpus collettii A.Camus with 2.7500 m2 had 32 trees and 1.8701 m2 and 2.5524 m2 for Syzygium sp. had 66 trees. The average basal area per plot from altitude levels at 0-100 m, 100-200 m and 200-300 m are 4.3707, 8.24805 and 8.6869 m2 respectively. The average of basal area of trees at altitude 200-300 m is higher than the other levels because consist high number of larger trees. At altitude 0-100 m, most of trees are smaller and the number of trees is low with 338 trees. Total basal area of the individual trees with DBH>4.5 cm according to three altitudes from 0-100 m, 100-200 m and 200-300 m shows that at 200-300 m altitude, the total basal area of trees is higher than the other levels about 19.4781 m2. The total basal area and number of individual trees from three altitude levels are 38.8462 m2 with 1,413 trees. The average basal area at altitude 0-100 m is lower than the other levels because the lowland area consist high number of saplings and seedlings. In the previous period, the lowland area is the secondary forest and people in BTS manage the lowland area with rehabilitation and restoration. Most of the trees which comprise high total basal area are found in Homalium undulatum King with 106 trees, 90 trees for Xylia xylocarpa (Roxb.) Taub. var. kerrii (Craib & Hutch.) I.C.Nielsen and 71 trees of Vatica stapfiana (King) Slooten are the dominant species in BTS Community Forest. The average height of trees at altitude levels from 0-100 m, 100-200 m and 200-300 m are 14.2 m, 12 and 12.9 m respectively. The highest average height of trees are found in Artocarpus sp. with 21.5 m, 20 m height of Vitex glabrata R.Br., Parkia speciosa Hassk. and Cryptocarya ferea Blume respectively, Carallia brachiata (Lour.) Merr. with 19.7 m, 20 m for Crypteronia paniculata Blume and Rhodamnia cinerea Jack var. cinerea respectively and 18 m for Archidendron clypearia (Jack) I.C.Nielsen. Most of trees with the highest height appear at 0-100 m altitude are include Artocarpus sp. with 21.5 m, 20 m for Vitex glabrata R.Br. and Carallia brachiata (Lour.) Merr. with 19.7 m height. The highest trees height species appears at 100-200 m altitude are found in Archidendron clypearia (Jack) I.C.Nielsen with 16.3 m, Symplocos cochinchinensis (Lour.) S.Moore subsp. cochinchinensis with 16 m and 15 m for Carallia brachiata (Lour.) Merr. At altitude 200-300 m, the highest trees are found in Parkia speciosa Hassk. with 20 m, 19.3 m for Cryptocarya ferea Blume, 19 m for Syzygium diospyrifolium (Wall. ex Duthie) S.N.Mitra and 18 m for Archidendron clypearia (JackP I.C. Nielsen). 3.4 Important Value Index The Important Value Index (IVI) was used to indicates the dominant trees with DBH>4.5 cm in BTSCF. IVI is used to determine dominant trees in each stands (Wachrinrat, 2000; Glumphabutr, 2004). The Xylia xylocarpa (Roxb.) Taub. var. kerrii (Craib & Hutch.) I.C.Nielsen shows the highest IVI with 22.37% (Figure 1). The highest percentage of relative density is found in Homalium undulatum King with 7.50% and the lowest IVI is Eurycoma longifolia Jack with 0.14% with the lowest percentage of relative density about 0.07%. The lowest density is also found in other 5 tree species which incude Fagraea racemosa Jack, Symplocos cochinchinensis (Lour.) S. Moore subsp. cochinchinensis, Parkia speciosa Hassk, Gnetum gnemon L. var. tenerum and Eurycoma longifolia Jack. The highest percentage of relative frequencies of tree is Homalium undulatum King with 7.55% and the lowest frequency are include Eurycoma longifolia Jack, Fagraea racemosa Jack and Symplocos cochinchinensis (Lour.) S. Moore subsp. cochinchinensis. Most of the trees that have the lowest density show lower value percentage of relative frequency. The result shows that the density of trees is influenced by the frequency of the trees. The trees that have high frequency value will have regular scatter all the area which contain high density of plants. In this study, the percentage of relative density is 6.37% for Xylia xylocarpa (Roxb.) Taub. var. kerrii (Craib and Hutch.) I.C.Nielsen and the percentage of relative frequency is about 6.41%. The dominant species from the highest IVI value in BTSCF consist of Xylia xylocarpa (Roxb.) Taub. var. kerrii (Craib & Hutch.) I.C.Nielsen, Homalium undulatum King, Mangifera caloneura Kurz, Vatica stapfiana (King) Slooten and Lithocarpus collettii A.Camus. The result also indicates that the IVI values of trees are related to IVI values of saplings. Most of the trees that have high IVI value such as Xylia xylocarpa (Roxb.) Taub. var. kerrii (Craib & Hutch.) I.C.Nielsen also comprise the high IVI value of saplings. The highest IVI saplings are found in Euonymus javanicus Blume with 27.19%, 18.30% for Prismatomeris sp., 13.44% for Xylia xylocarpa (Roxb.) Taub. var. kerrii (Craib & Hutch.) I.C.Nielsen and 10.31% for Calophyllum polyanthum Wall. ex Choisy. The result shows that the saplings of Euonymus javanicus Blume comprise the highest IVI value and grow well in BTSCF. As comparison to the previous research in the BTSCF by Sawatdee (2002), the highest IVI trees were found in Schima wallichii (DC.) Korth (58%), Crypteronia paniculata Blume (56%),

Journal of Sustainable Development March, 2008
73
Memecylon lilacinum Zoll & Moritzi (26%), Syzygium campanulatum Korth. var. campanulatum (24%) and Vitex pinnata L. (20%). The highest IVI for saplings were founded in Vatica sp. with 35.43%, 26.26% of Euonymus javanicus Blume, 14.45% of Ixonanthes reticulata Jack, 14.1% of Ardisia virens, Aporosa aurea, and Syzygium campanulatum var. campanulatum (11.4%). Pipatwattanakul (2002) also indicates that Schima wallichii (DC.) Korth was the highest IVI of trees and the highest IVI for saplings and seedlings were Vatica sp. In the Evergreen Forest of Eastern region of Thailand, the dominant trees with high IVI value are found in Scaphium macropodum Beaumee with 28%, 17% of Archidendron guocense (Pierre) Nielsen and 15 % of Syzygium leneatum (DC.) Merr. & L.M.Perry (Glumphabutr, 2004). 4. Conclusions Ban Thung Soong Community Forest (BTSCF) comprised of 65 species of trees, 50 saplings and 49 seedlings. In stands (20x50 m2), the number of trees were 1,413 trees, 572 saplings and 303 seedlings. The three elevation levels of BTSCF at 0-100 m altitude, 100-200 m altitude and 200-300 m altitude comprised different numbers of trees, saplings and seedlings. There were 36 families with 65 species found in BTSCF. The highest level at 200-300 m had the highest numbers of trees and total basal area. For the Important Value Index (IVI), the dominant species in BTSCF were Xylia xylocarpa (Roxb.) Taub. var. kerrii (Craib & Hutch.) I.C.Nielsen, Homalium undulatum King, Mangifera caloneura Kurz, Vatica stapfiana (King) Slooten and Lithocarpus collettii A. Camus. The dominant saplings were Euonymus javanicus Blume, Prismatomeris sp., Xylia xylocarpa (Roxb.) Taub. var. kerrii (Craib & Hutch.) I.C.Nielsen, Calophyllum ployanthum Wall. ex Choisy and Mangifera caloneura Kurz. There were 49 species categorized as Minor Forest Products (MFPs). The categories of MFPs were divided into three categories as medicinal plants, edible plants and non-edible plants. The dominant MFPs used as medicinal plants were as follows: Azadirachta indica A.Juss. var. siamensis Valeton, Bouea oppositifolia (Roxb.) Meisn. Cratoxylum maingayi Dyer, Mangifera caloneura Kurz, and Schima wallichii (DC.) Korth. The dominant edible plant species were Azadirachta indica A.Juss. var. siamensis Valeton, Bouea oppositifolia (Roxb.) Meisn., Gnetum gnemon L. var. tenerum, Garcinia cowa Roxb. ex DC, Cratoxylum maingayi Dyer and Eurya acuminata DC. var. acuminata, and non-edible plants consisted of Aporosa villosa (Wall. ex Lindl.) Baill., Diospyros undulata Wall. ex G.Don var. undulata, Homalium undulatum King and Memecylon garcinioides Blume. The results from IVI study not only provide information regarding MFPs composition in the forest but also indicate the levels of sustainable uses and resources of MFPs in BTS Community Forest among people in BTS. Some of the plants have low IVI but the frequency and quantity of harvesting is high which will affect the plant composition in the forest. The sustainable uses of MFPs through resource conservation in the natural forest will manage MFPs harvesting and collecting activity in the community forest. Some of the plants may be threatened because of the in lower composition or because of the higher frequency of harvesting which will affect the status of plants that occur in the forest. The sustainable resources of MFPs through distribution of MFPs in the natural forest and domestication in homesteads can improve the value of MFPs utilization. The awareness of people in BTS to ensure the sustainable management of the community forest should be continuous not only as a village program but also for future generation heritage. References Curtis, J.T. and McIntosh, R.P. (1951). An uphill forest continuum in the Prairie forest border region of Wisconsin. Journal of Ecology. 32: 476-498. de Pater, C. (2000). Non-Timber Forest Products (NTFPs): Their Role in Sustainable Forest Management in the Tropics. NTFPs. Theme Study 1, Forest, Forestry and Biological Diversity Support Group. Wageningen, the Netherlands. Gardner, S., Sidisunthorn, P., & Anusarnsunthorn, V. (2000). A Field Guide to Forest Trees of Northern Thailand. Chiang Mai University, Thailand, p. 544. Glumphabutr, P. (2004). Nutrients Dynamics of Natural Evergreen Forests in Eastern Region of Thailand. PhD. Thesis. Kasetsart University. Kiratiprayoon, S. (1986). Comparative Study on the Structure of Rattans Bearing Tropical Rain Forest. M.S. Thesis, Kasetsart University. Pipatwattanakul, D. (2002). Community Forestry Management and Rehabilitation as mean of Biodiversity Conservation: Case Study at Ban Thung Soong Community Forest in Krabi. Country Research Profile. 67 Asean Diversity. Faculty of Forestry, Kasetsart University, Bangkok, Thailand. Risser, P.G & Rice, E.L. (1971). Phytosociological analysis of Oklahoma upland forest species. Journal of Ecology. 52: 940-945. Sawatdee, W. (2002). Plant Diversity and Ecotourism Potential in the Community Forest and Homestead: A Case Study in Ban Thung Soong, Krabi, Thailand. M.S. (Forestry) Thesis, Kasetsart University, Bangkok, Thailand.

Vol. 1, No. 1 Journal of Sustainable Development
74
Subansenee, W. (1994). Thailand, In P.B. Durst, Ulrich, W. & Kashio, M. (Eds), Non-Wood Forest Products in Asia. RAP Publication 1994/28. FAO Regional Office for Asia and the Pacific, Bangkok. pp. 127-150. Sukwong, S. (1982). Ecological of Tropical Forests. Department of Forest Biology, Faculty of Forestry, Kasetsart University, Bangkok. Wachrinrat, C. (2000). Community Dynamics of Building Phase in Fire and Non-Fire Protected Secondary Dry Dipterocarp Forest, Nakhon Ratchsima. PhD. Thesis. Kasetsart Univeristy. Table 1. Quantitative characteristics of trees, saplings and seedlings in Ban Thung Soong Community Forest
Previous study (Sawatdee,
2002) Present study in BTSCF
Quantitative characteristics T S Se T S Se
Number of species 61 30 31 65 50 49
Number of trees (per plot) 524 121 113 1,413 572 303
Density of trees (per ha) 1,638 18,906 141,251 4,697 119,166 252,500
Basal area (per plot) 8.56 - - 36.45 - -
Percentage of basal area (%) 0.0856 0.3645
Average DBH (cm) (per plot) 14.53
Average height (m) (per plot) 12.5 4.06 4.01 13.75 3.43 0.24 Note: T = Trees, S = Saplings, Se = Seedlings Table 1 shows the comparison on number of species on BTSCF in 2002 and present study. In the previous research by Sawatdee (2002), there were 61 species of trees, 30 saplings and 31 seedlings and as comparison to the present study, the number of trees, saplings and seedlings were 65; 59 and 32 respectively were found in BTSCF. Figure 1 shows that the five main species of trees in BTSCF with the highest IVI value. The Xylia xylocarpa (Roxb.) Taub. var. kerrii (Craib & Hutch.) I.C.Nielsen was the highest IVI with 22.37% followed by Homalium undulatum King and Mangifera caloneura Kurz with 19.26% and 16.23% respectively.
Figure 1. The highest IVI value for five species of trees with DBH >4.5 in Ban Thung Soong Community Forest
0
5
10
15
20
25
Xylia xylocarpa(Roxb.) Taub. var.
kerrii (Craib &Hutch.) I.C.Nielsen
Homalium undulatumKing
Mangifera caloneuraKurz
Vatica stapfiana(King) Slooten
Lithocarpus collettiiA.Camus
Scientific name of the plants
Num
ber o
f Val
ue RD (%)RF (%)RDo (%)IVI
Journal of Sustainable Development March, 2008
75
Information Communications Technology (ICT) Effect on
Sustainable Development in Cameroon’s Fragile Economy Johnnes Arreymbi
School of Computing & Technology, University of East London, London, UK Tel: +44 20 8223 2242 E-mail: [email protected]
Esther A. Agbor Icons Systems Consulting, Taplow House, London, UK Tel: +44 795 7222 399 E-mail: [email protected]
Abstract This paper looks at how sustainable development is effected and affected by Information Communication Technology (ICT) in Cameroon – West Africa. It highlights some of the socio-economic, political and environmental issues involved in the adoption and use of ICT by Small to Medium size Enterprises (SMEs) and Government Institutions (GI), and the effect on sustainable development. It will attempt to bring some understanding of the peculiarities and challenges faced by SMEs, together with the opportunities to influence societal changes and integration into the digital world. Keywords: Information Communication Technologies (ICT), Emerging Economies, Small to Medium Size Enterprises (SMEs), Economic dependency, Cameroon and Sustainable Development 1. Introduction Businesses in advanced economies have in past twenty years enjoyed some levels of successes with the adoption and use of technologies, especially Information Communication Technology (ICT). On the other hand, some advancing economies, for example Cameroon, have reacted some how very slowly to the chance of making an impression with the available technologies. Interestingly, this situation is not unique to Cameroon alone but also in most of Africa and Asia’s emerging economies. 2. The Information low Economy In the early 20th century, emphasis was placed on the absolute need of machineries to promote economic growth in the economy. There was a greater need for human power to work these machineries, their intellectual capacity or skill specialty was not usually a pre-requisite for carrying out the tasks as long as the workers were skilled enough to carry out their daily routine. Users also had to wait lengthy period of time to see products and services they required. The whole productive cycle was done in a top-down fashion. And any error discovered at project completion phase meant a complete condemnation of the finished product and a fresh start from the analysis of specification stage. Much of these could be attributed to the fact that, there was no loop-style method of product design which is widely present in today’s economy, in which, a prototype of the specified product or service is designed and tested. Any fault detected at testing phase is simply corrected by re-visiting and correcting the programs or design in the offending loop, and re-integrating the new change into the product cycle. The early stage economies were at low information-(in) accessibility phase. A stage where entrepreneurs, program designers, analysts and even end-users did not have adequate knowledge of products and services they required, developed and/or used. Tasks were routinely carried out with no thought about how the cycle of production could be shortened or high-quality low-cost goods and services produced. It became the case of “the Good, the Bad and the Ugly”, where results were either achieved or not and with little foresight. 3. Survival of the fittest The advent of the Internet and modern communication technologies, have provided a breakthrough in information accessibility and dissemination. And the rules of the game changed, whereby, the strongest players were individuals, businesses or corporations, with the most access to relevant information – and who takes advantage maximally of such opportunities. In fact, it is worth noting that, availability of information does not necessarily imply acceptance and

Vol. 1, No. 1 Journal of Sustainable Development
76
usage. Some individuals and government agencies, even when provided with full access to information still prefer not to adapt their existing systems to provide modern solutions. Despite the many reports on successes of information-rich economies, many in the advancing world are not catching up with the trend and lagging behind. 3.1 Cultural and Socio-political Effects According to Arreymbi (2006), low technology up-take can be directly attributed to and/or influenced by the socio-political atmosphere in these economies. In most emerging economies, the socio-political and sometimes personal to cultural influences play a major part in the adoption and use of modern technologies. For example, many reports have pointed out the cultural influences on women in predominantly Muslim countries, which does not allow for women entrepreneurship and/or exposure to foreign technology. There have been reports (BBC News, 2002) of many such restrictions imposed by Muslim leaders especially in pre-war Afghanistan, in the education of women and general use of Western technology, because it was seen to be influencing the culture and could be used as a manipulative tool. Alterman (2000) also cited similar socio-political and cultural reasons in countries such as Bahrain and Tunisia, where they openly monitor Internet traffic. The United Arab Emirates and Yemen use proxy servers to prevent users from accessing “undesirable” sites. Iran allows access, but the extent of the traffic monitoring in that country is uncertain. Meanwhile Arreymbi and Williams (2005) reported that, in cold- war China, restrictions on use and monitoring of internet accessibility stems from believes that such technologies are a manipulative tool designed by the Western Governments to oppress and spy on their citizen and economies. However, some socio-cultural impact could be attributed to ignorance on the part of the citizens. Very little is known about the existence and use of alternative/modern technologies, which may also influence acceptance and/or adoption rate. 3.1.1 Fear factor Another example cited by When (1998), as one of the reasons tendered for the non-acceptance of ICT in some advancing countries is the fear that, “the poor financial, technical and human resources in these economies would perpetuate further ties of dependency, such that developing economies would be kept economically subservient by the need for Western equipment and expertise”. Therefore at times, the fear of a level of dependence on the more developed economies is often a barrier to technological solutions offered by these economies to the less developed ones. However, it is still a thought worth considering that technological upgrading is vital for socio-economic advancement of all economies; to an extent that it provides a unique opportunity for advancing economies to raise per capita income, and also improves the demand for a knowledge-based workforce. Arreymbi (2006) citing Nagy (1991) reported a statement by the Malaysian Prime Minister Mahathir Mohammed who said, “…it can be no accident that there is today no wealthy developed country that is information poor and no information rich country that is poor and underdeveloped…” Therefore, it can be safe to suspect a correlation between the information level and socio-economic development of a nation. How strong or beneficial this link is, depends on a number of factors; chief among them is the Information and Communication Technologies (ICT) available in an economy. The statement is further supported by the increase ICT adoption by many economies of the world both the rich and not so rich in promoting societal, business and more recently government (e-Government) activities. 4. The Economic Drivers Many technologies are driving ICT usage around the globe and with the World fast becoming a global village; these technologies are increasingly contributing to many countries’ economic and sustainable developments. In fact, Arreymbi (2006); Qiang and Khalil (2006) have argued that developing economies have gone through great development in the roll out of basic infrastructure for ICT. 4.1 The Internet and WWW These technologies have blurred national boundaries. Citizens can now source information or do business far beyond national boundaries through the complex Web of systems networks connected with super high-speed links cutting across sea, air and land. The information superhighway has developed from these technologies and provides access gateway which has been brought about by the World Wide Web (WWW) - a network of globally linked resources. Table 1 shows the increase use of internet is more noticeable in Africa, the Middle East and Latin America/Caribbean compared to other regions of the world. Presently, the Internet is not proprietary and is available to anyone with computer access connecting to the vast information market around the world. ICT through the Internet and www have developed strong virtual communities linked by interests, language, beliefs, habits, social networks etc. Williams and Arreymbi (2007) have reported on these communities which they called cyber tribes and showed how the activities of the avatars within these communities can influence either directly or indirectly the way we live, interact and/or do business in cyberspace. Electronic networking has become a very powerful, rapid, inexpensive and lively way to communicate and exchange information. Social networks are increasingly being built and when available, previously unanticipated collaboration seems to come into being almost spontaneously. The underlying cause seems to involve a latent demand that remains latent as long as joint
Journal of Sustainable Development March, 2008
77
work requires either the disruption of waiting for the text mail, the continual retyping of texts transmitted by mail or fax, or the ever daunting need to secure large budgets and approvals for extensive international travel. This globalisation of economies has drastically improved access of more advanced technologies to most deprived economies, providing opportunities for them to raise per capita income and improve demand for skilled or semi-skilled labour. Given the usefulness of the Internet it is clearly self-evident the correlation between information, communication, and economic growth. With the Internet and/or WWW, there are no set boundaries for business in cyberspace, including the transfer and movement of labour and capital. The Miniwatts Marketing Group (2006) provided estimates that suggest an increasing Internet usage growth rate around the world, presently at around 20 per cent a month with over 1 billion users (MIDS Press, Miniwatts Marketing Group, 2006). 4.2 Mobile and wireless Technologies Most advancing economies especially in Asia and Africa (IMT, 2006), are experiencing ICT growth more in areas of mobile and wireless communications, which have preceded all expectations in terms of level of penetration and system usage. Just as in most advanced economies – Japan, America and Europe – advancements in the Internet, WWW and mobile-wireless communication technologies have continued to drive these economies. Internet access is comparatively very low per population in advancing economies than in advanced economies. Access to and use of the Internet is unbalanced due to factors which will be highlighted later in this paper. There are obvious gaps between developed and developing economies in terms of the numbers of nets, hosts and users as evident in table 1. John (1995) agrees and quotes a study from the Panos Institute which suggest, there is a danger of a new information elitism which precludes the majority of the world's population. However, these disparities are increasingly being addressed by some forward looking governments in advancing economies. The BBC in a report highlighted the Ethiopian government’s collaboration with the South African Education Authorities, and invested approximately £2 million providing satellite links and plasma screen technologies to Schools and colleges in Ethiopia. The link delivered life educational programmes from South Africa, in a pack with South African Schools. The students get the same life-link teaching with their counterparts in South Africa as the courses are delivered (BBC2, August 2006). 5. Digitalisation and Cameroon Many UN reports (ITU, 2004, UNDP 2006) cites increasing use of mobile-wireless technology within the African continent and the technologies are contributing to an increasing growth proliferation of handheld devices especially the use of mobile phones in many rural areas. In Cameroon, where the country had upgraded parts of the telephone network with digital technologies (CamTel report, 2004) has, since privatisation, seen some improvements in mobile connection and call quality; and also, expanding subscriber base using 155,000 CDMA lines (Reuters, Feb, 2006). The Mobile and wireless technology system has also facilitated some penetration into the hinterlands of the country. Many analysts attribute the dramatic change, much to the benefits derived out of many factors. For example, digitalisation of networks, improved reliability and high bandwidth, low overhead costs of and flexibility of wireless systems structural implementation, falling costs of technological devices, and ease of use; as opposed to hitherto difficulties of implementing wired networks, equipment and maintenance costs, physical topography, funding and historically exaggerated bureaucracy and/or inadequate government policies. The Cameroon Radio and Television (CRTV) and Cameroon Tribune newspaper (May 2007), recently reported the Cameroon government have signed an agreement pack with the CISCO Company to develop and propagate ICT network throughout the country, linking universities, schools and businesses. Presently, the country has a monopolistic supplier - CAMTEL, state-owned and created in 1998 - for the fixed or wired lines telecommunication networked systems and services. Also, CamTel provides Leasing Services (LS) and Internet via RTC and ADSL. But within the mobile domain, competition is fierce from other mobile-wireless suppliers who are increasingly putting up strong challenges for the mobile–wireless market. Major players in this domain today are MTN (58% market share) and Orange (40%), who both have the majority of the wireless users and signal coverage spanning almost 40% of the country and about 80% of the population (Redline Communications, 2007). Another arm of CAMTEL, CMT joined the mobile market in 2005 with their CT phone, which is based on CDMA and providing competitive services for mobile subscribers (Africanews.com). However, it is worth noting that some of the services provided in the Cameroon mobile/wireless telecommunication systems, just as in many other advancing economies of the world, especially sub-Saharan Africa; are limited to voice calls and SMS text only. Other value-added services and technologies such as emails, MMS, GPRS and mobile web-browsing that could enhance users experience and give access to limitless resources on the WWW are almost non existent. This could be attributed to inferiority of the technologies still in use today in most parts of the Country, which provides very limited facilities such as low bandwidth, poor connection with high drop rates, poor signal quality and infrequent power supply and/or fluctuating power outages and other societal and/or social influences. The application of new

Vol. 1, No. 1 Journal of Sustainable Development
78
technologies in these economies have not always been easy, the digital divide is still prominent in such situations and problems could be attributed more to issues of costs and/or lack of support infrastructures for technology, technical know-how, funding and other factors of opportunity costs of acquiring such technologies. The situation has been exacerbated by the general poverty, ignorance, lack of demand, inadequate capital funding and/or lost-motivation to buy such quality value-added services, (Arreymbi, 2006). And according to ITU report (2006/7), Cameroon has a Networked Readiness Index (NRI) score of 2.74, one of the lowest in the modern World today (ITU report, 2006-07). 6. Motivation or the lack of it There are many motivational factors that would determine the extent to which the drive of activities within an economy either from government, individuals and/or business may be influenced to bring about sustainability and economic development. 6.1 Spending power Most advancing economies on the one hand have on average less than $500 per capita income (Aguolu, 1997, UNDP 2004). And with limited disposable income, most do not see the need to spend on technology against feeding themselves or being able to afford medical care. The people have basic needs – healthcare, food and shelter and many see ICT role as crucial in the long term provision of these socio-economic needs (OECD, 2000). The opportunity cost of forgoing a daily meal just to acquire a mobile system is huge and cannot easily be met by most and left entirely for the affluent few. However, there is some indication that the technology climate is changing, more especially in the cities where MTN in a deal with Redlines Communications group Inc., are installing WiMAX broadband networks and moderately affluent businesses and citizens are changing habits and desires, increasingly adopting emerging technologies to compete with the rest of the world, more so, due to peer pressure and keeping up with trends. On the other hand advanced economies such as the UK and USA can afford to spend over 10 per cent of its national resources (GDP) on information services alone (Garfield, 2001). But advancing economies such as Cameroon often spend less than 1% of GDP per cent on information services. Much of their scarce funds is allocated to other social services like health, government, education, housing, agriculture, transportation, etc., which are given priority over information systems such as libraries, documentation and information centres etc. 6.2 Physical hindrance Cameroon has most of its population scattered in numerous communities of towns and villages often with great physical distances between them. Therefore, free flow of information among and beyond the communities requires sound developmental infrastructures such as good road networks, regular electricity supply, transportations (vehicles, trains, aeroplanes, airports) and reliable postal and telecommunication services. Some of these amenities exist but their quantity and quality are generally inadequate and poor. The country has shown the desire for rapid growth in the adoption of new technologies and industrialization of her economy. She is striving to provide adequate basic infrastructures that foster development and promote information accessibility to important areas such as health, education, library services and general communication systems. But many problems are still abound within the country - problems with steady supply of electricity, inadequate roads and transportation infrastructures, and including postal and telecommunication networks coverage services. 6.2.1 Communications Network The country with a population of approximately 18 million has just about 110,000 fixed telephone lines and giving access to approximately 0.61 per 100 populations. There are only approximately 170,000 computers connected to the internet and with very few or almost non-existence registered Country-domain namespace - .CM – users. The national operator CamTel, is making very little or no effort to manage the .CM registry and/or promote development of the Internet in Cameroon. The majority of web applications such as emails originating from or terminating in Cameroon are hosted on either, .COM, .FR, .NET or .CO.UK and other registries because no alternative is being developed in the country. Many of the country’s SMEs and her big cyber player’s sites are priced out of the .CM domain name registration, which can cost $400-$800 (CamTel, 2005) per year to register. The mobile subscribers’ number on the other hand, has experienced a steady increase to total almost 2.3 million at approximately 14 per 100 populations. Internet users reached 370,000, at 2.3 per 100 populations in 2006 (ITU, ICT indicators, 2006). These figures show clearly the mobile and internet areas as potential directions for progressive ICT development and holds substantial promise for the information have-nots in this developing economy. Also interesting is the fact that, the government of Cameroon in a recent report (Cameroon Tribune, 2006) identified the relevance of ICT, especially Internet access, to the growth and advancement of her economy. Through capacity building and technology transfer, it is intending to provide mechanisms for developing skills in ICT via training, awareness and infrastructural developments etc. Hearn et al. (1998), Anderson (2005), and Arreymbi (2006), all agree that, the success of bridging the digital divide would be measured by the degree to which the lives of those who do not have access could be improved by having it. The consequences of which, if not, may disengage or disenfranchise the citizens to personal

Journal of Sustainable Development March, 2008
79
and national sustainable development. Other analysts such as Sadowsky (1996) have argued the importance of the role of the nation and her government in such calculations; by claiming that the result of lack of ICT or Internet access affects the entire country and may hamper development. Therefore, one area of focus for the government would be to further implement some degree of economic liberalisation, privatisation and facilitate increase competition in the telecommunication and ISP sectors; improve banking and finance sectors and provide adequate legal or legislative frameworks, including support infrastructures for conducive business operations. The ITU through its Telecommunication Development Bureau is supporting ICT initiatives in emerging economies, and has launched project called Electronic Commerce for Developing Countries (EC-DC). The EC-DC initiative addresses the challenges faced by developing economies in the application of new technologies (ITU report, 2006). The programme runs in collaboration with partners from both advanced and advancing economies, including the public and private sectors in facilitating developing economies to acquire and use electronic commerce technologies for economic development. In 2000-01, CamTel and ITU carried out EC-DC projects to facilitate infrastructural development, in Cameroon; to establish e-commerce platform and provide secure transactions, trust and secure payment services for online businesses (ITU, 2004). 7. Dilemmas of fixed lines systems ICT on its part has brought about previously unforeseen opportunities to gain access to knowledge and services from around the world in a way that would have been unimaginable previously. For example, Internet kiosks, Telephone call boxes (phone booths) mostly facilitating email and phone calls to overseas relatives, are springing up in many parts of Europe, Africa, Asia and Middle East. However, inappropriate and poor services land line telephone systems in most of Africa and Asia are rapidly being bypassed by the introduction of smart mobile/wireless phones, some of which have internet access and with improved communication and collaboration enabled technologies. The fixed line systems inherently have problems with implementation, operation and maintenance costs. The tasks and troubled experiences of most in the industry are very daunting and limiting. 7.1 Declining Market share Recently, fixed line operators have been facing very strong competition from the mobile sectors and a fast declining market share. There has been a disproportionate decrease (negative growth rate) in the number of fixed line subscribers in Cameroon since the late 90s, with decreasing revenue due to the introduction of mobile telephone systems (MTN, Orange and CT-phone). Africa in general has shown similar minimal growth rate in the total number of main telephone lines penetration, to almost stagnation point for several years. This situation is reflective of most other countries of the world especially in Europe, where stagnation in the fixed line market in many situations is partly as a result of saturation; and with most household having a telephone line (see figure 2 in appendix), (ITU, 2004/05). However, in Africa and Cameroon where penetration has not reached saturation, the stagnation is more of inadequate line infrastructure, funding, government policy structure, and ongoing business monopolistic tendencies. There has also been poor strategic management on the part of the organization – CamTel – which shows little drive for expansion, and including other issues already highlighted. Most of the high yielding fixed line subscribers in the late 90s were SMEs with businesses such as telephone call boxes (phone booths), Internet cafes and others which came about with the prominence of the internet and some privatisation. 7.2 Falling prices and bureaucracy Mobile systems have challenged the fixed line systems due to high drop in prices, triggered by major competition in the mobile sector. Worldwide, the gap between fixed and mobile prices has shrunk considerably and as a result the fixed line operators are losing traffic and revenues to the mobile sector. The fixed line telephony market has continuously been dropping both in value and volume since the early 2000s. Cameroon’s largest telecom operator CamTel again reported a fall in its fixed line business in 2005/6 financial report (CamTel Report 2005/6). The inflexibilities of the fixed line systems and the comparatively high costs, plus users’ desertions (to mobile systems) have resulted in low usage of the services – particularly for voice telephony. The monopoly Telco (CamTel) has been suffering from the ills of bad management and its inability to innovate, provide and market services adequately to the masses. This is partly due to lack-of or no serious competition from peers, and/or as a result of state ownership influence with improper supervision of the state management system which runs on laisser-faire tendencies with inadequate controls. Some are para-statal with full state controls. Consequently, many local and/or international long distance fixed line markets have been lost to the mobile sectors which have comparatively low implementation overheads and have provided consumers with improved and more flexible services, choice, fallen prices and manageable users’ running costs. Increasingly, most SMEs and private households find it extremely difficult and bureaucratic to own a fixed line, albeit the challenges coming from mobile-wireless telephony. The fixed line installation process is cumbersome, very expensive and delay can take many months to years, including going through inappropriate channels and expenses
Vol. 1, No. 1 Journal of Sustainable Development
80
before a line can be connected. There are issues of inadequate capacity - limited number of line and/or numbers, networked system unavailability and reliability, call clarity, high call drop-rates and the overall operational costs compared to mobile-wireless systems, which have enjoyed some strong growth rates and good penetration. The mobile-wireless systems have brought the added features of portability, mobility, convenience, usability, reliability, adaptability, slickness, miniaturisation, style and class; customisation and personalisation of systems and content, and, all-the-time anywhere services to many users (Arreymbi and Dastbaz, 2002). 7.3 Threat of Substitution Another potential worry for the fixed line operators in Cameroon is the threat of substitution. In such lower income society, the comparatively cheap and easy access to owning mobile phones, together with the relative ease of use or maintenance means new users are choosing only to have access to mobile systems. Meanwhile existing users are frequently substituting their fixed line phone calls for mobile phone calls. Some even prefer making cheaper internet access calls – voice over IP (VOIP) via internet Cafes. Hence, the drastically poor demand for fixed lines systems throughout the country. From personal experiences and small survey sample carried out in early March 2007 among SMEs and many private individuals within Cameroon, showed a general trend that is, an increasing number of households now own one or more mobile phones. The survey also exposes the fact that, many SMEs are more likely to substitute and use mobile telephony to operate and run their business more now than before. Although the mobile users operate on the model Pay-As-You-Go (PAYG) or Pay-As-You-Use service from the mobile operators, the majority see the convenience factor and tend to use their systems to receive rather than make expensive calls. Generally, the overall developments in the ICT arena have benefited the consumers who have seen an increase in choice and services tied with falling prices in both the fixed and mobile sectors. The fact still remains that, the increasing use of mobile systems would however not totally bring about the down fall of Cameroon fixed line systems in the short term, because; easy, fast and cheap access to the internet resources can now only be achieved via fixed line systems. 8. Government Policies and other issues Cameroon has a fairly high literacy rate at 75% (UN Report 2006), and an enthusiastic youthful population with an appetite for technology. This means that with some level of training and awareness, such active and vibrant population can exploit and make good use of information stored in both print and other media formats to bring about enhance use of ICT that would contribute to economic sustainability. However, government policies and developmental frameworks are lacking behind the citizens’ drive to acquire and personally develop themselves and/or businesses with ICT. Another feeble argument for low ICT uptake is that, majority of the people in developing economies are generally peasant farmers, semi-skilled craftsmen and women, who in most cases are unaware of the need for information. These assertions, from the authors’ personal experiences are not the complete facts. However, it is understood many in advancing economies live their lives routinely, using whatever little information they may stumble on, or is passed to them orally by spouses, relatives, friends, colleagues, religious workers and/or community. There are very low level public ICT drive or awareness campaign policies from government institutions. Some small scale ICT campaigns have been recorded recently but mostly targeted at Schools and not enough for SME or the public in general. John (1995), Khan (2001), and Arreymbi and Williams (2005) identified the major causes of poverty in developing economies to include: issues of political environment, systemic discrimination based on gender, race, ethnicity, religion, or caste, political inclinations or affiliations, ill-defined property rights to agricultural land and other natural resources, high concentration of land ownership giving unfair disadvantage to tenants, political corruption and/or bureaucratic red tape, large family sizes resulting in high dependency ratios, and national economic and social policy biases. Information poverty in such situations, is one of the more significant and insidious obstacles to effective exploitation of information processing and other types of technology. Lack of adequate information regarding developments in other countries and other environments is often not noticed, and in the absence of new information, old techniques and procedures are continued without conscious knowledge of alternatives. In addition, even though developing nations may not be hurt in an absolute sense by lack of information, they are certainly negatively affected by any relative measure (Sadowsky, 1996). Cameroon, like most advancing economies is lacking in transport and communication infrastructure for delivery of goods and information services. What exists is generally slow, poorly maintained and managed, and also very expensive to run. In contrast, the developed economies have well established infrastructures that are properly maintained and managed for optimum flow in delivery of goods and services. According to Arreymbi (2006), it has been demonstrated in a number of countries including Cameroon, that, the link between the free flow of information and movement toward democratization cannot be downplayed. Access to information affects political democratization efforts at both the global and national levels. In advancing economies such as Cameroon, where much of the media is controlled by the state, and individual access to the web is currently limited, it is no surprise that current research show less than 2% population penetration (Miniwatts Marketing Group, 2006) and having relative contact with ICT. Therefore, the need to decentralize control over information and over networks themselves is very clear. Many parts of Cameroon have limited and unreliable communication networks which break
Journal of Sustainable Development March, 2008
81
down every so often and are very costly to maintain and keep up-to-date. The government must do all in her effort and design of policies for example, Internet policies (which are presently inadequate), to address the gap. It is now widely acknowledged that ICT have generally provided avenues supportive of the development processes by giving easy access to information and knowledge and making it directly more useful in other technological applications for example, disaster warnings, location-based/geographic information systems, distance learning, and/or telemedicine etc. Another significant problem is that many research and academic institutions in the Country have very little facilities and access to the WWW which is known to yield tangible economic benefits and very vital to scientific research and/or development efforts. Commercial economic growth is enhanced by access to information and improved contact with support personnel. Although some academic research institutions in advancing economies may be using the ICT web resources for these purposes, only very few have explored this phenomenon. However, a study by Jimba and Atinmo (2000), reportedly found that, access to ICT-Internet had no positive impact on the number of publications in five research institution in Africa. The surprising results comes amid many issues such as; generally low productivity, content of the electronic database not relevant to research in question and that the African knowledge base has not been integrated with the services. In general, within developing-economic environments, requisite specialized knowledge is often either missing or in short supply. There is generally substantial competition for the scarce, more talented individuals within both the public and the private sectors as well as between them. Recently too, emigration to better labour markets in the more advanced economies - the so-called ‘Brain Drain Syndrome’ – has to an extent caused depletion of the resources necessary to exploit technology, in the face of countries having a limited set of human resources with which to work. Cameroon is financially poor relative to developed economies and suffers from low levels of both institutionalised financial assets and national income. The economy is subject to wide-ranging performance fluctuations due to factors beyond her immediate control. The country is to some extent relied on development assistance from International financial institutions and/or friendly governments. 9. Conclusion In this paper, we have explored issues in the adoption of ICT in Cameroon. Also explained is the nature of the aggressive fight for voice volume between the fixed and mobile operators. The market trend is shifting more in favour of the mobile sector than fixed line. Therefore, in order for the Cameroon fixed line operators to strongly compete in the ICT market, they need to develop and experiment with new technologies such as provide and support broadband, converged fixed-mobile products (e.g. BT Fusion type technology in UK) etc. The future in fact depends on the ability of mobile networks to provide high speed internet access. And until it comes to the point when users would be able to easily access the Internet at comparable prices and quality over their mobile phones, they would not do away with fixed lines in the short to medium term. ICT is increasingly penetrating the Cameroon economy and changing information practices and management in various sectors. The World Wide Web for example, is changing traditional ways of conducting business by establishing new sources of information sharing, and environments for new modes of communication. It has created pressure to improve information and communication technology infrastructures, and has similarly created competition by bringing many international and indigenous information technology vendors on to the same platform. Also, it has provided opportunities for policy to take advantage of access to global information resources.
References Aguolu I. (1997). Accessibility of Information: A myth for Developing Countries, Journal of New Library World, Vol. 98 No. 1, pp25-29. Anderson D. (2005). Bridging the digital divide: Linking and Closing the gap between advanced and developing economies- Intellas Group, LLC, Quantum, International Corporation, New York NY. Alterman, J. B. (2000). The Middle East’s Information Revolution, Current History, January, pp.21-26. Arreymbi, J. (2006). Exploiting ICT as effective tool for progressive independency in Emerging Economies: Balanced Economic and Development. Journal of Information and Communication Society (JICS) 10th Anniversary Symposium, University of York, UK Arreymbi, J. and Dastbaz, M. (2002). Issues in Delivering Multimedia content to mobile devices; Proceedings of the IEEE 6th International Conference on Information Visualisation, July 2002, London, UK Avegrou, C. (1998). How can IT enable growth in Developing Countries? In Journal of Information Technology for Development, Vol. 6, pp 15-28.

Vol. 1, No. 1 Journal of Sustainable Development
82
Hearn G., Mandeville T., Anthony D. (1998). The Communication Superhighway- Social and Economic change in the digital age, Allen & Unwin, Australia. John, M. (1995). “Third world faces `information poverty'”, CD News Bank Comprehensive, Reuters America. In Srikantaiah, T. K. and Xiaoying, D. (1998). “The Internet and its Impact on Developing Countries: Examples from China and India” Journal of Asian Libraries, Vol. 7 No. 9, pp. 199-209. Nagy H. (1991). Information Technology in World Bank Lending: “increasing the development and developmental impact”, World Bank Discussion Papers, 120, World Bank, Washington D.C. NRC (1996). Bridge builders: African Experience with Information and Communication Technology, National Academy Press, Quoted in Madon, S. (2000). “The Internet and Socio-Economic development: exploring the interaction, Journal of IT & People Vol. 13 No. 2 pp 85-101. OECD Growth Project. (2001). The New Economy: Beyond the Hype OECD. (2004). ICT, E-business and SMEs. Qiang, et al. (2006). Global trends and policies: Information communication for development. New York: World Bank. Sadowsky G. (1996). The Internet society and Developing countries- Article sourced from http://www.isoc.org Accessed 07/11/06. Servon L. (2002). Bridging the Digital Divide-Technology, Community and Public policy, Blackwell Publishers Ltd. The World Fact book (Cameroon), available at www.cia.gov/publications/factbook/geos/cm.html. Warschauer M. (2003). Technology and Social Inclusion: Re-thinking the digital divide, MIT Press, England. When U. (1998). Internet Access for all: The obstacles and the signposts, development research insights, 25, Institute of Developmental studies, University of Sussex. Quoted in Madon S. (2000). The Internet and socio-economic development: exploring the interaction, Journal of IT & People, Vol. 13, No 2, pp 85-101. Williams, G. and Arreymbi. J. (2007). Is Cyber tribalism winning Online Information Warfare? In Securing Electronic Business Processes. Paulus, S., Pohlmann, N., and Reimer, H.; (Eds). ISSE/SECURE 2007, Vieweg publishers. Germany. (ISBN: 978-3-8348-0346-7). Wriston W. (1992). How the Information revolution is transforming our world, Charles Scribners & sons, England. International Telecommunication Union (ITU). (2004). African Telecommunication Indicators 2004. http://www.itu.int/ITU-D/ict/publications/africa/2004. [Accessed 10 May 2007] http://www.bbc.co.uk/news [Accessed August 2007] http://www.un.org/ICT2003 [Accessed 24/10/07] BT Fusion, see http://www.Btplc.com/innovation/mobility/everywhere/ Miniwatts Marketing Group, 2006 http://www.afridigital.net/country_profile.php?id=23 ITU Report 2007 Reuters, (Feb. 2006) Cameroon: CamTel Privatisation, available at; http://www.regulateonline.org/content/view/632/79/ [Accessed, July 2007] CamTel, available at; http://www.camnet.cm/ http://www.csdptt.org/article342.html

Journal of Sustainable Development March, 2008
83
Figure 1.
Figure 2. Fixed line stagnation The survey, which was carried out for the European Commission, was based on a sample of 44’219 respondents in 127 regions, being representative of the total population of the 15 pre-accession EU Member States by demographics and regions. The interviews were carried out between the end of 2003 and the beginning of 2004. See http://europa.eu.int/information_society/newsroom/cf/itemlongdetail.cfm?item_id=1347.

Vol. 1, No. 1 Journal of Sustainable Development
84
Figure 3.
Figure 4. Source: ITU World statistics. Available at: http://www.itu.int/ITU-D/ict/statistics/ict/index.html [Accessed 07/12/2007]
Table 1. Basic indicators
Population GDP Total Telephone Subscribers Total (M) 2006
Density (per Km2)
2006
Total (B US$)
2005
Per capita (US$) 2005
Total (000s) 2006
Per 100 inhabitants 2006
16.60 35 16.6 1’016 2’352.8 14.42 Table 2. Main telephone lines
Main telephone lines Main telephone lines per 100 inhabitants
(000s)
2001 2006
CAGR (%)
2001-‘06 2001 2006
CAGR (%)
2001-‘06
106.3 100.3 -1.4 0.69 0.61 -2.8

Journal of Sustainable Development March, 2008
85
Table 3. Mobile cellular Subscribers
Mobile cellular subscribers
(000s)
2001
(000s)
2006
CAGR (%)
2001-‘06
Per 100 inhabitants %
digital 2006
As % of total telephone
subscribers
2006
417.3 2’252.5 52.4 13.80 100.0 95.7 Table 4. Internet, Users and Broadband subscribers
Internet Broadband Subscribers Subscribers (000s) 2006
Subscribers per 100 inhabitants 2006
Users (000s) 2006
Users per 100 inhabitants 2006
Total (000s) 2006
Per 100 inhabitants 2006
15.0 0.09 370.0 2.23 0.2 - Source: ITU ICT indicators. Available online at: http://www.itu.int/ITU-D/icteye/Indicators/Indicators.aspx# [Accessed 25/11/2007] Table 5. World Internet Usage and Population statistics (Miniwatts Marketing Group, 2006)
WORLD INTERNET USAGE AND POPULATION STATISTICS World Regions Population
(2006 Est.) Population% of World
Internet Usage,Latest Data
% Population (Penetration)
Usage % of
World
Usage Growth
2000-2005Africa 915,210,928 14.1 % 23,649,000 2.6 % 2.3 % 423.9 %Asia 3,667,774,066 56.4 % 380,400,713 10.4 % 36.5 % 232.8 %Europe 807,289,020 12.4 % 294,101,844 36.4 % 28.2 % 179.8 %Middle East 190,084,161 2.9 % 18,203,500 9.6 % 1.7 % 454.2 %North America 331,473,276 5.1 % 227,470,713 68.6 % 21.8 % 110.4 %Latin America/Caribbean
553,908,632 8.5 % 79,962,809 14.7 % 7.8 % 350.5 %
Oceania / Australia 33,956,977 0.5 % 17,872,707 52.6 % 1.7 % 134.6 %WORLD TOTAL 6,499,697,060 100.0 % 1,043,104,886 16.0 % 100.0
% 189.0 %
NOTES: (1) Internet Usage and World Population Statistics were updated for June 30, 2006. (2) Demographic (Population) numbers are based on data contained in the world-gazetteer website. (3) Internet usage information comes from data published by Nielsen//NetRatings, by the International Telecommunications Union, by local NICs, and other reliable sources. (4) For more information see www.internetworldstats.com. ©Copyright 2006, Miniwatts Marketing Group.

Vol. 1, No. 1 Journal of Sustainable Development
86
A Discussion on Relevant Issues about Levying Real
Estate Tax in China Hong Zhang
School of Economics, Tianjin Polytechnic University, Tianjin 300610, China Tel: 86-22-2458 5156 E-mail: [email protected]
Abstract This paper chiefly focuses on the name of taxes in constituting China’s real estate tax system, its connection with former taxes, and tax payers. The author puts forward some personal opinions on these issues. For example, the tax should be named as real estate tax. Cancel the urban land-using tax and the land value-added tax. Combine the house tax and the urban house tax. Reform the farmland occupation tax and retain the land-contract tax. Keywords: Real estate tax, Property tax In the 3rd session of the 16th conference of the Communist Party of China, Decisions on Relevant Issues of Perfecting Socialist Market Economy System was initially put forward. “Reform the urban construction tax. Levy the generally-regulated property tax on the real property as conditions permit. Cancel other relevant taxes.” At present, obeying the principle of “renting openly, regulating taxes, clearing fees”, China has begun to set up several practice spots for the property tax in some provinces and cities. At the same time, the theoretical field pays more attentions on the development of China’s property tax. This paper tends to discuss relevant issues of the property tax. 1. Property tax or real estate tax The property tax that will be levied on people in China is based on the real estate. But concerning with its name, lots of disputations are aroused from the theoretical field. The so-called property refers to sorts of houses that have been built up and used for living or non-living purposes, possessing the function of usage and the effect of economy, and equipped facilities, public services, land, affiliated ground and courtyard. This word was from the English word “property” or “estate”, being introduced from Hongkong to eastern China, and inland. In abroad, especially in north-eastern area, this word was used as another name of real estate or was regarded as the same with the later. However, most Chinese do not understand the meaning of property. What people know is the property fee that was paid by property owners periodically for services provided by property management companies according to relevant laws and regulations. Therefore, if the tax is named as property tax, people will fell confusion in front of property fee and property tax. In author’s opinion, it is better to name this tax as real estate tax, which can avoid misunderstanding effectively, and make people understand that the tax is based on real estate. The real estate tax is not a re-taxation on property, which can decrease the rejection emotion of people in a sense. 2. The new real estate tax should has certain connection with former tax system, and some taxes should be canceled or united In China, the real estate tax system includes house tax, city house tax, urban land-using tax, farmland occupation tax, land value-added tax, and land contract tax. Thereof, the first three are taxes paid in possessing the real estate. As a matter of fact, the country does not exert powerful effect on this part because of the narrow taxation in real estate field. But, levying taxes on the possession of real estate contributes to the economic and rational use of real estate resource (Junpei Wu, 2006). For the city house tax, the tax payer is foreign-funded company. Under the unified tax system, they should be integrated together. Unite the house tax and the city house tax together and levy the real estate tax generally. For the urban land-using tax, in a sense, it is not tax but rent. China has already set up the paid-using system for state-owned land. The land-remising cost is the land rent paid by user for the state. Therefore, in the process of holding the land, it is not proper to charge for land-using tax. And the urban land-using tax should be canceled. The last three are paid in the circulation of real estate. In fact, during this process, taxes are relatively heavy, what stops the normal circulation of resources. To levy the farmland occupation tax is to restrain the excessive use of land sources. However, in China the farmland occupation tax is equal to the result of occupied farmland’s real area multiplying fixed

Journal of Sustainable Development March, 2008
87
tax rate. But the later is established based on the farmland area per capita in certain region, betraying the price of land. Therefore, it is a must to reform the farmland occupation tax. This tax should be determined by the evaluated value of farmland. And different regions can adopt different tax rates. Besides, the nominal rate of land value-added tax in China is too high. Higher taxes can effectively restrict the speculation action in real estate field. On the other hand, however, it affects the normal circulation of real estates. Moreover, China levies taxes on the added value of land that was sold, which leads to different taxes for vending land and holding land. As a result, it may enhance people’s reference of holding the land, affecting the rational use of scarce land sources. The complicated calculation and the tough taxation of land value-added tax serve as high costs. It is not worth the candle (Zhiqiang Ren, 2006). The added value of land can be adjusted by income tax, avoiding repetitive taxation. Therefore, the land valued-added tax should be canceled. Unite the house tax and the urban house tax. Cancel irrational urban land using tax and the land value added tax. Keep the land contract tax. Reform the farmland occupation tax, real estate tax, and the land contract tax. By this way, China’s real estate tax system is accomplished, changing the “emphasizing on circulation and neglecting holding” fact in former real estate tax system (Huan Liu, 2005). Cancel the urban land-using tax, the house tax, and the urban house tax. All these measures should be taken into consideration as we design the property tax. Besides, to levy the real estate tax should distinguish taxations on income of holding the real estate and income of renting it. The former belongs to the real estate tax. And the later belongs to the income tax. 3. At the very beginning, the rural area should be escaped from the real estate tax and the urban personal living house can bear less to certain degree Presently, taxes levied on real estate exist in cities, towns, counties, and industrial and mining regions in China. But in the world, this tax exists in all fields (Songdong Chen, 2005). If China learns from experiences in foreign countries, individuals and companies in China will have to face greater tax burdens due to the real estate tax, which will harm the development of national economy. Firstly, the economic development in most rural areas of China is relatively lagged behind. And people in certain areas even do not dress warmly and ear their fill. Therefore, to levy the real estate tax on farmers in these areas will hurt the development of rural areas in China. Also, considering China’s economic development, the distance between counties and cities will be shortened step by step. Farmers will become more capable of bearing higher taxes. Therefore, it is possible to levy the real estate tax in rural areas in future. Then, as we set up the real estate tax, we can take the rural area as tax payers. But at present, it is reasonable to make the rural area free from this tax. Secondly, to buy a house is the largest expense of Chinese at present. The higher price of house adds more pressures on citizens. Although the real estate tax can restrain the speculation activity in the real estate field, it serves as higher cost for citizens buying houses. More citizens become incapable of buying houses. Therefore, it is reasonable to reduce the real estate tax for people who buy houses for living. In detail, we can take references from practices in foreign countries, where one family can buy one set of house that is free from the real estate tax. References Chen, Songdong. (2005). International comparison and reference of property tax. China Economist. No.3. Liu, Huan. (2005). An analysis of the collection of property sax and some difficulties in it. International Taxation In China. No.12. Ren, Zhiqiang. (2006). A discussion from levying property tax. Taxation Research. No.2. Wu, Junpei. (2006). Some thoughts about property tax. International Taxation In China. No.4.
Vol. 1, No. 1 Journal of Sustainable Development
88
Managing Sustainable Mangrove Forests in Peninsular Malaysia Kamaruzaman Jusoff
Forest Gespatial Information & Survey Lab Faculty of Forestry, Universiti Putra Malaysia, Serdang 43400 Selangor, Malaysia
Tel: +60-192279507 E-mail: [email protected] Dato’ Hj Dahlan bin Hj Taha
Deputy Director General (Planning and Development) Forestry Department Peninsular Malaysia, Ministry of Natural Resources and Environment
Forestry Department Headquarters Peninsular Malaysia, Jalan Sultan Salahuddin 50660 Kuala Lumpur, Malaysia Tel: +60-12-2198069 E-mail: [email protected]
The research is financed by Peninsular Malaysia Forestry Department Headquarters and Universiti Putra Malaysia. Abstract Mangrove forests in Peninsular Malaysia are found mainly on the sheltered coasts, estuaries, rivers and some near-shore islands. Mangrove forests support a diverse range of animals and plants and are important breeding ground for a vast array of organisms. The importance of mangrove forests in providing invaluable goods and services both in economics and environmental terms are well understood and documented. Forestry Department Peninsular Malaysia (FDPM) has been keeping abreast with current issues at the national, regional and international levels in managing the mangrove forests. FDPM has always been fully committed to the implementation of the sustainable forest management practices and in line with current concerns such as climate change, conservation of biological diversity and natural calamities including tsunami, have brought about a heightened expectation to the forestry profession. The policy and management of mangrove forests have great impacts on the political, social, economic, ecological and environmental well- being of the country, and thus managing mangrove forests is very challenging to the department. Mangrove forests management system has undergone changes from merely managing for its wood produce, to a management system that incorporates multiple roles, protection and conservation. Systematic management of mangrove forests started as early as 1904, with the adoption of the first working plan for Mangrove Forests in Matang. The Matang mangroves are identified as the best described mangrove forests in the world and is an exemplary of the sustainable managed mangrove forests. The Matang mangroves is in its third ten-year period of the second rotation, and after more than 100 years of management, the forest is still intact, providing sustainable various goods and services. This in itself is a manifestation of the success of forest management practices that aptly earned Matang mangroves as the best managed mangrove forests in the world. Special emphasis to the protection of the mangrove forests is enshrined in the National Forest Policy 1978 (revised1992) and duly recognized and given specific attention in the National Forestry Act 1984 (revised 1993). Future management of mangrove forests in Peninsular Malaysia will adopt an integrated approach by further refining the current management approach and incorporating latest findings and updated information through more vigorous R&D, scientific expeditions and studies on mangrove forests. A paradigm shift to conserve biodiversity even in the management of production mangrove forests will be emphasized. The National Forestry Policy and other policies related to mangrove forests need to be revised from time to time to match prevailing conditions and requirements, to ensure the realization of its multi-functions in perpetuity. The success in the sustainable management of mangrove forests by FDPM has in fact contributed to the sustainability of the Wetlands in Malaysia which is crucial to the survival and future health of the earth too. Keywords: Sustainable, Mangrove, Management, Malaysia 1. Introduction Mangrove forests forms one of the major wetland types in Peninsular Malaysia, which have been identified as one of the key life support systems on earth. The importance of mangrove forests goes beyond their status as the habitat of many endangered flora and fauna species. Mangrove forests are a valuable natural resource with distinctive diversity, high intrinsic natural productivity and unique habitat value. Mangrove forests provide invaluable goods and services both in economics and environmental terms. Apart from the production of poles, charcoal and fuel wood, the mangrove
Journal of Sustainable Development March, 2008
89
ecosystem supports a wide range of functions such as coastline protection, assimilation of waste, source of food, shelter and sanctuary for fauna, spawning and breeding ground for marine life and also recently proven as a barrier to significantly reduce the height and force of the waves of the tsunami. Traditionally, the coastal communities living within or at the fringes of the mangrove forests have been dependent on the mangrove forests for their livelihood. Mangrove forests are a major source of fishery resources. The mudflats are habitats for various types of shellfish, where many species of fish, prawns and other marine fauna spawn and feed. Local communities have been relying on the mangrove forests for consumable plants and medicinal herbs. Leaves, buds, fruits, and seeds of some mangrove species are used for human consumption. Some provide a wide range of medicinal uses, such as the bark of Rhizophora, which is used to heal fractures, cure diarrhea and stop hemorrhages. The mangrove forests can be an idyllic retreat for nature and wildlife lovers, photographers, bird-watchers or anyone who wants to relax and appreciate the beauty of the mangrove environment and its diverse flora and fauna. The mudflats are refueling and roosting sites for large numbers of migratory birds. The riverine areas in the mangroves offer potential for sport fishing. The meandering rivers and rivulets add to the peaceful environment especially to those escaping the tension of city life. Fireflies found at river estuaries, has been a major ecotourism attraction, such as in Kampong Kuantan, Selangor; Kampong Yakyoh, Trengganu; Delta Kelantan, Sungai Lebam, Johore; and Kuala Linggi, Negeri Sembilan/Melaka. 2. Distribution of mangroves in Peninsular Malaysia Mangroves in Peninsular Malaysia are found mainly on the sheltered west coast that borders the Straits of Melaka in the states of Kedah, Perak, Selangor and Johor. Major near-shore islands, including the Kelang islands in Selangor and Pulau Kukup in Johore are also predominantly colonized by mangroves. Small patches of mangrove forests occur along the rocky shores and they include those found in Pulau Langkawi, Kedah; in Pulau Pangkor, Perak; and in Port Dickson, Negeri Sembilan. In the south, mangroves are found in the estuaries of Sungai Pulai and Sg. Johor which drain into the straits of Johor, and the remaining mangroves are found along the straits of Johore. On the east coast, mangrove forests are mostly confined to sheltered estuaries of the Kemaman river in Terengganu, and Bebar in Pahang. The total area of mangrove forests in Peninsular Malaysia at the end of 2006 is estimated to be 107,802 ha, of which 82,091 ha has been gazetted as Permanent Reserved Forests (PRFs). Perak has the largest mangrove reserves, followed by Johore and Selangor. Mangrove reserves of Matang (Perak), South Johor (Johor) and Kelang (Selangor), together constitute 74 percent of the mangrove forest reserves. Details of mangrove areas by states are shown in Table 1. 3. Policy, legislation and prescriptions in managing mangrove forests The management of all type of forests including mangrove forests is enshrined in the National Forestry Policy 1978 (revised 1992) (NFP). The NFP was approved by the National Forestry Council in 1977, and later endorsed by the National Land Council in 1978. The Policy lists effective conservation and management of natural forest ecosystems, including the mangroves. It provides guidelines and strong emphasis on the necessity for sound management, conservation, utilization, development and protection of the forests. This commitment is duly recognized and given specific attention by the National Forestry Act 1984 (revised 1993) (NFA). The act provides the legislative backing to the policy and affirms the full protection of the mangrove forests in the PRFs. Besides these policies and legislation, there are other Federal legislations which complement and support the policies on land use matter. These include the Land Conservation Act 1960, Protection of Wildlife Act 1972, National Park Act 1980, Environmental Quality Act 1974 and Water Enactment 1935. The need to protect and conserve forest resources is further strengthened and highlighted in the National Economic Recovery Plan 1998. The Plan recommended that mangrove and nipah forests at river estuaries should be classed as Soil Reclamation Forest because of the erosion control function they serve and their sensitivity to disturbance. Meanwhile, the agricultural sector is to target suitable idle lands for development rather than general land clearance practices that deplete natural forests and encroach upon sensitive ecosystems. As a follow-up to the Earth Summit at Rio de Janeiro in 1992, Malaysia has formulated the National Biodiversity Policy (NBP) which was launched in 1998. The NBP aimed at conserving the country's plants and animal life and creating a safe, healthy and productive environment. In addition, Malaysia has developed a number of sectored policies covering biodiversity such as the National Environmental Policy (NPE), the Third National Agriculture Policy and the National Wetlands Policy. NPE is based on eight inter-related and mutually supporting principles that harmonize economic development goals with environmental imperatives. It was formulated to complement and enhance the environmental dimensions of other existing national policies, such as those on forestry and industry, and takes cognizance of international conventions on global concerns. The National Physical Plan (NPP), was prepared under the provision of Section 6B of the Town and Country Planning Act 1976 (Act 172). It was approved by the Cabinet on 20th April 2005 and by the National Physical Planning Council

Vol. 1, No. 1 Journal of Sustainable Development
90
(NPPC) chaired by the Prime Minister, on the 26th April 2005. The NPP is a long term strategic plan for the period until 2020 that contains written statement formulating strategic policies for the purpose of determining the general directions and trends of the physical development and conservation of Peninsular Malaysia. The NPP is to be the national physical planning guideline and to be implemented by all the states in Peninsular Malaysia. The NPP has classified many parts of mangrove areas as Environmentally Sensitive Areas (ESAs). The Environmental Quality Act 1974 was amended in 1985 to include Environmental Impact Assessments (EIAs) for forestry activities. The order came into force in 1987, requiring EIAs for activities that involve clearing of mangrove swamps or islands adjacent to national marine parks; conversion of mangrove areas for industrial, housing or agricultural areas covering an area of 50 ha or more; drainage of wetland, wild-life habitat or virgin forest covering an area of 100 ha or more; and land-based aquaculture projects accompanied by clearing of mangrove swamp forests covering an area of 50 ha or more. In addition, various regulations and guidelines for forest harvesting and related development in mangrove areas have been adopted. These include the ‘Forest Harvesting Guidelines in mangrove forests’, ‘ITTO guidelines on the conservation of biological diversity in tropical protection forest’ and the proposed guidelines for conservation and development of ESAs. In the wake of the tsunami at the end of 2004, the government established the ‘Special National Task Force on Planting of mangrove and other suitable species in Coastal Areas. This is a multidisciplinary committee with the task including nationwide survey and mapping of the mangrove areas, assessment of suitable sites for permanent reserve forests; rehabilitation and conservation; research, and awareness programs. 4. International commitments Tropical forest and its management had dominated discussions and deliberations at the international level. Mangrove forests, which form one of the major wetland types have gained worldwide recognition. Malaysia is a signatory to various international forest-related agreements which includes the United Nations Forum on Forests (UNFF), Convention on International Trade in Endangered Species of Wild Fauna and Flora (CITES), Convention on Biological Diversity (CBD), United Nation Framework Convention on Climate Change (UNFCCC) and Convention on Wetlands of International Importance especially as Waterfowl Habitat (Ramsar Convention). These agreements have initiated variety of programs and projects to inculcate and institutionalize aspects related to conservation and sustainable use of biological resources. As a party to the Ramsar Convention, Malaysia undertook to promote wise use and conservation of wetlands and establish nature reserves in wetlands and designate areas as Ramsar sites. With the CBD, Malaysia is committed to formulate national strategies and action plan to integrate conservation of biological diversity into all relevant development. The two prominent CBD decisions are the global strategy for plant conservation and acceptance of ecosystem approach, with the ultimate and long term objective to halt the current and continuing loss of plant diversity. The various international agreements will continue to influence our forest management practices as well as timber trade. 5. Management of mangrove forests Managing mangrove forests has been very challenging. The policy and management have great impact on political, social, economic, ecological and environmental well-being of the country. Forestry Department Peninsular Malaysia (FDPM) holds the responsibility and obligation in managing and safeguarding our mangrove resources. FDPM has taken steps to designate mangrove forest reserves to ensure they are efficiently and sustainably managed. Mangrove forest reserves are managed with the overall goal of conserving and managing the sustainability of forest through sustainable management, and maintaining its important roles in the national economy and environmental stability. Hence, sustaining their ecosystem functions, services and production. This goal was approved by the National Forestry Council through the National Land Council in 1992 and is binding for the states in Peninsular Malaysia. Mangrove forests management system has changed from merely managing for its wood produce, to a management system that incorporates multiple roles, protection and conservation. Systematic management of mangrove forests started in 1904, with the adoption of the first working plan for Mangrove Forests in Matang. In fact, mangrove forest management proper actually started in 1902, with the first gazettement of mangrove forest reserve. In early 1960’s, there was a gradual change to the uses of the mangrove ecosystem, due to the increasing pressure for coastal land by the growing population, particularly along the west coast of Peninsular Malaysia. Large mangrove areas were excised for residential, agricultural and industrial purposes. These are in direct conflict with the ecologically sound multiple-use management system and prompted an urgent need for the formulation of a national mangrove management plan to ensure rational management and utilization as well as resolving conflicts in resource utilization by the various sectors. In 1996, the Cabinet issued a directive to avoid further loss of mangroves, urging protection of the coastal areas and to manage the resource on a sustained yield basis. This has also been incorporated into other environmental policies, to maintain the extent and integrity of the mangrove ecosystem and ensure sustenance of the ecosystem functions, services

Journal of Sustainable Development March, 2008
91
and production. The total remaining mangrove forests in Peninsular Malaysia is the result of these initiatives. A good example is Matang mangroves, which has actually increased by 1,498 hectares, as compared to the total area when they were gazetted. Beside mangroves in PRFs, there are stateland and alienated mangroves. Even though the areas are mostly small and fragmented, their combined acreage nevertheless are quite substantial. Steps must be taken to gazette the stateland mangroves as PRFs, in line with the call made by the 19th meeting of the National Forestry Council, chaired by the Deputy Prime Minister in 2005. Mangrove forest reserves are divided into four broad classifications as provided for in the NFP. They are: (a) Protection Forest for ensuring favorable climatic and physical conditions of the country , safeguarding of water resources, soil fertility, environmental quality, conservation of biological diversity and the minimization of damage by floods and erosion to rivers and agricultural land (ha). (b) Production Forest for the supply in perpetuity at reasonable rates of all forms of forest produce which can be economically produced within the country and are required for agricultural, domestic and industrial purposes. as well as for export (ha). (c) Amenity Forest for the conservation of adequate forest areas for recreation. Eco-tourism and in promoting public awareness in forestry (ha). (d) Research and Education Forest for the conduct of research, education and conservation of biological diversity (ha). 6. Mangrove management and conservation by various state forestry departments As land is a state matter, mangrove forests are managed within the exclusive jurisdiction of the respective state forestry departments. This resulted in slight differences in terms of management regimes, objectives, priority and needs between states. Mangrove forests management and conservation by the various state forestry departments are discussed in the following paragraphs. 6.1 Matang mangroves, Perak Matang mangroves is one of the earliest forest to be gazetted as Permanent Forest Reserve, and subsequently managed on a systematic and sustainable approach since 1904. The Mangrove forests stretches from Kuala Gula in the north to Panchor in the south, covering a distance of about 52 km and 13 km wide. The extent of Matang mangroves is 40,466 hectares, though small in terms of hectarage, the roles has extended beyond the traditional role of producing timber to include tourism, bird sanctuary, research and education, preservation of unique sites, conservation and environmental stability. Matang mangroves not only provided a constant yield of renewable forest products, but also forestry resources and a conducive environment for aquaculture. Matang mangroves hosts 34 permanent settlements of which 28 are fishing villages with a total 5,300 households and an estimated population of 31,800 who are mainly engaged in mangrove activities. These villages are located inside, within and along the periphery of Matang Forest Reserves. Matang mangroves is divided into 3 ranges: Kuala Sepetang, Kuala Trong and Sungai Kerang, comprising 19 forest reserves and a total of 108 compartments. Reservation started in 1902, but the whole of Matang Mangroves was finally gazetted in 1906. The first written working plan of Matang Mangroves was prepared by A.E. Wells in 1904, which was more of a scheme to control and regulate felling. The management system of Matang mangroves has been subjected to many changes. The first system applied was the minimum girth system, which was then replaced by the standard system. Later the shelterwood system was proposed, with the provision of the retention of standards which was later replaced by the provision of the two-staged final felling. Similarly, the rotation length was reviewed from 20 years to 30 years, then to 40 years and finally back to 30 years in 1950. The 30 years rotation was based on report (Noakes, 1952) that the Mean Annual Increment of trees in the sample plot culminates at age 23 years. In the early years, the period for each working plan has been short and structured. The first 10-year working plan of Matang Mangroves only started in 1930, for the period 1930 to 1939. This working plan was periodically revised incorporating changing circumstances and the availability of new findings. During the early years, the working plan has been successfully prepared to maximize the sustained yield of wood production through only one silviculture system with limited production for non wood and other forest services. Matang mangrove has a dynamic silvicultural system, which has undergone refinement from time to time. Silvicultural operations are modified to suit the individual forest types. With the availability of more information through various research work, expeditions and many other related study, the scope of the working plan has been extensively expanded to include the application of compatible silvicultural system to the specific ecological types, which have been grouped into the respective productive and protective management zone. The functional role of Matang mangrove was then extended beyond the traditional role of producing timber to include ecotourism, wildlife sanctuary, education, research, preservation of unique sites and other biodiversity conservation.

Vol. 1, No. 1 Journal of Sustainable Development
92
The latest revision to the management plan covered the period 2000-2009, which emphasized on an integrated approach of management, considering on a comprehensive assessment of all direct benefits derived from the mangrove forests. Under this plan, Matang mangroves are divided into four management zones, namely (i) protective zone (7,360 ha), (ii) restrictive protective zone (2,892 ha), (iii) productive zone (29,794 ha) and (iv) the unproductive zone (420 ha) (Razani et al, 2007). The yield at final felling was estimated to be 179 tonnes/ha, which represented an increase of 2 tonnes/ha and 4 tonnes/ha from the previous management plan period, 1980-1989 and 1990-1999, respectively. The ecological consideration provides the basis and option to tap the full potential of the forest resources. Zoning represents a broad application of the concept of multiple uses, involving designation of forest areas for specific functional purposes. After more than a century of continuous and systematic management, Matang mangroves have only lost 250 hectares to settlement expansion and infrastructure facilities. As compared to other mangrove areas in the country, Matang mangroves has never been excised for agriculture or aquaculture activities. On the other hand, there was a net gain of 1,498 hectares over the years, with excision and accretion going on at the same time. The success of Matang mangrove is due to the strong commitment, policy and legal framework, professional forest management, increased public awareness, and linkages with local institutions of higher learning and research organizations. Future strategy of managing mangroves in Perak will adopt an integrated approach by further refining the current integrated approach to mangrove forests which will enhance their sustainable economic, social and environmental benefits with new strategies incorporating the latest findings and updated information gained through various research works, continuous specialized scientific expeditions and many other studies on the existing mangroves. 6.2 Johore mangroves Johor is dominated by coastal plains and large low-lying wetland areas. The districts of Pontian, Kota Tinggi and Johor Bahru share almost all the state’s mangrove forests, while Batu Pahat, Muar and Mersing share a minor portion. Sg. Pulai is the most important in terms of production of poles and charcoal, followed by Sg. Johor. Reservation of mangrove forests in Johor started in 1923 with the gazette of Sg. Pulai and Pulau Kukup forest reserves. Management of mangrove forests has undergone three management Period, early management (1941-1972), management after 1972 (1972-1999) and current management (after 2000). The first Working Plan was prepared by F.S. Walker in 1941, but was only implemented in 1947, after the 2nd World War. The objective then was to supply charcoal and firewood to Singapore as well as marketed locally. Stick thinning was introduced using sticks up to 16 feet (4.9m) in length. The practice was later abandoned due to heavy branching, as the forest was then managed for the production of poles. Another working plan was introduced by P.F. Burgess in 1950 which was subsequently revised in 1955 and 1960. After 1972 another working plan was drafted by Clarke with the objective of protecting coastal areas, provide employment for the locals and production of firewood, charcoal, poles and piling on a sustained yield basis. The silvicultural system adopted by Clarke was a 20-year rotation crop based on clear felling with one intermediate thinning at year 15 using the stick thinning method with a spacing of 1.6 metre. Buffer zone along rivers was recommended to be not less than 20 metre from the low tide mark. The current management plan for the mangroves of Johore (2000-2009) is an output of a two-year project carried out by the FDPM, the state Forestry Department of Johore and the Danish Cooperation for Environment and Development (DANCED). The plan provides long term management planning and guidelines on conservation and protection, rehabilitation of degraded sites, maintaining the ecological functions of mangroves as feeding and breeding ground of coastal fauna, and setting aside adequate forest for community and amenity purposes, research and training. It has four main components: Bio-D Conservation, Sustainable Mangrove Production, Community Forestry and Awareness and Recreation. Under the current management plan, the mangrove forests are managed with a system of clear felling and a rotation of 20 years based on area control. No thinning or intermediate felling are carried out. The area laid out for production constitutes some 8,183 ha or 46% of the total extent of the mangrove forest reserves. Allocation of areas for harvesting is based on the annual coupe of 400 ha. (300 ha. in Sg. Pulai and 100 ha. in Sg. Johor Forest Reserves). Based on a 20-year rotation, the area to be harvested within the ten year planning period is 4,092 ha. Thus, approximately 400 ha or 5% of the total productive forests (2.3% of the total mangrove forest reserves) are clear felled, annually. As a precautionary measure, areas for felling are spread out to ensure minimum disturbance to the habitat and wildlife have ample opportunity to consolidate into the adjoining forested areas. The harvested areas are ensured total regeneration either through natural, artificial or combination of both. Areas other than the production forests are to be designated as Old Growth Forests, Coastal Protection Forest, River Bank/Riparian Protection Forest and Wildlife Refuge Forest. They may serve one or a multiple of overlapping functions. The scattered compartment of old growth forests are valuable conservation sites that provide nesting sites for large birds. Most of the Old Growth Forests are in Sg. Johor Forest Reserve, and the state forestry department is currently identifying these areas to be designated by compartment. One Virgin Jungle Reserve (VJR) was established in Kuala

Journal of Sustainable Development March, 2008
93
Sedili Forest Reserve and one amenity forest established in Sg. Johor Forest Reserve. In addition, two State Parks were established by the Johor National Parks Corporation. They are located at Tg. Piai (Sg. Pulai Forest Reserve) and Pulau Kukup. Three mangrove areas were declared as Ramsar Sites, viz. Pulau Kukup, Sg. Pulai Forest Reserve and Tg. Piai. Additional sites identified are the Kuala Sedili Forest Reserve, Sungai Lebam, Sungai Santi and Sungai Sebana. 6.3 Selangor mangroves Mangrove forests of Selangor are mostly found in Klang islands, Banjar Utara and Banjar Selatan. The total mangrove area under PRFs is 14,897 ha, which is about 6% of the total PRFs of Selangor. The first working plan for Selangor mangrove was prepared by A.E.Sanger for the period 1922 to 1925. Between 1921 and 1961, seven working plan have been prepared for Selangor mangroves. Since 1962, mangrove forests of Selangor were managed under the Annual Felling and Treatment Plan. They are managed for the production of quality poles, firewood, fishing stakes and piling poles, and at the same time sufficient areas are set aside for conservation and protection. Selangor mangrove was first managed under a rotation of 30 years with intermediate felling at 20 years. The rotation was then changed to 40 years, then back to 30 years, then to 20 years and finally 15 years. The change in rotation was due to changes in the primary management objectives from production of firewood and charcoal to that of poles. At 20 years rotation, the intermediate felling was conducted at 15 years. Further reduction of rotation to 15 years was due to the high demand for poles and the market has adjusted to accept smaller size poles. This also has economic and silvicultural reasons, to maximize the number of poles produced per ha, to cater for the short fall in the annual supply as mangrove productive areas were further reduced (Nik Mohd Shah et al, 2005). Currently, based on a productive area of 8,760 ha, and a rotation age of 15 years, the annual coupe is fixed at 578 ha per year. With an average of 3,000 poles per ha. from the first intermediate felling and 2,500 poles per ha form final felling, the estimated production of poles from Selangor mangroves is about 2,750,000 pieces annually. The silvicultural system of Selangor mangroves has evolved around the minimum girth system, shelter-wood system and clear felling. The shelter-wood and minimum girth system was favored in the past, when the rotation age was longer and natural regeneration was plentiful. As the rotation age was shortened to half, more areas need to be rehabilitated artificially. Currently, the average size of areas requiring rehabilitation ranges between 15 – 20% of the annual coupe. The main species used for rehabilitation are the highly productive Rhizophora apiculata and to a lesser extent the R.mucronata. 6.4 Kedah mangroves The largest mangrove forests of Kedah is the Merbok Mangrove Forest Reserves that covers an area of approximately 4,085 hectares. The remaining mangroves are located in Pulau Langkawi (3,116 hectares), comprising of three large mangrove areas. They are Kampong Kuala Isap-Gua Cerita mangroves, the Sungai Ayer Hangat-Kubang Badak mangroves and the Pulau Dayang Bunting-Pulau Tuba mangroves. Mangrove forests in Kedah has shrunk over the years due to land demand for development, agriculture and aquaculture projects. The Bukit Malut mangrove with a total area of 110 hectares has given way to aquaculture ponds, while another 975.79 hectares of Sungai Merbok Forest Reserve was converted to make way for aquaculture ponds, small industries and other development projects. The mangrove forests management plan for Kedah was prepared with the objectives: to ensure sustain supply of timber resources for local industries; to produce poles for local users; and to conserve and protect coastal and fringes areas from erosion, rough current and winds. The concept of management is minimal interference, conservation and minimal silvicultural treatment. The annual coupe is 100 hectares on a 30 years felling rotation. Harvesting of mangrove forests is only restricted to Sg. Merbok area, while the mangroves of Langkawi are managed for conservation, ecotourism and protection. However, harvesting of mangroves for its timber is becoming less common in Kedah. 6.5 Trengganu mangroves The mangroves of Trengganu are mostly small and fragmented covering a total area of 2400 hectares. They are mainly limited to protected waters of estuaries and lagoons. With a small total area, they are limited in resource yield. Nevertheless, they play uniquely important ecological and protective functions. The largest mangrove area is the Kemaman Forest Reserve with a total area of 938 hectares. The next largest mangrove area is the stateland mangrove in Setiu district, stretches from Merang in the north to Kampong Raja, Besut. These are mostly fringing mangroves consisting mostly of Nypa and some stand of Rhizophora. Forestry activities is less common than fishing in Trengganu mangroves. The charcoal industri in Trengganu is working under constraints capacity. The extraction of mangrove timbers for poles and scaffolds are very much localised. Mangroves are seldom exploited commercially for its timber, but more for own consumption by local villages. It is common to see fish traps such as bubu, made of mangrove timber in Trengganu. The main fishing activities in mangroves are crab trapping, net trapping and shellfish harvesting. These activities are merely part time, particularly during the Northeast monsoon season between October and January. Waterways fronting or surrounding the mangroves are suitable for marine cultures such as cage culture for fishes and rafts culture for oysters and mussels.

Vol. 1, No. 1 Journal of Sustainable Development
94
Although the mangroves in Trengganu are not exploited commercially for timber, but they are subjected to conversion into development and industrial area. Much of the mangrove areas around Kuala Trengganu has been converted, leaving some remnants at Sungai Ibai, Sungai Trengganu and the lagoon wetland area at Batu Rakit. The Forestry Department is taking the initiatives to rehabilitate the remaining degraded mangrove areas in Trengganu 6.6 Other mangroves Mangrove forests are also found in the other states of Peninsular Malaysia. However, these mangrove forests are scattered, small in extent, not economically significant yet but ecologically and environmentally important. These areas are briefly summarized in Table 2. 7. Issues in managing mangrove forests The mangrove ecosystem is a sensitive ecosystem that has continued to be affected by the rapid economic growth of the country. The familiar development-environment frictions have always been a major concern. Population pressures and the increasing demand for land continue to pose threat to the coastal and marine resources. Mangrove forests have been the most vulnerable, under severe pressure and the first to be cleared when the need for land arises. There have been perceptions that mangrove areas are considered wasteland, thus, converting mangrove to other uses will fetch a higher financial returns. To many, mangroves are considered an eyesore that need to be cleared, while to some, mangroves are a waterfront that need to be developed, failing to recognize the essential functions of mangroves in maintaining the coastal ecosystem. There is limited information or documentation on mangrove destruction. Similarly, many statements have been made about the impact on biological diversity loss, but there are lack of scientific data or evidence to support these statements. However, shrinking mangrove areas resulting from developmental decisions of the past, as well as signs of strain on the remaining mangroves provides evidence of threat to this ecosystem. Being a fragile ecosystem, mangroves tend to fluctuate as a result of slight changes in the natural environment. Rapid development has led to clearing of mangrove areas to make way for urban and infrastructure development, beach resorts and aquaculture ponds. Industries and factories situated near the rivers and streams might discharge their effluent into the water systems, polluting and choking the riverine habitat, and eventually adversely affecting the aquatic biodiversity. The disruption of mangrove functions as part of our wetland ecosystem has a high cost: economically, socially and ecologically. The disturbance of their natural balance can destroy critical gene pools required for medical and agricultural purposes, affecting their ability to protect the coastline naturally and ruined their use for educational and recreational purposes. Constant sedimentation has endangered a variety of fishes and other marine species, particularly the corals. Destruction of mangroves led to a dramatic loss to the commercial and recreational fishing industry, coastal erosion, and endangered many floral and faunal species. Another issue is jurisdiction between federal and state government. Matters related to land use and natural resources remains within the exclusive jurisdiction of the state. The vast natural resources sectors such as forests, fishery, wildlife, mining and agriculture are under different agencies/authority with separate sets of regulatory laws, which at times creates overlaps in prescriptive and enforcement jurisdiction. The establishment of the National Forestry Council has successfully tackled this issue at policy level, and the various committees formed at the federal and state levels has helped to further improve towards conservation, sustainable use, management and development of the mangroves. Public awareness regarding mangroves and their conservation is on the rise. But some still do not appreciate the role of mangroves to the environment and quality of life. Despite the many benefits and functions, mangroves is seen not much more than timber, charcoal and woodchips, Indirect benefits offered by mangroves are easily forgotten and set aside when quick profits can be generated by converting mangroves to other uses. Absence of proper evaluation on mangrove forests results in the undervaluation of the mangrove forests. This in turn, has sent the wrong signals to the market. Therefore, there is need for a comprehensive valuation of our mangrove forests. More applicable inputs from research are needed. 8. Future strategy in managing mangrove forests FDPM have been successful in managing and conserving the mangrove forests in Peninsular Malaysia since the early 1900s. However, there is room for further improvement. The NFP and other related policies will be revised from time to time to match prevailing conditions and requirements, and to ensure the realizations of its multi-functions in perpetuity. The co-operation and co-ordination of relevant agencies will be fostered with respect to specific objectives in safeguarding the mangrove ecosystems. The aspirations and concerns of other related policies adopted would be viewed and considered in perspective so that a holistic approach in resource management and development could be amicably achieved. Future management of mangrove forests in Peninsular Malaysia will continue to adopt an integrated approach by further refining the current management approach and incorporating latest findings and updated information through

Journal of Sustainable Development March, 2008
95
more vigorous R&D, scientific expeditions and studies on mangrove forests. The remaining mangrove forests will be protected to ensure its biological diversity remained intact and not lost in the name of development. Disruption to the mangrove ecosystems and functions must cease, the diversity of remaining mangroves must be retained, and where possible rehabilitation, restoration and re-creation of mangroves habitats must continue to be pursued. Synergetic public-private partnership will be forged to ensure a functional coordination among concerned agencies. Public awareness and education related programs will be further enhanced. Efforts will be intensified in creating a better understanding among the public and policy makers on the importance of mangroves to the environment. 9. Conclusions and Recommendations FDPM recognizes the significant role of mangroves as an integral part of a wider forest ecosystem. FDPM is fully committed to ensure that our mangrove resources are sustainably managed, utilized and preserved for the benefits of present and future generations. From the first management plan, FDPM have moved forward and took a more positive approach by giving increasing emphasis on the conservation aspects of mangroves forest management. The role of foresters has changed from merely dealing with traditional forestry tasks to a multi-task approach. The practice of sustainable forestry production has contributed not only economically but also socially and environmentally. Matang mangroves is a living exemplary of the forest management practices that also conserves the biodiversity. The many diverse flora and fauna of the mangrove forests that are still intact are proof of our good management and conservation effort. The success in the sustainable management of mangrove forests by FDPM has in fact contributed to the sustainability of the Wetlands in Malaysia which is crucial to the survival and future health of the earth too. References Nik Mohd Shah, N. M., Shah Rani, A. Z. and Zakariah, A. H. (2005). Management and conservation of mangroves: Selangor Experience. In: Shaharuddin, M. I., Azahar, M., Razani, U., Kamaruzzaman, A. B., Lim, K. L., Suhaili, R., Jalil, M. S. and Latiff, A. Forest Biodiversity Series 4: Sustainable Management of Matang Mangroves: 100 Years and Beyond. Forestry Department Peninsular Malaysia. pp 91-101. Noakes, D.S.P. (1952). A Working Plan for the Matang Mangrove Forest Reserves, Perak. Forestry Department. Federation of Malaysa. 172 pp. Razani, U. and Abdullah Sani, S. (2005). Matang forest reserve: Best managed mangrove forests in the world. Pap0er presented at the National Conference on the management and conservation of forest biodiversity in Malaysia. 20-21 March, 2007. Putrajaya. Table 1. Current extent (ha) of mangrove forests (PRFs and Stateland) in Peninsular Malaysia (2006)
State Mangrove Forest Reserves Stateland Mangroves Total
Johor Kedah Kelantan Malacca N. Sembilan Pahang Penang Perak Perlis Selangor Terengganu
16,127 6,202 - 80 204 2,387 376 40,466 - 14,897 1,295
13,561* 1,916 744 - - 1,813 494 1,885 13 4,650 692
29,688 8,118 744 80 204 4,200 870 42,351 13 19,547 1,987
Total 82,091 25,768 107,802
*Mangrove areas (including mudflats) that has been approved by the state government in 2005 to be gazetted as PRFs

Vol. 1, No. 1 Journal of Sustainable Development
96
Table 2. Other mangrove forest areas found in Malaysia
State Mangrove forests
Pahang There are a total of 4,200 ha. of mangrove forests, found in the forest dictrict of Rompin and Kuantan, of which 2,387 ha have been gazetted as PRF.
Perlis Mangrove forests are found in patches in Kuala Perlis area.
Kelantan There are patches of mangrove forests at estuaries and their river banks at Tumpat, Pasir Puteh and Bachok districts. A centre of excellence was established in Delta Kelantan
Negeri Sembilan
Much of the mangrove forests found in the vicinity of Port Dickson has been developed for resorts, marinas and housing
Malacca Mangroves found on river banks and estuaries for conservation.
Penang Mangrove forests cover a total area of 967 ha, of 376 ha gazetted as PRF and 600 ha in alienated and state land. Centre of excellence for Nipah established in Hutan Simpan Ayer Hitam Dalam.

Journal of Sustainable Development March, 2008
97
Climate Change and Architecture: Mitigation and Adaptation
Strategies for a Sustainable Development
Sergio Altomonte School of the Built Environment, University of Nottingham University Park, NG7 2RD Nottingham, United Kingdom
Tel: 44-115-951-3170 E-mail: [email protected] Abstract Buildings are responsible nowadays for more than half of the energy consumption worldwide, significantly contributing - with the CO2 emissions they trigger - to the very causes of climate change. The knowledge gap that exists with respect to how emissions from built environments can be mitigated and, simultaneously, how buildings and their occupants can adapt to shifts in global and local climate must be filled, involving integration of established knowledge, advanced design strategies, application of innovative technologies and multidisciplinary research. Although the evidence of climate change is supported by large consensus, the amount of data and predictions currently available often results in ambiguous information for climate non-specialists. Starting from a review of the Fourth Assessment Report published by the IPCC, the paper examines the interactions between human systems and dynamic environmental forces, trying to underline the causes and consequences of the evident alteration in the climatic equilibrium of the planet and exploring how built environments can contribute to mitigate and adapt to these changing conditions. Keywords: Climate Change, Architecture, Mitigation, Adaptation, Integrated Design 1. Introduction The last 10 000 years have been a period of relatively stable and mild climate. Overall, this has suited mankind perfectly, creating the conditions for the development of agriculture, stable settlements, and, ultimately, the emergence of complex human societies. Obviously, there have always been slight variations in local weathers, but usually changes have taken place so slowly that animals (including humans), plants and other forms of life have had time to adapt or migrate. However, since the onset of the Industrial Revolution, the pace of these variations has been dramatically speeding up: humans have changed the chemistry of the atmosphere through the combustion of fossil fuels and living matter, bringing about the prospect of global alterations and shifts in the whole terrestrial climate system. The threat of global warming brought about by the build-up of heat-trapping gases in the atmosphere has nowadays become common knowledge. Yet, it is just recently that we have started to realise that the actions we have undertaken since the Industrial Revolution (and probably before) may have changed, possibly in a non-reversible fashion, the relationship between human development and the natural environmental system, altering most of the basic conditions that had allowed life to thrive on Earth. In this context, buildings - with their energy consumptions and CO2 emissions - have played a leading role. In order to respond to these threats and meet the needs imposed by a sustainable development, a new approach to building design and construction is mandatory, one which simultaneously addresses the complex requirements of the environment with its finite resources and the needs of contemporary societies and economies. New concepts of integrated design featuring sustainable methods of generation and use of energy have to be developed, bringing together the mandates of environmental responsibility (strategies of mitigation of human impacts) with the notion of climate responsiveness (strategies of adaptation to climate change). In pursuit of solutions, an important lesson can be derived by looking at adaptive natural systems. In Nature, almost all living organisms develop, through evolution, responsive mechanisms to endure changing conditions without depleting their resources and altering the equilibrium of their ecosystem. Considering the global climate alterations we are now facing and the speed and momentum of these shifts, an ‘adaptive’ attitude in the way built environments are conceived and inhabited can provide the conceptual basis for the building design of the future. If humans are going to prosper, they will have to re-learn how to imitate Nature’s highly effective adaptive metabolic systems, integrating ancient knowledge with current and forthcoming technology for the most ‘sustainable’ design yet seen.

Vol. 1, No. 1 Journal of Sustainable Development
98
2. The Science of Climate Change 2.1 The Greenhouse Effect According to the Fourth Assessment Report (AR4) of the Intergovernmental Panel on Climate Change (IPCC), ‘climate’ can be defined as ‘average weather’ and is usually described in terms of the “mean and variability of temperature, precipitation and wind over a period of time, ranging from months to millions of years” (IPCC, 2007a). The climate of the Earth is powered by the Sun, which radiates energy over a wide range of wavelengths, and predominantly in the visible part (around 54% of its emissions) of the electromagnetic spectrum. The amount of energy reaching the higher strata of the Earth’s atmosphere each second on a surface area of 1m2 facing the Sun during daytime is about 1370 Watts (W). Since the Earth is nearly spherical, a greater amount of solar radiation arrives for a given surface area in the tropics than at higher latitudes, where sunlight strikes with a constantly decreasing angle. Energy is then transported from tropical regions to northern or southern latitudes via atmospheric and ocean circulation. Part of the energy that reaches the Earth is reflected directly back into space by the atmosphere, while the remaining fraction is captured by land, biota, oceans, ice caps and, to a lesser extent, by gases. The total quantity of energy absorbed per second by the terrestrial system - averaged over the entire planet - amounts approximately to 240 W/m2. To balance this absorbed solar radiation, the Earth must re-radiate back in space the same amount of energy. Considering that the Earth is much colder than the Sun, it emits radiative energy at much longer wavelengths, i.e. in the infrared part of the spectrum (‘thermal’ radiation). Once emitted, some of this infrared radiation is absorbed by gases in the cooler upper atmosphere (CO2, water vapour and other naturally-occurring trace gases that, altogether, make up less than 0,1% of the atmosphere) and is radiated back to the surface; this is what is called the ‘greenhouse effect’. The warming effect of greenhouse gases (GHGs) is thus a natural process, which, incidentally, is conducive to life on our planet. Without this warming, the average temperature at the Earth’s surface would be about 30°C colder than the average +14°C currently enjoyed, and below the freezing point of water, making life as we know it simply not possible. Nevertheless, human activities of the last two centuries - primarily the burning of fossil fuels and the clearing of forests - have greatly intensified this natural greenhouse effect, initiating a chain of events which, as we are now starting to realise, can lead to drastic climate change. 2.2 The Earth’s climate system The system governing the climate on Earth consists of many sub-systems linked together in a non-linear fashion. The many interlinkages amongst them make it difficult to predict the overall behaviour of the global climate in response to a variation in a single sub-system like, for example, the atmosphere. The state of the atmosphere (temperature, humidity, cloud density, pressure distribution, etc.), in fact, is interactively influenced in its turn by other sub-systems such as the oceans, the cryosphere (snow and ice), the biosphere (animals and plants) and the lithosphere (e.g. volcanoes). Considering the intricate interactions between the various sub-systems, to induce a significant alteration in the global climate, one (or more) of the following causes (often referred to as ‘climate forcing’) has to occur (Alfsen et al., 2000): 1) Alteration of the Earth’s orbit and movements; 2) Variation in the intensity of solar radiation (the so-called ‘solar constant’); 3) Shift in the geological equilibrium of the planet (such as shape or position of the continents); 4) Variation in the equilibrium of oceanic currents (e.g. Gulf Stream, El Niño-La Niña cycles, etc.); 5) Modification of the Earth’s albedo (i.e. the reflectivity of the planet’s surface and atmosphere); 6) Changes in the composition of the atmosphere due to human activity. These driving forces operate on different time scales ranging from very long geological eras up to a more ‘human’ temporal dimension. In addition, there are many complex feedback mechanisms in the climate system that can either amplify (‘positive feedback’) or diminish (‘negative feedback’) the effects of an alteration in one of the sub-systems, generating internal reactions whose effects are difficult to predict due to the complex ramifications amongst the various factors involved. For example, evidence from ice cores (which currently represent the source of most of the information we have available on past climate alterations) testify that our planet has in several occasions during its paleoclimatic history abruptly shifted between climate extremes due to positive feedback loops (Smith, 2005). Earth’s climate has varied with time, both locally and globally, ever since the planet formed some 4,5 billion years ago. Best known are the Ice Age of 20 000 years ago (glacial maxima), the little Ice Age that hit Europe in the early Middle Age, the following medieval warm period and the cooling of the 17th, 18th, and 19th centuries. In all of these variations, carbon dioxide (CO2) concentration is believed to have constantly played an important role (IPCC, 2007a). Carbon is a key element for life on Earth forming the basis of all the plants, animals and micro-organisms. Its concentration in the atmosphere, over geological time scales, has helped stabilising the climate on Earth through the

Journal of Sustainable Development March, 2008
99
‘carbon cycle’, a combination of biological, chemical, and physical processes where the atmospheric CO2 is absorbed by ‘sinks’ - biota (plants and animals), rocks and ocean water - for then being released back in the ecosystem with the death and decomposition of living organisms, with the weathering of rocks and/or with volcanic eruptions. A high concentration of carbon dioxide in the atmosphere leads to a warm and humid climate (warmer air can retain more humidity) that in turn, due to increased precipitation, leads to more rock erosion and consequently to a stronger sink for atmospheric CO2 (as silicate binds to carbon in the atmosphere and is ‘absorbed’ by diffusion in the oceans). Conversely, low carbon dioxide concentrations induce a colder climate resulting in possible glaciations, with an ice cover that protects rocks from erosion and thus reduce CO2 sinking. These cyclical feedbacks tend to stabilise the global climate system (temperatures and carbon concentration) in the long run (Alfsen et al., 2000). Under natural circumstances, the release of CO2 is offset by carbon sinks, and the climate system would be in a dynamic equilibrium with the energy received from the Sun if it were not for external forcings which could alter this balance, as it has happened several times in the paleoclimatic record of our planet. 2.2.1 Alteration of the Earth’s orbit and movements One of the causes of past climate fluctuations has been due to variations in Earth’s orbit eccentricity, axial tilt (or obliquity) and precession, occurring over thousands of year-cycles. These orbital changes (induced by gravitational pull from neighbouring planets) are generally referred to as ‘Milankovitch cycles’, which change the amount of solar radiation received at each latitude in every season, although they can hardly affect the global annual mean (Figure 1). The Milankovitch cycles have been linked to the start and end of Ice Ages, although there are still several scientific uncertainties about how this alterations can actually be triggered (the amount of summer sunshine received in the northern hemisphere seems to play a crucial role in this process). It has been calculated that the Earth’s current orbital configuration is similar to that of the warm interglacial period of 400 000 years ago, probably signifying that we may be in the early stage of an interglacial episode. Yet, the next large reduction in northern summer insolation is not expected before 30 000 years (IPCC, 2007a). 2.2.2 Variation in the intensity of solar radiation Another likely cause of climate change in the past has been linked to variations in the energy output of the Sun, on both short and long time scales. On a short time scale, the solar output is known to vary over the 11-year solar ‘sunspot cycle’. Although the total intensity of the solar radiation does not vary much during this period (by close to 0,1%), alterations in the mean temperature over land in the northern hemisphere have been correlated to this phenomenon. On a longer time scale, as a consequence of the Sun’s evolution as a star, the solar radiation has increased its intensity by approximately 30% since the creation of the solar system (and thus the Earth), 4,5 billion years ago. Yet, although the solar radiation was considerably less intense at that early stage, the primordial terrestrial atmosphere contained probably much more CO2 (and possibly methane, CH4), and thus the ‘natural’ greenhouse effect contributed to keep the planet warm. 2.2.3 Shift in the geological equilibrium of the planet Movements of tectonic plates contribute to the stirring effect of the atmosphere in concert with the rotary motion of the Earth and also cause fluctuations in atmospheric pressure. Data that go beyond the reach of ice cores seem to confirm that much warmer times than present have occurred in the Earth’s paleoclimatic history due to shifts in the geological equilibrium of the planet, the formation of volcanoes and a consequently higher CO2 concentration in the atmosphere. Dramatic changes in carbon concentration have also been linked to subduction phenomena (when one tectonic plate slides under another). In this process, vast quantities of CO2 and debris are suddenly released, leading in the short term to a cooling of the climate (dust cutting out solar radiation), and to a warming effect in the long run, since CO2 has a longer life in the atmosphere than dust and debris. 2.2.4 Variations in the equilibrium of oceanic currents Due to a warming of the climate system induced by other external factors, surges of water coming from melting ice and increased rain can flow in the oceans affecting deep ocean currents; the Gulf Stream is a clear example. In this case, salty and warm surface water migrates from tropical seas to the North Atlantic heating up the north-western shores of Europe (contributing up to the 25% of the heat budget of these areas). In its movement, the current gradually becomes colder and saltier until it reaches Greenland, where due to its density it sinks to the ocean floor and, consequently, pulls more warm water from the tropics keeping active the current’s ‘conveyor belt’. If rain and melted land-based ice led to more freshwater runoff to the ocean, they could lower the salinity (and thus the density) of surface water undermining its ability to descend to the ocean floor. The stopping of oceanic currents would however be a reversible process (negative feedback), since colder conditions would decrease the melting of ice - and thus the plunging of fresh water in the ocean - up to a point where a new balance would be found. 2.2.5 Modification of the Earth’s albedo The extent of ice cover is another example of forcing that could be responsible for climate change. Ice has a much

Vol. 1, No. 1 Journal of Sustainable Development
100
greater reflectivity (albedo) than water and land masses, and thus it causes solar radiation to be reflected back to space rather than be absorbed by the surface and warm the climate system. A reduction in ice cover due a climate forcing could eventually lead to even warmer conditions (positive feedback) until a further forcing would intervene to shift the equilibrium of the system. Other factors affecting the Earth’s albedo can be represented by changes in cloud distribution, the presence of small particles called aerosols in the atmosphere, or alterations in the land’s cover. 2.2.6 Changes in the composition of the atmosphere due to human activity Finally, the last and possibly most dangerous cause of climate change can be linked to variations in the atmospheric concentration of greenhouse gases due to human activity. Carbon has been slowly locked in the Earth’s system over million of years; yet, since the Industrial Revolution, humans have been releasing CO2 in the atmosphere at a rate unprecedented. In addition, agriculture and industrial activities have resulted in the constantly increasing emission of other greenhouse gases such as methane (CH4), nitrous dioxide (N2O) and halocarbons (hydrofluorocarbons, HFCs, perfluorocarbons, PCFs and sulphur hexafluoride, SF6), which are significantly affecting the climate by altering the Earth’s energy budget. Although some scientists believe that the human influence on the climate system could be dated back at a far earlier time than the beginning of the Industrial Revolution (Note 1), the concern of our time is about climate changes comparable in magnitude to the global average difference between a glacial and an inter-glacial period (roughly 5°C), but projected to occur in a matter of decades rather than thousands of years. Throughout their evolution as a species, humans have always been subdued to the vagaries of climate, responding to drastic climate alterations with their wits, their adaptation capacities or eventually migrating to milder zones. Yet, today our number has grown to a point where there is no room for large-scale migrations should a major climate shift make this necessary (Flannery, 2005). The challenge humans have to face today is thus to put in place mitigation actions necessary to prevent the planet crossing the threshold into a process of irreversible global warming that could have disastrous impacts on many aspects of life, and also to develop strategies to make their settlements and activities adapt to forthcoming new climate conditions which, according to the evidence available, seem now unavoidable. 2.3 Evidence of Climate Change and Projected Impacts Climate change has been widely accepted as a reality of our times. According to the IPCC’s Fourth Assessment Report (AR4), in the last two centuries atmospheric concentration of carbon dioxide (CO2), methane (CH4), and nitrous oxide (N2O) have dramatically increased, at different rates, as a result of human activities, and now far exceed pre-industrial values (IPCC, 2007a). The global increases in carbon dioxide concentration are due primarily to fossil fuels and land use change (burning of forest, etc.), while those of methane and nitrous oxide are primarily due to agriculture. Carbon dioxide’s global atmospheric concentration has increased from a pre-industrial level of 280 ppm (parts per million) to a value of 379 ppm in 2005 (IPCC, 2007a). As per the evidence of ice cores, this concentration is unprecedented in at least the last 650 000 years. During this time, carbon dioxide varied between 180 ppm (during glacial times) and 300 ppm (warm interglacials). Values higher than today have occurred only millions of years ago due to massive forcing acting at a global scale, such as the immense and ‘sudden’ (from a geological perspective) release of methane-clathrates of 55 million years ago which drove CO2 concentrations up to 2000 ppm (marking the onset of an era, the Eocene period). According to most observations and climate models available today, current concentrations cannot be justified by natural causes alone without considering human influence. The annual average concentration growth rate of CO2 was larger during the last decade (1, 9 ppm) than it has been since 1960, when continuous direct atmospheric measurements begun (1, 4 ppm per year, although with year-to-year variability). Specifically, carbon dioxide annual emissions have increased from an average of 23, 5 GtCO2 (Gigatonnes of CO2) per year in the 1990s to approximately 26,4 GtCO2 per year in 2004-05 (IPCC, 2007a). The global atmospheric concentration of methane has increased from a pre-industrial value of about 715 ppb (parts per billion) to 1732 ppb in the early ‘90s and to 1774 ppb in 2005. This value largely exceeds the natural variability of the last 650 000 years, which ranges from 320 to 790 ppb; yet, growth rates have declined since the early 1990s, with total emissions being nearly constant. Finally, the global atmospheric concentration of nitrous oxide has increased at a constant growth rate since 1980 from a pre-industrial value of about 270 ppb to 319 ppb in 2005, primarily due to emissions resulting from farming activities (IPCC, 2007a). 2.3.1 Radiative Forcing The influence that a factor (such as the concentration increase of a greenhouse gas) can have on climate change is often defined in terms of its radiative forcing, which represents a measure of how the energy balance of the Earth-atmosphere system is influenced by that factor. Radiative forcing is expressed in units of Watts per square meter (Wm-2). The combined radiative forcing due to raises in CO2, CH4 and N2O concentrations between 1750 and 2005 is calculated in +2,30 Wm-2, and its rate of increase during the industrial era is unprecedented in the last 10 000 years (positive

Journal of Sustainable Development March, 2008
101
forcing causes a warming of the climate system). Other significant anthropogenic contributions to positive radiative forcing come from emissions of ozone-forming chemicals such as carbon monoxide and hydrocarbons (+0,35 Wm-2), changes in halocarbons (+0,34 Wm-2) and land cover (+0,1 Wm-2). Conversely, human modification of the reflective properties of ice and snow cover has resulted in a small negative forcing (-0,2 Wm-2), whilst emissions of aerosols (such as sulphate, organic carbon, black carbon, nitrate and dust) have overall produced a negative radiative forcing (i.e. a cooling effect) of -0,5 Wm-2 and an indirect cloud albedo negative forcing of -0,7 Wm-2. Changes in solar irradiance since 1750 have caused just a small positive forcing, estimated in approximately +0,12 Wm-2 (Figure 2) (IPCC, 2007a). As a whole, the radiative forcing from human activities is much more important for current and future climate change than the estimated forcing caused by shifts in natural processes (such as solar irradiance). Basing on the evidence of these data, Working Group I (Physical Science Basis) of the IPCC states, in its contribution to AR4, that “warming of the climate system is unequivocal, as is now evident from observations of increases in global air and ocean temperatures, widespread melting of snow and ice, and rising global average sea level” (IPCC, 2007a). An increasing rate of warming has taken place over the last 25 years, and 11 out of the last 12 years rank amongst the twelve warmest in the instrumental record of global surface temperature (averaging near-surface air temperature over land and sea surface temperature) since 1850. The last 100-year linear trend records an increase of approximately +0.74°C, while the linear trend over the last 50 years (+0,13°C per decade) is nearly twice that for the last 100 years. A warming of the climate system is evident in many different measurements (Figure 3). The total temperature increase from 1850 has been estimated in +0,76°C, with the warmest years of the series being 1998 and 2005 (IPCC, 2007a). The average atmospheric water vapour content (vapour is another powerful greenhouse factor) has increased since the ‘80s over land and oceans as well as in the upper atmosphere. Mountain glaciers and snow cover have significantly declined on average in both hemispheres, contributing to sea level rise. Also the average temperature of the global oceans has increased to depths of at least 3000m, due to the fact that the oceans have been absorbing more than 80% of the heat added to the climate system. Such warming causes seawater to expand, and thermal expansion has been so far the principal contributor of sea level rise. Actually, global sea level has risen at an average of 1,8mm per year between 1961 and 2003, with a faster rate measured in the last decade (about 3,1mm per year). The total 20th-century rise is estimated to be +0,17m (IPCC, 2007a). 2.3.2 Current and Future Scenarios In order to understand the effects of changes of such magnitude, scientists have been looking at the paleoclimatic record of climatically sensitive indicators to analyse past climate changes and refer them to potential future scenarios. These scenarios have been compared to actual observed values in order to strengthen the confidence in projections. For the next two decades, a warming of at least +0,2°C has been projected for a range of six emission scenarios developed by IPCC (Special Report on Emission Scenarios, SRES). Continued greenhouse gas emissions at or above current rates (‘business as usual’ values) would cause further warming and induce significant changes in the 21st century’s global climate system (IPCC, 2007a). For example, the best estimate for the lower scenario produced by IPCC (B1) predicts an increase of +1,8°C at the end of this century (with a likely range comprised between +1,1°C and +2,9°C), while the best estimate for the higher emission scenario (A1F1) foresees a +4,0°C increase, with a possible range getting up to +6,4°C temperature rise. The IPCC scenarios also predict the sea level to rise at the end of the 21st century by a range between 0,18m and 0,59m. It must be pointed out here that although an increase of 4°C may not sound very much this value is actually referred to a raise in global average temperature - i.e. an average taken over the whole world - which roughly corresponds to the difference in temperature between the middle of an ice age and the warm periods in between glacial episodes (estimated to diverge by 5-6°C in global average). This change is moreover expected to happen not over many thousands of years, as between glacial periods, but in a matter of less than a century. Other than creating dramatic alterations locally and globally, this sensitive warming would entail further consequences on the equilibrium of the entire climate system. Warming tends to reduce land and ocean uptake of atmospheric CO2 thus increasing the fraction of carbon emissions that remains in the atmosphere. These increasing carbon concentrations would lead to acidification of the oceans, with further reduction of CO2 ocean uptake (a typical positive feedback) and a consequent additional warming of the climate system. According to current data, this is already happening. As per the contribution of the IPCC Working Group II (Impacts, Adaptation and Vulnerability) to AR4: “evidence from all continents and most oceans shows that many natural systems are being affected by climate changes, particularly by temperature increases” (IPCC, 2007b). A global synthesis of data reveals that anthropogenic warming has already had a discernible influence on many physical and biological systems. Vulnerability of terrestrial and marine biosystems, for example, is revealed in phenomena such as earlier spring events, shifts in ranges of plant and animal species, longer growing seasons, and so forth. Warming is expected to be greater over land and at higher northern latitudes, and least over the Southern Ocean and parts of the North Atlantic. A warmer world is a wetter world because there is more evaporation and also more energy in the atmospheric circulation (due to the release of latent heat from water vapour).

Vol. 1, No. 1 Journal of Sustainable Development
102
Hot extremes, heat waves, tropical cyclones and heavy precipitations will become more frequent and intense especially at higher latitudes, whilst subtropical land regions will become even drier. Paradoxically, more floods and more droughts are expected to be recorded in the next few decades. Water security problems will intensify in many areas already subjected to droughts, fires and lack of rainfall. At the same time, the number of people at risk of flooding due to coastal erosion and sea-level rise will increase, mainly in densely-populated and low-lying areas which have relatively low adaptive capacity (IPCC 2007b). Climate change is also expected to negatively impact on the future of most developing countries as it will increase the pressure on availability and distribution of resources associated with rapid urbanisation, industrialisation and economic growth (Smith, 2007). 2.4 International Agreements In cognisance of the dramatic consequences that climate change would have on many, if not all, natural and biological systems, mitigation and adaptation measures are needed to address, respectively, long-term and short-term impacts. The variety of strategies available today is indeed very broad, ranging from technical, to educational, administrative and political measures, although the number of barriers, limits and costs to their effective implementation is still to be totally estimated and understood. Greenhouse gases emissions have grown since pre-industrial times with an increase of 70% between 1970 and 2004, the largest growth coming from the energy supply sector (+145%) (IPCC, 2007c). Amongst the measures to curb these massive impacts at a global scale, the Protocol signed in Kyoto on 11 December 1997 - and fully come into force in February 2005 - committed industrialised nations to make legally binding restrictions in emissions of the six main greenhouse gases: CO2, CH4, N2O, HFCs, PFCs and SF6. The called-for reductions varied from country to country, but overall would cut global greenhouse gases emissions by an average of about 5,2% below 1990 levels by the period 2008-12. Developing nations such as Mexico, Brazil, and the Asian ‘giants’ India and China, were however not included in the limitations established by the Protocol. Since each of the greenhouse gases has a different effect on the climate and remains for a different time in the atmosphere before being removed by natural processes, the Protocol combined them into a ‘basket’ and defined targets for cuts in individual gases translating these into ‘CO2 equivalents’, which can be added to produce one single figure (GtCO2-eq). To produce these carbon-equivalent amounts, each non-CO2 gas has been multiplied by its global warming potential factor (GWP), which reflects its impact relative to carbon dioxide (e.g. methane fosters a much stronger warming than CO2). After the official ratification of the Kyoto Protocol, a series of initiatives and regulations on climate change, energy security and sustainable development have started to be put in place in a number of countries worldwide. Yet, regardless of these efforts, the IPCC predicts that global greenhouse gases concentrations will still continue to grow over the next decades, with an increase by a range of 9,7 to 36,7 GtCO2-eq until 2030 (IPCC non-mitigation scenario). These rises in concentrations will mainly come from developing economies where the most quickly rising per capita emissions are being recorded (although total figures are still substantially lower than most developed nations) (IPCC, 2007a). The question mark now is to define the threshold of dangerous climate change and the concentration level of greenhouse gases (especially carbon dioxide) which would prevent ‘dangerous anthropogenic interference with the climate system’ (definition introduced by the United Nation Framework Convention on Climate Change); “such level should be achieved within a time-frame sufficient to allow ecosystems to adapt naturally to climate change, to ensure that food production is not threatened and to enable economic development to proceed in a sustainable way” (United Nations, 1992). Currently, IPCC refers to stabilisation targets for CO2 between 445 and 710 ppm by 2030 (IPCC 2007c), with a general agreement at 550 ppm, double the pre-industrial level. However, it is relevant to say that, considering the projected growth in emissions from developing countries, the limited targets of Kyoto are little more than irrelevant towards this target, since cuts of around 70% by the next decades would be needed to keep the atmospheric greenhouse gases concentration at double the pre-industrial levels. Yet, meeting this objective would still represent a serious challenge for human economies! Considering that when CO2 is emitted a known proportion of it is absorbed by carbon sinks (a little less than 50% over a century) while another part remains in the atmosphere, Flannery (2005) suggests that it is possible to calculate, in very rough figures, a hypothetical carbon budget to be met by mankind in the years to come. Before the Industrial Revolution, CO2 concentration in the atmosphere was around 280 ppm, which corresponds to around 585 GtCO2; currently, the figures are around 379 ppm or 790 GtCO2 (2005 data). If international agreements were to decide for a stabilisation level at double the pre-industrial times, it means that human CO2 emissions will have to be limited to around 600 GtCO2 in the next 100 years. In fact, nearly half of this carbon would remain in the atmosphere (the other part being absorbed by carbon sinks), thus raising CO2 levels up to about 1100 GtCO2, (or 550 ppm, double the pre-industrial level) by the
Journal of Sustainable Development March, 2008
103
end of the 21st century. However, this could be a really tough target for humanity, since it would imply a rate of global emissions limited to 6 GtCO2 per year over the next decades. If this figure is compared with the average 13,3 GtCO2 which have been emitted each year during the ‘90s and is also combined with the expected rise in population and the economical and industrial growth of developing countries, the challenge to be met reveals to be quite extraordinary (Flannery, 2005). Nonetheless, even if targets would be established and agreed at an international level and actions to reduce ‘business as usual’ rates of emissions were immediately put in place, climate models suggest that with concentrations of greenhouse gases and aerosols constant at year 2000 levels, still a warming of about +0,1°C per decade would have to be expected in the next fifty years due to the ‘momentum’ of the climate system, the slow response of the oceans and the time needed to remove greenhouse gases from the atmosphere (IPCC, 2007a). For this reason, it is imperative that long-term mitigation measures are coupled with short-term adaptive strategies in order to diminish the risks and projected consequences associated with climate change, as most impacts will increase in magnitude in the near future. All things considered, there is an urgent demand to fill the gap in knowledge concerned with how, methodologically, mitigation and adaptation strategies and technologies can be applied and integrated with current development standards and needs in order to keep pace with climate change. A specific reference is made here to the adoption of sustainable measures within the building sector, one of the greatest contributors to climate change. In the attempt to fill this gap, a breakthrough could paradoxically be represented by looking back at the very roots of the natural system humans are part of. 3. Mitigation and Adaptation Strategies in the Built Environment 3.1 Technology at the cutting edge We live challenging times. Following exhaustive evidence, it is possible to make reasonably confident predictions on the repercussions that climate change will have on most aspects of life on Earth, and consider their consequences on the future of human activities. The contribution of Working Group III (Mitigation of Climate Change) to the Fourth Assessment Report of the IPCC indicates some actions to be taken into account - in the short and medium term (before 2030), as in the long term (after 2030) - so as to curb human impacts and mitigate harmful consequences for the environment as a whole. These actions include primary measures to be applied within the energy and building sectors, but also on transports, industry, agriculture, forestry and waste management. By implementing these strategies, “energy efficiency options could sensibly reduce CO2 emissions with net economic and environmental benefits, improving comfort, social welfare and enhancing energy security” (IPCC, 2007c). Buildings will constitute a primary challenge in the ‘battle’ to mitigate the causes and effects of climate change, in that, primarily, we tend to spend a very large share of our time in them (often accountable to more than 90% of our day), whilst they also house the biggest part of our social, business, cultural and private activities. In addition, human settlements have undoubtedly been proven to be one of the very contributors to the current climate crisis (Steemers, 2003). Between 1970 and 1990, direct emissions (i.e. not including those due to the electricity consumed) from buildings have increased by 26%. Considering also the electricity required for the functioning of mechanical systems and services (such as heating and cooling), the total increase of direct and indirect emissions from the construction sector is much higher (75%) than direct emissions alone (IPCC, 2007c). Buildings consume enormous amounts of energy during their entire life-cycle (from construction, through operation, to dismantle) depleting non renewable resources and releasing greenhouse gases in the atmosphere. Their energy budget is accounted nowadays for more than half of worldwide consumptions (mostly coming from the burning of oil, coal and natural gas), significantly contributing - with the massive CO2 emissions they trigger - to the very causes of climate change. The development of design strategies for buildings to reduce their dependency on fossil fuels, curb their energy demands, exploit clean power sources and minimise their wastes becomes thus mandatory (also in cognisance of the uncertain future costs and actual availability of hydrocarbon-based forms of energy). The measures suggested by the IPCC define a clear path that developed economies, together with emerging countries, should take on the road to reducing the pressure of human ‘habitats’ on the environment and avoid dramatic consequences. In this context, advances in technology can clearly play a major role by making viable practical ways to use cleaner and renewable forms of energy without increasing the Earth’s carbon budget and enhancing the quality of building design from an environmental point of view (Smith, 2005 and 2007). Looking at recent advances in knowledge, it is possible to identify a range of ‘sustainable’ low-energy technologies that, in the near future, could contribute to curb the stress that mankind is imposing on the climate system (Table 1). However, in order to successfully reduce humans’ climate forcing, innovation in the production and management of

Vol. 1, No. 1 Journal of Sustainable Development
104
energy in built environments will have to be coupled with more responsive (and responsible) design strategies for both new and existing buildings. To effectively mitigate long-term impacts and adapt in the short-term to inevitable climate alterations, the challenge is thus to identify and effectively put in place the design methodologies by which sustainable technologies can be integrated with current building models in order to guarantee the continuous social and economic growth of human developments, whilst limiting emissions and effectively responding to the consequences of climate alterations which are expected in the next few decades. As a matter of fact, it is the overall design of the building - its structure, envelope, interiors, services - rather than the mere application of advanced technology per se that governs the delicate balance amongst the factors determining the conditions inside (and outside) built spaces. Hence, it is through strategic integrated design and the thorough implementation of knowledge - both existing and forthcoming - that buildings should succeed in integrating their functions and requirements with dynamic environmental forces, guaranteeing comfort for their users with an efficient use of energy and without harmful wastes and emissions. 3.2 Integrated Building Design As per the conclusions of the IPCC Fourth Assessment Report, amongst the key sectorial mitigation technologies and practices which are suggested to be applied within the design of built environments before 2030, an essential role is to be played by “integrated design” of buildings, which should be exploiting advances in technology and implement both passive and active techniques in order to provide comfort for their users and reduce their energy requirements (IPCC, 2007c). Nevertheless, in the attempt to provide simple and straightforward guidelines for the integrated and sustainable design of buildings able to mitigate their pressure on the environment, there is the obvious risk of giving recommendations which are either too specific to a particular circumstance, either too vague. Thermal performances, ventilation, light distribution, visual comfort, etc. are all variables that need to be carefully balanced according to specific requests, distinct environmental contexts, climate scenarios, and contingent technical choices. In addition, architecture is expected not only to serve the simple task of a filter against the elements, but also to provide the service functions that its users are accustomed to (Hawken et al., 1999). This raises the practical question of how to make building design progress in order to satisfy contemporary needs and, simultaneously, reduce energy consumptions and consequent environmental impacts. To meet these demands, a new integrated design process has to be developed that could potentially lead towards an innovative and progressive architecture, one that could easily and sustainably respond to current, as well as predicted, climate conditions and contextual situations. Yet, this pioneering new design process, in its most basic concept, can be paradoxically related to the very known, albeit nowadays scarcely exploited, rules of the natural world we are all part of (Luther and Altomonte, 2007). 3.2.1 Inspirations from Nature Biomimicry (from bios, life, and mimesis, to imitate) is a new science that studies Nature's best ideas and then uses the inspiration derived from natural designs and processes to solve human problems (Benyus, 1997). The “conscious emulation of life’s genius” represents - in a society that has for so many centuries been convinced of its capacity of dominating or sometimes even ‘improving’ Nature - a radically novel approach, a revolutionary era based on what we can learn from Nature rather than, as we have been doing since the Industrial Revolution, merely extracting from it. According to Benyus (1997), looking at the ecology of our planet we may realise that there is more to discover than to invent. Life, imaginative by its own nature, has probably already solved most of the problems we are facing today. The challenge for us is to understand these strategies and replicate them in our own activities. Responsive organisms have inhabited Earth well before humans, developing and perfecting their techniques of survival. Throughout a long path of trial and error - about 3,8 billion years since the first bacteria - species have responded to their environments and evolved to secure themselves nourishment and shelter, and all without burning fossil fuels or producing wastes that, in the long term, could have harmed the global ecosystem (Benyus, 1997). Contrary to most of human technological endeavours, all natural systems and structures have always been operating uniquely on the direct (and indirect) energy received from the Sun, which has interacted with the geochemistry of the Earth’s to sustain every regenerative biological system (McDonough and Braungart 2003). Photosynthesis, which literally means ‘putting together with light’, is the process by which green plants transform sunlight, CO2 and water into oxygen and nutritive sugars, rich in energetic content. Thanks to sunlight, life sustains itself, supplying all its energy needs without burning fossil fuels. Maximum economy, minimum waste and thorough integration and coordination of functions have been the strategies that Nature has exploited through millenary evolution (Forbes, 2005). Building on this ‘biomimetic’ metaphor - where the flexible cooperation of several constituents contributes to the metabolism and well-being of living creatures - the proposal here is to develop a design method based on the integration of specialised and interconnected competences.

Journal of Sustainable Development March, 2008
105
In order to do so, not only the use of cutting-edge technologies and tools has to be carefully weighed and optimised, but more integrated design strategies have to be accordingly implemented basing on climate, environment, orientation, functions and users needs. Not too long ago we were still basing our designs on a strict relationship with the natural environment, designing buildings that could be compared to living organisms in their ability to respond to climate and topography and regulate internal comfort without utilising non-renewable forms of energy. Looking at vernacular forms of architecture all around the world, we realise how those building design practices, together with the behaviour of their occupants, were uniquely based on climate and contextual characteristics. As hundreds of thousands of years ago our ancestors moved from temperate Africa to northern regions, not only they had to wear warmer clothes but they also had to develop techniques to protect them from the threats of colder climates. To allow their metabolic mechanism to remain unaffected, humans had to evolve in both their physical features as in their techniques for creating protecting structures. This process resulted in the production of an extraordinary diversity of dwellings, built of local materials and shaped to suit local climates, landscapes and societies; exempla of supreme responsiveness that we should now try to imitate. The Igloos of the Inuit, the Tepee of the Indians and several other ‘primitive’ construction forms testify how climate can dictate the forms of architecture, dampening harsh extremes by uniquely using materials and techniques available locally. Neither building type had a negative impact on the environment, whilst identifying the culture of the people that built them (Roaf, 2005). The challenge we are facing today therefore consists in moving from a design approach that exploits technological development for its own sake to one that has environmental and human objectives. A new design paradigm must be implemented so as to conceive buildings able to ensure comfort and health for their inhabitants without impacting negatively on the environment. This paradigm should be developed disregarding established discipline boundaries and transferring knowledge between seemingly distant scientific fields, which include architecture, physics, engineering, climatology, physiology, psychology and biosciences. 3.2.2 Sustainable Design Framework Basing on this awareness, a theoretical design ‘framework’ can be defined founded upon a number of strategies and criteria that should be systematically evaluated and developed within the building design process for mitigating the impacts of built structures on the environment. Previous work by the author (Altomonte and Luther, 2006) proposed a new integrated building design process which is methodologically structured upon the measured and iterative analysis of the following interconnected building categories and principles: 1) Site & Climate Analysis; comprising the analysis of site, exposure, climate, orientation, topographical factors, local constraints and the availability of natural resources and ecologically sustainable forms of energy considered in relation to the duration and intensity of their use (genius loci, Olgyay, 1963). 2) Flexible & Adaptive Structural Systems; investigating the characteristics of the structure, its permanence or temporariness, its integration with other building components such as interior, envelope or mechanical systems, the fixing to the footings or founding materials and the desired aesthetic effect. 3) Renewable & Environmental Building Materials; concerning the efficiency of a material or a product, size available, standardization, structural adequacy, complexity, appropriateness, cost, labour involved, plantation origin, method of growth (especially for natural materials), embodied energy (i.e. total energy required to create, harvest, transport, use, maintain and dispose a product), recycled and reused content (deconstruction, adaptability), toxicity level (wastes, pollution), etc. 4) Modular Building Systems; exploring the construction and assembling methods of building components in order for the various single elements to be eventually isolated and or substituted without adverse complication to the whole, thus allowing for shorter times of construction, reduced energy consumption and wastes, maintenance and/or replacements, flexibility and interchangeability. 5) Building Envelope Systems; investigating the role and the design of components, devices and systems acting as an interface, a dynamic filter between internal and external environments in order to control the energy flows that, directly or indirectly, enter (or leave) an enclosed volume, including consideration of orientation, seasonal variations, surrounding environment, function of the building, user requirements and façade typology. 6) Renewable & Non-conventional Energy Systems; integrating in built structures sources of energy that can be exploited without reducing or exhausting their point of origin and which could be collected directly on site or in centralized areas with little or no ecological impact. 7) Innovative Heating, Ventilation & Air Conditioning Systems; developing strategies to provide acceptable interior conditions for the occupants in terms of thermo-hygrometric and air quality comfort, exploiting mechanically-regulated, hybrid, or, preferably, totally passive techniques. 8) Water Collection & Storage Systems; analysing the methods, system and strategies to collect, store, distribute, use,

Vol. 1, No. 1 Journal of Sustainable Development
106
recycle and re-use water, a vital element for life and a fundamental resource in all inhabited buildings. The proposed building categories and principles identify only partially the infinite opportunities offered by design and technical decisions to improve the sustainability of built environments. Indeed, within the proposed integrated design process each system contributes and interacts with the others rather than behaving as an individual entity, therefore enhancing energy efficiency and mitigating impacts on the environment whilst optimizing the use of the accessible resources and contributing to the well-being of the building occupants. The objective of this sustainable design framework is thus not to define a sequential recipe to be applied identically in every contextual situation, but rather to set up a holistic and iterative methodology where the potential implications of each building category and principle - and therefore, of each building component - is carefully considered in relation to the whole and measured against climate, site and a range of other factors, which have to include, obviously, also social, economic and cultural values. 3.3 Structural and Behavioural Adaptation The thorough application of advanced technologies within an integrated design framework could prove to be effective in reducing consumptions and emissions particularly within the building sector. However, considering the momentum of climate change already built up, long-term mitigation actions will necessarily need to be coupled with short-term adaptive strategies that could warranty the continuous sustainable development of human civilisations. In the last decade, the United Framework Convention on Climate Change (UNFCCC) has been supporting, promoting, and directly funding a number of initiatives to identify the priority actions required for responding to urgent needs with regard to adaptation to climate change. These initiatives have concentrated especially on least developed countries which are more vulnerable to climate alterations and less able to adapt to their consequences. Amongst these, the Special Climate Change Fund (SCFF), established in 2001 to finance projects relating to adaptation to climate alterations, the Least Developed Countries Fund (LDCF), created to support the preparation and implementation of National Adaptation Programmes of Action (NAPAs) in more vulnerable economies, the Adaptation Fund, introduced to finance concrete adaptation projects in developing countries that are parties to the Kyoto Protocol. These initiatives lay down an agenda for the path that should be taken globally. Adapting to predicted drastic climate shifts will require efforts and changes in every sector of human development and at every level, from the personal sphere up to the setting up of international agreements. Adaptation responses will necessarily include changes in policies (e.g. risk management), technologies (e.g. protecting measures, advanced weather forecasts, flexible building techniques, etc.), infrastructures (e.g. design specifications and safety requirements of transport networks), and management (e.g. energy use, distribution of resources, water consumption, etc.). As far as buildings are concerned, older built structures may present characteristics that make them more resilient to global warming (e.g. high thermal mass, tall windows and ceilings, etc.), although they will be likely to perform poorly by modern standards and requirements. However, in the context of climate change scenarios typically spanning for a time scale that goes beyond a century, the true challenge will be represented by the development of adaptive strategies for the design of new constructions, and this will assume a vast relevance especially in developing countries, where massive barriers - technological, financial, and institutional/political - are yet to be fully overcome (Steemers, 2003). In order to meet this further challenge, the natural system could again offer us the inspiration needed to implement adaptive building techniques and apply them to human built structures so as to accommodate changing conditions such as modified distribution of cloud density and cover, extremes in temperatures, humidity variations, pressure distributions, alterations in rainfall, changes in wind patterns and intensities, soils stability, etc. As a matter of fact, the implementation in buildings of an ‘adaptive talent’ simply extends ideas and principles consistent with the propositions of Charles Darwin, who held that the capacity to survive depends on the ability to adapt to a changing environment. Looking at natural systems, we may realise that all living organisms develop adaptive mechanisms to help them to endure and prosper against shifting climatic conditions or contextual alterations. Some of their adaptive responses are deemed structural, i.e. physical features of an organism like the bill on a bird or the fur on a bear; other adaptations could be said to be behavioural, with the term meaning the things organisms do to survive. Species that can adapt to changes in the environment flourish and thrive; species that can not may soon die out (Wigginton and Harris, 2002). 3.3.1 Structural Adaptation Strategies Buildings are often assimilated to complex systemic organisms where all the structural components (including load-bearing elements, envelopes, services and internal partitions, such as floors and walls) are part of a whole, interconnected, architectural design. The implementation of structural adaptation in buildings can thus be intended as the application of flexible and adaptive design methodologies whereas the responsiveness to variation in climatic conditions can be tolerated and distributed due to an interlinked cooperation amongst various building constituents. As far as supporting systems are concerned, there is nowadays an increasing interest in the subject of structurally
Journal of Sustainable Development March, 2008
107
adaptive construction techniques, although these are often primarily driven by market forces and letting potential of the building rather than by a ‘sustainable’ response to climate change. A flexible design may endow the construction primarily with some degree of elasticity concerning the arrangement, functionality and subdivision of internal spaces, thus making the built organism more resilient to variations in environmental factors (and consequent requirements) with a minimum demand for energy. Within the previously proposed sustainable design framework, these concerns could be certainly addressed with the implementation of flexible and adaptive structural systems and the adoption of a modular building design, strategies which could give a significant contribution to increase the resilience of the building towards climate alterations and changes in functions and occupants needs. As reported by Steemers (2003), an additional interesting avenue of research in this field is focused on the ‘diversified lifetime’ of building components, a design methodology which proposes that built structures are basically composed by distinct parts, each with a different design life. Fernandez (2002) describes the number of technologies needed for a flexible structural design by saying: “design for disassembly, separation technologies, materials reclamation and recycling, loose-fit detailing, lightly-treading foundations and other techniques, will contribute to a suite of technologies necessary for building to change over time”. Although not explicitly formulated to provide specific answers to adapt to climate change, the concept of ‘diversified lifetime’ presents an interesting approach towards the design and construction of buildings which could structurally respond to a variation in external climate conditions and adjust to a set of new requirements by their users. Also in terms of the design of building envelopes, and their integration with building services, an adaptive design methodology (e.g. façade type, system integration, etc.), carefully weighed with the implementation of cutting-edge technologies, can result in significant steps forward in the challenge of adaptation to changing climate conditions, other than ‘simply’ contributing to reduce energy needs and CO2 emissions and maximizing the well-being of building occupants (Altomonte, 2007). In this context, the adaptive capacity of the building envelope can be supported by a number of devices and components which, as previously illustrated, are currently being developed in order, for example, to: 1) Shield internal spaces from changes in solar radiation and minimise thermal losses (solar control / low-emissivity coatings, multiple glazed units with gas fillings, fixed or movable external shading devices, vacuum glazing, transparent insulating materials, aerogels, etc.); 2) Maximise daylight transmission and distribution, whilst reducing glare and contrast (manually- or automatically-controlled blind systems, reflective lamellae, prismatic screens, holographic optical elements, light shelves, laser cut panels, anidolic ceilings, etc.); 3) Exploit extremes of environmental factors to generate energy (e.g. semi-transparent PV cells, building integrated wind turbines, heat recovery systems, etc.); 4) Normalise peaks in temperature and moderate day-night and seasonal thermal variations (e.g. exposed thermal mass, vaulted ceilings, phase change materials, vacuum insulated panels, etc.); 5) Tolerate changes in structural loads (e.g. advanced structural adhesives, flexible bonds, thermal expansion joints, thermal ageing resistance, structural glazing tapes, etc.); 6) Adaptively change the optical properties of the façade according to internal and external stimuli (chromogenic glass), both passively (e.g. photochromic, thermochromic and thermotropic glass) and/or actively (e.g. electrochromic glazing, gasochromic devices, Liquid Crystal Displays, Suspended Particles Devices, etc.); 7) Automatically control artificial lighting levels and HVAC (Heating, Ventilation & Air Conditioning) systems according to continuously-monitored physical parameters (Building Management Systems and IT sensors) and user needs (e.g. adaptive biomimetic control systems) (Guillermin and Morel, 2002). Further to this, innovative façade typologies are being investigated to achieve pressure balance in the building envelope and successfully accommodate condensation, weathering and increased wind forces, whilst advanced control strategies are being researched and tested to regulate the rates of air exchanges between internal and external environments, especially in terms of ventilation and heat transfers. These systems and control strategies fall, in general, under three categories: (1) Passive systems: single or multiple skin façades where air (and heat) exchanges between inside and outside are passively dictated by natural ventilation principles or by convective movements due to buoyancy and direct or indirect solar gains (e.g. single skin façades, cavity systems, naturally-ventilated double skin façades, etc.); (2) Active systems: automated strategies dictate the rate of air movement and ventilation, often in synchronisation with internal HVAC building services schedules (e.g. active walls, mechanically-ventilated double skin façades, pressure equalisation systems, etc.); (3) Interactive systems: the strategies that regulate air movements and heat distribution exploit essentially passive

Vol. 1, No. 1 Journal of Sustainable Development
108
principles, although these can be overridden by active controls that, in case of extreme climate conditions, operate in integration with mechanical building services (e.g. interactive walls, façades with built-in fans, extractors, heat exchangers, etc.). 3.3.2 Behavioural Adaptation Strategies Other than just developing methodologies to structurally adapt the design of buildings to expected climate alterations, another important adaptive contribution that the designer should take into account to successfully respond to changing conditions can be represented by the occupants’ responsibility, which can strongly help to create resilient built environments that are both comfortable and sustainable. As a matter of fact, it is interesting to point out that, amongst the actions proposed by the Working Group III of the IPCC to mitigate human impacts and adapt to climate change, particular relevance is actually given to “changes in lifestyle and behaviour patterns” (IPCC, 2007c). In this context, a specific role has to be assumed by education and training programmes which can help to overcome non-technological barriers to the acceptance and application of adaptive strategies and measures - in the household as on the workplace - contributing to changes in culture, habits, choices (e.g. appliances) and application of technologies which could result in considerable increase in responsive capacities of buildings (and their occupants) and, ultimately, also in sensitive reductions in CO2 emissions. As previously mentioned, throughout their evolution humans have been able to respond, with their intelligence and behaviour, even to the most extreme of the climates, showing evidence of tremendous adaptive skills. Specifically, Steemers (2003) suggests that there are broadly three categories in which behavioural adaptations of the inhabitants can directly influence the design and the operation of buildings, adjusting their requirements to dynamic environmental conditions: 1) Spatial, which is referred to the capacity of designing, arranging and utilising internal spaces in accordance with the expected environmental conditions that characterise the various parts of a building. For example, in hot-arid climates, occupant spatial patterns - i.e. the relocation of activities inside the house according to the seasons and the time of the day - have guaranteed for centuries a significant improvement of occupant comfort without the use of any energy-consuming system; 2) Personal, i.e. the capacity of building occupants to adapt their clothing (also on the workplace), modify their activity levels, change their posture, have access to hot/cold beverages, or use verandas, external courtyards, etc. according to external weather parameters (temperature, solar radiation, winds, etc.), individual preferences and/or contextual climate-driven demands (e.g. working schedules); 3) Control, which is the possibility given to the building users to have at least some level of direct control over the devices that influence their immediate environment (e.g. blinds, lighting systems, etc.), so as to maximise the adaptability of the building according to external factors and occupants’ requests. This is specifically important in modern commercial buildings, which are often fitted with ‘intelligent’ building services and automated management systems. Although the capacity of overriding (temporarily) the automatic control could (seldom, actually) partially jeopardise optimum energy performances, this strategy has been proven to be beneficial in terms of psychological well-being and users satisfaction. Obviously, a number of other mitigation and adaptation strategies and techniques could be applied to various other sectors of human activity (e.g. transport, energy, industry, waste management, etc.) with potential impacts on both reduction of emissions and responsiveness to climate change. However, discussion of these is beyond the scope of this paper. In summary, it is very likely that the portfolio of technologies and know-how needed to make built environments minimize their impact on the ecosystem and adapt to shifting climatic conditions is already with us, as long as integrated design and behavioural strategies are put in place for their implementation. Making the most of ancient, existing and forthcoming knowledge (also featuring hybridisations between seemingly distant disciplinary fields), the design of buildings has to progress in response to environmental and users demands, re-establishing the fundamental connection between humans and the natural system that has sustained us so far, cradling and nourishing us, making all of our (sometimes insane) actions possible. A sustainable future is possible, but there is still a long way to go. 4. Concluding Remarks The age of ‘climate crisis’ is upon us. After two centuries of Industrial Revolution, we are only now realising that the world we have artificially built is strictly interconnected with the real, biological one. The work of the IPCC, unanimously applauded and crowned by the 2007 Nobel Peace Prize, has managed to establish a global awareness to the climate problem. If the vital information contained in its Fourth Assessment Report is correctly received and endorsed by policy makers, market actors, technical practitioners (including those which operate within the built environment sector), and the general community, an array of national and international synergies could be

Journal of Sustainable Development March, 2008
109
stimulated and put in place, providing the solid foundation for a sustainable future. At the time of writing this paper, the United Nation Climate Change Conference in Indonesia (13th Conference of Parties to the UNFCCC), involving thousands of delegates from 192 nations, laid out the Bali Action Plan, a “roadmap” for negotiations set to produce, by 2009, a global climate treaty for the period post-2012, when the first phase of the Kyoto Protocol will expire. Although the Action Plan failed to establish binding targets in terms of emission reductions, for the first time representative from both developed and developing nations recognised that “deep cuts in global emissions” are required and decided to launch a process leading to (a) a shared vision for a “long-term global goal for emission reductions”; (b) enhanced national and international action on mitigation of climate change including “measurable, reportable and verifiable nationally appropriate mitigation commitments or actions” and reduction in deforestation and forest degradation in developing countries; (c) the implementation of adaptation initiatives, particularly in poorer nations; (d) enhanced actions and cooperation on technological development, diffusion and transfer; (e) the provision of financial resources and investment “to support action on mitigation and adaptation” (UNFCCC, 2007). In support of the results that the Bali Roadmap and the subsequent process will hopefully achieve in responding to the threats of climate change, the suggestions made here are that, other than just exploiting technological progress, we can study, learn and be inspired by adaptive natural systems to produce a more sustainable and integrated building design that could contribute to mitigate and adapt to current and predicted alterations. The questions may be: why haven’t we always been working with something that was compatible with Nature? Wouldn’t that have been more easy and avoided a lot of problems? Ironically, it always takes dramatic circumstances to become aware of the need to assume responsibility of our actions and adopt all the possible strategies to wisely utilise our skills, efficiently manage our resources, and achieve well-being into our ‘habitats’ in harmony with a dynamic natural environment. By following a mitigation and adaptation path in the battle to keep pace with shifts in climate, we could do more than simply guaranteeing a fertile future for ourselves and for the next generations, as the well-known definition of ‘sustainable development’ requires. As Janine Benyus (1997) has put it: “if we succeed, evolution will not have produced this giant [human] brain in vain”. References Alfsen, K.H., Fuglestvedt, J., Seip, H.M., Skodvin, T. (2000). Climate Change - Scientific background and process. CICERO (Centre for International Climate and Environmental Research) Report, 2000:1. Altomonte, S. (2005). L’involucro architettonico come interfaccia dinamica (The building envelope as a dynamic interface). Florence: Alinea Editrice (in Italian). Altomonte, S., Luther, M.B. (2006). A Roadmap to Renewable Adaptive Recyclable Environmental (R.A.R.E.) Architecture. 23rd International Conference on Passive and Low Energy Architecture (PLEA). Geneva, Switzerland. Altomonte, S. (2007). Adaptive Building Envelope Design. International Conference on Solar Energy and Buildings (CISBAT). Lausanne, Switzerland. Benyus, J. M. (1997). Biomimicry – Innovation inspired by Nature. New York: Perennial. Fernandez, J. (2002). Diversified lifetimes: orchestrated obsolescence for intelligent change. MIT Boston: Thresholds. Flannery, T. (2005). The weather makers - The history & future impact of climate change. Melbourne: Text Publishing. Forbes, P. (2005). The Gecko’s foot - How scientists are taking a leaf from Nature’s book. London: Harper Perennial. Guillemin, A., Morel, N. (2002). An Energy-Efficient Controller for Shading Devices Self-Adapting to the User Wishes. Building and Environment, 37 (11), 1091-1097. Hawken, P., Lovins, A., Lovins, L.H. (1999). Natural capitalism: Creating the next industrial revolution. London: Earthscan Publications. IPCC (2007a). Climate Change 2007: The Physical Science Basis. Contribution of Working Group I to the Fourth Assessment Report of the Intergovernmental Panel on Climate Change [S. Solomon, D. Qin, M. Manning, Z. Chen, M. Marquis, K.B. Averyt, M. Tignor and H.L. Miller (Eds.)]. Cambridge: Cambridge University Press. IPCC (2007b). Climate Change 2007: Impacts, Adaptation and Vulnerability. Contribution of Working Group II to the Fourth Assessment Report of the Intergovernmental Panel on Climate Change [M.L. Parry, O.F. Canziani, J.P. Palutikof, P.J. van der Linden and C.E. Hanson (Eds.)]. Cambridge: Cambridge University Press. IPCC (2007c). Climate Change 2007: Mitigation. Contribution of Working Group III to the Fourth Assessment Report of the Intergovernmental Panel on Climate Change [B. Metz, O.R. Davidson, P.R. Bosch, R. Dave and L.A. Meyer (Eds.)]. Cambridge: Cambridge University Press. Luther, M.B., Altomonte, S. (2007). Natural and environmentally responsive building envelopes. 37th International

Vol. 1, No. 1 Journal of Sustainable Development
110
Conference on Environmental Systems (SAE/ICES). Chicago, USA. McDonough, W., Braungart, M., (2002). Cradle to cradle - Remaking the way we make things. New York: North Point. Olgyay, V. (1963). Design with climate: bioclimatic approach to architectural regionalism: Princeton: Princeton University Press. Roaf, S., et al. (2005). Adapting buildings and cities for climate change - A 21st century survival guide. Oxford: Elsevier Architectural Press. Ruddiman, W. (2003). The anthropogenic greenhouse era began thousands of years ago. Climate Change, 61:261-93. Smith, P.F. (2005). Architecture in a climate of change - A guide to sustainable design (2nd ed.). Oxford: Elsevier Architectural Press. Smith, P.F. (2007). Sustainability at the cutting edge - Emerging technologies for low energy buildings (2nd ed.). Oxford: Elsevier Architectural Press. Steemers, K. (2003). Towards a research agenda for adapting to climate change. Building Research and Information, 31(3–4), 291-301. United Nations. (1992). United Nations Framework Convention on Climate Change. [Online] Available: http://unfccc.int/resource/docs/convkp/conveng.pdf (December 5, 2007). UNFCCC (2007). Bali Action Plan. [Online] Available: http://unfccc.int/files/meetings/cop_13/ application/pdf/cp_bali_act_p.pdf (December 15, 2007). Wigginton, M., Harris, J. (2002). Intelligent Skins. Oxford: Architectural Press. Notes Note 1. According to Ruddiman (2003), there is a distinctive factor that could have influenced the warm and stable period of the last 10 000 years and differentiated it from the previous interglacials, all characterised by unsteady cooling followed by the sudden appearance of another Ice Age: this factor is represented by the settled presence of humans. In particular, charting the levels of methane and CO2 bubbles in ice sheets, some anomalies may suggest that the beginning of agriculture (with their CH4 emissions) could have strongly influenced the greenhouse gases concentration in the atmosphere well before the 18th century. Table 1. Technologies for mitigation and adaptation
The Table summarises various cutting-edge sustainable techniques available for large-scale energy generation and a

Journal of Sustainable Development March, 2008
111
number of low-energy technologies to be integrated in the design of buildings
Figure 1. Schematic of the Earth’s orbital changes ‘T’ denotes changes in the tilt of the Earth’s axis (which takes 42 000 to run its course), ‘E’ denotes changes in the eccentricity of the orbit (whose shape changes on a 100 000-year cycle), and ‘P’ denotes precession, i.e. changes in the direction of the axial tilt (22 000-year cycle)
(Source: IPCC, 2007a)
Figure 2. Summary of the main components of the radiative forcing of climate change The Figure illustrates and provides an estimate of the radiative forcing on the natural system due to natural causes and anthropogenic activities
(Source: adapted from IPCC, 2007a)

Vol. 1, No. 1 Journal of Sustainable Development
112
Figure 3. Variations in global average surface temperature relative to the period 1961-1990
The Figure presents the variations in global average surface temperature between 1850 and 2005 relative to corresponding averages for the period 1961-1990 (circles show yearly variability)
(Source: adapted from IPCC, 2007a)

Journal of Sustainable Development March, 2008
113
Developing Small and Medium Enterprises (SMEs) in a Transitional
Economy-from Theory to Practice: An Operational Model for
Vietnamese SMEs Thanh Hai Nguyen
Department of Management, Monash University, Australia E-mail: [email protected]
Quamrul Alam Department of Management, Monash University, Australia
E-mail: [email protected] Daniel Prajogo
Department of Management, Monash University, Australia E-mail: [email protected]
Abstract This paper examines the factors contributing to the growth of SMEs by using a conceptual framework derived from the concept of resource; cluster; networking; and institutional theories. The Vietnamese experience suggests that institutional weakness and lack of proper coordination between policy making, implementation and market conditions has made the support regime ineffective. Literature review indicates that Vietnamese government has mainly focused on increase the number of SMEs rather than improving the performance of SMEs and strengthening the business competitiveness. This must be facilitated by the critical entrepreneurial role of the state. Furthermore, this paper argues that no adopted model from one country to another country would be suitable without consideration. It is vital to address the issues of external business environment, market environment, and social culture. The paper then recommends that the evolving relationship between the state’s entrepreneurial role and market factors are parts of the success picture. More importantly, support policies may be invalidated by the unbalance relationship between the state and market. Unfortunately, such important relationship has not thoroughly been identified by the Vietnamese government. Keywords: SMEs, Transitional economies, Support policies 1. Introduction SMEs in Asian developing countries, Central and Eastern European countries require strong aids from the governments in finance, technology, logistic, training, human resource development and entrepreneurship development. In Vietnam, the development of SMEs not only needs for the above mentioned policies but also have the need for stronger supports from the state in legal framework, information, credit, export promotion, tax, land, institutional and banking reform (US/Viet/95/004). Furthermore, a recent study that was conducted by Ha and Swierczek (2003) has found that the performance of SMEs in Vietnam was positively related to entrepreneurial culture. Thus, it seems that informal institutional development (in this case is the development of entrepreneurial culture) is as important as formal institutional development to the growth of SMEs in Vietnam. This paper examines how key physical, managerial, technological, strategic, cultural and organizational factors influence the business operation process of SMEs in Vietnam. The resource based theory, clustering, networking, and institutional theories provide an analytical framework to explain how a well-defined support regime can provide policy support, resource, and institutional infrastructure for the growth of SMEs. 2. Literature review 2.1 SMEs Growth Pattern SMEs growth depends on many factors that vary from country to country. McIntyre (2002) argues that a synergistic relationship between the SMEs and the larger enterprise sector is a critical factor. Havie (2002) observes that in China,

Vol. 1, No. 1 Journal of Sustainable Development
114
the development of the Township and Village Enterprises (TVEs) is an important aspect for the growth of SMEs. McIntyre (2002) also recommends synergistic relationship and the process of urbanization, based on both horizontal and vertical linkages such as industrial district and cluster (cited in Julien 1993, and You 1995), and the external economies of agglomeration and scope that played a large role in the post-World War II successes of Northern Italy. Regnier (1994) examines the overall experience of the four Asian newly industrialized countries (Singapore, Korea, Hong Kong and Taiwan) as examples for the need to promote the SMEs sector and also to encourage linkages between large and the small-scale enterprises. Empirical evidences in some developing Asian countries also support this trend: large firms (particularly state enterprises) sponsored and promoted local SMEs in Indonesia (Hill, 2002); the Department of Industrial Promotion (DIP) in Thailand implemented programs for promotion of linkages between SMEs and large firms, and develops SMEs clustering and networking (Brimble, Oldfield and Monsakul, 2002). Various theories have explained that SMEs’ growth from different perspectives. However, in order for a SME to develop its core competency, adequate resource (both internal and external) is an importance prerequisite. 2.2 Resource Based Theory Rindova and Fombrun (1999) argue that resources, capabilities and core competencies are essential for a firm’s competitive advantage. Therefore, adequate resource support and policies to create capability are critical for SMEs’ growth as they are small in size and need assistance. Resource based theory provides a framework to explain how business can identify suitable measures to overcome growth obstacles, have better access to technology resources, manpower resources, financial resources, natural, and infrastructure, and access to the market. According to Barney (1991) and Grant (1991), the four types of tangible resources are financial, organizational, physical, and technological. The three types of intangible resources are human, innovation and reputational resources. An example is the TVEs model in China, where TVEs rely on the state sector as a source of capital, materials, equipment, specialised personnel, technology, subcontracting arrangement and sales revenues (Harvie, 2002). 2.3 Approaches to develop a firm’s resource 2.3.1 Clustering approach Porter (1998a) proposes that industrial cluster policies can be a growth strategy for a firm and cluster is a geographic concentration of interconnected companies and institutions in a particular field. This argument is strongly supported by Enright and Robert (2001), Dijk and Sverrisson (2003), and Nadvi’s (1995) since SMEs can receive external economic advantages (economies of scale and scope) if clustering and networking offer a potential growth path for SMEs. Many Central and East European countries have used clustering approach for assisting the development of SMEs such as Poland, Hungary, Slovenia, the Czech Republic, Slovakia, Ukraine, Lithuania, Estonia and Latvia, (Ionescu, 2003). Examples of cluster theory in practice in East Asia and Latin America include surgical instrument clusters in Sialkot, Pakistan; electronic clusters in Penang, Malaysia; knitwear in Tiruppur, India; software in Bangalore, India; leather shoes in the Sinos Valley, Brazil (Abonyi, 2003).. Tambunan (2005) also suggests that experiences in many European countries show that clustering approach can be a powerful means for overcoming resource constraints that SMEs in transitional economies lack. 2.3.2 Networking approach ‘Firms should not be seen in isolation but as being connected in business systems’ (Ritter, Wilkinson, and Johnston, 2003, p.175). Lechner and Dowling (2000) define networks as the relationship of individual with other individuals, or relations between organizations that can have various functions.. Therefore, network relationships can be considered as an important intangible resource to support for SMEs who do not have sufficient resources since it help SMEs to develop the links with suppliers, distributors and customers, or utilization of social contacts, including acquaintances, friends, family and kin. Networking approach is applied in Moldavia, the Ukraine and Belarus (Smallbone and Welter, 2001); Thailand (Brimble, Oldfield and Monsakul 2002); Zhejiang, China (Krug and Hendrischke, 2003); Taiwan (Ngui, 2002) and Korea (Gregory, 2002). In addition, Nadvi (1995) suggests that both local associations and government support bodies facilitated the development of clusters and networks of SMEs in Brazil, Mexico, India and South Korea. 2.3.3 The application of Institutional theory North (1990) emphasizes that market economies convert resources - land, labour, energy, and capital - into manufacture services and goods. To make this conversion a success, institutions must also help and guide those transformations in predictable ways. Kartz (1995) observes from the economic histories of both newer and mature markets based in Asia, North America and Western Europe that private enterprises cannot emerge and prosper in an imperfect market without a conducive policy environment and institutional support system. Murrell (2003) also states that at the beginning of economic transition, institutional support is vital. Institutions must be designed so that they are able to work in the

Journal of Sustainable Development March, 2008
115
environment in which they are to be implemented. The success of China indicates that transitional institutions, formed by incremental change, can be helpful. In China, there was much enthusiasm for accepting new measures to improve the economic situation, but under the condition of not moving too far from the existing system. 2.4 Business environment and supporting infrastructure SMEs need to identify key success factors such as finance, technology transfer, taxation, market promotion, export opportunities, and research and development strategies that determine the conditions for them to overcome difficulties in both their internal and external environments (Petri, 1995; Assaf, 1998).Wattanapruttipaisan (2002) proposes that competitiveness can be leveraged by factors other than location and natural resources such as: on-going access to global information and knowledge (market standards, marketing opportunities and technology); participation in clusters of firms, networks with suppliers, producers or complementary product distributors and consumers; and on-going learning and improvements in efficiency and flexibility. This network relationship created a new information flow and knowledge base for SMEs that could be the model for the efficiency of resource distribution to SMEs by numerous policy packages from the state and the market. 3. From theory to practice 3.1 SMEs in transitional economies 3.1.2 Transitional Economy and Market Reform Transitional countries in Central and Eastern Europe (CEE) applied the rapid change “shock therapy” to put the economy on “automatic–pilot.” As a result the market determined supply, demand, prices, and economic transformation. Government sectors played no significant role in this economic system. Contrary to the CEE approach, the Asian “gradualism” approach was an incremental process. Although private enterprises and the free market were seen to be the driving forces for this process, the public sector still played an active role in supporting and moderating market-based reform and private sector development at a macroeconomic level (Katz, 1995). It is vital that a centrally planned economy moves to market-oriented economy through the reduction of government ownership and control in business. However, a small or weak public sector may also hinder the growth of the private sector, as experienced by CEE countries when private enterprises operating in a framework of market-determined prices continued after the involvement of the public sector were eradicated. In contrast, the public sector continues to play key role in strengthening and sustaining the development of a dynamic private enterprise sector and efficient market (Katz, 1995) in Asian countries such as Japan, South Korea, and Taiwan and even in the United States, Germany and the United Kingdom. 3.1.3 Policy Regime in Central and Eastern Europe (CEE) Support policies for SMEs vary from country to country and from developed countries to less developed countries due to differences in business contexts, culture and the level of industrialization. Since East European countries are now EU members, there are various EU programmes for SMEs that cover a range of needs. These include vocational training and education, infrastructure projects, individual and information technology development (Konopielko and Bell, 1997). In addition, SMEs in these countries also receive direct support from local authorities and the government. Poland and Bulgaria are a case in point where SMEs are provided with training and advisory services, management, market information, credit access, exports promotions and the introduction of high-tech production. In the initial stage of transition, these countries suffered some setbacks when SMEs operated in imperfect markets that lacked institutional support. The CEE experience suggests that business support infrastructure, financial support, legal and institutional framework, cluster and network relationships play vital role for business development. 3.1.4 Policy Regime in Asian Industrialised Countries SME development is becoming increasingly important to many industrialized countries such as Korea, Taiwan, Singapore, and Australia. Singaporean government identified four key problem areas of SMEs: access to technology, manpower, finance, and market (Lee, and Tan, 2002). In 1998, the Korean government employed a number of policies to foster the growth of SMEs and their involvement in the global economy. This was done by ensuring access to finance, supporting human resource development program, developing technology and scientific achievements so that business can develop extensive relationship with global market (Gregory, 2002). According to Ngui (2002), SMEs in Taiwan have the following features: network-based industrial systems; minimum efficiency sizes and entry barriers and; low agency and transaction costs. In Australia, special attention is given to key issues affecting the development of SMEs. These are access to finance, the importance of culture/networking in the conduct of business, access to technology and the adoption of information technology, and progress made in regard to human resource development (Nguyen, Gregory, Harvie, Lee, and Ngui, 2002). The most common key features among Korea, Taiwan, Singapore, and Australia are support for technology and financial access, manpower access, and

Vol. 1, No. 1 Journal of Sustainable Development
116
networking. The Korean government paid attention to developing ties between large firms and SMEs and the fact that large and small electronic firms’ network clustered in Seoul, Korea is a good lesson for other countries to study. 3.1.5 Policy Regime in East Asian Developing Countries Harvie (2002) identifies the case of TVE in China as providing important lessons for other economies in transition. To support private sector, China has reformed its financial system, tax and revenue system, enhanced technical innovation system, improved legal protection of property rights, devised education and training program, and opened up more sectors for private investment and competition. The Malaysian government has supported SMEs by providing financial and credit assistance, assisting entrepreneurial development, improving business management and human resource management, allowing consultancy and marketing services to grow, introducing technical and vocational programs, offering location and infrastructure facilities and providing fiscal incentives (Abdullah, 2002). In Thailand, the government introduced financial incentive package, technology development program, provision of benchmarks (in technology, marketing, management, and governance), policies were devised so that SMEs can integrate effectively into various industry value chains or clusters and become involved in more supportive networks such as academic institutions, government agencies and other firms in related and supportive industries (Brimble, Oldfield and Monsakul, 2002). This network relationship created new information flow and knowledge base for SMEs. China, Malaysia and Thailand benefited from these policies reform, network relationship and the new support infrastructure. The Indonesia’s experience suggests that neglected cluster linkage to markets was one of the reasons for which SMEs failure. That is, economic advantages can only be achieved if the cluster has a well-developed network both internally and externally (Tambunan, 2005). Katz (1995) argues that the transitional countries of Asia - Laos, Mongolia, Myanmar, and Vietnam - enjoy a significant economic advantage since they can learn from the experiences of other transitional countries in Asian and Central and Eastern European countries with less political change and step by step incremental processes. These countries enjoy cheap labor and strategic locations with a reasonably large market in Asia and the Pacific. However, they do not enjoy a high level of industrialization. As a result, the change to a market economy and the integration into a global market requires a gradual approach to change. The development of SMEs in Vietnam requires a well-designed policy package, infrastructure development program and effective institutional framework. 3.2 The Vietnamese policies experience Recognising the important role that private sector can play in the transition process, Vietnamese government has made great efforts to encourage the development of the privately owned SMEs. Due to rapid change in the current international economy, further restructuring efforts and strategic policies for support are required for the development of SMEs. The development of SMEs through supporting infrastructure policies, legal and institutional frameworks were of special importance. According to GSO (2004), the number of enterprises is large but size of enterprises is small and they are spread over the country with backwards technology. The figures show that about 48% of firms have lower than 10 employees, 32.9% of firms with 10 to less than 50 employees, and 14.1% of firms with 50 to less than 300 employees. Most of them are poor of resources (unskilled labour, small capital, and land, lack of supporting service on technology, legislation and information). Approximately 50.6% employees are not trained; 86.2% of firms have less than 550,000 USD; on average, a private firm uses only 0.17 ha of land while a states enterprise uses 1.61 ha; furthermore, there are about 48% of surveyed respondents informed that they met difficulties in gaining access to information; significantly, 72% informed that they had backwards technology. In accessing to credit, 49% of capital is capital of owner equity; only 4% is provided by government budget; 9% from other sources and 38% is from credit capital. Among this 38% of credit capital, state enterprises occupy 56.4%, of which 63.4% is concessionaire credit capital of state. According to Ho, Do, and Chu (2002), about 53% of the surveyed SMEs owners indicate that credit access is the most critical factor to private SMEs. Although credit capital is too low, more than half of the credits are reserved for SOEs. This clearly depicts the fact that SMEs in Vietnam are currently facing significant difficulties in accessing to formal credit and they have to rely heavily on informal credit source (see figure1 at the appendix). 4. An operational framework model for supporting SMEs The above examples suggest that resource based theory; clustering, networking approach and application of institutional theory are not separated. The main argument is that, in gaining better access and utilizing resources, firms need to cluster in suitable locations, build strategic alliances or network in a cluster of firms. This is in order to attain the critical mass needed to create support infrastructure. These theories also emphasize the role of supporting institutions as agents for facilitating the development of firms’ cluster and network, improving technology flow, and knowledge is vital. And the context of economic transition in Vietnam would require a conceptual framework in order to examine how SMEs
Journal of Sustainable Development March, 2008
117
can pool the resources together and effectively use of them, seeking supports from government and institutions (both formal and informal) to sustain the SMEs and to create a favourable business environment for them to growth. A study on the effectiveness of supporting policies is crucial to identify the difficulties that SMEs have been facing in Vietnam. The resource base, clustering, networking, and institutional theories referred to by Petri (1995), Assaf (1998), Brimble, Oldfield and Monsakul (2002), Harvie (2002), Tambunan (2005), Ha and Swierczek (2003), and Gibb (1996) provide an understanding of the factors supporting SME development in developing countries. These authors infer that a well-defined support regime from the state can coordinate with existing market factors to provide policy support, external resources, and institutional infrastructure for the growth of SMEs (Please refer to the appendix for the conceptual model). 5. Discussion and conclusion The policies of the government have not been strong enough to direct the firms for their investment. This has led to the situation that in many provinces and cities there are thousand of firms engaging in only one economic sector but they are not key sectors and do not affect much to local economy. The Vietnamese government seems to focus on increasing the number of SMEs (quantity) rather than improving their performance (quality). According to GSO (2004), the contribution by the private sector to GDP did not grow much between 1995 and 2001 (8.6% and 8.8% respectively). This would indicate that private sector still not plays a key role in driving the economy and although private sector are encouraged to be widely developed, the state sector are the firm foundation of the national multi sector economy. Additionally, the efficiency of doing business in private sectors is still not high. The ratio of profit per capital is only 2.3% in private firms. By 2002, the number of established enterprises rose to 63,000, but only 68% were actual real operating firms. This is consistent with the survival rate during 1996-2002 of private firms in the country economic report of Koko and Tingvall (2005) which is only 61.44%. Basing on the report of the GSO (2004), it seems that SMEs are in the embarrassing situation of finding supporting service on technology and information. NORAD (2003), and James and Chuong (1997), reveal the irrationality of tax system and in which the way it is administered; bureaucracy and red tape; imperfect market regulation, property rights and competition has restrained SMEs development. It seems that the support policies for SMEs in Vietnam are inconsistent and SMEs in the public sector are treated favourably. While private firms are being seen as a key driving force of the economy in many regional countries and CEE countries, and private firms in Vietnam are allowed and encouraged to develop, State owned firms still be considered to play a key role in the Vietnamese transitional economy. No specific strategies have been developed to establish links between SMEs in both public and private sector. No clear policies guideline has been designed to support SMEs to work in partnership with large business as suppliers, buyers or manufacturers. In addition, there is no clear policy direction on how businesses in related and supporting industries can support each other by transferring knowledge, infrastructure, and resources, which are critically. When formal institutions (e.g., laws and regulations) are weak, informal institutions (e.g., interpersonal ties) may play important roles in facilitating economic exchange and therefore assert a more considerable influence on the performance of firms (Peng & Heath, 1996). The Vietnam experience could be the case in point where SMEs have to rely heavily on informal credit as source of capital for overcoming resource constraints. SMEs have tended to be viewed negatively by labourers and the public as a high-risk policy that would generate insecurity in the job market. As a result, it is very tough for SMEs to attract qualified labour and access adequate support such as credit, land, and other external resources. Negative social perceptions towards the roles of SMEs would have a significant influence on the development of this private business sector and discourage SMEs from business development in many ways. Although the current legal regimes do ensure fairness of competition between the public and private business sectors, so-called “unwritten laws” of discrimination against SMEs still exist strongly in society. Operating in such unfavourable environment, together with defective supporting institutional developments, inadequate regulatory frameworks and the SMEs’ poor internal resources, it is obvious that SMEs are struggling to survive and develop. The paper is based on the concepts of resource based and tries to suggest that clustering, networking, and institutional approaches can be a powerful vehicle for overcoming resource constraints of SMEs. The operational model incorporates experiences from transitional economies in CEE countries and South East Asian countries with the Tanaka Sakai-Takada framework model that designed specifically for Vietnam’s context. The policies framework is also an extension of the four-part policy framework proposed by Sakai and Takada (2000) since their model has not successfully addressed some of the critical support policies for the growth of SMEs in Vietnam. It has reviewed a number of concepts to apply to the new operational framework for examining the critical support policies for developing SMEs in Vietnam. The operational policies framework is essential for the following reasons: Supporting policies for the development of SMEs may differ from country to country. A successful model in one country may be inappropriate if it is applied in another due to different political, legal, historical, economic, social, cultural, and resource conditions; although numerous studies have been conducted on SMEs in many transitional economies, few are in the context of Vietnam. This paper hopes to fill the gap in existing literature by identifying critical support policies for SMEs in Vietnam.

Vol. 1, No. 1 Journal of Sustainable Development
118
Hence, it could be concluded that an overall strategic policy is critical for supporting SMEs in Vietnam. The policy should be focus on how to support SMEs effectively rather than how to increase the number of SMEs in Vietnam. It is important to highlight that, a holistic approach is needed for supporting SMEs in Vietnam. It is not only what policies the government is pursuing but how they can utilize the existing market condition which is important. It would be misleading if the government just focus on the role of the state as other transitional countries did and do not take into account the importance of existing market factors and business environments. However, this is not to ignore the critical entrepreneurial role of the state in facilitating the evolving relationship between the State and Market. Balancing such evolving relationship between the state and market will dictate the direction for implication of policies to support SMEs. In regard to future research, this conceptual model addresses a number of issues that needed to be examined in order to identify factors contributing to the growth of SMEs in Vietnam. This could be the limitation of this conceptual model and needed to be addressed in both exploratory and explanatory study stages of the research. Acknowledgements Our special thanks to the 2 anonymous reviewers of the Australian and New Zealand Academy of Management Conference (ANZAM) 20th for their valuable comments and suggestions to revise this paper. The paper is an extended version of the refereed paper which was presented at the 20th ANZAM conference 2006.
References
Abdullah, M. ( 2002). An overview of the Macroeconomic Contribution of SMEs in Malaysia. In: Harvie, C., and Lee, B.C. (Eds), The role of SMEs in National Economies in East Asia. Singapore: Edward Elgar. Assaf G.B. (1998). Enterprise restructuring in central and Eastern Europe (CEE) and the former Soviet Union: The roles of technical assistance. In Cook C, Kirkpatrick C., and Nixson F. (Eds), Privatization, Enterprise development and Economic reform: Experiences of developing and transitional economies, USA: Edwards Elgar. Abonyi, G. (2003). Challenges of Industrial Restructuring in a Globalizing World: Implications for Smalland Mediumscale Enterprises (SMEs) in Asia. ISEA working paper: Visiting researcher Series No.3. Institute of Southeast Asian Studies. Barney, J. (1991). Firm resources and sustained competitive advantage. Journal of Management, 17 (1): pp 99120. Brimble, P., Oldfield, D., and Monsakul, M. (2002). Policies for SME recovery in Thailand. In: Harvie, C., and Lee, B.C. (Eds), The role of SMEs in National Economies in East Asia. Singapore: Edward Elgar. Dijk, M.P.V., and Sverrisson, A.(2003). Enterprises cluster in developing countries: mechanisms of transition and stagnation. Entrepreneurship & regional development 15 (3): pp 183206. Enright, M.J., and Roberts, B. (2001). Regional clustering in Australia. Australian journal of management, August 2001, 26 (2): p 65. Grant, R.M. (1991). The resource based theory of competitive advantage: Implications for strategy formulation. California Management Review 33 (3): pp 114. Gregory, G.(2002). Promoting SMEs in Korea: Government response to the Asian Financial Crisis. In: Harvie, C., and Lee, B.C. (Eds), The role of SMEs in National Economies in East Asia. Singapore: Edward Elgar. GSO (2004). The real situation of enterprises through the results of surveys conducted in 2001, 2002, 2003, General Statistic Office. Hanoi, Vietnam: Statistic Publishing House. Harvie, C. (2002). China’s SME: Their evolution and future prospects in an evolving market economy. In Harvie, C. and Lee, B.C. (Eds), The role of SMEs in National Economies in East Asia. Singapore: Edward Elgar. Ha, T.T., and Swierczek, F.W. (2003). Motivation, entrepreneurship and the performance of SMEs in Vietnam. Journal of Enterprising Culture, 11(3): pp 4768. Hill, H. (2002). Old policy challenges for a new administration: SMEs in Indonesia. In Harvie, C., and Lee, B.C., (Eds.), The role of SMEs in National Economies in East Asia. Singapore: Edward Elgar. Ionescu, D. (2003). Cluster development in transition countries: a tool for small business support’ CEI Workshop on Clusters, OECD, [Online] Available: http://www.oecd.org/dataoecd/54/27/17940932.pdf. Julien, PierreAndre (1993). Small business as a research subject: Some reflections on knowledge or Small business and its effects of economic theory. Small business economics 5: pp 157166. James R. and Chuong S.T. (1997). The emerging private sector and the industrialization of Vietnam. Private sector discussions No.1. Hanoi: The Mekong project development facility.
Journal of Sustainable Development March, 2008
119
Katz, S. (1995). Some key development issues for transitional economiesEast and West. In: Naya, S.F., and Tan, J.L.H. (Eds), Asian transitional economies: challenges and prospects for reform and transformation. Singapore: Institute of Southeast Asian Studies. Konopielko, L., and Bell, J. (1997). Reinventing aid for SMEs in Eastern Europe: Lessons from the implementation of the Struder Programme. Policy review section. Koko, A., and Tingvall, P.G. (2005). Regional development and government support to SMEs in Vietnam Country economic report 2005:5, Sida. Ho, X.P., Do, M.T., and Chu, M.P., (2002). Financial policies to support the growth of SMEs. Hanoi, Vietnam: Institute of Finance, Financial Publishing House. NORAD (2003). Study on private sector development and prospects for Norwegian Trade and Investment interests in Vietnam. Norwegian Agency for Development Cooperation, NORAD report 6/2003. Mori, J. (2005). Development of supporting industries for Vietnam’s industrialization: increasing positive vertical externalities through collaborative training. Master of Arts in Law and Diplomacy Thesis, The Fletcher School, Tufts University, USA. Riedel, J., and Tran, S.C. (1997). The Emerging private sector and the industrialization of Vietnam. Private sector discussion No.1. Hanoi, Vietnam: Mekong Project Development Facility (MPDF). Rindova, V.P. and Fombrun, C.J. (1999). Constructing competitive advantage: The role of firm-constituent interactions. Strategic Management Journal, 20 (8): pp 691-710. Regnier, P. (1994). Dynamics of small enterprise development: State versus market in the Asian newly industrializing economies. In Cook, C., Kirkpatrick, C., and Nixson, F., (Eds.), Privatization, Enterprise development and Economic reform: Experiences of developing and transitional economies. USA: Edwards Elgar US/VIE/95/004 (1999). Assistance to Small and Medium Industrial Enterprises (SMEs) in Vietnam. Report of the Mid-term Evaluation Mission, United Nations Industrial Development Organization (Unido). Taussig, M. ( 2005 ). Domestic companies in Vietnam: Challenges for development of Vietnam’s most important SMEs. William Davidson Institute Policy Brief Working Paper Series, Michigan. Krug, B., and Hendrischke, H. (2003). China Incorporated: Property Rights, Networks, and the Emergence of a Private Business Sector in China. Managerial Finance, 29 (12): pp 32-42. Lechner, C., and Dowling, M. (2000). The evolution of industrial districts and regional networks: The case of the biotechnology region Munich/Martinsried. Journal of Management and governance, Special issue, 99 (3): pp 309-338. Lee, B.C., and Tan, WL (2002). Small and medium enterprises in Singapore and the new economy. In: Harvie, C., and Lee, B.C., (Eds), The role of SMEs in National Economies in East Asia. Singapore: Edward Elgar. McIntyre, R.J. (2002). Small enterprises in transition economies: Causal puzzles and policies relevant research. Economic science of contemporary Russia 5, 1 (2002): pp 121-141 (English version). Murrell, P. (2003). Institutions and firms in Transition Economies. In: Menard, C., and Shirley, M. (Eds), Handbook of new institutional economies. Kluwer Academic Press. Nadvi, K. (1995). Industrial Clusters and Networks: Case studies of SME Growth and Innovation. Unido small medium programme. [Online] Available: http://www.unido.org/userfiles/PuffK/Nadvi.pdf. Ngui, M (2002) ‘Government policies and programs for SMEs in Taiwan’ In: Harvie, C, and Lee, BC (eds) The role of SMEs in National Economies in East Asia. Singapore: Edward Elgar. Nguyen, J., Gregory, G.D., Harvie, C., Lee, B.C., and Ngui, M. (2002). Small and medium sized enterprises in Australian. In Harvie, C., and Lee, B.C. (Eds), The role of SMEs in National Economies in East Asia. Singapore: Edward Elgar. North, D. (1990). Institutions, Institutional Change and Economic Performance. England: Cambridge University Press. Peng, M.W., and Heath, P. (1996). The growth of the firm in planned economies in transition: Institutions, organizations, and strategic choice. Academy of Management Review, 21 (2): pp 492-528. Portel, M. E. (1998b). On competition. Havard Business School Press. Porter, M.E. (1998a). Cluster and the new economics of competition. Havard business review, Nov-Dec 1998 (1): p77. Petri P.A. (1995). The lesson of East Asian Success: A primer for transitional economies. In Naya S.F., and Tan J.L.H. (Eds), Asian transitional economies: challenges and prospects for reform and transformation, Singapore: Institute of Southeast Asian Studies.

Vol. 1, No. 1 Journal of Sustainable Development
120
Ritter, T., Wilkinson, I.F., and Johnston, W.J. (2004). Managing in complex business networks. Industrial marketing management 33: pp 175-183. Sakai, H., and Takada, N. (2000). Developing small and medium-scale enterprises in Vietnam. NRI papers No.13 September, Nomura Research Institute. Smallbone, D., and Welter, F. (2001). The Distinctiveness of Entrepreneurship in transitional Economies. Small Business Economics, 16: pp 249-262. Tambunan, T. (2005). Promoting Small and Medium Enterprises with a clustering approach: A policy experience from Indonesia. Journal of Small Business Management 43 (2): pp 138-154. You, Jong Il (1995). Small firms in economic theory. Cambridge Journal of Economics 19 (3): pp 441-462.
Wattanapruttipaisan T. (2002). Promoting SME development: Some issues and suggestion for policy consideration. [Online] Available: http://unpan1.un.org/intradoc/groups/public/documents/APCITY/UNPAN011410.pdf.
Figure 1. Credit accessibility of SMEs
(Source: Ho, Do, and Chu 2002)
05
1015
20253035404550
Credit from commercial banks Credit from stated banks Credit from friends and relat ive
Series1

Journal of Sustainable Development March, 2008
121
Figure 2. Conceptual model
Low level of state intervention, high role of market conditions
High level of the State’s intervention + facilitating of existing market conditions
Low level of the State intervention
State support in CEE countries (Poland,
Bulgaria)
State support in Asia-Pacific (Korea, Singapore, Taiwan,
Australia)
State support in South East Asia (China,
Thailand, Indonesia, Malaysia)
State support in
Vietnam
The Resource based theory
1. Internal resource - Training - Management - Consulting 2. External resource - Finance/credit access
- Export promotion - Technology - Tax -Market information 3. Approaches - Industrial clustering - Networking - Institutional support 4. Role of the state - Very weak in the initial time of transition
- Lack focus on institutional development
- “Shock therapy” approach
5. Market conditions - Strong market factors
- Developed support institutions
1. Internal resource - Training - Management - Consulting 2. External resource- Finance/credit access
- Export promotion - Technology - Tax - Market information3. Approaches - Industrial clustering- Networking - Institutional support 4. Role of the state - Important - Focus on institutional development, clustering and networking
-“Market” approach 5. Market conditions - Very strong - Strong developed support institutions
1. Internal resource - Training - Management - Consulting 2. External resource- Finance/credit access
- Export promotion - Technology - Tax - Market information - Legal and property right (China)
- Location (Malaysia)
3. Approaches - Industrial clustering- Networking - Institutional support 4. Role of the state - Very important - Focus on institutional development, clustering and networking
- “Gradualism” approach
5. Market conditions - Weak - Weak support institutions
1. Internal resource- Training - Management - Consulting 2. External resource - Finance/credit access - Export promotion - Technology - Tax - Market information - Legal & property right - Location/land - Business environment - Administrative reform 3. Approaches - Industrial clustering - Networking - Institutional support 4. Entrepreneurial role of the state & market conditions - Extremely vital - Strongly focus on institutional development, clustering and networking, entrepreneurial culture, public attitude towards SMEs, utilizing market factors
- “Gradualism”approach 5. Market conditions - Extreme weak - Extreme weak support institutions - Balance between State and Market relationship is important