journal of pharmacreations farhat_5… · offered best controlled release along with floating lag...
TRANSCRIPT

Farhat, et al / Journal of Pharmacreations Vol-2(2) 2015 [50-61]
50
Pharmacreations|Vol.2 | Issue 2 | April-June-2015
Journal Home page: www.pharmacreations.com
Research article Open Access
Formulation and characterization of lafutidine floating matrix tablets
employing three grades of HPMC polymers
Farhat Fatima1, Prakash Katakam
2*
1Department of Biotechnology, Acharya Nagarjuna University, Guntur, Andhra Pradesh, India
2Department of Pharmaceutics, Priyadarshini Institute of Pharmaceutical Education and Research,
Guntur, Andhra Pradesh, India
*Corresponding author: Prakash Katakam E-mail: [email protected]
ABSTRACT
Aim: The aim of the study was to formulate and evaluate lafutidine floating matrix tablets employing three
grades of HPMC i.e., K4M, HPMC K15M and HPMC K100M.
Materials and methods: Controlled release floating matrix tablets were prepared using wet granulation method
employing drug and polymers in four ratios (1:0.5; 1:1; 1:5 and 1:2). Characterization was done on prepared
formulations, such as drug-excipient interaction, in vitro buyoncy, swelling, in vitro dissolution and accelerated
stability studies.
Results: FTIR, DSC and XRD studies on the formulations showed no interaction of lafutidine with the
polymers employed in the study. Most of the tablet formulations showed values within the official limit upon
pre and post- compression evaluation. The type of polymer affected the drug release rate and the mechanism.
Polymer swelling was crucial in determining the drug release rate flotation. A lesser FLT could be achieved by
increasing the concentration and increasing the viscosity grade of the polymer. The optimized formulation (LS2)
offered best controlled release along with floating lag time of 1 min 10 sec and total floating time of >14 h.
Good stability was observed for 3 months during accelerated stability studies.
Conclusion: The optimized formulation LS2 employing lafutidine HPMC K4M in the ratio of 1:1 showed
sufficient release for prolonged period, the dose could be reduced and the possible incomplete absorption of the
drug could be avoided.
KEY WORDS: HPMC, K4M, K15M, K100M, Gastroretentive, Lafutidine, Matrix tablets, In vitro studies.
INTRODUCTION
Grater therapeutic effect of the drug substances can
be achieved by prolonging the gastric retention of a
delivery system. This is more applicable to the
drugs those are absorbed in stomach region [1]
and
the drugs that are less soluble or are degraded by
the alkaline pH may benefit from the gastric
retention. [2,3]
In addition, for local and sustained
drug delivery to the stomach and the proximal
small intestine to treat certain conditions,
prolonging gastric retention of the therapeutic
moiety may offer numerous advantages including
improved bioavailability, therapeutic efficacy and
possible reduction of the dose size [4,5].
Gastroretentive drug delivery systems of lafutidine
were reported for HPMC K4M [6]
, HPMC K15M [7,8]
, sodium alginate [9]
, HPMC K4M [10]
, xanthan
gum and karaya gum [11]
. However in the present
study we tried to reduce the concentration of gas
generating agent by introducing microcrystalline
cellulose thereby minimizing the adverse effects of
gas generating agents.
Journal of Pharmacreations

Farhat, et al / Journal of Pharmacreations Vol-2(2) 2015 [50-61]
51
MATERIALS AND METHODS
Lafutidine was gift sample from Ajanta Pharma
Ltd, Mumbai, India. Methocel (HPMC grades of
K4M, K15M and K100M) were obtained from
ColorCon Asia Pvt. Ltd, Goa, India. HCl,
Microcrystalline cellulose, Citric acid, Sodium
bicarbonate, talc and magnesium stearate were
purchased from S.D.Fine Chemicals, Mumbai,
India. All other ingredients used were of analytical
grade.
SPECTRAL (FTIR) STUDIES
The FTIR spectra (400 to 4000 cm-1
and resolution
of 4 cm-1
) of the pure lafutidine and polymers were
measured by preparing dispersion in dry KBr using
Shimadzu FTIR 8400S (Perkin-Elmer 1615 Series
or Bruker, Germany). The transmission minima
(absorption maxima) in the spectra obtained with
these polymers were compared. The presence of
additional peaks corresponding to the functional
groups was noted [12]
.
THERMOGRAPHIC (DSC) STUDIES
The heat characteristics of lafutidine and polymers
were analyzed using a Shimadzu DSC-60
(Shimadzu, Kyoto, Japan). The behavior under heat
was studied by heating the samples (2 mg) in an
aluminium pan from 25 to 300°C at a heating rate
of 10°C/min under a flow of nitrogen at 10
cm3/min using an empty pan as a point of
reference.
CRYSTALLOGRAPHIC (XRD) STUDIES
Powder XRD was conducted using an automatic
diffractometry (XRD 7000, Schimadzu, Kyoto,
Japan) with a voltage of 40 kV and a current of 30
mA. The sweep measurements of 2θ angle were
carried out at a scanning rate of 4o min
-1 over a
range of 10 to 80o. The results were interpreted
using the computer program (XRD 7000,
Schimadzu, Kyoto, Japan). The highest peak of
diffraction was measured for crystallinity of the
sample.
PRE-COMPRESSION EVALUATION OF
POWDER BLENDS
The drug and polymer powders blends of different
combinations as per table no were evaluated for
bulk density, tapped density, Carr’s index,
Hausner’s ratio and angle of repose using standard
procedures [13]
. The obtained values after testing are
compared with the standard values and inferences
were drawn.
PREPARATION OF FLOATING TABLETS
USING HPMC POLYMERS[14]
In the present investigation, wet granulation
technique was employed to prepare tablets of
HPMC of different viscosity grades (K4M, 4,000
cps; K15M, 15,000 cps; and 1,00,000 cps) at
different drug to polymer ratios as per the
composition given in Tables 1. Microcrystalline
cellulose was used as diluent along with sodium
bicarbonate and citric acid as gas generating
agents. PVP K30 dissolved in sufficient isoprpyl
alcohol was used as granulating agent (binder).
Magnesium stearate was used as lubricant and talc
as a glidant. Punch of 8 mm size with
corresponding dies were used for tablet
compression the tablets employing Cadmach Press.
The granules were prepared by wet granulation
method using PVP K30 in sufficient isopropyl
alcohol. The wet mass was prepared by taking the
calculated amount of mentioned ingredients as per
above composition tables. The ingredients were
mixed to make a dough and passed through #20
standard sieve and dried at 60 oC in hot air oven for
1 h. The dried granules were sifted through #22
sieve and lubricated with mixture of magnesium
stearate and talc (pre-sifted through sieve #80). The
mixed granules were compressed in tablet press
using suitable punches as stated above.

Farhat, et al / Journal of Pharmacreations Vol-2(2) 2015 [50-61]
52
Table 1: Formulation of lafutidine floating tablets prepared using different grades of HPMC
Ingredients(mg) LS1 LS2 LS3 LS4 LS5 LS6 LS7 LS8 LS9 LS10 LS11 LS12
Lafutidine 20 20 20 20 20 20 20 20 20 20 20 20
HPMC K4M 10 20 30 40 - - - - - - - -
HPMC K15M - - - - 10 20 30 40
HPMC K100M - - - - - - - - 10 20 30 40
Microcrystalline cellulose 119 109 99 89 119 109 99 89 119 109 99 89
Sodium bicarbonate 20 20 20 20 20 20 20 20 20 20 20 20
Citric acid 15 15 15 15 15 15 15 15 15 15 15 15
PVP K30 10 10 10 10 10 10 10 10 10 10 10 10
Talc 2 2 2 2 2 2 2 2 2 2 2 2
Magnesium stearate 4 4 4 4 4 4 4 4 4 4 4 4
Total weight 200 200 200 200 200 200 200 200 200 200 200 200
IN VITRO BUOYANCY STUDIES
The time taken for tablet to emerge on surface of
medium is called the floating lag time (FLT) and
duration of time the dosage form constantly remain
on surface of medium is called the total floating
time (TFT). The in vitro buoyancy was determined
by floating lag time, as per the method described by
Rosa et al.[15]
. The tablets were placed in a 250 mL
beaker containing 100 mL of 0.1N HCl. The time
required for the tablet to rise to the surface and
float was determined as floating lag time. The
duration of time the dosage form constantly
remained on the surface of medium was determined
as the total floating time.
SWELLING STUDIES [11]
Formulated tablets were weighed individually (W0)
and placed separately in a petri dish containing 50
mL of 0.1N HCl. The Petri dishes were placed in
an incubator maintained at 37±0.5oC. The tablets
were removed from the petri dish, at predefined
intervals of time and reweighed (Wt), and the %
swelling index was calculated using the following
formula
% WU = (Wt-Wo/Wo) × 100
Where: WU – Water uptake, Wt – Weight of tablet
at time t, Wo – Weight of tablet before immersion.
IN VITRO DISSOLUTION STUDIES [15]
The release of lafutidine from the prepared floating
tablets was studied using USP-Type II paddle
apparatus (Electrolab TDT 08L, dissolution tester,
U.S.P.). Drug release profile was carried out in 900
mL of 0.1N HCl maintained at 37±0.5°C
temperature at 100 rpm. 5 mL of samples were
withdrawn at regular time intervals up to 12 h. The
samples were replaced by equivalent volume of
dissolution medium and were filtered through 0.45
µm Whatman filter paper. The samples were
suitably diluted and analyzed at 279 nm, using
(Shimadzu UV 1700) UV spectrophotometer.
To analyze the mechanism of release and release
rate kinetics of the dosage form, the data obtained
were fitted into Zero order, First order, Higuchi and
Koresmeyer-Peppas equations. Based on the
obtained R2 values, the best-fit model was selected
[16-18].
Anomalous diffusion or non-fickian diffusion
refers to a combination of both diffusion and
erosion controlled rate release. The Korsmeyer
Peppa’s equation is used to deteremine whether the
drug release mechanism is Fickian or non-
Fickian[19]
.
STABILITY STUDIES OF OPTIMIZED
FLOATING MATRIX TABLETS [20, 21]
The optimized floating matrix tablets were
separated in to two groups. Each group of
formulations were placed separately in stability
chamber which is maintained at 40±5oC/75% RH
for three months and the formulations from each
group were subjected to dissolution studies and %
drug release was calculated. The drug content,
floating lag-time and drug dissolution profile of the
exposed samples were determined.
Student t-test is used to compare the means of two
related (paired) samples analyzed by reference and
test methods. It gives answer to the correctness of

Farhat, et al / Journal of Pharmacreations Vol-2(2) 2015 [50-61]
53
the null hypothesis with certain confidence such as
95% or 99%. If the number of pairs (n) are small
than 30, the condition of normality of x is required
or atleast the normality of the difference (di). This
test, also known as Welch's t-test, is used only
when the two population variances are not assumed
to be equal (the two sample sizes may or may not
be equal) and hence must be estimated separately.
The t statistic to test whether the population means
are different is calculated as:
Where, 1x = mean of first set of values, 2x = mean
of second set of values, S1= standard deviation of
first set of values, S2= standard deviation of second
set of values, n1= total number of values in first set
and n2= total number of values in second set.
Significance of difference for floating lag time and
assay values of the optimized formulation before
and after accelerated stability testing was calculated
based on Student’s t-test.
The similarity factor (f2) given by SUPAC
guidelines for a modified release dosage form was
used as a basis to compare dissolution profile. The
dissolution profiles are considered to be similar
when f2 is between 50 and 100 [21]
. The dissolution
profiles of products were compared using f2 which
is calculated from the following formula,
Where, n is the dissolution time and Rj and Tj are
the reference and test dissolution values at time t.
The similarity factor (f2) was calculated for
comparison of the dissolution profile before and
after stability studies in the present study [22]
.
RESULTS AND DISCUSSION
DRUG-POLYMER COMPATIBILITY
STUDIES
The development of a successful formulation
depends only on a suitable selection of excipients.
Hence the physical states of pure lafutidine and the
polymers (HPMC grades of K4M, K15M and
K100M) individually and the combination of drug
and polymers used for the preparation of
formulations were studied by FTIR spectroscopy to
know the drug-polymer compatibility. The results
are shown in Fig. 1.
FTIR spectra of pure lafutidine showed
characteristic sharp peaks of alkene stretching (=C–
H and CH2) vibration at 3323.07–2941.33 cm−1
and
alkane stretching (–CH3, –CH2 and –CH) vibration
at 2863.82 cm−1
. Also exhibited C=O stretch at
1688.13 cm−1
due to saturated ketone and C=O–NH
stretching at 1648.61 cm−1
. A selective stretching
vibration at 1562.10 cm−1
and 1524.46 cm−1
for
primary and secondary amine was also observed.
For functional groups like S=O stretch and –C–S
stretch showed vibrations at 1031.83 cm−1
and
727.16 cm−1
respectively. Most of the peaks are
observed in the spectral region 748.83–
881.38 cm−1
, 623.17–727.16 cm−1
, and 817.70–
1031.83 cm−1
are due to stretching (bending =C–H
and =CH2), –CH deformation and –CH bending.
The same bands were also found in the spectra of
the formulations of lafutidien using various
polymers, which indicated that there was no drug-
polymer interaction.
DIFFERENTIAL SCANNING
CALORIMETRY (DSC)
The DSC thermograms of pure drug, polymer and
the composition of drug –polymers were recorded
in DSC analyzer at a heating rate of 20oC per min
from 0 to 350oC in the nitrogen environment. The
DSC thermograms showed well defined peaks for
lafutidine in individual and combination with
polymers. The DSC thermograms showed well
defined peaks for lafutidine in individual and
combination with polymers. Drug showed one
sharp endothermic peak occurred at 112°C.
Formulations of lafutidine using HPMC K4M,
HPMC K15M and HPMC K100M showed similar
endothermic peaks at 102, 103 and 106°C
respectively which indicated that there was no
significant interaction between the drug and
polymers employed in the study. The obtained DSC
thermograms are shown in the Fig. 2.

Farhat, et al / Journal of Pharmacreations Vol-2(2) 2015 [50-61]
54
Fig.1: FTIR spectra of LAF (A) and
formulations of HPMC K4M (B), HPMC K15M
(C) and HPMC K100M (D)
Thus, from IR spectra studies and DSC
thermograms we can draw a conclusion that the
drug remains in its normal form without
undergoing any interaction with the polymers
evidenced by no additional peaks in FTIR and
DSC.
Fig. 2: DSC thermograms of lafutidine (A) and
formulations of HPMC K4M (B), HPMC K15M
(C) and HPMC K100M (D)
CRYSTALLOGRAPHY (X-RAY
DIFFRACTION, XRD)
XRD analysis was carried out to confirm formation
of a new solid state which provides the information
regarding the degree of crystanality and crystal
lattice arrangements of the compound. The non
crystalline portion simply scatters the X-ray beam
to give continuous background, while the
crystalline portion causes diffraction lines that are
not continuous. The diffractogram of lafutidine
exhibited a series of intense peaks at 10.23, 12.82,
13.12, 15.14, 17.81, 18.12, 19.24, 21.52, 22.34,
23.45, 24.44, 25.62, 27.12, 28.22 and 31.88 which
were indicative of crystalline nature of lafutidine.
As compared to lafutidine and different
formulations using polymers employed in the study
showed insignificant diffraction pattern of peaks
and their intensity which indicated that there was
no variation in the crystanality of formulations as
compared to the lafutidine alone.
PRE-COMPRESSION FLOW PROPERTIES
OF POWDER BLEND
The drug and polymer powders blends of different
combinations were evaluated for bulk density,
tapped density, Carr’s index, Hausner’s ratio and
angle of repose using standard procedures [13]
and
consistency in data obtained as indicated by their
standard deviation values shown in Table 2.
Bulk density and tapped density
Bulk density and tapped densities showed good
packing ability of the powdered blend for
compression process. Bulk and tapped densities of
different formulations were calculated. The results
of bulk density ranged from 0.346±0.87 to
0.490±0.32 gm/cm3 and tapped density from
0.400±0.67 to 0.582±0.32 gm/cm3.
Carr’s index (Compressibility index)
Carr’s index of the powder of all formulations
ranged from 8.54% to 21.55%. Formulation LS8
showed lowest Carr’s index indicating good and
passable compressibility.
Haunsner’s ratio
Hausner’s ratio ranged between 1.14 and 1.20. The
powder blend of formulation LS5 showed lowest
Hausner’s ratio indicating good flow. Blend of LS8
had an excellent angle of flow as compared to those
of other formulations
Angle of repose
All the powder blends showed excellent flow
ability as expressed in terms of angle of repose

Farhat, et al / Journal of Pharmacreations Vol-2(2) 2015 [50-61]
55
whose values were found in the range 22.39±0.45o
to 29.21±1.21o. The powder blend of LS5 had the
lowest value among all formulations composition
showing excellent flow. As per pharmacopoeial
standards ranged in (25–30o)
[23].
The obtained values of all the derived properties of
powder combinations were within the limits,
indicating that the powder blends possessed the
required flow property for tablet compression.
Table 2: Pre-compression flow properties of powder blends
Formulation
Code
Bulk density
(gm/cm3)
Tapped density
(gm/cm3)
Carr’s index
(%)
Hausner’s
ratio
Angle of repose
(°)±SD
LS1 0.490±0.32 0.582±0.32 15.81 1.19 27.92±0.32
LS2 0.472±0.54 0.568±0.54 16.90 1.20 29.21±0.21
LS3 0.425±0.67 0.512±0.21 16.99 1.20 27.42±0.12
LS4 0.420±0.89 0.535±0.23 21.50 1.27 26.11±0.33
LS5 0.440±0.90 0.495±0.34 11.11 1.13 22.29±0.24
LS6 0.452±0.21 0.512±0.54 11.72 1.13 28.37±0.54
LS7 0.406±0.32 0.500±0.65 18.80 1.23 25.25±0.76
LS8 0.439±0.34 0.480±0.76 08.54 1.09 24.69±0.65
LS9 0.375±0.45 0.478±0.88 21.55 1.27 22.39±0.45
LS10 0.386±0.56 0.465±0.89 16.99 1.20 28.99±0.34
LS11 0.394±0.67 0.450±0.09 12.44 1.14 29.10±0.23
LS12 0.346±0.87 0.400±0.67 13.50 1.16 28.00±0.12
Table 3: Post-compression physicochemical evaluation of lafutidine floating tablets
Formulation
code
Hardness
(kg/cm2)
Weight variation
(mg)
Friability
(%) Drug content (%) FLT (min)
TFT
(h)
LS1 4.1±0.02 201.12±0.24 0.20±0.010 100.14±0.13 1.08 >14
LS2 4.2±0.00 200.05±0.08 0.34±0.088 100.78±0.05 1.10 >14
LS3 4.2±0.025 210.55±0.28 0.36±0.078 100.78±0.15 1.12 >14
LS4 4.2±0.092 199.93±0.34 0.42±0.084 99.56±0.11 1.23 >14
LS5 4.3±0.022 199.03±0.91 0.28±0.011 99.99±0.10 1.18 >14
LS6 4.4±0.00 202.33±0.31 0.65±0.064 99.16±0.12 1.16 >14
LS7 4.5±0.025 200.55±0.28 0.55±0.098 99.78±0.15 1.18 >14
LS8 4.3±0.025 200.58±0.20 0.34±0.008 101.78±0.10 1.22 >14
LS9 4.3±0.092 199.03±0.04 0.40±0.054 98.96±0.91 1.63 >14
LS10 4.4±0.022 204.03±0.01 0.42±0.044 99.16±0.12 1.78 >14
LS11 4.5±0.032 200.93±0.34 0.51±0.024 99.56±0.11 2..12 >14
LS12 4.6±0.022 200.33±0.31 0.60±0.024 100.16±0.12 2.15 >14
FLT, floating lag time; TFT, total floating time
FORMULATION OF LAFUTIDINE
FLOATING TABLETS
All the tablets were prepared by effervescent
approach. The concentration of all the three
selected semi-synthetic polymers (HPMC) was
decided on trial and error basis. Sodium
bicarbonate (10%) and citric acid (7.5%) in the
ratio of 1.0:0.7, were incorporated as a gas-
generating agents. PVP-K30 (5%) and MCC
(44.5%–59%) were used as binder and diluent
respectively. Talc (1%) was used as lubricant and
magnesium stearate (2%) was employed as glidant
to improve the flow of the powder. FTIR study
showed that all the polymers used were compatible
with lafutidine [24]
.
POST-COMPRESSION EVALUATION OF
LAFUTIDINE FLOATING TABLETS
The formulated floating tablets were subjected for
post compressional evaluation such as visual
inspection, hardness, weight variation, friability,
uniformity of drug content, in vitro buoyancy,
swelling, in vitro dissolution, stability and
similarity studies. The results are summarized in
Table 3.
Visual inspection
The prepared tablets were inspected visually for
general tablet deformities. The tablets were smooth
with uniform in size, shape and colour. There was

Farhat, et al / Journal of Pharmacreations Vol-2(2) 2015 [50-61]
56
no lamination or chipping was observed in all the
tablets which indicated that the tablet-
instrumentation was compatible with the powder
blends and resulting in good tablet characteristics.
Hardness
The prepared tablets in all the formulations
possessed good mechanical strength with sufficient
hardness. Hardness in the prepared tablets was
found to be in the range of 4.1±0.02 to 4.6±0.022
kg/cm2. Hardness of the tablets was found to
increase with an increasing of polymer
concentration. Similar pattern of results was
observed in the study done by Chauhan et al. [25]
.
Weight variation
The weight variation of prepared formulations was
found in the range of 199.03±0.04 –204.03±0.01
mg. All the batches of tablets were found to pass
the weight variation test. The percentage deviation
of the individual tablet weights from the average
tablet weight was found to be within the I.P. limits
of ±7.5 %.
Friability test
The friability loss of prepared tablets was found to
be between 0.28±0.011% and 0.60±0.024 % when
tested using Roche friabilator. All batches of
tablets passed the test and were within the limits of
less than 1% which indicated that the tablets were
mechanically stable.
Drug content uniformity
The drug content uniformity of the prepared tablets
was examined as per I.P. specification and was
found compliant. The drug content of the
formulations was in the range 98.96±0.91 % to
101.78±0.10 % showing the uniformity of drug
distribution in the prepared tablets [26]
. None of the
individual drug content values were outside the
average content values of 90% to 110% as per IP.
IN VITRO BUOYANCY STUDIES
In the present study the floating tablets were
formulated with sodium bicarbonate (NaHCO3) and
citric acid in an optimized ratio (1.0:0.75) as gas
forming mixture. Floating lag time of all
formulations was found to be within the range
1.08–2.15 min and results are given in Table No.3.
All formulations floated in the 0.1N HCl for more
than 14 h showing good matrix integrity during this
extended period of time. The results showed that as
the concentration of HPMC polymer increased, the
floating lag time decreased due to the increasing
hydrophilic nature of the polymer allowing
penetration of liquid through pores formed on the
surface of the tablet. Sodium bicarbonate and citric
acid reacts with acid to liberate CO2, which gets
trapped within the gel formed by hydration of
polymer thus decreasing the tablet density to below
1 g/cm3 [27]
.
SWELLING STUDIES
Swelling index is a parameter which describes the
ability of the formulation to swell and float in the
dissolution medium. Tablets composed of
polymeric matrices build a gel layer around the
tablet core when they come in contact with water.
This gel layer governs the drug release. Kinetics of
swelling is important because the gel barrier is
formed with water penetration. Swelling is also a
vital factor to ensure floating and drug dissolution.
To obtain floating, the balance between swelling
and water acceptance must be restored. The
swelling index of floating tablets of LS1–LS12 is
shown in Figs.3-5. Floating tablets prepared using
HPMC K4M and HPMC K15M (LS1 to LS8)
swelled rapidly at the beginning in 0.1 N HCl and
could remain their matrix integrity up to 8 h. The
swelling index was increased with concentration of
HPMC since this polymer gradually absorbs buffer
due to hydrophilic nature. The HPMC grade affects
the swelling and hydration with considerably
higher swelling index for HPMC K4M than HPMC
K15M and HPMC, K100M. HPMC K100M
exhibited low swelling index which could be due to
its high viscosity and high water retention property.
The swelling index was calculated with respect to
time. As time increases, the swelling index also
increased, this is because weight gain by tablet was
increased proportionally with rate of hydration up
to certain limit. The direct relationship was
observed between swelling index and polymer
concentration (HPMC), and as polymer
concentration increases, swelling index was found
to increase. Similar fashion was also reported by [28].

Farhat, et al / Journal of Pharmacreations Vol-2(2) 2015 [50-61]
57
Fig. 3: Swelling studies of lafutidine floating
tablets formulated with HPMC K4M
Fig. 4: Swelling studies of lafutidine floating
tablets formulated with HPMC K15M
Fig. 5: Swelling studies of lafutidine floating
tablets formulated with HPMC K100M
IN VITRO DISSOLUTION STUDIES
In vitro dissolution studies of lafutidine floating
tablet were evaluated in 0.1 N HCl (pH 1.2) for 8.5
h. The cumulative percentage of drug released from
the tablets containing three viscosity grades of
HPMC (K4M, K15M and K100M) in specified
ratios (1:0.5; 1:1; 1:1.5 and 1:2) was compared.
The curves of cumulative percentage of drug
released vs. time (h) for all the formulations were
plotted and are depicted in Figs. 6–8.
As the concentration of polymer HPMC was
increases, the rate of release of drug from tablets
were decreases. When concentration of HPMC was
lower (10 mg) it released maximum drug but as
concentration of HPMC increases (upto 40 mg) the
rate of release drug consistently decreases at a
constant time period. The amount HPMC in
formulation was also found to be a key factor in
terms of controlled drug release rate. It is widely
known that high HPMC contents usually retard
drug release by forming a viscous gel layer which
will not only increase the diffusion path length but
also the resistance to diffusion [29]
. Thus, HPMC
concentration was found to play a key role in
modifying the drug release.
HPMC K4M floating tablet LS4 showed release of
99.36%, while HPMC K15M (LS8),
HPMCK100M (LS12) formulated in the same
concentration exhibited 96.99% and 94% drug
release respectively at 8.5 h. This indicates there
was also an influence of polymer viscosity on the
release rate of the drug. High viscosity grade
HPMC contents results in a greater amount of gel
being formed. This gel increases diffusion path
length of the drug. Its viscous nature also affects
the diffusion coefficient of the drug.
Formulation LS2 gave 98.92% drug release at 8.5th
h fulfilling the aim of study and, hence, was
selected as optimized batch.
Fig. 6: In vitro drug release profiles of lafutidine
floating tablets of HPMC K4M
Fig. 7: In vitro drug release profile of lafutidine
floating tablets of HPMC K15M
Farhat, et al / Journal of Pharmacreations Vol-2(2) 2015 [50-61]
58
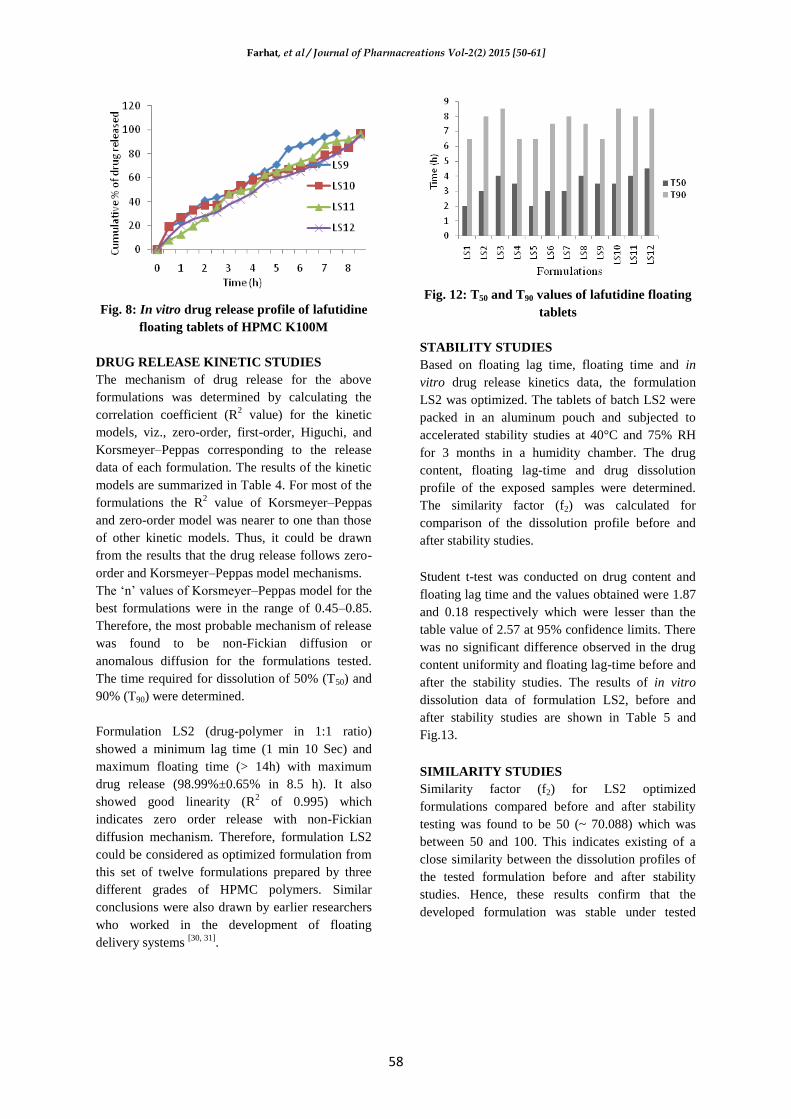
Fig. 8: In vitro drug release profile of lafutidine
floating tablets of HPMC K100M
DRUG RELEASE KINETIC STUDIES
The mechanism of drug release for the above
formulations was determined by calculating the
correlation coefficient (R2 value) for the kinetic
models, viz., zero-order, first-order, Higuchi, and
Korsmeyer–Peppas corresponding to the release
data of each formulation. The results of the kinetic
models are summarized in Table 4. For most of the
formulations the R2 value of Korsmeyer–Peppas
and zero-order model was nearer to one than those
of other kinetic models. Thus, it could be drawn
from the results that the drug release follows zero-
order and Korsmeyer–Peppas model mechanisms.
The ‘n’ values of Korsmeyer–Peppas model for the
best formulations were in the range of 0.45–0.85.
Therefore, the most probable mechanism of release
was found to be non-Fickian diffusion or
anomalous diffusion for the formulations tested.
The time required for dissolution of 50% (T50) and
90% (T90) were determined.
Formulation LS2 (drug-polymer in 1:1 ratio)
showed a minimum lag time (1 min 10 Sec) and
maximum floating time (> 14h) with maximum
drug release (98.99%±0.65% in 8.5 h). It also
showed good linearity (R2 of 0.995) which
indicates zero order release with non-Fickian
diffusion mechanism. Therefore, formulation LS2
could be considered as optimized formulation from
this set of twelve formulations prepared by three
different grades of HPMC polymers. Similar
conclusions were also drawn by earlier researchers
who worked in the development of floating
delivery systems [30, 31]
.
Fig. 12: T50 and T90 values of lafutidine floating
tablets
STABILITY STUDIES
Based on floating lag time, floating time and in
vitro drug release kinetics data, the formulation
LS2 was optimized. The tablets of batch LS2 were
packed in an aluminum pouch and subjected to
accelerated stability studies at 40°C and 75% RH
for 3 months in a humidity chamber. The drug
content, floating lag-time and drug dissolution
profile of the exposed samples were determined.
The similarity factor (f2) was calculated for
comparison of the dissolution profile before and
after stability studies.
Student t-test was conducted on drug content and
floating lag time and the values obtained were 1.87
and 0.18 respectively which were lesser than the
table value of 2.57 at 95% confidence limits. There
was no significant difference observed in the drug
content uniformity and floating lag-time before and
after the stability studies. The results of in vitro
dissolution data of formulation LS2, before and
after stability studies are shown in Table 5 and
Fig.13.
SIMILARITY STUDIES
Similarity factor (f2) for LS2 optimized
formulations compared before and after stability
testing was found to be 50 (~ 70.088) which was
between 50 and 100. This indicates existing of a
close similarity between the dissolution profiles of
the tested formulation before and after stability
studies. Hence, these results confirm that the
developed formulation was stable under tested

Farhat, et al / Journal of Pharmacreations Vol-2(2) 2015 [50-61]
59
conditions.
Fig. 13: Cumulative % of drug released vs time
plots of formulation LS2 before and after
stability studies
Table 5: Stability studies of optimized
formulation LS2
Storage conditions Drug content
(%±sd)
FLT
(min±sd)
Reference (LS2) 100.78±0.05 1.10±0.20
Test (40±20 C/75±5%
RH,
3 months)
100.10±00.89 1.11±0.12
t-test value 1.87 0.18
FLT, floating lag time; n=3
Table 4: In vitro drug release kinetics of lafutidine floating tablets formulated with HPMC
Formulation
Code
T50
(h)
T90
(h)
Zero order First order Higuchi KorsmeyerPeppas
R2 K0 (mg.h-1) R2 K1 (h-1) R2 R2 N
LS1 2.0 6.5 0.986 11.687 0.925 0.318 0.974 0.988 0.454
LS2 3.0 8.0 0.995 08.492 0.899 0.258 0.937 0.990 0.490
LS3 4.0 8.5 0.980 10.179 0.976 0.245 0.939 0.992 0.471
LS4 3.5 6.5 0.961 11.687 0.955 0.405 0.927 0.976 0.636
LS5 2.0 6.5 0.935 10.330 0.945 0.345 0.983 0.953 0.516
LS6 3.0 7.5 0.979 10.679 0.969 0.316 0.980 0.964 0.714
LS7 3.0 8.0 0.933 09.343 0.972 0.295 0.979 0.964 0.568
LS8 4.0 7.5 0.985 10.493 0.937 0.320 0.980 0.993 0.705
LN9 3.5 6.5 0.986 11.631 0.899 0.337 0.963 0.986 0.725
LN10 3.5 8.5 0.983 08.699 0.965 0.212 0.988 0.989 0.588
LN11 4.0 8.0 0.984 11.254 0.930 0.212 0.959 0.981 0.759
LN12 4.5 8.5 0.993 09.729 0.929 0.212 0.958 0.989 0.664
CONCLUSIONS
Preformulation studies reveals that the lafutidine
and HPMC polymers are compatible,
precompresion results are excellent to proceed
further for formulation development of lafutidine
floating tablets, post compression evaluation
parameters evidenced the benchmark results for the
LS2 formulation prepared with (1:1 drug :
polymer) ( 2:1 ; sodium bicarbonate:citric acid-gas
generating agent) ratios with a zero order kinetics
with % drug released at 8.5th
h was found to be
98.99±0.65, drug contenet 100.78±0.05. The
swelling index to the optimized formulation was
194 % with floating lag time 1.10 and total floating
time >12 h. Henceforth from this part of the
research it can be concluded that LS2 with a
similarity factor f2 70.088 after stability study can
be further evaluated in vivo for it robustness in the
biological systems then scaled up to validate its
industrial applicability and as a promising floating
drug delivery system.
Micro Crystalline Cellulose (Avicel PH 101), in
this formulation is used as a diluent, it also imparts
superior flow properties and enhances powder
compaction in during compression. Moreover it is
reported that microcrystalline cellulose is capable
of swelling in contact with aqueous fluids due to its
water soluble property, it also imparts in pore
formation in the tablets disc that leads to entry of
aqueous fluid then the increased released at a short
time, therefore the maximum release of drug in this
investigation was at 8.5h due to increase amount of
MCC in the formulations.
CONFLICTS OF INTEREST
The authors declare that they have no conflicts of
interest.
ACKNOWLEDGEMENT
Authors duly acknowledge their gratitude to
Instrumentation center, Osmania University,
Hyderabad, India for providing necessary facilities
to carry out the instrumental work.

Farhat, et al / Journal of Pharmacreations Vol-2(2) 2015 [50-61]
60
REFERENCES
[1]. Rouge N, Buri P and Doelker E. Drug absorption sites in the gastrointestinal tract and dosage form for
site–specific delivery. Int.J.Pharm. 1996; 136: 117–139.
[2]. Fell JT, Whitehead L and Collet H. Prolonged gastric retention using floating dosage forms. Pharm
Technol. 2000; 24(3): 82–90.
[3]. Mathura RS, Sangahavi NM, Novel drug delivery systems for captopril. Drug Dev Ind Pharm. 1992;
18: 1567–1574.
[4]. Baumgartners S, Kristal J, Vrecer F, Vodopivec P and Zorco B. Optimization of floating matrix tablets
and evaluation of their gastric residence time. Int.J.Pharm. 2000; 195(1–2): 125–135.
[5]. Despande AA, Rhodes CT, Shah NH, Malick AW. Control release drug delivery systems for prolong
gastric recidence: an overview. Drug Dev Ind Pharm. 1996; 22(6): 531–539.
[6]. Ashok KD, Guru PM. Formulation and In vitro evaluation of lafutidine floating tablets by lipid solid
dispersion spray drying technique. International Journal of Research in Pharmacy and Chemistry. 2012;
2(4): 996–1000.
[7]. Manish P, Patel MM, Patel DH, Patel KN. Formulation Development, Optimization and Evaluation of
Lafutidine Floating Matrix Tablets. International Journal of Pharmaceutical Sciences and Drug
Research 2009; 1(2): 85–90.
[8]. Kapoor D, Vyas RB, Lad C, Patel M, Sharma S, Formulation and evaluation of stomach specific floating
tablet of anti-ulcer drug. World journal of pharmacy and pharmaceutical sciences, 2014, 3 (5): 1534-
1545.
[9]. Patel DM , Patel DG ,. Patel CN, Formulation and Optimization of Raft Forming Chewable Tablet
Containing Lafutidine, International Journal of Pharmaceutical Sciences and Drug Research, 2015;
7(3): 229-234.
[10]. Patil S, Talele G. Formulation development and in vitro & in vivo evaluation of gastro retentive
floating drug delivery system of Lafutidine. Asian J. Pharma. 2013; 7(2):68-74..
[11]. Gnanaprakash K, Chandhra SKB, Madhu SCC. Floating tablets of Lafutidine with natural polymer: An
approach for gastric treatment. J. Pharm. Sci. & Res. 2010; 2(10): 657–662.
[12]. Assaleh FH, Katakam P, Botcha R, Chandu BR, Adiki SK
. Synthesis and characterisation of starch
tartrate and its application as novel disintegrant in telmisartan tablets. Starch‐Stärke 2013; 65: 1–9.
[13]. Lachman L, Liberman HA. The Theory and Practice of Industrial Pharmacy, 7th
Edn. 2009, 297, 300.
[14]. Raju K, Deepika B, Prasanna L, Gouthami M, Anusha G. Formulation and In vitro evaluation of
nizatidine floating tablets: effect of natural and synthetic polymers on floating properties. International
Journal of Advances in Pharmaceutical Research. 2013; 4: 1358–1367.
[15]. Rosa M, Zia H, Rhodes T, Dosing and In vitro testing of a bioadhesive Floating Drug Delivery
Systems, Int. J. Pharm, 1994; 105: 65–70.
[16]. Wertz PW, Downing DT. Transdermal drug delivery: developmental issues and research iniatives,
Hadgraft J, Guy RH, Eds. Marcel Dekker Inc. New York. 1989, pp. 1–22.
[17]. Donbrow M, Samuelov Y, Zero order drug delivery from double–layered porous films: Release rate
profiles from ethyl cellulose, hydroxypropylcellulose and polyethylene glycol mixtures. J Pharm
Pharmacol 1980; 32: 463–70.
[18]. Higuchi T. Rate of release of medicaments from ointment bases containing drugs in suspension. J
Pharm Sci 1961; 50: 874–75.
[19]. Ritger PL, Peppas NA. A simple equation for description of solute release II. Fickian and anomalous
release from swellable devices. J Control Rel 1987; 5: 37–42.
[20]. ICH Guideline Q1A (R2). Stability Testing of New Drug Substances and Products. (2003). http:
//www. ich. org/LOB/media/MEDIA419. Pdf
[21]. Costa P, Manuel J, Labao J. Modeling and comparison of dissolution profiles. Eur. J. Pharm. Sci, 2002,
13: 123–133.
[22]. Gray V, Kelly G, Xia M, Butler C, Thomas S, Mayock S, The science of USP 1 and 2 dissolution:
present challenges and future relevance. Pharm Res 2009; 26: 1289–1302.

Farhat, et al / Journal of Pharmacreations Vol-2(2) 2015 [50-61]
61
[23]. The Indian Pharmacopoeia, 6thEd, published by the Indian Pharmacopeia Commission, Ghaziabad,
2010, 3: 2469, 2501, 2547
[24]. Lakshmaiah AS, Rajesh A, Reddy DN, Naik VV, Rao AA, Pashaa A, Gupta SK. Formulation and
evaluation of hydrodynamically balanced floating tablets of antidiabetic agent. Acta Chim Pharm
Indica 2014; 4(1): 719.
[25]. Chauhan K, Kumar A, Kumar M, Kumar S, Singh S. Formulation and development of Lafutidine
floating tablets for gastric irritation. Der Pharmacia Lettre, 2010; 2(3): 450–459.
[26]. Parija S, Devlopment and In vitro Evaluation of Gastroretentive Floating Tablets of Famotidine.
International Journal of Research in Pharmaceutical and Biomedical Sciences. 2013; 4 (1).
[27]. Tadros MI. Controlled–release effervescent floating matrix tablets of ciprofloxacin hydrochloride:
development, optimization and In vitro–in vivo evaluation in healthy human volunteers. Eur. J. Pharm.
Biopharm. 2010; 74: 332–339.
[28]. Gergogiannis YS, Rekkas DM, Dallos, PP and Chailis NH. Floating and swelling characteristics of
various excipients used in controlled release technology, Drug Dev Ind Pharm, 1993, 19, 1061‐1081.
[29]. Padmavathy J, Saravanan D, Rajesh D. Formulation and evaluation of Ofloxacin floating tablets using
HPMC. International Journal of Pharmacy and Pharmaceutical Sciences. 2011; 3(1): 170–173.
[30]. Dhumal RS, Dhumal ST, Rajmane ST, Dhumal AP, Pawar. Design and evaluation of bi–layered
floating tablets of cefuroxime axetil for bimodal release. J Sci Ind Res. 2006; 65: 812–816.
[31]. Patel VF, Patel NM. Intragastric floating drug delivery system of cefuroxime axetil: In vitro evaluation.
AAPS Pharm. Sci. Tech, 2006; 7: E1–E7.