journal of pharmaceutical and biomedical...
TRANSCRIPT

Sm
Sa
b
a
ARRAA
KRABMDR
1
tltsstateatcScrcA
h0
Journal of Pharmaceutical and Biomedical Analysis 137 (2017) 60–69
Contents lists available at ScienceDirect
Journal of Pharmaceutical and Biomedical Analysis
j o ur nal ho me page: www.elsev ier .com/ lo cate / jpba
eparation of antibody drug conjugate species by RPLC: A genericethod development approach
zabolcs Feketea,∗, Imre Molnárb, Davy Guillarmea
School of Pharmaceutical Sciences, University of Geneva, University of Lausanne, CMU – Rue Michel Servet, 1, 1211 Geneva 4, SwitzerlandMolnár-Institute for Applied Chromatography, Schneeglöckchen Strasse 47, 10407 Berlin, Germany
r t i c l e i n f o
rticle history:eceived 7 December 2016eceived in revised form 5 January 2017ccepted 6 January 2017vailable online 11 January 2017
eywords:etention modellingntibody drug conjugate
a b s t r a c t
This study reports the use of modelling software for the successful method development of IgG1 cysteineconjugated antibody drug conjugate (ADC) in RPLC. The goal of such a method is to be able to calculate theaverage drug to antibody ratio (DAR) of and ADC product. A generic method development strategy wasproposed including the optimization of mobile phase temperature, gradient profile and mobile phaseternary composition. For the first time, a 3D retention modelling was presented for large therapeuticprotein. Based on a limited number of preliminary experiments, a fast and efficient separation of theDAR species of a commercial ADC sample, namely brentuximab vedotin, was achieved. The predictionoffered by the retention model was found to be highly reliable, with an average error of retention time
rentuximab vedotinethod developmentryLabeversed phase liquid chromatography
prediction always lower than 0.5% using a 2D or 3D retention models. For routine purpose, four to six initialexperiments were required to build the 2D retention models, while 12 experiments were recommendedto create the 3D model. At the end, RPLC can therefore be considered as a good method for estimatingthe average DAR of an ADC, based on the observed peak area ratios of RPLC chromatogram of the reducedADC sample.
© 2017 Elsevier B.V. All rights reserved.
. Introduction
Antibody drug conjugates (ADCs) are chemotherapeutics consti-uted of a cytotoxic chemical drug linked covalently – via peptideinker – to a monoclonal antibody (mAb) [1]. They are used forhe treatment of cancer by combining the proven antigen-specificelectivity and activity of mAbs with the potency of highly cytotoxicmall molecules [2]. Drug conjugation can be achieved via reac-ions at different amino acid residues such as at lysine side chainsmines (lysine conjugation), at cysteine thiol groups after reduc-ion of the interchain disulfide bonds (cysteine conjugation), or atngineered cysteine residues at specific sites on a mAb [3,4]. Theddition of the drugs results in a heterogeneous population of ADCshat differ in the number of drugs per antibody, and this mixturean be described by an average drug to antibody ratio (DAR) [4].tructurally, immunoglobulin G1 (IgG1) mAbs contain four inter-hain disulphide bridges. Among those, two are located in the hinge
egion and connect the two heavy chains (H) while the other twoonnect the H and light chain (L). Therefore, a cysteine linked IgG1DC is composed of a heterogeneous mixture of 0, 2, 4, 6 or 8 drug∗ Corresponding author.E-mail address: [email protected] (S. Fekete).
ttp://dx.doi.org/10.1016/j.jpba.2017.01.013731-7085/© 2017 Elsevier B.V. All rights reserved.
conjugations [5]. An odd number of conjugated drugs on an ADCis typical indicative of degradation [6,7]. In this study, we focusonly on a commercially available cysteine linked IgG1 ADC, namelybrentuximab vedotin.
One of the most important critical quality attributes (CQA) ofan ADC is the average DAR, since it determines the amount of“payload” that can be delivered to a tumor cell and can affectefficacy and safety [3]. A variety of analytical methods have beenused to measure the average DAR, including UV–vis spectroscopic,liquid chromatographic, and native mass spectrometric methods[4,8–19]. Among liquid chromatographic methods, hydrophobicinteraction chromatography (HIC) and reversed phase chromatog-raphy (RPLC) are routinely used. The former approach separates theintact DAR species under non-denaturating conditions, while RPLCis mostly used to separate the DAR species of reduced ADC samplerelated to the H or L chains as L0, L1 and H0, H1, H2 and H3 species.
In addition to information about the average DAR, multiplemethods have been applied to analyze the distribution of druglinked forms and their positional isomers. This is again an importantcharacteristic because different forms may have different pharma-
cokinetic and toxicological properties [3,16]. A number of methodsfor this task are based on the use of mass spectrometry (MS)[20–23]. The separation of intact DARs in HIC also allows the iso-lation of pure species and permits further characterization (e.g.
al and
bicbsaafs
solMatnmpciawfs
2
2
M
atp
ctF
c
2
Iiat0asV
Efr(
2
tmp
S. Fekete et al. / Journal of Pharmaceutic
y capillary electrophoresis-sodium dodecyl sulphate and capillaryso-electric focusing (CE-SDS, cIEF) or cell based bioassay) [3,5]. Theomplete characterization of ADC DAR positional isomers can alsoe performed on-line, by peptide mapping LC–MS or two dimen-ional (HIC x RPLC)-MS analysis of the native ADC [6,7,24,25]. Inddition to average DAR, DAR distribution and positional isomernalysis, a number of complementary methods can be applied forurther characterization of ADCs to determine residual free drugs,ize variants or charge variants [25].
As mentioned earlier, RPLC is mostly used to separate the DARpecies of reduced ADC related to H and L, but can also be appliedn the native ADC to separate L, H, HH, HL and HHL fragments. Theatter one can be useful, as a second dimension separation prior to
S. In the literature, only “historical” methods are reported, using mobile phase containing 0.1% trifluoroacetic-acid (TFA), an ace-onitrile gradient and elevated temperature of 70–80 ◦C. However,othing is reported about systematic method development, opti-ization procedure or retention behavior. In this study, we offer a
ossible generic method development approach for IgG1 cysteineonjugations. Both 2D and 3D retention models are discussed. Thempact of temperature and mobile phase ternary composition waslso studied. Finally, four, six and twelve experiments based designsere suggested for routine purposes. This new approach allows a
ast and accurate systematic method development for the efficienteparation of ADC DAR species and fragments.
. Experimental
.1. Chemicals and columns
Water was obtained from a Milli-Q Purification System fromillipore (Bedford, MA, USA).Acetonitrile (ACN) and methanol (MeOH) were ULC–MS grade
nd purchased from Biosolve (Valkenswaald, Netherlands). Dithio-hreitol (DTT, ≥99.0%) and trifluoroacetic acid (TFA, 99%) wereurchased from Sigma–Aldrich (Buchs, Switzerland).
Brentuximab vedotin as therapeutic monoclonal antibody drugonjugate (IgG1 cysteine linked ADC) was kindly provided byhe Center of Immunology Pierre Fabre (Saint-Julien en Genevois,rance).
The AdvanceBio RP-mAb C4 (3.5 �m, 150 mm × 2.1 mm, 450 Å)olumn was purchased from Agilent (USA).
.2. Equipment and software
Measurements were performed using a Waters Acquity UPLCTM
-Class system equipped with a binary solvent delivery pump (max-mum flow rate of 2 mL/min and upper pressure limit of 1200 bar),n auto-sampler and UV detector. The system includes a flowhrough needle (FTN) injection system with 15 �L needle and a.5 �L UV flow-cell. The overall extra-column volume (Vext) wasbout 7.5 �L as measured from the injection seat of the auto-ampler to the detector cell. The dwell volume was measured asd = 0.09 mL.
Data acquisition and instrument control were performed bympower Pro 3 software (Waters). Calculations and data trans-erring were achieved with Excel (Microsoft). Retention andesolution modelling was performed with DryLab
®4 software
Molnár-Institute, Berlin, Germany).
.3. Mobile phase composition and sample preparation
For the gradient separation of ADC DARs and its fragments,he mobile phase “A” consisted of 0.1% TFA in water, whereas the
obile phase “B” was 0.1% TFA in organic solvent having differentossible compositions of acetonitrile and methanol.
Biomedical Analysis 137 (2017) 60–69 61
Native brentuximab vedotin was injected as received (5 mg/mL)using low volume insert vials.
Reduced brentuximab vedotin sample was prepared by theaddition of DTT solution (10 mM) and incubation at 30 ◦C for 60 min.The ADC was completely converted into the light and heavy chaincomponents. Then, sample was injected from low volume insertvial.
2.4. Investigation of retention properties of ADC species(preliminary studies)
Native brentuximab vedotin was eluted in RPLC mode using lin-ear gradients. The effect of the gradient profile, temperature andorganic modifier on the retention and selectivity of ADC specieswas studied. Detection was carried out at 280 nm, and 1 �L samplewas injected.
First, the effect of gradient steepness (gradient time, tG) onretention and selectivity was evaluated. A generic linear gradient,starting from 25% to 50% B was applied at a flow rate of 0.3 mL/min.For mobile phase B, acetonitrile was used as organic modifier andthe experiments were performed at T = 90 ◦C. In our previous study,the validity of linear solvent strength model (LSS) was proved formAbs and subunits in the practically relevant design space (DS)[26]. The gradient time was varied as tG = 6, 12 and 18 min. Theobserved apparent (or gradient) retention factors (kapp) were plot-ted against tG and the change in selectivity (elution order) wasfollowed.
Based on previous experiments, high temperature seemed to bemandatory for correct peak shape and recovery [27]. Therefore, allthe experiments were performed at mobile phase temperature ofT ≥ 70 ◦C. Short gradient runs (tG = 6 min) were carried out at 70,75, 80, 85 and 90 ◦C (up to the upper temperature limit of the col-umn). Our purpose was to illustrate the effect of temperature onthe retention and recovery. Plots of log kapp vs. 1/T and recoveryvs. T were made. For the estimation of recovery, peak area valueswere normalized to the ones observed at the highest temperature(90 ◦C).
At last, the impact of the organic modifier was studied by run-ning gradients with mixtures of acetonitrile and methanol. Aproticand protic solvents may have an impact on the solvation of ADCspecies and can interact in different ways with the proteins and alsowith the residual acidic silanols of the silica based stationary phase.Therefore, differences in retention and selectivity were expected.Ternary mobile phases were prepared using water, acetonitrile andmethanol. The ternary composition (tC) of mobile phase B was setas 0, 20, 40 and 50% MeOH in ACN. Since MeOH has a lower eluentstrength than ACN, the gradients were run in an extended%B range(30–80%B), to elute all the species with all mobile phase composi-tions. The experiments were performed at T = 90 ◦C, and tG = 6 min.Higher than 50% MeOH content resulted in unacceptable recoveryand too high retention.
2.5. Systematic method optimization
Snyder et al. recommended initial basic runs for multifactorialexperimental designs already in the 90’s [28]. A general approachis to simultaneously model the effect of temperature and gradi-ent steepness (tG) on selectivity with a previously selected RPLCcolumn [29,30]. Then, with the help of resolution maps generatedby modelling software – which show the critical resolution of thepeaks to be separated [31] – the gradient program and column tem-perature can be rapidly and efficiently optimized. Today – thanks
to new developments of modelling software – it is also possible tosimultaneously optimize three method variables. Beside tempera-ture and gradient steepness, ternary mobile phase composition ormobile phase pH are often selected as third variable [32–34]. Since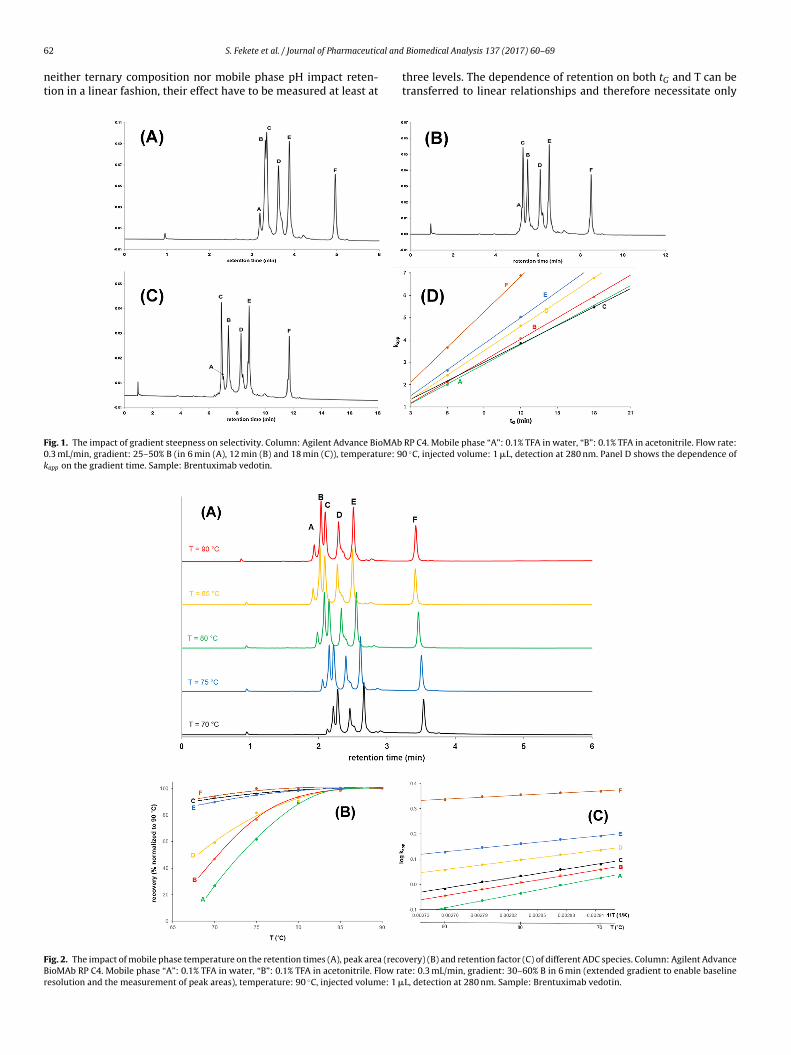
6
nt
F0k
FBr
2 S. Fekete et al. / Journal of Pharmaceutical and
either ternary composition nor mobile phase pH impact reten-ion in a linear fashion, their effect have to be measured at least at
ig. 1. The impact of gradient steepness on selectivity. Column: Agilent Advance BioMAb.3 mL/min, gradient: 25–50% B (in 6 min (A), 12 min (B) and 18 min (C)), temperature: 9app on the gradient time. Sample: Brentuximab vedotin.
ig. 2. The impact of mobile phase temperature on the retention times (A), peak area (recoioMAb RP C4. Mobile phase “A”: 0.1% TFA in water, “B”: 0.1% TFA in acetonitrile. Flow raesolution and the measurement of peak areas), temperature: 90 ◦C, injected volume: 1 �
Biomedical Analysis 137 (2017) 60–69
three levels. The dependence of retention on both tG and T can betransferred to linear relationships and therefore necessitate only
RP C4. Mobile phase “A”: 0.1% TFA in water, “B”: 0.1% TFA in acetonitrile. Flow rate:0 ◦C, injected volume: 1 �L, detection at 280 nm. Panel D shows the dependence of
very) (B) and retention factor (C) of different ADC species. Column: Agilent Advancete: 0.3 mL/min, gradient: 30–60% B in 6 min (extended gradient to enable baselineL, detection at 280 nm. Sample: Brentuximab vedotin.

al and Biomedical Analysis 137 (2017) 60–69 63
tmf
s3aTacerrt
0wm
atbmaBt
tow
3
3
pnnmitmttabwfdl
itftitpttrv
e
Fig. 3. The impact of mobile phase ternary composition. Column: Agilent AdvanceBioMAb RP C4. Mobile phase “A”: 0.1% TFA in water, “B”: 0.1% TFA in acetonitrile and
S. Fekete et al. / Journal of Pharmaceutic
wo experiments for one variable to build up an accurate retentionodel. In our DS, these linear relationships were found to be valid
or large ADC species.In this study, the most information retention model for ADC
ubunits was found to be a twelve experiments based combinedD model of tG × T × tC. The gradient time was set as tG1 = 10 minnd tG2 = 20 min, temperature was studied at T1 = 75 ◦C and at2 = 90 ◦C while ternary composition was set at tC1 = 0%, tC2 = 10%nd tC3 = 20% MeOH in ACN. Longer gradients than 20 min were notonsidered to avoid on column degradation of large ADC species atlevated temperature. The experiments were performed at a flowate of 0.3 mL/min (25–50% B, linear gradients). The accuracy ofetention models were verified in the center point of the DS, namelyG = 15 min, T = 82,5C and tC = 10% MeOH.
Mobile phase pH was not an important method variable, and.1% TFA is commonly added to the mobile phase to have ion-pairsith the positively charged proteins and a pH of around 2 in theobile phase.Simplified 2D retention models were also suggested as tG × T
nd tG × tC. The former one requires four initial experiments, whilehe latter one needs six experimental runs. These 2D models wereuilt up on the basis of experimental runs performed for the 3Dodel. For the first 2D model tG1 = 10 min, tG2 = 20 min, T1 = 75 ◦C
nd T2 = 90 ◦C were considered (with 0% MeOH in mobile phase). For the second 2D model tG1 = 10 min, tG2 = 20 min, tC1 = 0%,C2 = 10% and tC3 = 20% MeOH in ACN were considered at T = 90 ◦C.
Optimal conditions (working points) were determined for bothhe native and reduced brentuximab vedotin and then the accuracyf retention time prediction was studied. Simulated robustness testas also performed around the working point.
. Results and discussion
.1. Preliminary measurements
In RPLC, interaction with the stationary phase is mediatedredominantly through hydrophobic interactions between theonpolar amino acid residues of proteins and the immobilized-alkyl ligands. Solutes are eluted in their order of increasingolecular hydrophobicity. The retention of mAb and ADC species,
.e. large biomolecules is strongly dependent on small changes inhe solvent strength and a very small change (<1%) in the organic
odifier content could lead to a significant shift in the retention. Forhis reason, isocratic conditions are impractical, and gradient elu-ion is mandatory. In addition, the peak shape of large molecules islways better in gradient mode compared to isocratic one due toand focusing effects. The LSS model is the widely accepted theoryhich describes the analyte retention as a function of the volume
raction (�) of the eluting B solvent. This model generally wellescribes the retention of numerous types of analytes including
arge proteins such as mAbs or mAb sub-units [26].Fig. 1 shows the impact of tG on selectivity and kapp. Interest-
ngly, the selectivity between some peaks changes drastically withG . With a fast gradient (tG = 6 min), the first three peaks elute in theollowing order: A, B and C. When increasing tG to 12 min, the elu-ion order of B and C changes. Further increasing tG (18 min) resultsn a new elution order, namely C, A and B. Fig. 1D well representshe effect of tG on selectivity since the fitted curves of kapp vs tG foreaks A, B and C cross each other in the studied range. Moreover,he LSS behavior of the ADC species was also illustrated, since linearrends fit perfectly with the experimental data. These preliminary
esults suggest that gradient steepness is a very important methodariable to optimize ADC separations under RPLC conditions.The effect of temperature on retention factor is generallyxpressed by the van’t Hoff relationship. When log kapp is plotted
methanol mixture. Flow rate: 0.3 mL/min, gradient: 30–80% B in 6 min (extendedgradient to enable eluting all the peaks with 50% MeOH content), temperature: 90 ◦C,injected volume: 1 �L, detection at 280 nm. Sample: Brentuximab vedotin.
against 1/T, a linear relationship is expected for regular solutes.However, with large biomolecules, the effect of temperature onretention becomes more complex. Depending on the stability of thesecondary structure, the molecules unfold to various extents andhence interact with the stationary phase with various strengths[35]. Due to the different conformation-dependent responses ofproteins at elevated temperatures, the change in retention can bevery different [36,37]. Another issue related to temperature is thepossible thermal degradation of proteins when working at elevatedtemperature [27]. It was shown for mAbs that analysis time shouldbe kept below 20 min to avoid degradation at 70–90 ◦C. On the otherhand, high temperature is mandatory to limit protein adsorptionon the stationary phase. A temperature lower than 70 ◦C results inunacceptable recovery for most mAbs [38]. Therefore, it is impor-tant to work in a limited range in terms of temperature and analysistime. If the analysis time is no longer than 20 min, then, a van’tHoff like behavior is expected between 70 and 90 ◦C for mAbs andsubunits [26]. Fig. 2A shows the observed chromatograms of bren-tuximab vedotin measured at 70, 75, 80, 85 and 90 ◦C. As shownin Fig. 2A, the ratio of peak areas of the main peaks (A–F) changeswith temperature. The change of peak areas was especially impor-tant for peaks A, B and D. As reported in Fig. 2B, only 27, 47 and59% of peak areas was observed at 70 ◦C for peaks A, B and D com-pared to 90 ◦C. Based on previous studies [6,7], these peaks probablycorrespond to the naked mAb (and mAb with two drugs on the Hin the hinge region), the conjugated light chain (L1) and differentHHL species (HHL1 and HHL3). To have at least 50% recovery forall peaks, the temperature should not be set below 75 ◦C. Fig. 2Cconfirms the van’t Hoff like behavior of these ADC species withinthe applied temperature range. It is important since it enables tostudy the effect of temperature on retention only at two levels andsimplifies the experiments.
Another interesting variable is the mobile phase ternary compo-sition. Fig. 3 shows the impact of organic modifier nature in mobilephase B. Increasing MeOH vs. ACN results in expected increase ofretention. In addition, some differences in selectivity were alsoobserved. However, a drawback of using huge MeOH fraction isthe non-desired adsorption of the ADC species onto the station-ary phase. The sum of peak areas decreases when increasing theMeOH content. At 50% MeOH, only about 30% of total peak area wasobserved, which is not acceptable. The MeOH fraction of mobile
phase B should then, not be larger than 20% to get appropriaterecovery for all peaks.To conclude on the preliminary studies, tG , T, and tC all seem tobe interesting variables to optimize or adjust the separation of ADC

64 S. Fekete et al. / Journal of Pharmaceutical and
F1
sid
3
wdipifv
in the center point of the experimental design. Retention times and
Fpd
ig. 4. Suggested experimental design for 3D retention model (column:50 × 2.1 mm, gradient: 25–50% B at 0.3 mL/min).
pecies in RPLC. However, these 3 parameters can only be tunedn a limited design space, when considering possible recovery andegradation issues.
.2. 3D experimental design and retention model
Based on the preliminary studies, a 3D design (tG × T × tC model)as suggested. The levels (and values) of such an experimentalesign were illustrated on Fig. 4 for a 150 × 2.1 mm column operat-
ng at 0.3 mL/min. Several additional preliminary experiments were
erformed to determine the values of tG for the initial runs rang-ng between 4 and 20 min. For most solutes (including proteins), aactor of three was used between the two set levels of tG , to pro-ide accurate retention modelling (e.g. tG1 = 6 min and tG2 = 18 min).
ig. 5. Model verification in the center point for native Brentuximab vedotin (1) and for
hase “A”: 0.1% TFA in water, “B”: 0.1% TFA in 90% acetonitrile + 10% MeOH. Flow rate: 0.3
etection at 280 nm. “A” corresponds to predicted, while “B” corresponds to experimenta
Biomedical Analysis 137 (2017) 60–69
However, with the ADC subunits analysed in the present study,combining any shorter gradients than 10 min with a longer one(tG > 15 min) resulted in inaccurate retention model. This is proba-bly due to the very high slope of the LSS model (S) for these largeproteins. Finally, it was found that performing tG1 = 10 min andtG2 = 20 min gradients (difference of a factor two) results in accurateretention modelling and enables the precise prediction of retentiontimes for any gradient program (linear and multilinear too and forextrapolated tG such as tG < 10 min).
The experimental data from the twelve experiments wereentered into the modelling software. After processing and check-ing the data accuracy, the retention times of 10 peaks from nativeADC and 14 peaks of reduced ADC were matched in each of thechromatograms by using the PeakMatch module of the DryLab soft-ware. The peak tracking process was based on peak areas. All thedata were automatically transferred into the modelling softwarebut small adjustments for the peak widths were required to getrealistic peak capacity in the simulated chromatograms [39]. Pleasenote, that peak tracking based on peak area was not obvious in thiswork, due to the fact that the sum of the peak areas was expect-edly lower at 75 ◦C vs. 90 ◦C because of the significant on-columnadsorption at lower temperature. Some ADC subunits adsorb moreintensively onto the stationary phase, while for other peaks (e.g.H3 or L0), the adsorption was less critical. Therefore, peak move-ments have to be followed and understood before matching thepeak areas. Manual adjustment may have to be performed.
After building up the retention model, its accuracy was experi-mentally verified. Both native and reduced ADC samples were run
chromatograms were also predicted for this condition. Fig. 5 showsthe predicted and measured chromatograms and the identificationof the 10 and 14 peaks included in the models. As shown in Fig. 5,
reduced Brentuximab vedotin (2). Column: Agilent Advance BioMAb RP C4. MobilemL/min, gradient: 25–50% B in 15 min, temperature: 82.5 ◦C, injected volume: 1 �L,l chromatograms.

S. Fekete et al. / Journal of Pharmaceutical and
Table 1Prediction accuracy in the center point of the experimental design for native bren-tuximab vedotin.
tr experimental (min) tr predicted (min) Differencea % errorb
peak 1 7.575 7.590 −0.01 −0.20peak 2. 7.726 7.740 −0.01 −0.18peak 3 8.016 8.050 −0.03 −0.42peak 4 8.749 8.770 −0.02 −0.24peak 5 8.844 8.870 −0.03 −0.29peak 6 9.149 9.170 −0.02 −0.23peak 7 9.215 9.240 −0.03 −0.27peak 8 10.124 10.140 −0.02 −0.16peak 9 11.507 11.530 −0.02 −0.20peak 10 11.557 11.590 −0.03 −0.28
average −0.02 −0.25
ti%aa
mtccimciptcamanwateSg
aI
TP
a Difference = experimental − predicted.b % error = [(experimental − predicted)/predicted] × 100.
he experimentally observed and predicted chromatograms weren very good agreement. Tables 1 and 2 present the difference and
error of measured and calculated retention times for the nativend reduced ADC, respectively. There was no more than 0.5% error,nd the average error of retention time prediction was below 0.3%.
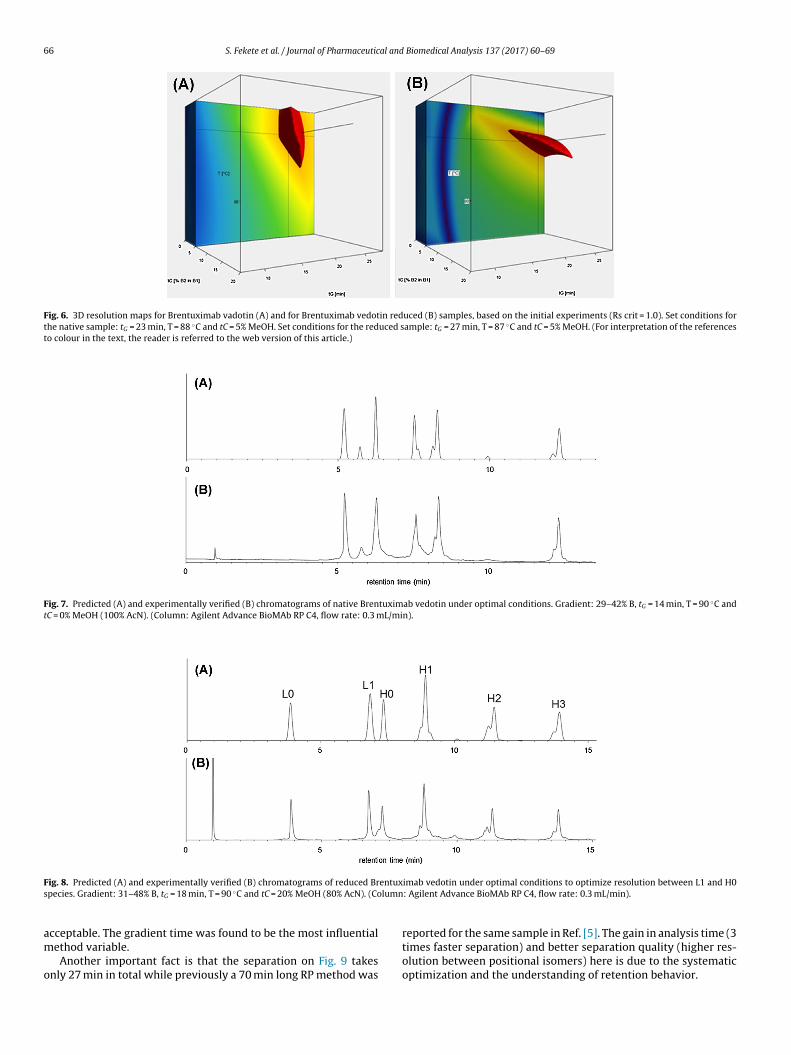
The verification of the model was assessed by creating resolutionaps (Fig. 6). The colour code in these resolution maps represents
he value of the critical resolution (Rs), with warm “red” coloursorresponding to large resolution values (Rs > 1.0) and cold “blue”olours correspond to low resolution values (Rs < 0.3). The visualnspection of the cubes show the largest red region, where the
ethod is probably robust and the resolutions of all peaks in thehromatogram are the best that can be achieved (when using thenitial linear gradient). Based on the resolution cubes, the startingoint of the optimization can easily be selected. Further optimiza-ion can be done by changing the B% of initial and final mobile phaseomposition. After changing the B%, again the effect of temperaturend ternary composition are worth re-studying. After further opti-ization, a gradient from 29 to 42%B, with tG = 14 min at T = 90 ◦C
nd tC = 0% MeOH gave a fast and appropriate separation for theative ADC sample (Fig. 7). The experimental verification of thisorking point again showed high prediction accuracy. The aver-
ge error of retention time prediction was lower than 0.5%. Forhe reduced ADC, the optimal conditions were found as a gradi-nt of 31–48%B, tG = 18 min, T = 90 ◦C and tC = 20% MeOH (Fig. 8).imilarly, the predicted and experimental chromatograms were in
ood agreement (lower than 0.5% error).As illustrated by this example, this generic 3D retention modelnd optimization for cysteine linked ADCs seems to be interesting.t can also be useful for laboratories working under regulated con-
able 2rediction accuracy in the center point of the experimental design for reduced brentuxim
tr experimental (min) tr pred
peak 1 5.868 5.850
peak 2. 7.599 7.610
peak 3 7.729 7.740
peak 4 8.514 8.520
peak 5 8.601 8.600
peak 6 8.718 8.720
peak 7 9.258 9.280
peak 8 9.961 9.960
peak 9 10.031 10.070peak 10 10.148 10.150peak 11 10.297 10.320peak 12 10.711 10.710peak 13 11.543 11.530peak 14 11.592 11.590
average
a Difference = experimental − predicted.b % error = [(experimental − predicted)/predicted] × 100.
Biomedical Analysis 137 (2017) 60–69 65
ditions, since all the possible combinations of method variables canquickly be checked.
The time required for this 12 runs based design and its ver-ification is about 7–8 h for one sample and assuming duplicateinjections (2 × (6 × 10 min + 6 × 20 min + 1 × 15 min) + system equi-libration). Then the understanding of peak movements, peaktracking, importing chromatograms and creating the model takearound 5–6 h. Finally, the optimization and then the experimen-tal verification of the selected working point take an additional2–3 h of work. In total, this optimization approach of ADC speciesseparations in RPLC mode requires 2–3 working days.
3.3. Simulated robustness testing
An interesting feature of DryLab 4 modelling software is its abil-ity to perform an in-depth “modelled” robustness testing [34]. Fromthe design space, as defined in a resolution cube, it is possible to getrobustness information for the measured variables, including tG , Tand tC. The influence of additional parameters, such as flow rateor initial- and final-%B of the gradient, on retention time can bepredicted for all compounds. Consequently, the impact of changesin any of these 6 variables/parameters on the resolution can beassessed using a simulated 26 or 36 type factorial design. Afterdefining the possible deviations from the nominal values, 64 or729 experiments can be virtually performed. At the end, the soft-ware provides a ‘frequency distribution graph’ showing how often(N) a certain critical resolution occurs under any combination ofpossible parameters. On the other hand, ‘regression coefficients’can also be obtained to show the effect of each parameter, relatedto the selected deviation from the nominal value, for the criticalresolution.
This simulated robustness test was performed around a selectedworking point as tG = 27 ± 0.5 min, T = 87 ± 1 ◦C, tC = 5 ± 1% MeOH,flow rate: 0.30 ± 0.05 mL/min, initial%B: 25 ± 1, final%B: 50 ± 1. Thiscondition allowed the best separation of the L1 and H0 peaks (ascritical peak pairs) of the reduced brentuximab vedotin (Fig. 9).The baseline separation of the L0, L1, H0, H1, H2 and H3 species areimportant for the determination of average DAR. The separation ofpositional isomers of a given species (e.g. H1 or H2 have 3 differentpositional isomers) is not mandatory for this purpose. Please note,that the total run time is 27 min but the retention time of the lasteluting peak is below 20 min, thus possible thermal degradation is
not an issue. Performing the 729 virtual experiments showed thatall the experiments met the Rs > 1.5 criterion, thus the conditionsdefined by our selected working point can be considered as robust(Fig. 9C). The lowest observed resolution was Rs = 1.73 which is stillab vedotin.
icted (min) Differencea % errorb
0.02 0.31−0.01 −0.14−0.01 −0.14−0.01 −0.070.00 0.010.00 −0.02−0.02 −0.240.00 0.01
−0.04 −0.39 0.00 −0.02 −0.02 −0.22 0.00 0.01
0.01 0.11 0.00 0.02
−0.01 −0.06
66 S. Fekete et al. / Journal of Pharmaceutical and Biomedical Analysis 137 (2017) 60–69
Fig. 6. 3D resolution maps for Brentuximab vadotin (A) and for Brentuximab vedotin reduced (B) samples, based on the initial experiments (Rs crit = 1.0). Set conditions forthe native sample: tG = 23 min, T = 88 ◦C and tC = 5% MeOH. Set conditions for the reduced sample: tG = 27 min, T = 87 ◦C and tC = 5% MeOH. (For interpretation of the referencesto colour in the text, the reader is referred to the web version of this article.)
Fig. 7. Predicted (A) and experimentally verified (B) chromatograms of native Brentuximab vedotin under optimal conditions. Gradient: 29–42% B, tG = 14 min, T = 90 ◦C andtC = 0% MeOH (100% AcN). (Column: Agilent Advance BioMAb RP C4, flow rate: 0.3 mL/min).
F entuxs lumn
am
o
ig. 8. Predicted (A) and experimentally verified (B) chromatograms of reduced Brpecies. Gradient: 31–48% B, tG = 18 min, T = 90 ◦C and tC = 20% MeOH (80% AcN). (Co
cceptable. The gradient time was found to be the most influentialethod variable.Another important fact is that the separation on Fig. 9 takes
nly 27 min in total while previously a 70 min long RP method was
imab vedotin under optimal conditions to optimize resolution between L1 and H0: Agilent Advance BioMAb RP C4, flow rate: 0.3 mL/min).
reported for the same sample in Ref. [5]. The gain in analysis time (3times faster separation) and better separation quality (higher res-olution between positional isomers) here is due to the systematicoptimization and the understanding of retention behavior.

S. Fekete et al. / Journal of Pharmaceutical and Biomedical Analysis 137 (2017) 60–69 67
Fig. 9. Predicted (A) and experimentally verified (B) chromatograms of reduced Brentuximab vedotin under optimal conditions to optimize resolution between all peaks.Gradient: 25–50% B, tG = 27 min, T = 87 ◦C and tC = 5% MeOH (95% AcN). (Column: Agilent Advance BioMAb RP C4, flow rate: 0.3 mL/min). Panel C represents the result ofsimulated robustness test as number of observations (N) vs. critical resolution (Rs,crit).
Fig. 10. Simplified 2D experimental designs as tG x T model (4 runs) and tG × tC (6 runs) models.
F ased
t vance
3
es
ig. 11. Simplified 2D resolution maps of native (A) and reduced (B) ADC bG2 = 20 min, T1 = 75 ◦C, T2 = 90 ◦C and tC = 0% MeOH (100% AcN). (Column: Agilent Ad
.4. Simplified 2D experimental designs
Obviously, the 3D retention model can be simplified to 2D mod-ls if required (e.g. to gain in time or if 3D retention modellingoftware is not available). One possibility is to select a tG × T model
on four initial experiments (tG × T model). Gradient: 25–50% B, tG1 = 10 min, BioMAb RP C4, flow rate: 0.3 mL/min).
which requires four initial runs, while the other choice is to perform
a tG × tC model which necessitates six experiments (Fig. 10).To perform a tG × T model, ternary mobile phase compositionis not suggested. Since the best recovery was obtained with ACN,the mobile phase B should preferably be 0.1% TFA in ACN as a

68 S. Fekete et al. / Journal of Pharmaceutical and Biomedical Analysis 137 (2017) 60–69
F n six
t vance
fi2srittbo
mbteht
aimtaqp
3
it
iiaaasitw
ig. 12. Simplified 2D resolution maps of native (A) and reduced (B) ADC based oC1 = 0% MeOH, tC2 = 10% MeOH and tC3 = 20% MeOH, T = 90 ◦C. (Column: Agilent Ad
rst choice. The time required for the experiments is only around–3 h (2 × (2 × 10 min + 2 × 20 min) + system equilibration) for oneample (with duplicate injections). Fig. 11 shows the obtained 2Desolution maps for the native and reduced ADC. The blue linesndicate co-elutions (and therefore elution order changes). Sincehe blue lines oriented in both vertical and horizontal directions onhe map, the design space indeed seems to be well selected sinceoth method variables play an important role in the overall qualityf the separation.
Fig. 12 shows the obtained 2D resolution maps for a tG × tCodel. In this case, the temperature should be set as high as possi-
le to avoid recovery issues (e.g. T = 90 ◦C). This experimental designakes around 3–4 h of work (2 × (3 × 10 min + 3 × 20 min) + systemquilibration). The maps again suggest that both variable (tG and tC)ave a huge impact on the critical resolution and therefore makeshis model interesting for routine applications.
Both 2D models provided similar maximum resolution andnalysis time as for an optimal method. If further optimizations required then the tG × T model can be repeated with a ternary
obile phase (e.g. 20% MeOH + 80% ACN as organic solvent) whilehe tG × tC model can be performed again, but at a different temper-ture (e.g. at 80 ◦C). This repeated experiments may perform betteruality of separation. If it is not the case, then the best choice is toerform one of these 2D models on a different stationary phase.
.5. Determination of the average DAR
One method of choice to determine the average DAR of an ADCs based on the observed peak area ratios of RPLC chromatogram ofhe reduced ADC:
DAR = 2x
(1∑
i=0
weighted peak area of L (i)
+3∑
i=0
weighted peak area of H (i)
)/100
Both optimum conditions (presented in Figs. 8 and 9) resultedn DAR = 4.0. This value is in good agreement with those reportedn the literature [6,7,17]. However, it is worth mentioning that theverage DAR was calculated for all the initial runs (at 75 and 90 ◦C),nd we systematically observed larger DAR value (as DAR = 4.2–4.3)t 75 ◦C compared to 90 ◦C (DAR = 4.0). Finally, this is not surprising
ince the poorer recovery of some species results in differencesn pear area% distribution. Logically, the DAR determined at loweremperature is not correct, and therefore attention should be paidhen calculating the average DAR from RPLC chromatograms.initial experiments (tG × tC model). Gradient: 25–50% B, tG1 = 10 min, tG2 = 20 min, BioMAb RP C4, flow rate: 0.3 mL/min).
4. Conclusions
A new 3D retention model was suggested and successfullyapplied in RPLC for IgG1 cysteine conjugated antibody drug con-jugate (ADC). In total, the optimization of this 3D retention modelrequired only 2–3 working days (12 experiments for one sample).In addition to the 3D model, simplified 2D models could also bedone for fast method development which took less than one day(4 or 6 experiments with one sample). Generic (platform) methoddevelopment approach was found to be feasible. The time saving ofthis systematic methodology is obvious compared to trial and errorapproach.
The most important method variables to optimize ADC sepa-ration were the gradient steepness (1), mobile phase temperature(2) and mobile phase ternary composition (3). The retention timeprediction offered by the retention models was found to be highlyaccurate, with an average error lower than 0.5%.
The developed RPLC method can be considered for determiningthe average DAR of an ADC, based on the observed peak area ratiosof the reduced ADC sample. The native ADC separation can also beuseful for multidimensional separations in the second dimension toseparate the positional isomers and different species and enablingthe MS identification.
It also worth mentioning that – by understanding the retentionbehavior of ADC peaks – analysis time could be shortened into the20–25 min range while 60–70 min long separations were reportedpreviously.
Acknowledgements
The authors wish to thank Alain Beck from Pierre Fabre for pro-viding the antibody drug conjugate sample.
Davy Guillarme wishes to thank the Swiss National ScienceFoundation for support through a fellowship to Szabolcs Fekete(31003A 159494).
References
[1] R.V.J. Chari, Targeted cancer therapy: conferring specificity to cytotoxic drugs,Acc. Chem. Res. 41 (2008) 98–107.
[2] S. Ornes, Antribody drug conjugates, Proc. Natl. Acad. Sci. U. S. A. 110 (2013)13695.
[3] A. Wakankar, Y. Chen, Y. Gokarn, F.S. Jacobson, Analytical methods forphysicochemical characterization of antibody drug conjugates, mAbs 3 (2011)161–172.
[4] B. Wiggins, L. Liu-Shin, H. Yamaguchi, G. Ratnaswamy, Characterization ofcysteine-linked conjugation profiles of immunoglobulin G1 and
immunoglobulin G2 antibody–drug conjugates, Pharm. Drug Deliv. Pharm.Tech. 104 (2015) 1362–1372.[5] L.N. Le, J.M. Moore, J. Ouyang, X. Chen, M.D. Nguyen, W.J. Galush, Profilingantibody drug conjugate positional isomers: a system of-equations approach,Anal. Chem. 84 (2012) 7479–7486.

al and
[
[
[
[
[
[
[
[
[
[
[
[
[
[
[
[
[
[
[
[
[
[
[
[
[
[
[
[
[
S. Fekete et al. / Journal of Pharmaceutic
[6] S. Heinisch, M. Sarrut, D. Guillarme, A. Beck, S. Fekete, M.C.J. Bussat, O. Colas,Analysis of antibody-drug conjugates by comprehensive on-linetwo-dimensional hydrophobic interaction chromatography x reversed phaseliquid chromatography hyphenated to high resolution mass spectrometry. II –identification of sub-units for the characterization of even and odd load drugspecies, J. Chromatogr. B 1032 (2016) 91–102.
[7] M. Sarrut, A. Corgier, S. Fekete, D. Guillarme, D. Lascoux, M.C.J. Bussat, A. Beck,S. Heinisch, Analysis of antibody-drug conjugates by comprehensive on-linetwo-dimensional hydrophobic interaction chromatography x reversed phaseliquid chromatography hyphenated to high resolution mass spectrometry. I –optimization of conditions, J. Chromatogr. B 1032 (2016) 103–111.
[8] B.C. Laguzza, C.L. Nichols, S.L. Briggs, G.J. Cullinan, D.A. Johnson, J.J. Starling,New antitumor monoclonal antibody-vinca conjugates LY203725 and relatedcompounds: design, preparation and representative in vivo activity, J. Med.Chem. 32 (1989) 548–555.
[9] R.V. Chari, B.A. Martell, J.L. Gross, S.B. Cook, S.A. Shah, W.A. Blattler,Immunoconjugates containing novel maytansinoids: promising anticancerdrugs, Cancer Res. 52 (1992) 27–31.
10] F. Hudecz, M.C. Garnett, T. Khan, R.W. Baldwin, The influence of syntheticconditions on the stability of methotrexate-monoclonal antibody conjugatesdetermined by reversed phase high performance liquid chromatography,Biomed. Chromatogr. 6 (1992) 128–132.
11] R.V. Chari, K.A. Jackel, L.A. Bourret, S.M. Derr, B.M. Tadayoni, K.M. Mattocks,Enhancement of the selectivity and antitumor efficacy of a CC-1065 analoguethrough immunoconjugate formation, Cancer Res. 55 (1995) 4079–4084.
12] R.S. Greenfield, T. Kaneko, A. Daues, M.A. Edson, K.A. Fitzgerald, L.J. Olech,Evaluation in vitro of adriamycin immunoconjugates synthesized using anacid-sensitive hydrazone linker, Cancer Res. 50 (1990) 6600–6607.
13] D. Willner, P.A. Trail, S.J. Hofstead, H.D. King, S.J. Lasch, G.R. Braslawsky,(6-maleimidocaproyl)hydrazone of doxorubicin, a new derivative for thepreparation of immunoconjugates of doxorubicin, Bioconjugate Chem. 4(1993) 521–527.
14] M.M. Sun, K.S. Beam, C.G. Cerveny, K.J. Hamblett, R.S. Blackmore, M.Y. Torgov,Reduction-alkylation strategies for the modification of specific monoclonalantibody disulfides, Bioconjugate. Chem. 16 (2005) 1282–1290.
15] C.F. McDonagh, E. Turcott, L. Westendorf, J.B. Webster, S.C. Alley, K. Kim,Engineered antibody-drug conjugates with defined sites and stoichiometriesof drug attachment, Protein Eng. Des. Sel. 19 (2006) 299–307.
16] K.J. Hamblett, P.D. Senter, D.F. Chace, M.M. Sun, J. Lenox, C.G. Cerveny, Effectsof drug loading on the antitumor activity of a monoclonal antibody drugconjugate, Clin. Cancer Res. 10 (2004) 7063–7070.
17] B. Bobaly, A. Beck, J.L. Veuthey, D. Guillarme, S. Fekete, Impact of organicmodifier and temperature on protein denaturation in hydrophobicinteraction chromatography, J. Pharm. Biomed. Anal. 131 (2016) 124–132.
18] S. Fekete, J.L. Veuthey, A. Beck, D. Guillarme, Hydrophobic interactionchromatography for the characterization of monoclonal antibodies andrelated products, J. Pharm. Biomed. Anal. 130 (2016) 3–18.
19] A. Cusumano, D. Guillarme, A. Beck, S. Fekete, Practical method developmentfor the separation of monoclonal antibodies and antibody-drug-conjugatespecies in hydrophobic interaction chromatoraphy, part 2: optimization ofthe phase system, J. Pharm. Biomed. Anal. 121 (2016) 161–173.
20] M.M. Siegel, I.J. Hollander, P.R. Hamann, J.P. James, L. Hinman, B.J. Smith,Matrix-assisted UV-laser desorption/ionization mass spectrometric analysisof monoclonal antibodies for the determination of carbohydrate, conjugated
chelator and conjugated drug content, Anal. Chem. 63 (1991) 2470–2481.21] J.R. Junutula, K.M. Flagella, R.A. Graham, K.L. Parsons, E. Ha, H. Raab,Engineered thio-trastuzumab-DM1 conjugate with an improved therapeuticindex to target human epidermal growth factor receptor 2-positive breastcancer, Clin. Cancer Res. 16 (2010) 4769–4778.
[
Biomedical Analysis 137 (2017) 60–69 69
22] L. Wang, G. Amphlett, W.A. Blattler, J.M. Lambert, W. Zhang, Structuralcharacterization of the maytansinoid-monoclonal antibody immunoconjugatehuN901-DM1, by mass spectrometry, Protein Sci. 14 (2005) 2436–2446.
23] A.C. Lazar, L. Wang, W.A. Blattler, G. Amphlett, J.M. Lambert, W. Zhang,Analysis of the composition of immunoconjugates using size-exclusionchromatography coupled to mass spectrometry, Rapid Commun. MassSpectrom. 19 (2005) 1806–1814.
24] M.C. Janin Bussat, M. Dillenbourg, N. Corvaia, A. Beck, C. Klinguer-Hamour,Characterization of antibody drug conjugate positional isomers at cysteineresidues by peptide mapping LC–MS analysis, J. Chromatogr. B 981–982(2015) 9–13.
25] T. Chen, Y. Chen, C. Stella, C.D. Medley, J.A. Gruenhagen, K. Zhang,Antibody-drug conjugate characterization by chromatographicandelectrophoretic techniques, J. Chromatogr. B 1032 (2016) 39–50.
26] S. Fekete, S. Rudaz, J. Fekete, D. Guillarme, Analysis of recombinantmonoclonal antibodies by RPLC: towards a generic method developmentapproach, J. Pharm. Biomed. Anal. 70 (2012) 158–168.
27] S. Fekete, S. Rudaz, J.L. Veuthey, D. Guillarme, Impact of mobile phasetemperature on recovery and stability of monoclonal antibodies using recentreversed-phase stationary phases, J. Sep. Sci. 35 (2012) 3113–3123.
28] J.A. Lewis, L.R. Snyder, J.W. Dolan, Initial experiments in high-performanceliquid chromatographic method development II. Recommended approach andconditions for isocratic separation, J. Chromatogr. A 721 (1996) 15–29.
29] J.W. Dolan, L.R. Snyder, N.M. Djordjevic, D.W. Hill, D.L. Saunders, L. VanHeukelem, T.J. Waeghe, Simultaneous variation of temperature and gradientsteepness for reversed-phase high-performance liquid chromatographymethod development: I. Application to 14 different samples using computersimulation, J. Chromatogr. A 803 (1998) 1–31.
30] L.R. Snyder, J.J. Kirkland, J.L. Glajch, Practical HPLC Method Development,second ed., John Wiley & Sons Inc., 1997.
31] J.C. Berridge, Techniques for the Automated Optimization of HPLCSeparations, John Wiley & Sons, New York, 1986.
32] R. Kormány, I. Molnár, H.J. Rieger, Exploring better column selectivity choicesin ultra-high performance liquid chromatography using Quality by Designprinciples, J. Pharm. Biomed. Anal. 80 (2013) 79–88.
33] N. Rácz, R. Kormány, J. Fekete, I. Molnár, Establishing column batchrepeatability according to Quality by Design (QbD) principles using modelingsoftware, J. Pharm. Biomed. Anal. 108 (2015) 1–10.
34] R. Kormány, J. Fekete, D. Guillarme, S. Fekete, Reliability of simulatedrobustness testing in fast liquid chromatography using state-of-the-artcolumn technology, instrumentation and modelling software, J. Pharm.Biomed. Anal. 89 (2014) 67–75.
35] Y. Chen, C.T. Mant, R.S. Hodges, Temperature selectivity effects inreversed-phase liquid chromatography due to conformation differencesbetween helical and non-helical peptides, J. Chromatogr. A 1010 (2003)45–61.
36] C.T. Mant, Y. Chen, R.S. Hodges, Temperature profiling of polypeptides inreversed-phase liquid chromatography: I. Monitoring of dimerization andunfolding of amphipathic �-helical peptides, J. Chromatogr. A 1009 (2003)29–43.
37] C.T. Mant, B. Tripet, R.S. Hodges, Temperature profiling of polypeptides inreversed-phase liquid chromatography: II. Monitoring of folding and stabilityof two-stranded �-helical coiled-coils, J. Chromatogr. A 1009 (2003) 45–59.
38] S. Fekete, A. Beck, E. Wagner, K. Vuignier, D. Guillarme, Adsorption andrecovery issues of recombinant monoclonal antibodies in reversed-phase
liquid chromatography, J. Sep. Sci. 38 (2015) 1–8.39] A.H. Schmidt, I. Molnár, Using an innovative Quality-by-Design approach fordevelopment of a stability indicating UHPLC method for ebastine in the APIand pharmaceutical formulations, J. Pharm. Biomed. Anal. 78-79 (2013)65–74.