journal of oil, gas and alternative energy sources a ... · do fracturamiento hidráulico como...
TRANSCRIPT

A SELECTION METHODOLOGY OF FLOWBACK TREATMENT TECHNOLOGIES AND WATER REUSE IN HYDRAULIC FRACTURING IN SOURCE
ROCKS – A STRATEGY TO REDUCE THE ENVIRONMENTAL IMPACTS IN COLOMBIA
CT&F - Ciencia, Tecnología y Futuro - Vol. 7 Num. 1 Dec. 2017 5
A SELECTION METHODOLOGY OF FLOWBACK TREATMENT TECHNOLOGIES AND WATER REUSE
IN HYDRAULIC FRACTURING IN SOURCE ROCKS – A STRATEGY TO REDUCE THE ENVIRONMENTAL IMPACTS
IN COLOMBIA
*To whom correspondence should be sent
CT&F - Ciencia, Tecnología y Futuro - Vol. 7 Num. 1 Dec. 2017 Pag. 5 - 30
The development of unconventional reservoirs (source rocks) around the world in the last years intensi-fied the use of hydraulic fracturing as stimulation technique in the petroleum industry. Nevertheless, the amount of water used for its execution, the legal restrictions implemented in certain regions for
the application of this technology and the possible environmental impact generated, are issues to take into account. In that way, petroleum industry has begun the implementation of technologies for post-frac flowback treatment of these kinds of reservoirs with the aim of converting those waste volumes into an important asset for recurrent hydraulic fracturing operations.
The water cycle into these operations begins with the capture of this resource at surface and then, it is mix-ing with chemicals and proppant to generate the fracturing fluid, which is pumped to the well to create the fractures in the target formation. Once the well starts producing, a fraction of the water injected during the fracturing operation along with formation water, are back produced to surface and finally treated or injected through disposal wells.
Given that in Colombia the development of unconventional reservoirs is on its very preliminary phase, there are no studies related to the flowback treatment, which is a sensitive issue in making decisions to develop this energy resource in the country. Hence, this research proposes a methodology for selecting technically technologies suitable for flowback treatment in unconventional reservoirs in Colombia. A review of technical parameters and experiences in a real scale of different technologies, a sensitivity analysis of four water stability indexes, a correlation between flowback physical chemical parameters of a geological formation similar to Colombian geological formation and an economic analysis are presented. The best option always arises from the higher operational efficiency at the lowest cost.
ABSTRACT
How to cite: Aranguren-Campos, Fabian, A., Calderón-Carrillo, Zuly., Usuriaga-Torres, José,M. (2017). A selection methodology of Flowback treatment technologies and Water reuse in Hydraulic Fracturing in source rocks – A strategy to reduce the Environmental Impacts in Colombia. CT&F- Ciencia, Tecnología y Futuro, 7(1), 5-30.
METODOLOGÍA SELECTIVA DE TECNOLOGÍAS PARA EL TRATAMIENTO DE FLUIDOS DE RETORNO POST-FRACTURA Y REÚSO DE AGUA EN EL FRACTURAMIENTO HIDRÁULICO EN YACIMIENTOS EN ROCA GENERADORA – UNA ESTRATEGIA PARA REDUCIR LOS IMPACTOS
AMBIENTALES EN COLOMBIA
METODOLOGIA SELECTIVA DE TECNOLOGIAS PARA O TRATAMENTO DE FLUIDOS DE RETORNO POST-FRACTURA E REUTILIZAÇÃO DE ÁGUA NA FRACTURAÇÃO
HIDRÁULICA EM ROCHA DE ORIGEM - UMA ESTRATÉGIA PARA REDUZIR IMPACTOS AMBIENTAIS NA COLÔMBIA
ISSN (Print) 0122-5383ISSN (Online) 2382-4581
Journal of oil, gas and alternative energy sources
Keywords: Flowback, Treatment, Unconventional reservoirs, Hydraulic fracturing, La Luna, Eagle Ford.
Fabian-Alexis Aranguren-Campos 1, Zuly Calderón-Carrillo1 and José-Manuel Usuriaga-Torres2*1 Universidad Industrial de Santander, Bucaramanga, Santander, Colombia
2 Ecopetrol S.A – Instituto Colombiano del Petróleo, Bucaramanga, Santander, Colombia
e-mail: [email protected]
(Received: Apr. 06, 2016; Accepted: Sept. 29, 2017)

CT&F - Ciencia, Tecnología y Futuro - Vol. 7 Num. 1 Dec. 2017
FABIAN-ALEXIS ARANGUREN-CAMPOS et al.
6
O desenvolvimento de jazidas não convencionais (rocha de origem) à escala mundial intensificou o uso do fracturamiento hidráulico como técnica de estimulação na indústria petrolífera. Não obstante, a grande quantidade de água utilizada para sua execução, as restrições legais implementadas em
várias regiões para uso da população e o possível impacto gerado no ambiente, são aspectos importantes para levar em mente. Neste sentido, há algum tempo, a indústria petrolífera iniciou a implementação de tecnologias para tratar o água de retorno derivado dessas jazidas, com o intuito de transformar estes volumes residuais em ativos de importância, em estágios subsequentes de fracturamiento.
O ciclo de água dentro destas operações inicia com a captação deste recurso em corpos superficiais, sendo misturada a seguir com os aditivos químicos e o material propante para gerar o fluido de fratura, que depois é bombeado ao poço para gerar as fraturas na formação de interesse. Depois do poço ter sido colocado em produção, parte da água injetada com o fluido, somada a uma porção da água de formação retornam à superfície, para serem tratada ou injetadas em poços de eliminação.
No caso da Colômbia, onde o desenvolvimento deste tipo de jazidas se encontra na fase inicial, não há estudos relacionados com o tratamento do flowback, assunto sensível na tomada de decisões para desenvolver esta fonte energética no país. Tendo em conta o que precede, este trabalho de pesquisa propõe uma metodologia para selecionar a (s) tecnologias (s) que podem tratar eficientemente o água de retorno em jazidas não convencionais na Colômbia, que inclui a revisão dos parâmetros técnicos e as experiências à escala real de cada tecnologia, as análises de sensibilidade de quatro índices de estabilidade da água, a correlação das características fisioquímicas do água de retorno de uma formação estrangeira similar a uma formação colombiana e a análise econômica das tecnologias selecionadas. A melhor opção surge da mais alta eficiência operacional ao menor custo possível.
E l desarrollo de yacimientos no convencionales (roca generadora) a nivel mundial intensificó el uso del fracturamiento hidráulico como técnica de estimulación en la industria petrolera. No obstante, la cantidad de agua requerida para su ejecución, las restricciones legales implementadas en ciertas
regiones para la aplicación de esta tecnología y el posible impacto generado en el ambiente, son aspectos relevantes a tener en cuenta. En este sentido, la industria petrolera inició hace algunos años la implementación de tecnologías que permitan tratar el agua de retorno proveniente de estos yacimientos, con la finalidad de convertir estos volúmenes residuales en activos de importancia, en posteriores etapas de fracturamiento.
El ciclo del agua dentro de estas operaciones inicia con la captación de este recurso en cuerpos superficiales, a continuación es mezclada con los aditivos químicos y el material propante para generar el fluido de fractura, que posteriormente es bombeado al pozo para generar las fracturas en la formación de interés. Luego que el pozo se ha puesto en producción, parte del agua inyectada con el fluido, sumada a una parte del agua de formación retornan a superficie, en donde son luego tratadas o inyectadas en pozos de disposición. Para el caso de Colombia donde el desarrollo de este tipo de yacimientos se encuentra en su etapa inicial, no se dispone de estudios relacionados con el tratamiento del agua de retorno, tema sensible en la toma de decisiones para desarrollar esta fuente energética en el país. En función de lo anterior, el presente trabajo de investigación propone una metodología para seleccionar la(s) tecnología(s) que pueden tratar de manera eficiente el agua de retorno en yacimientos no convencionales en Colombia, la cual incluye la revisión de los parámetros técnicos y las experiencias a escala real de cada tecnología, los análisis de sensibilidad de cuatro índices de estabilidad del agua, la correlación de las características fisicoquímicas del agua de retorno de una formación extranjera similar a una formación colombiana y el análisis económico de las tecnologías seleccionadas. La mejor opción surge de la más alta eficiencia operacional al menor costo posible.
Palabras clave: Aguas de retorno, tratamiento, yacimientos no convencionales, fracturamiento hidráulico, La Luna, Eagle Ford.
Palavras-chave: Água de retorno, Tratamento, Jazidas não convencionais, Fracturamento hidráulico, La Luna, Eagle Ford.
RESUMEN
RESUMO
A SELECTION METHODOLOGY OF FLOWBACK TREATMENT TECHNOLOGIES AND WATER REUSE IN HYDRAULIC FRACTURING IN SOURCE
ROCKS – A STRATEGY TO REDUCE THE ENVIRONMENTAL IMPACTS IN COLOMBIA
CT&F - Ciencia, Tecnología y Futuro - Vol. 7 Num. 1 Dec. 2017 7
1. INTRODUCTION
Non-conventional reservoirs (YNC as per its Spanish acronym) propose a new energetic perspective focussed on worldwide energy self-sufficiency; this is achieved through the optimization and massification of the extraction of resources such as Shale Oil and Shale Gas. These type of oil reservoirs have very particular characteristics, making them very difficult prospects to manage. These source rocks contain significant amounts of organic matter in the form of kerogen, showing a low to ultra-low permeability. Hydraulic Fracturing is required to obtain these non-conventional resources; their main objective is the enhancement of the hydrocarbons flow through the creation of the fracture in the formation, connecting the reservoir with the well. (Nolen-Hoeksema, 2013).
To develop shale oil & gas resources in Colombia is necessary overcome several challenges, especially environmental issues, mainly the related to water consumption required for the hydraulic fracturing process and the flowback water management. Hydraulic fracturing in shale reservoirs demand greater amounts of water with respect to the hydraulic fracturing in sandstone reservoirs.
The implementation of technologies for the optimization of stimulation process has been much needed for the oil industry. Therefore in recent years a number of facilities have been set up allowing the transformation of those residual water volumes into fundamental constituents of fracture fluids to be used at later stages. Discussed methodology in this research work will allow to select the more appropriate technology (ies) for the treatment of returned waters in any non-conventional reservoirs in Colombia, taken into account the experience in efficiency and the cost of average treatments in the more important Shale plays of the United States.
2. THEORICAL FRAME
Hydraulic Fracturing OverviewHydraulic Fracturing is a well stimulation technic
starting its industrial use in 1949; it was also used for the enhanced hydrocarbon recovery (Gandosi, 2013). The hydrocarbon production of source rocks is more
complicated than reservoirs rocks. The gas and oil remain motionless into the rocks due to low porosity and permeability of source rocks that is why it’s necessary to drill horizontally along the formation and then performing a multi-stage hydraulic fracturing process. The hydraulic fracturing process involves injecting a mixture of water, proppant and some chemicals at high pressure to fracture the rock. The proppant placed into the rock serves to keep fracture open, so that the hydrocarbon can flow to the surface when the wells start their production life span.
Fracturing FluidWater is a very important element for most of the
hydraulic fracturing treatments; it represents 95% of the fluid components. On the other hand, the proppant is other important material. It is about granular particles, such as natural sand or ceramic, which is mixed with the fracturing fluid, and its mission is to keep the fracture open when fracturing operation is over and the pressure released, keeping the desired conductivity of the fracture during the production life of the well (Trombetta, 2012). There are several fracturing fluid types; the more common are the slickwater, linear gels and cross-linked fluids; though it is possible to find gas assisted and hybrid fluids. Different to assisted fluids, the remaining fracturing fluids mainly contain water (approx. 95% in volume), proppant (approx. 4%) and the remaining 1% of the volume is composed of a number of additives (chemicals).
Technology for the flowback treatmentThe returned post-frac water (flowback) represents
the higher volume of residual fluid for the oil industry. Published figures in 2007 showed that at worldwide level, between 11,1 and 15,9 million of cubic meters of water were generated (Dores, Hussain, Katebah & Adham, 2012). Besides, for the year 2009 some 3,3 trillion m3 of returned water were produced in the United States (Argone National Laboratory, 2009).
There are a number of technologies for the flowback treatment that could be classified in several ways; the most common is linked to the science of carrying the treatment out. There are three important groups for this type of classification. It is important to take into account that some technologies are part of a specific group and others coincide with the overlapping of two or more types of treatment (Ely, J., Horn, A., Cathey, R., Fraim, M. & Jakhete, S., 2011).

CT&F - Ciencia, Tecnología y Futuro - Vol. 7 Num. 1 Dec. 2017
FABIAN-ALEXIS ARANGUREN-CAMPOS et al.
8
Physical treatmentsThese types of treatments are based upon the
filtration principle, seeing as the physical remotion of particles by size. Separation might be passive (leaving gravity and/or volumetric flow to do the job), or active (where the energy is used to exert pressure and strength upon the water through the filter or membrane stopping contaminants) (Pierce, Bertrand & Cretiu Vasiliu, 2010). Limitations of this treatment process are mainly linked to the following aspects: membrane manufacturing costs, components linked to the system (spares), continuous contamination of the membrane and the energy requirements to generate the right pressure for the remotion of contaminants. In this way the process is commonly used with feeding currents with concentrations of TDS between 500 and 50 000 ppm.
Among the treatments, the Reverse Osmosis is worth mentioning as the more implemented technology in the oil industry due to its large contaminant remotion capacity (monovalent, divalent and polyvalent ions,
amongst others). This can be applied at an approximate rate of 1 000 m3/day. Generally speaking, dense and selective membranes can be used, capable to retain components as small as 0,0001 μm. This process could be efficient for the elimination of sand, lime, slurry, algae, protozoa (5 to 15 μm), bacteria (0.4 to 30 μm), virus (0.004 to 6 μm), humid acids, organic and inorganic chemical products, aqueous salts and metallic and non-metallic ions). The membranes are designed to achieve remotion of the NaCl excess up to 90% (Valero, 2013).
The main cause for failure of the Reverse Osmosis is the contamination of the membrane including deposits of different types of fouling organisms in the surface. The more common contaminants are inorganic contaminants (scales, for example calcium carbonate, sulphates of calcium, siliceous and other species exceeding the saturation index) (Valero,2013), the colloidal contamination (to be typically found via mechanic filtration), biologic contamination and organic contaminants (Zibrid, Amjad, Zuhl & Lewis, 2000).
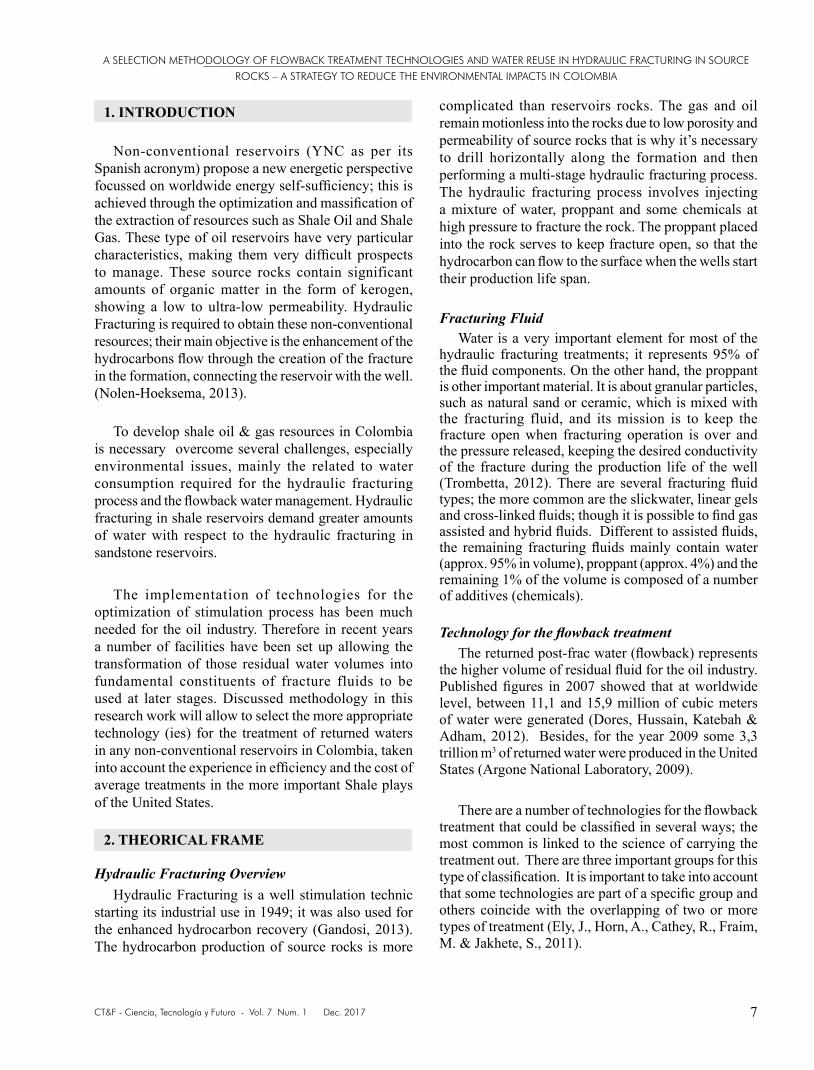
Figure1. Technologies for the treatment of flowback
Notation: NF: Nanofiltration UF: Ultrafiltration, MF: Microfiltration, RO: Reverse Osmosis, MSF: Multi-stage flash distillation, MED: Multi-effect distillation, DV: Dewvaporation, MVC: Steam mechanic compression, FTE: Freeze thaw evaporation. AOP: Advanced oxidation processes.
Physical Thermal Chemical
Treatmenttechnologies
Particles Membranes
NF,UF, MF,RO
Emergents
MSF
MED
MVC
FTE
DV
Liquids
Ion exchange
AOP
A SELECTION METHODOLOGY OF FLOWBACK TREATMENT TECHNOLOGIES AND WATER REUSE IN HYDRAULIC FRACTURING IN SOURCE
ROCKS – A STRATEGY TO REDUCE THE ENVIRONMENTAL IMPACTS IN COLOMBIA
CT&F - Ciencia, Tecnología y Futuro - Vol. 7 Num. 1 Dec. 2017 9
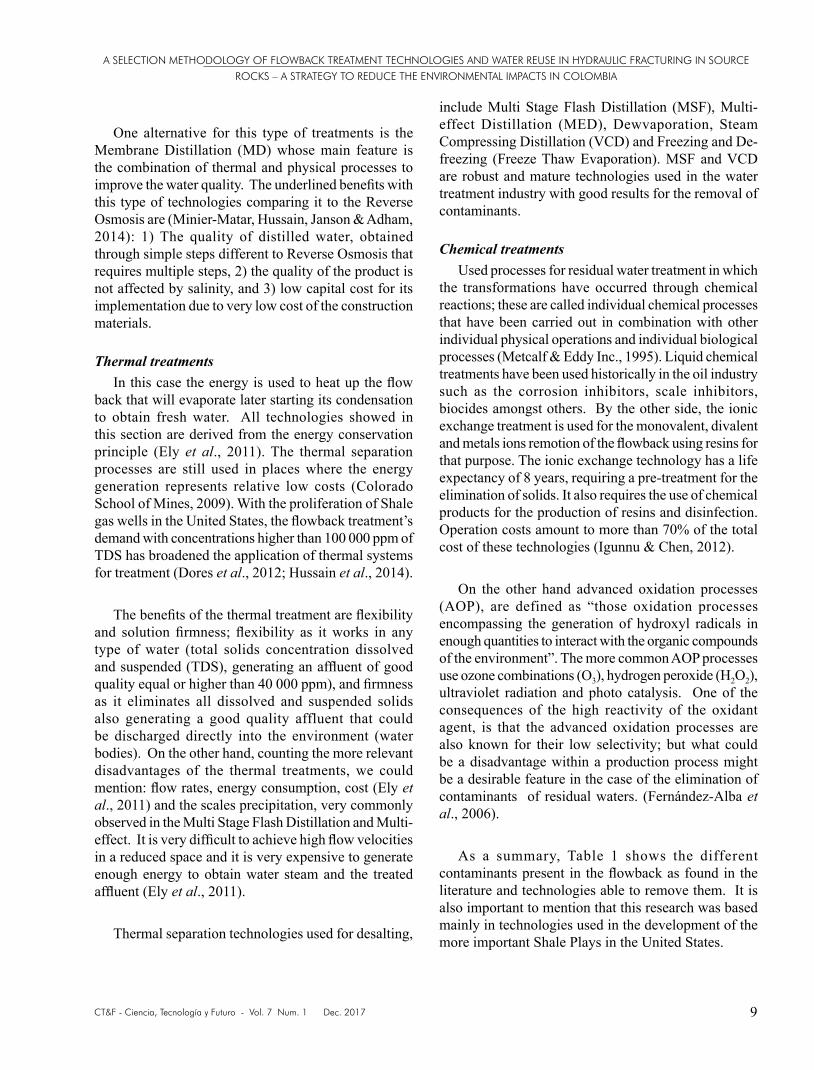
One alternative for this type of treatments is the Membrane Distillation (MD) whose main feature is the combination of thermal and physical processes to improve the water quality. The underlined benefits with this type of technologies comparing it to the Reverse Osmosis are (Minier-Matar, Hussain, Janson & Adham, 2014): 1) The quality of distilled water, obtained through simple steps different to Reverse Osmosis that requires multiple steps, 2) the quality of the product is not affected by salinity, and 3) low capital cost for its implementation due to very low cost of the construction materials.
Thermal treatmentsIn this case the energy is used to heat up the flow
back that will evaporate later starting its condensation to obtain fresh water. All technologies showed in this section are derived from the energy conservation principle (Ely et al., 2011). The thermal separation processes are still used in places where the energy generation represents relative low costs (Colorado School of Mines, 2009). With the proliferation of Shale gas wells in the United States, the flowback treatment’s demand with concentrations higher than 100 000 ppm of TDS has broadened the application of thermal systems for treatment (Dores et al., 2012; Hussain et al., 2014).
The benefits of the thermal treatment are flexibility and solution firmness; flexibility as it works in any type of water (total solids concentration dissolved and suspended (TDS), generating an affluent of good quality equal or higher than 40 000 ppm), and firmness as it eliminates all dissolved and suspended solids also generating a good quality affluent that could be discharged directly into the environment (water bodies). On the other hand, counting the more relevant disadvantages of the thermal treatments, we could mention: flow rates, energy consumption, cost (Ely et al., 2011) and the scales precipitation, very commonly observed in the Multi Stage Flash Distillation and Multi-effect. It is very difficult to achieve high flow velocities in a reduced space and it is very expensive to generate enough energy to obtain water steam and the treated affluent (Ely et al., 2011).
Thermal separation technologies used for desalting,
include Multi Stage Flash Distillation (MSF), Multi-effect Distillation (MED), Dewvaporation, Steam Compressing Distillation (VCD) and Freezing and De-freezing (Freeze Thaw Evaporation). MSF and VCD are robust and mature technologies used in the water treatment industry with good results for the removal of contaminants.
Chemical treatmentsUsed processes for residual water treatment in which
the transformations have occurred through chemical reactions; these are called individual chemical processes that have been carried out in combination with other individual physical operations and individual biological processes (Metcalf & Eddy Inc., 1995). Liquid chemical treatments have been used historically in the oil industry such as the corrosion inhibitors, scale inhibitors, biocides amongst others. By the other side, the ionic exchange treatment is used for the monovalent, divalent and metals ions remotion of the flowback using resins for that purpose. The ionic exchange technology has a life expectancy of 8 years, requiring a pre-treatment for the elimination of solids. It also requires the use of chemical products for the production of resins and disinfection. Operation costs amount to more than 70% of the total cost of these technologies (Igunnu & Chen, 2012).
On the other hand advanced oxidation processes (AOP), are defined as “those oxidation processes encompassing the generation of hydroxyl radicals in enough quantities to interact with the organic compounds of the environment”. The more common AOP processes use ozone combinations (O3), hydrogen peroxide (H2O2), ultraviolet radiation and photo catalysis. One of the consequences of the high reactivity of the oxidant agent, is that the advanced oxidation processes are also known for their low selectivity; but what could be a disadvantage within a production process might be a desirable feature in the case of the elimination of contaminants of residual waters. (Fernández-Alba et al., 2006).
As a summary, Table 1 shows the different contaminants present in the flowback as found in the literature and technologies able to remove them. It is also important to mention that this research was based mainly in technologies used in the development of the more important Shale Plays in the United States.

CT&F - Ciencia, Tecnología y Futuro - Vol. 7 Num. 1 Dec. 2017
FABIAN-ALEXIS ARANGUREN-CAMPOS et al.
10
Table 1. Summary of flowback treatment technologies.
API separator
Deep bed filter
Hydrociclon
Induced gas flotation
Sedimentation and aeration
Softening by precipitation
Sand filtration
Treatment by UV
Activated carbon
Biologic treatment
Chemical addition
Flocculation/Coagulation
Absorption
Ionic Exchange
Ozonisation
Advanced Oxidation
Electrocoagulation
Membranes of the bioreactor
Reverse Osmosis
Direct Osmosis
Ultrafiltration
Nano filtration
Membrane Distillation
Freeze Thaw Evaporation
Multi Stage Flash
Multi Flash effect
Dewvaporation
MVC (Steam Mechanic Compression)
MVR (Steam Mechanic Recompression).
Electrodialisis
Crystallization
Distillation
•
•
•
•
•
•
•
•
•
•
•
•
•
•
•
•
•
•
•
•
•
•
•
•
•
•
•
•
•(2)
•
•
•
•
•
•
•
•
•
•
•
•
•
•
•
•
•
•
•
•
•
•
•
•
•
•
•
•
•
•
•
•
•
•
•
•
•
•
•
•(4)
•(5)
•(3)
•(1)
•(1)
•
•
•
•
Broad range
500
Low
Broad range
500-5000
< 10 000
< 30 000
20 000-47 000
500-70 000
1 000-25 000
1 000-25 000
500-70 000
> 40 000
40 000
Broad range
> 60 000
> 40 000
80 000-100 000
> 80 000
> 50 000
40 000-45 000
Treatment Process
Ope
ratio
n ra
nge
TDS
(ppm
).
Oil
extra
ctio
n
Susp
ende
d so
lids
rem
otio
n
Man
gane
sium
Rem
otio
n
Rem
otio
n/ S
ofte
ning
Ca
and
Mg
Org
anic
Sol
uble
Rem
otio
n
Org
anic
trac
es re
mot
ion
Des
altin
g
SAR
adju
stm
ent
(Sod
ium
abs
orpt
ion
ratio
)
BOD
CO
D
Silic
ate
and
boro
n re
mot
ion
Amm
oniu
m
Hea
vy M
etal
s
BTEX
Iron
Rem
otio
n
Source: (Colorado School of Mines, 2009; Hussain et al., 2014; Metcalf & Eddy Inc., 1995; Igunnu & Chen, 2012; Fernández – Alba, 2006; Shaffer et al., 2013; Guadlip & Paugh, 2008; Pierce et al., 2010; HE et al., 2014; Platt, Burnett, Eboagwu & Vavra, 2011; Lee & Frankiewicz, 2005; Webb et al., 2009; Minier-Matar, Hussain, Janson & Adham, 2014; Winter, Koschikowski, & Wieghaus, 2011; Jude, 2006; Peeters, & Theodoulou, 2005; Janson et al., 2014; Altela Inc., 2006; Bahar, Hawlader & Woei, 2014; Darwish, 1998; Boysen, 2007; Boysen et al., 1999; Horner, Halldorson & Slutz, 2011; Ortiz, 2013; Arnold & Stewart, 2008; Veil, 2011; Ramalho, 1990; Letterman, 1999; Forero, Ortiz & Rios, 2005; Sarria et al., 2005; Ma & Wang, 1998; Arango, 2005; Guohua, 2004; Holt, Barton & Mitchell, 2005) (1) Remotion 8%, (2) Remotion >99% of MgSO4; Moderated remotion of other ores (<90%), (3) Remotion (60%-80%, 4) Less than 50% remotion, (5) Boron Remotion.
A SELECTION METHODOLOGY OF FLOWBACK TREATMENT TECHNOLOGIES AND WATER REUSE IN HYDRAULIC FRACTURING IN SOURCE
ROCKS – A STRATEGY TO REDUCE THE ENVIRONMENTAL IMPACTS IN COLOMBIA
CT&F - Ciencia, Tecnología y Futuro - Vol. 7 Num. 1 Dec. 2017 11
The current situation of the oil industry mandates the optimization of the diverse resources. As one of the residues of larger magnitude, the flowback has been re-used to decrease the environment and social impact up to a point, generated by the capture of water within neighbouring communities where hydraulic fracturing activities take place. To achieve this, diverse type of technologies have been implemented and researched to obtain the best possible effect from this residual volume; such is the case of technologies for physical treatment. In spite of its usefulness and evolution within the last years, it is important to identify its major disadvantages such as the previous treatment absorbed by the flowback and the cost of spares; these might be important parameters in the selection of this type of technologies.
Other thermal treatments could be considered as potential options, as these are applicable where other types of technologies could be more expensive to implement. The result of these types of processes is a good one, as these contaminants are almost fully eliminated. Even though, the energy consumption becomes an important practical challenge. On their side, some other technologies for chemical treatment have been also used within the industry such as the corrosion inhibitors. Apart from it some other configurations have come up, such as the AOP under development, and from which promising results have been obtained. It is also important to highlight that there are combinations between the types of treatments, such as the membrane distillation and the membranes bio-reactors as other alternatives for the treatment of returned waters.
3. EXPERIMENTAL DEVELOPMENT
Methodology for the selection of technologies for the flowback treatment.
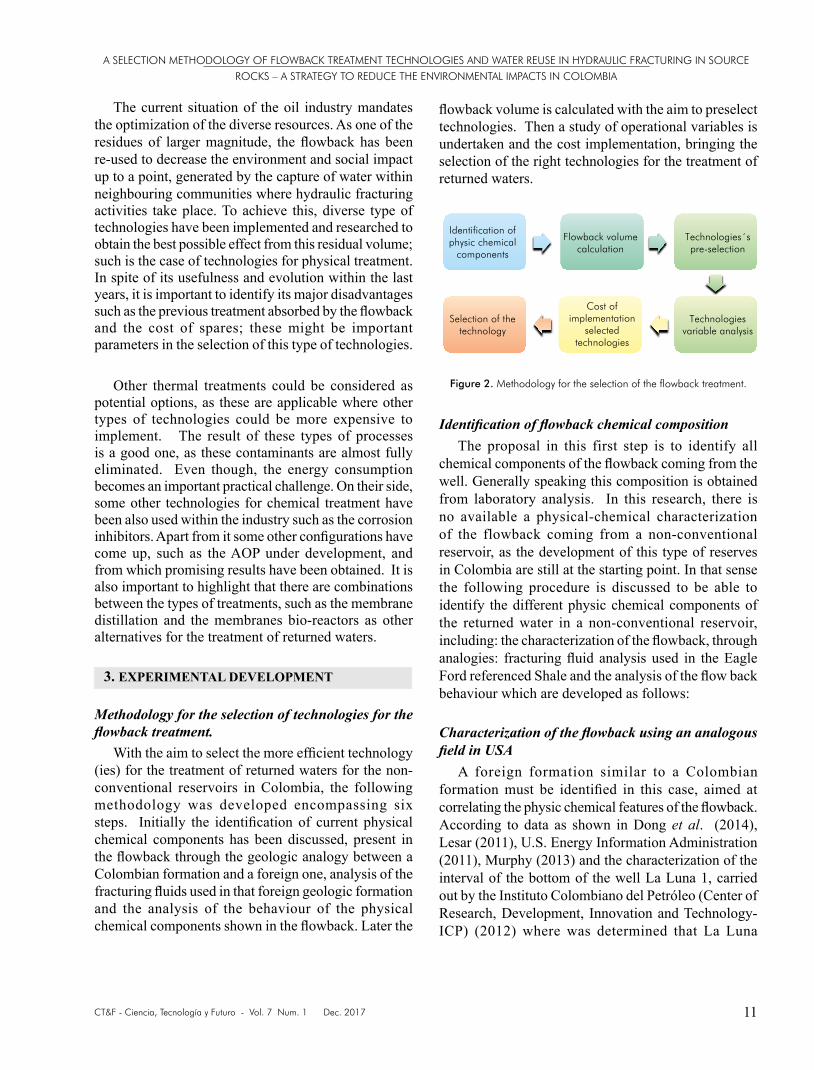
With the aim to select the more efficient technology (ies) for the treatment of returned waters for the non-conventional reservoirs in Colombia, the following methodology was developed encompassing six steps. Initially the identification of current physical chemical components has been discussed, present in the flowback through the geologic analogy between a Colombian formation and a foreign one, analysis of the fracturing fluids used in that foreign geologic formation and the analysis of the behaviour of the physical chemical components shown in the flowback. Later the
flowback volume is calculated with the aim to preselect technologies. Then a study of operational variables is undertaken and the cost implementation, bringing the selection of the right technologies for the treatment of returned waters.
Identification of flowback chemical compositionThe proposal in this first step is to identify all
chemical components of the flowback coming from the well. Generally speaking this composition is obtained from laboratory analysis. In this research, there is no available a physical-chemical characterization of the flowback coming from a non-conventional reservoir, as the development of this type of reserves in Colombia are still at the starting point. In that sense the following procedure is discussed to be able to identify the different physic chemical components of the returned water in a non-conventional reservoir, including: the characterization of the flowback, through analogies: fracturing fluid analysis used in the Eagle Ford referenced Shale and the analysis of the flow back behaviour which are developed as follows:
Characterization of the flowback using an analogous field in USA
A foreign formation similar to a Colombian formation must be identified in this case, aimed at correlating the physic chemical features of the flowback. According to data as shown in Dong et al. (2014), Lesar (2011), U.S. Energy Information Administration (2011), Murphy (2013) and the characterization of the interval of the bottom of the well La Luna 1, carried out by the Instituto Colombiano del Petróleo (Center of Research, Development, Innovation and Technology- ICP) (2012) where was determined that La Luna
Identification ofphysic chemical
components
Selection of thetechnology
Cost ofimplementation
selectedtechnologies
Technologiesvariable analysis
Flowback volumecalculation
Technologies´spre-selection
Figure 2. Methodology for the selection of the flowback treatment.

CT&F - Ciencia, Tecnología y Futuro - Vol. 7 Num. 1 Dec. 2017
FABIAN-ALEXIS ARANGUREN-CAMPOS et al.
12
formation located in the Magdalena Valley (VMM) and the Shale Eagle Ford, showed similarities in their petro physic and geologic features; as shown in Table 2. In order to establish the similarities between these two formations the following parameters were taken into account: permeability, porosity, TOC (Cerón,, Walls & Diaz, 2013), type of hydrocarbons, type of kerogene, temperature and vitrinite reflectance (Ro). Comparing each one of the mentioned parameters between the two formations showed in Table 2, the similarities on data can be ratified.
Once the shale Eagle Ford formation has been identified as the foreign formation analogue to the Colombian La Luna, it is assumed that the physic chemical composition of the flowback resulting from this formation in the United States is the base composition of the flowback in a non-conventional reservoir in the Colombian area. In Table 3 the flow back contaminants of the shale Eagle Ford and the water production of the Colombian fields located in the Magdalena Valley are compared, thus for the later works of this investigation, the data from the shale Eagle Ford will be worked upon.
Age
Approx. area (m2)
Basin
Mineral Composition
Porosity (%)
Permeability
Thickness
TOC (%)
Average depth (meters)
Pressure Gradient (psi/m)
Hydrocarbon Type
Total resources
Temperature (°K)
Maximum temperature (°K)
Kerogene Type
Ro (%)
Poisson Coefficient
Young Module (10/6 psi)
Technically recoverable resources
Cretaceous
12 140’569 267
Appalachian
Quartz 3%Calcite 77%Dolomite 2%
Pyrite 6%Clay: 8%Other: 4%
4-10
1-1.5
31-101
2-9
1 676-4 572
1.3 – 2.13
Dry gas, Humid Gas/condensed andoil with API between 33o and 50o
150 Tera cubic feet (Tcf) of gas and 33 m3/millions of cubic
feet standard (MMcf) of oil.
350-384
-
I and II
0.8-3
-
-
532.608 m3 of oil21 Tcf of gas
Upper Cretaceous
6 190’071 584
VMM
Quartz 62%Carbonates: 25%
Clay: 13%
Formation Eagle FordLa Luna
Salada Member Galembo Member
8.3 +/- 0.0238.27+ / -3.54
836 – 3 781
1.8 – 2.6
355 – 361
494-504
II
0.6-1
0.120-0.375
1.476-5.248
14.1 Tcf 728 m3 of oil
117.8 Tcf 12.120 billion m3 of oil.
8.69% +/- 0.0376.89 +/- 2.9
17
198-274
3.7 +/- 1.63
4.3
274-518
3 +/- 1.22
Light crudeand humid gas
Heavy Crude
Table 2. Analogy between the Eagle Ford and the La Luna formations.
Source: (Dong et al., 2014; Lesar, 2011; U.S. Energy Information Administration, 2011; Murphy, 2013). Formation data of La Luna shown in the Table, is the result of the comprehensive characterization of the bottom interval laboratory in La Luna well in the ICP, 2012

A SELECTION METHODOLOGY OF FLOWBACK TREATMENT TECHNOLOGIES AND WATER REUSE IN HYDRAULIC FRACTURING IN SOURCE
ROCKS – A STRATEGY TO REDUCE THE ENVIRONMENTAL IMPACTS IN COLOMBIA
CT&F - Ciencia, Tecnología y Futuro - Vol. 7 Num. 1 Dec. 2017 13
Table 3. Flowback composition in Eagle Ford and production water in Magdalena Valley fields
Source: (Slutz, Amderson, Broderick, & Horner, 2012; Halldorson, 2013; Ecolotron, 2014; Naranjo, Muñoz & Zapata, 2010; Benavidez, J. & Jaimes, 2014; Garzón, 2009; Ortiz, 2013)
Aluminium
Arsenic
Barium
Boron
Cadmium
Calcium
Chrome
Copper
Strontium
Iron
Magnesium
Manganesium
Mercury
Molybdenum
Nickel
Potassium
Silver
Lead
Selenium
Sodium
Zinc
Alkalinity (mg/L CaCO3)
Chlorides
Salinity
Nitrate
Nitrogen
Silicium
Sulphate
Bicarbonate
TOC
pH
Turbidity (NTU)
Conductivity (µs/cm)
TSS
TDS
Temperature (°C)
-
Cl-
NO3
N2
SiO2
SO42-
HCO3
-
-
-
-
-
-
-
406
19 318
19.3
148
163
736
612
7
>100
37 000
840
33 015
25
-
5 325
9 323
-
36.9
141.3
160
-
7.8 @ 20°C
-
-
-
9 439
-
320
1 300
8 500
-
-
50.4
192
-
-
134
3 500
1.200
286
-
-
17 867.6
3 728
0.41
-
-
67.7
-
-
7.6
-
-
1 110
-
24
1 000
6 200
13 000
-
-
-
110
2.700
-
-
-
-
-
-
-
Al
As
Ba
B
Cd
Ca
Cr
Cu
Sr
Fe
Mg
Mn
Hg
Mb
Ni
K
Ag
Pb
Se
Na
Zn
<1 000
<25
10
711
<20
1 270
55
<130
203
112
111
1.2
<0,2
<50
<200
192
<50
22.4
<25
10 900
<100
-
-
0.2
-
-
377.7
-
-
6.2
0
12.7
-
-
-
-
15.5
-
-
-
3 364
-
-
-
7
-
-
1 346
-
-
-
-
54.4
-
-
-
-
-
-
-
-
-
-
-
0.14
102.9
0.056
0.081
-
-
-
-
0.6
54.4
-
-
-
0.35
-
-
0.64
0.36
-
0.052
-
-
-
-
-
150
-
-
-
-
125
-
-
-
-
-
-
-
-
5 000
-
ComponentEagle Ford Water composition in Magdalena Valley fields
Concentration (ppm)
Ores
General chemistry
Lisama Field Under River Field Colorado Field La Cira FieldConcentration(ppm)Name Formula
CT&F - Ciencia, Tecnología y Futuro - Vol. 7 Num. 1 Dec. 2017
FABIAN-ALEXIS ARANGUREN-CAMPOS et al.
14
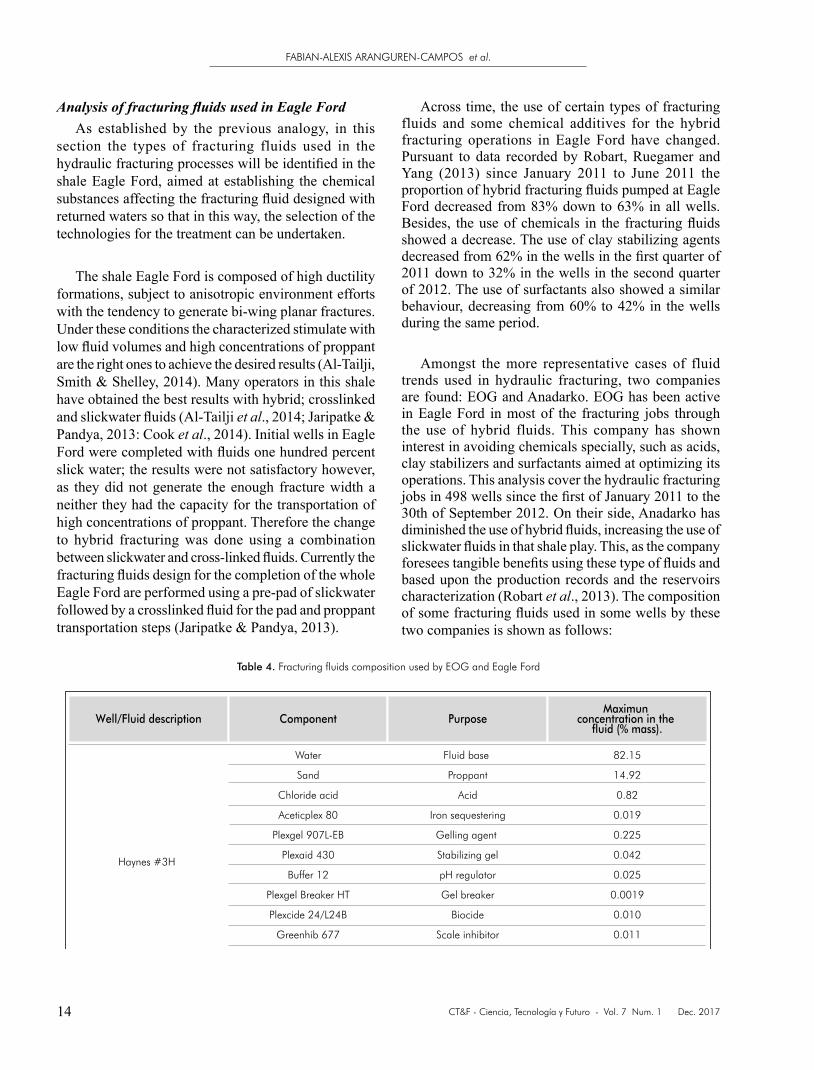
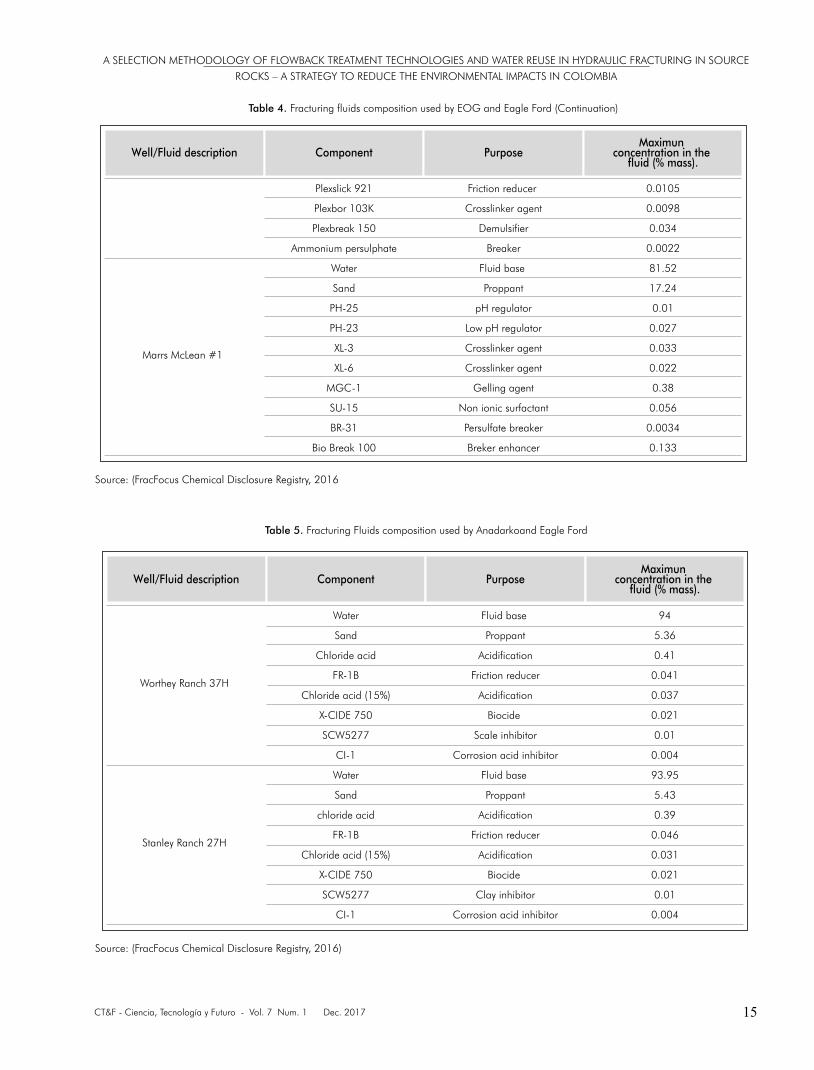
Analysis of fracturing fluids used in Eagle FordAs established by the previous analogy, in this
section the types of fracturing fluids used in the hydraulic fracturing processes will be identified in the shale Eagle Ford, aimed at establishing the chemical substances affecting the fracturing fluid designed with returned waters so that in this way, the selection of the technologies for the treatment can be undertaken.
The shale Eagle Ford is composed of high ductility formations, subject to anisotropic environment efforts with the tendency to generate bi-wing planar fractures. Under these conditions the characterized stimulate with low fluid volumes and high concentrations of proppant are the right ones to achieve the desired results (Al-Tailji, Smith & Shelley, 2014). Many operators in this shale have obtained the best results with hybrid; crosslinked and slickwater fluids (Al-Tailji et al., 2014; Jaripatke & Pandya, 2013: Cook et al., 2014). Initial wells in Eagle Ford were completed with fluids one hundred percent slick water; the results were not satisfactory however, as they did not generate the enough fracture width a neither they had the capacity for the transportation of high concentrations of proppant. Therefore the change to hybrid fracturing was done using a combination between slickwater and cross-linked fluids. Currently the fracturing fluids design for the completion of the whole Eagle Ford are performed using a pre-pad of slickwater followed by a crosslinked fluid for the pad and proppant transportation steps (Jaripatke & Pandya, 2013).
Across time, the use of certain types of fracturing fluids and some chemical additives for the hybrid fracturing operations in Eagle Ford have changed. Pursuant to data recorded by Robart, Ruegamer and Yang (2013) since January 2011 to June 2011 the proportion of hybrid fracturing fluids pumped at Eagle Ford decreased from 83% down to 63% in all wells. Besides, the use of chemicals in the fracturing fluids showed a decrease. The use of clay stabilizing agents decreased from 62% in the wells in the first quarter of 2011 down to 32% in the wells in the second quarter of 2012. The use of surfactants also showed a similar behaviour, decreasing from 60% to 42% in the wells during the same period.
Amongst the more representative cases of fluid trends used in hydraulic fracturing, two companies are found: EOG and Anadarko. EOG has been active in Eagle Ford in most of the fracturing jobs through the use of hybrid fluids. This company has shown interest in avoiding chemicals specially, such as acids, clay stabilizers and surfactants aimed at optimizing its operations. This analysis cover the hydraulic fracturing jobs in 498 wells since the first of January 2011 to the 30th of September 2012. On their side, Anadarko has diminished the use of hybrid fluids, increasing the use of slickwater fluids in that shale play. This, as the company foresees tangible benefits using these type of fluids and based upon the production records and the reservoirs characterization (Robart et al., 2013). The composition of some fracturing fluids used in some wells by these two companies is shown as follows:
82.15
14.92
0.82
0.019
0.225
0.042
0.025
0.0019
0.010
0.011
0.0105
0.0098
0.034
0.0022
81.52
17.24
0.01
0.027
0.033
0.022
0.38
0.056
0.0034
0.133
Fluid base
Proppant
Acid
Iron sequestering
Gelling agent
Stabilizing gel
pH regulator
Gel breaker
Biocide
Scale inhibitor
Friction reducer
Crosslinker agent
Demulsifier
Breaker
Fluid base
Proppant
pH regulator
Low pH regulator
Crosslinker agent
Crosslinker agent
Gelling agent
Non ionic surfactant
Persulfate breaker
Breker enhancer
Water
Sand
Chloride acid
Aceticplex 80
Plexgel 907L-EB
Plexaid 430
Buffer 12
Plexgel Breaker HT
Plexcide 24/L24B
Greenhib 677
Plexslick 921
Plexbor 103K
Plexbreak 150
Ammonium persulphate
Water
Sand
PH-25
PH-23
XL-3
XL-6
MGC-1
SU-15
BR-31
Bio Break 100
Haynes #3H
Marrs McLean #1
Well/Fluid description Component PurposeMaximun
concentration in the fluid (% mass).
Table 4. Fracturing fluids composition used by EOG and Eagle Ford
A SELECTION METHODOLOGY OF FLOWBACK TREATMENT TECHNOLOGIES AND WATER REUSE IN HYDRAULIC FRACTURING IN SOURCE
ROCKS – A STRATEGY TO REDUCE THE ENVIRONMENTAL IMPACTS IN COLOMBIA
CT&F - Ciencia, Tecnología y Futuro - Vol. 7 Num. 1 Dec. 2017 15
82.15
14.92
0.82
0.019
0.225
0.042
0.025
0.0019
0.010
0.011
0.0105
0.0098
0.034
0.0022
81.52
17.24
0.01
0.027
0.033
0.022
0.38
0.056
0.0034
0.133
Fluid base
Proppant
Acid
Iron sequestering
Gelling agent
Stabilizing gel
pH regulator
Gel breaker
Biocide
Scale inhibitor
Friction reducer
Crosslinker agent
Demulsifier
Breaker
Fluid base
Proppant
pH regulator
Low pH regulator
Crosslinker agent
Crosslinker agent
Gelling agent
Non ionic surfactant
Persulfate breaker
Breker enhancer
Water
Sand
Chloride acid
Aceticplex 80
Plexgel 907L-EB
Plexaid 430
Buffer 12
Plexgel Breaker HT
Plexcide 24/L24B
Greenhib 677
Plexslick 921
Plexbor 103K
Plexbreak 150
Ammonium persulphate
Water
Sand
PH-25
PH-23
XL-3
XL-6
MGC-1
SU-15
BR-31
Bio Break 100
Haynes #3H
Marrs McLean #1
Well/Fluid description Component PurposeMaximun
concentration in the fluid (% mass).
Table 5. Fracturing Fluids composition used by Anadarkoand Eagle Ford
Table 4. Fracturing fluids composition used by EOG and Eagle Ford (Continuation)
Source: (FracFocus Chemical Disclosure Registry, 2016
Source: (FracFocus Chemical Disclosure Registry, 2016)
94
5.36
0.41
0.041
0.037
0.021
0.01
0.004
93.95
5.43
0.39
0.046
0.031
0.021
0.01
0.004
Fluid base
Proppant
Acidification
Friction reducer
Acidification
Biocide
Scale inhibitor
Corrosion acid inhibitor
Fluid base
Proppant
Acidification
Friction reducer
Acidification
Biocide
Clay inhibitor
Corrosion acid inhibitor
Water
Sand
Chloride acid
FR-1B
Chloride acid (15%)
X-CIDE 750
SCW5277
CI-1
Water
Sand
chloride acid
FR-1B
Chloride acid (15%)
X-CIDE 750
SCW5277
CI-1
Worthey Ranch 37H
Stanley Ranch 27H
Well/Fluid description Component PurposeMaximun
concentration in the fluid (% mass).

CT&F - Ciencia, Tecnología y Futuro - Vol. 7 Num. 1 Dec. 2017
FABIAN-ALEXIS ARANGUREN-CAMPOS et al.
16
Each one of the additives used for fracturing fluids was the mixed of several chemical substances. It is important to remember that the main objective of this research paper is the reuse of flowback by later stages of hydraulic fracturing, therefore the removal of all possible showed contaminants is not necessary. For these cases, technology should be focused on the elimination of contaminants more affecting the rheological stability of the fracturing fluid, designed with flowback waters. For example, the calcium remotion is necessary due its incidence in two ways on the water quality: 1) it affects the rheologic performance of the fracturing fluid, but it depends upon the concentration and the fluid’s type used. 2) The forming of scale (Calcium carbonate), that can constrain the flow; this should be treated through some treatment technology or through the use of scale inhibitors mitigating its effect. It is also important to consider other elements for the selection of technologies for flowback treatment such as iron, usually removed in some proportion, although this depends upon the fluid used for the fracturing work.
Analysis of the scaling indices of flowbackTo analyse the behaviour of the physical chemical
components of the flowback, four water stability indices will be analysed allowing identifying whether the volume of water is aggressive, corrosive or scaling. The water is aggressive when this volume has the tendency to dissolve the limestone scales. The water is corrosive when its physic chemical composition favours corrosion in a given metal. Finally, the water is scaling when it has the tendency to form limestone scale. Some methodologies for the calculation of scaling indices are illustrated as follows:
Water stability indicesLangalier Saturation Index (LSI): This index
defines the scale potencial of water about to calcium carbonate (CaCO3). It is based upon the effect of the pH on the solubility equilibrium of CaCO3.It allows to determine the stability and the optimums pH of a water. It is also used as an indicator of water corrosiveness. If LSI > 0, the water is oversaturated, the scale can form and CaCO3 precipitation may occur. If LSI = 0, the water is saturated (in equilibrium) with CaCO3, it does not precipitate nor it is dissolved. If LSI < 0, the water is unsaturated, no potential to scale, the water will dissolve CaCO3. The Langelier index calculation is conducted in the following way (De Sousa, Correia & Colmenares,
2010; Varo Galvañ, Chillón & Prats, 2001; Guevara, 2013; Botella, 2014).
Where T is in Kelvin degrees
I= Ionic strength
E= dielectric constant
Ryznar Stability Index (RSI): Empiric index to determine the corrosive or scale tendency of the waters. It is confirmed that the value of this index allows determining the water behaviour. If RSI < 6, indicates that, the water tends to be scale forming. If, 6 < RSI < 7, indicates that the water is considered to be approximately at saturation equilibrium with CaCO3. If RSI > 8, indicates that the water is under saturated and therefore, would tend to dissolve any existing solid CaCO3. The index calculation of Ryznar is carried out in the following way: (De Sousa et al., 2010; Roberge, 2000):
The term pHs is calculated in the same way as the Langelier index was calculated.
(1)IL=pH-pHs
(2)pHs=(pK2-pKs)+ logCa+ log Alkalinity + 5pfm
(3)pK2=107,8871+0,03252849*T -
- 38,92561 logT +
5151,79T
563713,9T 2
(4)pKs=171,9065+0,077993*T + -71,595 logT 2839,319T
(5)pfm=A -0,3*I √I1+√I
(6)I= TDS40000
(7)A= 1,82*106*(E*T)-1,5
(8)E= 60954 -68,937T+116
(9)Ir= 2pHs-pH

A SELECTION METHODOLOGY OF FLOWBACK TREATMENT TECHNOLOGIES AND WATER REUSE IN HYDRAULIC FRACTURING IN SOURCE
ROCKS – A STRATEGY TO REDUCE THE ENVIRONMENTAL IMPACTS IN COLOMBIA
CT&F - Ciencia, Tecnología y Futuro - Vol. 7 Num. 1 Dec. 2017 17
Puckorius Scaling Index (PSI): Similar to the developed Ryznar index. This index is based on the buffering capacity of water and the maximum quantity of precipitate that can form in bringing water to equilibrium. If PSI < 4,5 indicates that scaling may occur. If 4,5 < PSI < 6,5 indicates no corrosion. If PSI > 6,5 indicates tendency to corrosion. This index is calculated in the following way (Guevara, 2013; Roberge, 2000):
The term pHs is calculated in the same way as the Langelier index was calculated.
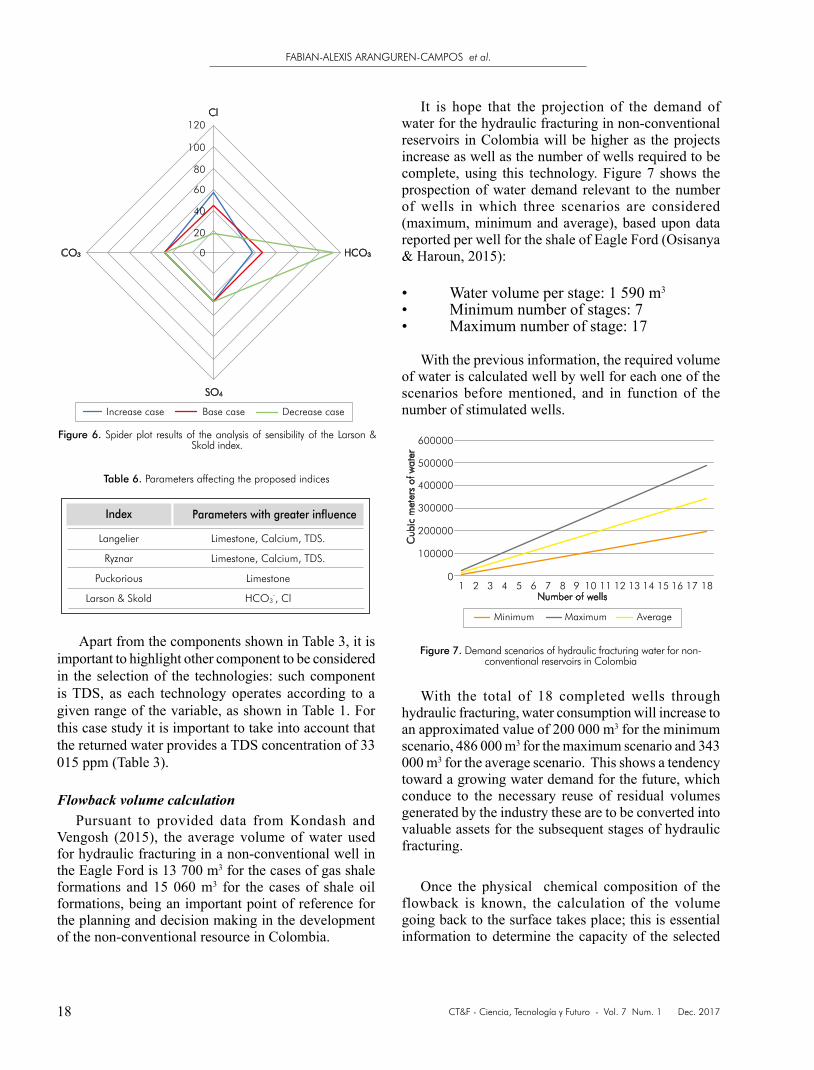
Larson & Skold index (L&SKI) This index considers chlorides, sulphates and total limestone. It is useful for balanced and purified waters, and especially cold waters. It does not work well with very low limestone waters (desalted waters) or very high limestone waters. If Index < 0,8 there is no corrosion. If 0,8 < Index > 1,2 there is a meaningful corrosion. If Index > 1,2 the corrosion is high. The calculation of this index is carried out in the following way (Guevara, 2013; Roberge, 2000):
Sensitive analysisAimed at establishing the physic chemical
components affecting the stability indices as previously explained, a sensitivity analysis was carried out. The results can be observed in Figure 3 to Figure 6, noticing three scenarios: (1) Increase of up to 25% of sensitive variable, (2) Base case, and (3) Decreased down to 60% of the sensitive variable. The variable showing the larger dispersion in the increased and decreased scenarios relevant to the base value is the one affecting the stability index.
Table 6 shows a summary of the physic chemical components affecting each one of the water stability indices. These results are later used to preselect technologies for the treatment of flowback.
(10)PSI= 2pHs - pHeq
(11)pHeq= 1,465+log(Alkalinity)+4,54
(12)L&SKI= (Cl-+SO42-)
(HCO3-+CO3
2-)
TDS Alcalinity
Ca0,0
-0,2
Increase case Decrease caseBase case
-0,4
-0,6
-0,8
-1,0
Figure 3. Spider plot results of the analysis of sensibility of the Langelier index
Figure 4. Spider plot results of the analysis of sensibility of the Ryznar index.
Figure 5. Spider plot results of the analysis of sensibility of the Puckorius index.
TDS Alcalinity
Ca9,0
8,0
7,0
6,05,04,0
3,0
2,0
1,00,0
Increase case Decrease caseBase case
TDS Alcalinity
Ca
9,010,0
8,07,06,05,04,03,02,01,00,0
Increase case Decrease caseBase case
CT&F - Ciencia, Tecnología y Futuro - Vol. 7 Num. 1 Dec. 2017
FABIAN-ALEXIS ARANGUREN-CAMPOS et al.
18
Apart from the components shown in Table 3, it is important to highlight other component to be considered in the selection of the technologies: such component is TDS, as each technology operates according to a given range of the variable, as shown in Table 1. For this case study it is important to take into account that the returned water provides a TDS concentration of 33 015 ppm (Table 3).
Flowback volume calculationPursuant to provided data from Kondash and
Vengosh (2015), the average volume of water used for hydraulic fracturing in a non-conventional well in the Eagle Ford is 13 700 m3 for the cases of gas shale formations and 15 060 m3 for the cases of shale oil formations, being an important point of reference for the planning and decision making in the development of the non-conventional resource in Colombia.
It is hope that the projection of the demand of water for the hydraulic fracturing in non-conventional reservoirs in Colombia will be higher as the projects increase as well as the number of wells required to be complete, using this technology. Figure 7 shows the prospection of water demand relevant to the number of wells in which three scenarios are considered (maximum, minimum and average), based upon data reported per well for the shale of Eagle Ford (Osisanya & Haroun, 2015):
• Water volume per stage: 1 590 m3 • Minimum number of stages: 7 • Maximum number of stage: 17
With the previous information, the required volume of water is calculated well by well for each one of the scenarios before mentioned, and in function of the number of stimulated wells.
With the total of 18 completed wells through hydraulic fracturing, water consumption will increase to an approximated value of 200 000 m3 for the minimum scenario, 486 000 m3 for the maximum scenario and 343 000 m3 for the average scenario. This shows a tendency toward a growing water demand for the future, which conduce to the necessary reuse of residual volumes generated by the industry these are to be converted into valuable assets for the subsequent stages of hydraulic fracturing.
Once the physical chemical composition of the flowback is known, the calculation of the volume going back to the surface takes place; this is essential information to determine the capacity of the selected
SO4
CO3
Cl
HCO3
120
100
80
60
40
20
0
Increase case Decrease caseBase case
Figure 6. Spider plot results of the analysis of sensibility of the Larson & Skold index.
Figure 7. Demand scenarios of hydraulic fracturing water for non-conventional reservoirs in Colombia
Langelier
Ryznar
Puckorious
Larson & Skold
Limestone, Calcium, TDS.
Limestone, Calcium, TDS.
Limestone
HCO3-, Cl
Index Parameters with greater influence
Table 6. Parameters affecting the proposed indices
Number of wells
Cub
ic m
eter
s of
wat
er
Minimum Maximum Average
600000
500000
400000
300000
200000
100000
01 2 3 4 5 6 7 8 9 10 11 12 13 14 15 16 17 18

A SELECTION METHODOLOGY OF FLOWBACK TREATMENT TECHNOLOGIES AND WATER REUSE IN HYDRAULIC FRACTURING IN SOURCE
ROCKS – A STRATEGY TO REDUCE THE ENVIRONMENTAL IMPACTS IN COLOMBIA
CT&F - Ciencia, Tecnología y Futuro - Vol. 7 Num. 1 Dec. 2017 19
Figure 8. Energy consumption of pre-selected technologies for the treatment.
Figure 9. Energy consumption of pre-selected technologies for the Capital cost of the pre-selected technologies for the treatment.
technology (ies) for the treatment. This information can be obtained from the reported volume as flowback in stages or previous operations. Because there is not background in Colombia, it will be used data previously shown (Eagle Ford shale in Osisanya & Haroun, 2014) for the water by stage volume and the maximum and minimum number of stages. Therefore, the following results are obtained:
• Volume of maximum water: 27 028 m3
• Volume of minimum water: 11 129 m3
With these data, the calculated average value is 19 079 m3 of water per well. It is assumed that the returning to surface volume is 15% of what was injected. (Halliburton, 2014), therefore the flowback volume is approx. 2 862 m3/well; this value will be used as the capacity of treatment by the selected technologies.
Technologies pre-selectionA pre-selection of technologies takes place at this
stage; these should follow the provided information in the previous methodology stages. In this stage it is possible also to define whether the implementation of one or more technologies is necessary, depending upon the quantity and concentration of existing contaminants in the flowback. Based upon the previously explained specifications (Table 1 information, sensitivity of the indexes of water stability, other contaminants as explained in Table 3, information in Table 7, analysis of the fracturing fluids used in the shale Eagle Ford and the capacity of treatment), the right technologies for treatment are: Reverse Osmosis, Membranes Distillation, Dewvaporation, Vapor Compression Distillation and Flash Multi Stage Distillation.
For this study case, it will not be feasible combine two or more technologies because the selected thermal technologies the flowback don´t require pre-treatment or if necessary will require a low consumption of chemical products. Reverse Osmosis represents a different case as this could be combined with other technology to achieve a high quality effluent; however, what is required is the removal of some contaminants for being reused. In this way the effluent obtained through reverse osmosis will allow to design a fracturing fluid with good rheological stability, initially achieved via treatment and also via the addition of new corrosion inhibitors and/or incrustations as shown in Argentina. (Bonapace et al., 2012).
Variable analysis of preselected technologiesIn this stage the different variables involved in each
technology are assesed: energy consumption, capital cost and treatment efficiency, amongst others. Using a specialized software tool in the topic of treatment design schemes, would improve the aproximation of the real behaviour of the technology(ies), thus the decision would be more reliable. The technical evaluation of each one of the technologies, will allow for the selection to be more focussed on the highest efficiency of the flowback treatment for non conventional reservoirs in Colombia. Four variables were selected for this study. Energy consumption, capital cost, treatmemt capacity and operational cost.
The theoric composition held by the water volumen was also taken into account after the treatment, through the pre-selected technologies. It is worth to clarify that one of the criteria used in the pre-selection was that each technology could achieve a theoretical removal of contaminants in the Flowback between 85 and 90%; this is a range fully dependant on the initial concentration of physico chemical components.
kWh/
cubu
c m
eter
ReverseOsmosis
MembraneDistillation
SteamCompressingDistillation
Multi StageFlash
Distillation
Dewvaporation
35,00
30,00
25,00
20,00
15,00
10,00
5,00
0,00
5,03
0,13
11,958,18
29,56
ReverseOsmosis
MembraneDistillation
SteamCompressingDistillation
Multi StageFlash
Distillation
Dewvaporation
US
$/cu
buc
met
er
2500,00
2000,00
1500,00
1000,00
500,00
0,005,91 0,94
2075,64
1572,45
2264,33

CT&F - Ciencia, Tecnología y Futuro - Vol. 7 Num. 1 Dec. 2017
FABIAN-ALEXIS ARANGUREN-CAMPOS et al.
20
In Figure 8, the higher energy consumptions belong to thermal treatment technologies, were the Multi Stage Flash Distillation is the highest. However, this technology has a high performace (>90%) in contaminants removal. On its side, Membranes Distillation is the technology consuming the lowest, therefore following this variable it would be the more adequate technology for the flowback treatment. On the other hand, Figure 9 shows the capital cost of pre-selected technologies where the higher cost of thermal technologies is identified in respect of the Reverse Osmosis cost; together with the Membranes Distillation, these two latest technologies would be ideal for the treatment.
Likewise, it is observed that the Multi Stage Flash Distillation has the highest capacity to treat the Flowback per day (Figure 10). However, the pre-selected technologies such as the Membranes Distillation and
ReverseOsmosis
MembraneDistillation
SteamCompressingDistillation
Multi StageFlash
Distillation
Dewvaporation
Cub
uc m
eter
/day
80000
70000
60000
50000
40000
30000
20000
10000
02703 3816
14999
2862
69986
Figure 10. Treatment capacity of the pre-selected technologies. Figure 11. Operation cost of the pre-selected technologies.
ReverseOsmosis
MembraneDistillation
SteamCompressingDistillation
Multi StageFlash
Distillation
Dewvaporation
7,00
6,00
5,00
4,00
3,00
2,00
1,00
0,000,19 0,38
6,29
0,47 0,75US
$/cu
bic
met
er
Reverse Osmosis accomplish with the specified volume capacity for treatment; thus in an over dimensioned technology, investment would not be feasible from the economic view point. Fort the operation cost’s case, Dewvaporation is the technology with the highest operation costs of all technologies (Figure 11); these costs are associated mainly to the maintenance of the treatment system, therefore this would be the first option to be discarded as high efficiency at lower cost is sought after.
In Table 7, the physical chemical composition of the flowback before and after the treatment through each one of the pre-selected technologies is theoretically compared. In detail, all comply with the contaminant removal of interest to make possible to design a new fracturing fluid with a desirable rheological stability.
<1 000
<25
10
711
<20
1 270
55
<130
203
112
111
1.2
<0.2
<50
<200
192
<50
22.4
<25
10 900
<100
406
19 318
19.3
148
163
736
612
7
>100
37 000
840
33 015
160
4
1.6
355.5
3,2
101.6
8,8
65
81.2
16,8
8.88
0.192
0.2
8
32
30.72
8
3 584
4
872
16
64.96
1 545.44
3.088
23.68
13.04
117.76
97.92
6
100
37 000
134.4
2 641.2
130
25
10
106.65
20
139.7
7.15
16.9
26.39
14.56
12.21
1.2
0.2
6,5
26
24.96
50
22.4
25
11.99
100
52.78
1 545.44
19.3
19
21.19
95.68
79.56
6
94
30 000
109.2
3 631.65
100
25
10
71.1
20
127
5.5
13
20.3
11.2
11.1
1.2
0.2
50
20
19.2
50
22.4
25
1.090
100
40,6
1 931.8
19.3
14.8
16,3
73,6
61.2
7
120
29 000
84
3 301.5
50
25
0.5
35.55
1
63.5
2.75
6.5
10.15
5.6
5.55
1.2
0.2
2,5
10
9.6
50
1.12
25
545
5
20.3
965.9
0.965
7.4
8.15
36.8
30.6
5.8
98
31 000
42
1 650.75
100
2.5
1
71.1
2
127
5.5
13
20.3
11.2
11.1
1.2
0.2
5
20
19.2
5
2.24
2,5
1.090
10
40.6
1 931.8
1.93
14.8
16.3
73.6
61.2
6.8
10
3 700
84
2 311.05
Aluminium
Arsenic
Barium
Boron
Cadmium
Calcium
Chrome
Copper
Strontium
Iron
Magnesium
Manganesium
Mercury
Molybdenum
Nickel
Potassium
Silver
Residues
Selenium
Sodium
Zinc
Alkalinity (mg/L CaCO3)
Chlorides
Nitrogen
Silicium
Sulphate
Bicarbonate
TOC
pH
Turbidity (NTU)
Conductivity (µs/cm)
TSS
TDS
Physic chemical composition [ppm] Affluent
Effluent
RO MD DV MVC MSF
Table 7. Theorical flowback water composition before and after treatment.

A SELECTION METHODOLOGY OF FLOWBACK TREATMENT TECHNOLOGIES AND WATER REUSE IN HYDRAULIC FRACTURING IN SOURCE
ROCKS – A STRATEGY TO REDUCE THE ENVIRONMENTAL IMPACTS IN COLOMBIA
CT&F - Ciencia, Tecnología y Futuro - Vol. 7 Num. 1 Dec. 2017 21
<1 000
<25
10
711
<20
1 270
55
<130
203
112
111
1.2
<0.2
<50
<200
192
<50
22.4
<25
10 900
<100
406
19 318
19.3
148
163
736
612
7
>100
37 000
840
33 015
160
4
1.6
355.5
3,2
101.6
8,8
65
81.2
16,8
8.88
0.192
0.2
8
32
30.72
8
3 584
4
872
16
64.96
1 545.44
3.088
23.68
13.04
117.76
97.92
6
100
37 000
134.4
2 641.2
130
25
10
106.65
20
139.7
7.15
16.9
26.39
14.56
12.21
1.2
0.2
6,5
26
24.96
50
22.4
25
11.99
100
52.78
1 545.44
19.3
19
21.19
95.68
79.56
6
94
30 000
109.2
3 631.65
100
25
10
71.1
20
127
5.5
13
20.3
11.2
11.1
1.2
0.2
50
20
19.2
50
22.4
25
1.090
100
40,6
1 931.8
19.3
14.8
16,3
73,6
61.2
7
120
29 000
84
3 301.5
50
25
0.5
35.55
1
63.5
2.75
6.5
10.15
5.6
5.55
1.2
0.2
2,5
10
9.6
50
1.12
25
545
5
20.3
965.9
0.965
7.4
8.15
36.8
30.6
5.8
98
31 000
42
1 650.75
100
2.5
1
71.1
2
127
5.5
13
20.3
11.2
11.1
1.2
0.2
5
20
19.2
5
2.24
2,5
1.090
10
40.6
1 931.8
1.93
14.8
16.3
73.6
61.2
6.8
10
3 700
84
2 311.05
Aluminium
Arsenic
Barium
Boron
Cadmium
Calcium
Chrome
Copper
Strontium
Iron
Magnesium
Manganesium
Mercury
Molybdenum
Nickel
Potassium
Silver
Residues
Selenium
Sodium
Zinc
Alkalinity (mg/L CaCO3)
Chlorides
Nitrogen
Silicium
Sulphate
Bicarbonate
TOC
pH
Turbidity (NTU)
Conductivity (µs/cm)
TSS
TDS
Physic chemical composition [ppm] Affluent
Effluent
RO MD DV MVC MSF
Table 7. Theorical flowback water composition before and after treatment. (Continuation)
Cost of pre-selected technologies implementation
In this stage the viability of the implementation of the pre-selected technologies from the economic view point is assessed. It is important to take into account
Reverse Osmosis
Membranes Distillation
Dewvaporation
Vapor Compression
Flash Multi Stage
$ 5.91
$ 0.94
$ 28.30
$ 1 195
$ 2 264
$ 0.19
$ 0.38
$ 13
$ 0.50
$ 0.75
Technology *Capital cost(USD/m3)
*Operational cost(USD/m3)
Table 8. Capital and operational costs of the pre-selected technologies.
Source: (Colorado School of Mines, 2009)
whether the technology is implemented on site or at a distance from the well, as this will imply changes in the final costs. In Table 8, the capital and operational costs in USD/m3 can be observed for each one of the pre-selected technologies. In this way it is possible to conclude that the best option from the economic focus would be Membranes Distillation Technology.
Technology selectionAccording to provided information in each one of the
methodology steps, it is concluded that the best option for the flowback treatment in the non-conventional reservoirs is the Membrane Distillation, as it might have the capacity to remove (~90%) non desirable materials such as calcium, magnesium, sodium, total solids dissolved and chlorides, having a big incidence in the future behaviour and performance of the fracturing

CT&F - Ciencia, Tecnología y Futuro - Vol. 7 Num. 1 Dec. 2017
FABIAN-ALEXIS ARANGUREN-CAMPOS et al.
22
fluid. Also it is important to highlight that although it has technologic characteristics for thermal treatment, energy consumption for treated cubic meter is the lowest of all pre-selected technologies (Figure 7) making it as a viable economic and accessible option. Finally and in spite of this technology having a membrane being a possible common and constant cause of failure, the treatment rate per day is high and sufficient enough to take the flowback water for the design of fracturing fluid into optimum conditions.
4. RESULTS ANALYISIS
Taking into account the information collected from each one of the available technologies for the treatment of flowback waters and the analysis of the submitted information in each stage of the proposed methodologies in this article, the right technology to carry out the flowback treatment in the non-conventional reservoirs in Colombia would be Membrane Distillation technology; even having the capacity to eliminate the needed contaminants for the flowback, and the right physical-chemical composition for the design of fracturing fluids, it also has the capacity to treat the required volume. Also, total costs for the implementation of this technology in site, are the lowest (0.94 USD/m3) in respect of the implementation costs of other technologies. Also other costs associated to operations of this technology are found in second place in respect to what other technologies show. (Figure 10). Through this technology the total projected benefit would be 15% equal to the flowback volume required for later stages of hydraulic fracturing.
It is important to highlight that the result obtained through this posed methodology in this research work is based upon a similar case that should be validated in later studies; including representative samples of flowback coming from non-conventional reservoirs in Colombia, and the implementation of a software tool, allowing to have a better approximation to the real behaviour of the treatment technology (ies).
5. CONCLUSIONS
● A methodology allowing selecting the technology (ies) for the treatment of the flowback in non-conventional reservoirs in Colombia was proposed.
It included technical parameters and experienced at real scale in the field of each technology, the analysis of sensibility of four water stability indexes, the correlation of physic chemical characteristics between the formations geologically similar and the cost of implementation.
● The methodology submitted by this article constitutes a fundamental tool for the planning and decision making processes within the exploitation framework of non-conventional resources in Colombia. The total benefit projected would be 15%, equal to the flowback required for subsequent stages, in this way decreasing the environmental impact upon the regions where the hydraulic fracturing operations are undertaken.
● Based upon the obtained results through the use of the proposed technology, Membrane Distillation would be the adequate technology to carry out the flowback treatment for non-conventional reservoirs in Colombia.
● As second option for this type of treatment in Colombia, Reverse Osmosis is proposed taking into account that it has the capacity to treat considerable volumes of flowback and it also has the capacity to remove any type of ions.
● Each one of these pre-selected technologies will manage efficiency in the removal of contaminants up to 90%, even though it is important to mention that this value depends upon the initial concentration of physical chemical components showed in the flowback.
● The limestone at CaCO3 is the parameter affecting three of the four stability indices analysed in this research work. Under the above, the selected technology was based upon this parameter, as wells as upon the concentration of TDS, chlorides, bicarbonates and other physic chemical components.
● Available technologies for treating flowback water and the recent advances in the development of hydraulic fracturing fluids enable a sustainable development to the environment of unconventional reservoirs projects in those countries where the use of fresh water is increasingly restricted or those places with water shortage.

A SELECTION METHODOLOGY OF FLOWBACK TREATMENT TECHNOLOGIES AND WATER REUSE IN HYDRAULIC FRACTURING IN SOURCE
ROCKS – A STRATEGY TO REDUCE THE ENVIRONMENTAL IMPACTS IN COLOMBIA
CT&F - Ciencia, Tecnología y Futuro - Vol. 7 Num. 1 Dec. 2017 23
● Results obtained through this research work are based upon a similar case, therefore, later studies are required validating the veracity of this methodology. For that purpose, any later stages of this work should include representative samples of flowback waters of non-conventional reservoirs in Colombia, and using a software tool allowing obtaining a best possible approach to the real implementing technologies.
REFERENCES
Altela Inc. AltelaRainSM Produced Water Treatment Technology, Making Water from Waste (2006). International Petroleum Environmental Conference. Texas.
Al-Tailji, W., Smith N. & Shelley R. (2014). Optimizing Hydraulic Fracture Performance in the Liquids-Rich Eagle Ford Shale – How Much Proppant Is Enough? SPE Annual Technical Conference and and Exhibition. Amsterdam, SPE-170785.
Arango, A. (2005). Electrocoagulation: an alternative for the treatment of residual waters. Revista Lasallista de Investigación, 2(1), 49-56.
Argone National Laboratory (2009). Produced Water Volumes and Management Practices in the United States. Enviromental Science Division, ANL/EVS/R-09/1.
Arnold, K. & Stewart M. (2008). Surface Production Operations. Design of oil handling systems and facilities. Burlington: Gulf Professional Publishing. 1(3).
Bahar, R., Hawlader, M. & Woei, L.S. (2014). Performance evaluation of a mechanical vapor compression desalination system. Desalination. 166, 123-127.
Benavidez, J. & Jaimes, Y. (2014). Technic financial feasibility of the alternatives uses for water in the production fields, Colorado School. Tesis de pregrado Fac. de Ingenierías Fisicoquímicas. Universidad Industrial de Santander, Bucaramanga, Colombia, 136 p.
Bonapace, J., Giglio, M., Moggia, J.& Krenz, A. (2012). Water Conservation: Reducing Freshwater Consumption by Using Produced Water for Base Fluid in Hydraulic Fracturing–Case Histories in Argentina. SPE Latin American and Caribbean Petroleum Engineering Conference. Cuidad de Mexico, SPE-151819.
Botella, N. (2014). Parameters determination in waters implied in desalinating processes. Langelier saturation index calculation. Master sustainable management and water technologies. Module 6: non-conventional resources. Chemistry Department., Universidad de Alicante, España.
Boysen, J. (2007). The Freeze-Thaw/Evaporation (FTE®) Process for Produced Water Treatment, Disposal and Beneficial Uses. IPEC Conferene.
Boysen, J., Harju, J.A., Shaw, B., Fosdick, M., Grisanti, A. & Sorensen, J.A. (1999). The Current Status of comercial Deployment of the Freeze Thaw Evaporation Treatment Of Produced Water. SPE International Production and Operations Conference & Exhibition. Doha, SPE-52700.
Cárdenas, J. (2011). Development of an analytic model to predict geometry of fracking and the flow of fluids in hydraulic operations with viscose elastic fluids. Tesis de maestría (Ingeniería de Hidrocarburos) Fac. de Ingenierías Fisicoquímicas, Universidad Industrial de Santander, Bucaramanga, Colombia, 25pp.
Cerón, M., Walls, J. & Diaz, E. (2013). Comparison of reservoir quality of La Luna, Gacheta and Eagle Ford Shale formations: Using Digital Rock Physics. AAPG Datapages. Search and Discovery Article #50875.
Colorado School of Mines (2009). An Integrated Framework for Treatment and Management of Produced Water. RPSEA Proyecto 07122-12. (1), 58.
Cook, D., Downing, K., Bayer, S., Watkins, H., Chee Fore, V.S., Stansberry, M., Saksena, S. & Peck, D. (2014). Unconventional Asset Development Work Flow in the Eagle Ford Shale. SPE Unconventional Resources Conference. Texas, SPE-168973.
Darwish, M.A. (1998). Thermal analysis of vapor compression desalination system. Desalination. 69, 275-295.
De Sousa C., Correia, A. & Colmenares, M. (2010). CorrosiON AND incrustations in then fresh wáter distributions systems: Control strategies revision. Malariología y Salud Ambiental. 50(2).
Dong, Z., Holditch, S., McVay, D., Ayers, W., Lee, J. & Morales, E. (2014). Probabilistic assessment of world recoverable shale gas resources. SPE Economics & Management. SPE-167768-PA.

CT&F - Ciencia, Tecnología y Futuro - Vol. 7 Num. 1 Dec. 2017
FABIAN-ALEXIS ARANGUREN-CAMPOS et al.
24
Dores, R., Hussain, A., Katebah, M. & Adham, S. (2012). Using advanced Water treatment technologies to treat produced water from the petroleum industry. SPE International Production and Operations Conference and Exhibition. Doha, SPE-157108.
Ecolotron (2014). Water recovery systems. Treatment of flow back and produced water from the hydraulic fracturing of oil shale – Eagle Ford formation, McMullen County Texas.
Electrificadora de Santander S.A. E.S.P. – ESSA (2015). Rates, May.
Ely, J., Horn, A., Cathey, R., Fraim, M. & Jakhete, S. (2011). Game changing technology for treating and recycling frac water. SPE Annual Technical Conference and Exhibition. Colorado, SPE-145454.
Fernández – Alba, A., Letón, P., Rosal, R., Dorado, M., Villar, S. & Sanz, J. (2006). Tratamientos avanzados de aguas residuales industriales. CEIM, Dirección General de Universidades e Investigación.
Forero, J., Ortiz, O. & Rios, F. (2005). Application of advances oxidation processes as a phenol treatment in residual waters in refineries. CT&F - Ciencia, Tecnología y Futuro, 3(1).
FracFocus, Chemical Disclosure Registry (2016).
Gandosi, L. (2013). An overview of hydraulic fracturing and other stimulation technologies for shale gas production. Reporte EUR 26347 EN. 3.
Garzón, J. (2009). Análisis de distribución de la inyección de agua en un sector del área 3W del campo La Cira-Infantas a través de trazadores radioactivos. Tesis de pregrado Fac. de Ingenierías Fisicoquímicas. Universidad Industrial de Santander, Bucaramanga, Colombia, 25 p.
Guadlip, A. & Paugh, L. (2008). Marcellus Shale Water Management Challenges in Pennsylvania. SPE Shale Gas Production Conference held in Fort Worth. Texas, SPE-119898.
Guevara, A. (2013). Anti-corrosive control in production pipelines of a crude-producing well in Canonaco field. Tesis de grado Fac. de Ciencias de la Ingeniería. Universidad Tecnológica Equinoccial, Quito, Ecuador, 59-60 pp.
Guohua, C. (2004). Electrochemical technologies in wastewater treatment. Separation and Purification Technology, (38), 11- 41.
Halldorson, B. (2013). Successful oilfield water management. AADE National Technical Conference and Exhibition. Oklahoma, AADE-13-FTCE-14.
Halliburton (2014). Produced and flow back water recycling and reuse. Economics, limitations and technology. Oil and Gas Facilities, 16-22.
He, C., Wang, X., Liu, W., Barbot, E. & Vidic, R. (2014). Microfiltration in recycling of Marcellus Shale flowback Water: Solids removal and potential fouling of polymeric microfiltration membranes. Journal of Membrane Science. 462, 88-95.
Holt, P., Barton, G. & Mitchell, C. (2005). The future for electrocoagulation as a localised water treatment technology. Chemosphere, 59, 355–367.
Horner, P., Halldorson, B. & Slutz, J. (2011). Shale Gas Water Treatment Value Chain – A Review of Technologies, including Case Studies. SPE Annual Technical Conference and Exhibition. Colorado, SPE-147264-MS.
Hussain, A., Minier-Matar, J., Janson, A., Gharfeh, S. & Adham, S. (2014). Advanced technologies for Produced Water Treatment and Reuse. SPE International Petroleum Technology Conference. Doha, SPE-17394.
Igunnu E. & Chen G. (2012). Produced Water Treatment Technologies. International Journal of Low-Carbon Technologies. 9, 157-177.
Janson, A., Katebah, M., Santos, A., Minier-Matar, J., Hussian, A., Adham, S. & Judd, S. (2014). Assessing the Biotreatability of Produced Water from a Qatari Gas Field. SPE International Petroleum Technology Conference. Doha, SPE IPTC-17318-MS.
Jaripatke, O. & Pandya, N. (2013). Eagle Ford Completions Optimization – An Operator ’s Approach. SPE Unconventional Resources Technology Conference. Colorado, SPE-168811/URTeC 1581757.
Jude, S. (2006). The MBR Book. Principles and Applications of Membrane Bioreactors in Water and Wastewater treatment. Great Britain: Elsevier.

A SELECTION METHODOLOGY OF FLOWBACK TREATMENT TECHNOLOGIES AND WATER REUSE IN HYDRAULIC FRACTURING IN SOURCE
ROCKS – A STRATEGY TO REDUCE THE ENVIRONMENTAL IMPACTS IN COLOMBIA
CT&F - Ciencia, Tecnología y Futuro - Vol. 7 Num. 1 Dec. 2017 25
Kondash, A. & Vengosh, A. (2015). Water Footprint of Hydraulic Fracturing. Environmental Science and Technology Letters. 2 (10), 276-280.
Lee, J. & Frankiewicz, T. (2005). Treatment of Produced Water with an Ultrafiltration (UF) Membrane – A field trial. SPE Annual Technical Conference and Exhibition. Texas, SPE-95735.
Lesar, D. (2011). Shale developments III. Halliburton.
Letterman, R. (1999). Water Quality and Treatment. New York: McGraw-Hill. (5).
Ma, H. & Wang, B. (1998). Electrochemical pilot-scale plant for oil field produced wastewater by M/C/Fe electrodes for injection. Journal of Hazardous Materials, 132, 237-243.
Metcalf & Eddy Inc. (1995). “Ingeniería de aguas residuales. Tratamiento, vertido y reutilización.” Madrid: McGraw-Hill (1). Residual waters engineering.
Minier-Matar H. Hussain, A., Janson, A. & Adham S. (2014). Treatment of produced water from unconventional resources by membrane distillation. SPE International Petroleum Technology Conference. Doha, SPE-17481.
Murphy, E., Praznik, G., Quirein, J., Galford, J., Witkowsky, M. & Chen, S. (2013). A workflow to evaluate mineralogy, porosity, TOC and hydrocarbon volumen in the Eagle Ford shale. SPE Unconventional Resources Conference and Exhibition-Asia Pacific. Brisbane, SPE-167012-MS.
Naranjo, C., Muñoz, S. & Zapata, J. (2010). Factibilidad experimental de la inyección de agua en las arenas mugrosa del campo Lisama. Fuentes: El reventón energético. 8(1)
Nolen-Hoeksema, R. (2013). Hydraulic fracking elements. Oilfield Review. 25(2), 57.
Ortiz, W. (2013) Treatment plant design of production water in a field in Magdalene Valley. Tesis de pregrado Fac. de Ingenierías Fisicoquímicas. Universidad Industrial de Santander, Bucaramanga, Colombia, 29, 157 p.
Osisanya, S. & Haroun, M. (2014). Evaluation of cementing and stimulation techniques for horizontal Wells drilled in unconventional shale formations. SPE International Petroleum Exhibition and Conference. Abu Dhabi, SPE-172162 MS.
Pazmiño, J. (2005). Fundamentals of the theory of hydraulic fracking.
Peeters, J. & Theodoulou, S. (2005). Membrane technology treating oily wastewater for reuse. Corrosion, Paper No. 05534, 3-7.
Pierce, D., Bertrand, K. & Cretiu Vasiliu C. (2010). Water recycling helps with sustainability. SPE Asia Pacific Oil & Gas Exhibition. Queensland, SPE-134137.
Platt, F., Burnett, D., Eboagwu, U. & Vavra, C. (2011). Pre-Treatment Options for Frac Flow Brines: Laboratory and Pilot Plant Testing of Oil Removal Materials. SPE Canadian Unconventional Resources Conference. Alberta, CSUG/SPE-147417.
Ramalho, R.S. (1990). Tratamiento de aguas residuales. Quebec: Editorial Reverté S.A.
Roberge, P. (2000). Handbook of Corrosión Engineering. New York: McGraw-Hill.
Sarria, V., Parra, S., Rincón, A., Torres, R. & Pulgarín, C. (2005). New electrochemical and photochemical systems for residual and fresh water treatments. Revista Colombiana de Química, 34(2), 161-173.
Shaffer, D., Arias, L., Ben-Sasson, M., Romero-Vargas, S., Yin Yip, N. & Elimelech, M. (2013). Desalination and Reuse of High-Salinity Shale Gas Produced Water: Drivers, Technologies and Future Directions. Environmental Science & Technology. 47 (17), 9569–9583.
Slutz, J., Amderson, J., Broderick, R. & Horner, P. (2012). Key shale gas water management strategies: an economic assessment tool. SPE International Conference on Health, Safety and Environment in Oil and Gas Exploration and Production. Perth, SPE-157532-MS.
Trombetta, J. (2012). Water in the exploitation of non-conventional reservoirs.. Petrotecnia. Agosto, 52-64pp.
U.S. Energy Information Administration (2011). Review of emerging resources: U.S. shale gas and shale oil plays.
Valero, M. (2013). Selection of technologies form the treatment of production waters in a gas shale using a technic of multi criteria decision. Tesis de maestría (Ingeniería Ambiental),

CT&F - Ciencia, Tecnología y Futuro - Vol. 7 Num. 1 Dec. 2017
FABIAN-ALEXIS ARANGUREN-CAMPOS et al.
26
Fac. de Ingenierías Fisicoquímicas, Universidad Industrial de Santander, Bucaramanga, Colombia, 43-69pp.
Varo Galvañ, P., Chillón, M. & Prats, D. (2001). Características Fisicoquímicas de las Aguas Ablandadas. Ingeniería Química. 33, 146-150.
Veil, J. (2011). Produced Water Management Options and Technologies. New York: Springer.
Webb, C., Nagghappan, L., Smart, G., Hoblitzell, J- & Franks, R. (2009). Desalination of Oilfield-Produced Water at the San Ardo Water Reclamation Facility, CA. SPE Western Regional Meeting. California, SPE-121520.
Winter, D., Koschikowski, J. & Wieghaus, M. (2011). Desalination using membrane distillation: Experimental studies on full scale spiral wound modules. Journal of Membrane Science. 375, 104-112.
Zibrida, J., Amjad, Z., Zuhl, W. & Lewis J. (2000). Advances in reverse osmosis application in water reuse. NACE International. Corrosion 2000. 26-31.
.
AUTHORS
Fabian Alexis Aranguren CamposAffiliation : Universidad Industrial de Santander, Bucaramanga, Santander, Colombia.e-mail: [email protected]
Zuly Calderón CarrilloAffiliation: Universidad Industrial de Santander, Bucaramanga, Santander, Colombia.e-mail: [email protected]
José Manuel Usuriaga TorresAffiliation : Ecopetrol S.A – Instituto Colombiano del Petróleo, Bucaramanga, Santander, Colombia.e-mail: [email protected]

A SELECTION METHODOLOGY OF FLOWBACK TREATMENT TECHNOLOGIES AND WATER REUSE IN HYDRAULIC FRACTURING IN SOURCE
ROCKS – A STRATEGY TO REDUCE THE ENVIRONMENTAL IMPACTS IN COLOMBIA
CT&F - Ciencia, Tecnología y Futuro - Vol. 7 Num. 1 Dec. 2017 27
NOTATION
Langalier Saturation Index (LSI)
Hydrogen Saturation Potential
- Log10 of the second constant of
dissociation for carbonic acid
-Log10 of solubility product for calcite form
: Temperature, Kelvin degrees (°K)
Activity coefficient for monovalent ions at
specified temperature.
Ionic strength
Dielectric constant
Ryznar Stability Index (RSI)
Puckorius Scaling Index (PSI)
Equivalent Hydrogen potential
Aggressiveness Index
Actual Flowback Potential Hydrogen
Larson & Skold Index (L&SKI)
IL
pHs
pK2
pKs
T
pfm
I
E
Ir
PSI
pHeq
AI
pHactual
L&SKI

CT&F - Ciencia, Tecnología y Futuro - Vol. 7 Num. 1 Dec. 2017
FABIAN-ALEXIS ARANGUREN-CAMPOS et al.
28
APPENDIX
Indices calculations of water stabilityTo analyze the behaviour of the physic chemical
components of the flow back, four water stability indexes will be analysed allowing identifying whether the volume of water is aggressive, corrosive or incrusting. The water is aggressive when this volume has the tendency to dissolve the limestone incrustations. The water is corrosive when its physicochemical composition favours corrosion in a given ore. Finally, the water is incrusting when it has the tendency to form limestone incrustations.
Taking into account the given information in the following Table, we proceed to calculate the four indexes of water stability.
Aluminium ***
Arsenic***
Barium*
Boron***
Cadmium***
Calcium*
Chrom***
Copper***
Strontium*
Iron*
Magnesium*
Manganesium**
Mercury***
Molybdenum***
Nickel***
Potassium*
Silver
Residues***
Selenium***
Sodium*
Zinc***
1000
25
10
71100
20
1.270
55
130
203
112
111
1,2
0,2
50
200
192
50
22,4
25
10.900
<100
Limestone (mg/L CaCO3)**
Chlorides*
Nitrogen
Silice**
Sulfate*
Bicarbonate*
TOC***
pH**
Turbidity (NTU)**
Conductivity (µs/cm)
TSS*
TDS*
Temperature (°C)*
Temperature (°K)*
406
19.318
19,3
148
163
736
612
7
100
37.000
840
33.015
30
303
Name
Ores
General chemistry
ComponentConcentration (mg/L)
Table 1. Flowback physic chemical composition
Langalier Saturation Index (LSI):The mathematic definition for the calculation of
Langelier as follows:
Where
The temperature (T) is in grades Kelvin
I= Ionic strength
(1)IL=pH-pHs
(2)pHs=(pK2-pKs)+ logCa+ log Alkalinity + 5pfm
(3)pK2=107,8871+0,03252849*T -
- 38,92561 logT +
5151,79T
563713,9T 2
(4)pKs=171,9065+0,077993*T + -71,595 logT 2839,319T
(5)pfm=A -0,3*I √I1+√I
(6)I= TDS40000
(7)A= 1,82*106*(E*T)-1,5

A SELECTION METHODOLOGY OF FLOWBACK TREATMENT TECHNOLOGIES AND WATER REUSE IN HYDRAULIC FRACTURING IN SOURCE
ROCKS – A STRATEGY TO REDUCE THE ENVIRONMENTAL IMPACTS IN COLOMBIA
CT&F - Ciencia, Tecnología y Futuro - Vol. 7 Num. 1 Dec. 2017 29
Latest from the equation (1) the Langelier index is calculated
Ryznar Stability Index (RSI):The mathematical definition for the calculation of
the Ryznar index as follows:
The term pHs is calculated in the same way as the Langelier index’s, therefore the pHs values showed in Table 6 are valid for the Ryznar index. In this way the equation (9) is calculated in the Ryznar index:
Puckorius Scaling Index (PSI)
The term pHs is calculated in the same way as the Langelier’s, therefore the pHs values shown in Table 6 are valid for the Puckorius index.
E= dielectric constant
As previously defined, the following scenarios will be observed: (1) Increase of up to 25% of sensibiliser variable, (2) Base case and (3) Decreased down to 60% of the sensibiliser variable. Therefore
Of the equations (3), (4), (7) and (8) we have:
As showed in equation (6) the Ionic Strength (I) depends on the TDS term; thus the posed scenarios should be taken into account. Therefore and noticing data of TDS provided in table 2:
Based on data obtained from table 4 and equation (5):
Later is calculated from the equation (2) the term pHs
(8)E= 60954 -68,937T+116
Ca+2
Limestone
TDS
508
162,4
13206
1587,5
507,5
41268,75
1.270
406
33.015
Variable Decrease 60% Increase 25% Base
Table 2. Parameters influencing the Langelier index in the three proposed scenarios
Table 3. Calculted values for pK2, pKs, E and A
Table 4. Obtained values for I
Table 5. Obtained values for pfm
Table 6. Obtained values for pHs
Table 7. Obtained values for Langelier Inde
Table 8. Obtained values in the Ryznar index
pK2
pKs
E
A
10,2890
8,5088
76,5379
0,5153
I 0,33015 1,03172 0,82538
Variable Decrease 60% Increase 25% Base
pfm 0,08901 -0,04984 -0,00230
Variable Decrease 60% Increase 25% Base
Ca+2
Limestone
TDS
7,0831
7,0831
7,9376
7,5780
7,5780
7,2434
7,4811
7,4811
7,4811
VariableDecrease 60%
pHs calculationIncrease 25% Base
Ca
Limestone
TDS
-0,5780
-0,5780
-0,2434
-0,4811
-0,4811
-0,4811
-0,0831
-0,0831
-0,9376
VariableDecrease 60%
Langelier indexIncrease 25% Base
(9)Ir= 2pHs-pH
Ca+2
Limestone
TDS
8,2
8,2
7,5
8,0
8,0
8,0
7,2
7,2
8,9
VariableDecrease 60%
Ryznar IndexIncrease 25% Base
(10)PSI= 2pHs - pHeq
(11)pHeq= 1,465+log(Alkalinity)+4,54

CT&F - Ciencia, Tecnología y Futuro - Vol. 7 Num. 1 Dec. 2017
FABIAN-ALEXIS ARANGUREN-CAMPOS et al.
30
Of the equation (11) we have:
Of the equation (10) we have
Larson & Skold index (L&SKI)The last analysed index was Larson & Skold’s
in which chloride is present (Cl-), sulphate (SO4=), bicarbonate (HCO3
-) and carbon dioxide (CO3=). To work on this index, the concentration should be in meq/L and to obtain this concentration, the concentration in mg/L should be divided over the equivalent weight To find the equivalent weight, the atomic mass is divided over the valence
Limestone 6,8552 6,8846 6,8790
Variable Decrease 60% Increase 25% Base
Table 9. Obtained values pHeq
Table 10. Obtained values from the Puckorius index
Table 11. Parameters value contributing in the Larson & Skold index (mg/L).
Table 12. Parameter values contributing in the Larson & Skold index (meq/L).
Ca+2
Limestone
TDS
8,2714
8,2714
7,6022
8,0832
8,0832
8,0832
7,3110
7,3110
9,0200
VariableDecrease 60%
Puckorius IndexIncrease 25% Base
(12)L&SKI= (Cl-+SO42-)
(HCO3-+CO3
2-)
Cl-
SO4=
HCO3-
CO3=
7727,2
65,2
294,4
0
24147,5
203,75
920
0
19.318
163
736
0
Variable Decrease 60% Increase 25% Base
Cl-
SO4=
HCO3-
CO3=
217,956
1,357
4,825
0,000
681,113
4,242
15,078
0,000
544,890
3,394
12,062
0,000
Variable Decrease 60% Increase 25% Base
Therefore the equation (12) has:
Table 13. Obtained values from Larson & Skold index
Cl-
SO4=
HCO3-
CO3=
56,7478
36,3636
45,5249
45,4545
45,4545
45,4545
45,4545
45,4545
18,3506
113,6364
45,2857
45,4545
VariableDecrease 60%
Larson & Skold IndexIncrease 25% Base