journal of mechanics of materials and structuresfibre was derived on the basis of assumptions...
TRANSCRIPT

Journal of
Mechanics ofMaterials and Structures
A NONLINEAR STRESS-STRETCH RELATIONSHIPFOR A SINGLE COLLAGEN FIBRE IN TENSION
Francesco Genna
Volume 9, No. 5 September 2014
msp

JOURNAL OF MECHANICS OF MATERIALS AND STRUCTURESVol. 9, No. 5, 2014
dx.doi.org/10.2140/jomms.2014.9.475 msp
A NONLINEAR STRESS-STRETCH RELATIONSHIPFOR A SINGLE COLLAGEN FIBRE IN TENSION
FRANCESCO GENNA
A new stress-strain equation for a single, stretched collagen fibre (bundle) is developed, based on the sta-tistical description of the fibre microstructure, down to the tropocollagen molecule level. The derivationfollows previous work of Annovazzi and Genna (2010), but the modifications reported here both simplifyand improve the final result. The model is governed by physically meaningful parameters. Comparisonsbetween the model predictions and some available experimental results suggest that the proposed modelcould be of value in bioengineering applications.
1. Introduction
In [Annovazzi and Genna 2010] (hereafter referred to as [AG]), a constitutive model for a single collagenfibre was derived on the basis of assumptions concerning both the fibre microstructure and the mechanicalbehaviour of the tropocollagen molecule. The present paper aims at simplification, improvement, andbetter internal consistency with respect to what done in [AG].
The main motivation for this work is the relative scarcity of constitutive models for the stress-stretchbehaviour of a single collagen fibre in tension. The most commonly adopted assumptions for the collagenfibre constitutive law are in fact still not fully adequate. They might be either unrealistic, such as linearelasticity, or purely phenomenological, such as linear or nonlinear viscoelasticity, or hyperelasticity,based on the definition of potential functions that depend on parameters having no physical meaning.One reason for this could be the fact that the interest is often focussed on tissue analysis, so complicatedin itself that it leaves little space for an accurate description of the underlying constituents, i.e., the singlefibres. Examples of this type of difficulty can be found in [Grytz and Meschke 2009; Cacho et al. 2007;Wang et al. 1997; Limbert 2011].
To the best of our knowledge, only one attempt — that of [AG] — has been made at deriving a micro-structurally based stress-stretch law for a single collagen fibre. This could cover the whole range ofpossible tensile loading, and described the microstructure of the fibre itself, which includes several levelsof subcomponents, down to the molecular level [Kastelic et al. 1978]. The fibre stress-strain relationshippresented in [AG] was based on the statistical description of the crimp properties of all the internallevels — four, according to the available information — of the fibre itself. The results obtained in [AG],however, could be improved in several respects:• in the absence of data concerning the tropocollagen molecule, the equation for the elastic behaviour
at the molecular level was taken, in [AG], from a model developed for a DNA molecule, an extensionof the so-called WLC model of [Bustamante et al. 2000];
Work done within a research project financed by the Italian Ministry of Education and Research (MIUR)..Keywords: collagen fibre, constitutive modelling, microstructure, statistical analysis.
475
476 FRANCESCO GENNA
• the failure of the tropocollagen molecule was described in [AG] on the basis of uncertain force dataconcerning the DNA molecule;
• the assumptions regarding the statistics of the waviness at the molecular level were inconsistent, in[AG], which resulted in needless analytical complications;
• crosslinking was ignored;
• all the subfibrils, at all the sublevels, were assumed to be continuous and stress-carrying, ignoringthe existence of both interrupted subfibrils and of extra fibrous matter/voids;
• all the probability density functions for all the random variables, in [AG], were taken as Gaussian;this created some inconsistency in the definition of the governing parameters.
Here, a modification of the model of [AG] is presented. It overcomes the quoted problems and, at thesame time, it is much simpler, and is better suited to be adopted even in large-scale applications, asshown in an accompanying paper [Genna and Paganelli 2014]. The main features of the constitutivemodel described here are of two types: those that follow what was already presented in [AG], and thosewhich modify and improve the previous approach. In summary:
Retained features:
• a collagen fibre, or bundle, is seen as having an internal hierarchy of 4 sublevels of wavy or crimpedsubfibres, arranged in parallel at each sublevel; the waviness at each level is treated as a randomvariable;
• all the random variables are considered as stochastically independent;
• no compressive or bending stiffness is considered;
• the tropocollagen molecules are seen as forming wavy cables, of which the stress-carrying ones aretreated as continuous, running from end to end of the bundle, and having an elastic-brittle behaviour.
New features:
• a bilinear elastic law is adopted for the tropocollagen molecule, as suggested in [Buehler and Wong2007];
• the statistical aspects of the molecular failure are based on a simpler yet more consistent assumption,expressed in terms of displacement instead of force;
• crosslinking is accounted for;
• a beta probability density function is chosen for the statistics of all the random quantities;
• account is taken of the possible coexistence, at any sublevel, of stress-carrying and non-stress-carrying material.
The model herein proposed is valid for any material — and specially for soft tissues or tissue compo-nents — whose internal microstructure is made by nested wavy thin cables. Its effectiveness, in thecontext of collagen, is tested by comparing its predictions with the results of experiments available inthe literature for single collagen fibres. An indirect verification is also presented, obtained by insertingthe new fibre stress-stretch equation into a previously developed model for the mechanical behaviour intension of the periodontal ligament (PDL) [Genna 2006].

A NONLINEAR STRESS-STRETCH RELATIONSHIP FOR A SINGLE COLLAGEN FIBRE IN TENSION 477
2. Theory: the constitutive model
Figure 1 shows a sketch of the assumed hierarchy of subcomponents inside a collagen fibre, based onthe description presented, for instance, in [Kastelic et al. 1978]. This follows [AG]; Figure 1 also showsthe approximate geometrical scales of each level. The nomenclature adopted here is the following:
• Collagen fibre (or bundle, or fascicle): this is called here “level 0”, and it is the component forwhich we desire to obtain a stress-stretch equation, starting from its uncoiled, unstretched configu-ration. Its characteristic diameter is, for collagen types I, II, and III, of about 100µm. The uncoiled,unstretched length of the fibre, inside the proposed model, is taken as deterministic, denoted by Lb.
• Fibril: this is called here “level 1”, and has a typical diameter of about 10 to 500 nm. This componentexhibits a typical banded structure, with a period of about 65 nm, that derives from the features ofthe molecular arrangement [Petruska and Hodge 1964].
• Subfibril: this is called here “level 2”. According to [Kastelic et al. 1978], this entity, of diameterranging from 10 to 20 nm, has been described in previous literature; it seems hard to be distinguishedfrom the next one (see also [AG]).
• Microfibril, formed by five tropocollagen units joined together: this is called here “level 3”, and hasa typical diameter of 3.5 nm;
• Tropocollagen molecule, having a diameter of 1.5 nm: this is the lowest level considered here, i.e.,“level 4”.
Level 3: microfibril8= 3.5 nm
Level 2: subfibril8= 20 nm
Level 4: molecule8= 1.5 nm
Level 1: fibril8= 100 nm
Level 2: subfibril8= 20 nm
Level 0: fibre bundle/fascicle8= 100µm
Figure 1. Schematic representation of the internal structure of a fibre-forming collagenfibre, as proposed for instance in [Kastelic et al. 1978].

478 FRANCESCO GENNA
List of abbreviationsAm Molecular cross-section area 1.7671 nm2
fi Volume fraction of fibrous matter in cable iFs Molecular force at the end of stiffness stage 2Fm Molecular force
F4,A Force in cable 4 during molecular stiffness stage 2F4,B Force in cable 4 during molecular stiffness stage 3
Ks Molecular stiffness in molecular stiffness stage 2 10 pN/nmKm Molecular stiffness in molecular stiffness stage 3 30 pN/nmL0,i Coiled end-to-end distance of a cable at level i Random
L0,m Coiled end-to-end distance of a single molecule RandomLb Unstretched uncoiled length of a collagen fibre
Ld,i Unstretched uncoiled length of a cable at level i RandomLm Unstretched uncoiled length of a single molecule 301.7 (204.9) nmM Number of molecules in cable at level 4 RandomN Total number of levels (cables) in the cable microstructure 4 for a fibre of collagen
type I, II, and IIIs Molecular displacement range spanned by stiffness stage 2
u1 Deterministic value of the displacement that stretches a collagen fibreu f Failure molecular displacement Randomu∗f Difference between failure molecular displacement and displacement
at the end of the first (entropic) stiffness stageui Displacement of cable at level i starting from situation
when cable i−1 is uncoiled and unstretchedui Displacement ui corresponding to complete uncoiling,
but with no stretching, of cable at level ium Molecular displacement starting from rest (coiled) configurationum Molecular displacement um corresponding to complete uncoiling,
but with no stretching, of a single moleculeus Molecular displacement um corresponding to the end of stiffness
stage 2 of a single molecule RandomX f Crosslink parameter affecting molecular failure
Xks Crosslink parameter affecting the stiffness in molecular stiffness stage 2Xkm Crosslink parameter affecting the stiffness in molecular stiffness stage 3
yi Ratio between coiled end-to-end distance and unstretched uncoiledlength of cable at level i Random
z4 Product y1 y2 y3 y4 Randomz A Current value of variable z4 at the beginning of molecular
stiffness stage 2 for cable 4zB Current value of variable z4 at the transition between molecular
stiffness stages 2 and 3 for cable 4zC Current value of variable z4 at failure for cable 4
zC,0 Value of variable z4 at failure for cable 4 with zero crosslinking8m Molecular diameter 1.5 nmσ0 Cauchy stress in a collagen fibre Randomσ e
i Stress in the non-fibrous matter in a cable at level i 0
A NONLINEAR STRESS-STRETCH RELATIONSHIP FOR A SINGLE COLLAGEN FIBRE IN TENSION 479
Level 0
Level 1
Level 0
Tissue level
u1
Level 1
L0,0
Ld,0 = Lb = L0,1
u0
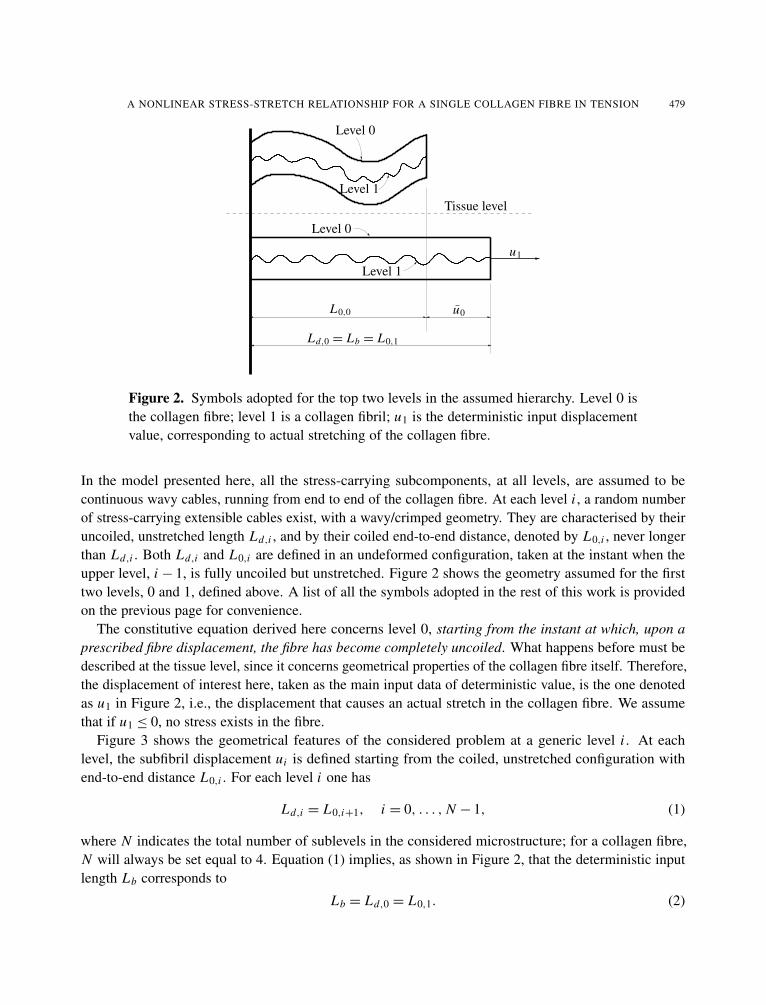
Figure 2. Symbols adopted for the top two levels in the assumed hierarchy. Level 0 isthe collagen fibre; level 1 is a collagen fibril; u1 is the deterministic input displacementvalue, corresponding to actual stretching of the collagen fibre.
In the model presented here, all the stress-carrying subcomponents, at all levels, are assumed to becontinuous wavy cables, running from end to end of the collagen fibre. At each level i , a random numberof stress-carrying extensible cables exist, with a wavy/crimped geometry. They are characterised by theiruncoiled, unstretched length Ld,i , and by their coiled end-to-end distance, denoted by L0,i , never longerthan Ld,i . Both Ld,i and L0,i are defined in an undeformed configuration, taken at the instant when theupper level, i − 1, is fully uncoiled but unstretched. Figure 2 shows the geometry assumed for the firsttwo levels, 0 and 1, defined above. A list of all the symbols adopted in the rest of this work is providedon the previous page for convenience.
The constitutive equation derived here concerns level 0, starting from the instant at which, upon aprescribed fibre displacement, the fibre has become completely uncoiled. What happens before must bedescribed at the tissue level, since it concerns geometrical properties of the collagen fibre itself. Therefore,the displacement of interest here, taken as the main input data of deterministic value, is the one denotedas u1 in Figure 2, i.e., the displacement that causes an actual stretch in the collagen fibre. We assumethat if u1 ≤ 0, no stress exists in the fibre.
Figure 3 shows the geometrical features of the considered problem at a generic level i . At eachlevel, the subfibril displacement ui is defined starting from the coiled, unstretched configuration withend-to-end distance L0,i . For each level i one has
Ld,i = L0,i+1, i = 0, . . . , N − 1, (1)
where N indicates the total number of sublevels in the considered microstructure; for a collagen fibre,N will always be set equal to 4. Equation (1) implies, as shown in Figure 2, that the deterministic inputlength Lb corresponds to
Lb = Ld,0 = L0,1. (2)

480 FRANCESCO GENNA
Level i , coiled, unstretched
ui
Level i , uncoiled, unstretched
Level i , uncoiled, stretched
L0,i
Ld,i
ui
Figure 3. Symbols adopted for a generic internal level of the assumed microstructure.
The displacement ui contains a part that uncoils the subcomponent i without stretching it: this part isdenoted by ui , defined as
ui = Ld,i − L0,i ≥ 0. (3)
For each level i , the following nondimensional quantity is defined:
yi =L0,i
Ld,i, 0< yi ≤ 1, (4)
i.e., the ratio between the coiled end-to-end distance and the uncoiled, unstretched length of the subfibrilsat that level. The quantities yi are assumed to be random variables, governed by a probability densityfunction of the beta type [Ross 2004], because of their taking values in the interval [0, 1]. It is assumedthat (i) the quantities yi , for all i , are stochastically independent, and that (ii) a mean value E(yi ) and avariance Var(yi ) of each yi are both known.
Exploiting (1)–(4), and following the same path taken in [AG] (where, though, a different definitionof the random variables was adopted), the following results can be obtained:
Ld,i =Lb∏ij=1 y j
, 1≤ i ≤ N , (5)
ui − ui = u1+ Lb
(1− 1∏i
j=1 y j
), 1≤ i ≤ N . (6)
It is now necessary to define the mechanical behaviour at the tropocollagen molecule level, herein called“level 4”.

A NONLINEAR STRESS-STRETCH RELATIONSHIP FOR A SINGLE COLLAGEN FIBRE IN TENSION 481
Single molecule, coiled, unstretched
um
Single molecule,uncoiled, unstretched
Single molecule,stretched
Single molecule,failure point
L0,m
Ld,m = Lm
um
u∗f
u f
Figure 4. Symbols adopted for the displacements of a single tropocollagen molecule.The uncoiled, unstretched length Ld,m of a single molecule coincides with its contourlength Lm .
Figure 4 shows the geometry and the symbology adopted for a single molecule. Note that all thesymbols previously introduced refer to continuous subcomponents, at all levels, running from end to endof the collagen fibre. In Figure 4, the subscripts m and f refer instead to a single molecule, and um isthe molecular displacement defined from the coiled, unstretched configuration of a single molecule.
The contour length Lm is the uncoiled, unstretched length of the molecule, usually (but not always)taken equal to Lm = 301.7 nm (see for instance [Buehler and Wong 2007]). It is the sum of the end-to-enddistance of the coiled molecule, L0,m , with the displacement um necessary to fully uncoil the molecule.Both these quantities are assumed to be random variables. The displacement u∗f that brings the moleculefrom its uncoiled state up to the brittle failure point (see for instance [Bozec and Horton 2005] and[Buehler and Wong 2007] for experimental evidence of the aspect of a stress-strain curve in tension ofa tropocollagen molecule) is assumed to have a deterministic value; yet, the total failure displacementu f = um + u∗f , defined as starting from the coiled configuration, is also a random variable.
The mechanical properties of a single molecule are defined on the basis of results presented in [Buehlerand Wong 2007], where three stages are recognised in the tensile force-displacement behaviour: a firstone, of entropic elasticity, up to an axial force of about 10–15 pN; a second one, corresponding to theuncoiling of the molecule triple helix; and a third stage, where the molecular bonds are stretched, thatends with brittle fracture, at a displacement u∗f of about 150 nm.
Here, the first stage is neglected, assuming that, for um ≤ um , the molecular force is zero. Next,a bilinear elastic-brittle force-displacement law is assumed, illustrated in Figure 5. The molecule startsfurnishing stiffness when um > um ; at this instant a second stiffness stage begins, spanning a displacement

482 FRANCESCO GENNA
Fm
Fs
Stage 1
Stage 2
Stage 3
Km
Ks
um sus
u∗f
u fum
Figure 5. Bilinear force-displacement law adopted for a single tropocollagen molecule.Fm is the molecular force; um is the molecular displacement, defined from the initial(coiled) state; u f indicates the brittle failure point. Both s and u∗f are assumed to bedeterministic quantities. Stage 1 corresponds to entropic elasticity, herein neglected.Stage 2 corresponds to the helix uncoiling phase. Stage 3 corresponds to actual molecularstretching.
range denoted by s. This stage 2 ends at a displacement us given by
us = um + s. (7)
During this stage 2, for um ≤ um ≤ us the molecular stiffness is denoted by Ks . For us < um ≤ u f themolecular behaviour is in a third and final stiffness stage, still linear elastic, but governed by a differentstiffness value, indicated by Km .
We assume as deterministic, and known, beside the value of u∗f = u f − um , also (i) the two stiffnessesKs and Km , and (ii) the displacement interval s spanning the stiffness stage 2. Also the moleculardiameter 8m is assumed as deterministic and known, of value 8m = 1.5 nm; this value is assumed toremain constant during the deformation.
The assumed force-displacement law for a single tropocollagen molecule is then as follows:
Fm = 0, um ≤ um (entropic elasticity, neglected);
Fm = Ks(um − um), um < um ≤ us (uncoiling);
Fm = Fs + Km(um − us), us < um ≤ u f = (um + u∗f ) (stretching);
Fm = 0, um > u f (failed),
(8)
A NONLINEAR STRESS-STRETCH RELATIONSHIP FOR A SINGLE COLLAGEN FIBRE IN TENSION 483
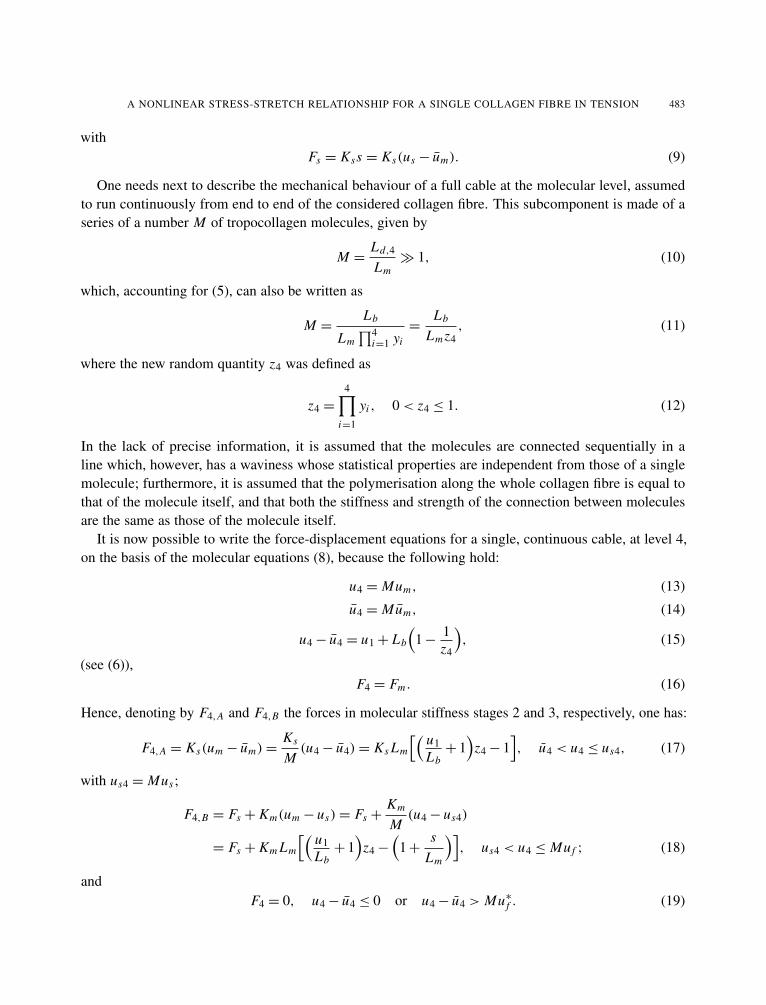
withFs = Kss = Ks(us − um). (9)
One needs next to describe the mechanical behaviour of a full cable at the molecular level, assumedto run continuously from end to end of the considered collagen fibre. This subcomponent is made of aseries of a number M of tropocollagen molecules, given by
M =Ld,4
Lm� 1, (10)
which, accounting for (5), can also be written as
M =Lb
Lm∏4
i=1 yi=
Lb
Lmz4, (11)
where the new random quantity z4 was defined as
z4 =
4∏i=1
yi , 0< z4 ≤ 1. (12)
In the lack of precise information, it is assumed that the molecules are connected sequentially in aline which, however, has a waviness whose statistical properties are independent from those of a singlemolecule; furthermore, it is assumed that the polymerisation along the whole collagen fibre is equal tothat of the molecule itself, and that both the stiffness and strength of the connection between moleculesare the same as those of the molecule itself.
It is now possible to write the force-displacement equations for a single, continuous cable, at level 4,on the basis of the molecular equations (8), because the following hold:
u4 = Mum, (13)
u4 = Mum, (14)
u4− u4 = u1+ Lb
(1− 1
z4
), (15)
(see (6)),F4 = Fm . (16)
Hence, denoting by F4,A and F4,B the forces in molecular stiffness stages 2 and 3, respectively, one has:
F4,A = Ks(um − um)=Ks
M(u4− u4)= Ks Lm
[( u1Lb+ 1
)z4− 1
], u4 < u4 ≤ us4, (17)
with us4 = Mus ;
F4,B = Fs + Km(um − us)= Fs +Km
M(u4− us4)
= Fs + Km Lm
[( u1Lb+ 1
)z4−
(1+
sLm
)], us4 < u4 ≤ Mu f ; (18)
andF4 = 0, u4− u4 ≤ 0 or u4− u4 > Mu∗f . (19)

484 FRANCESCO GENNA
From (17) and (18), it becomes apparent that the only random quantity that governs the mechanicalbehaviour of each cable at level 4 is z4, defined by (12). The probability density function of z4 cannot bedefined in closed form, but it is assumed to be also a beta function, with known mean value and variance,that can be computed, for the product of stochastically independent random variables, exploiting thefollowing expressions:
if x = yi y j , then E(x)= E(yi )E(y j ); (20)
if x = yi y j , then Var(x)= [E(yi )]2 Var(y j )+ [E(y j )]
2 Var(yi )+Var(yi )Var(y j ) (21)
(see for instance [Goodman 1960; 1962]).Denoting now by fz4(z4) the probability density function for z4, the expected value of F4, for each
assigned value of the collagen fibre displacement u1, must be computed through an integration over theadmissible values of z4, as follows:
E[F4(u1, z4)] =
∫ 0<zB≤1
0<z A≤1F4,A(z4) fz4(z4) dz4+
∫ 0<zC≤1
0<zB≤1F4,B(z4) fz4(z4) dz4 (22)
The integration limits z A, zB , and zC , all deterministic, are to be computed as follows:
• from (15) and (19) one has
F4,A 6= 0 if u1+ Lb
(1− 1
z4
)> 0 =⇒ z4 >
Lb
u1+ Lb= z A; (23)
• from (17) it is seen that the transition from F4,A to F4,B occurs for u4 = us4, i.e., for
u4 = Mus = u4+Ms, (24)
which, recalling (11) and again (15), gives
zB =Lb
u1+ Lb
(1+ s
Lm
); (25)
• and from (11), (15), and (18) one has
F4,B 6= 0 if u1+ Lb
(1− 1
z4
)<
Lb
Lmz4u∗f =⇒ z4 <
Lb
u1+ Lb
(1+
u∗fLm
)= zC . (26)
Note that, in order to account for the irreversibility of failure, in the calculation of integral (22) the upperintegration limit zC can not increase with increasing u1, i.e., one must always set dzC/du1 ≤ 0.
It is now possible to introduce into the previous equations some simple modifications in order toaccount for the possible presence of crosslinking. For this complex aspect, no attempt is made here atdescribing any physical feature of the substructural arrangement. The purpose is to model the main me-chanical effects of crosslinking in a phenomenological way, through equations void of physical meaning,but as simple as possible.
The main effects of crosslinking considered herein are (i) the increase of the apparent stiffness of asingle cable (see, for instance, [Thompson and Czernuszka 1995]); (ii) the influence of the brittle failureof a cable on the surrounding ones.

A NONLINEAR STRESS-STRETCH RELATIONSHIP FOR A SINGLE COLLAGEN FIBRE IN TENSION 485
The first effect is described in a trivial way: the basic molecular stiffnesses, Ks and Km , are introducedinto the governing equations each multiplied by an independent dimensionless factor, denoted by Xks ≥ 1and Xkm ≥ 1 respectively.
The second effect of crosslinking is recognised to be of reducing the failure displacement of the wholecollagen fibre. Such a reduction is quite significant, according to [Pins et al. 1997]: non-crosslinked fibresare reported to fail at a strain (probably Biot, although this is not reported in [Pins et al. 1997]) that canreach values up to 0.68, whereas crosslinked ones fail at strains of the order of 0.15. This phenomenoncould be explained considering that brittle failure is associated to a sudden release of elastic energy: ifthe failed cable is crosslinked to other parallel cables, the surrounding ones might absorb a portion ofthe released energy, and fail themselves, thus leading to a premature failure of the whole collagen fibre.
This effect has been taken into account by defining a progressive reduction of the upper integrationlimit in (22), i.e., zC of (26). This reduction is proportional to the current value of the input displace-ment u1 through a new nondimensional parameter X f ≥ 0. We have redefined zC as follows:
zC = zC,0− f (X f , u1),dzC
du1≤ 0, with zC,0 =
Lb
u1+ Lb
(1+
u∗fLm
), (27)
and with
f (X f , u1)=2 arctan(u1 X f /Lb)(zC,0− z A)
π. (28)
These equations, which have no physical basis, when inserted into the governing equations allow one toobtain the desired effect: with increasing u1, the upper integration limit zC tends to approach the lowestone, z A. This reflects the progressive disappearance, among the various subcomponents, of the shorterones, at a rate that increases with increasing values of the parameter X f .
The expected value of the axial stress in a cable at level 4, i.e., in a cable made by a sequence oftropocollagen molecules, for a given value of the collagen fibre displacement u1, is then
E(σ4)=E(F4)
Am=
4E(F4)
π82m. (29)
Elementary homogenisation theory is finally exploited to compute the corresponding expected valueof the macroscopic axial stress in the collagen fibre at level 0 of the assumed hierarchy, as shown inFigure 1. At each level, in fact, the stress-carrying subfibrils coexist with noncontinuous subfibrils, withsome extra-fibrous (ground) matter, and with no matter at all.
Denote by σ ei the tensile stress possibly transmitted by the nonfibrous matter at each level i , and by fi
the volume fraction of stress-carrying fibrous matter at each level i . Then fi = A fi /Ai , where Ai is the
total area of a cable at level i , and A fi is the area occupied by continuous fibrous matter in that very cable.
Then the elementary homogenisation theory allows one to calculate the average macroscopic stress σ0
at level 0 as follows:
σ0 = E(σ4) f3 f2 f1 f0+ σe3 (1− f3) f2 f1 f0++σ
e2 (1− f2) f1 f0+ σ
e1 (1− f1) f0+ σ
e0 (1− f0). (30)
From now on, for simplicity, we always assume that the extra-fibrous matter does not carry any mechan-ical stress in tension, even though it could do so in compression. Therefore, we will set σ e
i = 0 for each

486 FRANCESCO GENNA
i = 0, . . . , 3 in (30), which then reduces to
σ0 = E(σ4) f3 f2 f1 f0, (31)
with E(σ4) given by (29), with (22) and following. This is an explicit expression for the axial stress in asingle stretched collagen fibre for any corresponding value of the prescribed value of u1; this last couldbe related to any conventional strain value through standard theory.
We note, finally, that the obtained stress-stretch equation, here derived explicitly for the case of N = 4,could be easily extended to any other structural component, biological or not, having the same typeof microstructure of nested wavy cables, with any number N of subcomponents. Once the mechanicalproperties of the most microscopic level — i.e., level N — are known, a straightforward extension of theabove equations will furnish the desired stress-stretch relationship. The only statistics to be describedwould be that of a variable zN , defined as the product of the N random variables yi , defined by (4).The expression for the average macroscopic stress that extends result (30) to an arbitrary number N ofsublevels is the following:
σ0 = E(σN )
N−1∏i=0
fi +
N−1∑i=0
[σ e
i (1− fi )
i−1∏j=0
f j
]. (32)
The proposed stress-stretch equation, with the force-displacement law of (17) and (18), and with the mod-ifications of (27) and (28), included to account for crosslinking, requires a total number of constitutiveparameters equal to 7+ 3N in general, and equal to 19 for the case N = 4.
3. Applicative examples
3.1. Sea cucumber collagen fibril, from [Eppell et al. 2006]. The first example considers a collagenfibril, i.e., the subcomponent at level 1 of the hierarchy considered so far. Therefore, to obtain thecorresponding results one must adopt N = 3, and the molecular level corresponds now to i = 3 in (5)and (6). This example was chosen both because it helps in setting a basis for the data concerning thestatistics at the lower levels of a fibre, and because there are experimental results available [loc. cit.].
Figure 6 shows tensile stress-strain curves: one as presented in [loc. cit.] (continuous), the other(with white circles) as obtained from the analytical approach proposed here. In this case, unlike all theremaining ones, the molecular length Lm has been set equal to Lm = 204.9 nm, instead of the commonlyadopted value Lm = 301.7 nm, following the results presented in [loc. cit.]. We note (we will return tothis in the next section) that a substantial uncertainty about experimentally measured quantities existsalready for the “simple” molecular length Lm . The Almansi strain employed for the abscissa, as done in[loc. cit.], is defined as
εAlmansi =λ2− 1
2λ2 , λ=Lb+ u1
Lb. (33)
Table 1 shows the set of parameters adopted to obtain the analytical results for this and the next threeexamples. The first ten parameters have values that will remain fixed in all the presented examples; theremaining nine will have different values for each example. Note that, for (31), we have not definedindividual values for the stress-carrying fibrous matter volume fractions fi , but rather a single value for
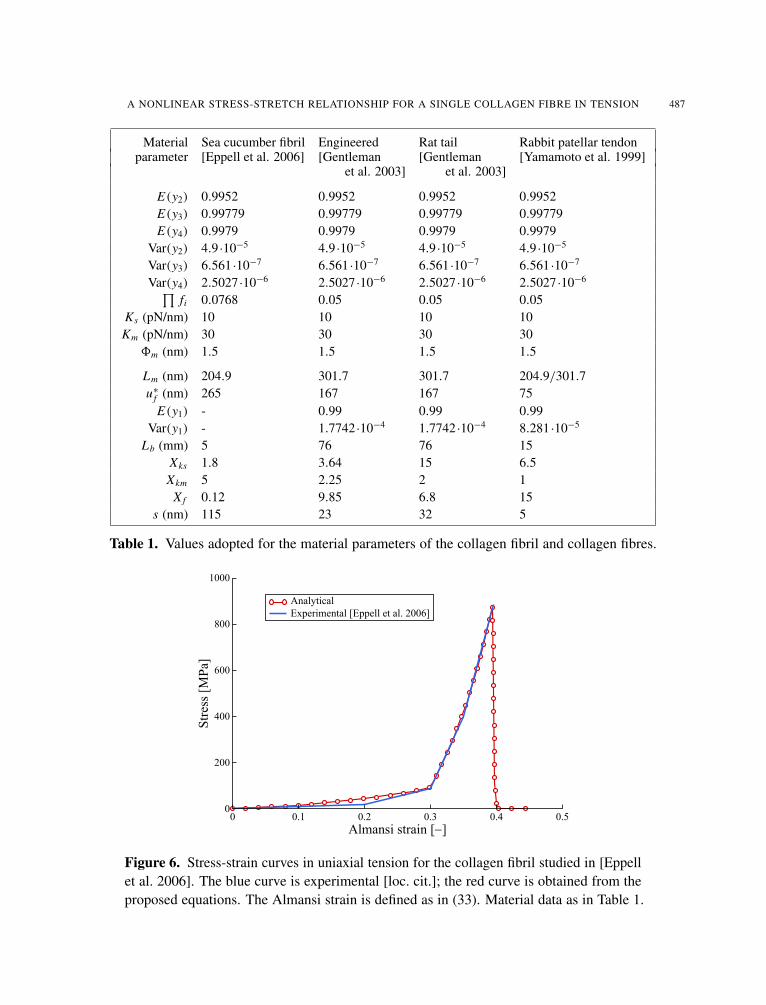
A NONLINEAR STRESS-STRETCH RELATIONSHIP FOR A SINGLE COLLAGEN FIBRE IN TENSION 487
Material Sea cucumber fibril Engineered Rat tail Rabbit patellar tendonparameter [Eppell et al. 2006] [Gentleman [Gentleman [Yamamoto et al. 1999]
et al. 2003] et al. 2003]
E(y2) 0.9952 0.9952 0.9952 0.9952E(y3) 0.99779 0.99779 0.99779 0.99779E(y4) 0.9979 0.9979 0.9979 0.9979
Var(y2) 4.9·10−5 4.9·10−5 4.9·10−5 4.9·10−5
Var(y3) 6.561·10−7 6.561·10−7 6.561·10−7 6.561 ·10−7
Var(y4) 2.5027·10−6 2.5027·10−6 2.5027·10−6 2.5027·10−6∏fi 0.0768 0.05 0.05 0.05
Ks (pN/nm) 10 10 10 10Km (pN/nm) 30 30 30 30
8m (nm) 1.5 1.5 1.5 1.5
Lm (nm) 204.9 301.7 301.7 204.9/301.7u∗f (nm) 265 167 167 75
E(y1) - 0.99 0.99 0.99Var(y1) - 1.7742·10−4 1.7742·10−4 8.281 ·10−5
Lb (mm) 5 76 76 15Xks 1.8 3.64 15 6.5Xkm 5 2.25 2 1
X f 0.12 9.85 6.8 15s (nm) 115 23 32 5
Table 1. Values adopted for the material parameters of the collagen fibril and collagen fibres.
1000
800
600
400
200
0
Str
ess
[MP
a]
0 0.1Almansi strain [−]
AnalyticalExperimental [Eppell et al. 2006]
0.2 0.3 0.4 0.5
Figure 6. Stress-strain curves in uniaxial tension for the collagen fibril studied in [Eppellet al. 2006]. The blue curve is experimental [loc. cit.]; the red curve is obtained from theproposed equations. The Almansi strain is defined as in (33). Material data as in Table 1.

488 FRANCESCO GENNA
their product, based on the considerations presented in Section 4. A good agreement between experi-mental and analytical results could be found for this special example. The analytical result provides theexpected value for the fibril stress; for this example, the peak stress expected value is 884 MPa, to whicha predicted standard deviation of 4157 MPa corresponds.
3.2. Engineered collagen fibre, from [Gentleman et al. 2003]. The next example concerns the engi-neered collagen fibre studied in [loc. cit.]. Figure 7 shows tensile stress-strain curves: one as presentedin [loc. cit.], and the others as obtained from the proposed analytical approach. The Biot strain in theabscissa — the same adopted in [loc. cit.] — is defined as
εBiot =u1
Lb. (34)
A good agreement between experimental results and analytical predictions can be observed. In this case,the peak stress expected value is 70.8 MPa, and the corresponding standard deviation is 419.5 MPa.
The other curves, with white markers, refer to analytical results obtained from different choices ofmaterial parameters, in order to provide a brief sensitivity analysis: each curve refers to the modificationof a single parameter, with respect to those listed in Table 1. The following effects, easy to predict onthe basis of the meaning of the considered parameters, are visible:
• a reduction of the molecular failure displacement, u∗f , causes a reduction of both the global peakstress and strain, leaving the overall shape of the stress-strain curve unaltered;
• a reduction of the size of stage 2 of the molecular stiffness, through parameter s (see Figure 5),causes a corresponding increase of the overall stiffness, as well as of the global peak stress;
80
60
40
20
0
Str
ess
[MP
a]
0 0.05 0.10 0.15 0.20
Biot strain [�]
Experimental [Gentleman et al. 2003]
Analytical (see caption)
u* = 150 nm
s = 15 nm
K = 20 pN/nm
E( y ) = 0.98
X = 20
f
m
f
1
Figure 7. Stress-strain curves in uniaxial tension for the engineered collagen fibre stud-ied in [Gentleman et al. 2003]. The solid curve is experimental, from [loc. cit.]; all theother curves, with markers, are obtained from the proposed equations. The Biot strainis defined in (34). Material data as in Table 1.
A NONLINEAR STRESS-STRETCH RELATIONSHIP FOR A SINGLE COLLAGEN FIBRE IN TENSION 489
200
150
100
50
0
Str
ess
[MP
a]
0 0.05Biot strain [−]
AnalyticalExperimental [Gentleman et al. 2003]
0.10 0.15 0.20 0.25
Figure 8. Stress-strain curves in uniaxial tension for the rat tail collagen fibre studiedin [Gentleman et al. 2003]. The solid curve is experimental, from [loc. cit.]; the curvewith circles is obtained from the proposed equations. Material data as in Table 1.
• a reduction of the molecular stiffness Km has the opposite effect;
• a reduction of the expected value for the variable y1 of (4) causes a change of shape of the stress-strain curve, as well as a reduction of the peak stress for the fibre;
• an increase of the parameter X f causes a significant loss of ductility, as expected.
The model is relatively insensitive to small variations of the variances for the single variables yi of (4).
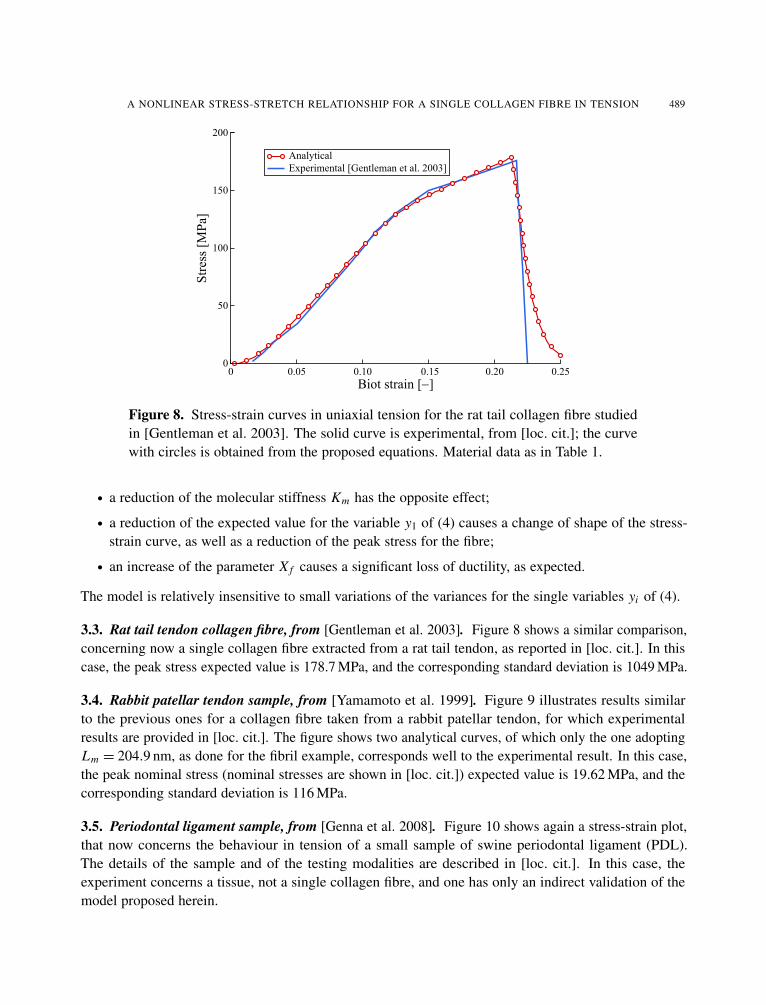
3.3. Rat tail tendon collagen fibre, from [Gentleman et al. 2003]. Figure 8 shows a similar comparison,concerning now a single collagen fibre extracted from a rat tail tendon, as reported in [loc. cit.]. In thiscase, the peak stress expected value is 178.7 MPa, and the corresponding standard deviation is 1049 MPa.
3.4. Rabbit patellar tendon sample, from [Yamamoto et al. 1999]. Figure 9 illustrates results similarto the previous ones for a collagen fibre taken from a rabbit patellar tendon, for which experimentalresults are provided in [loc. cit.]. The figure shows two analytical curves, of which only the one adoptingLm = 204.9 nm, as done for the fibril example, corresponds well to the experimental result. In this case,the peak nominal stress (nominal stresses are shown in [loc. cit.]) expected value is 19.62 MPa, and thecorresponding standard deviation is 116 MPa.
3.5. Periodontal ligament sample, from [Genna et al. 2008]. Figure 10 shows again a stress-strain plot,that now concerns the behaviour in tension of a small sample of swine periodontal ligament (PDL).The details of the sample and of the testing modalities are described in [loc. cit.]. In this case, theexperiment concerns a tissue, not a single collagen fibre, and one has only an indirect validation of themodel proposed herein.

490 FRANCESCO GENNA
25
20
15
10
5
0
Nom
inal
str
ess
[MP
a]
0 0.05 0.10 0.15 0.20Biot strain [−]
Analytical, L = 204.9 nmAnalytical, L = 301.7 nmExperimental [Yamamoto et al. 1999]
m
m
Figure 9. Stress-strain curves in uniaxial tension for the rabbit patellar collagen fibrestudied in [Yamamoto et al. 1999]. The solid curve is experimental, from [loc. cit.]; thecurves with markers are obtained from the proposed equations, and refer to differentmolecular lengths Lm as indicated. The nominal stress is force divided by initial cross-section area. Material data as in Table 1.
4
3
2
1
0
Str
ess
[MP
a]
0 0.5 1.0 1.5 2.0Green-Lagrange strain [−]
AnalyticalExperimental [Genna et al. 2008]
Figure 10. Stress-strain curves in uniaxial tension for one of the periodontal ligamentsamples studied in [Genna et al. 2008]. The solid curve is experimental, from [loc. cit.];the curve with circles is obtained by means of the model of [Genna 2006], in which theequations developed in the present work have been inserted for the behaviour in tensionof a single collagen fibre. The Green–Lagrange strain is defined as in (35) of the text.Material data as in Table 2.

A NONLINEAR STRESS-STRETCH RELATIONSHIP FOR A SINGLE COLLAGEN FIBRE IN TENSION 491
The Green–Lagrange strain plotted in abscissa in Figure 10, as adopted in [loc. cit.], is defined as
εGL =12
[(Lb+ u1
Lb
)2
− 1]. (35)
In this case, (31) is inserted into an interface model, presented in [Genna 2006], that allows one, bymeans of yet another statistical integration over the waviness of the collagen fibres, to describe the tissuefeatures. The accompanying paper [Genna and Paganelli 2014] makes extensive use of this model forstudying the extraction of a tooth from its socket; we refer to [Genna 2006] and [Genna and Paganelli2014] for more details of the interface description.
The main parameters required by the PDL model of [Genna 2006] are:
• the thickness w0 of the PDL layer;
• the angle β0 that defines the inclination of the collagen fibres in a longitudinal section of the tooth;
• the angle θ0 that defines the inclination of the collagen fibres in a transversal section of the tooth;
• the volume fraction fc of stress-carrying collagen fibres inside the PDL;
• statistical properties of the collagen fibres waviness in the PDL, described by the variable xc whichis the ratio between the uncoiled, unstretched length of a collagen fibre and its end-to-end distanceat rest, governed by w0, β0, and θ0;
• data for the constitutive law of a single collagen fibre, that here correspond to the 19 parametersrequired by the proposed stress-stretch model;
• other parameters that define the compressive behaviour of the PDL, of no interest here.
Table 2 reports all the relevant data adopted to obtain the result shown in Figure 10. In Table 2 theparameter Lb, denoting the uncoiled length of a collagen fibre at rest, is marked as a random variable,since its value now depends on the statistics of the waviness of the fibre, i.e., on the current values of xc
during the integration process.
E(y2) 0.9952 u∗f 167 nm w0 0.66 mmE(y3) 0.99779 E(y1) 0.995 β0 34◦
E(y4) 0.9979 Var(y1) 1.2078·10−4 θ0 76.8◦
Var(y2) 4.9·10−5 Lb random variable fc 0.05Var(y3) 6.561·10−7 Xks 1 E(xc) 1.093Var(y4) 2.5027·10−6 Xkm 1 Var(xc) 0.00397
f0 f1 f2 f3 0.05 X f 0Ks 10 pN/nm s 50 nmKm 30 pN/nm8m 1.5 nmLm 301.7 nm
Table 2. Adopted values for the material parameters of the periodontal ligament samplestudied in [Genna et al. 2008].

492 FRANCESCO GENNA
4
3
2
1
0
Str
ess
[MP
a]
0 0.5 1.0 1.5 2.0 2.5Shear strain [−]
PDL model [Genna 2006] + presentExperimental [Genna et al. 2008]
Figure 11. Stress-strain curves in shear for one of the periodontal ligament samplesstudied in [Genna et al. 2008]. The solid curve is experimental, from [loc. cit.]; the curvewith circles is obtained by means of the model of [Genna 2006], in which the equationsdeveloped in the present work have been inserted for the behaviour in tension of a singlecollagen fibre. The shear strain is defined as the ratio between the displacement and thewidth at rest of the sample. Material data as in Table 2 except for w0 = 0.33 mm andβ0 =−7◦.
It is worth remarking, here, that the failure Biot strain of a single collagen fibre, with the data adoptedto obtain the result of Figure 10, is εf ≈ 0.55. As already observed, this quite large value is an indicationof the probable lack of crosslinking in the PDL collagen.
Finally, Figure 11 shows a comparison obtained in the same way as the previous one, but on a differentswine PDL sample, and for a different type of loading, i.e., shear in a plane normal to the tooth axis[Genna et al. 2008]. The curves in Figure 11 show a shear stress in ordinate, and, in abscissa, a shearstrain defined as the ratio between the shear displacement and the width w0 of the PDL sample. Forthis case the adopted data are the same as in Table 2, with the exception of w0 and β0, which are noww0 = 0.33 mm and β0 =−7◦.
4. Discussion
A main source of difficulty for the model proposed here is the choice of the material parameter values.Results of a detailed sensitivity analysis, beside what was shown in Figures 7 and 9, are not reportedhere for the sake of brevity.
All the data concerning the statistics of the quantities yi of (4), shown in Tables 1 and 2, have beenrederived following the same approach adopted in [AG]. A partial confirmation of their usability derivesfrom the result shown in Figure 6, which refers to a subcomponent of the fibres.
A precise evaluation of the volume fractions fi of stress-carrying cables at the various sublevels canhardly be given. The following approach was therefore followed: a single cable at level i is assumed to

A NONLINEAR STRESS-STRETCH RELATIONSHIP FOR A SINGLE COLLAGEN FIBRE IN TENSION 493
have a circular cross-section; fibrous matter is assumed to be present in cables, at level i + 1, also havinga circular cross-section. For a full packing of infinite equal circles, the volume fraction of fibrous matterwould be equal to π/
√12 ≈ 0.907, at each sublevel. Assuming a large but finite number of internal
circles, one can adopt a smaller value, that we chose equal to 0.85. Furthermore, it was necessary todefine what part of the fibrous subcomponents, at each level, was continuous, i.e., stress-carrying: weassumed that only one half of the fibrous matter was continuous, thus obtaining a value fi ≈ 0.425.Therefore, one finds f0 f1 f2 f3 ≈ 0.4254
= 0.033, rounded to f0 f1 f2 f3 = 0.05, and f1 f2 f3 = 0.0768 forthe fibril, with N = 3, as shown in Tables 1 and 2.
More difficulties arise in defining several molecular parameters. We started by reasoning on the caseof the periodontal ligament (PDL), in order to exclude the effects of crosslinking: in this tissue, in fact,the stress-carrying fibres seem to behave as if little or no crosslinking at all were present. This couldbe inferred from (i) the very low stiffness values, and the very large failure strains, compared to othertissues, observed in PDL samples [AG], and (ii) as said in Section 3.3, from the high value of the singlefibre failure strain. No quantitative description of this aspect could be found; [Berkovitz et al. 1995]reports that PDL has “unique” crosslinking features, with respect to all other tissues, but no informationis given about the relevance of this property with respect to mechanical behaviour.
Thus, the stress-carrying collagen fibres of the PDL were assumed to be uncrosslinked. This implies,in the approach illustrated here, to adopt Xks = Xkm = 1 and X f = 0, which allows one to reason aboutraw molecular data.
In order to obtain a good match with the experimental result in tension of Figure 10, the valuesKs = 10 pN/nm, Km = 30 pN/nm, u∗f = 167 nm, and s = 50 nm were adopted (see Table 2).
The displacement values agree reasonably well with the corresponding ones reported in [Buehler andWong 2007], which are u∗f = 150 nm and s = 90 nm. On the contrary, the molecular stiffness ones donot, since our Km is ten times smaller than the one obtained in [Buehler and Wong 2007], and Ks isabout 1/5. It is extremely difficult to obtain coherent information about these data from the literature,for several reasons. A relationship exists that relates the bending stiffness of a tropocollagen moleculeto its persistence length, but this seems to hold for the entropic regime only, neglected here. Anotherrelationship which provides the molecular stiffness in the stretching range derives from standard trusstheory, and is
Km =Em Am
Lm, (36)
where Em denotes the molecule Young modulus. According to several sources (see, for instance, [Gau-tieri et al. 2012]), the Young modulus of a collagen molecule takes values in the range Em = 300–16000 pN/nm2 (i.e., MPa), depending both on the evaluation modalities and on the considered strain rate,both in experiments and in numerical simulations based on molecular dynamics theory.
Adopting an average value Em = 5000 pN/nm2, equation (36) yields Km = 29.98 pN/nm. On the otherhand, a value Em = 5000 pN/nm2 hardly agrees with further data reported in [Buehler and Wong 2007],where the bending stiffness of a single molecule is reported to vary between Em Im = 1.247× 10⁻²⁹ Nm2
and Em Im = 1.2× 10⁻²⁸ Nm2, depending on the assumed strain rate, Im denoting the molecule momentof inertia around its neutral axis. Assuming for the molecule a circular cross-section with diameter8m = 1.5 nm, the first value corresponds to Em ≈ 50 pN/nm2, and the second to Em ≈ 500 pN/nm2.

494 FRANCESCO GENNA
On yet another hand, in order to obtain the stiffness value Km = 294.8 pN/nm proposed in [Buehler andWong 2007] for the molecular stretching regime, (36) would require a value Em ≈ 50000 pN/nm2, welloutside the reported range of values. This uncertainty on the value of Km may arise from the intrinsic mea-surement difficulties, from confusion between entropic and energetic behaviour, from presence/absenceof crosslinking, strain-rate effects, solvated/dry conditions during the test, and so on.
In order to obtain results from the stress-stretch model proposed in this work, it was arbitrarily decidedto assume as valid the average value Em = 5000 pN/nm2, which corresponds to Km ≈ 30 pN/nm, for theuncrosslinked, basic molecular stiffness. All the choices for the molecular parameters are made verydifficult by the lack of reliable experimental results; even the basic molecular length Lm does not seeagreement on its values (here we have been forced to adopt the values Lm = 204.9 nm or Lm = 301.7 nmin different cases.)
As for Ks , the molecular stiffness associated to the chain uncoiling, the situation is even less clearthan for Km . Its value could only be identified, and it was taken equal to Ks = 10 pN/nm, in a proportionto Km about twice as that indicated in [Buehler and Wong 2007].
The numerical values of the three parameters Xks, Xkm , and X f , that govern crosslinking, in the resultsof Figures 7, 8, and 9, had to be identified case by case.
As for the last rows in Table 2, that concern the data defining the PDL behaviour, we refer to [Genna2006], except for fc of Section 3.3. In [loc. cit.] every single collagen fibre was supposed to run continu-ously from end to end of the PDL layer, and the value for the fibre volume fraction fc was taken from theliterature as equal to fc = 0.5. Recent work [Trombetta and Bradshaw 2010] confirms that fc = 0.5 is areasonable estimate of the average value for the volume fraction of the fibrous component in the PDL. Inthe new model, only the stress-carrying portion of it is considered, which, at least according to availableimages of the PDL, is only a small fraction of the total. In order to obtain a good match with theexperimental stress-strain results, the value fc = 0.05 had to be adopted, as shown in Table 2.
An uncertainty remains about the shape of the stress-strain curves of both Figures 8 and 9, and therelevant material data, shown in Table 1. Work by Gutsmann et al. [2004] suggests that a plateau in thestress-strain curve of collagen might be due to crosslinking; the model proposed here might reproduce thiseffect through the reduction of the upper integration limit zC ((27) and (28)), for increasing displacementu1, until the stiffer portion of the molecular behaviour disappears from the picture. Nevertheless, withthe set of material parameters herein adopted, and especially in view of the narrow extension of themolecular force-displacement law covered by the statistics of the variable z4 of (12), it was impossibleto obtain such an effect automatically. The only way to reproduce it was to adopt Xks Ks < Xkm Km asshown by Table 1, whose meaning remains unclear.
The simplicity of the model proposed herein allows one to consider any type of mechanical behaviourat the lowermost level — for instance, viscosity — with no conceptual difficulty.
Other considerations, similar to those already reported in [AG], remain still valid also for this modified,simplified, and improved version of the same approach.
5. Conclusions
No attempt has been made, here, to propose a complete and accurate representation of the physicalmicrostructure of a single collagen fibre. The aim has been to obtain a simple and engineering-usable

A NONLINEAR STRESS-STRETCH RELATIONSHIP FOR A SINGLE COLLAGEN FIBRE IN TENSION 495
(for instance, in large-scale 3D finite element calculations) set of equations that describe the nonlinearmechanical behaviour of this important biological component, based on a set of parameters having,where possible, a clear physical meaning. Several features of the real arrangement of subcomponents areexplicitly taken into account, but several other important details still require more study. The ability toreproduce experimental results on the basis of reasonable values of the material parameters is howeverencouraging. An accompanying paper [Genna and Paganelli 2014] illustrates the performance of themodel presented herein in the context of finite element simulations at the macroscopic scale.
References
[Annovazzi and Genna 2010] L. Annovazzi and F. Genna, “An engineering, multiscale constitutive model for fiber-formingcollagen in tension”, J. Biomed. Mater. Res. A 92A:1 (2010), 254–266.
[Berkovitz et al. 1995] B. K. B. Berkovitz, B. J. Moxham, and H. N. Newman, The periodontal ligament in health and disease,2nd ed., Mosby-Wolfe, London, 1995.
[Bozec and Horton 2005] L. Bozec and M. Horton, “Topography and mechanical properties of single molecule of type Icollagen using atomic force microscopy”, Biophys. J. 88:6 (2005), 4223–4231.
[Buehler and Wong 2007] M. J. Buehler and S. Y. Wong, “Entropic elasticity controls nanomechanics of single tropocollagenmolecule”, Biophys. J. 93:1 (2007), 37–43.
[Bustamante et al. 2000] C. Bustamante, S. B. Smith, J. Liphardt, and D. Smith, “Single-molecule studies of DNA mechanics”,Curr. Opin. Struct. Biol. 10:3 (2000), 279–285.
[Cacho et al. 2007] F. Cacho, P. J. Elbischger, J. F. Rodriguez, M. Doblaré, and G. A. Holzapfel, “A constitutive model forfibrous tissues considering collagen fiber crimp”, Int. J. Non-Linear Mech. 42:2 (2007), 391–402.
[Eppell et al. 2006] S. J. Eppell, B. N. Smith, H. Kahn, and R. Ballarini, “Nano measurements with micro-devices: Mechanicalproperties of hydrated collagen fibrils”, J. R. Soc. Interface 3:6 (2006), 117–121.
[Gautieri et al. 2012] A. Gautieri, S. Vesentini, A. Redaelli, and M. Buehler, “Viscoelastic properties of model segments ofcollagen molecules”, Matrix Biol. 31:2 (2012), 141–149.
[Genna 2006] F. Genna, “A micromechanically-based, three-dimensional interface finite element for the modelling of theperiodontal ligament”, Comput. Methods Biomech. Biomed. Engin. 9:4 (2006), 243–256.
[Genna and Paganelli 2014] F. Genna and C. Paganelli, “Force–displacement relationship in the extraction of a porcine toothfrom its socket: Experiments and numerical simulations”, J. Mech. Mater. Struct. 9:5 (2014), 497–514.
[Genna et al. 2008] F. Genna, L. Annovazzi, C. Bonesi, P. Fogazzi, and C. Paganelli, “On the experimental determination ofsome mechanical properties of porcine periodontal ligament”, Meccanica 43:1 (2008), 55–73.
[Gentleman et al. 2003] E. Gentleman, A. Lay, D. Dickerson, E. Nauman, G. Livesay, and K. Dee, “Mechanical characterizationof collagen fibers and scaffolds for tissue engineering”, Biomater. 24:21 (2003), 3805–3813.
[Goodman 1960] L. A. Goodman, “On the exact variance of products”, J. Amer. Stat. Assoc. 55:292 (1960), 708–713.
[Goodman 1962] L. A. Goodman, “The variance of the product of K random variables”, J. Amer. Stat. Assoc. 57:297 (1962),54–60.
[Grytz and Meschke 2009] R. Grytz and G. Meschke, “Constitutive modeling of crimped collagen fibrils in soft tissues”, J.Mech. Behav. Biomed. Mater. 2:5 (2009), 522–533.
[Gutsmann et al. 2004] T. Gutsmann, G. Fantner, J. Kindt, M. Venturoni, S. Danielsen, and P. Hansma, “Force spectroscopy ofcollagen fibers to investigate their mechanical properties and structural organization”, Biophys. J. 86:5 (2004), 3186–3193.
[Kastelic et al. 1978] J. Kastelic, A. Galeski, and E. Baer, “The multicomposite structure of tendon”, Connect. Tissue Res. 6:1(1978), 11–23.
[Limbert 2011] G. Limbert, “A mesostructurally-based anisotropic continuum model for biological soft tissues—decoupledinvariant formulation”, J. Mech. Behav. Biomed. Mater. 4:8 (2011), 1637–1657.

496 FRANCESCO GENNA
[Petruska and Hodge 1964] J. Petruska and A. Hodge, “A subunit model for the tropocollagen macromolecule”, Proc. Nat.Acad. Sci. USA 51:5 (1964), 871–876.
[Pins et al. 1997] G. Pins, E. Huang, D. Christiansen, and F. Silver, “Effects of static axial strain on the tensile properties andfailure mechanisms of self-assembled collagen fibers”, J. Appl. Polym. Sci. 63:11 (1997), 1429–1440.
[Ross 2004] S. M. Ross, Introduction to probability and statistics for engineers and scientists, 3rd ed., Academic Press, Burling-ton, MA, 2004.
[Thompson and Czernuszka 1995] J. I. Thompson and J. T. Czernuszka, “The effect of two types of cross-linking on somemechanical properties of collagen”, Biomed. Mater. Eng. 5:1 (1995), 37–48.
[Trombetta and Bradshaw 2010] J. M. Trombetta and A. D. Bradshaw, “SPARC/Osteonectin functions to maintain homeostasisof the collagenous extracellular matrix in the periodontal ligament”, J. Histochem. Cytochem. 58:10 (2010), 871–879.
[Wang et al. 1997] J. L. Wang, M. Parnianpour, A. Shirazi-Adl, and A. E. Engin, “Failure criterion of collagen fiber: Viscoelas-tic behavior simulated by using load control data”, Theor. Appl. Fract. Mech. 27:1 (1997), 1–12.
[Yamamoto et al. 1999] E. Yamamoto, K. Hayashi, and N. Yamamoto, “Mechanical properties of collagen fascicles from therabbit patellar tendon”, J. Biomech. Eng. (ASME) 121:1 (1999), 124–131.
Received 19 Feb 2014. Revised 16 Jun 2014. Accepted 14 Jul 2014.
FRANCESCO GENNA: [email protected] of Civil Engineering, University of Brescia, Via Branze 43, I-25123 Brescia, Italy
mathematical sciences publishers msp

JOURNAL OF MECHANICS OF MATERIALS AND STRUCTURESmsp.org/jomms
Founded by Charles R. Steele and Marie-Louise Steele
EDITORIAL BOARD
ADAIR R. AGUIAR University of São Paulo at São Carlos, BrazilKATIA BERTOLDI Harvard University, USA
DAVIDE BIGONI University of Trento, ItalyIWONA JASIUK University of Illinois at Urbana-Champaign, USA
THOMAS J. PENCE Michigan State University, USAYASUHIDE SHINDO Tohoku University, JapanDAVID STEIGMANN University of California at Berkeley
ADVISORY BOARD
J. P. CARTER University of Sydney, AustraliaD. H. HODGES Georgia Institute of Technology, USA
J. HUTCHINSON Harvard University, USAD. PAMPLONA Universidade Católica do Rio de Janeiro, Brazil
M. B. RUBIN Technion, Haifa, Israel
PRODUCTION [email protected]
SILVIO LEVY Scientific Editor
Cover photo: Wikimedia Commons
See msp.org/jomms for submission guidelines.
JoMMS (ISSN 1559-3959) at Mathematical Sciences Publishers, 798 Evans Hall #6840, c/o University of California, Berkeley,CA 94720-3840, is published in 10 issues a year. The subscription price for 2014 is US $555/year for the electronic version, and$710/year (+$60, if shipping outside the US) for print and electronic. Subscriptions, requests for back issues, and changes of addressshould be sent to MSP.
JoMMS peer-review and production is managed by EditFLOW® from Mathematical Sciences Publishers.
PUBLISHED BY
mathematical sciences publishersnonprofit scientific publishing
http://msp.org/© 2014 Mathematical Sciences Publishers
Journal of Mechanics of Materials and StructuresVolume 9, No. 5 September 2014
Buckling of two-phase inhomogeneous columns at arbitrary phase contrasts andvolume fractions MOHAMMED G. ALDADAH,
SHIVAKUMAR I. RANGANATHAN and FARID H. ABED 465A nonlinear stress-stretch relationship for a single collagen fibre in tension
FRANCESCO GENNA 475Force–displacement relationship in the extraction of a porcine tooth from its socket:
experiments and numerical simulationsFRANCESCO GENNA and CORRADO PAGANELLI 497
Nonuniform shear strains in torsional Kolsky bar tests on soft specimensADAM SOKOLOW and MIKE SCHEIDLER 515
Transient elastic-viscoplastic dynamics of thin sheetsALI A. ATAI and DAVID J. STEIGMANN 557
1559-3959(2014)9:5;1-5
JournalofMechanics
ofMaterials
andStructures
2014V
ol.9,No.5