journal of mechanical engineering 2011 1
DESCRIPTION
The Strojniški vestnik – Journal of Mechanical Engineering publishes theoretical and practice oriented papaers, dealing with problems of modern technology...TRANSCRIPT

no. 1year 2011
volume 57Jour
nal o
f Mec
hani
cal E
ngin
eeri
ng -
Str
ojni
ški v
estn
ik57
(201
1) 1
Since 195557 (2
011)
1

Strojniški vestnik – Journal of Mechanical Engineering (SV-JME)
© 2011 Strojniški vestnik - Journal of Mechanical Engineering. All rights reserved. SV-JME is indexed / abstracted in: SCI-Expanded, Compendex, Inspec, ProQuest-CSA, SCOPUS, TEMA. The list of the remaining bases, in which SV-JME is indexed, is available on the website. The journal is subsidized by Slovenian Book Agency.
Strojniški vestnik - Journal of Mechanical Engineering is also available on http://www.sv-jme.eu, where you access also to papers’ supplements, such as simulations, etc.
Editor in ChiefVincenc ButalaUniversity of Ljubljana Faculty of Mechanical Engineering, Slovenia
Co-EditorBorut BuchmeisterUniversity of MariborFaculty of Mechanical Engineering, Slovenia
Technical EditorPika ŠkrabaUniversity of Ljubljana Faculty of Mechanical Engineering, Slovenia
Editorial OfficeUniversity of Ljubljana (UL)Faculty of Mechanical EngineeringSV-JMEAškerčeva 6, SI-1000 Ljubljana, SloveniaPhone: 386-(0)1-4771 137Fax: 386-(0)1-2518 567E-mail: [email protected]://www.sv-jme.eu
Founders and PublishersUniversity of Ljubljana (UL)Faculty of Mechanical Engineering, Slovenia
University of Maribor (UM)Faculty of Mechanical Engineering, Slovenia
Association of Mechanical Engineers of Slovenia
Chamber of Commerce and Industry of SloveniaMetal Processing Industry Association
International Editorial BoardKoshi Adachi, Graduate School of Engineering,Tohoku University, JapanBikramjit Basu, Indian Institute of Technology, Kanpur, IndiaAnton Bergant, Litostroj Power, Slovenia Franci Čuš, UM, Faculty of Mech. Engineering, SloveniaNarendra B. Dahotre, University of Tennessee, Knoxville, USAMatija Fajdiga, UL, Faculty of Mech. Engineering, SloveniaImre Felde, Bay Zoltan Inst. for Mater. Sci. and Techn., HungaryJože Flašker, UM, Faculty of Mech. Engineering, SloveniaBernard Franković, Faculty of Engineering Rijeka, CroatiaJanez Grum, UL, Faculty of Mech. Engineering, SloveniaImre Horvath, Delft University of Technology, NetherlandsJulius Kaplunov, Brunel University, West London, UKMilan Kljajin, J.J. Strossmayer University of Osijek, CroatiaJanez Kopač, UL, Faculty of Mech. Engineering, SloveniaFranc Kosel, UL, Faculty of Mech. Engineering, SloveniaThomas Lübben, University of Bremen, GermanyJanez Možina, UL, Faculty of Mech. Engineering, SloveniaMiroslav Plančak, University of Novi Sad, SerbiaBrian Prasad, California Institute of Technology, Pasadena, USABernd Sauer, University of Kaiserlautern, GermanyBrane Širok, UL, Faculty of Mech. Engineering, SloveniaLeopold Škerget, UM, Faculty of Mech. Engineering, SloveniaGeorge E. Totten, Portland State University, USANikos C. Tsourveloudis, Technical University of Crete, GreeceToma Udiljak, University of Zagreb, CroatiaArkady Voloshin, Lehigh University, Bethlehem, USA
President of Publishing CouncilJože DuhovnikUL, Faculty of Mechanical Engineering, Slovenia
PrintTiskarna Present d.o.o., Ižanska cesta 383, Ljubljana, Slovenia
General informationStrojniški vestnik – The Journal of Mechanical Engineering is published in 11 issues per year (July and August is a double issue). Institutional prices include print & online access: institutional subscription price €100,00, general public subscription €25,00, student subscription €10,00, foreign subscription €100,00 per year. The price of a single issue is €5,00. Prices are exclusive of tax. Delivery is included in the price. The recipient is responsible for paying any import duties or taxes. Legal title passes to the customer on dispatch by our distributor. Single issues from current and recent volumes are available at the current single-issue price.To order the journal, please complete the form on our website. For submissions, subscriptions and all other information please visit: http://en.sv-jme.eu/ You can advertise on the inner and outer side of the back cover of the magazine.We would like to thank the reviewers who have taken part in the peer-review process.
Cover: Laboratory laser setup and the emergence of the laser pulse (bellow).
Image courtesy: Fotona d.d., Ljubljana
ISSN 0039-2480
Aim and ScopeThe international journal publishes original and (mini)review articles covering the concepts of materials science, mechanics, kinematics, thermodynamics, energy and environment, mechatronics and robotics, fluid mechanics, tribology, cybernetics, industrial engineering and structural analysis. The journal follows new trends and progress proven practice in the mechanical engineering and also in the closely related sciences as are electrical, civil and process engineering, medicine, microbiology, ecology, agriculture, transport systems, aviation, and others, thus creating a unique forum for interdisciplinary or multidisciplinary dialogue.The international conferences selected papers are welcome for publishing as a special issue of SV-JME with invited co-editor(s).

Strojniški vestnik - Journal of Mechanical Engineering 57(2011)1Contents
Contents
Strojniški vestnik - Journal of Mechanical Engineeringvolume 57, (2011), number 1
Ljubljana, January 2011ISSN 0039-2480
Published monthly
PapersAleš Bizjak, Karolj Nemeš, Janez Možina: Rotating-Mirror Q-Switched Er:YAG Laser for
Optodynamic Studies 3Burak Dikici, Cagri Tekmen, Mehmet Gavgali, Umit Cocen.: The Effect of Electroless
Ni Coating of SiC Particles on the Corrosion Behavior of A356 Based Squeeze Cast Composite 11
Miha Pirnat, Zdenko Savšek, Miha Boltežar: Measuring Dynamic Loads on a Foldable City Bicycle 21
Stipe Čelar, Eugen Mudnić, Sven Gotovac: Interrelation between ERP Modification and Modification Scheduling: Four SME Case Studies in Croatia 27
Liangmo Wang, Yufa Chen, Chenzhi Wang, Qingzheng Wang: Fatigue Life Analysis of Aluminum Wheels by Simulation of Rotary Fatigue Test 31
Liviu Marsavina, Andrew D. Nurse: Comparison between Elastic-Perfectly-Plastic Interfacial Free-Edge and Crack Tip Singular Fields 40
Roman Staniek: Shaping of Face Toothing in Flat Spiroid Gears 47Jelena Borocki, Ilija Cosic, Bojan Lalic, Rado Maksimovic: Analysis of Company Development
Factors in Manufacturing and Service Company: a Strategic Approach 55Nina Andjelić: Nonlinear Approach to Thin-Walled Beams with a Symmetrical Open Section 69
Instructions for Authors 78


Strojniški vestnik - Journal of Mechanical Engineering 57(2011)1, 3-10 Paper received: 27.05.2010DOI:10.5545/sv-jme.2010.120 Paper accepted: 18.10.2010
*Corr. Author’s Address: I.H.S. d.o.o., Cesta 4. julija 84 D, 8270 Krško, Slovenia, [email protected] 3
Rotating-Mirror Q-Switched Er:YAG Laser for Optodynamic Studies
Bizjak, A - Nemeš, K. - Možina, J.Aleš Bizjak1,* - Karolj Nemeš2 - Janez Možina3
1 I.H.S. d.o.o., Slovenia 2 Fotona d.d., Slovenia
3 University of Ljubljana, Faculty of Mechanical Engineering, Slovenia
In this article a development of a simple, reliable and repeatable Q-switched Er:YAG laser with a pulse duration of 270 ns and energies up to 16 mJ in a TEM00 spatial beam mode is presented. The Q-switching is performed mechanically with a flat, highly reflective silicon rotating mirror. The laser pumping chamber is cooled with thermally stabilized de-ionized water. This laser is intended for optodynamic studies of the short Er:YAG laser pulses with various media, primarily those containing water, where the thermal diffusion effects are negligible.©2011 Journal of Mechanical Engineering. All rights reserved. Keywords: Er:YAG laser, Q-switch, inverse population, optodynamics, Xe flash lamp, rotating mirror
0 INTRODUCTION
The Er:YAG laser is a well-accepted tool in many medical applications, like the ablation of hard and soft dental tissue as well as in various areas of dermatology [1] to [3]. For all these applications the Er:YAG laser operates in a free-running mode with laser-pulse durations from several tens of μs up to several ms. The interaction is based on the coincidence of the Er:YAG laser wavelength (2940 nm) with the absorption peak of water (absorption coefficient μa = 13,300 cm-1 [4] and [5]. This high absorption leads to a very shallow (several μm) penetration depth in the water as well as in all water-rich biological tissue. During the interaction of the laser pulses with the biological tissue, part of the laser-pulse energy is used up for ablation (depending on the instantaneous laser pulse power and the fluence), while the remaining part of the pulse energy during the laser pulse leaves the interaction region with diffusion that has a characteristic diffusion length of (4DT)1/2 (D is the diffusivity of the media and T is the laser-pulse duration). Recently, interactions in which the diffusion of heat from the interaction region during the laser pulse can be neglected became of some interest. Any study of this type of interaction obviously needs a very-short-pulse Er:YAG laser.
Approaches for the reliable, Q-switched operation of an Er:YAG laser have already been described in the literature [6] to [8]. Most of these approaches need special materials and expensive components like undoped Nd:YAG crystals cut and polished at precise angles or specially designed electro-optic Q-Switches based on LiNbO3 crystals and high-voltage Q-switch drivers. The repeatability and long lifetime, as well as the easy set-up of the experimental laboratory, are important issues. Since the rotating-mirror and Q-switched lasers (Nd:YAG, Er:glass, and others) are already known for their reliability and repeatability, we decided to use this approach for the Q-switched Er:YAG laser as well.
The Er:YAG laser is a complex, rare-earth, solid-state crystal laser in which 50% of the yttrium ions are replaced with Er3+ ions. The laser is exited with Xe flash lamps [9]. Since the laser operates at fairly high pumping energies, efficient cooling of both, the laser rod and the flash lamp is accomplished with de-ionized water. The Er:YAG laser is one of the rare lasers that operate at a wavelength near 3 μm at room temperature.
The basic Q-switching technique for the rotating-mirror laser is well known and described elsewhere [10], and only the main principles are shown in Fig. 6. One of the resonator mirrors rotates at a constant frequency ω and passes the resonant alignment (with low losses) of the

Strojniški vestnik - Journal of Mechanical Engineering 57(2011)1, 3-10
4 Bizjak, A - Nemeš, K. - Možina, J.
resonator once in a single rotation. The laser rod is excited with a Xe flash map until a steady inversion population n is built up during the non-resonant condition of the laser. When the rotating mirror reaches the resonant position at time t0, the resonator losses abruptly fall to a level where laser oscillation starts and a fast build-up of photons from the inverse population creates a Q-switched laser pulse (Fig. 1 photon flux Φ).
Fig. 1. Dynamics of the inverse population n and the photon flux ф, according to the resonator
losses following the time t0
In an analysis of the Q-switched laser it is very important to understand the laser crystal population dynamics, Q-switch operation itself as well as the laser resonator structure.
The Er:YAG crystal’s laser energy levels are shown in Fig. 2.
Fig. 2. Simplified energy diagram with the most important transitions in an Er:YAG (50% at Er3+)
laser crystal
The laser operates at room temperature, and the laser emission that we are interested in develops between the states I11/2 and I13/2 at a wavelength of 2940 nm. I11/2 is the laser upper level, while I13/2 is the laser lower level. The excitation with the Xe flash lamp directly pumps the levels 4S3/2 with a pumping rate r1 (cm-3s-1) as well as the upper laser level I11/2 with the rate r2 (cm-3s-1). The highly lying levels 4S3/2 are very quickly depleted with transitions to the upper laser level and therefore contribute to the creation of an inverse population. The up-conversion w2 from the upper laser level pumps the 4S3/2 level. The up-conversion w1 depletes the lower laser level in such a manner that it contributes to the inverse population twice. Both, the upper and lower laser levels are Stark split. The population distribution in the Stark split levels follows the Boltzmann distribution – i.e., the populations are determined by Boltzmann factors [11]. It is important to emphasize that both pumping rates r1 and r2 are tied with r = r1 + r2 . In this article we assumed the relationship between the rates r1 and r2 to be k = r2 / (r1 + r2) [12].
Fig. 3. a) 50% doped Er:YAG crystal absorption spectrum; b) Xe flash lamp spectrum

Strojniški vestnik - Journal of Mechanical Engineering 57(2011)1, 3-10
5Rotating-Mirror Q-Switched Er:YAG Laser for Optodynamic Studies
t2 upper laser level lifetime [s]t3 4S3/2 lifetime [s]w1 coefficient of up-conversion process of
upper laser level [cm3s-1]w2 coefficient of up-conversion of lower
laser level [cm3s-1]tc photon lifetime in laser resonator [s].
The inversion population that is important for the laser emission is:
n = (b2n2 – a7n1), (5)
here, the degeneracy due to the Stark splitting of the upper and lower laser levels is taken into account.
The pumping rates’ time behaviors r1(t) and r2(t) are used in these equations as r1(t)= r1P(t) and r2(t) = r2P(t), where P(t) is the shape of the flash-lamp pumping pulse with an amplitude of 1. The relation between the pumping rates is a constant throughout, taken as k = r2/(r1+r2) = 0.6.
In order to check the above rate equations, they were numerically solved for a free-running Er:YAG laser (no Q-switching) for a rectangular flash-lamp current pulse of 300 μs duration, where for reasons of simplicity we used P(t) = 1-h(t-tp), where h(t) is a Heaviside step function and tp is the duration of the rectangular current pulse.
The constants used in Eqs. (1) to (4) were taken from reference [12]. The photon lifetimes were calculated for a resonator with plane/plane mirrors, an out coupling mirror transmitivity of 85% at 2940 nm, a ф 4 × 90 mm laser rod and an overall resonator length of 178 mm.
Typical results of the solutions are shown in Fig. 4.
Since the laser in free-running mode operates in mixed-mode operation, without limiting apertures inside the resonator, except for the ones at the laser-rod ends, we can obtain the laser efficiency curve by determining the time integral of the photon flux (proportional to the laser pulse energy) as well as the pumping rate (proportional to the flash-lamp pulse energy) for various pumping rates.
The curve in Fig. 5 predicts a linear relationship between the laser output energy on the flash-lamp pulse energy that is a typical result, obtained in all experiments for an Er:YAG laser operating in the free-running mode. Therefore, the
The Er:YAG laser is efficiently pumped by flash lamps filled with Xe since the pumping bands for the Er:YAG crystal are around 500, 650 and 750 to 800 nm and they overlap very well with the Xe flash lamp’s spectrum (Fig. 3).
1 POPULATION DYNAMICS OF AN Er:YAG LASER
The time evolution of pumping, the population of various levels as well as stimulated emission is described with rate equations. Due to the many processes that are present during the Er:YAG laser pumping these equations are fairly complex. For studying the population dynamics of the upper and lower laser levels of a flash-lamp-pumped Er:YAG laser as well as for the generation of laser emission, these equations can be simplified [12], and can be described using the equations below:
dndt
r t nt
w n31
3
32 2
2= − +( ) , (1)
dndt
r t nt
w n w n
nt
s b n a n
22
3
31 1
22 2
2
2
221 2 2 7 1
2= + + − ⋅ −
− − −
( )
( )Φ
, (2)
dndt
nt
w n nt
nt
s b n a n
1 3
31 1
2 2
2
1
1
21 2 2 7 1
2= − ⋅ + − +
+ −( )Φ, (3)
ddt
s b n a ntc
ΦΦ
Φ= − −21 2 2 7 1( ) , (4)
where is: n1 lower laser level population [cm-3]n2 upper laser level population [cm-3]n3 population of 4S3/2 state [cm-3]Φ photon flux in the resonator [cm-2]r1(t) pumping rate of 4S3/2 [cm-3s-1] r2(t) direct pumping rate of upper laser level
[cm-3s-1] s21 cross-section for stimulated emission
[cm2]b2 Boltzmann factor of Stark spited I11/2 upper laser levela7 Boltzmann factor of Stark spited I13/2
lower laser levelt1 lower laser level lifetime [s]

Strojniški vestnik - Journal of Mechanical Engineering 57(2011)1, 3-10
6 Bizjak, A - Nemeš, K. - Možina, J.
rate-equation model describes the behavior of a free-running Er:YAG laser well.
The curve in Fig. 5 predicts a linear relationship between the laser output energy on the flash-lamp pulse energy that is a typical result, obtained in all experiments for an Er:YAG laser operating in the free-running mode. Therefore, the rate-equation model describes the behavior of a free-running Er:YAG laser well.
2 Q-SWITCHED OPERATION
The simulation of the Q-switched operation was performed in two steps: Fig 5. Er:YAG laser output energy as a function
of the flash-lamp input energy
Fig 4. a) lower laser level population – n1; b) upper laser level population – n2; c) inverse population n = (b2n2 - a7n1); d) photon flux in resonator – ρ; e) photon flux in resonator with higher temporal
resolution (note the relaxation oscillation micro pulses with a time duration of the order of 1 μs, which are also observed experimentally)

Strojniški vestnik - Journal of Mechanical Engineering 57(2011)1, 3-10
7Rotating-Mirror Q-Switched Er:YAG Laser for Optodynamic Studies
a) From Eqs. (1) and (2), as well as from Eqs. (3) and (4), the inverse population as a function of time is determined, where we assume no laser action (Φ = 0) is assumed. Here we assume a rectangular time profile of the flash-lamp current and hence the pumping terms r1(t) and r2(t). The inverse population is calculated until time equals t0.
b) From time t0 on, the rate Eqs. (1) to (3) and (6) are used, which were modified from Eq. (4) and presented below:
ddt
s n dl
L ttres R
ΦΦ
Φ= ⋅ ⋅ −
+21
2 ( ( ))ε . (6)
Then, these equations, with the starting conditions from Eqs. (1) to (4) at time t0, are solved numerically.
In Eq. 6 for a photon flux the term for the stimulated emission is multiplied by the ratio of the length of the active medium d2 to the overall resonator length lres. The photon lifetime tc is replaced with the resonator roundtrip time tR presented in Eq. 7:
t d n d dcRrod=
⋅ + +2 1 2 3( ) , (7)
where d1 is the separation between the out coupling mirror and the laser rod, nrod is the rod index of refraction, d3 is the separation from the rod to the rear mirror center.
The losses in the resonator are expressed as:
L = Ls + Loc , (8)
where Ls are the diffraction losses and Loc are the losses from the out coupling mirror with scattering and absorption. Ls was estimated to be Ls = 0.05, while Loc was taken as:
L Roc oc= − ln( ) , (9)
where Roc is the reflectivity of the out coupling mirror.
The term ε(t) is the time-dependent losses of the rotating-mirror Q-switch. ε(t), as a function of the rotating mirror’s angular frequency ω, was modeled as [10]:
ε ω( ) cos( )t a b t= + . (10)
3 ROTATING-MIRROR Q-SWITCHED LASER DESIGN
The Q-switch in the form of a flat Si mirror (silver coated by II-VI Belgium) with a reflectivity of 99.7% at 2940 nm was fixed to a motor shaft. The position of the motor shaft at a defined angle α to the resonant position of the mirror was detected for triggering the flash-lamp discharge by optocouplers. The frequency of the rotating mirror was adjusted to 200 Hz.
The Er:YAG laser-pumping chamber consisted of a BaS04 diffuse reflector with a Borofloat 33 flow tube. A 4 × 90 mm Er:YAG flat/flat rod (Sumitomo) doped with 50% at Er+3, AR coated at 2940 nm on both end faces, with fine ground sides, was used. The laser rod and the flash lamp were cooled with temperature-stabilized, de-ionized water (Twater = 18 ± 0.5 ºC).The laser was pumped with a Xe flash lamp that had an inner diameter of 5 mm and an arc length of 89 mm with a cerium-doped envelope, made by Noblelight. The out coupling mirror was a flat/flat mirror with a reflectivity of 85% at 2940 nm and an AR coating for 2940 nm manufactured by Layertec GmbH, Germany.
The laser resonator is shown in Fig. 6.
Fig. 6. Q-switched Er:YAG laser resonator, where d1 = 52 mm, d2 =90 mm and d3 =36 mm
The flash lamp was operated with a simmer current of approximately 150 mA, while the main discharge (pumping pulse) was generated from a 10 mF capacitor bank with an IGBT module. The IGBT module was activated with a programmable pulse generator, triggered by the rotating-mirror, Q-switch, position-sensor electronics. The repetition rate of the Q-switched laser pulses was set to 2.87 Hz. The flash-lamp triggering circuit as well as the typical flash-lamp current and voltage pulses are shown in Fig. 7. During the experiments for each laser pulse, the flash-lamp current and

Strojniški vestnik - Journal of Mechanical Engineering 57(2011)1, 3-10
8 Bizjak, A - Nemeš, K. - Možina, J.
the voltage pulse were measured and used for the calculation of energy delivered in the flash lamp.
3.1 Simulations of Q-Switched Operation
For reasons of simplicity, an ideal rectangular flash-lamp pumping pulse with a duration of tp = 325 μs was used in the simulations. The real pumping pulse is not rectangular due to the time needed for the flash-lamp Xe plasma to fill the flash lamp. Since we were only interested
in the creation of a certain inverse population, the shape of the pumping pulse did not influence the results of the simulation. The values of the populations of all three levels n1, n2 and n3 were solved at the time t0 with a photon flux Φ = 0. For times t > t0 the photon flux was solved from Eqs. (1), (2), (3) and (6), where the time-dependent term for Q-switch losses ε(t) was used. The simulations were made considering a Q-switch rotation frequency of 200 Hz. See Fig. 8a.
Fig. 7. a) flash-lamp triggering and main discharge control circuit and; b) typical flash-lamp voltage and current pulse shapes
Fig. 8. Q-switched Er:YAG TEM00 laser pulse temporal shape; a) calculated from rate Eqs. (1) to (3) and (9); b) experimentally realized and measured

Strojniški vestnik - Journal of Mechanical Engineering 57(2011)1, 3-10
9Rotating-Mirror Q-Switched Er:YAG Laser for Optodynamic Studies
3.2 Measured Properties of Q-Switched Er:YAG Laser
The Q-switched laser pulse shape, energy, efficiency, output-energy repeatability and laser-beam spatial profile were measured. The measured Q-switched pulse temporal shape is shown in Fig. 8b, together with the same laser pulse calculated from the rate equations (Fig. 8a). The temporal pulse shape was measured with a fast InAs detector (Teledyne Judson Technologies).
Fig. 9. Q-switched Er:YAG laser pulse output energy as a function of flash-lamp input energy; the threshold energy for Q-switched operation
was found to be 40.2 J
The Q-switched laser-pulse temporal shape remained the same for input energies in the flash lamp of Ein = 52 J, with a pulse width (FWHM) of 270 ns. At higher pumping energies, the evolution of the second pulse was observed (typical in rotating-mirror Q-switching [10]) as well as the evolution of higher transverse modes, since no mode selection in the form of additional limiting apertures was used in the laser design.
The laser output energy for single-mode, Q-switched operation as a function of the flash-lamp input energy is shown in Fig. 9.
The repeatability of the laser pulses was measured at different laser-pulse energies (see Table 1) for a pulse-repetition frequency of 2.87 Hz. The repeatability is the worst at low energies (approximately 7%). For laser-pulse energies greater than 10 mJ the repeatability saturates to a remarkable value of 2%.
Table 1. Calculated pulse-to-pulse repeatability
Eflash[J]
Elaser[mJ]
St. dev. [mJ]
Pulse-to-pulse repeatability [%]
45.9 7.1 0.5 6.947.3 9.6 0.4 4.648.6 11.4 0.2 2.150.8 13.8 0.3 2.152.1 15.9 0.3 1.9
The laser-beam spatial profile was measured at a position 341 mm from the laser-output coupler. Due to a lack of equipment for better measurements, a technique of measuring the transmission through the apertures of various diameters was used and then the fluence as a function of aperture diameter and finally fitting the fluence to the Gaussian beam profile was calculated. The result is shown in Fig. 10.
Fig. 10. Spatial profile of Er:YAG Q-switched laser beam at a distance of 341 mm from the laser
out coupling mirror; the data points are from measured transmissions through apertures with
various diameters; the laser-pulse energy was 15 mJ at repetition rate of 2.87 Hz; the measured
data points were fitted to a Gaussian beam profile (full line); the 1/e-2 points are at 2w =1.28 mm
The measured spatial profile corresponds to a TEM00 mode with the 1/e-2 point at a radius of 0.64 mm. A higher certainty could be reached with measurements made at multiple distances from the laser out coupling mirror.
The propagation of the fundamental laser mode created in the resonator was also calculated.

Strojniški vestnik - Journal of Mechanical Engineering 57(2011)1, 3-10
10 Bizjak, A - Nemeš, K. - Možina, J.
Here, the thermal lensing of the laser rod under the conditions of the experiment (laser rod pumping power = 52.1 J x 3 Hz = 156.3 W) was taken into account. The obtained result for the 1/e-2 point of the spatial profile was 0.85 mm. For the reasons for the discrepancy between the measured and calculated value of the 1/ e-2 point in the spatial TEM00 beam profile may lie in the inaccuracy of the method of the beam-profile measurement used. The other possible reason could be that in the calculation of the TEM00 mode and its propagation we took an average value of thermal lensing of the Er:YAG rod. The actual thermal lensing of the laser rod during the creation of the Q-switched laser pulse could be different than the average value we used.
4 CONCLUSIONS
We developed a simple, repeatable and reliable Q-switched Er:YAG laser for laboratory use. Q-switched, laser-pulse energies from 7 to 16 mJ with a pulse width of 270 ns and a TEM00 spatial beam profile were realized at a repetition rate of 2.87 Hz. The pulse-to-pulse repeatability reached values of approximately 2%.
The laser is intended for various optodynamic laboratory studies of 2940 nm, Q-switched, laser pulses’ interaction with various media that contain water. In the future, we intend to run experiments to detect and define the thickness of the water condensing on various surfaces, like aluminum, copper and glass.
5 REFERENCES
[1] Grad, L., Možina, J., Šušterčič, D., Funduk, N., Skalerič, U., Lukač, M., Cenčič, S., Nemeš, K. (1994). Optoacoustic studies of Er:YAG laser ablation in hard dental tissue. SPIE Proc., vol. 2128, p. 456-465.
[2] Jelínková, H., Dostálová, T., Hamal, K., Krejsa, O., Kubelka, J., Procházka, S. (1998). Er:YAG Laser in dentistry. Laser Physics, vol. 8, no. 1, p. 176-181.
[3] Paghdiwala, A.F., Vaidyanathan, T.K., Paghdiwala, M.F. (1993). Evaluation of erbium:YAG laser radiation of hard dental
tissues: analysis of temperature changes, depth of cuts and structural effects. Scanning Microsc., vol. 7, no. 3, p.989-997.
[4] Shori, R.K., Walston, A.A., Stafsudd, O.M., Fried, D., Walsh, J.T., Jr. (2001). Quantification and modeling of the dynamic changes in the absorption coefficient of water at λ = 2.94 μm. IEEE Journal on Selected Topics in Quantum Electronics, vol. 7, no. 6, p. 959-970.
[5] Samokhin, A.A., Vovchenko, V.I., Ilichev, N.N. (2008). Photoacoustic and evaporation pressure signals in water irradiated with erbium laser pulses. Phys. Wave Phenomena, vol 16, no. 4, p. 275-282.
[6] Livingston, F.E., George, S.M., Shori, R.K. (2002). Optimization of rotary Q-switched Er:YAG laser. Rev. Sci. Instrum, vol. 73, no. 7, p. 2526-2532.
[7] Vodopyanov, K.L., Shori R.K., Stafsudd, O.M. (1998). Generation of Q-switched Er:YAG pulses using evanescent wave absorption in ethanol. Appl. Phys. Lett., vol. 72, no. 18, p. 2211-2213.
[8] Korada, P., Nemec, M., Jelinkova, H., Sulc, J., Cech, M., Shi, Yi-Wei, Matsuura, Y., Miyagi, M. (2005). Electro-optically Q-switched Er:YAG laser and its application. Proceedings of the SPIE, XV International Symposium of Gas Flow, Chemical Lasers, and High Power Lasers, vol. 5777, p. 384-389.
[9] Lukač, M., Nemeš, K., Cenčič, S. (1993). Influence of direct and cross-relaxation pumping processes on the output energy and thermal load of an Er:YAG laser. Appl. Opt., vol. 32, p. 7399-7401.
[10] Koechner, W. (1999). Solid state laser engineering, 4th ed. Springer-Verlag, Berlin.
[11] Pollack, S.A., Chang, D.B., Birnbaum, M., Kokta, M. (1991). Upconversion-pumped 2.8-2.9 μm lasing of Er3+ ion in garnets. J. Appl. Phys., vol. 70, p. 7227-7239.
[12] Majaron, B., Rupnik, T., Lukač, M. (1996). Temperature and gain dynamics in flash lamp-pumped Er:YAG. IEEE J. Quantum Electron, vol. 32, no. 9, p 1636-1644.

Strojniški vestnik - Journal of Mechanical Engineering 57(2011)1,11-20 Paper received: 11.05.2010DOI:10.5545/sv-jme.2010.111 Paper accepted: 19.07.2010
*Corr. Author’s Address: Yuzunvu Yil University, Ercis Technical Vocational School of Higher Education, Mechanical Engineering Technology, 65400 Ercis, Van, Turkey, [email protected] 11
The Effect of Electroless Ni Coating of SiC Particles on the Corrosion Behavior of A356 Based Squeeze Cast Composite
Dikici, B. - Tekmen, C. - Gavgali, M. - Cocen, U.Burak Dikici1,* - Cagri Tekmen2 - Mehmet Gavgali3 - Umit Cocen2
1 Yuzuncu Yil University, Ercis Technical Vocational School of Higher Education, Turkey 2 Dokuz Eylul University, Metallurgical and Materials Engineering, Turkey
3 Ataturk University, Department of Mechanical Engineering, Turkey
The corrosion behavior of electroless Ni coated SiC particle reinforced squeeze cast aluminum based composite was investigated by potentiodynamic scanning (PDS) and electrochemical impedance spectroscopy (EIS) techniques in aerated and deaerated chloride solutions. Microstructural and interfacial characterization of the composite was carried out by using an optical microscope, scanning electron microscope (SEM), energy dispersion spectroscopy (EDS) and X-ray diffractometer (XRD). It has been observed that electroless Ni coating of SiC particles is not an effective method to improve its corrosion resistance in structural applications containing halide solution.©2011 Journal of Mechanical Engineering. All rights reserved. Keywords: electroless nickel, metal matrix composite, corrosion, EIS
0 INTRODUCTION
Properties of metal matrix composites (MMCs) strongly depend on the interfacial phenomena between the metal matrix and ceramic reinforcement [1] to [4]. The wettability of reinforcement by liquid metal is the key factor to achieve high interface bonding strength [5] to [7]. Unfortunately, the wettability of SiC particle reinforcement with molten aluminum matrix is generally poor. However, several methods including the modification of the matrix composition, coating of the reinforcement and control of process parameters have been widely used to improve the interfacial properties [8] to [11]. Among these methods, electroless nickel (EN) coating of the reinforcement, which is a simple, low-cost and an easy to use process, has been successfully applied to prevent undesired interfacial reactions and promote the wettability through increasing the overall surface energy of the reinforcement [12] to [14].
The corrosion properties of aluminum based metal matrix composites reinforced with coated ceramic particles is still in the investigation stage. In addition, the published literature on the corrosion behavior of aluminum based composites is rather limited and often contradictory [15] and [16]. The reason is generally related to the quantity of alloying elements in the Al matrix, reinforcement shape, size and volume fraction and
composite production method [17] and [18]. Also, many researchers reported that galvanic actions between the uncoated SiC particle and matrix alloy is not effective in the corrosion behavior of the composite due to a semiconductor structure of SiC phase. In other words, SiC is cathodic to aluminum and does not polarize easily [19] to [21]. However, the corrosion susceptibility of the composite increases due to the presence of Al4C3 phase, which forms at the SiC/Al matrix interface [17], [22] and [23]. Al4C3 reduces not only the corrosion resistance but also the ductility and strength of the composite [24] and [25]. Similar results have been observed in our previous studies [26] and [27]. Coating of the reinforcement changes the physical and mechanical properties of the composites, as well as the corrosion behavior [16] and [18]. Also, surface treatment of SiC reinforcement may improve the wetting behavior with Al matrix. However, the protective film on the matrix surface can be easily broken due to a mismatch in coefficient of thermal expansion (CTE) between different phases. In addition, corrosion can decrease the interfacial strength between SiC and Al matrix [20], [28] and [29]. Recently, a considerable attention has been paid especially to the use of these composites in marine applications [30]. However, several drawbacks of these materials, such as low temperature ductility and poor corrosion resistance hinder their wide range of application in alkaline environments [8].

Strojniški vestnik - Journal of Mechanical Engineering 57(2011)1, 11-20
12 Dikici, B. - Tekmen, C. - Gavgali, M. - Cocen, U.
In this study, corrosion behavior of Al–7%Si–0.7%Mg (A356) based metal matrix composite reinforced with electroless nickel (EN) coated SiC particles produced by squeeze casting technique has been investigated. Another purpose of this study was to increase wettability between matrix/reinforcing phase and preventing undesirable interface reactions. The coating morphology, microstructural and interfacial properties of the composite, and the effect of EN coating of SiC reinforcement on the corrosion properties has been examined and discussed in detail.
1 EXPERIMENTAL PROCEDURE
1.1 Electroless Nickel (EN) Coating
Electroless nickel coating of SiC particles was carried out as follows: cleaning of SiC particles in acetone for 15 min. After cleaning, particles were sensitized for another 15 minutes in a solution containing 10 g/L SnCl2 and 30 mL HCl. The sensitized particles were immersed in a solution containing 0.25 g/L PdCl2 and 3 ml/L HCl for 15 min in order to activate the nonmetal SiC particle surface. Rinsed and dried SiC particles were gently dispersed in an electroless nickel bath containing 45 g NiCl2, 8 g NaH2PO2.H20, 100 g Na3C6H5O7 and 50 g NH4Cl dissolved in 1 L distilled water. Deposition was carried out at 80 to 90 °C and 8 to 9 pH.
1.2 Composite Manufacturing
A composite reinforced with 20 vol. % electroless nickel coated SiC particles with an average size of 15 µm was produced by a squeeze casting technique. Al–7%Si–0.7%Mg matrix alloy was melted in a ceramic crucible and then SiC particles were added by stirring continuously. The mixture was superheated up to 750 °C and then poured into a preheated (400 °C) die and finally solidified under a pressure of 100 MPa.
1.3 Characterization
Characterization studies were carried out by using optical microscope, scanning electron microscope (SEM), energy dispersion
spectrometer (EDS) and X-ray diffractometer (XRD).
1.4 Corrosion Tests
Electrochemical investigation of the composite was performed with potentiodynamic polarization (PDS) and electrochemical impedance spectroscopy (EIS). All experiments were carried out with a computer-controlled potentiostat (PCI4/750, GAMRY Instruments, Inc., Warminster, PA) in aerated and deaerated 3.5% NaCl solution at room temperature. Ag/AgCl and platinum (Pt) electrodes were used as a reference and auxiliary electrode, respectively. The solution was deaerated in order to remove the oxygen with nitrogen (N2) gas. Deaerated process was started 60 minutes prior the measurement and continued until the end of the experiment. Specimens were immersed into the solution until obtaining a steady open circuit potential (OCP). After reaching equilibrium, polarization test started at the cathodic overpotential and the scan was stopped when the specimens reached the anodic corrosion current density of 10 mA.cm-2. All potentiodynamic scanning (PDS) tests were carried out according to the ASTM standard [31]. EIS measurements were carried out using AC signals of amplitude 10 mV at the open circuit potential (OCP) in the frequency range of 100000 to 0.01 Hz. The exposed area of the test specimens was about 5 x 5 mm (±0.01), and all data have been normalized according to the surface area. Impedance parameters were calculated by fitting the experimental results to an equivalent circuit model by using the Echem Analyst software.
2 RESULTS
2.1 Characterization
Surface and elemental Ni mapping of electroless nickel coated SiC particles are given in Figs. 1a and b, respectively. It has been observed that the EN coating is homogenous, uniform and the thickness is about 1 μm. A typical microstructure of the composite produced by squeeze casting is shown in Fig. 2. In our previous study [32], it was demonstrated that the microstructure consists mainly from aluminum

Strojniški vestnik - Journal of Mechanical Engineering 57(2011)1, 11-20
13The Effect of Electroless Ni Coating of SiC Particles on the Corrosion Behavior of A356 Based Squeeze Cast Composite
dendrites and eutectic silicon with no evidence of macro-pores. The amount of micro-pores was measured as 0.54% (in vol.).
Fig. 1. a) SEM image and b) X-ray map of Ni on the SiC particle surface
Fig. 2. Optical micrograph of squeeze cast composite
Fig. 3. SEM micrograph showing the SiC/matrix interface
Higher magnification micrograph of the composite demonstrates a good SiC/matrix interface in terms of porosity (Fig. 3). In addition, XRD pattern of the composite indicates that Al4C3 reaction product does not occur (Fig. 4).
Fig. 4. XRD pattern of squeeze cast composite
2.2 Corrosion Tests
Fig. 5. a) open circuit potential‒time (Eocp‒T) curves, b) electrochemical potential noise
measurements in aerated and deaerated 3.5% NaCl solutions

Strojniški vestnik - Journal of Mechanical Engineering 57(2011)1, 11-20
14 Dikici, B. - Tekmen, C. - Gavgali, M. - Cocen, U.
Open circuit potential (OCP) and electrochemical noise measurements of the composite in aerated and deaerated 3.5% NaCl solutions measured against time are given in Fig. 5. Noise values were calculated from the variation between two potential values obtained from OCP.
It is well known that a corrosion reaction may be masked by the heavily reduction reactions in aerated solution. Thus, especially aluminum alloys, pitting onset, passive areas and subtle polarization effects can not be seen completely. Therefore, the solution was deaerated to remove the oxygen by introducing nitrogen into the system. Fig. 6 shows a typical potentiodynamic polarization curve of the composite obtained in aerated and deaerated 3.5% NaCl solutions. Corrosion parameters obtained from these polarization curves are collected in Table 1.
Fig. 6. Potentiodynamic polarization curves in aerated and deaerated 3.5% NaCl solutions
Fig. 7 shows the impedance response of the composite in a Nyquist representation. In addition, the corrosion behavior of the composite is further illustrated by Bode plots in Fig. 8.
In order to obtain accurate results, complex plane plots were analyzed by fitting the experimental results to the equivalent circuit as given in Fig. 9. It is obvious from Fig. 7 that fitted results present a similar shape with experimental results. Also, impedance parameters derived from complex plane plots are given in Table 2.
Fig. 7. Nyquist diagram of the sample exposed to aerated 3.5% NaCl
Fig. 8. Bode plots of the sample exposed to aerated 3.5% NaCl: a) magnitude, b) phase angle
Fig. 9. Equivalent circuit model represents the metal/solution interface

Strojniški vestnik - Journal of Mechanical Engineering 57(2011)1, 11-20
15The Effect of Electroless Ni Coating of SiC Particles on the Corrosion Behavior of A356 Based Squeeze Cast Composite
2.3 Corrosion Morphology
Fig. 10 is a typical SEM micrograph of a squeeze cast composite exposed to 3.5% NaCl solution, where the presence of preferentially localized corrosion can be seen at SiC/matrix interface.
Fig. 10. SEM micrographs showing the corroded surfaces of the sample
Fig. 11 shows the corrosion progress paths on the corroded surface of squeeze cast composite at the initial and intensive corrosion stages. At extensive corrosion levels, the presence of pits
at the SiC/matrix interface can be considered as regions where SiC particles are partially or completely detached (Fig. 12).
Fig. 11. Initial and intensive stages of corrosion: a) fresh pit, b) grown pit (arrow directions present
corrosion paths)
Fig. 13 reveals the preferential removal of the matrix material around EN coated SiC particles. This figure illustrates that SiC particles are not greatly affected by the corrosion process. The corrosion progress on aluminum rich matrix, causes an intense porous structure, without any
Table 1. Corrosion parameters obtained from polarization curves of the composite in aerated and deaerated 3.5% NaCl solutions (E vs. Ag/AgCl)
Test condition Eocp [mV] Ecorr [mV] Epit [mV] Epass [mV] Ipass [μA/cm2] Icorr [μA/cm2]Aerated solution -776 -833 -696 - - 1.25
Deaerated solution -904 -1169 -718 -1135 6.15 2.50
Table 2. Impedance parameters derived from complex plane plot in aerated 3.5% NaCl solution
R1 [W.cm2] R2 [W.cm2] C1(x10-6) [F.cm-2] C2(x10-3) [F.cm-2] W(x10-6) [S.s½.cm-2]10.65 4850 30.33 6.862 258.6

Strojniški vestnik - Journal of Mechanical Engineering 57(2011)1, 11-20
16 Dikici, B. - Tekmen, C. - Gavgali, M. - Cocen, U.
corrosion product on SiC particle surface. In addition, it was observed that corrosion did not cause any damage in the EN coating, as illustrated by small, light spheres in Fig. 13.
Fig. 12. Detachment of SiC particles from the structure due to intensive matrix corrosion
Fig. 13. High magnification SEM micrograph of EN coated SiC particles after the corrosion test
3 DISCUSSION
In the literature, it has been attributed that the following parameters significantly affect the corrosion behavior of metal matrix composites in macro scale; (i) reinforcement volume fraction [26] and [33], (ii) composition of the matrix alloy [28] and [34], (iii) reinforcement coating [15] and [18], (iv) composite manufacturing method [33], and (v) thermal or thermo-mechanical post treatment [33] and [35]. In addition, the corrosion principle of aluminum alloys under passive
conditions establishes the pitting [19]. Therefore, for these alloys, the pitting potential value is directly related to the corrosion susceptibility, and it can provide more realistic results related to the electrochemical behavior of the composites. In spite of using the same matrix alloy and reinforcement volume fraction in this study, the corrosion and pitting results are relatively more noble (Table 1) compared to our previous study [18] and [26]. Also, since no post treatment was applied in this study, the difference in potential values cannot be explained by parameters (i), (ii) and (v) given before. Therefore, the main reason of the difference can be attributed to the manufacturing method (iv) and/or reinforcement coating (iii).
From the point of manufacturing method, in both liquid infiltration and squeeze casting methods, a composite material solidifies under pressure, therefore, its effect on microstructure, in terms of porosity and interfacial properties, is insignificant. As reported in our previous studies, the porosity ratio of 20% volume fraction SiC reinforced composite manufactured by liquid infiltration [18], stir casting and extrusion [20] and squeeze casting [32] is the same and approximately 1%. Porosity, which acts as preferential sites for corrosion, is one of the key parameters in the corrosion behavior of composite materials. Therefore, it can be concluded that, the most effective parameter that differentiates the corrosion results obtained in each study is the type of reinforcement coating (iii).
As it is known, if the gradient of corrosion rate with time is neglible, it can be said that the material undergoes general corrosion. In such a case, it is easier to determine the corrosion rate and the lifetime of the material. However, as observed in this study, if the corrosion behavior changes significantly with time (Fig. 5), this indicates that the material undergoes pitting corrosion. In this case, the test carried out in aerated solution to determine the corrosion rate and the obtained data lose its validity and reliability, respectively [23] and [36]. In such circumstances, using the electrochemical noise technique and performing the tests in deareated solution gains importance. As seen from Fig. 5a, the open circuit potential (OCP) values of the composite measured under aerated condition are more positive than in

Strojniški vestnik - Journal of Mechanical Engineering 57(2011)1, 11-20
17The Effect of Electroless Ni Coating of SiC Particles on the Corrosion Behavior of A356 Based Squeeze Cast Composite
deaerated condition. This can be explained by the affinity of the present and dissolved oxygen in aerated condition. The reason is that in deaerated condition, the oxygen reduction reaction given by reaction (1) will not occur, thus the growth of the surface oxide layer will be prevented. Consequently, dissolution of the metal became more dominant and the protective oxide layer became gradually thinner.
½O2 + H2O +2e- → 2OH- (1)
In order to evaluate localized interactions, the electrochemical potential noise magnitudes of each sample were compared (Fig. 5b). 25 minutes after the sample was immersed into the electrolyte it was observed that localized corrosion is hindered due to passivation, and this inhibition is relatively stronger in deaerated solution. This can be easily seen in the magnitued graph of the noise amplitude (Fig. 5b). This result verifies that the difference in potential values observed in both studies arise from the composite structure rather than the oxidation in dilute solution.
In our previous study [18], corrosion was preferentially started and continued at the interface between the Al matrix and alloying elements rather than reinforcement. Also, since SiC particles were coated with SiO2 and TiO2, no detrimental galvanic corrosion was observed between SiC particles and matrix alloy. In addition, up to date, no galvanic effect has been reported between Al and SiC [28] and [33]. However, in this study, SiC particles were coated with nickel which is a relatively good conductive metal, and a metallic bond is expected to occur where Al and Ni are in direct contact. An interface with a metallic bond is more ductile than other bonds, and is desirable in metal matrix composites [8]. However, as a metallic bond has a relatively high electrical conductivity, electrons in the matrix alloy can be easily drained through the conductive EN coating in a corrosive environment,. Also, it has been demonstrated that Ni can react with Al matrix and intermetallic phases such as NiAl3 and Al3Ni2 can occur preferentially at the Al/SiC interface [14]. These intermetallic phases frequently have solution potentials differing from that of the matrix alloy in which they occur, therefore, localized galvanic cells may be formed between these phases and the matrix. Thus, these
phases are cathodic to the Al matrix and decrease the corrosion resistance in aqueous saline media [19] and [28].
The main effect of EN coating on the corrosion behavior of composite might be morphologic. The high pressure applied in squeeze casting might have an indirect effect on the corrosion resistance of the composite. During the solidification of composite under high pressure, some residual stresses might appear and cause an increase in the overall internal stresses in the composite. However, it has been widely accepted that these residual stresses have no or little effect on the corrosion behavior of the composite [23] and [28]. However, dislocations accumulated around Al dentrites and/or Al/SiC interface can indirectly cause a degradation of the surface oxide layer, and might be effective in the change of the corrosion morphology of the composite [37] and [38]. At the advanced stage of the corrosion, if SiC coating is a nonconductive material, the corrosion will continue around these particles since SiC is a noble material and will not undergo corrosion. Thus, localized corrosion in Al matrix alloy will progress quickly and in depth, and causes less material loss. However, if the SiC coating is a conductive material, this increases the ratio of local cathode area around the SiC particle where low resistance areas exist and electrons leave easily from these areas, therefore, corrosion will progress around the SiC particles where the pits extend at the surface not in depth. As a result, this kind of constitutions affect the normal pitting corrosion behavior of the composite. This implies that the matrix/reinforcement interfaces are active sites for corrosion and the corrosion morphology clearly demonstrates that it progresses as pitting corrosion. The initial and intensive stages of the corrosion based on Fig. 11 where the pit morphology differs at each stage. Also, as seen from Fig. 11, corrosion starts in-depth at the early stages of corrosion, and later, as a result of excessive polarization, it expanses to the surface. This can be attributed to the eutectic silicon phase, which segregates to Al dendrites during solidification [32] since Si decreases the solution potential of Al to more noble values [28]. Due to this fact, Al grain boundaries close to the Al/SiC interface, where there are relatively active sites as a result of EN coating, will become more

Strojniški vestnik - Journal of Mechanical Engineering 57(2011)1, 11-20
18 Dikici, B. - Tekmen, C. - Gavgali, M. - Cocen, U.
active. Consequently, these regions will become localized regions where the oxide film layer has a relatively high solubility and surface conductivity. Therefore, after corrosion propagates in-dept for a while, it will interact with these localized regions and will propagate around these regions, and will consequently spread out (Fig. 11). This progress will occur in a very short time and will continue until the reinforcement detach from the matrix (Figs. 12 and 13). This approach is well in agreement with the observation of Modi et al. [30]. As a result, this kind of constitutions may affect the normal corrosion behavior of the material.
The corrosion potential and polarization resistance during the immersion of a system in a corrosive medium can provide information regarding the ongoing corrosion reaction process. This information, as well as additional information about the solution/protection layer/composite surface interfaces can be obtained from EIS. Figs. 7 and 8 demonstrate the Nyquist and bode plots of the composite after the EIS scanning. At low frequency, the region of the Nyquist plot shows an approxinately straight line with a slope of 45° (Fig. 7). In addition, the phase angle approaches 45° at low frequency (Fig. 8b). In this case, it can be said that the corrosion rate is controlled by the diffusion of electrochemical active species (EAS) to the composite surface and is referred as Warburg diffusion [39]. The result confirms the Nyquist plot because Warburg Impedance appears as a straight line with a slope of 45° in a Nyquist plot. Diffusion is observed at relatively low frequencies and corrosion is observed at higher frequencies (Fig. 8). This behavior demonstrates that the electron exchange between the composite and EAS is very fast. This can be attributed to a relatively high surface electrical conductivity of the Al/SiC interface because of EN coating, which supports the above discussions. As a result, the EN surface coating method significantly affects the corrosion characteristics and the morphology of the composite.
4 CONCLUSIONS
In this study, it has been observed that Al/SiC interfaces are active sites where corrosion preferentially starts in-depth at the early stages, and later, as a result of excessive polarization,
expanses to the surface, which indicates that the corrosion type is 'pitting'. Such corrosion behavior has been attributed to the conductivity of the coating material, eutectic silicon phase and dislocations accumulated around Al dendrites, by forming preferential sites for corrosion. In addition, the high pressure applied in squeeze casting might have an indirect effect on the corrosion resistance of the composite. It can be concluded that despite improving the wettability, electroless nickel coating is not an effective method to improve the corrosion resistance in structural applications containing halide solution.
ACkNOWLEDGEMENTS
This work was financially supported by Yuzuncu Yil University (2009-MYO-B031).
5 REFERENCES
[1] Lee, J.C., Ahn, J.P., Shim, J.H., Shi, Z., Lee, H.I. (1999). Control of the interface in SiC/Al composites. Scripta Mater, vol. 41, p. 895-900.
[2] Shi, Z., Yang, J.M., Fan, T., Zhang, D., Wu, R. (2000). The melt structural characteristics concerning the interfacial reaction in SiC(p)/Al composites. Appl Phys A, vol. 71, p. 203-209.
[3] Thakur, S.k., Dhindaw, B.k. (2001). The influence of interfacial characteristics between SiCp and Mg/Al metal matrix on wear, coefficient of friction and microhardness. Wear, vol. 247, p. 191-201.
[4] Wang, R.M., Surappa, M.k., Tao, C.H., Li, C.Z., Yan, M.G. (1998). Microstructure and interface structure studies of SiCp-reinforced Al (6061) metal-matrix composites. Mater Sci and Eng A, vol. 254, p. 219-226.
[5] Hashim, J., Looney, L., Hashmi, M.S.J. (2001). The wettability of SiC particles by molten aluminium alloy. J of Mater Proc Tech, vol. 119, p. 324-328.
[6] Hashim, J., Looney, L., Hashmi, M.S.J. (2001). The enhancement of wettability of SiC particles in cast aluminium matrix composites. J of Mater Proc Tech, vol. 119, 329-335.

Strojniški vestnik - Journal of Mechanical Engineering 57(2011)1, 11-20
19The Effect of Electroless Ni Coating of SiC Particles on the Corrosion Behavior of A356 Based Squeeze Cast Composite
[7] Feng, A., McCoy, B.J., Munir, Z.A., Cagliostro, D. (1998). Wettability of transition metal oxide surfaces. Mater Sci and Eng A, vol. 252, p. 50-56.
[8] Rajan, T.P.D., Pillai, R.M., Pai, B.C. (1998). Review reinforcement coatings and interfaces in aluminum metal matrix composites. J of Mater Sci, vol. 33, p. 3491-3503.
[9] Rams, J., Urena, A., Campo, J. (2004). Sol-gel coatings as active barriers to protect ceramic reinforcement in aluminum matrix composites. Adv Eng Mater, vol. 6, p. 57-61.
[10] Wen, T., Gao, J., Shen, J., Zhou, Z. (2001). Preparation and characterization of TiO2 thin films by the sol-gel process. J of Mater Sci, vol. 36, p. 5923-5926.
[11] Yang, G., Fan, T., Zhang, D. (2004). Chemical reaction in Al matrix composite reinforced with SiCp coated by SnO2. J Mater Sci, vol. 39, p. 3689-3694.
[12] Libo, L., Maozhong, A., Gaohui, W. (2004). A new electroless nickel deposition technique to metallise SiCp/Al composites. Surf and Coat Tech, vol. 200, p. 5102-5112.
[13] Ip, S.W., Sridhar, R., Toguri, J.M., Stephenson, T.F., Warner, A.E.M. (1998). Wettability of nickel coated graphite by aluminium. Mater Sci and Eng A, vol. 244, p. 31-38.
[14] Leon, C.A., Drew, R.A.L. (2002). The influence of nickel coating on the wettability of aluminum on ceramics. Compos A, vol. 33, p. 1429-1432.
[15] Pardo, A., Merino, M.C., Ureña, A., Merino, S., Viejo, F., Campo, M. (2004). Effect of reinforcement coating on corrosion behavior of AA6061/SiC/20p composite in high relative humidity environments. Corrosion, vol. 60, p. 945-953.
[16] Davidson, A.M., Regener, D. (2000). A comparison of aluminium-based metal-matrix composites reinforced with coated and uncoated particulate silicon carbide. Compos Sci Technol, vol. 60, p. 865-869.
[17] kiourtsidis, G., Skolianos, S.M. (1998). Corrosion behavior of squeeze-cast silicon carbide-2024 composites in aerated 3.5 wt.% sodium chloride. Mater Sci and Eng A, vol. 248, p. 165-172.
[18] Dikici, B., Tekmen, C., Yigit, O., Gavgali, M., Cocen, U. (2009). Detrimental effect of particle sol-gel coating on the corrosion behavior of A380-SiC composite. Corros Sci, vol. 51, p. 469-476.
[19] Aylor, D.M., Taylor, D. (1987). Corrosion of metal matrix composites. ASM Handbook. ASM international Materials Park, vol. 13.
[20] Dikici, B., Gavgali, M., Tekmen, C. (2006). Corrosion behavior of an artificially aged (T6) Al-Si-Mg based metal matrix composite. J of Comp Mater, vol. 40, p. 1259-1269.
[21] Aylor, D.M., Moran, P.J. (1985). Effect of reinforcement on the pitting behavior of aluminum-base metal matrix composites. J Electrochem Soc, vol. 132, p. 1277-1281.
[22] Yaghmaee, M.S., kaptay, G. (2001). On the stability range of SiC in ternary liquid Al-Si-Mg alloy. In Materials Worlds: Proceeding of Hungarian Materials Science Society, vol. 2, no. 3, e-journal from http://materialworld.fw.hu.
[23] Trowsdale, A.J., Noble, B., Haris, S.J., Gibbins, I.S.R., Thompson, G.E., Wood, G.C. (1996). The influence of silicon carbide reinforcement on the pitting behaviour of aluminium. Corrosion Sci, vol. 38, p. 77-191.
[24] Suery, M., Salvo, L. (1995). Matrix-reinforcement interactions during fabrication and thermal treatment of cast Al-matrix composites. Metall New Mater, vol. 111, p. 119-137.
[25] Urena, A., Escalera, M.D., Rodrigo, P., Baldonedo, J.L., Gil, L. (2001). Active coatings for SiC particles to reduce the degradation by liquid aluminium during processing of aluminium matrix composites: study of interfacial reactions. J Microsc, vol. 201, p. 122-136.
[26] Gavgali, M., Dikici, B., Tekmen, C. (2006). The effect of SiCp reinforcement on the corrosion behaviour of Al based metal matrix composites. Corrosion Reviews, vol. 24, p. 27-37.
[27] Dikici, B., Bedir, F., Gavgali, M., kiyak, T. (2009). Corrosion characteristics of Al–Cu/B4C (T6) MMCs and their microstructure

Strojniški vestnik - Journal of Mechanical Engineering 57(2011)1, 11-20
20 Dikici, B. - Tekmen, C. - Gavgali, M. - Cocen, U.
evaluation. Kovove Mater, vol. 47, p. 317-323.
[28] Lucas, k.A., Clarke, H. (1993). Corrosion of aluminium-based metal matrix composites. Research Studies Pres Ltd.
[29] Shackelford, J.F., Alexander, W. (2001). Thermal properties of materials. Materials Science and Engineering Handbook, vol. 5. CRC press.
[30] Modi, O.P., Prasad, B.k., Dasgupta, R., Jha, A.k., Mondal, D.P. (1999). Errosion-corrosion characteristics of squeeze cast aluminium alloy/SiC composites in water and sodium chloride solutions containing sand. Mater Sci Technol, vol. 15, p. 933-938.
[31] ASTM G5, Standard reference test method for making potentiostatic and potentiodynamic anodic polarization measurements, Annual Book of ASTM Standards. ASTM International.
[32] Tekmen, C., Cocen, U. (2008). Squeeze casting of Ni coated SiC particle reinforced Al based composite. J Comp Mater, vol. 42, p. 1271-1279.
[33] Turnbull, A. (1992). Review of corrosion studies on aluminium metal matrix composites. Br Corros J, vol. 27, no. 27-35.
[34] Bhat, M.S.N., Surappa, M.k. (1991). Corrosion behaviour of silicon carbide particle reinforced 6061/Al alloy composites. J Mater Sci, vol. 26, p. 4991-4996.
[35] McIntyre, J.F., Conrad, R.k., Golledge, S.L. (1990). The effect of heat treatment on the pitting behaviour of SiCw/AA2124. Corros, vol. 46, p. 902-905.
[36] Trzaskoma, P.P., McCafferty, E., Crowe, C.R. (1983). Corrosion behavior of SiC/Al metal matrix composites. Electrochem Soc J, vol. 130, p. 1804-1809.
[37] Ahmed, Z., Abdul Aleem, B.J. (2002). Degradation of aluminum metal matrix composites in salt water and its control. Mater Des, vol. 23, p. 173-180.
[38] Trzaskoma, P.P. (1990). Pit morphology of aluminum alloy and silicon carbide/aluminum alloy metal matrix composites. Corrosion, vol. 46, p. 402-409.
[39] Tait, S.W. (1994). An introduction to electrochemical corrosion testing for practicing engineers & scientists. Pair O Docs Publications, Madison.

Strojniški vestnik - Journal of Mechanical Engineering 57(2011)1, 21-26 Paper received: 27.10.2009DOI:10.5545/sv-jme.2009.149 Paper accepted: 04.10.2010
*Corr. Author’s Address: University of Ljubljana, Faculty of Mechanical Engineering, Aškerčeva 6, 1000 Ljubljana, Slovenia; [email protected] 21
Measuring Dynamic Loads on a Foldable City BicyclePirnat, M. - Savšek, Z. - Boltežar, M.
Miha Pirnat - Zdenko Savšek - Miha Boltežar*University of Ljubljana, Faculty of Mechanical Engineering, Slovenia
Strain gauges have been used to measure dynamic loads on a foldable bicycle while it is being ridden. Eight full, Wheatstone-bridge measuring points were used to measure the forces on the front and rear wheels, the handlebars, the seat and the pedals. These bridges were positioned at special measuring parts that simplified the measurements. Some of the measuring problems that were successfully resolved are described. The measuring took place on public roads where real-life data was gathered for various riding situations. For an easier interpretation of the data, a camera, an encoder and a GPS system were used. The results are shown for some riding situations and their impact on the design of foldable bicycles is discussed.© 2011 Journal of Mechanical Engineering. All rights reserved.Keywords: foldable bicycles, dynamic loads, strain gauges, Wheatstone bridge
0 INTRODUCTION
In recent years foldable city bicycles have become very popular due to their practicality in city centers. They allow users to park their cars at more distant free-parking areas and ride into the center.
Foldable bicycles have a completely different geometry than conventional city bicycles, which proves to be a problem during the design process. A different geometry means different critical structural parts, which have to be dimensioned for the maximum safety of the rider. This can be achieved by following a standard or by knowing the loads on the bicycle.
Since foldable bicycles are still relatively rare, there is currently no standard covering their very specific design. This means the designer does not know what loads are decisive for the safety of the foldable bicycle. The loads on conventional city bicycles are not generally known, but there is a standard [1] that is widely accepted and prescribes various tests for city bicycles to ensure users’ safety.
This standard is only partly acceptable for foldable bicycles because of their entirely different geometry and components. There are also other problems with the standard, i.e., the prescribed tests are loosely defined, a quantitative evaluation is non-existent and some of the tests do not take everything necessary into account.
In past years studies were carried out to investigate the loads on mountain bikes during riding [2] to [4] and the systems required to accomplish such tasks [5]. Some studies concentrated on only one bicycle component, mostly for off-road use, i.e., [6] and [7], which is not applicable for the case of foldable bicycles. Much work has also been done on understanding a human being’s cycling capabilities and the forces a person can exert on a bicycle, [8] and [9]. It is clear that mountain bikes are well investigated with regard to the loads that occur during riding, but in the case of foldable bicycles and city bicycles, there is a serious knowledge gap.
The aim of this study was to determine the forces acting on a foldable bicycle during various riding situations. For this purpose we equipped a test bicycle with strain gauges connected in full Wheatstone bridges at eight measuring points. These points are located on parts designed from scratch to obtain a simple geometry for the force calculation.
1 MEASURING POINTS
The measuring points (MPs) were prepared on several parts of the bicycle using specifically designed parts and strain gauges. Each MP consisted of four strain gauges connected to form a full Wheatstone bridge. The calculation of the force at these points was made possible

Strojniški vestnik - Journal of Mechanical Engineering 57(2011)1, 21-26
22 Pirnat, M. - Savšek, Z. - Boltežar, M.
through a known geometry and the material of the aforementioned parts.
An encoder, a camera and a GPS system were used to make the data interpretation easier. Fig. 1 shows the locations for every measuring point and some additional instruments.
Fig. 1. Measuring points on the test bicycle
1.1 Front Forks
The forces on the front wheel during riding cannot be measured directly because the contact of the wheel with the ground is inaccessible.
To overcome this problem it seems natural to measure the forces at the wheel axis. This approach, however, requires load sensing devices to be installed between the wheel axis and the front forks, which turned out to be a complicated and time-consuming task. To avoid these problems a special, new set of front forks was designed for the test bicycle.
These forks were designed using a horizontal steel profile with a square cross-section as the base. This was necessary in order to gain a linear distribution of the bending moment. If the slope is known, the shear force is also known since it represents the differential of the bending moment and, in the case of a horizontal profile, it equals the external vertical force Fy.
ddMx
Fy= . (1)
Due to this, two measuring points (Fig. 2) on the steel profile provide enough information to calculate the forces on the wheel.
Eqs. of static equilibrium:
M F l F lx y2 3 2= − − , (2)
M F l F lx y2 3 2= − − . (3)
Eqs. (2) and (3) give:
FM F llx
y=− −2 2
3
, (4)
F M Ml ly =−+
1 2
1 2
. (5)
Fig. 2. Geometry and the forces on the front forks (MP1, MP2)
From Eq. (5) it is clear that the vertical force is always correctly calculated, independently of the acting point. However, the horizontal force is dependent on the dimensions l2 and l3, which are changing during the ride, therefore, this force cannot always be correctly calculated.
1.2 Seat Post
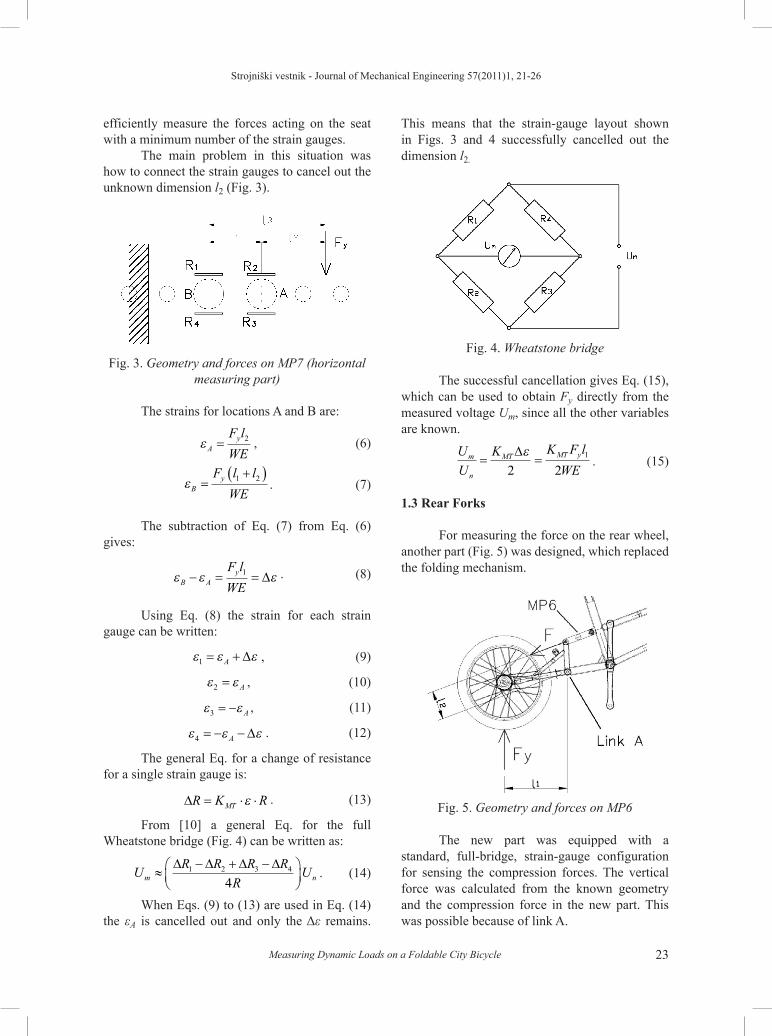
The forces acting on the seat were measured indirectly with the help of specifically designed parts (Fig. 3) and non-standard wiring (Fig. 4) of the four strain gauges in the full Wheatstone bridge. The theoretical principle for calculating the force is the same as for the front forks. The difference is that the output voltage of the Wheatstone bridge is directly proportional to the vertical force on the part and no further calculations are necessary. The layout of the strain gauges was the same for the horizontal and vertical measuring parts. This approach, as with the front forks, enabled us to cheaply and
Strojniški vestnik - Journal of Mechanical Engineering 57(2011)1, 21-26
23Measuring Dynamic Loads on a Foldable City Bicycle
This means that the strain-gauge layout shown in Figs. 3 and 4 successfully cancelled out the dimension l2.
Fig. 4. Wheatstone bridge
The successful cancellation gives Eq. (15), which can be used to obtain Fy directly from the measured voltage Um, since all the other variables are known.
UU
K K F lWE
m
n
MT MT y= =∆ε
2 21 . (15)
1.3 Rear Forks
For measuring the force on the rear wheel, another part (Fig. 5) was designed, which replaced the folding mechanism.
Fig. 5. Geometry and forces on MP6
The new part was equipped with a standard, full-bridge, strain-gauge configuration for sensing the compression forces. The vertical force was calculated from the known geometry and the compression force in the new part. This was possible because of link A.
efficiently measure the forces acting on the seat with a minimum number of the strain gauges.
The main problem in this situation was how to connect the strain gauges to cancel out the unknown dimension l2 (Fig. 3).
Fig. 3. Geometry and forces on MP7 (horizontal measuring part)
The strains for locations A and B are:
ε AyF lWE
= 2 , (6)
εByF l lWE
=+( )1 2 . (7)
The subtraction of Eq. (7) from Eq. (6) gives:
ε ε εB AyF lWE
− = =1 ∆ . (8)
Using Eq. (8) the strain for each strain gauge can be written:
ε ε ε1 = +A ∆ , (9)
ε ε2 = A , (10)
ε ε3 = − A , (11)
ε ε ε4 = − −A ∆ . (12)
The general Eq. for a change of resistance for a single strain gauge is:
∆R K RMT= ⋅ ⋅ε . (13)
From [10] a general Eq. for the full Wheatstone bridge (Fig. 4) can be written as:
U R R R RR
Um n≈− + −
∆ ∆ ∆ ∆1 2 3 4
4. (14)
When Eqs. (9) to (13) are used in Eq. (14) the εA is cancelled out and only the Δε remains.

Strojniški vestnik - Journal of Mechanical Engineering 57(2011)1, 21-26
24 Pirnat, M. - Savšek, Z. - Boltežar, M.
1.4 Pedal
A simple and cost efficient measuring method was needed for the pedaling forces normal to the pedal surface. For this reason one pedal was fitted with a special foot grip (Fig. 6), which was equipped with four strain gauges wired in a full Wheatstone bridge for sensing the bending moment. The important parts of the new grip are the special cross braces, which ensured the synchronous loading of both sides of the grip.
Fig. 6. Modified standard pedal
1.5 Handlebar
The handlebar stem was equipped with two, standard, full Wheatstone bridges for sensing the bending moment in two directions: first, in the riding direction; and second, perpendicular to the riding direction.
1.6 Encoder
Following the crank-arm angle during riding proved to be a problem. It was solved by using an Iskra TGR-21 encoder, which gives out a specific number of TTL impulses during one turn of its shaft. These impulses were led to the counter input port of the data-acquisition hardware. The drive chain was used for a physical connection between the encoder and the crank arm.
1.7 Camera
Since the measuring took place outside, on public roads, a device was needed to provide the data about road conditions at a specific time.
This problem was solved by using a standard web camera attached to the lowest point of the bicycle frame. Doing this highlighted all the road irregularities because of the low filming angle. The camera was synchronized with data using the acquisition software.
1.8 GPS System
The GPS system gave information about the speed and the location during riding. It was synchronized with data using acquisition software.
2 MEASUREMENT
2.1 The Measuring Chain and Calibration
The measuring chain consisted of strain gauges connected to form a full bridge. Each bridge was plugged into a Dewe 43-V analog-digital converter using a 9-pin D-sub plug. The converter was connected to a laptop via a USB cable. For the data synchronization, storing and analysis the DeweSOFT program was used.
During riding the laptop was placed in a bag on the rider’s back and a converter was fitted to the bicycle frame. For better mobility and performance everything should be attached to the bicycle frame, but this was not possible due to severe vibrations during riding.
The calibration of the measuring points was carried out using known weights, which were checked with an accurate scale.
2.2 Comparison of the Theoretical and Real Sensitivity of the Wheatstone Bridges
The results of the calibration are the real sensitivities of the bridges, which were then compared to the theoretical ones. There were large deviations, which were later attributed to two main factors. The first was an inaccurate positioning of the strain gauges over the holes (Fig. 3), which were used at MP6 to MP8 to boost the strain-gauge sensitivity. The second was the local buckling (Fig. 7) of the hole walls, which caused local tension strain, even if the part was subjected to compression. This reduced the sensitivity-boost factor from a predicted 6 to a measured 2.
When these two factors were accounted for, it was established that the deviations ranged

Strojniški vestnik - Journal of Mechanical Engineering 57(2011)1, 21-26
25Measuring Dynamic Loads on a Foldable City Bicycle
from 2 to 15%. Deviations of these sizes are acceptable and can be accounted for.
Fig. 7. Local buckling at MP6
2.3 Measurement Realization
The measurements were carried out on public roads to gather data on a wide variety of common loads during the riding. In this way, the load data were gathered for speed bumps, curbs, pedaling, potholes, braking and other common riding events.
The data were gathered at two different speeds and for two riding positions. The common riding position was sitting down, but for some events the rider would stand up. The speeds were approximately 10 and 15 km/h, but because of
real-life situations these speeds were hard to maintain consistently.
Due to the hardware limitations, only seven full bridges could be monitored at the same time. This problem was overcome by making some measurements twice: first without the pedal, and then with the pedal. When measuring the pedal forces one out of two bridges measuring the seat forces was sacrificed. The remaining Wheatstone bridge was only used to detect the rider’s position.
Before riding, the bicycle was put in a vertical position for bridge zeroing. The zero position for the crank arm angle was when the left crank arm was parallel with the top seat tube. The cyclist’s mass was approximately 80 kg.
3 RESULTS AND DISCUSSION
The results are shown in the form of minimum and maximum force readings during specific events. In Table 1 some results are gathered with the pedal measuring point plugged in and one measuring point sacrificed for monitoring the position of the rider.
It can be seen from Table 1 that the rider can press on the pedal with a greater force than his own weight. This is possible and was confirmed by the study [8]. Moreover, it can also be seen that the stem (MP4 and MP5) is under a severe load during pedaling in standing position and even during pedaling on the mild slope. This is due to a
Table 1. Measured forces during the various riding situationsEvent: Flat
surfaceMild slope
Steep slope
Speed bump
Jump from curbMP:
Handlebars forward_back [Nm]
26-3
12-40
-2-51
34-50
135-60
Handlebars left_right [Nm]
10-13
19-19
68-75
13-5
21-21
Pedal [N] 25234
65033
101052
54447
92134
Crank arm angle [°] / / / 284° 283,9°Position of the driver Sitting Sitting Standing Standing Standing
Fy front wheel [N] 317169
276113
504201
700100
1140-83
Fx front wheel [N] 6-5
9-5
11-6
50-117
164-380
Fy rear wheel [N] 828495
934573
752475
793245
959213
Speed [km/h] 12 7.6 6 16.5 10

Strojniški vestnik - Journal of Mechanical Engineering 57(2011)1, 21-26
26 Pirnat, M. - Savšek, Z. - Boltežar, M.
large length of the stem and high handlebar, which are needed to ensure relaxed riding position. Since the standard [1] does not account for such unusual handlebar and stem geometry, it cannot be directly used for the foldable bicycles. The forces acting on the rear wheel can also be a serious problem for the foldable bicycle as the rear part of the frame does not have the usual high strength triangular shape.
Fig. 8 shows the force on the pedal during each and every turn of the crank arm in a single measuring session. The wide range of the pedal forces and the crank arm angle at witch they are applied can be clearly seen.
Fig. 8. Forces on the pedal during the entire measuring session
4 CONCLUSIONS
Innovative and inexpensive methods for measuring the dynamic loads on a foldable city bicycle were presented. These methods could also be applied to other problems with similar geometries to efficiently gather data.
Based on the gathered data we can conclude that the rear end of the foldable bicycle could be the most critical since it does not have the usual triangular form. Other potential critical parts are the handlebar and stem, which are, due to their inconvenient geometry, under great stress, even during mild braking.
Events that induce great stresses are rare due to the rider's discomfort during such an event; however, these events frequently happen and most probably dictate the longevity of the bicycle.
Bicycles should be tested using modified standard tests to obtain quantitative information about their longevity.
5 REFERENCES
[1] Comité européen de normalization (2005). EN 14764: City and trekking bicycles - Safety requirements and test methods. Brussels
[2] De Lorenzo, D.S., Hull, M.L. (1999). Quantification of structural loading during off-road cycling. Journal of biomechanical engineering-Transactions of the ASME, vol. 121, no. 4, p. 399-405.
[3] Wilczynski, H., Hull, M.L. (1994). A dynamic system model for estimating surface-induced frame loads during off-road cycling. Journal of mechanical design, vol. 116, no. 3, p. 816-822.
[4] Champoux, Y., Vittecoq, R., Maltais, P., Auger, E., Gauthier, B. (2004). Measuring the dynamic structural load of an off-road bicycle frame. Experimental techniques, vol. 28, no. 3, p. 33-36.
[5] De Lorenzo, D.S., Hull, M.L. (1999). A hub dynamometer for measurement of wheel forces in off-road bicycling. Journal of biomechanical engineering - Transactions of the ASME, vol. 121, no. 1, p. 132-137.
[6] Shelton, H., Sullivan, J.O., Gall, K. (2004). Analysis of the fatigue failure of a mountain bike front shock. Engineering failure analysis, vol. 11, no. 3, p. 375-386.
[7] Barna, T., Bretz, K., Fodor, T., Rudolj, I., Tsura, A. (2002). Experimental testing of magnesium and chrome-molybdenum-alloy bicycle frames. IEEE transactions on vehicular technology, vol. 51, no. 2, p. 348-353.
[8] Stone, C., Hull, M.L. (1993). Rider bicycle interaction loads during standing treadmill cycling, Journal of applied biomechanics, vol. 9, no. 3, p. 202-218.
[9] Mornieux, G., Zameziati, K., Mutter, E., Bonnefoy, R., Belli, A. (2006). A cycle ergometer mounted on a standard force platform for three-dimensional pedal forces measurement during cycling. Journal of biomechanics, vol. 39, no. 7, p. 1296-1303.
[10] Vaughan, J. (1975). Application of B&K equipment to strain measurements. Brüel & Kjær, Copenhagen.

Strojniški vestnik - Journal of Mechanical Engineering 57(2011)1, 27-30 Paper received: 09.02.2010DOI:10.5545/sv-jme.2010.026 Paper accepted: 28.10.2010
*Corr. Author’s Address: University of Split, Faculty of Electrical Engineering, Mechanical Engineering and Naval Architecture, R. Boškovića bb, Split, Croatia, [email protected] 27
Interrelation between ERP Modification and Modification Scheduling: Four SME Case Studies in Croatia
Čelar, S. – Mudnić, E. – Gotovac, S.Stipe Čelar* - Eugen Mudnić - Sven Gotovac
University of Split, Faculty of Electrical Engineering, Mechanical Engineering and Naval Architecture, Croatia
ERP customization and implementation requires significant resources and is a timely and complex project. ERP implementation became extremely demanding for SMEs because such projects generally include modifications with all the inherent risks of software development process. In this paper the relations between the impact of the amount of ERP changes and the scheduling of these changes on key project parameters is presented. The study was conducted in four medium-size companies in Croatia, which are similar in organization and operations, and all have successfully completed the implementation of one and the same ERP system. Data for analysis were collected during the project implementations. The results showed the expected large impact of ERP modifications on the project duration. However, it was found that the wise dividing of modifications into two phases and their good planning can significantly affect the duration and cost of the project.© 2011 Journal of Mechanical Engineering. All rights reserved.Keywords: enterprise resource planning (ERP), critical success factors (CSFs), ERP implementa-tion, small and medium-sized enterprise (SME), case study, ERP modification factor, function point
0 INTRODUCTION
A typical ERP (Enterprise Resource Planning) implementation in large enterprises (LE) can be generally expensive to implement [1] and [2] and take too long to realize business value – from one to five years [3] and [4]. Such implementation could cost several million dollars for a moderate size firm (license, installation, modification and maintenance costs) [3] to [6]. For small and medium-sized enterprises (SME) the major obstacles to wider application of classic ERP systems is project long-term duration and high cost of implementation and modification.
This paper focuses on the correlation between two critical success factors (CSF) in ERP implementation in SMEs (amount of ERP changes and their schedule). Both CSFs are defined in the four successful ERP projects in Croatian medium-sized SMEs made with the integrated ERP system called SUSTAV. The aim of this paper is to present a two-step modification approach of ERP system for SMEs as a way to reduce a project risk.
The paper is structured as follows. Introduction is followed by a brief business profile of the case studies and projects descriptions while Section 2 presents the case studies results.
Section 3 deals with the modification factor and scheduling. Conclusions are given in Section 4.
1 FOUR SME CASE STUDIES
Parameterization of commercial ERP systems cannot resolve all the specific requirements of SMEs, which consequently require modifications that lead to project extension. In this paper, the outcomes of ERP projects in four Croatian SMEs are analyzed. Furthermore, it is shown how the modification schedule is related to the implementation length.
The described case studies (denoted A-D retrospectively), shown in Table 1, were conducted in Croatian enterprises that successfully implemented SUSTAV [7] one of domestic ERP systems surveyed by [8]. SUSTAV achieved very good marks for the components it contains [8]. The main motive for seeking a new ERP suppliers and launch a complex project in all four companies was the desire to better support the expansion of business system.
Although well-structured ERP system with a lot of useful functionality can largely be parameterized, it is impossible to completely avoid its adaptation or extension. These additional

Strojniški vestnik - Journal of Mechanical Engineering 57(2011)1, 27-30
28 Čelar, S. – Mudnić, E. – Gotovac, S.
Table 1. Case studies – business data
CASE A B C D
industry retail wholesale, retail wholesale, retailhotel, manufacturing,
SCM, retail
vision & mission
integration of 4 small companies into a middle
one and expansion of new retail stores
expansion of new retail stores; build
regional wholesale/retail network
expansion of new retail stores; build
large regional retail network
construction of new factory; building of the large regional
retail networkemployees, Jan. 2010 266 171 304 374
income 2009 20 mio € 20 mio € 29 mio € 13 mio €end users, Jan. 2010 75 67 140 70
efforts directly affect the duration, cost and overall success of the ERP project. Therefore, this paper attempts to find an answer to two questions asked in the ERP projects in SMEs: (i) how ERP modification before go-live affects the ERP project duration and (ii) what is an adequate modification approach when the ERP changes are necessary?
In all the projects, a detailed gap analysis was made – customer current situation, their desire and business plans were compared with the ERP functionality. As a measure for overlapping of business processes and ERP functionality a gap analysis was performed. In all these projects the big-bang implementation strategy with minor modifications before the go-live activities and major modification after go-live and stabilization phase was suggested to the companies. However, in companies A and B it was decided to make the whole adaptation (Retail back office automation and front office automation, retrospectively) and then to implement the adapted ERP. In companies C and D a minor ERP modifications were started immediately after the gap analysis and finished before go-live activities, while larger modifications were made after go-live (see Fig. 1). Most of the modifications in companies C and D referred to reporting (C) and Production Management (D). Interoperability with legacy systems in company D is provided by ERP changes after go-live while others changed ERP completely.
2 CASE STUDIES’ RESULTS
PMBOK [9] was applied in implementation projects as a management guideline. All companies involved in the study are privately owned and
managements were very willing to organizational changes, although the management of companies A and C had no previous experience in the ERP implementation. In addition, the management used the ERP implementation projects as a means to achieve the re-engineering of business processes (BPR).
Although the change management readiness among top management was at a high level, end user acceptance was accessed as a high risk element. In order to eliminate this risk, a well-planned, prepared and executed education with a follow up was needed. The exception was the case D because of the initial small number of end users and because the key users used the same ERP two to three years (two years earlier, in another company).
In analyzing Figs. 1 and 2, several phenomena relevant to SME market can be seen. Projects lasted from 4 (company C) to 13 months (company A) – see Fig. 2. A large difference in the implementation effort in the company D (only 11.9 man-months) is notable. The reasons are a small number of end users, an extensive experience of the key users, a small number of retail stores and small stores integration effort. Company C had much fewer changes (only 2.8 man-months) than the others and completed implementation in the shortest time and with the smallest total effort.
On the other hand, company D, in which the changes amounted to a total of 11.3 man-months completed the project for 6 months while company B with only 5.2 man-months of changes needed even 9 months. Furthermore, project D completed more than twice faster than project A (6 to 13 months), although the total project effort ratio is relatively high (23.2 to 34.1 man-month).

Strojniški vestnik - Journal of Mechanical Engineering 57(2011)1, 27-30
29Interrelation between ERP Modification and Modification Scheduling: Four SME Case Studies in Croatia
where mi is the functional gap to modify in case i (in Function Points), mmax is maximal functional gap among the benchmarked cases (in Function Points).
The modification factors of the four analyzed case studies are shown in Table 3. The modification factor for case C shows that company C has the highest degree of overlapping of business processes and ERP functionality (all companies use the same ERP).
Table 2. Analysis of modification approaches
App
roac
h A
-Bad
vant
age Client starts go-live with an customized
ERP systemsFunctional uncertainty in the project is
smaller than in the approach C-D
disa
dvan
tage
Modification is a risky task and may delay the go-live and the whole
implementationGreater involvement of the client and the contractor (in parallel is to adapt and to
prepare implementation)Project takes more time to achieve final
results
App
roac
h C
-Dad
vant
age
Project is less riskyClient sees the project benefits earlier,
after 1st modification stepWhen a client sees the benefits, it is
easier to introduce new changesDelays in modification have less impact
on ERP go-live
disa
dvan
tage
Higher degree of compliance between business processes and ERP functionality
is neededChange management culture in customer
organization should be matureBusiness process (re)engineering
readiness should be positiveRelative “small 20%” of changes in
the 2nd step could take 80% of project duration
When the modification factor is big, it is recommended to make modification in two steps and thus reduce the riskiness of the project. In cases C and D modification was smaller and/or it was applied in two steps, so that the implementation was shorter. In addition, these two projects were also less risky. Therefore, a two step
Fig. 1. Amount of delivered modifications
The amount of changed functionality is not the only variable that significantly affected the project duration and success. According to the risk analysis and project outcomes (Figs. 1 and 2) the key element was the schedule of modification. Companies C and D finished their projects two to three times faster than companies A and B.
Fig. 2. Efforts and project duration
Generally speaking, these two modification approaches have some advantages and disadvantages, which are summarized in the Table 2. This comparison could be useful for project managers who have to make a decision about an appropriate scheduling approach and risk management.
3 MODIFICATION FACTOR AND MODIFICATION’S SCHEDULING
Since the amount of modification and its scheduling proved in the observed case studies as the key success elements, in this paper the modification factor (m) is defined as follows:
m = mi / mmax, 0 < m ≤ 1 , (1)

Strojniški vestnik - Journal of Mechanical Engineering 57(2011)1, 27-30
30 Čelar, S. – Mudnić, E. – Gotovac, S.
approach is the recommended approach for the projects with a higher modification factor.
Table 3. Modification factors
CASE A B C Dm 0.88 0.46 0.25 1.00
Experience of other companies that made similar projects could be helpful for new projects planning and scheduling.
4 CONCLUSION
In general, ERP system implementations are complex projects and many of them are unsuccessful. Almost all SMEs need some functional modifications of ERP in implementations and well-managed project implementation in SME takes at least 4 to 5 months. It is, therefore, important to manage the critical success factors wisely. Case analyses show that the ERP modifications significantly affect the success of ERP implementation projects. In addition to experience in the management of ERP projects and knowledge about ERP system itself, the key factor is also the schedule of these modifications.
In four ERP projects in SME companies the impact of sharing the ERP modification into two phases (before and after ERP’s go-live) was analyzed. The analysis shows that even projects with a higher modification factor and total project effort could be shorter than projects with a smaller modification factor if the modifications are scheduled wisely. The schedule approach with a minimal amount of necessary modifications in the first phase and larger modifications in the second, resulted in less risky and shorter projects. The key step in both approaches was the detailed gap analysis with an aim to determine the difference between SME business processes and functionality of the ERP system.
It is, therefore, advisable for SMEs to implement modified ERP systems in two phases (regarding necessary ERP modifications) and thus reduce the riskiness of the project and its duration. In this way, it could be easier to manage the whole
ERP project and thus control the implementation costs. In addition, the modification factor could also help in benchmarking the projects.
5 REFERENCES
[1] Botta-Genoulaz, V., Millet, P.-A. (2005). A classification for better use of ERP systems. Computers in Industry, vol. 56, no. 6, p. 573-587.
[2] Su, Y., Yang, C. (2010). Why are enterprise resource planning systems indispensable to supply chain management? European Journal of Operational Research, vol. 203, p. 81-94.
[3] Nicolaou, A.I. (2004). Quality of postimplementation review for enterprise resource planning systems. International Journal of Accounting Information Systems, no. 5, p. 25-49.
[4] Mabert, V., Soni, A., Venkataramanan, M.A. (2003). Enterprise resource planning: Managing the implementation process. European Journal of Operational Research, vol. 146, no. 2, p. 302-314.
[5] Al-Mashari, M., Al-Mudimigh, A., Zairi, M. (2003). Enterprise resource planning: A taxonomy of critical factors. European Journal of Operational Research, vol. 146, no. 2, p. 352-364.
[6] Matičević, G., Majdandžić, N., Lovrić, T. (2008). Production scheduling model in aluminium foundry. Strojniški vestnik – Journal of Mechanical Engineering, vol. 54, no. 1, p. 37-48.
[7] Celar, S., Gotovac, S., Vickovic, L. (2008). The role of PMO concept in project outcome increasing, Ch. 17, Katalinic, B. (Ed.), DAAAM International Scientific Book 2008, DAAAM International, Vienna, p. 197-204.
[8] Fertalj, K., Kalpić, D. (2004). ERP software evaluation and comparative analysis. Journal of Computing and Information Technology, vol. 3, p. 195-209.
[9] ANSI/PMI (2008). A Guide to the Project Management Body of Knowledge. PMI Inc., Newtown Square, Pennsylvania.

Strojniški vestnik - Journal of Mechanical Engineering 57(2011)1, 31-39 Paper received: 08.04.2009DOI:10.5545/sv-jme.2009.046 Paper accepted: 12.11.2010
*Corr. Author’s Address: School of Mechanical Engineering, Nanjing University of Science & Technology, Xiao Lingwei 200, Nanjing, China, [email protected] 31
Fatigue Life Analysis of Aluminum Wheels by Simulation of Rotary Fatigue Test
Wang, L. - Chen, Y. - Wang, C. - Wang, Q.Liangmo Wang* - Yufa Chen - Chenzhi Wang - Qingzheng Wang
School of Mechanical Engineering, Nanjing University of Science & Technology, China
To improve the quality of aluminum wheels, a new method for evaluating the fatigue life of aluminum wheels is proposed in this paper. The ABAQUS software was used to build the static load finite element model of aluminum wheels for simulating the rotary fatigue test. The equivalent stress amplitude was calculated based on the nominal stress method by considering the effects of mean load, size, fatigue notch, surface finish and scatter factors. The fatigue life of aluminum wheels was predicted by using the equivalent stress amplitude and aluminum alloy wheel S-N curve. The results from the aluminum wheel rotary fatigue bench test showed that the baseline wheel failed the test and its crack initiation was around the hub bolt hole area that agreed with the simulation. Using the method proposed in this paper, the wheel life cycle was improved to over 1.0×10⁵ and satisfied the design requirement. The results indicated that the proposed method of integrating finite element analysis and nominal stress method was a good and efficient method to predict the fatigue life of aluminum wheels.©2011 Journal of Mechanical Engineering. All rights reserved. Key words: aluminum wheel, finite element analysis, static analysis, fatigue analysis
0 INTRODUCTION
Aluminum wheels should not fail during service. Their strength and fatigue life are critical. In order to reduce costs, design for light-weight and limited-life is increasingly being used for all vehicle components. In the actual product development, the rotary fatigue test is used to detect the strength and fatigue life of the wheel. Therefore, a reliable design and test procedure is required to guarantee the service strength under operational conditions and full functioning of the wheel.
Loads generated during the assembly may cause significant levels of stress in components. Under test conditions, these high levels of stress alter the mean stress level which in turn, alters the fatigue life and critical stress area of the components as well. Guo, Bhandarkar and Lin conducted finite element analysis and found that the inclusion of clamp load improves the prediction of the critical stress area and fatigue life of aluminum wheels [1]. Grubisic and Fischer examined wheel decisive parameters for design and durability, including operational loads, fatigue properties, which depend on material and manufacturing technology, and design [2]. Hsu, Wang and Liu proposed a probability-based model
for predicting the fatigue failure of aluminum wheels. This model was intended to improve the prediction of the wheel fatigue life using simulation results and historical data. In their study, finite element models of 20 physcially tested aluminum wheels were constructed to simulate the dynamic radial fatigue test. Their mean stress level and stress amplitude during the fatigue loading cycles were calculated and plotted on a two dimensional plane. For a new wheel, the failure probability of the dynamic radial fatigue test can be read directly from this probability contour drawn from the test data [3]. Kocabicak and Firat proposed a bi-axial load-notch strain approximation for proportional loading to estimate the fatigue life of a passenger car wheel during the cornering fatigue test. The elasto-plastic strain components were calculated analytically using the total deformation theory of plasticity. The damage accumulation was calculated based on the Palmgren- Miner rule [4]. Raju et al. were concerned with generation of S-N curve for aluminum alloy (Al) A356.2-T6 and estimation of fatigue life under radial fatigue load. Finite element analysis (FEA) was carried out by simulating the test conditions to analyze the stress distribution and fatigue life of alloy wheels. The analytical results using FEA to predict the wheel fatigue life agreed well with the experimental

Strojniški vestnik - Journal of Mechanical Engineering 57(2011)1, 31-39
32 Wang, L. - Chen, Y. - Wang, C. - Wang, Q.
results [5]. A mathematical model was developed to predict the residual stress distribution of an A356 alloy wheel, taking into account the residual stress evolution during the T6 quench process and redistribution of residual stress due to the material removal at the machining stage. The fatigue life of an A356 wheel was predicted by integrating the residual stress into the in-service loading and wheel casting defects (pores). The residual stress showed a moderate influence on the fatigue life of the wheel, which was more sensitive to casting pore size and service stress due to applied loads [6]. By improved Smith formula, Yang, Cui and Zhao used finite element analysis of stress values as the basic parameters for wheel fatigue life prediction.The wheel bending fatigue test results verified the method [7].
1 ROTARY FATIGUE TEST
In this paper, for predicting the wheel fatigue life, the nominal stress method was integrated into the CAD / CAE technology to simulate the rotary fatigue test. In addition, an actual prototype of the test was done to verify the analysis.
In the rotary fatigue test, a wheel was spun to bear a moment to simulate the process of turning corner continued the wheel’s ability bearing the moment. According to the rotary fatigue test condition as specified in the SAE test procedure [8], a wheel was mounted on a rotating table. A shaft was attached to the center of the wheel where a constant normal force was applied as shown in Fig.1.
Fig.1. Layout of wheel rotary fatigue test
Test moment is calculated as follows [9]:
M R= +( )µ λd F , (1)
where M is the moment (Nm), it is the strengthening moment the real vehicle bears; μ is the friction coefficient between tires and the road and set as 0.7; R is the tire static load radius (m); d is the offset of wheel (m); F is the maximum rated load (N), which can be obtained by standards; λ is the strength coefficient and set as 1.5. It is necessary to bear such a cycle load 1.0×10⁵ times with no visible crack.
2 MATERIAL PROPERTIES AND MANUFACTURING OF ALUMINUM
ALLOY WHEEL
2.1 A356 Aluminum Alloy
The aluminum alloy A356 is widely used in the wheel industry, its solidification temperature ranges from 550 to 615 °C and its volume shrinkage is about 6%. Tables 1 and 2 show the components of A356 cast aluminum alloy and the mechanical performance of these components [9].
2.2 Foundry Technology
Gravity casting and low-pressure casting are the two major approaches to case aluminum alloy wheels. Gravity casting presses molten metal into mold by gravity, while low-pressure casting uses low-pressure of air instead of gravity for molding. Of these two approaches, low-pressure casting has a higher utilization ratio of molten aluminum alloy, and higher levels of mechanical quality, surface hardness, and accuracy of dimension and smooth surface, so it is a major method to produce aluminum alloy wheels.
Low-pressure permanent mold casting uses a gas at low pressure, usually between 21 and 100 kPa to push the molten metal into the mold cavity. The pressure is applied to the top of the pool of liquid, which forces the molten metal up a refractory pouring tube and finally into the bottom of the mold. The pouring tube extends to the bottom of the ladle, so that the aluminum being pushed into the mold is exceptionally clean. The speed of aluminum being pushed into the mold is usually controlled in the range of 30 to 70mm/s to ensure that the molten aluminum flows smoothly and the air exhausts out [10].

Strojniški vestnik - Journal of Mechanical Engineering 57(2011)1, 31-39
33Fatigue Life Analysis of Aluminum Wheels by Simulation of Rotary Fatigue Test
3 FINITE ELEMENT MODELING BASED ON ROTARY FATIGUE TEST
Based on the wheel dynamic bending fatigue test, the finite element models of automotive wheels under the static load are constructed, and the I–DEAS software is used to perform the stress analysis [11] and [12]. In this paper, the stress analysis was performed by using a commercial FEA software ABAQUS. ABAQUS is powerful engineering finite element simulation software with a library of rich elements that can be used to simulate any geometry and typical engineering properties of materials. The software provides solutions to problems ranging from relatively simple linear analysis to many complex non-linear problems [13].
3.1 Element Type and Material Properties
The wheel is meshed using second-order mend tetrahedral elements (C3D10M), with an element size of 10 mm, which can be refined locally. There are a total of 167,817 C3D10M elements. The shaft is modeled using C3D8R element, with an element size of 20 mm. There are a total of 3,162 C3D8R elements [13].
3.2 Wheel Meshing
When the wheel is meshed, in estimated data change gradient big spot, it needs to adopt more intensive grid to better reflect the changes of data. In the wheel hub, the danger zones are rim, junction with rim and rib, and the areas
2.3 Heat Treatment Technology
T6 Heat Treatment is a specific heat treatment process which can be applied to aluminum wheels. The T6 heat treatment for aluminum wheels commonly includes solution treatment, quench and artificial aging.
Solution treatment can dissolve the alloying elements, get supersaturated and instable solid solution phase, in order to enhance the effect of subsequent aging. The solution treatment temperature needs to exceed the solid solution temperature. The higher the temperature is, the better the effect of solution treatment is. But the treatment temperature cannot exceed that of the solidus, otherwise, the mechanical performance of the wheel will distinctly decline due to overheating or oversintering. In this phase the alloy wheel is heated to 535±5 °C for 3 to 4 hours. In the quench phase, quenching temperature cannot be too low, otherwise, excessive internal stress will result in deformation and cracking, and the quenching time should be as short as possible. The wheel is water quenched less than 15 s, and the water temperature is 60 °C. Finally, in the artificial aging, the strength and hardness of aluminum alloy are improved because the supersaturated solid solution decomposes as time increases. If the aging temperature is too high, the elongation of aluminum alloy will decrease. However, if the aging temperature is too low, the yield strength and tensile strength will decline. In T6 heat treatment condition, temperature is kept at 165±5 °C for 3 to 4 h [10].
Table 1. The components of A356 cast aluminum alloy (GB/T 1173-1995)
Elements Si Mg Ti Fe Cu Zn Mn AlWeight[%]
6.5~7.5 0.25~0.45 0.08~0.20 ≤0.2 ≤0.1 ≤0.1 ≤0.1 Others
Table 2. The mechanics performance of A356 cast aluminum alloy (GB/T 1173-1995)
Alloy Foundry method
Heat treatment
Mechanics Performance(≥)Tensile strength
σb [MPa]Elongation δs
[%]Brinell hardnessHBS
(5/250/30)ZAlSi7MgA (A356)
Metal Mold casting T6 225 3 80

Strojniški vestnik - Journal of Mechanical Engineering 57(2011)1, 31-39
34 Wang, L. - Chen, Y. - Wang, C. - Wang, Q.
around bolt hole. The stress concentration region corresponding grid distribution should be dense; but the rim the stress cannot consider nearly in the entire parsing process, the corresponding grid distribution should be sparse (shown in Fig. 2).
a)
b)
c)
Fig. 2. Wheel meshing; a) bolt hole, b) rib, c) junction with rim and rib
3.3 Loads and Boundary Conditions [1]
In the FEA model, loading and boundary conditions were set up similarly to those in the bench test. The wheel was constrained around flange edge of the rim and loaded with a constant force at the end of the shaft, see Fig. 3. The load shaft and wheel were connected by bolts. Due to
the main concern being wheel deformation, the load shaft in the FEA analysis was defined as a rigid body, using tie connection with wheel. J area under the wheel rim was under full constraints.
In aluminum alloy wheel fatigue test, 1×10⁵ cycles were conducted. To simulate the cycle, there were 16 load cases, each interval was 22.5°, and wheel responses were calculated respectively. As shown in Fig. 3, the direction at 0° gave the positive direction of x axis from the original direction of cyclical loading force in the simulation. Then, the force loaded counterclockwise with an intersection of 22.5° which was sufficient to reflect the real stress distribution.
Fig. 3. Finite element model
4 STATIC ANALYSIS
4.1 Baseline Design
When the wheel endured the dynamic bending moment, load direction and maximum stress place changed over time. According to the pre-process, the circumference was divided into 16 sections and the information of stress and location was calculated. As the wheel structure was complex, Von Mises stress was used.
The node with maximum wheel stress at the 16 load cases was exactly the damage area. Because the wheel structure was symmetrical, only eight load cases were analyzed. Figs. 4 and 5 show the wheel stress and stress local at the loading direction of 0°.
The maximum stress was 152.54 MPa in the node 111606, which was in the hub bolt hole area. According to the bench test, this area was also where the crack damage occurred to the wheel. Therefore, the result from the FEA was reliable. The remaining stress figures were

Strojniški vestnik - Journal of Mechanical Engineering 57(2011)1, 31-39
35Fatigue Life Analysis of Aluminum Wheels by Simulation of Rotary Fatigue Test
omitted. The principal stress was not considered in this location because Von Mises stress criteria was sufficient.
The maximum stress level of wheel key nodes was shown in Table 3. Stress concentration, weakness and possible fatigue cracks were presented in this table.
4.2 Improved Design
According to the FEA results of the baseline design, the aluminum alloy wheel design could be improved by reinforcing the weaker area and revising the geometry of rib and notch.
Fig. 6 shows the wheel stress at the loading direction of 0°. The maximum stress was 143.64
MPa in the node 192061 which was in the hub bolt hole area same as the baseline design. Table 4 shows the maximum stress level of wheel key nodes. It can be seen that the maximum stress level of the improved wheel design using FEA is smaller than that of the baseline design in all load cases.
5 FATIGUE ANALYSIS [11] and [15] to [18]
The main methods to determine the model fatigue life are fatigue life test and fatigue life analysis. Fatigue life test has a high-cost and long cycle. Fatigue life analysis is based on the fatigue properties of materials and load time histories. It can predict fatigue life at the product design stage,
Table 3. The maximum stress value of wheel key nodes (Baseline design) [MPa]
σmax node 0° 22.5° 45° 67.5° 90° 112.5° 135° 157.5° 180°
111606 152.54 164.82 89.04 116.06 64.45 1.88 37.33 117.04 152.547986 64.75 101.76 72.74 128.14 112.99 81.24 22.92 23.28 64.758024 51.31 18.34 30.69 92.05 118.99 128.33 69.43 91.21 51.316059 3.07 31.40 34.54 77.61 139.90 78.48 35.47 33.48 3.07
278799 147.62 113.16 36.02 2.04 60.71 112.56 86.28 159.60 147.62
Table 4. Maximum stress value of wheel key nodes (Improved design) [MPa]
σmaxnode 0° 22.5° 45° 67.5° 90° 112.5° 135° 157.5° 180°
192061 143.64 150.13 83.78 109.14 58.68 13.34 35.25 110.28 143.6413037 21.27 43.14 34.34 135.40 61.97 49.31 17.13 6.01 21.2711096 17.88 54.46 53.97 116.90 124.34 113.23 50.02 45.98 17.88
207190 48.21 16.97 31.70 93.27 119.25 127.51 68.35 88.57 48.21238613 143.41 110.09 35.16 15.56 58.58 108.99 83.66 154.90 143.41
Fig. 4. Node:11606,152.54MPa [0°] Fig. 5. Stress local figure [0°]

Strojniški vestnik - Journal of Mechanical Engineering 57(2011)1, 31-39
36 Wang, L. - Chen, Y. - Wang, C. - Wang, Q.
reduce the number of experimental prototypes, and shorten the development cycle. Fatigue life analysis includes nominal stress analysis, crack initiation analysis, stress-strain field intensity and energy law [14].
Fig. 6. 0° Node192061, 143.64 [MPa]
In this paper, a method that combined nominal stress analysis and static analysis was used to predict wheel fatigue life.
5.1 Material S-N Curve
In high-cycle fatigue situations, materials performance is commonly characterized by an S-N curve, also known as a Wöhler curve. This is a graph of the magnitude of a cyclical stress (S) against the logarithmic scale of cycles to failure (N).
In the absence of test data, some special points can be obtained from the basic material performance parameters, and then material S-N curve can be obtained by connecting them.
When N ≤ 1 × 10³, σ-1N = 0.9 σb .When N ≥ N0, σ-1N = σ-1 .When 1 × 10³ ≤ N ≤ N0, S-N curve can be
obtained by connecting two points (N = 1×10³, σ-1N = 0.9 σb and N = N0, σ-1N = σ-1) and calculated using the following equation:
lg lg lg lglg
lg( . ) lgσ σ σ σ− − −= +−−
−[ ]1 10
130 9N b
N NN
. (2)
N is stress or strain cycle. The cycle N0 corresponds to the breaking point of material. σ-1N is the limited life material limit of fatigue under
symmetric cycle. σ-1 is the material limit of fatigue under symmetric cycle.
Therefore, the basic material S-N curve can be established as depicted in Fig.7.
Fig.7. Material S-N curve
The strength limit σb of material A356 is 250 MPa. The symmetrical bending fatigue limit σ-1 is 120 MPa. N0 can be obtained as 1×10⁷.
5.2 Influencing Factors
Component size factor ε: Component fatigue strength decreases as component size increases. Component size has a distinct effect on part fatigue strength. Therefore, size factor describes the size effect on fatigue strength.
When N ≥ N0, for bending and torsion, εN = ε, where ε and εN give the size factors of unlimited life design and limited life design respectively. When N ≤ 1 × 10³, εN = 1. When N = 1 × 10³
to N0, points 1 × 10³ corresponding to 1 and N0 corresponding to ε are connected on coordinates, and the corresponding life of εN can be obtained from the ratio curve. In this case, according to the wheel size, ε is 0.68.
Fatigue notch factor Kf: In the stress-life approach the effect of notches is accounted for by the fatigue notch factor, Kf: This value relates the unnotched fatigue strength of a member to its notched fatigue strength at a given life. Kf can be calculated by using the following Eq.:
Kf = 1 + q(Kt - 1), (3)
where q-a notch sensitivity factor; Kt the theoretical stress concentration factor.
The original fatigue location always occurs at the stress-concentrated area. Fatigue notch factor is usually used to express the

Strojniški vestnik - Journal of Mechanical Engineering 57(2011)1, 31-39
37Fatigue Life Analysis of Aluminum Wheels by Simulation of Rotary Fatigue Test
reduction in fatigue strength of part notch. When N ≤ 1 × 10³, KfN =1. When N = 1 × 10³ to N0, points 1 × 10³ corresponding to 1 and N0 corresponding to Kf are connected on coordinates, and the corresponding life of KfN can be obtained from the ratio curve. When N ≥ N0, KfN = Kf. In this case, Kf = 1.1.
Surface finish factor β: Part surface state has prominent effect on fatigue strength, so surface factor is used to describe the effect degree. When N ≤ 1 × 10³,βN = 1. When N = 1 × 10³
to N0, connect points 1 × 10³ corresponding to 1 and N0 corresponding to β on coordinate, obtain corresponding life of βN from the ratio curve. When N ≥ N0,βN = β. In this case β is 0.95.
Scatter factor Ks: Material property, heat treatment, machining process, and so forth have errors, so scatter factor KsN is considered. When N ≤ 1×10⁴, KsN = Ks1. When N ≥ 1 × 10⁵, KsN = Ks2. For aluminum alloy wheels which are casted, Ks1 = 1.3, Ks2 = 1.6. When N = 1 × 10⁴ to 1 × 10⁵, connect points 1 × 10⁴ corresponding to 1.3 and 1 × 10⁵ corresponding to 1.6 on coordinate, obtain corresponding life of Ks from the ratio curve.
5.3 Component S-N Curve
Based on material S-N curve, component S-N curve can be obtained by considering size factor, fatigue notch factor, surface finish factor and scatter factor.
First, σ-1D is not corrected when N = 1, 1×10³. When N = N0, σ needs to divide fatigue strength coefficient KσD. Then, the adjacent points are connected, the component S-N curve can be obtained without considering the scatter factor. The component S-N is calculated using the following Eq.:
lg lglg lg
lglg( . ) lgσ σ σ σ
−=
−+
−
−−
−
1 1
0
0 30 9
1DN D
N N
N b D, (3)
where σ-1D = σ-1 / KσD and KK
DfN
N Nσ ε β
= + −1 1 .
After all, N = 1, 103, 104, using the σ divides scatter factor Ks1; N = 105, N0, using the σ divides scatter factor Ks2. Therefore, a modified component S-N curve can be obtained by connecting two adjacent points as shown in Fig. 8.
Fig. 8. Component S-N curve (1 material S-N curve 2 component S-N curve)
5.4 Equivalent Cycle Stress and Fatigue Life
Wheel fatigue strength is determined by the maximum stress σmax and minimum stress σmin of weakness spot. Based on the nominal stress analysis for predicting wheel fatigue life, weakness spot S-N curve is suitable to symmetrical loads.
According to the influence of medium stress and fatigue strength decreasing coefficient, any asymmetric cycle stress has an equivalent cyclic stress amplitude σae which can be calculated by using Eq. (5). Therefore, the problem of asymmetric cycle stress can be translated to symmetry cycle stress.
σ σ ψ σσae D a a mK= + , (4)
where σa = (σmax - σmin)/2, σa is the stress amplitude; σm = (σmax - σmin)/2, σm is the mean stress.
Ψσ is the equivalent factor which is used to convert medium stress to equivalent stress amplitude. It is related to material properties and calculated as follows:
ψ σ σσ = +−1 350( )b . (6)
Where σ-1 is the material fatigue limit; σb is strength limit.
Considering the equivalent stress σae in the component S-N curve, the value at abscissa is the fatigue life.

Strojniški vestnik - Journal of Mechanical Engineering 57(2011)1, 31-39
38 Wang, L. - Chen, Y. - Wang, C. - Wang, Q.
achieve results consistent with that obtained from the actual static load test.
The nominal stress method was used to predict the fatigue life of aluminum alloy wheels. In the nominal stress method, the fatigue life of aluminum wheels was predicted by using aluminum alloy wheel S-N curve and equivalent stress amplitude. The simulation result showed that baseline design fatigue life was lower than 1 × 10⁵. After improving the weakness area of aluminum alloy wheels, the improved wheel life cycle exceeded 1 × 10⁵ and satisfied the design requirement.
Aluminum alloy wheel rotary fatigue bench test was conducted. The test result showed that the prediction of fatigue life was consistent with the physical test result. These results indicate that the fatigue life simulation can predict weakness area and is useful for improving aluminum alloy wheel. These results also indicate that integrating FEA and nominal stress method is a good and efficient method to predict aluminum alloy wheels fatigue life.
List of notation
D the offset of wheel [m]F the maximum rated load [N]Kf fatigue notch factor q a notch sensitivity factorKt the theoretical stress concentration factorKfN fatigue reducing factorKsN scatter coefficient
5.5 Fatigue Analysis and Test Correlations [12]
Based on the previous static analysis results, equivalent symmetric cycle stress amplitude of maximum stress amplitude node can be calculated. Considering the equivalent stress in the component S-N curve, the fatigue life is obtained.
Tables 5 and 6 give the equivalent stress amplitude and fatigue life results of the baseline and improved designs. The results showed that the fatigue life of baseline design was less than 1 × 10⁵ cycles and failed to meet the design requirement for aluminum alloy wheels. While the fatigue life of the improved design using FEA was greater than 1 × 10⁵ cycles, satisfying the design requirement.
To validate the prediction of fatigue life, wheel rotary fatigue test was conducted. The test results showed that the prediction of fatigue life using FEA was consistent with the result of bench test.
6 CONCLUSION
A fatigue lifetime prediction method of aluminum alloy wheels was proposed to ensure their durability at the initial design stage. To simulate the rotary fatigue test, static load FEM model was built using ABAQUS. The analysis results showed that the maximum stress area was located in the hub bolt hole area agreed with the fact. Therefore, the finite element model can
Table 5. Equivalent stress and fatigue life of wheel dangerous nodes (Baseline design)
Node σmax [MPa] σmin [MPa] σa [MPa] σm [MPa] σ [MPa] life [cycle]111606 164.82 1.88 81.52 83.47 98.19 644867986 128.14 22.92 52.64 75.56 67.73 4395428024 128.33 18.34 55.01 73.35 69.76 3796276059 139.97 3.07 82.75 68.41 71.52 155779
278799 159.60 2.04 78.89 80.83 94.95 76531
Table 6. Equivalent stress and fatigue life of wheel dangerous nodes (Improved design)
node σmax [MPa] σmin [MPa] σa [MPa] σm [MPa] σ [MPa] life [cycle]192061 150.13 13.34 68.39 81.73 84.74 13778013037 135.40 6.01 64.77 70.70 78.84 20019811096 124.34 17.88 53.20 71.12 67.42 448512
207190 127.51 16.97 55.32 72.24 69.70 378053238613 154.90 15.56 69.67 85.23 86.72 122309

Strojniški vestnik - Journal of Mechanical Engineering 57(2011)1, 31-39
39Fatigue Life Analysis of Aluminum Wheels by Simulation of Rotary Fatigue Test
KσD the fatigue reducing factor of component M the moment [Nm]R the tire static load radius [m]N stress or strain cycles before fatigue failureN0 the cycle is corresponding to the breaking
point of materialS-N Wohler curveβ surface finish factorβN surface finish coefficient:ε the size factors of unlimited life design εN the size factors of limited life designλ the strengthening coefficientμ the friction coefficient between tires and the
roadσ equivalent cyclic stressσa the stress amplitudeσmax the maximum stressσb strength limitσf the real fracture stressσm the mean stressσ-1 fatigue limit σ-1N fatigue strength at N cyclesσae equivalent cyclic stress amplitude Ψσ the equivalent factor which is used to convert
medium stress to equivalent stress amplitude.
7 REFERENCES
[1] Guo, M., Bhandarkar, R., Lin, B. (2004). Clamp load consideration in fatigue life prediction of a cast aluminum wheel using finite element analysis. Society of Automotive Engineer, Inc. Warrendale, Pennsylvania.
[2] Grubisic, V., Fischer, G. (1998). Design criteria and durability approval of wheel hubs. Society of Automotive Engineer, Inc. Warrendale, Pennsylvania.
[3] Hsu, Y.-L., Wang, S.-G., Liu, T.-C. (2004). Prediction of fatigue failure of aluminum disc wheel using the failure probability contour based on historical test data.Journal of the Chinese Institute of Industrial Engineers, vol. 21, no. 6, p. 551-558.
[4] Kocabicak, U., Firat, M. (2001). Numerical analysis of wheel cornering fatigue tests, Engineering Failure Analysis, vol. 8, p. 339-354.
[5] Ramamurty Raju, P., Satyanarayana, B., Ramji, K., Suresh Badu, K. (2007).
Evaluation of fatigue life of aluminum alloy wheels under radial loads. Engineering Failure Analysis, vol. 14, p. 791-800.
[6] Li, P., Maijer, D.M., Lindley, T.C., Lee, P.D. (2007). Simulating the residual stress in an A356 automotive wheel and its impact on fatigue life. Metallurgical and Materials Transactions B, vol. 38B, no. 8, p. 505-515.
[7] Zhanchun, Y., Shengming, C., Guifan, Z. (2000). Prediction of automobile wheel fatigue life with improved smith equation. Journal of Harbin Institute of Technology, vol. 32, no. 6, p. 100-102.
[8] SAE J328 Revised 1994: Wheels-Passenger car and truck performance requirements and test procedures.
[9] GB/T 1173-1995, Casting Aluminum Alloy. [10] Yutao, Z. (2004). Aluminum alloy wheel
manufacturing technology, China Machine Press, Beijing.
[11] Cuixia, Z. (2006). Design and structural analysis of aluminum alloy wheel, Dissertation, Zhejiang University, Zhejiang.
[12] Xiaofeng, W., Zhao, L., Xiaoge, Z. (2007). Finite element analysis of a wheel based on the wheel dynamic cornering fatigue test. Tractor & Farm Transporter, vol. 34, no. 1, p. 45-47.
[13] Tenglun, Z. (2007). The application of ABAQUS 6.6 in mechanical engineering, China Water Power Press, Beijing.
[14] Karandikar, H.M. (1990). Fatigue life prediction for wheels by simulation of the rotating bending test. Society of Automotive Engineer, Warrendale, Pennsylvania.
[15] Bannantine, J.A., Corner, J.J., Handrock, J.L. (1990). Fundamentals of metal fatigue analysis, Prentice Hall, New Jersey.
[16] Pook, L. (2007). Metal fatigue: what it is, why it matters, solid mechanics and its applications, Springer Verlag, Berlin.
[17] Stephens, R.I., Fatemi, A., Stephens, R.R., Fuchs, H.O., Faterni, A. (2000). Metal fatigue in engineering, 2nd Edition, Wiley-Interscience.
[18] Zhao, S., Wang, Z. (1997). Fatigue design. Mechanical Industrial Press,.

Strojniški vestnik - Journal of Mechanical Engineering 57(2011)1, 40-46 Paper received: 15.01.2006DOI:10.5545/sv-jme.2006.001 Paper accepted: 02.12.2010
*Corr. Author’s Address: University Politehnica Timisoara, Department Strength of Materials, Blvd. M. Viteazu, No. 1, Timisoara 300222, Romania, [email protected]
Comparison between Elastic-Perfectly-Plastic Interfacial Free-Edge and Crack Tip Singular Fields
Liviu Marsavina1,* - Andrew D. Nurse2
1 University Politehnica Timisoara, Romania 2 Loughborough University, UK
The problem of the elastic and perfectly-plastic plane-strain asymptotic fields for the interfacial free-edge joint singularity is examined and compared with the interfacial crack tip. The geometries are idealised as isotropic elastic and elastic-perfectly-plastic materials bonded to a rigid elastic substrate. Under elastic behaviour it is difficult to directly compare the asymptotic fields between the joint and the crack due to the difference in singularity order and stress distributions. The elastic-perfectly-plastic fields for the interfacial free-edge joint were determined as polar stress components and as idealised plastic slip-line sectors. A fourth-order Runge-Kutta numerical method provides solutions to fundamental equations of equilibrium and compatibility that are verified with those of a highly focused finite element (FE) analysis. A successful attempt to show that a direct comparison between the solutions for the interfacial free-edge joint and the Mode I interfacial crack exists if the deviatoric stresses are considered.© 2011 Journal of Mechanical Engineering. All rights reserved. Keywords: free-edge, crack tip, interface, elastic-perfectly-plastic
0 INTRODUCTION
Interface-controlled fracture is the initial microscopic event leading to ultimate macroscopic rupture in many polycrystalline and composite materials. Failure frequently initiates within the interfacial free-edge singularity being the source of unbounded elastic stresses and/or a plastic zone. The fracture process continues through propagation of an interface crack driven by complex stress intensity factors (SIFs). However, the actual events that take place between the former (initiation) and latter (propagation) are not well understood. From a design perspective, one may choose to prevent initial debonding of the interfacial joint or to prevent crack propagation. To add to the confusion though, it has been shown by Klingbeil and Bleuth [1] that conflicting solutions are obtained if designing to prevent debonding of the interfacial free-edge and subsequent propagation of the interfacial crack. Thus far, at least, it has been shown by Akinsaya and Fleck [2] that in the interim stage between initiation and propagation an interface crack has SIFs amplified if it is embedded in a free-edge singularity field. This may seem an issue related only to interfacial systems but considering that the vast majority of structural materials are either
polycrystalline metals or composite materials, it is more fundamental than perhaps first considered.
One approach to understand the events that take place between crack initiation at the interfacial free edge and propagation of an interface crack would be to examine the change in stress state from the initiating stage to the final stage. However, to link the two fields in terms of elastic stresses and strains is problematic due to the general difference in singularity orders and resulting angular distributions. From an asymptotic perspective, the problem is incomprehensible given that one either has a free edge (Fig. 1a), or one has a crack (Fig. 1b); there is no in-between stage. Furthermore, most structural materials are also known to undergo, in general, small-scale yielding (SSY) before failure. Consequently, there seems little point in attempting to establish a direct link between crack initiation and propagation in the purely elastic regime. It seems more important to link the asymptotic fields of the interfacial free-edge joint and interfacial crack tip under elasto-plastic (SSY) conditions. Our understanding of the toughness of interfacial systems would be then increased with this link between the events of crack initiation, i.e. debonding of the interfacial free-edge joint and the propagation of an interfacial crack.

Strojniški vestnik - Journal of Mechanical Engineering 57(2011)1, 40-46
41Comparison between Elastic-Perfectly-Plastic Interfacial Free-Edge and Crack Tip Singular Fields
In this paper, the structure of the asymptotic field at the interfacial free-edge is determined for an elastic-perfectly-plastic material bonded perfectly to a rigid elastic material forming a half plane. Stresses and displacements in the asymptotic fields are numerically calculated in an approach similar to Sharma and Aravas [3] and are verified by finite element (FE) analysis. To determine a pathological link between crack initiation at the interfacial free-edge and growth of an interface crack the two fields are compared directly. To compare for a range of possibilities the distributions of polar stress components are determined for the interfacial free-edge and crack-tip singular fields for the purely elastic and perfectly-plastic cases. In the latter case, direct comparisons are possible since the singularities are removed by material yielding except in the case of the radial shear strain. The plastic slip-line field for the interface crack-tip characterized by Zywicz and Parks [4] is used to show that the interfacial free-edge joint solution is very similar to its counterpart crack-tip with a null elastic wedge sector.
a)
b)
Fig. 1. Schematic a) interfacial free-edge joint and b) interfacial crack-tip geometries including
polar and Cartesian co-ordinate systems
1 THEORETICAL FORMULATION
The singularity order of the interfacial crack tip under elastic conditions is always -0.5 in comparison to the free-edge joint that varies according to the elastic properties of the two materials. In general, the interface crack between two isotropic materials suffers a singularity stress field characterised by the complex SIF, K = K1 + iK2, and is of the form:
( ) ( )0.5, ,iij ijr Kr ges θ e θ− += , (1)
where e is the oscillatory index and gij are known non-dimensional functions. A singularity at the interfacial free-edge is predicted by Bogy [5] to be of order depending on the elastic constants of the materials. For the interfacial free-edge joint the stress singularity corresponds to the form:
( ) ( )1, ,ij ijr Hr fλs θ λ θ−= , (2)
where H is its intensity, λ-1 is the singularity order, and fij are known non-dimensional functions of (λ,θ). The order of the singularity λ is dependent on the degree of material mismatch and the intensity H depends on the far-field geometry and loading. For the purposes of this study the singularity order of the elastic case for an aluminium – epoxy joint (EAl = 70000 MPa, νAl = 0.33, Eepoxy = 3000 MPa, nEpoxy = 0.4) is λ-1 = -0.303.
A fracture mechanics description of the critical state prior to separation using continuum-based mechanics usually involves the elastic solution for the crack. It is of limited use for describing materials that yield and undergo inelastic deformation at high strains. The elasto -plastic interfacial crack problem has received considerable attention in the last decade, enabling a thorough understanding to be developed. Using a J-integral argument Rice and Rosengren [6], and Hutchinson [7] have shown that crack problems under SSY conditions result in a 1/r singularity in the strain-energy density and the radial shear strain fields. The analysis of interfacial free-edge is just as important to our understanding of crack initiation and growth though in comparison to its counterpart the interface crack it has received far less attention. It appears no effort has been made to understand the elasto-plastic behaviour of the free-edge singularity. The constitutive behaviour of a homogeneous isotropic elasto-plastic material

Strojniški vestnik - Journal of Mechanical Engineering 57(2011)1, 40-46
42 Marsavina, L. - Nurse, A.D.
may be characterised by the J2 deformation theory for a Ramberg-Osgood uniaxial stress-strain behaviour, i.e.:
1
1 1 2 33 2 o
o o
nije
ij ij kk ij
SS
E Esn ne s δ aes s
− + −
= + +
, (3)
where εij is the infinitesimal strain tensor, σo is the yield stress, σe is the Mises equivalent stress, E is the Young’s moduli, εo = so/E and Sij is the deviatoric stress. Also, n is the power-law hardening exponent (1 ≤ n ≤ ∞), δij is the Kronecker delta, and a is a material constant. Putting n = ∞ then the behaviour is elastic-perfectly-plastic.
Asymptotic solutions to the crack-tip behaviour under elastic-perfectly-plastic conditions may be obtained in polar co-ordinate form (r, θ) using the expansion form given by Sharma and Aravas [3]. To obtain the asymptotic solution the problem is formulated in terms of the leading order stresses ( )0
s and displacements u(0) that are substituted into the governing equations of equilibrium, compatibility, and stress-strain relationship. Terms having like powers of radius r are collected and hierarchy of problems is obtained. The leading order problem that defines σ(0) and u(0) consists of five non-linear ordinary differential equations, where s is the stress singularity order [8].
The focus of the paper is the leading order solution for the interfacial free-edge joint and its similarities with that of the crack tip where s = -1/(1+n).
( )
( )
( )
(0)(0) (0)
(0)(0)
(0)~(0) (0) 1
(0)(0) ~(0) 1
(0)(0) (0) 1 (0)
1 0,
2 0,
31 0,2
3 0,2
1 3 0.2 2
rrr
r
nrrr e
nr e
nre r
dsd
d sd
sn u S
duu Sd
du snud
θθθ
θθθ
θθθ
θ θ
ss sθ
s sθ
s
sθ
s sθ
−
−
−
+ − + =
+ + =
+ − =
+ − =
+ − =
(4)
2 THE DEVELOPMENT OF THE ELASTIC-PERFECTLY-PLASTIC FIELD FOR THE INTERFACIAL FREE-EDgE JOINT AND
BIMATERIAL INTERFACE CRACK
A fourth-order Runge-Kutta solution to the Eq. (3) was obtained for an elastic-perfectly-plastic hardening exponent (n > 1000), using the proprietary software Mathcad (v.2000), distributed by Adept Scientific Ltd. n iteration scheme was used to determine the solution s to the non-linear eigenvalue problem and the subsequent distributions for the stresses and displacements that satisfy the governing equations and imposed boundary conditions, [8]. This asymptotic solution was verified by a FE analysis performed by using the software Lusas (v13.3, distributed by FEA Ltd., UK). Highly-focused, refined meshes for the interfacial free-edge joint and bimaterial interface crack geometries were prepared using
Fig. 2. Mesh and boundary condition for the a) interfacial free-edge joint (2074 elements, 2136 nodes) and b) interfacial crack-tip models (4500 elements, 4651 nodes)

Strojniški vestnik - Journal of Mechanical Engineering 57(2011)1, 40-46
43Comparison between Elastic-Perfectly-Plastic Interfacial Free-Edge and Crack Tip Singular Fields
Fig. 3. Contour plots showing results of a FE analysis for the elastic-perfectly-plastic upper region of an interfacial free-edge joint and crack tip bonded to a rigid elastic lower region; a) sxx for interfacial free-edge and interfacial crack tip (in MPa), b) syy for interfacial free-edge and interfacial crack tip (in
MPa), c) sxy for interfacial free-edge and interfacial crack tip (in MPa), d) se for interfacial free-edge and interfacial crack tip (in MPa)
four-noded linear elements until satisfactory convergent results were obtained. The boundary conditions were defined as applied displacements
corresponding to the elastic solution for the model radius R = 5 mm, and a perfect bond to the rigid substrate was defined, Fig. 2.

Strojniški vestnik - Journal of Mechanical Engineering 57(2011)1, 40-46
44 Marsavina, L. - Nurse, A.D.
The results of the FE analysis for interfacial free-edge joint and crack tip under SSY elastic-perfectly-plastic conditions are shown in Fig. 3 as contour plots for the region -10-5 ≤ r/rp ≤ 10-3 where rp is the maximum extent of the plastic zone defined by σe = σo. The results for the Cartesian stress components σij, and for the equivalent stress σe are plotted using the same scale for interfacial free-edge joint and crack tip.
Fig. 4a shows the angular variation of the polar components of stress for the interfacial free-edge joint. Nodal values of the polar components of stress from the FE analysis are plotted as symbols for the radius log(r/rp) = -2. The results are normalised so that the maximum value of the equivalent stress σe in the angular variation is unity, i.e.:
1/2(0) (0)~ ~
max
1.5 1ij ijS S
=
. (5)
The fourth-order Runge-Kutta solution to the angular variations satisfying (3) and the imposed boundary conditions has been superimposed onto the FE results to enable them to be validated, [9]. In all cases of the polar components of stress, the agreement between the asymptotic solution and the FE results is excellent.
The rigid-slip-line field solution for the interfacial free-edge may be characterised using the notation of Zywicz and Parks [4]. The three inelastic crack-tip sectors admissible are the
centred fan, constant-state sector, and the quasi-constant-state sector [4]. Elastic crack-tip sectors are also admissible and asymptotically they behave as semi-infinite elastic wedges loaded by constant surface tractions. The solution for the plastic slip-line field was determined and is shown in Fig. 4b. A quasi-constant-state sector exists at the interface followed by comparatively large angular distributions of centred fan and constant state. A characteristic of the centred fan region is a singularity in the shear strain and the order was found to be approximately –0.8 (c.f. –1 for the crack).
3 COMPARISON BETWEEN INTERFACIAL FREE-EDgE JOINT AND CRACK TIP
ASYMPTOTIC FIELDS
Figs. 5a and b show the normalised solutions for the polar and deviatoric stress components for the two geometries assuming purely elastic behaviour. Asymptotic solutions assuming elastic perfectly-plastic behaviour that satisfy (3), were produced for both geometries under remote Mode I loading. It was considered here that there may be some similarity between the inelastic behaviour at the interfacial free-edge joint and the Mode I interfacial crack since the latter case includes an elastic sector between 90°≤θ≤180°, [4]. That is, both are inelastic between 0°≤θ≤90° and the plasticity is confined to the same quarter. The normalised results for
Fig. 4. Rigid-slip-line field solution at an interfacial free-edge singularity for an elastic-perfectly-plastic upper region bonded to a rigid elastic substrate; a) the angular variation of the polar components of
stress for the interfacial free-egde joint; b) the solution for the plastic slip-line field
(0)rθs (0)
θθs
(0)rrs
θ [degrees]
ssij
e
( )
max
0

Strojniški vestnik - Journal of Mechanical Engineering 57(2011)1, 40-46
45Comparison between Elastic-Perfectly-Plastic Interfacial Free-Edge and Crack Tip Singular Fields
Legend:
n - (0)θθs , - (0)
rrs , p - (0)rθs for interfacial free-edge -
(0)~
rrS , p -(0)~
rS θ for interfacial free-edge
£ - (0)θθs , - (0)
rrs , r - (0)rθs for interfacial crack tip -
(0)~
rrS , r -(0)~
rS θ for interfacial crack tip
Fig. 5. Comparison of the asymptotic normalised plane-strain stress components for the interfacial free-edge and crack-tip under elastic-perfectly-plastic slip conditions; a) polar elastic stress components, b)
deviatoric elastic stress components, c) polar perfectly-plastic stress components, d) deviatoric perfectly-plastic stress components
the polar components of stress for the interfacial crack and those for the free-edge joint are shown together in Fig. 5c to enable comparisons to be made. The “elastic sector” indicated is the solution for a 90° elastic wedge and not those of Eq. (3).
For the elastic solutions, there is some similarity between the forms of the polar components of stress for the two geometries between 0° and 90°. The deviatoric stresses demonstrate, however, that there are still some major differences between the two geometries; it should also be emphasised that the singularity orders are –0.28 and –0.5 for the interfacial free-edge joint and crack tip, respectively. Under perfectly-plastic behaviour, instead, the singularity orders are –0.8 and –1 for shear strain for the interfacial free-edge joint and crack tip, respectively. There is no singularity for the
stresses in both cases. The resulting distributions for the polar components of stress shown in Fig. 5c compare very favourably in form. A more obvious similarity is obtained when the deviatoric stresses are plotted as in Fig. 5d. Here, the two sets of curves cannot be distinguished for the region 0°≤θ≤45°. It may be surmised that upon development of an interfacial crack from an interfacial free-edge joint the asymptotic deviatoric stress field does not have to change in the region 0°≤θ≤45° for an elastic-perfectly-plastic material. In other words, upon attaining yielding stress levels a ‘pseudo’ crack-tip will exist at the interfacial free-edge that has the same asymptotic field for the deviatoric stresses as for the interfacial crack. The close similarity ends at θ = 45° where the slip-line sectors for the joint undergo a transition from centered fan to constant

Strojniški vestnik - Journal of Mechanical Engineering 57(2011)1, 40-46
46 Marsavina, L. - Nurse, A.D.
state whereas for the crack this takes place at about 60°.
4 CONCLUSIONS
The plastic-slip-line field has been sectorally assembled for elastic-perfectly–plastic behaviour at the interfacial free-edge joint. This is found to be in agreement with a Mode I solution for the interfacial crack. In comparing stress field solutions for the interfacial free-edge joint with that of the crack, involving an elastic sector between 90°≤θ≤180°, it is seen that the normalised deviatoric stress field is indistinguishable between the two geometries for the region 0°≤θ≤45°. Consequently, it would appear that the asymptotic deviatoric stress field that drives many forms of crack propagation does not need to change structure upon initiation of an interfacial crack at the free-edge joint.
5 ACKNOWLEDgEMENTS
Financial support from the European Commision trough programm FP7-PEOPLE-ERg-2007 under grant agreement no. 230991 is gratefully acknowledged.
6 REFERENCES
[1] Klingbeil, N.W., Beuth, J.L. (2000). On the design of debonding - resistant Bimaterials. Part I: Free-edge singularity approach. Engng. Fract. Mech., vol. 66, p. 93-110.
[2] Akisanya, A.R., Fleck, N.A. (1997). Interfacial cracking from the free-edge of a long bi-material strip. Int. J. Solids Structures, vol. 34, p. 1645-1665.
[3] Sharma, S.M., Aravas, N. (1991). Determination of higher order terms in asymptotic elastoplastic crack tip solutions. J. Mech. Phys. Solids, vol. 39, p. 1043-1072.
[4] Zywicz, E., Parks, D.M. (1992). Small-scale yielding interfacial crack-tip fields. J. Mech. Phys. Solids, vol. 40, p. 511-536.
[5] Bogy, D.B. (1971). Two edge-bonded elastic wedges of different materials and wedge angles under surface traction. J. Appl. Mechs., vol. 38, p. 377-386.
[6] Rice, J.R., Rosengren, g.R. (1968). Plane strain deformation near a crack tip in a power - law hardening material. J. Mech. Phys. Solids, vol. 16, p. 1-12.
[7] Hutchinson, J.W. (1968). Singular behaviour at the end of a tensile crack in a hardening material. J. Mech. Phys. Solids, vol. 16, p. 13-31.
[8] Marsavina, L., Nurse, A.D. (2007). The asymptotic structure of small-scale yielding interfacial free-edge joint and crack-tip fields. Acta Mechanica, vol. 190, p. 115-131.
[9] Marsavina, L., Nurse, A.D. (2003). Similarities between small-scale yielding interfacial free-edge joint and crack-tip fields. Facta Universitatis, vol. 3, no. 13, p. 623-634.

Strojniški vestnik - Journal of Mechanical Engineering 57(2011)1, 47-54 Paper received: 28.04.2010DOI:10.5545/sv-jme.2010.093 Paper accepted: 26.10.2010
*Corr. Author’s Address: Poznan University of Technology, Piotrowo 3, 60-965 Poznan, Poland, [email protected] 47
Shaping of Face Toothing in Flat Spiroid GearsStaniek, R.
Roman StaniekPoznan University of Technology, Poland
The paper deals with the theoretical basics of forming the face toothings in flat wheels of spiroid gears by means of a single cutting edge tool, using NC machine tools. Based on kinematics - geometrical formulas, geometrical models of creating the tooth spaces, as well as a determination of the modification depth along the tooth line, are described. Equations of the tooth line have been calculated as well as mathematical formulas enabling the determination of the modification depth, assuming the correct matching of the worm with the flat wheel of the spiroid gear. Based on geometrical models and mathematical formulas algorithms were elaborated in order to determine the envelope condition and modification depth of the tooth line. Then, on the basis of algorithms, computer programs that are going to be used to design the flat spiroid gears and to calculate their geometrical dimensions were proposed. The modification depth along the tooth line was also illustrated. The simulation results have been illustrated by the gear example. Finally, two methods of machining the face toothings in spiroid gears with a single edge-cutting tool are presented: accurate and approximate ones. Based on algorithms and programs, a comparative simulation of both methods was elaborated.©2011 Journal of Mechanical Engineering. All rights reserved. Keywords: NC rotary tables, flat spiroid gears, forming of toothings, modification, simulation
0 INTRODUCTION
Spiroid gears, especially their flat variety, are often applied in rotary tables as mechanical reduction gears [1], [3] to [6] and [11]. This increased application can be observed in a new generation of NC gear cutting machine tools [6], [11] and [12].
In a flat spiroid gear, a worm engages the wheel with face toothing. The tooth line depends on the worm direction (right hand or left hand worm) and the direction of inclination in the wheel (right hand or left hand direction) and it is a modified involute line: ● a shortened involute line in case of
conformable directions,● anelongatedinvolutelineincaseofopposite
directions.It has been assumed that the worm profile
in axial section is a straight line which enables the application of the same cutting edge (cutting insert) to machine the worm and the flat wheel [7].
The face toothing of the flat spiroid gear should be formed with a tool of the profile and dimensions of the engaging worm. Such a tool, formed as a hob, is very expensive and has to be prepared for each individually designed worm [2], [9] and [12].
A much cheaper solution is a single edge cutting tool in the form of an insert made of sintered carbides with a profile equivalent to the worm tooth profile. The profile conformity should occur only in the range of the convolution intersection of the worm and the face toothing wheel. The same simple insert made of sintered carbides may be used to form both the worm and the wheel. Based on such an assumption, it is not necessary to define a pitch as the unit describing the measure of the tooth profile [7] and [12].
1 TOOTH LINE EQUATION
The tooth line equation in the face section provided at the distance h0 from the tool axis (see Fig. 1) was obtained in the following way:● in a fixed coordinate system (x, y) with an
origin located in the rotary table axis a parametric equation of the cutting edge track (spindle rotation angle φ is treated as the parameter) was determined,
● theequationof this trackwasdetermined ina polar coordinate system (Ry,Φ) assuming as the origin the middle of the wheel (rotary table axis) and a line connecting the middle of the cutting edge profile with the table axis in the initial position of the tool (x0 = 0; φ = 0),

Strojniški vestnik - Journal of Mechanical Engineering 57(2011)1, 47-54
48 Staniek, R.
● by a variation of the x0 two-parametric family of cutting edge tracks were obtained and then the searched tooth line was determined as the envelope of the two-parametric family curves.
The track of the cutting tool edge in the rectangular coordinate system (x, y) with an origin in the middle of the rotary table may be described with the following parametric equations (Fig. 1):
x x r h
y a h
= + −
⋅
= − ⋅
0 00
0 0
costg
tgφ
α
φ. (1)
The equation of the other side track is obtained by applying a negative value of the profileangleα.
In a polar coordinate system (Ry, Φ) (see Fig. 2), the set of equations can be obtained in the form:
R x y
xykz
xR
y
w
= +
= + ⋅ −
2 2
0Φ arc tg φ. (2)
Fig. 1. Geometrical model of forming the tooth space in a fixed coordinate system (x, y)
The second equation concerning the Φ value is composed of factors describing the place of the origin. The directions of the worm and the involute tooth line in the wheel are considered by coefficient k:● k = +1 for conformable directions (a shortened
involute is obtained),
● k = –1 for opposite directions (an elongated involute is obtained).
The variation of the parameter x0 in the equation set (2) creates the family of curves for those the envelope has to fulfil the condition:
∂
∂∂∂
∂
∂∂∂
=
R
Rx x
y
y
φ φΦ
Φ
0 0
0 . (3)
Fig. 2. Geometrical model of forming the tooth spaces in a coordination system of a machined
wheel
Partial derivatives that are necessary to calculate the determinant (3) can be obtained from Eqs. (1) and (2):
∂
∂= ⋅
∂∂
⋅ +∂∂
⋅
∂∂
= ⋅∂∂
⋅ +∂∂
⋅
RR
x x y y
Rx y y x
y
y
y
φ φ φ
φ φ φ
1
12
Φ++
∂
∂=
∂∂
= −
kz
Rx
xR x
yR R
y
y y w0 02
1; Φ
(4)
∂∂
=⋅ ⋅
∂∂
=
x h
y hφ
α φφ
φ φ
02
02
tg sincos
cos
. (5)
After substitution Eqs. (4) and (5) into the determinant (3) it is possible to obtain the envelope condition:
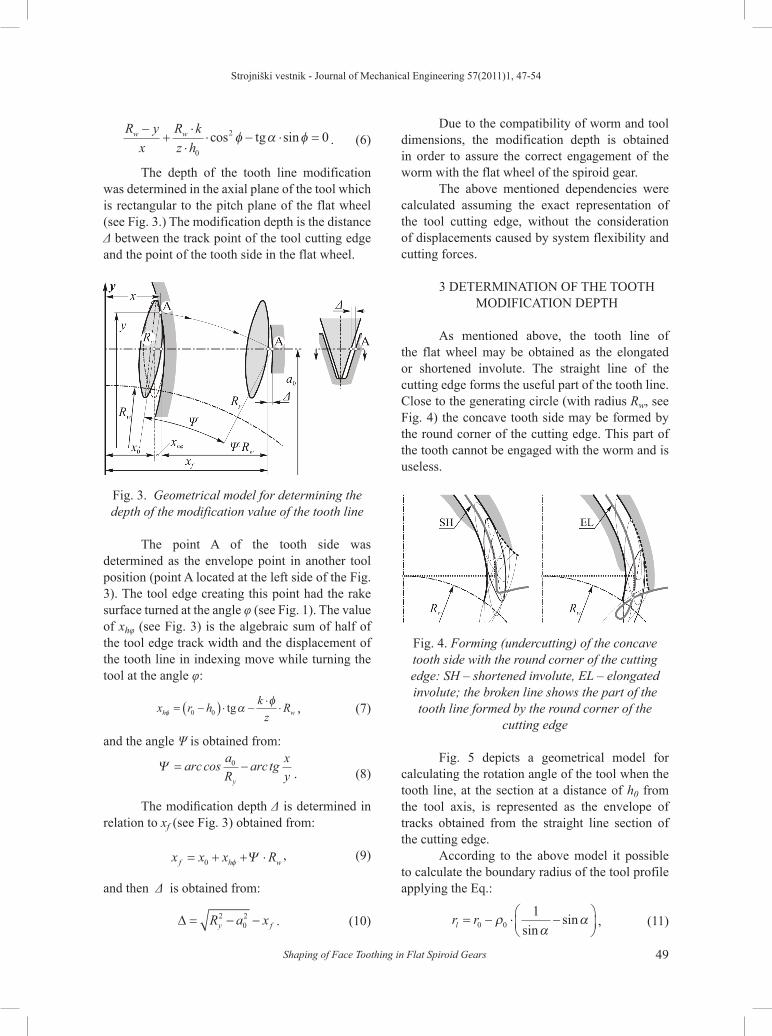
Strojniški vestnik - Journal of Mechanical Engineering 57(2011)1, 47-54
49Shaping of Face Toothing in Flat Spiroid Gears
Due to the compatibility of worm and tool dimensions, the modification depth is obtained in order to assure the correct engagement of the worm with the flat wheel of the spiroid gear.
The above mentioned dependencies were calculated assuming the exact representation of the tool cutting edge, without the consideration of displacements caused by system flexibility and cutting forces.
3 DETERMINATION OF THE TOOTH MODIFICATION DEPTH
As mentioned above, the tooth line of the flat wheel may be obtained as the elongated or shortened involute. The straight line of the cutting edge forms the useful part of the tooth line. Close to the generating circle (with radius Rw, see Fig. 4) the concave tooth side may be formed by the round corner of the cutting edge. This part of the tooth cannot be engaged with the worm and is useless.
Fig. 4. Forming (undercutting) of the concave tooth side with the round corner of the cutting edge: SH – shortened involute, EL – elongated involute; the broken line shows the part of the tooth line formed by the round corner of the
cutting edge
Fig. 5 depicts a geometrical model for calculating the rotation angle of the tool when the tooth line, at the section at a distance of h0 from the tool axis, is represented as the envelope of tracks obtained from the straight line section of the cutting edge.
According to the above model it possible to calculate the boundary radius of the tool profile applying the Eq.:
r rl = − ⋅ −
0 0
1ρ
αα
sinsin , (11)
R yx
R kz h
w w−+
⋅⋅
⋅ − ⋅ =0
2 0cos tg sinφ α φ . (6)
The depth of the tooth line modification was determined in the axial plane of the tool which is rectangular to the pitch plane of the flat wheel (see Fig. 3.) The modification depth is the distance Δ between the track point of the tool cutting edge and the point of the tooth side in the flat wheel.
Fig. 3. Geometrical model for determining the depth of the modification value of the tooth line
The point A of the tooth side was determined as the envelope point in another tool position (point A located at the left side of the Fig. 3). The tool edge creating this point had the rake surface turned at the angle φ (see Fig. 1). The value of xhφ (see Fig. 3) is the algebraic sum of half of the tool edge track width and the displacement of the tooth line in indexing move while turning the tool at the angle φ:
x r h kz
Rh wφ αφ
= −( ) ⋅ −⋅⋅0 0 tg , (7)
and the angle Ψ is obtained from:
Ψ = −arc cos arc tgaR
xyy
0
. (8)
ThemodificationdepthΔ is determined in relation to xf (see Fig. 3) obtained from:
x x x Rf h w= + + ⋅0 φ Ψ , (9)
and then Δ is obtained from:
∆ = − −R a xy f2
02 . (10)

Strojniški vestnik - Journal of Mechanical Engineering 57(2011)1, 47-54
50 Staniek, R.
and the boundary angle of tool rotation, applying the equation:
φll
hr
= arccos 0 . (12)
Fig. 5. Geometrical model for calculation of the boundary angle of the rotating tool that forms
the tooth side surface with the straight line of the cutting edge
In the program for calculating the depth modification of the tooth line the following assumptions have been considered:● tooth line is formed as the envelope of
the cutting edge tracks when the envelope condition is fulfilled for the angle φ from the range – φl ≤ φ ≤ + φl,
● toothlineisrepresentedbypointPofthetoolprofile when the condition of the envelope of the cutting edge tracks would demand elongation of the straight part of the cutting edge over point P; in such case it has been assumed that φ = φl , and the representation of the round corner cutting edge was not calculated, as this part of the tooth side is not engaged with the worm.
An algorithm of obtaining the depth modification needs multiple calculations of the envelope condition. The angle φ, when the envelope condition is fulfilled (this means W = 0), is obtained by applying the iterative method. This part of the program was treated as a separate procedure (see Fig. 6).
The tooth line modification depth Δ was calculated in the face cross-section at distance h0 when the middle point of the cutting edge profile was located at the distance x0 from the wheel axis (see Figs. 2 and 3). The algorithm for calculating the modification depth is presented in Fig. 7.
Fig. 6. Algorithm for calculating the envelope condition
Fig. 7. Algorithm for calculating the modification depth for the tooth line of the flat wheel in the
spiroid gear
By applying the positive value of the profile angle α for the concave side and the negative value for the convex side, it is possible to obtain the modification depth value for both tooth sides.
The proper value of the tool rotation angle φ was calculated by means of the iterative method when the envelope condition (see Eq. 6) was fulfilled. The following values of the angle

Strojniški vestnik - Journal of Mechanical Engineering 57(2011)1, 47-54
51Shaping of Face Toothing in Flat Spiroid Gears
φ were determined by means of Newton’s secant method. In the first part of the algorithm (see Fig. 7) the iterative coefficient was determined. This coefficient is obtained as the quotient of angle φ increment and the increment of the polynomial value W (left side of Eq. 6) which is calculated in the neighbourhood of the zero value for W.
The range of angle φ (–φl, +φl ) was divided into 16 parts. For the following values of φ the W value was calculated and the antecedent value was marked as W0. The indicator showing the existence of the zero value in the investigated sub-range is the negative quotient W0/W. The method of calculating the value of the angle φ which fulfils the envelope condition is presented in the second part of the algorithm.
In case the tooth line is formed by the round corner of the cutting edge, it was assumed that the tooth line is the representation boundary point P tracks of the straight line cutting edge (see Fig. 5). In this case the boundary angle φ = φl (positive or negative).
Fig. 8. Algorithm for calculating the tooth line modification depth of the flat wheel as the function of the nominal point distance line from
the toothing axis
The graphical or numerical presentation of calculation results as the function Δ(xf) is much easier when xf is treated as an independent value. In order to do this, the calculations presented in Fig. 7 should be repeated in an additional loop by means of a simple iterative method. The algorithm of these calculations is presented in Fig. 8.
The range of the independent value Xf was obtained by taking into consideration the possible engagement of the worm with the flat wheel teeth. This range is approximately the distance between points of intersection the worm axis with internal cylinder (with radius Ri) and the external cylinder (with radius Re) of the flat wheel (see Fig. 9).
Fig. 9. The range of the independent value Xf
Based on the described algorithms a computer program was elaborated in order to calculate parameters of the flat spiroid gear and to illustrate tooth modification. Calculation results are presented in Fig. 10 with the gear applied in the rotary table FNd 320 s as an example.
The zero line of the modification depth (marked in Fig. 10 as “0”) is created where the cutting edge track is tangential to the point located on the tool (worm) axis projection line that is projected on the surface of the investigated face cross section. In this point the worm lead angle (on the co-axial cylinder with radius h0) is equal to the angle created by the normal to the tooth line with the projection of the worm (or tool) axis on the cross-section plane.
The distance Xf (Δ = 0) of the zero modification depth line from the toothing axis is determined by the dependency:
Xk a Rp
hfw∆ =( ) = ⋅ ⋅ ⋅ −( )⋅0
2 00
π . (13)
The modification depth of the concave tooth side is much greater than the convex tooth side, so Fig. 11 shows the modification distribution on the concave tooth side (magnification 25:1) for the spiroid gear and for the numerical example shown in Fig. 10. The nominal surface of the tooth side is shadowed.
The tooth side modification was determined as the difference between the worm tooth profile and the flat wheel in the worm axial plane that is rectangular to the pitch of the wheel. The modification depth of the convex tooth side surface is much smaller than the modification depth of the concave tooth side surface. The great values of modification occur close to the internal cylinder of the co-axial engagement. This is the

Strojniški vestnik - Journal of Mechanical Engineering 57(2011)1, 47-54
52 Staniek, R.
position where the tooth line curvature increases and gets closer to the curvature of the cutting edge track in the face cross section of the wheel. This phenomenon as well as a smaller inclination angle of the edge point tracks on the co-axial cylinder with a diameter greater than the pitch diameter makes it possible to obtain that part of the tooth side which was machined with the round cutting edge corner. This small part of the tooth side surface in the neighborhood of the bottom of the tooth is presented in Fig. 11 by the broken line. The computer program and the illustration presented in Fig. 10 facilitate finding the proper geometrical parameters of the spiroid gear and then creating an illustration of the modified tooth side. The program is a very effective tool for designing flat spiroid gears.
4 METHODS OF FORMING FACE TOOTHINGS IN THE FLAT SPIROID GEAR
WITH THE APPLICATION OF A SINGLE EDGE CUTTING TOOL
The method of forming the face toothing in a flat spiroid gear was elaborated by R. Grajdek [8]. The forming of large flat wheels with the single tool edge equivalent to the diameter of the mating worm needs an application of the long arbor with the cutting insert at the end of it. The rigidity of such a system is very small and therefore in the author’s investigations the face toothing was formed on an NC milling machine with the spindle axis inclined to the pitch plane of the wheel at an angle slightly smaller than the angle of the tooth profile. The diameter of the tool
Fig. 10. Illustration of the face toothing modification in the flat spiroid gear (dimension proportions are saved in the picture)
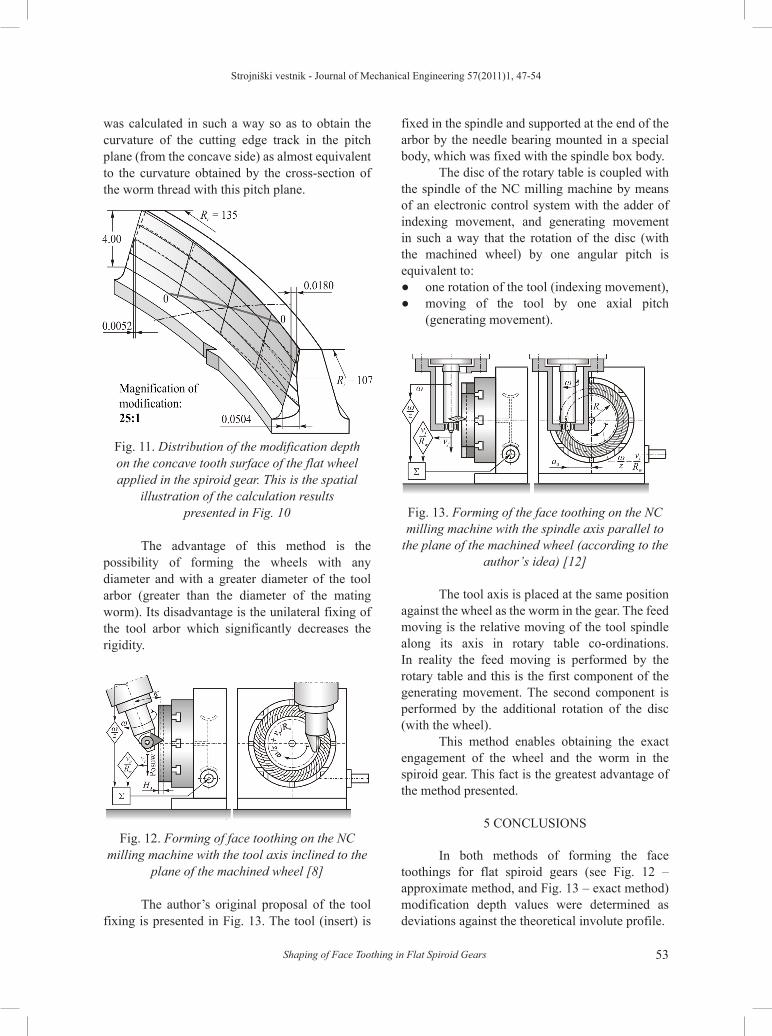
Strojniški vestnik - Journal of Mechanical Engineering 57(2011)1, 47-54
53Shaping of Face Toothing in Flat Spiroid Gears
was calculated in such a way so as to obtain the curvature of the cutting edge track in the pitch plane (from the concave side) as almost equivalent to the curvature obtained by the cross-section of the worm thread with this pitch plane.
Fig. 11. Distribution of the modification depth on the concave tooth surface of the flat wheel applied in the spiroid gear. This is the spatial
illustration of the calculation results presented in Fig. 10
The advantage of this method is the possibility of forming the wheels with any diameter and with a greater diameter of the tool arbor (greater than the diameter of the mating worm). Its disadvantage is the unilateral fixing of the tool arbor which significantly decreases the rigidity.
Fig. 12. Forming of face toothing on the NC milling machine with the tool axis inclined to the
plane of the machined wheel [8]
The author’s original proposal of the tool fixing is presented in Fig. 13. The tool (insert) is
fixed in the spindle and supported at the end of the arbor by the needle bearing mounted in a special body, which was fixed with the spindle box body.
The disc of the rotary table is coupled with the spindle of the NC milling machine by means of an electronic control system with the adder of indexing movement, and generating movement in such a way that the rotation of the disc (with the machined wheel) by one angular pitch is equivalent to:● onerotationofthetool(indexingmovement),● moving of the tool by one axial pitch
(generating movement).
Fig. 13. Forming of the face toothing on the NC milling machine with the spindle axis parallel to
the plane of the machined wheel (according to the author’s idea) [12]
The tool axis is placed at the same position against the wheel as the worm in the gear. The feed moving is the relative moving of the tool spindle along its axis in rotary table co-ordinations. In reality the feed moving is performed by the rotary table and this is the first component of the generating movement. The second component is performed by the additional rotation of the disc (with the wheel).
This method enables obtaining the exact engagement of the wheel and the worm in the spiroid gear. This fact is the greatest advantage of the method presented.
5 CONCLUSIONS
In both methods of forming the face toothings for flat spiroid gears (see Fig. 12 – approximate method, and Fig. 13 – exact method) modification depth values were determined as deviations against the theoretical involute profile.

Strojniški vestnik - Journal of Mechanical Engineering 57(2011)1, 47-54
54 Staniek, R.
whose tooth surfaces have a linear contact, Gearing and Transmissions, vol. 2, p. 24-31.
[2] Bolos, V., Bolos, C. (2002). Considerations concerning the roughness resulted from milling plan spiroid worm gears. Proc. of 4th International Conference DMC, Kosice, p. 247-249.
[3] Dudas, I. (1999). Optimization and manufacturing of the spiroid gearing. 4th World Congress Gearing and Power Transmission, Proceedings volume, Paris, p. 377-389.
[4] Dudas, I. (2000). The theory and practice of worm gear drives. Penton Press, London,
[5] Goldfarb, V.I. (1995). Theory of design and practise of development of spiroid gearing, Proc. of Congress: Gear Transmissions, p. 1-5.
[6] Grajdek, R. (2000). Modification of face toothing in a plane spiroid gear. Archives of Mechanical Technology and Automation, vol. 20, no 2, p. 89-97.
[7] Grajdek, R. (1996). The modified face toothing with arc line. Archives of Mechanical Technology and Automation, vol. 16, no 2, p. 73-83.
[8] Grajdek, R. (2000). The face toothings. Theoretical, principles of forming and new applications. Publishing House Poznan University of Technology, Poznan.
[9] Kirov, V. (1999). Design of spiroid hobs, Journal of Materials Processing Technology, vol. 88, no. 1, p. 208-215.
[10] Litvin, F.L., Nava, A., Fan, Q., Fuentes, A. (2002). New geometry of worm face gear drives with conical and cylindrical worms, Generation. Simulation of Meshing and Stress Analysis, U.S. ARMY ARL–CR 0511, NASA/CR–211895.
[11] Litvin, F.L., Petrov, K.M., Gansin, V.A. (1973). The effect of geometrical parameters of hypoid and spiroid gears on its quality characteristics. Mechanism and Machine Theory, vol. 8, no. 2, p. 187-196.
[12] Staniek, R. (2005). NC rotary tables. Theoretical basics, design, technology and investigations, no. 392, Publishing House Poznan University of Technology, Poznan.
Fig. 14. Deviations of the tooth line modification occurring by machining with the approximate
method with the inclined tool axis
Theoretically this aspect is correct. Considering the practical aspects, it seems reasonable to accept as a master profile the profile obtained by machining with the ideal worm by means of an exact method with the tool axis parallel to the wheel plane. It was assumed that in this case modification deviations of the tooth line profile are equal to zero and then the engagement with the real worm should be expected as errorless. Considering the above assumptions in order to evaluate the compatibility of the demanded tooth line and the obtained tooth line according to the method with the inclined tool axis, the proper deviations were calculated. The deviation values for both sides of the tooth concave and convex are presented in Fig. 14. Negative values prove a lack of contact between the worm and the wheel, but positive values demand the lapping process. Both methods were verified experimentally and implemented in the production [12].
6 REFERENCES
[1] Abadijev, V. (1994). Aspects of the mathematic modeling of skew-axes gears

Strojniški vestnik - Journal of Mechanical Engineering 57(2011)1,55-68 Paper received: 12.02.2010DOI:10.5545/sv-jme.2010.030 Paper accepted: 02.12.2010
*Corr. Author’s Address: University of Novi Sad, Faculty of Technical Sciences, Trg D. Obradovića 6, Novi Sad, Serbia, [email protected] 55
Analysis of Company Development Factors in Manufacturing and Service Company: a Strategic Approach
Borocki, J. - Cosic, I. - Lalic, B. - Maksimovic, R.Jelena Borocki* - Ilija Čosic - Bojan Lalic - Rado Maksimovic
University of Novi Sad, Faculty of Technical Sciences, Department of Industrial Engineering and Management, Serbia
Continuing company development requires the development of all segments (processes): technology development, organizational structure development, human resources development, investment development, etc. These factors cannot be analyzed irrespective of the external environment. The aim of the presented study was to give contribution to the efforts that are being made to analyze the differences between manufacturing and service companies regarding the selected development factors.
The original contributions of this paper are the analysis of correlations between the elements of a company development and some factors that give us information about the development of the external environment. In a research process modified SPACE analysis for defining strategic posture of the company was used. Basic SPACE analysis (Strategic Position and Action Evaluation – Rowe et al. 1994) is used for analyzing the competitive posture of the company. It consists from four basic dimensions for analyzing external and internal environment: environment stability, industry strength, financial and competitive strength of the company. Modified SPACE analysis is hierarchically structured and it consists of: great number of factors and/or indicators (in order to use analysis in both manufacturing and service companies) assessed through Likert scales in a significance and value domain; assessment of synergy effects of factors and a selection of critical ones; simulation of possible future strategic posture, together with the modification of the values of selected critical factors that could have an impact on the future development of the company. ©2011 Journal of Mechanical Engineering. All rights reserved. Keywords: strategy posture, manufacturing companies, service companies, correlations, t-test
0 INTRODUCTION
Any qualitative expansion, improvement, and innovation of production, services, structure and technology including a quantitative increase of operation volume (expressed through, for example, sales volume, market share, and company profitability [1]) is a new stage in company development. Continuing company development does not require the development only in terms of new products/services, but also the development of all company segments (processes): technology development, organizational structure development, human resources development, and investment development. It is possible to assume that unequal development level of any of these processes may not ensure company development continuity as a whole regardless of investments, time, and other resources spent for the development of new products/services. It is, therefore, necessary
to ensure an integral development process of all processes in a company.
The development of any company, regardless of whether it deals in manufacture or services, requires the company to make a completely new combination of resources and/or to define completely new (visionary) goals. If a company wants to reach these goals, it has to create an appropriate strategy which has to bring a better competitive position of the company and its better strategic posture in the near future. The key moment of any company’s strengths lies within essential and sustainable development. Modern companies require constant investment into development [2].
From a short-term perspective, companies are more interested in growth than in development. However, it is necessary that a company is effective and efficient both in the short- and long-term [3]. Any neglect of the long-term orientation may result in the company’s defense strategic

Strojniški vestnik - Journal of Mechanical Engineering 57(2011)1, 55-68
56 Borocki, J. - Cosic, I. - Lalic, B. - Maksimovic, R.
posture which is only a temporary solution of some critical situation in which the company is found and which must not last for a long time. However, most of the manufacturing companies still assume that product development is enough for company competitiveness. Product development cycle is not a linear one. It is connected with many other functions: marketing, design, process planning, resource planning, etc. Production planning task cannot easily be classified into particular functions and these tasks lead toward integration between these functions [4] and [5].
With regard to the significance of innovations for company development, changes are crucial in implementing the innovation activities as well as in the acceptance of certain (higher) development level. The higher the resistances to the changes in the company are, the lower are the changes and company willingness to initiate the innovation process. Problems of accepting innovation activities requiring the making a good decision and their efficient implementation definitely occur. Changes in the sphere of operation (regardless of the fact whether these are developed countries or countries in transition) are developing faster, where technology development and huge competition having effect at the global level, regardless of physical distance, are the predominant factors. Besides political, ecological, and other conditions for survival, growth and development of any company is important for making adequate strategic decisions whose timeframe is increasingly getting shorter. The prerequisite for making strategic decisions is the knowledge of adequate strategic posture of the company as well as the factors which may be impacted on in order to improve that position, and prepare the company for the next development stage.
How the company will accept and respond to the changes, and how it will create its competitive strategy depends on the quality of the participants in the relevant operating processes. The strategic posture of the company determines the manner in which the company will mobilize its advantages within the market competition and how it will define its competitive advantage [6] and [7]. Therefore, it is very important to know the type of the strategic posture (for example, by implementing the modified strategic planning
model – SPACE analysis), and also dynamically monitor the key factors which may impact not only the change of the strategic posture, but also the quality of the development processes at the company, company innovation level, and/or its competitiveness. Modified SPACE analysis includes 81 factors and indicators in order to asses company’s current strategic position; it is hierarchically structured and gives company a possibility to monitor every critical factors, make a simulation of a possible future strategic posture, as well as to create a more detailed strategic plan of a future development. Managers are expected to formulate strategies in accordance with the relevant information about the environment [8]. How managers perceive the environment will also reflect in their actions and innovative strategy they choose to pursue. It is important that firms recognize environmental changes and adapt accordingly [9]. Technological and market turbulence are those two moderating effects that influence new product development strategy planning [10]. Thus, it is very important to define business strategy which will in turn lead the company to a higher development level. The strategic role of the production process in creating a business strategy in the company, is becoming so important that we can state that the competitiveness of the company depends on its production characteristics [11].
Many authors have recently stressed that the traditional boundaries between manufacturing and services are becoming obsolete [12] and [13]. Authors have noted that there are new forms of production for supplying physical products together with intangible services [12]. In business life, traditional manufacturing companies have increased their maintenance and other services for the whole lifecycles of their products, while service firms tend to compete with tangible products like “productized” software as well [14]. Some authors claim that there are some differences in service and manufacturing firms in the development of products and services. In addition, there are differences inside the service sector between different types of services as well [15]. This paper deals with the study of the differences between the manufacturing and service companies on the selected geographic area, in view of the level of the development of company processes

Strojniški vestnik - Journal of Mechanical Engineering 57(2011)1, 55-68
57Analysis of Company Development Factors in Manufacturing and Service Company: a Strategic Approach
In order to overcome these limitations of the original model, we made some modifications which are achieved in the following areas [19]:1) A standardization of concepts from strategic
management and coordination of all financial terms, according to conditions in selected geographical area has been accomplished.
2) Model is hierarchically structured. 3) After determining the company strategic
posture, through applied model, if the gap between the current and desirable posture still exists, a group of factors on which a company has some influence to change them - to improve their values, can be defined.
4) The process of assessment level of influence on the changing factor values from most the significant area for internal dimensions of the company; determine direction and intensity of the resulted vector for changed values and maximal values of every factor from the significant area.
1.2 Research
The research covered 126 companies from Serbia, Bosnia & Herzegovina and Monte-negro. With the aim of having as representative a sample as possible, the compa nies differ ent in their size, legal form of organization, economic sec tor, location, activity, and ownership have been selected. The research of the strategic commitment of the selected companies was made in line with the expanded and modified SPACE questionnaire [20] to evaluate the company’s strategic position. Since the questionnaire covers 80 hierarchical structural factors and/or indicators which are indi vidually evaluated in terms of their level of importance and value for the respondents (for the selected main product/service, target customer, and geographic area), which include various operation areas, it was necessary to complete the questionnaire by several employees from various areas – functional units of the company whose competences, knowledge, and experience in certain fields were used to get as objective an evaluation as possible i.e. significance of a factor and/or indicator from the questionnaire. The survey was conducted for three years on the selected territory. In the final sample of the entities, after the exclusion of the companies
measured through the key company development factors, by applying modified SPACE analysis. The identified similarities and differences result from the implemented research.
Starting from the premise that environment change is a strong driver for organization innovation [16] and for its development, this paper intends to research the relationship between some external development factors and internal (company) development factors. The objective of this study is to examine relationships between the selected factors of internal process development and some factors of external environment development. Some of the selected factors are very important for company innovativeness.
1 METHOD
1.1 Instruments
SPACE analysis is used to determine appropriate strategic posture of the company or any of its parts (profit centre). However, the existing model [17] and [18] has got certain restrictions: insufficiently developed operationalization; availability of the information necessary for
the strategic posture model; variation: there are no guidelines for further
activity when the company’s strategic posture is once determined (how current posture impacts further development, what opportunities change, etc.).
If the difficulties characteristic of the conditions of the operation in the areas subject to the study are added, like: a lack of understanding of the needs and principles of using the developed methods and techniques of the strategic management, noticeable lag in the development of the external environment which may, to a high extent, impact the level of the company development, a lack of clearly defined development policies, etc., the problem is even more significant and requires finding a method for eliminating these failures and, above all, for ensuring the basis for facilitated, more accurately, and continuing the application of a certain model as a basic simpler formulation and monitoring of the key factors of further company development.

Strojniški vestnik - Journal of Mechanical Engineering 57(2011)1, 55-68
58 Borocki, J. - Cosic, I. - Lalic, B. - Maksimovic, R.
and factors with more than 5% of the missing answers, 116 companies were kept in the further analysis. The presentation of the sample structure regarding the type of the company (manufacturing or service) is given in Table 1. Percentages of research example regarding the legal form of the company are given in Fig. 1.
Table 1. Frequency – type of company
No. of the companies Percent
Manufacturing 47 40.5Service 69 59.5Total 116 100.0
1.3 Selecting Factors for Research
The company development certainly depends on a high number of the factors: their selection, assessment of impact to their change with the aim of achieving much higher level of
their value, is the starting basis for planning the company’s development. Indeed, these factors should be the starting basis of defining the future development goals planning and strategy development – therefore, it is very important that the starting basis, initial evaluation of values and significance of all factors in the company standing analysis, is valid. Of course, not every goal requires the strategy development – there are certain prerequisites for the goal to be of strategic significance for the company (visible income increase, high additional costs for goal achievement, longer term of the goal realization, high risk of achieving the goal, and the need to engage more than 30% of additional employees).
In the course of the selection of the development factors which are additionally studied in this paper, we were guided by the requirement that all factors are included in the standard set of the indicators of the modified SPACE analysis and that the company may achieve certain impact
Table 2. Results of t-test
Development factor Levene F P t df pLMean (prod.)
Mean (services)
Market share .180 .672 -.188 114 .851 2.9149 2.9478Product/service quality 5.395 .022 *2.320 114 .022 3.6064 3.3087
Average product/service life cycle stages .038 .846 1.363 109 .176 2.6778 2.4212Completeness of production programme/
service programme 2.916 .090 1.279 113 .204 3.0543 2.8420
Uniqueness (originality) of products/services 1.775 .185 1.536 114 .127 3.0000 2.6826Capability of introducing new products/
services .358 .551 .801 114 .425 3.1277 2.9783
Available know-how .967 .327 1.876 114 .063 3.3191 2.9942Use of capacities in relation to major
competitors .641 .425 .683 114 .496 3.0213 2.8986
Product/service development .015 .903 .708 113 .480 3.0745 2.9426Operation technology development 2.757 .100 2.254 113 .026 3.2660 2.8529
Human resources development 1.605 .208 1.476 114 .143 3.3936 3.1449Harmonization of org. structure with changes
in the environment/company 7.883 .006 1.590 114 .115 3.0426 2.7725
Timely taking of corrective actions .139 .710 -.586 113 .559 3.1383 3.2250Flexibility in relation to client requirements .780 .379 .589 114 .557 3.3830 3.3014
Return of investments .537 .465 .929 114 .355 3.2447 3.0942Level of cash inflow in terms of self-finance .272 .603 .313 114 .755 3.0638 3.0058
Placement of interim cash surpluses .219 .641 -.594 114 .554 2.2766 2.4130Legende:Levene F - the value of the Levene test statistic, used to test an assumption of equal variances is valid P – level of significance t – t-value (* t-test for non-homogenous variances)df – degrees of freedom pL – Leven’s level of significanceMean (prod.) - arithmetic mean for manufacturing companies Mean (services) - arithmetic mean for service companies

Strojniški vestnik - Journal of Mechanical Engineering 57(2011)1, 55-68
59Analysis of Company Development Factors in Manufacturing and Service Company: a Strategic Approach
to their change. The selected factors exclusively describe the company’s process development and they could be classified in a four specific company transformation processes: client’s relationships, employees, the system of transformations (processes) and finance.
Fig. 1. Sample structure (legal form of the company)
The internal factors show such impact on the company operation and development
so that they may be controlled only by the company, under the condition that it has got a well structured organization with clearly defined key characteristics and well developed human resources.
2 RESULTS
Each factor of the modified SPACE analysis is assessed in view of its significance and values (during the team work, using Likert scale in specially defined questionnaire). We used t-test as the most common used method to evaluate differences in means between two groups: manufacturing and service companies. The purpose of the Levenes Test is to test and verify that this equal variance assumption is reasonable.
T-tests for independent samples determine the statistic significance of the difference of the average assessments of the selected factors
Table 3. Matrix of intercorrelations of the selected development factors in the scales of the modified SPACE analysis within the group of manufacturing companies (number of the companies = 47) (significance domain)
Development factor
Rate of economic growth in the
country
Technology level in industrial
segment
Innovation rate in industrial
segmentr p r p r p
Market share .011 .943 -.001 .997 .191 .198Product/service quality .047 .751 .255 .087 .244 .099
Average product/service life cycle stages .051 .737 .120 .438 .127 .407Completeness of production programme/service
programme .250 .094 .066 .668 .037 .809
Uniqueness (originality) of products/services .192 .197 .230 .125 .029 .847Capability of introducing new products/services .119 .425 .152 .312 .166 .265
Available know-how .258 .080 .201 .181 .248 .093Use of capacities in relation to major competitors .009 .953 .254 .089 .138 .355
Product/service development .231 .119 .259 .083 .301 .040Operation technology development .146 .326 .269 .071 .215 .147
Human resources development -.048 .750 .075 .623 .273 .064Harmonization of organizational structure with
changes in the environment/company .257 .081 -.067 .658 .227 .125
Timely taking of corrective actions -.046 .759 -.108 .476 .273 .064Flexibility in relation to client requirements .113 .448 -.123 .415 .369 .011
Return of investments -.164 .270 .167 .267 .145 .330Level of cash inflow in terms of self-finance -.006 .969 -.120 .426 .115 .442
Placement of interim cash surpluses .059 .694 .129 .393 .036 .810Rate of economic growth in the country 1 .101 .503 .152 .308Technology level in industrial segment .101 .503 1 .151 .317
Innovation rate in industrial segment .152 .308 .151 .317 1 Legende: r – Pearson’s coefficient of correlation p – Level of significance

Strojniški vestnik - Journal of Mechanical Engineering 57(2011)1, 55-68
60 Borocki, J. - Cosic, I. - Lalic, B. - Maksimovic, R.
(within the significance domain) between the manufacturing and service companies. In the course of analysis, the grouping (independent) variable included the activity (manufacturing/service) while the set of the variables included the scores at the selected development factors. It is presented in Table 2.
Statistically significant difference between the manufacturing and service companies in terms of the significance of development factors is obtained only for the factors Product/service quality and Operation technology development.
T-tests are significant at the level of p < 0.05. Based on the values of arithmetic means of these factors, it may be seen that the manufacturing companies place a higher significance to these factors.
2.1 Relations of Significance of the Selected Factors of Company Development and Selected Factors of External Environment Development on the Sub-samples of Manufacturing and Service Companies
This relation was specifically checked using Pearson’s linear correlation coefficient on the sub-sample of the manufacturing and the sub-sample of service companies.
The results show that there is certain correlation degree of low intensity in the sample of the manufacturing companies between the factors: Product/service development and Innovation rate in industrial segment, i.e. the factor: Flexibility in relation to client requirements and Innovation rate in industrial segment. It is obvious that the rate of innovation in the commercial segment is significant for the stating of the significance of the above factors. Manufacturing companies state that the higher the Innovation rate in industrial/commercial
Table 4. Matrix of intercorrelations of the selected development factors in the scales of the modified SPACE analysis within the group of service companies (number of the companies = 69) (significance domain)
Development factor
Rate of economic growth in the
country
Technology level in industrial
segment
Innovation rate in industrial segment
r p r p r pMarket share .012 .924 .316 .008 .342 .004
Product/service quality .028 .821 .251 .037 .188 .123Average product/service life cycle stages .033 .794 .160 .199 .189 .128
Completeness of production/service programme .002 .987 .168 .169 .201 .098Uniqueness (originality) of products/services .059 .631 .151 .216 .291 .015
Capability of introducing new products/services -.112 .360 .265 .028 .344 .004Available know-how .190 .117 .362 .002 .454 .000
Use of capacities in relation to major competitors .085 .488 .300 .012 .492 .000Product/service development .118 .337 .319 .008 .391 .001
Operation technology development .065 .599 .323 .007 .432 .000Human resources development .040 .745 .249 .039 .288 .017
Harmonization of organizational structure with changes in the environment/company .139 .254 .177 .147 .142 .243
Timely taking of corrective actions .156 .203 .066 .595 .132 .283Flexibility in relation to client requirements .014 .906 -.055 .651 .168 .168
Return of investments .238 .049 .130 .286 .252 .037Level of cash inflow in terms of self-finance .081 .507 .280 .020 .374 .002
Placement of interim cash surpluses .096 .431 .312 .009 .191 .116Rate of economic growth in the country 1 -.125 .307 -.002 .988Technology level in industrial segment -.125 .307 1 .510 .000
Innovation rate in industrial segment -.002 .988 .510 .000 1

Strojniški vestnik - Journal of Mechanical Engineering 57(2011)1, 55-68
61Analysis of Company Development Factors in Manufacturing and Service Company: a Strategic Approach
segment, the more significant is the factors such as Product/service development and Flexibility in relation to client requirements. Observing the sample of the service companies, it is noticed that there is a positive correlation of low to moderate intensity between the selected external environment development factors: Technology level in commercial segment and Innovation level in industrial/commercial segment with the internal environment development factors: Market share, Capability of introducing new products/services, Available know-how, Use of capacities in relation to major competitors, Product/service development, Operation technology development, and Human resources development, Level of cash inflow in terms of self-finance (Table 4). Within the group of the non-manufacturing companies, in the matrix of the intercorrelations of the dimensions of significance from the area of the modified SPACE analysis, 19 correlation coefficients are statistically significant in relation to 2 within the group of the manufacturing companies. The
consideration of the intercorrelation matrices indicates that there are differences in the signs of the correlation coefficients; however, the differences in the intensity of the individual bivariant relations between the modified SPACE analysis dimensions are visible.
2.2 Relation of Development Factors of Modified SPACE Analysis from the Domain of Values and Development Factors of External Environment
This relation was specifically checked using Pearson’s linear correlation coefficient on the sub-sample of the manufacturing and the sub-sample of service companies.
In the sub-sample of the manufacturing companies, there is a negative correlation of moderate intensity between Available know-how and Rate of economic growth in the country, as well as between the Placement of interim cash surpluses and Rate of economic growth.
Table 5. Matrix of intercorrelations of the selected development factors in the scales of the modified SPACE analysis within the group of manufacturing companies (number of the companies = 47) (value domain)
Development factor
Rate of economic growth in the
country
Technology level in industrial segment
Innovation rate in industrial segment
r p r p r pMarket share -.297 .264 .263 .074 .098 .512
Product/service quality -.472 .065 .575 .000 .501 .000Average product/service life cycle stages -.153 .602 .131 .393 .409 .005
Completeness of production/service programme .311 .242 .107 .474 .004 .979Uniqueness (originality) of products/services -.013 .962 .222 .134 .264 .073
Capability of introducing new products/services -.205 .447 .162 .276 .531 .000Available know-how -.510 .044 .272 .065 .233 .115
Use of capacities in relation to major competitors -.072 .792 .207 .164 .402 .005Product/service development -.132 .626 .377 .009 .451 .001
Operation technology development -.088 .745 .457 .001 .498 .000Human resources development -.139 .607 .377 .009 .322 .027
Harmonization of organizational structure with changes in the environment/company -.009 .972 .322 .028 .489 .000
Timely taking of corrective actions -.141 .601 .411 .004 .269 .067Flexibility in relation to client requirements -.183 .499 .168 .260 .168 .259
Return of investments -.093 .732 .512 .000 .279 .057Level of cash inflow in terms of self-finance -.119 .661 .248 .092 -.081 .586
Placement of interim cash surpluses -.545 .036 .298 .046 .334 .025Rate of economic growth in the country 1 -.133 .624 .148 .584Technology level in industrial segment -.133 .624 1 .365 .012
Innovation rate in industrial segment .148 .584 .365 .012 1

Strojniški vestnik - Journal of Mechanical Engineering 57(2011)1, 55-68
62 Borocki, J. - Cosic, I. - Lalic, B. - Maksimovic, R.
Significant positive correlation of moderate intensity exists between the factors: Product/service quality, Product/service development, Operation technology development, Capability of introducing new products/services, Harmonization of organizational structure with changes in the environment/company, Use of capacities in relation to major competitors with the Innovation rate in industrial segment.
The significant positive correlation of moderate intensity exists between the factors: Product/service development, Operation technology development, Timely taking of corrective actions, Return of investments, with the Technology level in industrial/commercial segment. Within the group of the manufacturing companies, in the matrix of the intercorrelations of the dimensions of values from the area of the modified SPACE analysis, 16 correlation coefficients are statistically significant which
is shown in Table 5, in relation to 2 correlation coefficients in the matrix of the intercorrelations of the dimensions of significance, presented in Table 3 for the same group.
In the sub-sample of the service companies, there are certain significant correlations of low intensity, except between the factors Market share and Rate of economic growth in the country (high correlation), shown in Table 6.
The significant positive correlation of moderate intensity exists between the factors: Product/service development and Technology level in industrial/commercial segment exists in the sub-sample of the manufacturing companies but not in the sub-sample of the service companies for which the correlation of moderate intensity between Market share and Rate of economic growth in the country (these correlation
Table 6. Matrix of intercorrelations of the selected development factors in the scales of the modified SPACE analysis within the group of service companies (number of the companies = 69) (value domain)
Development factor
Rate of economic growth in the
country
Technology level in industrial segment
Innovation rate in industrial segment
r p r p r pMarket share .648 .023 .307 .010 .352 .003
Product/service quality .143 .658 .211 .082 .275 .022Average product/service life cycle stages -.392 .233 .265 .032 .094 .454
Completeness of production/service programme .201 .531 .152 .212 .318 .008Uniqueness (originality) of products/services -.083 .799 .088 .472 .177 .145
Capability of introducing new products/services .335 .287 .083 .498 .304 .011Available know-how .225 .482 .387 .001 .355 .003
Use of capacities in relation to major competitors .205 .523 .168 .171 .287 .018Product/service development .413 .183 .243 .044 .289 .016
Operation technology development -.017 .958 .173 .155 .181 .137Human resources development .364 .245 .248 .040 .312 .009
Harmonisation of organizational structure with changes in the environment/company .429 .164 .175 .151 .292 .015
Timely taking of corrective actions .427 .166 .204 .092 .312 .009Flexibility in relation to client requirements .158 .624 .130 .286 .224 .065
Return of investments .198 .537 .418 .000 .383 .001Level of cash inflow in terms of self-finance .264 .407 .144 .239 .159 .192
Placement of interim cash surpluses -.301 .341 .300 .014 .199 .107Rate of economic growth in the country 1 .500 .098 .497 .100Technology level in industrial segment .500 .098 1 .576 .000
Innovation rate in industrial segment .497 .100 .576 .000 1

Strojniški vestnik - Journal of Mechanical Engineering 57(2011)1, 55-68
63Analysis of Company Development Factors in Manufacturing and Service Company: a Strategic Approach
coefficients have the highest value in both Matrix of intercorrelations) is statistically significant.
Differences in the structure of the correlation matrices prove that the interaction patterns among the selected development factors of the modified SPACE analysis, most probably, differ in the groups of the manufacturing and non-manufacturing companies.
3 DISCUSSION
The results of the research indicate that the difference between the manufacturing and service companies is reflected in the fact that the manufacturing companies place higher significance to the development factors: Product quality and Operation technology development. It may be assumed that the service companies within the selected area of the research place higher significance to other development factors, i.e. that they observe the level of their development through some other factors than those included in the modified SPACE analysis.
In terms of the degree of the relation of the selected company development factors with the level of external environment factors development, but within the domain of the significance placed by the companies to these factors, the main differences between manufacturing and service companies are given in Table 7, where the big size of sign “X” signals a moderate level of correlation (others are low).
Obviously, the manufacturing companies perceive that the significance of these internal development factors is ensured through internal activities, based on a company’s own potentials, rather than based on the economic growth rate: there is no significant correlation with this external factor, for both manufacturing and service companies.
The service companies perceive that the Technology level and Innovation rate in industrial/commercial segment to a large extent determine the level of significance of almost all internal development factors which is not the case with manufacturing companies. Service companies
Table 7. Differences between manufacturing and service companies in relation to Innovation rate in industrial segment and Technology level in industrial segment (significance domain)
Development factor
Innovation rate in industrial segment
Technology level in industrial segment
Manuf. companies
Service companies
Manuf. companies
Service companies
Market share x xProduct/service quality x
Average product/service life cycle stagesCompleteness of production/service programme
Uniqueness (originality) of products/services xCapability of introducing new products/services x x
Available know-how X xUse of capacities in relation to major competitors X x
Product/service development x x xOperation technology development X x
Human resources development x xHarmonization of org. structure with changes in the
environment/companyTimely taking of corrective actions
Flexibility in relation to client requirements xReturn of investments x
Level of cash inflow in terms of self-finance x xPlacement of interim cash surpluses x

Strojniški vestnik - Journal of Mechanical Engineering 57(2011)1, 55-68
64 Borocki, J. - Cosic, I. - Lalic, B. - Maksimovic, R.
considered that external development significantly affect on the level of internal development, measured through selected factors (available know-how, operation technology development, originality of services, etc.).
In terms of the value of the selected company factors, service companies perceive that the Market share size significantly depends on the Rate of economic growth – the higher the rate of economic growth, the higher market share may be achieved, in contrast to the manufacturing companies which neglect both the significance of this factor and its value (Table 8).
Another difference is reflected in the fact that a high rate of economic growth for the manufacturing companies does not also mean a highly available know-how. For service companies, Available know-how depends on the Technology level and Innovation rate in industrial/commercial segment. Both manufacturing and service companies do not see the level of the rate of economic growth with the majority of factors (apart from the market share with the service companies) as important for a strong development of the selected factors of company development.
Flexibility in relation to client requirements, Uniqueness (originality) of products/services and Level of cash inflow in terms of self-finance does not depend on the value of the Rate of economic growth in the country, Technology level in industrial segment and Innovation rate in industrial segment for any company from the research sample. These company development factors probably depend on some other factors (i.e. creativity climate in the company; knowledge of the service employees; technological, capacity and flows flexibility of the company [21] to [23]; financial strength of the company, etc.).
The main similarities between manufacturing and service companies are expressed in correlation coefficients which exist between internal development factors: Product/service development and Human resources development and external development factors: Technology level and Innovation rate in industrial segment. This means that manufacturing and service companies stand that high quality of product or service could be reached only when high technology exists in
Table 8. Differences between manufacturing and service companies in relation to Innovation rate in industrial segment and Technology level in industrial segment (value domain)
Development factor
Innovation rate in industrial segment
Technology level in industrial segment
Manuf. companies
Service companies
Manuf. companies
Service companies
Market share x xProduct/service quality X x X
Average product/service life cycle stages xCompleteness of production/service programme x
Uniqueness (originality) of products/servicesCapability of introducing new products/services X x
Available know-how x xUse of capacities in relation to major competitors X x
Product/service development X x x xOperation technology development X X
Human resources development x x x xHarmonization of org. structure with changes in the
environment/company X x x
Timely taking of corrective actions x XFlexibility in relation to client requirements
Return of investments X X xLevel of cash inflow in terms of self-finance
Placement of interim cash surpluses x x x

Strojniški vestnik - Journal of Mechanical Engineering 57(2011)1, 55-68
65Analysis of Company Development Factors in Manufacturing and Service Company: a Strategic Approach
external environment in which innovation rate is also high. Capability of introducing new products or service is possible only if the innovation rate in the external environment is high. Return of investments depends only from Technology level in industrial segment for selected companies in a research sample. Considering the above, it can be concluded that it is possible to define the collective set of company development factors that depends on the same external factors for both manufacturing and service companies. This set includes: Product/service development, Human resources development, Capability of introducing new products or service and Return of investments. Rate of economic growth in the country does not have an impact on these factors.
The development of a new product is conducted in accordance with the strategy and market needs. The fact that it requires significant financial and other resources, underpin applying of a multicriteria analysis of product development in a multi-dimensional space [24].
4 CONCLUSION
Statistic analyses of t-test and linear correlation were used on the selected sample of 116 companies, thereof, 47 are manufacturing and 69 are service companies, with the aim of determining possible differences regarding the attitude of these companies in relation to the significance of the selected factors of process development at company and external environment, and it may be concluded that there are certain differences in the perception of the significance of the development factors between the manufacturing and service companies. It was identified that there was the application of the modified SPACE analysis as a basis to determine possible differences between the manufacturing and service companies in terms of the selected development factors. These differences are also perceivable in terms of the factor value. The manufacturing companies from the selected sample see their development mostly through quality product development and operation technology, and they place lower significance on other development factors i.e. their processes. This could mean that the manufacturing companies, to some extent, neglect other development processes
and do not monitor their development through certain indicators of competitive and financial potential which is given a higher significance by the service companies. It could be said that the service companies in the selected geographic area are more developed regarding the selected development factors than the manufacturing, i.e. there is certain integral development approach to the company development as a whole.
Manufacturing companies in the selected sample of research have as a dominant (most frequent), an aggressive strategic posture, which means that the company has at the same time excellent financial and competitive potential, which in turn means a higher level of product development as good as most of the company’s processes. However, with a more detailed analysis of strategic posture, especially of the direction (position) of the resultant, it is obvious that the services companies has a stronger, more stable aggressive posture than the manufacturing companies, whose resultants are close to the scale that represents industrial strength. Such a posture of the manufacturing companies indicates that the company is an early adopter of aggressive strategic posture and has not yet well settled into this posture (position of a stable balance). It is closer to the competitive strategic posture with the main characteristic: attractive industry in a relatively unstable environment. Research and development activities in the company require a lot of resources and are not cheap, particularly in a case of product development. Creating better strategic posture requires a company to mobilize a lot of internal resources. Creating a plan of future company development is more complicated. The simulation of values of key development factors gives valuable information about the possible future strategic posture to the company. For this reason, it is useful to use a process of simulation (as we can use some kind of simulation in modified SPACE analysis in order to find out if company could reach its most desired strategic posture). Thus, in a company with low cost strategy, created ideas should be manifested in the form of process innovation and not in product/service innovation. In addition to the aggressive and competitive posture, a company can have defensive and conservative posture applying SPACE analysis. In the research sample, 45.69%

Strojniški vestnik - Journal of Mechanical Engineering 57(2011)1, 55-68
66 Borocki, J. - Cosic, I. - Lalic, B. - Maksimovic, R.
of selected companies have an aggressive posture, 20.69% competitive, 26.72% defensive and 6.90% have a conservative posture. On the other hand, good aggressive posture allows company to protect its competitive advantage and to increase its market share. The results of the research show that service companies give a higher importance to market share while manufacturing companies are not. On the base of research results, it could be assumed that manufacturing and service companies give more importance to product and market/clients respectively. If service companies are focused only on their clients and markets and do not invest enough in the development of internal processes, innovation radicalness will be restricted and consequently company development might become critical. On the other hand, if manufacturing companies will pay attention only on their products, their market orientation and innovativeness of business systems will be put into critical position. As we assume, there are some differences in service and manufacturing companies in the development of products and services, as good as in development of other internal processes.
In an unstable environment companies are forced to be more innovative. However, they put more emphasis on administrative innovations, mostly because a frequent change even in external environment requires frequent changes of structures and systems. Service companies from the research example have a stronger aggressive posture than the manufacturing one, which allows the company to be innovative (even to introduce radical innovations), thus to improve its level of development.
The manufacturing and service companies from the research sample are considering that external environment is highly unstable (70% of manufacturing and 67% of service companies). Rate of economic growth in the country was evaluated as under mediate in 72% of manufacturing companies and in 71% of service companies. Taking Technology level and Innovation rate in industrial segment as selected factors of external environment development were also evaluated with an under-average level but at a lower percentage (almost 40%) for both manufacturing and service companies. Service
companies evaluated industry strength lower than manufacturing companies.
Strategic posture is a major determinant for innovativeness. A firm’s choice of an aggressive, competitive, risk taking strategy apparently influences innovativeness in terms of the way the firms differentiate themselves from their competitors by changing their production methods and products. The company’s choice of an aggressive strategy leads to a flexible model of organizational structure.
Strategic plan of the company development could be defined on the basis of selected critical factors of company development. Simulation of their value change through the process of applying modified SPACE analysis, gives the company an insight on possible and/or idealistic future strategic posture. More valuable is the possibility to monitor how changes of value of key development factors affect the development plan of the company, its structure and strategic posture.
There are certain restrictions of this research reflected in the following: selection of factors is based on the application
of a model for the evaluation of the strategic posture of the companies,
number of the companies in the sample is insufficient for the application of other statistical analyses,
information on the factors of underdevelopment of the external environment is insufficient.
Also, in the course of the selection of the development factors to be observed, various factors must be taken in consideration: company life cycle stage (which gives
information on the characteristics of the organizational and key problems),
external environment development degree (knowledge of the environment characteristics in detail),
internal environment development degree (defined through the competitive and financial potential of the company; production structure, and its changes, etc.),
competition (number, intensity, etc.), trends and further movements on the selected
markets.Overcoming of the existing restrictions
is possible in the further research with a greater

Strojniški vestnik - Journal of Mechanical Engineering 57(2011)1, 55-68
67Analysis of Company Development Factors in Manufacturing and Service Company: a Strategic Approach
number of companies in the sample, using a larger number of factors that could give us more information about internal and/or external development level, and with a more detail analysis of service/manufacturing sector’s structure (specially because service industry is highly fragmented). That will help to identify the specific differences between both sectors.
5 REFERENCES
[1] Prajogo, D. (2006). The relationship between innovation and business performance - a comparative study between manufacturing and service firms. Knowledge and process management, vol. 13, no. 3, p. 218-225.
[2] Kostanjevec, T., Polajnar, A., Sarjaš, A. (2008). Product development through multi-criteria analysis. Strojniški vestnik – Journal of Mechanical Engineering, vol. 54, no. 11, p. 739-750.
[3] Adizes, I. (2005). The Pursuit of Prime. The Adizes Institute Publishing, Santa Monica, CA: Knowledge Exchange.
[4] Gecevska, V., Cus, F., Dukovski, V., Kuzinovski, M. (2006). Modeling of manufacturing activities by process planning knowledge representation. Int. j. simul. model., vol. 5, no. 2, p. 69-81.
[5] Palčič, I., Polajnar, A., Pandža, K. (2003). A model for the effective management of order-based production. Strojniški vestnik – Journal of Mechanical Engineering, vol. 49, no. 7/8, p. 398-412.
[6] Thoumrungroje, A., Tansuhaj, P. (2005). Entrepreneurial strategic posture, international diversification, and firm performance. Multinational Business Review, vol. 13, no. 1, p. 55-73.
[7] Pandža, K., Buchmeister, B., Polajnar, A., Palčič, I. (2002). An operations strategy supported with resource-based theory: a case study at the Primat company. Strojniški vestnik – Journal of Mechanical Engineering, vol. 48, no. 7, p. 379-394.
[8] Rajkovič, T., Vehovec, M. (2008). Competencies and innovative performance of Croatian manufacturing companies. EIZ
Working Papers EIZ-WP-0802, p. 5-25, Zagreb.
[9] Leonard-Barton, D.A. (1992). Core capabilities and core rigidities: a paradox in managing new product development. Strategic Management Journal, vol. 13, no. 1, p. 111-125.
[10] Calantone, R., Garcia, R., Dröge, C. (2003). The effects of environmental turbulence on new product development strategy planning. Journal of Product Innovation Management, vol. 20, p. 90-103.
[11] Lalic, B., Cosic, I., Anisic, Z. (2005). Simulation based design and reconfiguration of production systems. Int. j. simul. model., vol. 4, no. 4, p. 173-183.
[12] Gann, D.M., Salter, A.J. (2003). Innovation in design, engineering and project management services. Tidd, J., Hull, F.M. (Eds.), Service innovation: organizational responses to technological opportunities and market imperatives, Series on Technology Management, vol. 9, p. 301-320.
[13] Drejer, I. (2004). Identifying innovation in surveys of services: a Schumpeterian perspective. Research Policy, no. 33, p. 551-562.
[14] Davies, A., Brady, T., Hobday, M. (2006). Charting a path toward integrated solutions. MIT Sloan Management Review, vol. 47, no. 3, p. 39-48.
[15] Atuahene-Gima, K. (1996). Differential potency of factors affecting innovation performance in manufacturing and services firms in Australia. J. Prod. Innov. Management, vol. 13, p. 35-52.
[16] Damanpour, F., Gopalakrishnan, G. (1998). Theories of organizational structure and innovation adoption: the role of environmental change. Journal of Engineering and Technology Management, vol. 15, p. 1-24.
[17] Rowe, J.A., Mason, O.R., Dickel, E.K., Mann, B.R., Mockler, J.R. (1994). Strategic management - a methodological approach. 4th edition, Addison-Wesley Publishing Company, Reading.
[18] Rowe, J.A., Mason, O.R., Dickel, E.K. (1984). Computer models for strategic

Strojniški vestnik - Journal of Mechanical Engineering 57(2011)1, 55-68
68 Borocki, J. - Cosic, I. - Lalic, B. - Maksimovic, R.
management. Addison-Wesley Publishing Company, Reading.
[19] Borocki, J. (1998). Determination strategic posture of the company. Master Thesis, University of Novi Sad, Faculty of Technical Sciences, Novi Sad.
[20] Borocki, J. (2009). Developing strategic planning model in function of company’s innovativeness. PhD Thesis, University of Novi Sad, Faculty of Technical Science, Novi Sad.
[21] Fricke, E., Schulz, A., Wenzel, S., Negele, H. (2000). Design for changeability of integrated systems within a hypercompetitive environment. Conference: Systems Approach to Product Innovation and Development in
Hyper-Competitive Environments, INCOSE, Colorado.
[22] Schulz, A.P., Fricke, E. (1999). Incorporating flexibility, agility, robustness, and adaptability within the design of integrated systems - key to success? 18th DASC, Gateway to the New Millenium, IEEE.
[23] Zelenović, D.M. (1982). Flexibility - A Condition for Effective Production Systems. International Journal of Production Research, vol. 20, no. 3, p. 319-337.
[24] Kostanjevec, T., Polajnar, A., Kostanjevec, M. (2009). Product development simulation with multicriteria analysis. Int. j. simul. model., vol. 8, no. 1, p. 38-47.

Strojniški vestnik - Journal of Mechanical Engineering 57(2011)1, 69-77 Paper received: 23.05.2008DOI:10.5545/sv-jme.2008.061 Paper accepted: 27.09.2010
*Corr. Author’s Address: Faculty of Mechanical Engineering, University of Belgrade, Kraljice Marije 16, 11120 Belgrade 35, Serbia, [email protected] 69
Nonlinear Approach to Thin-Walled Beams with a Symmetrical Open Section
Andjelić, N.Nina Andjelić*
Faculty of Mechanical Engineering, University of Belgrade, Serbia
The principle of virtual work is applied to thin-walled beams with a cross-section with the middle line of an arbitrary curvilinear shape and with a continuously varying thickness. Six equilibrium equations and a seventh one related to the constrained torsion are derived taking into account general sectorial coordinates. The obtained relations are applied to structural elements with one longitudinal plane of symmetry with the shape similar to real turbine blades. All geometrical characteristics are calculated for one structural element with a modified cross-section shape. It has been shown that it is not recommendable to neglect the influence of secondary effects. ©2011 Journal of Mechanical Engineering. All rights reserved. Keywords: nonlinear approach, general sectorial coordinates, curvilinear open sections, thin-walled beams, stresses
0 INTRODUCTION
Many modern metal structures (motor and railroad vehicles, naval structures, turbine blades) are manufactured using thin-walled elements (shells, plates, thin-walled beams). Thin-walled structures are applied when it is necessary to achieve high efficiency in strength and cost by minimizing the mass of the material used. Thin-walled beams are made from flat strips, manufactured by welding of thin plates or even machined, which permits a wide variety of cross-sectional shapes.
Investigations of the behaviour of thin-walled members with open cross-sections have been carried out extensively since the early works of Timoshenko [1], Wagner [2] and Vlasov [3]. In addition to the mentioned authors, the theory of thin-walled structures was later developed by Kollbruner and Hajdin [4] and [5], Murray [6] and others all of whom showed that the cross-sections of thin-walled beams exhibit significant out-of-plane warping as a response to torsion.
It is well-known that both geometric nonlinearity and material inelasticity [7] are important for the investigation of the ultimate strength of thin-walled beams. The nonlinear analysis of beams and frames composed of thin-walled members has been generally carried out in the area of geometrical nonlinear elastic analysis. Early work on the large deflection and elastic
analysis was presented by Powell [8] among others.
Nonlinear analysis can be defined as any analysis where linear extrapolation of stress, load and deflection is invalid [9] to [11]. Since the coupling between the nonlinear displacements and the rotational transformation relationships are complicated, certain approximations were usually done in order to simplify the derivations of the nonlinear strains. When approximations are made in the early stages of derivation, some significant terms of nonlinear strains can be lost. Open profiles are commonly analyzed by using Vlassov’s assumption of vanishing of the warping shear strains in the middle surface of the thin-walled structure, and the warping of the profile is obtained as a function of the angle of rotation.
The linear theory of thin-walled members with open cross-sections, as presented in [4], differs from the conventional form by including the change of longitudinal normal stresses along the wall thickness. However, the basic differential equations (equilibrium conditions) are derived in the unique way. The linear “classical” theory of thin-walled open section beams was extended in [4] by including the secondary sectorial coordinates. That procedure is still linear and later in [12] the second order theory was extended to thin-walled members with an open cross-section with an arbitrary polygonal middle line.

Strojniški vestnik - Journal of Mechanical Engineering 57(2011)1, 69-77
70 Andjelić, N.
A similar approach is applied in this paper to the sections with a middle line of an arbitrary curvilinear shape and with constantly varying thickness. The main purpose of this paper is to present an approach of a nonlinear analysis of beam-type structures with a thin-walled open cross-section. The authors tried to investigate the influence of the introduction of second order terms on the results.
1 BASIC ASSUMPTIONS
According to the classical linear theory of thin-walled open section beams [1], [3] and [4], normal stresses in cross-sections are assumed to be constant across the wall thickness and proportional to the sectorial coordinates. In [4] the secondary sectorial coordinate is introduced and the normal stresses are assumed to have the distribution that is not constant but linear across the wall thickness.
Basic assumptions of the theory of thin-walled beams are assumed to be valid:(a) the cross-sections do not change their shape
and their projections on the initial planes behave as rigid plates,
(b) the shear deformation in the middle surface is neglected,
(c) the line elements that are initially perpendicular to the middle surface remain straight and perpendicular during the whole deformation.
Open cross-sections are commonly analyzed by using Vlasov’s assumptions: the warping shear strains are assumed to vanish in the middle surface of the thin-walled structure and the warping of the cross-section is obtained as a function of the angle of rotation.
2 DISPLACEMENTS AND DEFORMATIONS
Applying the principle of virtual work [12] and [13] to the deformed configuration of the considered thin-walled beam, apart from the six common scalar equations, an additional seventh equation is obtained and it includes the relations between the bimoment B, Saint Venant’s torque M3 , warping torque Mω and internal forces.
2.1 Position Vector of an Arbitrary Point
Let us consider a thin-walled beam with an open cross-section (Fig. 1) and let us assume that:Xi (i = 1, 2, 3) are two centroidal principal
axes of the cross-section and the centroidal longitudinal axis of the considered beam respectively,
ii
(i = 1, 2, 3) are the unit vectors of Xi ,s is the coordinate measured along the middle
line of the cross-section,e is the distance from the middle line.
Fig. 1. Thin-walled open cross-section
Using the summation convention, the position of an arbitrary point in the cross-section (not in the middle surface) before the deformation is defined by:
* *i ir x i= ⋅
, (1)
where *r is position vector before the deformation, xi* (i = 1, 2, 3) are material coordinates of an arbitrary point which is not initially in the middle surface.
2.2 Displacements during the Deformation
The position of an arbitrary point after the deformation can be defined by [12]:
* * *R r u= +
, (2)
and by:
iii iuxR
)( *** += , (3)
where *
R is the position vector after the

Strojniški vestnik - Journal of Mechanical Engineering 57(2011)1, 69-77
71Nonlinear Approach to Thin-Walled Beams with a Symmetrical Open Section
deformation, *u is the displacement vector, *
iu (i = 1, 2, 3) are its components.
If P is an arbitrary pole in the plane of the cross-section [4], starting from the assumptions about the deformations of the considered member, the components of the displacement vector can be obtained in the form: u x x i j j ii iP j jP P
* *( ) , , ; )= − = ≠ξ φ ( 1 2 , (4)
u x x wP P P P3 1 1 2 2 0* ' * ' * ' *= − − − +ξ ξ φ ω , (5)
where xiP (i = 1, 2) are the displacement components of the pole P in the directions of the axes Xi (i = 1, 2), jP is the angle of rotation of the cross-section around the longitudinal axis through the pole P, xiP (i = 1, 2) are material coordinates of the pole P, ωP* is the generalized sectorial coordinate, equal to the sum of the “classical’’ and the previously mentioned secondary sectorial coordinate, w0 is the displacement in the direction of the longitudinal axis X3; (...)’=d(...)/dx3 .
2.3 Virtual Displacements
If the virtual displacement
u u ii i* *= (6)
is imposed to the points of the deformed beam, the position vector (3) will become
R x u u ii i i i* * * *( )= + + (7)
and its projections on the directions of the axes Xi (i = 1, 2) are: u x xi iP i iP P
* *( )= −ξ φ
, (8)
where ui* (i = 1, 2, 3) are the components of the
virtual displacement vector u * .
2.4 Virtual Deformations
The assumption (b) about the shear deformation es3 in the middle surface gives as its consequence
ε s s
i s i i i i i s
R Ru x u u x u
3 3
3 3 0= =
= +( ) + +( ) =
, ,, , , , ,
(9)
or, if developed,
− + =
= − + −
u u
x x x x x xs
P s s P s
3 3 3
1 2 2 1 2 1
1, ,
', , ,
( )
[
φ
− + + +
+ +
x x u x x uu uP s s s
s
1 2 1 2 1 2
1 2
, , ,
, xx u u xx u u u x u
P s s
s s P s
2 1 2 1
2 1 2 1 1 2
, ,
, , , ]− −
− + − +
+ + +
+
φP P s P s
P
x x x ux
[ , , , ,
,
2 1 3 2 1 3
2 3xx x ux x x u
s P s
P s P s
1 2 3 1
1 2 3 1 2 3
, , ,
, , , ,
+ −
− − −
− − +
+ +
x x x u
x uP s P s
P
1 3 2 1 3 2
1 1 1
, , , ,
'
]
( )ξ ,, ( ),'s P sx u+ +ξ2 2 2
(10)
where
R x u ui i i= + +( ) , xi (i = 1, 2, 3) are coordinates of the middle surface, ui (i = 1, 2, 3) are the components of the displacement vector of the middle surface, ui (i = 1, 2, 3) are the components of the virtual displacement vector of the middle surface, (...), (...) / ( , )i ix i= =∂ ∂ , 1 2 ,
(...), (...) / ; (...), (...) /.e se s= =∂ ∂ ∂ ∂ .
Also, the consequence of the assumption (b) about the shear deformation ee3 in the longitudinal plane perpendicular to the middle surface is:
εe e
i e i i i i i s
R R
u x u u x u3 3
3 3 0
= ⋅ =
= +( ) + +( ) =
* *
* * * * * *
, ,
, , , , ,, (11)
or
− + =
= − + −
u u
x x x x x xe
P e e P e
3 3 3
1 2 2 1 2 1
1,*
,*
' *,
* *,
*,
*
( )
[
φ
− + + +x x u x x uP e e e1 2 1 2 1 2,* *
,* *
,*
+ + − −
−
u u x u u x
x ue P e e1 2 2 1 2 1
2
*,
*,
* *,
*
*11 2 1 1 2
2 1 3 2
,* *
,*
,*
, ,*
,
]
[e e P e
P P e P e
u u x u
x x x u
+ − +
+ + φ 11 3
2 3 1 2 3 1 1 2 3
,*
, ,*
, ,*
, ,
+
+ + − x x x u x xP e P e P e**
, ,*
, ,*
, ,* ]
−
− − − + x u x x x uP e P e P e1 2 3 1 3 2 1 3 2
+ + + +ξ ξ1 1 1 2 2 2P e P ex u x u' * * ' * *( ), ( ),
(12)

Strojniški vestnik - Journal of Mechanical Engineering 57(2011)1, 69-77
72 Andjelić, N.
3 EQUILIBRIUM CONDITIONS
The equations of equilibrium are obtained using the expressions for the work of external and internal forces.
If A is the cross-sectional area, if σ3i (i = 1, 2, 3) are the stress components in the cross-section and if p is the load acting over the middle surface of the considered beam, the virtual work W of external forces and U of internal forces [11] are: W u u dA pu ds
A s
= + +∫ ∫( ),*
,*σ σ3 3 3 3 , (13)
U dAs sA
= − +∫ ( )* *σ ε σ ε33 33 3 3 . (14)
Introducing real and virtual displacements and deformations into (14) and using the condition [12] W U+ = 0 (15)
an equation of the following form is obtained:
H w H H HH H H
P P P
P P P
1 0 2 1 3 2 4
5 1 6 2 7 0
+ + + +
+ + + =
ξ ξ φ
ξ ξ φ' ' ' . (16)
The functions Hi (i = 1, 2, ...,7) are defined by long expressions that are simplified if some of their parts are neglected:
H
x xx x
AP P
P
P
1 33 31 1 23 2
31 2 2
23 1 1
= − + −
− − −
− −
∫{ [
( ( )
( ))
' ' '
*
*
σ σ ξ σ ξ
σ
σ φPP
s
dA
p ds
' '] }
,
+
+∫ 3
(17)
H
x x dA
p ds
PA
P P P
s
2 31 23
1 2 2 33
1
= − −
− − − +
+
∫
∫
{ [
( ( )) ]}
,
'
' ' * '
σ σ φ
ξ φ σ (18)
H
x x dA
p ds
PA
P P P
s
3 23 31
2 1 1 33
2
= − −
− + − +
+
∫
∫
{ [
( ( )) ]}
,
'
' ' * '
σ σ φ
ξ φ σ (19)
H x x x xP PA
P P
P
4 23 1 1 31 2 2
1 23 2 31
33 1
= − − − +
+ − −
−
∫{ ( ) ( )
[
( (
* *
'
σ σ
ξ σ ξ σ
σ ξ xx x x xx x x x
P P P
P P P
2 2 2 1 1
33 1 12
2 22
* ' *
' * * '
) ( ))
(( ) ( ) )]}
− − − +
+ − + −
ξ
φ σ ddA
p x x p x x p
p p x x p
P P PS
P P P
+
+ − − − + −
− − − +
∫{ ( ) ( )
( ( )
2 1 1 1 2 2 1 2
2 1 1 1 1
ξ
ξ φ 22 2 2( )]} ,x x dsP−
(20)
H x
x xx
A
P P
P P P
5 33 1 31
33 2 2 23
33 1 2
= − −
− − − +
+ + +
∫{
[ ( ) ]
( )
' *
' *
'
σ σ
φ σ σ
σ ξ φ gg x dA
p x x x dsP P Ps
' *}
[ ( ) ] ,1
3 1 2 2 1
+
+ − − +∫ φ ξ
(21)
H x x
x g x d
PA
P P P
6 33 2 23 33 1 31
33 2 1 2
= − − − +
+ + +
∫[ ( )
( ) ]
' * ' *
' ' *
σ σ φ σ σ
σ ξ φ AA
p x x x dsP P Ps
+
+ + − +∫ 3 2 1 1 2[ ( ) ] ,φ ξ (22)
H x x x x
eA
P P P
s P
P
7 33 31 2 2 23 1 1
3
1 33
2
= − − − − +
+ +
+
∫[ ( ) ( )
(
' * *
'
'
σ ω σ σ
σ φ
ξ σ xx xx x g dA
P
P P P P P
2 23 2 33 1 31
33 1 2 2 1
* ' *
' ' *
) ( )
( ) ]
− − − −
− − + +
+
σ ξ σ σ
σ ξ ξ ω
pp x x x x dsP Ps
P P P3 1 2 2 2 1 1[ ( ) ( )] ,ω ξ ξ+ − − −∫
(23)
where: g x x x xP P P P P P= − − + + −σ ξ φ σ ξ φ31 1 2 2 23 2 1 1[ ( )] [ ( )]' * ' ' (24)
In order to satisfy the Eq. (16), the Eq. (17) to (23) must equal zero. After the integration over the cross-sectional area [12] the following Eqs. are obtained:
F F F M pP P P3 1 1 2 2 3 3 0' ' ' ' '( )− + + + =ξ ξ φ (25)
F F x M F pP P P P P1 3 1 2 2 2 1 0' ' ' ' '[ ( ) ]+ + − − + =ξ φ φ φ (26)
F F x M F pP P P P P2 3 2 1 1 1 2 0' ' ' ' '[ ( ) ]+ + + + + =ξ φ φ φ (27)
M F F M F x
M F xF i
P P P P
P P
P P
3 2 1 1 2 1 2 3 2
2 1 3 1
32
' '
'
'
[ ( )
( )
(
+ − − − +
+ − +
+
ξ ξ ξ
ξ
φ ++ + + ++ + − − =
M M Bm p p mP P P
1 1 2 2
3 2 1 1 2 3 0β β β
ξ ξ φω )]
,
'
(28)

Strojniški vestnik - Journal of Mechanical Engineering 57(2011)1, 69-77
73Nonlinear Approach to Thin-Walled Beams with a Symmetrical Open Section
M F m M F mF p x G
P
P P P
1 1 1 2 2 2
3 3 1 2 1 0
' '
'
( )
( )( ) ,
− + − − + +
+ + − + =
φ
ξ φ (29)
M F m M F mF p x G
P
P P P
2 2 2 1 1 1
3 3 2 1 2 0
' '
'
( )
( )( ) ,
− + + − + +
+ + − + =
φ
ξ φ
(30)
B M b M F mM F m
F p x
P
P
P P
' '
'
'
( )
( )
( )(
− + + − + −
− − + −
− + −
ω ω ξ
ξ
ξ ξ
1 2 2 2
2 1 1 1
3 3 1 2 22 1 0P Px G) .+ =ω
(31)
Seven Eqs. of equlibrium are obtained and the seventh one (31) is the Eq. connected with the constrained torsion.
In the Eqs. (25) to (31) the following notations are introduced: Fi (i = 1, 2, 3) are two transversal forces and
the axial force respectively, Mi and mi (i = 1, 2) are concentrated and
continuously distributed bending moments, M3 and m3 are concentrated and continuously
distributed torques about the longitudinal axis (Saint Venant’s torques):
M x x x x dAP PA
3 23 1 1 31 2 2= − − −∫[ ( ) ( )]* *σ σ , (32)
Mω and mω are concentrated and continuously distributed warping moments,
B and bω are concentrated and continuously distributed bimoments defined through the general sectorial coordinates,
Gi (i = 1, 2, 3), bi (i = 1, 2), bω and iP are:
G g x dAA
1 1= ∫ ' * , (33)
G g x dAA
2 2= ∫ ' * , (34)
G g dAA
Pω ω= ∫ ' * , (35)
β12
1 12
22
11 2= + −∫J x x x dA x
AP
* * *( ) , (36)
β22
2 12
22
21 2= + −∫J x x x dA x
AP
* * *( ) , (37)
β22
2 12
22
21 2= + −∫J x x x dA x
AP
* * *( ) , (38)
i x xAJ JP P P
212
22
1 21
= + + +( ) , (39)
Ji are the principal centroidal moments of inertia of the cross-section
J x dA i j i ji jA
= = ≠∫ * , ( , , ; )2 1 2 , (40)
• Jω is the generalized sectorial moment of inertia of the cross-section
J dAPA
ω ω= ∫ *2 . (41)
The quantities (33) to (41) are calculated taking into account the secondary effects.
If the expressions are linearized, the Eqs. (17) to (23) are reduced to the Eqs. of the linear theory of thin-walled beams shown in [1], [3] and [4].
4 NUMERICAL EXAMPLE
The real steam turbine blades usually have the cross-sections of the shapes shown in Fig. 2 [14] and they have to be treated as thin-walled sections of non-constant thickness.
The real cross-sections (Fig. 2) were approximated for the calculations by the cross-section with one axis of symmetry (Fig. 3).
Fig. 2. Real cross-sections
In order to apply the derived equations and expressions to the elements with cross-sections similar to the cross-sections of the real turbine blades, one element of the modified shape of the cross-section with one axis of symmetry (Fig. 3) was chosen for the calculations. Its symmetry obviously induced some simplifications in the used expressions, and the whole element was considered as clamped at one end and loaded in a complex way by continuously distributed lateral load and torque along its length.

Strojniški vestnik - Journal of Mechanical Engineering 57(2011)1, 69-77
74 Andjelić, N.
Fig. 3. Approximated cross-section; R is the radius of curvature of the middle line; eP is the distance between the center of curvature O and
the pole P (shear center); hC is the distance between the center of curvature O and the
centroid of the cross-section C; yP = eP - hC
A certain problem presented the choice of the function by which the variation of the thickness along the section could be described. The chosen cross-section having non-constant thickness t(j ) (Fig. 3) was defined by the following Eq. [15]. t t t t( ) ( ) /φ φ α= − −0 0 1
(42)
where t t0 0= =( )φ , t t1 = =( )φ α .
4.1 Geometrical Characteristics
The expressions defining the geometrical characteristics needed for the calculation were derived applying the function (42): Cross-sectional area A Rt t t= +0 1 01α ( / ) , (43)
Torsion constant
I t R d
Rt t t t t t t
t = =
= + + +
∫( / ) ( )
/ )[ / ( / ) ( / ) ],
1 3
6 1
3
03
1 0 1 02
1 03
φ φ
αφ
( (44)
Generalized sectorial moment of inertia
J R t t te R t tP
ω α
α α α α
/ ( / ) ( / )
/ {( / ) ( / ) ( sin cos
50
31 0
1 0
6 1 3
4 1 1 2
= + +
+ − + −− − + + − +
+
2 8 1 12
8
21 0 0
31
2( / )sin ) ( / )( / ) ( cos sin )
( /
e R t t t t Re
P
P
α α α α
RR t t t t t R t t)[( / ) ( / )sin ] ( / ) [ ( / ) ( / ) ( co1 2 2 1 11 0 1 0 02
1 02+ − + − −α α α α ss sin cos )
( / )( / ) ( cos sin cos
α α α α
α α α α α α α
− − + +
+ − − −
2 2 2
1 1 3 621 0
3 2t t ++ − − −
− +
6 4 3 1 1 4
3 6
31 0
3 4 3
2
sin ) ( / ) ( / )( / ) (( / ) cos sin
cos
α α α α α α
α α
t tαα α α α α α αsin cos )]} / ) ( / ) [ sin cos / ) ( / )+ − + − − −6 6 2 3 2 10
2 21 0t R e R t tP (( sin sin )
( / ) ( / ) ( / sin.
α α α α
α α α α α α
2 2
21 0
2 3 2
2
3 2 1 2 3 2 2
− + +
+ − ⋅ − − +t t ssin sin cos ) ( / ) ( / ) ( / ( / )sin
s
2 31 0
3 4 3
2
3 4 1 3 2 3 2
2
α α α α α α α
α
+ − − − +
+
t tiin sin sin )]2 2 22α α α α α− + − .
(45)
After the integration the quantities b1, b2 and bω defined by (36) to (38) become:
β ρ η α η ρ α12
03
2 02 2
02 248 12 1 4 1 1 4 1 12/ ( / ) [ ( )]( cos ) ( )sinR t J = + + − − + −
−− − + + − + + −12 1 1 3 4 11 0 02 2
02( / ) ( / )[ ( ) (sin cos ) ( sint t α ρ η α α α η ρ α(1 ) αα α α α
α α α α α
cos sin )]
( / ) ( / )[ ( sin cos cos
− −
− − − − +
2
6 1 1 6 2 2 2
2
1 02 2 2t t αα η α α α α α α
α
) ( sin sin sin )]
( / ) ( / ){ ( si
− − + − +
+ −
2 2 2 2
1 03 3
2 2
3 1 1 12 2t t nn cos sin cos ) [ ( ) ( sin )
( )sin
α α α α α α α η α α α
α
− − + + − −
− −
2 3 2 1 2
3 1 2
3 3 2 2
2 αα αcos ]},
(46)
β ρ η η ρ α α α22
03
1 02 2
0248 12 1 4 1 4 1 12/ ( / ) { [ ( )] ( ) sin cosR t J = + + − + +( ) − 44 1 12 1 3
12 1 1 3 4 1 3 102 2
1 0 02 2
αη ρ η
α ρ η
[ ( )]
( / ) ( / )[ ( ) ( cos
+ + +
+ − + + −t t αα α α η ρ α α α α α
η ρ α
− + + + −
− + + −
sin ) ( sin cos sin )
] (
(1 )
(1 ) 2
4 2
4 2 102 2 2
02 tt t1 0
2 2 2
3 2
1 18 2 2
4 6 3
/ ) ( / )[ ( sin cos sin )
( sin cos
α α α α α
η α α α α
+ − −
− + − αα α α α α α α α α αsin sin cos )] ( / ) ( / )[ ( sin cos21 0
3 3 3 23 3 1 1 12 3+ − − − + −t t 66 6 6
2 4 3 2 1 64 3 2 2
α α α
α α α α α α α α α
sin cos )
sin cos ( sin ) sin cos
− + −
− + − − − ++ −3 482 203
1sin ]} ( / )α y R t JP ,
(47)

Strojniški vestnik - Journal of Mechanical Engineering 57(2011)1, 69-77
75Nonlinear Approach to Thin-Walled Beams with a Symmetrical Open Section
β ρ η α ρ ηω ω/ ( / ) [ ( ) ] ( / )[ ( )R t J e RP3
0 02 2 2
02 2120 10 1 12 1 20 1 12 1= + + + − + ]]( cos )
( sin cos ) ( / ) ( )sin
1
480 1 20 1 1202
02 2
− +
+ − − − + −
α
ρ η α α α η ρ αe RP 55 1 1 4 16 1
96 21 0 0
2 2 3
02 2
( / ) ( / ){[ ( )]
( cos sin s
− + + −
− − +
t t α ρ η α
ρ η α α α α iin ) ( / ) [ ( )]( cos sin )
( / ) ( )
α ρ η α α α
η ρ
+ − + − +
+ +
12 1 4 1
6 1 402 2
02
e Re R
P
P (( sin sin cos )} ( / ) ( / ) [ sin cosα α α α α α α α α α− − − − − − +2 15 1 1 8 8 8 41 02 2t t 22
2 2 2 2 4
1
2 2 2
1
cos
( / ) ( sin cos sin sin ) ]
( /
α
η α α α α α α α α
+
+ − + − − −
− −
e RtP
tt e Re R
P
P
03 3 2 31 20 6 6 3
5
) ( / ){ ( / ) ( cos sin sin cos )
( / )
α α α α α α α α− + − +
+ [[( sin ) ( ) ( )sin cos ] },1 2 3 2 3 1 2 42 3 2 5− − − − +α α α α α α α
(48)
where h = hC / R, ρ0 = R / t0 .It must be underlined that according
to the author’s knowledge the Eq. (45) for the generalized sectorial moment of inertia and Eqs.(46) to (48) are for the first time derived in this paper.
4.2 Stress Distribution
Stress components that appear in the considered case are normal and shear stresses caused by bending and torsion. Attention is particularly paid to the constrained torsion effects as well as to the stress components, which are their consequences as in that case the secondary effects become evident.
Normal stresses are proportional to the sectorial coordinate and it is necessary to point out that the secondary sectorial coordinate will be taken into consideration together with the generalized sectorial moment of inertia calculated using (41).
Normal stresses σ caused by the bimoment and shear stresses t caused by the torsion [4] and [15] are calculated from the Eqs. (49) and (50):
σ ωω
=BJ
, (49)
τ =MIt
t
3 , (50)
where t - is the thickness of the cross-section at the considered place.
As the shear stresses and particularly stresses induced by the Saint Venant’s torques should not be neglected, it was necessary to calculate the equivalent stresses σe, which was done using the maximum shear stress failure (Tresca) criterion (51)
σ σ τe = +2 24 . (51)
The calculations were done for the straight beam (Fig. 4) with the chosen cross-section (Fig. 3), and for the dimensions: L = 900 mm, R = 300 mm, α = 300, t0 = 26 mm, t1 = 13 mm.
Fig. 4. Approximated shape of the steam turbine blade
As the aim of the paper is to investigate whether it is necessary or not to take into account the additional effects, secondary effects and sectorial coordinates, the stresses were calculated for the unit loads.
Fig. 5. Distribution of normal stresses
The distribution of maximal stresses along the beam is presented in Fig. 5 for normal stresses, in Fig. 6 for shear stresses, and in Fig. 7 for equivalent stresses. Numerical calculations were

Strojniški vestnik - Journal of Mechanical Engineering 57(2011)1, 69-77
76 Andjelić, N.
performed separately for the “classical” case when the secondary sectorial coordinate was not taken into account.
The stress values connected with secondary effects are denoted by asterisk.
Fig. 6. Distribution of shear stresses
5 CONCLUSIONS
All geometrical characteristics for the chosen cross-section and, after that, all stress components for the considered structural element having the shape of the turbine blade were calculated in the way explained in [4], [13] and [15]. As it has been mentioned the Eqs. (45) to (48) are for the first time derived in this paper. The geometrical quantities obtained with and without the secondary sectorial coordinates were mutually compared as well as the stress components in the case of complex loads. Their distributions over the cross-section and along the element for the applied unit loads were determined. The dependence of the secondary effects on the cross-sectional dimensions was shown.
Fig. 7. Distribution of equivalent stresses
From the obtained results it can be concluded that if secondary effects are taken into account, the differences between the stresses with and without the mentioned effects are quite remarkable at the clamped ends and that they decrease towards the middle of the beam. It should be pointed out that the clamped ends are at the same time the places where the blades are connected with the rotor body and that they already represent the critical points.
If the additional terms are taken into account, they have non negligible effects on the level of stress components, particularly in some cases of the crotional shapes similar to those considered in the numerical example.
6 REFERENCES
[1] Timoshenko, S.P. (1945). Theory of bending, torsion and buckling of thin-walled members of open cross section. Journal of the Franklin Institute, vol. 239, no. 3, p. 201-219, vol. 239, no. 4, p. 249-268, vol. 239, no. 5, p. 343-361.
[2] Wagner, H., Pretschner, W. (1934). Verdrehung und Knickung von offenen Profilen. Luftfahrtforschung, vol. 11, no. 6, p. 174-180.
[3] Vlasov, V.Z. (1959). Thin-walled elastic beams, 2nd ed. Moscow (English translation, Jerusalem, 1961).
[4] Kollbruner, C.F., Hajdin, N. (1972). Dunnwandige Stabe, Band 1. Springer Verlag, Berlin.
[5] Kollbruner, C.F., Hajdin, N. (1975). Dunnwandige Stabe, Band 2. Springer Verlag, Berlin.
[6] Murray, N.W. (1984). Introduction to the theory of thin-walled Structures. Clarendon Press, Oxford.
[7] Epstein, M., Murray, D.W. (1996). Three-dimensional large deformation analysis of thin-walled beams. International Journal of Solids and Structures, vol. 12, no. 12, p. 867-876.
[8] Powell, G.H. (1969). Theory of nonlinear elastic structures. Journal of the Structural Division, ASCE, vol. 95, no. 12, p. 2687-2701.
[9] Chan, S.L. (2001). Non-linear behaviour and design of steel structures. Journal of

Strojniški vestnik - Journal of Mechanical Engineering 57(2011)1, 69-77
77Nonlinear Approach to Thin-Walled Beams with a Symmetrical Open Section
Constructional Steel Research, vol. 57, no. 12, p. 1217-1231.
[10] Sekulovic, M. (1986). Geometrically nonlinear analysis of thin-walled members, steel struct., recent ‘research advances and their applications to design’. Elsevier Applied Science Publishers, part 12.
[11] Harl, B., Kegl, M. (2005). Efficient shape optimization of space trusses. Strojniški vestnik - Journal of Mechanical Engineering vol. 51, no. 9, p. 570-588.
[12] Hajdin, N. (1982). The non-linear theory of thin-walled member with open cross section. Theoretical and Applied Mechanics, vol. 8, p. 29-39.
[13] Erkmen, R.E., Bradford, M.A. (2009). Non-linear elasto-dynamic analysis of I-beams
curved in-plan. International Journal of Structural Stability and Dynamics, vol. 9, no. 2, p. 213-242.
[14] Vasiljević, N. (1990). Steam Turbines. University of Belgrade, Faculty of Mechanical Engineering, Belgrade. (in Serbian)
[15] Rnjak, N. (1993). A contribution to the analysis of behaviour of thin-walled structural elements of turbine blade shapes, MSci Thesis. University of Belgrade, Faculty of Mechanical Engineering, Belgrade. (in Serbian)
[16] Ružić, D. (1995). Strength of Structures. University of Belgrade, Faculty of Mechanical Engineering, Belgrade. (in Serbian)

Strojniški vestnik - Journal of Mechanical Engineering 57(2011)1, 78-79Instructions for Authors
78
Instructions for Authors
All manuscripts must be in English. Pages should be numbered sequentially. The maximum length of contributions is 10 pages. Longer contributions will only be accepted if authors provide justification in a cover letter. Short manuscripts should be less than 4 pages. For full instructions see the Authors Guideline section on the journal’s website: http://en.sv-jme.eu/.
Send to:Strojniški vestnik - Journal of Mechanical EngineeringAškerčeva 6, 1000 Ljubljana, SloveniaPhone: 00386 1 4771 137Fax: 00386 1 2518 567E-mail: [email protected] [email protected]
Please add a cover letter stating the following information about the submitted paper:1. Paper title, list of authors and affiliations.2. The type of your paper: original scientific paper
(1.01), review scientific paper (1.02) or short scientific paper (1.03).
3. A declaration that your paper is unpublished work, not considered elsewhere for publication.
4. State the value of the paper or its practical, theoretical and scientific implications. What is new in the paper with respect to the state-of-the-art in the published papers?
5. We kindly ask you to suggest at least two reviewers for your paper and give us their names and contact information (email).
Every manuscript submitted to the SV-JME undergoes the course of the peer-review process.
THE FORMAT OF THE MANUSCRIPT
The manuscript should be written in the following format:- A Title, which adequately describes the content of
the manuscript.- An Abstract should not exceed 250 words. The
Abstract should state the principal objectives and the scope of the investigation, as well as the methodology employed. It should summarize the results and state the principal conclusions.
- 6 significant key words should follow the abstract to aid indexing.
- An Introduction, which should provide a review of recent literature and sufficient background information to allow the results of the article to be understood and evaluated.
- A Theory or experimental methods used.- An Experimental section, which should provide
details of the experimental set-up and the methods used for obtaining the results.
- A Results section, which should clearly and concisely present the data using figures and tables where appropriate.
- A Discussion section, which should describe the relationships and generalizations shown by the results and discuss the significance of the results making comparisons with previously published work. (It may be appropriate to combine the Results and Discussion sections into a single section to improve the clarity).
- Conclusions, which should present one or more conclusions that have been drawn from the results and subsequent discussion and do not duplicate the Abstract.
- References, which must be cited consecutively in the text using square brackets [1] and collected together in a reference list at the end of the manuscript.
Units - standard SI symbols and abbreviations should be used. Symbols for physical quantities in the text should be written in italics (e.g. v, T, n, etc.). Symbols for units that consist of letters should be in plain text (e.g. ms-1, K, min, mm, etc.)
Abbreviations should be spelt out in full on first appearance, e.g., variable time geometry (VTG).
Meaning of symbols and units belonging to symbols should be explained in each case or quoted in a special table at the end of the manuscript before References.
Figures must be cited in a consecutive numerical order in the text and referred to in both the text and the caption as Fig. 1, Fig. 2, etc. Figures should be prepared without borders and on white grounding and should be sent separately in their original formats.
Pictures may be saved in resolution good enough for printing in any common format, e.g. BMP, GIF or JPG. However, graphs and line drawings should be prepared as vector images, e.g. CDR, AI.
When labeling axes, physical quantities, e.g. t, v, m, etc. should be used whenever possible to minimize the need to label the axes in two languages. Multi-curve graphs should have individual curves marked with a symbol. The meaning of the symbol should be explained in the figure caption.
Tables should carry separate titles and must be numbered in consecutive numerical order in the text and referred to in both the text and the caption as Table 1, Table 2, etc. In addition to the physical quantity, e.g. t (in italics), units (normal text), should be added in

Strojniški vestnik - Journal of Mechanical Engineering 57(2011)1, 78-79
79
square brackets. The tables should each have a heading. Tables should not duplicate data found elsewhere in the manuscript.
Acknowledgement of collaboration or preparation assistance may be included before References. Please note the source of funding for the research.
REFERENCES
A reference list must be included using the following information as a guide. Only cited text references are included. Each reference is referred to in the text by a number enclosed in a square bracket (i.e., [3] or [2] to [6] for more references). No reference to the author is necessary.
References must be numbered and ordered according to where they are first mentioned in the paper, not alphabetically. All references must be complete and accurate. All non-English or. non-German titles must be translated into English with the added note (in language) at the end of reference. Examples follow.Journal Papers:Surname 1, Initials, Surname 2, Initials (year). Title. Journal, volume, number, pages.[1] Zadnik, Ž., Karakašič, M., Kljajin, M., Duhovnik,
J. (2009). Function and functionality in the conceptual design process. Strojniški vestnik - Journal of Mechanical Engineering, vol. 55, no. 7-8, p. 455-471.
Journal titles should not be abbreviated. Note that journal title is set in italics.Books:Surname 1, Initials, Surname 2, Initials (year). Title. Publisher, place of publication.[2] Groover, M.P. (2007). Fundamentals of Modern
Manufacturing. John Wiley & Sons, Hoboken.Note that the title of the book is italicized. Chapters in Books:Surname 1, Initials, Surname 2, Initials (year). Chapter title. Editor(s) of book, book title. Publisher, place of publication, pages.[3] Carbone, G., Ceccarelli, M. (2005). Legged
robotic systems. Kordić, V., Lazinica, A., Merdan, M. (Eds.), Cutting Edge Robotics. Pro literatur Verlag, Mammendorf, p. 553-576.
Proceedings Papers:Surname 1, Initials, Surname 2, Initials (year). Paper title. Proceedings title, pages.[4] Štefanić, N., Martinčević-Mikić, S., Tošanović, N.
(2009). Applied Lean System in Process Industry. MOTSP 2009 Conference Proceedings, p. 422-427.
Standards:Standard-Code (year). Title. Organisation. Place.
[5] ISO/DIS 16000-6.2:2002. Indoor Air – Part 6: Determination of Volatile Organic Compounds in Indoor and Chamber Air by Active Sampling on TENAX TA Sorbent, Thermal Desorption and Gas Chromatography using MSD/FID. International Organization for Standardization. Geneva.
www pages:Surname, Initials or Company name. Title, from http://address, date of access.[6] Rockwell Automation. Arena, from http://www.
arenasimulation.com, accessed on 2009-09-07.
EXTENDED ABSTRACT
By the time the paper is accepted for publishing, the authors are requested to send the extended abstract (approx. one A4 page or 3.000 to 3.500 characters). The instructions for writing the extended abstract are published on the web page http://www.sv-jme.eu/ information-for-authors/.
COPYRIGHT
Authors submitting a manuscript do so on the understanding that the work has not been published before, is not being considered for publication elsewhere and has been read and approved by all authors. The submission of the manuscript by the authors means that the authors automatically agree to transfer copyright to SV-JME and when the manuscript is accepted for publication. All accepted manuscripts must be accompanied by a Copyright Transfer Agreement, which should be sent to the editor. The work should be original by the authors and not be published elsewhere in any language without the written consent of the publisher.
The proof will be sent to the author showing the final layout of the article. Proof correction must be minimal and fast. Thus it is essential that manuscripts are accurate when submitted.
Authors can track the status of their accepted articles on http://en.sv-jme.eu/.
PUBLICATION FEE
For all articles authors will be asked to pay a publication fee prior to the article appearing in the journal. However, this fee only needs to be paid after the article has been accepted for publishing. The fee is 180.00 EUR (for articles with maximum of 6 pages), 220.00 EUR (for articles with maximum of 10 pages), 20.00 EUR for each addition page. Additional costs for a color page is 90.00 EUR.


Strojniški vestnik - Journal of Mechanical Engineering 57(2011)1Vsebina
Vsebina
Strojniški vestnik - Journal of Mechanical Engineeringletnik 57, (2011), številka 1
Ljubljana, januar 2011ISSN 0039-2480
Izhaja mesečno
Povzetki člankovAleš Bizjak, Karolj Nemeš, Janez Možina: Er:YAG laser s preklopom kvalitete z vrtečim se
zrcalom SI 3Burak Dikici, Cagri Tekmen, Mehmet Gavgali, Umit Cocen.: Vpliv negalvanskega nikljanja
delcev SiC na korozijske lastnosti kompozitnega materiala na osnovi A356, izdelanega po postopku litja s stiskanjem SI 4
Miha Pirnat, Zdenko Savšek, Miha Boltežar: Merjenje dinamičnih obremenitev na zložljivem mestnem kolesu SI 5
Stipe Čelar, Eugen Mudnić, Sven Gotovac: Povezava med spremembami in terminiranjem sprememb poslovno informacijskih sistemov: štiri študije primerov v malih in srednjih podjetjih na Hrvaškem SI 6
Liangmo Wang, Yufa Chen, Chenzhi Wang, Qingzheng Wang: Analiza utrujenostne trajnostne dobe aluminijastih platišč s simulacijo rotacijskega utrujenostnega preizkusa SI 7
Liviu Marsavina, Andrew D. Nurse: Primerjava med singularnimi polji na vmesniškem prostem robu in na konici razpoke v elastičnem – idealno plastičnem materialu SI 8
Roman Staniek: Oblikovanje kronskih ozobij pri ploskih spiralnih gonilih SI 9Jelena Borocki, Ilija Cosic, Bojan Lalic, Rado Maksimovic: Analiza dejavnikov razvoja
proizvodnega in storitvenega podjetja: strateški pristop SI 10Nina Andjelić: Nelinearna analiza tankostenskih nosilcev odprtega prereza SI 11
Navodila avtorjem SI 12
Osebne vestiDoktorati, magisteriji, specializacija in diplome SI 14
Seznam recenzentov SI 18


Strojniški vestnik - Journal of Mechanical Engineering 57(2011)1, SI 3 Prejeto: 27.05.2010 Sprejeto: 18.10.2010
*Naslov avtorja za dopisovanje: I.H.S. d.o.o., Cesta 4. julija 84 D, 8270 Krško, Slovenija, [email protected] SI 3
Er:YAG laser s preklopom kvalitete z vrtečim se zrcalom
Aleš Bizjak1 - Karolj Nemeš2 - Janez Možina3
1 I.H.S. d.o.o., Slovenija 2 Fotona d.d., Slovenija
3 Univerza v Ljubljana, Fakulteta za strojništvo, Slovenija
Svetloba z valovno dolžino 2940 nm, ki jo oddaja Er:YAG laser, sovpada z vrhom absorpcijskega spektra vode in se zato zelo močno in selektivno absorbira v vseh snoveh, ki vsebujejo vodo. Poleg vode se dobro absorbira tudi v hidroksiapatitu, ki sestavlja zobe in kosti. Običajni Er:YAG laserji delujejo v prostem režimu in dosegajo dolžine bliskov med nekaj deset mikro do nekaj milisekund. Nezaželena lastnost tovrstnih razmeroma dolgih laserskih bliskov je, da znaten del svetlobne energije s termičnim prevajanjem preide v širšo okolico mesta interakcije in jo toplotno obremeni. Za primere, kjer je zaželeno, da absorbirana energija ostane v neposredni bližini mesta interakcije, je možno znatno skrajšati laserske bliske in sicer tako, da se v sistem vključi preklopnik kvalitete.
Doslej razviti laserji Er-YAG s preklopom kvalitete dosegajo čas bliska od nekaj deset do nekaj sto nanosekund, a so razmeroma zapleteni, občutljivi in manj primerni za upravljanje. Zato smo se odločili za razvoj enostavnejšega, zanesljivega Er-YAG laserskega vira s preklopom kvalitete z vrtečim se zrcalom. Laser je sestavljen iz osrednjega dela z aktivno lasersko sredico in resonatorskega dela s preklopnikom kvalitete. Lasersko sredico predstavlja z erbijem obogaten YAG kristal (Er:Y3Al5O12) v obliki palice ф4x90 mm. Sredico črpamo s ksenonovo bliskavico, katere spekter se prekriva s spektrom črpalnih frekvenc, ki so značilne za Er:YAG kristal. Na sliki 3 je predstavljen širok črpalni spekter ksenonske bliskavice, ki obsega valovne dolžine od 350 do 1600 nm. Zaradi relativno velike količine toplote, ki se sprošča kot posledica močnega črpanja, je potrebno sredico kontrolirano hladiti z deionizirano vodo. Frekvenco in trajanje črpalnega cikla je možno spreminjati z mikrokrmilnikom, ki skrbi tudi za usklajenost črpanja glede na kot zasuka zrcala v preklopniku kvalitete. Preklopnik kvalitete služi istočasno tudi kot zadnje zrcalo resonatorja. Zrcalo vrti DC elektromotor s frekvenco do 200 Hz. Prednje, izhodno zrcalo resonatorja je ravno, prekrito s protiodbojno plastjo in ima 85% odbojnost za svetlobo valovne dolžine 2940 nm. Shema laserja je prikazana na sliki 6.
Na sliki 9 je predstavljena odvisnost energije laserskega bliska od energije črpanja. Spodnji prag laserskega delovanja dosežemo pri minimalni energiji črpanja 40 J. Pri črpanju z energijo bliskavice 52 J dobimo na izhodu laserski blisk z energijo 16 mJ in trajanjem 270 ns. Žarek ima Gaussov profil in zato ustreza TEM00 modu. Premer negoriščenega žarka na razdalji 340 mm od izhodnega zrcala meri 2w = 1.28 mm. Optimalna frekvenca delovanja tega laserja znaša 3 Hz. Zaradi izrazitega termičnega lečenja Er:YAG kristala frekvenca navzgor omejena pri 10 Hz.
Izdelani laserski sistem je namenjen optodinamskim raziskavam interakcije kratkih bliskov erbijeve svetlobe z različnimi snovmi, v prvi vrsti s tistimi, ki vsebujejo vodo. Laserski blisk je dovolj kratek, da lahko nezaželen vpliv prehajanja toplote na okolico zanemarimo. Enostavna zasnova in računalniško podprto delovanje imata za posledico to, da je novi laserski sistem zanesljiv, odlikuje pa se tudi s ponovljivostjo oblike in energije bliskov. ©2011 Strojniški vestnik. Vse pravice pridržane.Ključne besede: Er:YAG laser, preklop kvalitete, termično lečenje, vrteče zrcalo, optodinamika, obrnjena zasedba, Xe-bliskavica

Strojniški vestnik - Journal of Mechanical Engineering 57(2011)1, SI 4 Prejeto: 11.05.2010 Sprejeto: 19.07.2010
*Naslov avtorja za dopisovanje: Univerza Yuzuncu Yil, Visoka poklicna tehniška šola Ercis, 65400 Ercis, Van, Turčija, [email protected] SI 4
Vpliv negalvanskega nikljanja delcev SiC na korozijske lastnosti kompozitnega materiala na osnovi A356,
izdelanega po postopku litja s stiskanjem
Burak Dikici1,* - Cagri Tekmen2 - Mehmet Gavgali3 - Umit Cocen2
1 Univerza Yuzuncu Yil, Visoka poklicna tehniška šola Ercis, Turčija 2 Univerza Dokuz Eylul, Oddelek za metalurgijo in materiale, Turčija
3 Univerza Ataturk, Oddelek za strojništvo, Turčija
Glavna težave, ki se pojavljajo na mejnih površinah pri izdelavi ali pretaljevanju kompozitnih materialov s kovinsko osnovo Al-SiCp, so formiranje produktov kemijskih reakcij, kot je npr. Al4C3, degradacija ojačitvene faze in pomanjkljiva omočljivost SiC ojačitve z aluminijasto osnovo. Za izboljšanje lastnosti na mejni površini se uporablja več metod, vključno s spremembo sestave osnove, oslojevanjem ojačitvene faze in krmiljenjem parametrov procesa. Med naštete metode spada tudi negalvansko nikljanje ojačitvene faze kot enostaven in poceni postopek, ki uspešno preprečuje neželene reakcije na mejni površini in izboljšuje omočljivost s povečevanjem celotne površinske energije ojačitve. Vpliv negalvanskega nikljanja na korozijske značilnosti ojačitve SiC pri kompozitnih materialih na aluminijasti osnovi v objavljeni literaturi še ni dobro opisan. Preučitev omenjenega učinka je smiselna, ker oslojevanje ojačitvene faze spreminja fizikalne in mehanske lastnosti kompozita, pa tudi korozijske lastnosti. Nagnjenost kompozitnega materiala k koroziji se povečuje zaradi prisotnosti faze Al4C3, ki nastaja na meji SiC/Al osnove. V zadnjem času je bila precejšnja pozornost usmerjena tudi na uporabo teh kompozitnih materialov pri pomorskih aplikacijah. Številne pomanjkljivosti teh materialov, kot sta duktilnost pri nizkih temperaturah in slaba korozijska obstojnost, pa omejujejo širšo uporabnost materialov v alkalnih okoljih.
V tej študiji so bile zato preučene korozijske lastnosti kompozitnega materiala s kovinsko osnovo Al – 7% Si – 0,7% Mg (A356), ojačenega z negalvansko ponikljanimi delci SiC, in izdelanega po postopku litja s stiskanjem. Naslednji cilj študije je bil povečati omočljivost med osnovo in ojačitveno fazo ter preprečiti nezaželene reakcije na mejni površini. Podrobno so preučene in obravnavane morfologija prevleke, lastnosti mikrostrukture in mejne površine kompozitnega materiala, kakor tudi vpliv negalvanske nikljeve prevleke SiC ojačitve na korozijske lastnosti. Kozorijske lastnosti so bile preučene s potenciodinamskim skeniranjem (PDS) in elektrokemično impedančno spektroskopijo v aeriranih in deaeriranih kloridnih raztopinah. Karakterizacija mikrostrukture in mejnih površin kompozita je bila opravljena z optičnim mikroskopom, vrstičnim elektronskim mikroskopom (SEM), energijsko disperzijsko spektroskopijo (EDS) in rentgenskim difraktometrom (XRD).
V študiji je bilo ugotovljeno, da mejne površine Al/SiC predstavljajo aktivna mesta, kjer se globinska korozija začenja v zgodnjih fazah, kasneje pa se zaradi čezmerne polarizacije razširi tudi na površino, kar nakazuje jamičasto korozijo. Takšne korozijske lastnosti je mogoče pripisati prevodnosti materiala prevleke, evtektični silicijevi fazi in dislokacijam, ki se zbirajo okrog Al dendritov in oblikujejo mesta nastanka korozije. Na korozijsko obstojnost kompozitnega materiala lahko posredno vpliva tudi visok tlak, ki se uporablja pri postopku litja s stiskanjem.
Zaključimo lahko, da negalvansko nikljanje kljub izboljšanju omočljivosti ni učinkovita metoda za izboljšanje korozijske obstojnosti pri konstrukcijskih aplikacijah v prisotnosti halidnih raztopin.©2011 Strojniški vestnik. Vse pravice pridržane.Ključne besede: negalvansko nikljanje, kompozit s kovinsko osnovo, korozija, EIS

Strojniški vestnik - Journal of Mechanical Engineering 57(2011)1, SI 5 Prejeto: 27.10.2009 Sprejeto: 04.10.2010
*Naslov avtorja za dopisovanje: Univerza v Ljubljani, Fakulteta za strojništvo, Aškerčeva 6, 1000 Ljubljana, Slovenija; [email protected] SI 5
Merjenje dinamičnih obremenitev na zložljivem mestnem kolesu
Miha Pirnat - Zdenko Savšek - Miha Boltežar*Univerza v Ljubljani, Fakulteta za strojništvo, Slovenija
Zložljiva mestna kolesa so vedno bolj zanimiva alternativa javnemu prevozu v mestih, saj omogočajo parkiranje avtomobila na bolj oddaljenih parkiriščih, ki so brezplačna in potem nadaljevanje poti v mesto s kolesom. Na ta način se lahko uporabnik izogne kaznim za nepravilno parkiranje, prenapolnjenim avtobusom in je hkrati neodvisen od voznih redov.
Pri razvoju takšnega zložljivega kolesa se izkaže, da trenutno ni standarda, na katerega bi se lahko razvojni inženir oprl pri dimenzioniranju ključnih komponent, kot je naprimer okvir ali krmilo, saj vsi standardi predvidevajo klasično geometrijo kolesa, ki jo zložljivo kolo nima in je ne more imeti. V ta namen je bilo potrebno izvesti meritve dinamičnih obremenitev kolesa med vožnjo v različnih okoliščinah.
Merjenje dinamičnih obremenitev pomeni merjenje sil, ki delujejo na sprednje kolo, zadnje kolo, krmilo, pedala in sedež. Največja težava se pokaže pri merjenju sil na obe kolesi, saj je stik pnevmatike in tal, kjer sile dejansko delujejo, nedostopen. V ta namen so bile razvite posebne komponente, ki nadomestijo prvotne in omogočajo enostavno izvedbo meritev. Tako je bilo možno s pomočjo inovativnega načina razporeditve merilnih lističev in njihove ustrezne povezave na preprost in poceni način izmeriti tudi sile, ki delujejo na fizično nedostopnih mestih. Nadaljno delo je obsegalo pripravo osmih polnih Wheatstonovih mostičev, ki so bili potrebni za izvedbo merilnih mest in pripravo ostalih pomožnih sistemov. Ti so obsegali analogno-digitalni pretvornik, enkoder za spremljanje kota gonilke, kamero za spremljanje voznih razmer in globalni pozicionirni sistem (ang. GPS). Za sinhronizacijo, zapisovanje in kasnejši ogled podatkov je skrbel pogram Dewesoft, ki je bil naložen na prenosni računalnik. Slednji je bil med vožnjo shranjen v nahrbtniku kolesarja, ki je imel maso 80 kg.
Meritve so bile izvedene na vnaprej določenem krogu, ki je vseboval vožnjo po makadamu, preko grbin, ležečih policajev, robnikov, obcestnih jaškov in drugih ovir, ki jih kolesarji pogosto srečujejo. Krog je bil prevožen pri dveh različnih hitrostih, kar je dalo pomembne podatke o stopnji povečanja obremenitev kolesa s povečanjem hitrosti.
Zložljiva kolesa imajo zadnji del okvirja popolnoma drugačen od navadnih, klasičnih koles in ta navadno nima značilne trikotne oblike, ki dobro prenaša obremenitve. Dobljeni rezultati nakazujejo na veliko obremenitev ravno zadnjega dela zložljivega kolesa, kar je nujno potrebno upoštevati pri dimenzioniranju. Na sprednjem delu zložljivega kolesa je zaradi visoke lege krmila kritično vpetje le te, saj se ravno na tem mestu v nekaterih primerih, kot je naprimer vožnja stoje, generirajo velike obremenitve. Potrdili so se tudi rezultati člankov, ki pravijo, da človek lahko pritiska na pedala s silo večjo od lastne teže. Pomembno se je tudi zavedati, da so obstoječi standardi za mestna kolesa preveč ohlapni in ne zajemajo geometrijsko tako drugačnih koles, kot so zložljiva kolesa.
Članek predstavlja nekatere rezultate meritev, ki bodo koristili vsem, ki se ukvarjajo z razvojem koles in tudi inovativen način merjenja sil, ki bo koristil vsem, ki se srečujejo s podobno geometrijo problema in želijo na enostaven in poceni način meriti sile. ©2011 Strojniški vestnik. Vse pravice pridržane.Ključne besede: zložljivo kolo, dinamične obremenitve, merilni lističi, Wheatstonov mostič

Strojniški vestnik - Journal of Mechanical Engineering 57(2011)1, SI 6 Prejeto: 09.02.2010 Sprejeto: 28.10.2010
*Naslov avtorja za dopisovanje: Univerza v Splitu, Fakulteta za elektrotehniko, strojništvo in ladjedelništvo, R. Boškovića bb, Split, Hrvaška, [email protected] 6
Povezava med spremembami in terminiranjem sprememb poslovno informacijskih sistemov: štiri študije primerov v
malih in srednjih podjetjih na Hrvaškem
Stipe Čelar* – Eugen Mudnić – Sven GotovacUniverza v Splitu, Fakulteta za elektrotehniko, strojništvo in ladjedelništvo, Hrvaška
Projekti prilagajanja in uvajanja sprememb poslovno informacijskih procesov (ERP) so zamudni in kompleksni projekti, ki so prav zaradi tega pogosto neuspešni. To je tudi glavna ovira za širšo uporabnost klasičnih sistemov ERP. Uvajanje sistemov ERP zato za mala in srednja podjetja predstavlja zelo zahteven izziv. Na trgu komercialnih sistemov ERP za mala in srednja podjetja so na voljo vnaprej konfigurirane (z vnaprej nastavljenimi parametri) rešitve, ki zahtevajo manj funkcijskih sprememb (prilagoditev). Čeprav predstavljajo spremembe sistemov ERP le manjši del projektnih aktivnosti, pa te spremembe vključujejo tudi tveganja, ki so tipična za proces razvoja programske opreme in imajo lahko velik vpliv na trajanje projekta. Dobro vodeni projekti ERP v malih in srednjih podjetjih brez funkcijskih sprememb trajajo vsaj štiri do pet mesecev. V tem članku raziskujemo soodvisnosti med nekaterimi ključnimi dejavniki uspeha pri uvajanju sistemov ERP v malih in srednjih podjetjih. Naša raziskava je bila osredotočena na korelacijo med dvema ključnima dejavnikoma uspeha (obseg funkcijskih sprememb sistema ERP in njihov urnik) ter na njihov vpliv na ostale projektne spremenljivke (obseg projektnih aktivnosti, trajanje, tveganje projekta – ter posredno projektni stroški). Teza avtorjev je, da so lahko tudi projekti z mnogimi funkcijskimi spremembami mnogo krajši in manj tvegani, če so spremembe smotrno terminirane.
V članku analiziramo projekte uvajanja sistemov ERP v štirih hrvaških malih ali srednje velikih podjetjih. Štirje primeri so si v marsičem podobni (po osnovni dejavnosti, številu končnih uporabnikov sistema ERP, številu zaposlenih, letnih prihodkih itd.), vsa podjetja pa so uspešno uvedla enak sistem ERP. Podatki za analizo so bili zbrani v fazi izvedbe projekta. V študijah primerov smo analizirali vpliv delitve sprememb ERP na dve fazi (pred in po zagonu sistema ERP). Analize kažejo, da so lahko tudi projekti z večjim faktorjem sprememb (1,0 oz. 0,46) in obsegom dela na spremembah (11,3 oz. 5,2 človek-meseca) krajši (6 oz. 9 mesecev), če so spremembe premišljeno terminirane. Pristop k terminiranju z najmanjšim obsegom potrebnih sprememb v prvi fazi in z večjimi spremembami v ostalih fazah prinaša manj tvegane in krajše projekte. Ključni korak pri obeh pristopih je bila podrobna analiza vrzeli, ki ugotavlja razliko med poslovnimi procesi malih in srednjih podjetjih in funkcionalnostjo sistema ERP. Zato je smiselno, da mala in srednja podjetja spremenjene sisteme ERP uvajajo v dveh fazah (glede na potrebne funkcijske spremembe sistema ERP). Na ta način je enostavneje upravljati s celim projektom ERP in obdržati pod nadzorom stroške implementacije. Obseg sprememb in terminiranje sta v obravnavanih študijah primerov ključna dejavnika uspeha, zato je faktor sprememb v članku definiran kot numerično merilo za stopnjo prekrivanja poslovnih procesov in funkcionalnosti sistema ERP. Faktor sprememb lahko pomaga malim in srednjim podjetjem tako pri izbiri primernega pristopa k terminiranju kot pri benčmarkingu projektov.
Glavni prispevki tega članka so: (i) praktična obravnava pristopov k terminiranju, ki je lahko uporabna za vse, ki uvajajo sisteme ERP, (ii) definicija uporabnih metrik ERP za uspešno izvedbo projektov, in (iii) definicija teoretičnega faktorja sprememb kot numeričnega merila in uporabnega orodja za izbiro primernega pristopa k terminiranju.© 2011 Journal of Mechanical Engineering. All rights reserved.Ključne besede: poslovno informacijski sistem (ERP), ključni dejavniki uspeha, metrika ERP, mala in srednja podjetja, študija primera, faktor spremembe ERP, uvajanje sistemov ERP, funkcijska točka

Strojniški vestnik - Journal of Mechanical Engineering 57(2011)1, SI 7 Prejeto: 08.04.2009 Sprejeto: 12.11.2010
*Naslov avtorja za dopisovanje: Šola za strojništvo, Univerza za znanost in tehnologijo Nanjing, Nanjing 210094, Kitajska, [email protected] SI 7
Analiza utrujenostne trajnostne dobe aluminijastih platišč s simulacijo rotacijskega utrujenostnega preizkusa
Liangmo Wang*, Yufa Chen, Chenzhi Wang, Qingzheng WangŠola za strojništvo, Univerza za znanost in tehnologijo Nanjing, Kitajska
Aluminijasta platišča med uporabo ne smejo odpovedati. Ključnega pomena je njihova trdnost in utrujenostna trajnostna doba. Glavni metodi za določitev utrujenostne trajnostne dobe sta preizkus utrujenostne trajnostne dobe in analiza utrujenostne trajnostne dobe. Preizkušanje utrujenostne trajnostne dobe je drag in dolgotrajen postopek. Analiza utrujenostne trajnostne dobe poteka na osnovi utrujenostnih lastnosti materiala in časovne zgodovine obremenitev. Analiza lahko napove utrujenostno trajnostno dobo že v fazi snovanja izdelka, zmanjša število eksperimentalnih prototipov in skrajša razvojni cikel. Rotacijski utrujenostni preizkus se uporablja za določanje trdnosti in utrujenostne trajnostne dobe platišč pri razvoju izdelkov. Za zagotavljanje želene trdnosti v pogojih delovanja in polne funkcije platišč je potrebna analiza porazdelitve napetosti in utrujenostne trajnostne dobe litih platišč s simulacijo rotacijskega utrujenostnega preizkusa.
Predlagana je nova metoda za vrednotenje utrujenostne trajnostne dobe aluminijastih platišč z namenom izboljšanja kakovosti izdelkov. Analiza utrujenostne trajnostne dobe vključuje nominalno analizo napetosti, analizo iniciacije razpok, jakost napetostno-deformacijskega polja in zakon o ohranitvi energije. Za napovedovanje utrujenostne trajnostne dobe platišč je bila izbrana metoda nominalnih napetosti in vgrajena v CAD/CAE-programsko opremo za simulacijo rotacijskega utrujenostnega preizkusa. ABAQUS je zmogljiva programska oprema za izvedbo tehničnih simulacij po metodi končnih elementov in vključuje bogato knjižnico elementov za simulacijo vsake geometrije in tipičnih inženirskih lastnosti materialov. Ustvarjen je bil model statične obremenitve aluminijastega platišča s končnimi elementi za simulacijo rotacijskega utrujenostnega preizkusa.
Analiza napetosti je bila opravljena s programsko opremo ABAQUS. Amplituda ekvivalentne napetosti je bila izračunana po metodi imenske napetosti ob upoštevanju vplivov srednje obremenitve, dimenzij, utrujenostne zareze, kakovosti površine in faktorjev raztrosa. Doba trajanja aluminijastih platišč je bila napovedana na osnovi amplitude ekvivalentne napetosti in Wöhlerjeve krivulje aluminijastega platišča. Za validacijo napovedi utrujenostne trajnostne dobe je bil opravljen rotacijski utrujenostni preizkus platišča. Rezultati preizkusa so pokazali, da se napoved utrujenostne trajnostne dobe z analizo po metodi končnih elementov ujema z rezultati eksperimenta. Teoretična vsebina prispevka obsega analizo utrujanja in analizo po metodi končnih elementov.
Predlagana metoda integracije analize po metodi končnih elementov in analize nominalnih napetosti lahko napove šibka območja aluminijastih platišč. Uporabna je tudi za izboljšanje aluminijastih platišč v skladu s konstrukcijskimi zahtevami. Rezultati kažejo, da je predlagana metoda dobra in učinkovita za napovedovanje utrujenostne trajnostne dobe aluminijastih platišč.
Pri analizi je bila izračunana amplituda ekvivalentne napetosti po metodi imenske napetosti ob upoštevanju vplivov srednje obremenitve, dimenzij, utrujenostne zareze, kakovosti površine in faktorjev raztrosa. Utrujenostna doba trajanja aluminijastih platišč je bila napovedana na osnovi amplitude ekvivalentne napetosti in Wöhlerjeve krivulje aluminijastega platišča. Lastnosti materiala in postopek izdelave aluminijastega platišča vplivajo na Wöhlerjevo krivuljo platišča. Natančna določitev dejavnikov in Wöhlerjeve krivulje aluminijastega platišča je zelo pomembna in težavna.
Glavni prispevek je predlagana metoda integracije analize po metodi končnih elementov in metode nominalnih napetosti. Vrednost članka je v tem, da bo uporaben za konstruiranje, proizvodnjo in izboljšanje kakovosti izdelkov iz aluminija.©2011 Strojniški vestnik. Vse pravice pridržane.Ključne besede: aluminijasto platišče, metoda končnih elementov, statična analiza, analiza utrujanja, metoda nominalnih napetosti, ABAQUS

Strojniški vestnik - Journal of Mechanical Engineering 57(2011)1, SI 8 Prejeto: 15.01.2006 Sprejeto: 02.12.2010
*Naslov avtorja za dopisovanje: Oddelek za trdnost materialov, Politehnična univerza v Temišvaru, Bv. M. Viteazu, Nr.1, Temišvar 300222, Romunija, [email protected] 8
Primerjava med singularnimi polji na vmesniškem prostem robu in na konici razpoke v elastičnem –
idealno plastičnem materialu
Liviu Marsavina1,*, Andrew D. Nurse2
1 Oddelek za trdnost materialov, Politehnična univerza v Temišvaru, Romunia 2 Wolfsonova šola za strojništvo in proizvodni inženiring, Univerza Loughborough, Združeno kraljestvo
Namen članka je poiskati podobnosti med singularnimi polji na vmesniškem prostem robu in na konici razpoke v elastičnem – idealno plastičnem materialu.
Obravnavane geometrije so idealizirani izotropni elastični – idealno plastični materiali, prilepljeni na tog elastičen substrat. Rešitve osnovnih enačb ravnotežja in združljivosti daje numerična metoda Runge-Kutta četrtega reda. Za primerjavo stanja na vmesniškem prostem robu in konici razpoke so izrisana asimptotična polja za polarne napetosti in deviatorske komponente elastične napetosti.
Problem je za pridobivanje asimptotične rešitve formuliran s pomočjo napetosti ( )0σ in premikov
u(0), ki jih vstavimo v vodilne enačbe za ravnotežje, združljivost in napetostno-deformacijsko značilnico. Za elastičen – idealno plastičen material je bila s programsko opremo Mathcad pridobljena rešitev Runge-Kutta četrtega reda. Za določitev singularnosti napetosti so za nelinearni problem lastnih vrednosti in nadaljnjih porazdelitev napetosti in premikov, ki zadoščajo vodilnim enačbam in uveljavljenim robnim pogojem, je bila uporabljena iteracijska shema. Asimptotična rešitev je bila preverjena z visoko osredotočeno analizo po metodi končnih elementov so programsko opremo Lusas. Robni pogoji so bili definirani kot premiki, ki ustrezajo elastični rešitvi za modelni polmer R = 5 mm, in za idealen lepljeni spoj s togim substratom.
Polje plastične zdrsnice je bilo sestavljeno po delih za elastično – idealno plastično obnašanje na vmesniškem prostem robu in primerjano z rešitvijo za vmesniško konico razpoke za Zvrst 1. Primerjava rešitev napetostnega polja na vmesniškem prostem robu in ob konici z elastičnim delom med 90° ≤ θ ≤ 180° pokaže, da ni mogoče razlikovati med normaliziranima deviatorskima napetostnima poljema v območju 0° ≤ θ ≤ 45° za obe geometriji. Iz tega sledi možen zaključek, da ob iniciaciji vmesniške razpoke na spoju s prostim robom ni potrebna sprememba strukture asimptotičnega deviatorskega napetostnega polja, ki je gonilo mnogih vrst napredovanja razpok.
Članek skuša dati prispevek k razumevanju faz nastanka škode pri iniciaciji in napredovanju razpok pri spojih s prostimi robovi. Za določitev patološke povezave med iniciacijo razpoke na vmesniškem prostem robu in rastjo vmesniške razpoke je bila opravljena neposredna primerjava obeh polj.
Ko je dosežena raven meje plastičnosti, je v območju vmesniškega prostega roba psevdokonica razpoke, ki ima enako asimptotično polje za deviatorske napetosti kot za vmesniško razpoko. Podobnost se konča pri θ = 45°, kjer deli zdrsnice za spoj preidejo iz centrirane pahljače v konstantno stanje. Pri razpoki se to zgodi približno pri 60°. ©2011 Strojniški vestnik. Vse pravice pridržane.Ključne besede: vmesniški spoj s prostim robom, konica razpoke, singularno polje, elastično – idealno plastično

Strojniški vestnik - Journal of Mechanical Engineering 57(2011)1, SI 9 Prejeto: 28.04.2010 Sprejeto: 26.10.2010
*Naslov avtorja za dopisovanje: Tehnična univerza v Poznanu, Piotrowo 3, 60-965 Poznan, Poljska, [email protected] SI 9
Oblikovanje kronskih ozobij pri ploskih spiralnih gonilih
Roman StaniekTehnična univerza v Poznanu, Poljska
Med mehanskimi reducirnimi gonili z velikim prestavnim razmerjem, ki se dandanes vgrajujejo v vrtljive mize računalniško krmiljenih (CNC) obdelovalnih strojev, so najpogosteje uporabljena spiralna gonila. Med njimi imajo največji potencial in pomen ploska gonila.
V članku so predstavljene teoretične osnove za oblikovanje kronskih ozobij velikih zobnikov ploskih spiralnih gonil s pomočjo orodij z enim rezalnim robom, kot so uporabljena pri CNC-obdelovalnih strojih. Na osnovi kinematičnih in geometrijskih soodvisnosti je predlagan geometrijski model za izdelavo vrzeli med zobmi, kakor tudi geometrijski model za določitev globine sprememb vzdolž linije zob. V ta namen so bile razvite enačbe linije zob ter matematične enačbe, ki omogočajo določitev globine spremembe, ob predpostavki popolnega ujemanja polža s kronskim zobnikom ploskega spiralnega gonila.
Na podlagi predlaganih geometrijskih modelov in matematičnih formul so bili izpeljani ustrezni algoritmi za ugotavljanje stanja ovojnice in globine sprememb linije zoba. Prej omenjeni algoritmi so bili podlaga za razvoj računalniških programov, namenjenih snovanju ploskih spiralnih gonil, kakor tudi izračunu njihovih geometrijskih dimenzij. Razviti računalniški programi razen tega omogočajo tudi ilustracijo globine sprememb ozobij med preiskovanjem po liniji zoba.
Članek tako predstavlja primer računalniške simulacije preiskovanega procesa in ilustrira pridobljene rezultate.
Članek razen tega predstavlja tudi dve alternativni metodi za obdelavo kronskih ozobij ploskih spiralnih gonil s pomočjo orodja z enim samim rezalnim robom: natančno metodo in aproksimativno metodo. Na osnovi algoritmov in računalniških programov je bila izdelana primerjalna simulacija obeh metod. Obe preučevani metodi sta bili eksperimentalno verificirani in vpeljani v proizvodnjo. Natančna metoda (ki jo je izvirno predlagal avtor) v primerjavi z aproksimativno metodo omogoča točen vprijem kronskega zobnika in polža pri ploskem spiralnem gonilu. To dejstvo je največja in neizpodbitna prednost predstavljene metode, ki potrjuje superiornost natančne metode ter dokazuje potencial za praktično uporabo in nadaljnji razvoj v prihodnosti.©2011 Strojniški vestnik. Vse pravice pridržane.Ključne besede: CNC-vrtljive mize, ploska spiralna gonila, oblikovanje ozobja, orodje z enim rezalnim robom, sprememba globine, primerjalna simulacija

Strojniški vestnik - Journal of Mechanical Engineering 57(2011)1, SI 10 Prejeto: 12.02.2010 Sprejeto: 02.12.2010
*Naslov avtorja za dopisovanje: Univerza v Novem Sadu, Tehniška fakulteta Trg D. Obradovića 6, Novi Sad, Srbija, [email protected] 10
Analiza dejavnikov razvoja proizvodnega in storitvenega podjetja: strateški pristop
Jelena Borocki* - Ilija Ćosić – Bojan Lalić – Rado MaksimovićUniverza v Novem Sadu, Fakulteta tehniških znanosti,
Oddelek za industrijski inženiring in management, Srbija
Prispevek obravnava ključne dejavnike razvoja proizvodnih in storitvenih podjetij s spremenjeno analizo SPACE, z namenom ugotavljanja morebitnih razlik oz. podobnosti. V raziskavo so bila vključena podjetja iz Republike Srbije, Črne gore ter Bosne in Hercegovine. Raziskava je bila osredotočena na ugotavljanje možnih razlik v dojemanju stabilnosti in ravni razvoja izbrane regije.
Raven razvoja podjetja je v veliki meri odvisna od dejavnikov zunanjega in notranjega okolja podjetja. Pri raziskavi smo uporabili spremenjeno analizo SPACE. Osnovni model analize SPACE je model vrednotenja strateškega položaja in delovanja (Rowe et al, 1994) in je namenjen analizi konkurenčnega položaja podjetja. Vključuje štiri osnovne dimenzije za analizo zunanjega in notranjega okolja: stabilnost okolja, moč industrije, finančno in konkurenčno moč podjetja. Rezultat analize SPACE je grafična predstavitev strateške drže podjetja. Spremenjena analiza SPACE vključuje: večje število dejavnikov/kazalnikov (s čimer je vprašalnik prilagojen tako za proizvodna kot za storitvena podjetja), vrednotenje sinergičnih učinkov dejavnikov in izbiro ključnih dejavnikov za boljšo strateško držo podjetja. Opravljena je bila simulacija možne strateške drže v prihodnosti, skupaj s spremembo vrednosti izbranih ključnih dejavnikov, ki bi lahko vplivali na razvoj podjetja v prihodnosti.
Spremenjena analiza SPACE vključuje 81 dejavnikov in indikatorjev. Gre za hierarhično strukturiran model, ki ga uporablja 126 podjetij. Podjetja iz preučevanega vzorca se razlikujejo po velikosti, pravni obliki organizacije, gospodarskem sektorju, lokaciji, dejavnosti in lastništvu. Vsi dejavniki v vprašalniku spremenjene analize SPACE z Likertovo skalo se vrednotijo glede na dva vidika: raven pomena za konkurenčnost podjetja in vrednost dejavnika. Ekipa ljudi, ki je vrednotila vrednost in pomen dejavnikov, je sestavljena iz ključnih ljudi v različnih poslovnih procesih podjetja. Raziskava je potekala tri leta na izbranem ozemlju. V končnem vzorcu subjektov je po izločitvi podjetij in dejavnikov, kjer je manjkalo več kot 5 odstotkov odgovorov, ostalo 116 podjetij za nadaljnjo analizo. Pri izbiri dejavnikov razvoja nas je vodila zahteva, da morajo biti vsi dejavniki vključeni v standardni nabor kazalnikov spremenjene analize SPACE in da lahko podjetje vpliva na njihovo spremembo. Uporabili smo: t-test za nehomogene variance in matriko medsebojnih korelacij.
Ključna razlika med proizvodnimi in storitvenimi podjetji glede izbire ključnih dejavnikov razvoja v notranjem in zunanjem okolju je v tem, da je po mnenju proizvodnih podjetij Stopnja inovativnosti v industriji pomembna za Razvoj izdelkov in Fleksibilnost glede na zahteve strank. Storitvena podjetja pa po drugi strani menijo, da je mnogo notranjih dejavnikov razvoja odvisnih tudi od Ravni tehnologije v industriji. Uporaba spremenjene analize SPACE kaže, da je možno definirati nabor dejavnikov razvoja podjetja, ki je odvisen od istih zunanjih dejavnikov za obe vrsti podjetij.
Omejitve te raziskave se odražajo v naslednjem: dejavniki so bili izbrani samo na osnovi spremenjene analize SPACE, število podjetij v vzorcu je nezadostno, upoštevane niso bile faze življenjskega cikla podjetja in trendi na izbranih trgih itd.
Rezultati raziskave so uporabni za akademske kroge in za prakso, ki lahko bolje definira svoj odnos do ustvarjanja podrobnejšega strateškega načrta prihodnjega razvoja podjetja in izboljša svoje inovacijske dejavnosti za višjo raven konkurenčnosti. Uporabne so tudi značilnosti proizvodnih in storitvenih podjetij iz izbranih držav v razvoju. ©2011 Strojniški vestnik. Vse pravice pridržane.Ključne besede: strateška drža, proizvodna podjetja, storitvena podjetja, korelacije, t-test

Strojniški vestnik - Journal of Mechanical Engineering 57(2011)1, SI 11 Prejeto: 23.05.2008 Sprejeto: 27.09.2010
*Naslov avtorja za dopisovanje: Univerza v Beogradu, Fakulteta za strojništvo, Kraljice Marije 16, 11120 Beograd 35, Srbija, [email protected] SI 11
Nelinearna analiza tankostenskih nosilcev odprtega prereza
Andjelić, N.Nina Andjelić*
Univerza v Beogradu, Fakulteta za strojništvo, Srbija
Glavni namen tega članka je predstaviti pristop k nelinearni analizi tankostenskih nosilcev odprtega prereza. Avtorica je skušala raziskati vpliv uvedbe členov drugega reda na rezultate.
Pri obravnavi tankostenskih nosilcev na srednjici prereza poljubne krivuljne oblike in z zvezno spremenljivo debelino je bil uporabljen princip navideznega dela.
Po klasični linearni teoriji tankostenskih nosilcev odprtega prereza [1], [3] in [4] privzamemo, da so normalne napetosti konstantne po debelini stene in sorazmerne s sektorskimi koordinatami.
Odprti prerezi se običajno analizirajo s pomočjo Vlasovih domnev: deformacijske strižne obremenitve izginejo na srednji površini tankostenskega elementa, deformacija prereza pa je funkcija vrtilnega kota.
Z uporabo principa virtualnega dela [12] in [13] na deformirani konfiguraciji obravnavanega tankostenskega nosilca dobimo poleg šestih običajnih skalarnih enačb dodatno sedmo enačbo, ki vsebuje odvisnosti med bimomentom B, Saint Venantovim momentom M3, deformacijskim momentom Mω in notranjimi silami. Realne lopatice parnih turbin imajo običajno prereze oblik, kot so prikazane na Sliki 2, obravnavati pa jih je treba kot tankostenske prereze, ki nimajo konstantne debeline. Za izračune je bil izbran element spremenjene oblike z enoosno simetrijo prereza (Sl. 3), ki omogoča uporabo izpeljanih enačb in izrazov na elementih, ki imajo podoben prerez kot realne turbinske lopatice. Simetrija elementa seveda vpeljuje poenostavitve uporabljenih izrazov, celoten element pa je bil obravnavan kot vpet na enem koncu in obremenjen s kompleksno obremenitvijo – zvezno porazdeljeno prečno obremenitvijo in momentom po dolžini.
Komponente napetosti, ki se pojavljajo v obravnavanem primeru, so normalne in strižne napetosti zaradi upogibanja in vzvoja. Posebna pozornost je posvečena učinkom omejenega vzvoja ter posledičnim komponentam napetosti, saj so v tem primeru pomembni sekundarni učinki.
Normalne napetosti so sorazmerne sektorski koordinati in omeniti je treba, da je upoštevana sekundarna sektorska koordinata skupaj s posplošenim sektorskim vztrajnostnim momentom, izračunanim po (41).
Strižnih napetosti in še zlasti napetosti zaradi Saint Venantovih momentov ni mogoče zanemariti, zato je bilo treba izračunati ekvivalentno napetost po kriteriju zloma pri maksimalni strižni napetosti (Tresca), (51).
Iz dobljenih rezultatov je možno sklepati, da so razlike med napetostmi s sekundarnimi učinki in napetostmi brez njih signifikantne v območju vpetja in, da se zmanjšujejo proti sredini nosilca.
Kolikor je znano avtorici, so bile enačbe (45) za posplošeni sektorski vztrajnostni moment ter enačbe od (46) do (48) v tem članku izpeljane prvič.
Med seboj so bile primerjane geometrijske veličine, pridobljene z in brez sekundarnih sektorskih koordinat, kakor tudi komponente napetosti v primeru kompleksnih obremenitev. Določene so bile njihove porazdelitve po prerezu in vzdolž elementa za uporabljene enotske obremenitve. Prikazana je bila odvisnost sekundarnih učinkov od dimenzij prereza.©2011 Strojniški vestnik. Vse pravice pridržane.Ključne besede: nelinearen pristop, splošne sektorske koordinate, krivuljni odprti prerezi, tankostenski nosilci, napetosti

Strojniški vestnik - Journal of Mechanical Engineering 57(2011)1, SI 12-13Navodila avtojem
SI 12
Navodila avtorjem
Članke pošljite na naslov:Strojniški vestnik -Journal of Mechanical EngineeringAškerčeva 6, 1000 Ljubljana, SlovenijaTel.: 00386 1 4771 137Faks: 00386 1 2518 567E-mail: [email protected] [email protected]
Članki morajo biti napisani v angleškem jeziku. Strani morajo biti zaporedno označene. Prispevki so lahko dolgi največ 10 strani. Daljši članki so lahko v objavo sprejeti iz posebnih razlogov, katere morate navesti v spremnem dopisu. Kratki članki naj ne bodo daljši od štirih strani.
Navodila so v celoti na voljo v rubriki “Informacija za avtorje” na spletni strani revije: http://en.sv-jme.eu/
Prosimo vas, da članku priložite spremno pismo, ki naj vsebuje:1. naslov članka, seznam avtorjev ter podatke
avtorjev;2. opredelitev članka v eno izmed tipologij; izvirni
znanstveni (1.01), pregledni znanstveni (1.02) ali kratki znanstveni članek (1.03);
3. opredelitev, da članek ni objavljen oziroma poslan v presojo za objavo drugam;
4. zaželeno je, da avtorji v spremnem pismu opredelijo ključni doprinos članka;
5. predlog dveh potencialnih recenzentov, ter kontaktne podatke recenzentov. Navedete lahko tudi razloge, zaradi katerih ne želite, da bi določen recenzent recenziral vaš članek.
OBLIKA ČLANKA
Članek naj bo napisan v naslednji obliki:- Naslov, ki primerno opisuje vsebino članka.- Povzetek, ki naj bo skrajšana oblika članka
in naj ne presega 250 besed. Povzetek mora vsebovati osnove, jedro in cilje raziskave, uporabljeno metodologijo dela, povzetek rezultatov in osnovne sklepe.
- Uvod, v katerem naj bo pregled novejšega stanja in zadostne informacije za razumevanje ter pregled rezultatov dela, predstavljenih v članku.
- Teorija.
- Eksperimentalni del, ki naj vsebuje podatke o postavitvi preskusa in metode, uporabljene pri pridobitvi rezultatov.
- Rezultati, ki naj bodo jasno prikazani, po potrebi v obliki slik in preglednic.
- Razprava, v kateri naj bodo prikazane povezave in posplošitve, uporabljene za pridobitev rezultatov. Prikazana naj bo tudi pomembnost rezultatov in primerjava s poprej objavljenimi deli. (Zaradi narave posameznih raziskav so lahko rezultati in razprava, za jasnost in preprostejše bralčevo razumevanje, združeni v eno poglavje.)
- Sklepi, v katerih naj bo prikazan en ali več sklepov, ki izhajajo iz rezultatov in razprave.
- Literatura, ki mora biti v besedilu oštevilčena zaporedno in označena z oglatimi oklepaji [1] ter na koncu članka zbrana v seznamu literature.
Enote - uporabljajte standardne SI simbole in okrajšave. Simboli za fizične veličine naj bodo v ležečem tisku (npr. v, T, n itd.). Simboli za enote, ki vsebujejo črke, naj bodo v navadnem tisku (npr. ms-1, K, min, mm itd.)
Okrajšave naj bodo, ko se prvič pojavijo v besedilu, izpisane v celoti, npr. časovno spremenljiva geometrija (ČSG).
Pomen simbolov in pripadajočih enot mora biti vedno razložen ali naveden v posebni tabeli na koncu članka pred referencami.
Slike morajo biti zaporedno oštevilčene in označene, v besedilu in podnaslovu, kot sl. 1, sl. 2 itn. Posnete naj bodo v ločljivosti, primerni za tisk, v kateremkoli od razširjenih formatov, npr. BMP, JPG, GIF. Diagrami in risbe morajo biti pripravljeni v vektorskem formatu, npr. CDR, AI.
Vse slike morajo biti pripravljene v črno-beli tehniki, brez obrob okoli slik in na beli podlagi. Ločeno pošljite vse slike v izvirni obliki Pri označevanju osi v diagramih, kadar je le mogoče, uporabite označbe veličin (npr. t, v, m itn.). V diagramih z več krivuljami, mora biti vsaka krivulja označena. Pomen oznake mora biti pojasnjen v podnapisu slike.
Tabele naj imajo svoj naslov in naj bodo zaporedno oštevilčene in tudi v besedilu poimenovane kot Tabela 1, Tabela 2 itd.. Poleg fizikalne veličine, npr t (v ležečem tisku), mora biti v oglatih oklepajih navedena tudi enota. V tabelah naj se ne podvajajo podatki, ki se nahajajo v besedilu.
Strojniški vestnik - Journal of Mechanical Engineering 57(2011)1, SI 12-13
SI 13
Potrditev sodelovanja ali pomoči pri pripravi članka je lahko navedena pred referencami. Navedite vir finančne podpore za raziskavo.
REFERENCE
Seznam referenc MORA biti vključen v članek, oblikovan pa mora biti v skladu s sledečimi navodili. Navedene reference morajo biti citirane v besedilu. Vsaka navedena referenca je v besedilu oštevilčena s številko v oglatem oklepaju (npr. [3] ali [2] do [6] za več referenc). Sklicevanje na avtorja ni potrebno.
Reference morajo biti oštevilčene in razvrščene glede na to, kdaj se prvič pojavijo v članku in ne po abecednem vrstnem redu. Reference morajo biti popolne in točne. Vse neangleške oz. nenemške naslove je potrebno prevesti v angleški jezik z dodano opombo (in Slovene) na koncu Navajamo primere:Članki iz revij:Priimek 1, začetnica imena, priimek 2, začetnica imena (leto). Naslov. Ime revije, letnik, številka, strani.[1] Zadnik, Ž., Karakašič, M., Kljajin, M.,
Duhovnik, J. (2009). Function and Functionality in the Conceptual Design Process. Strojniški vestnik – Journal of Mechanical Engineering, vol. 55, no. 7-8, p. 455-471.
Ime revije ne sme biti okrajšano. Ime revije je zapisano v ležečem tisku. Knjige:Priimek 1, začetnica imena, priimek 2, začetnica imena (leto). Naslov. Izdajatelj, kraj izdaje[2] Groover, M. P. (2007). Fundamentals of Modern
Manufacturing. John Wiley & Sons, Hoboken.Ime knjige je zapisano v ležečem tisku. Poglavja iz knjig:Priimek 1, začetnica imena, priimek 2, začetnica imena (leto). Naslov poglavja. Urednik(i) knjige, naslov knjige. Izdajatelj, kraj izdaje, strani. [3] Carbone, G., Ceccarelli, M. (2005). Legged
robotic systems. Kordić, V., Lazinica, A., Merdan, M. (Eds.), Cutting Edge Robotics. Pro literatur Verlag, Mammendorf, p. 553-576.
Članki s konferenc:Priimek 1, začetnica imena, priimek 2, začetnica imena (leto). Naslov. Naziv konference, strani.[4] Štefanić, N., Martinčević-Mikić, S., Tošanović,
N. (2009). Applied Lean System in Process Industry. MOTSP 2009 Conference Proceedings, p. 422-427.
Standardi:Standard (leto). Naslov. Ustanova. Kraj.[5] ISO/DIS 16000-6.2:2002. Indoor Air – Part 6:
Determination of Volatile Organic Compounds in Indoor and Chamber Air by Active Sampling on TENAX TA Sorbent, Thermal Desorption and Gas Chromatography using MSD/FID. International Organization for Standardization. Geneva.
Spletne strani:Priimek, Začetnice imena podjetja. Naslov, z naslova http://naslov, datum dostopa.[6] Rockwell Automation. Arena, from http://www.
arenasimulation.com, accessed on 2009-09-27.
RAZŠIRJENI POVZETEK
Ko je članek sprejet v objavo, avtorji pošljejo razširjeni povzetek na eni strani A4 (približno 3.000 - 3.500 znakov). Navodila za pripravo razširjenega povzetka so objavljeni na spletni strani http://sl.sv-jme.eu/informacije-za-avtorje/.
AVTORSKE PRAVICE
Avtorji v uredništvo predložijo članek ob predpostavki, da članek prej ni bil nikjer objavljen, ni v postopku sprejema v objavo drugje in je bil prebran in potrjen s strani vseh avtorjev. Predložitev članka pomeni, da se avtorji avtomatično strinjajo s prenosom avtorskih pravic SV-JME, ko je članek sprejet v objavo. Vsem sprejetim člankom mora biti priloženo soglasje za prenos avtorskih pravic, katerega avtorji pošljejo uredniku. Članek mora biti izvirno delo avtorjev in brez pisnega dovoljenja izdajatelja ne sme biti v katerem koli jeziku objavljeno drugje.
Avtorju bo v potrditev poslana zadnja verzija članka. Morebitni popravki morajo biti minimalni in poslani v kratkem času. Zato je pomembno, da so članki že ob predložitvi napisani natančno.
Avtorji lahko stanje svojih sprejetih člankov spremljajo na http://en.sv-jme.eu/.
PLAČILO OBJAVE
Domači avtorji vseh sprejetih prispevkov morajo za objavo plačati prispevek, le v primeru, da članek presega dovoljenih 10 strani oziroma za objavo barvnih strani v članku, in sicer za vsako dodatno stran 20 EUR ter dodatni strošek za barvni tisk, ki znaša 90,00 EUR na stran.

Strojniški vestnik - Journal of Mechanical Engineering 57(2011)1, SI 14-17Osebne objave
SI 14
Doktorati, magisterij in diplome
DOKTORATI
Na Fakulteti za strojništvo Univerze v Ljubljani je z uspehom obranil svojo doktorsko disertacijo:
dne 21. decembra 2010 Marko Sedlaček z naslovom: »Vpliv topografije na tribološke lastnosti kontaktnih površin« (mentor: izr. prof. dr. Bojan Podgornik, somentor: prof. dr. Jožef Vižintin);
Ena od zelo pomembnih lastnosti površine je njena hrapavost oz. topografija ter vpliv le-te na trenje in obrabo. To pomeni, da je za pravilno konstruiranje kontaktnih površin potrebno poznati povezavo med parametri hrapavosti površine in njenim tribološkim obnašanjem.
Z namenom določiti tako pomembne parametre hrapavosti, ki vplivajo na tribološke lastnosti kontaktnih površin, kakor tudi na njihovo medsebojno korelacijo, smo izdelali serijo preizkusov, s katerimi smo ugotovili, da lahko parametra hrapavosti Rku in Rsk uporabimo kot smernici pri načrtovanju topografije površine za doseganje manjšega trenja. Z uporabo različnih stopenj in vrst mehanskih obdelav preizkušancev smo ugotovili, da se z ugodnim tribološkim obnašanjem odrazijo površine, ki imajo čim nižjo vrednost parametra hrapavosti Rsk in čim višjo vrednost Rku.
S pomočjo virtualnega obličenja površin smo nadalje preučili vpliv različnih parametrov obličenja na parametre hrapavosti. Rezultati so pokazali, da se z večanjem razmika med utori in ožanjem utorov doseže nižje vrednosti Rsk in višje vrednosti Rku. Ta dognanja smo s pomočjo laserskega obličenja površin preizkusili na jeklenih preizkušancih ter potrdili, da se veliki razmiki med utori in manjša širina utorov odrazijo v nižjih vrednostih parametra hrapavosti Rsk in višjih vrednostih Rku ter posledično tudi v boljših triboloških lastnostih.
*
Na Fakulteti za strojništvo Univerze v Mariboru je z uspehom obranila svojo doktorsko disertacijo:
dne 29. novembra 2010 Maja BAUMAN z naslovom: »Površinska modifikacija nanofiltracijskih membran z alkoksisilani za odstranjevanje ionov težkih kovin« (mentor: prof. dr. aleksandra lobnik);
Ioni težkih kovin, kot so Zn2+, Cd2+, Pb2+, Ni2+, Cu2+, Mn2+, Hg2+, Co2+, al3+, Fe3+, Cr6+,… največkrat končajo v okolju kot posledica izpustov industrijskih odpadnih vod. Povzročajo onesnaženost tal in površinskih voda ter zaradi ekotoksikoloških lastnosti posledično vplivajo na zdravje živih organizmov. Njihovo odstranjevanje z membranskimi tehnologijami s pomočjo ustrezne nanofiltracijske (NF) membrane je sicer učinkovito, vendar učinkovitost NF membran, zlasti tistih, ki so trenutno dostopne na trgu, zaradi lastnosti materiala in procesa iz katerega so izdelane, variira. Površinska modifikacija membran z alkoksisilanskimi prekurzorji po sol-gel postopku v smislu dodatnega površinskega nanosa lahko dodatno stabilizira membrano, predvsem pa izboljša selektivno odstranjevanje specifičnih težkih kovin zaradi steričnih ovir, elektrosteričnih lastnosti in funkcionalnih skupin z afiniteto do ionov težkih kovin nanesenih na površino membrane. V okviru raziskav je bila izvedena osnovna karakterizacija izbrane tanko slojne kompozitne NF membrane (NF2, Sepro Inc.). Po sol-gel postopku pripravljeni soli, uporabljeni za nanos na membrano, so vsebovali čiste komponente in mešanice alkoksisilanskih prekurzorjev tetraetoksisilana (TeOS), 3-(trimetoksisililpropil)dietilentriamina (deTa), 3-(merkaptopropil)trimetoksisilana (MPTMS), v molarnih razmerjih voda:prekurzor (r525, r264 in r175) in kombinacije prekurzorjev v razmerjih 1:1; 1:2, 1:4; 2:1 in 4:1, in sicer v alkalnem in kislem pH mediju (~4,5 in ~10), v času od 1 do 14 ur in temperaturah od 25 do 50 °C. lastnosti pripravljenih solov in modificiranih membran so bile ovrednotene z različnimi karakterizacijskimi metodami. Namen osnovnih raziskav je bil preučiti vpliv parametrov priprave in nanosa sol-gela (tip in koncentracija sol-gel prekurzorja, katalizator, molsko razmerje voda:prekurzor, staranje sola, čas priprave sola) na končno mikrostrukturo površinske modifikacije. Karakterizacija sol-gel alkoksidnih materialov in površinskega sloja obdelanih membran je podlaga za podatke o parametrih, ki vplivajo na učinek zadrževanja ionov težkih kovin (Zn2+, Cd2+, Hg2+, Pb2+). Površinsko modificirane membrane z najboljšim sol-gel nanosom so bile testirane v smislu učinkovitosti odstranjevanja ionov težkih kovin in modelnih vod pri različnih filtracijskih pogojih. Iz rezultatov filtracije je razvidno, da je karakterizacija
Strojniški vestnik - Journal of Mechanical Engineering 57(2011)1, SI 14-17
SI 15
nemodificirane, komercialno dostopne tankoplastne kompozitne nanofiltracijske membrane kot njeno pomanjkljivost pokazala nestabilno strukturo in nihajoče rezultate v zadrževanju ionov in molekul različnih velikosti in mas. Z izbranimi alkosisilanskimi prekurzorji (TEOS, DETA in MPTMS) je iz sol-gela z optimizacijo pogojev sinteze in sestave sola moč formirati funkcionalne delce z afiniteto do membrane in ionov težkih kovin ter iz njih tvoriti funkcionalen in obstojen monoplastni nanos na izbrano membrano. Rezultati kažejo, da je površinska modifikacija NF membran lahko učinkovita v smislu selektivnega zadrževanja ionov težkih kovin, predvsem zadrževanje Hg2+ in Pb2+ ionov se izboljša z uporabo kombinacije prekurzorjev TEOS:MPTMS in TEOS:DETA v razmerju 1:1 in temperaturi 50 °C, ter TeOS-a z r525 pri sobni temperaturi.
Z eksperimenti filtracije na pilotni filtracijski napravi je bilo dokazano, da je z modifikacijo membrane v smislu nanosa dodatne funkcionalne plasti, formirane iz delcev izbranih alkosisilanskih prekurzorjev po metodi sol-gel možno bistveno (za več kot 100% za Hg2+ in za do 10% za Pb2+) izboljšati selektivnost in stabilnost strukture izbrane nanofiltracijske membrane.
Obsežno eksperimentalno delo, katerega rezultati so spremljani in dokazani s premišljeno izbranimi analiznimi metodami (SEM/TEM/EDXS mikroskopija; aTR-FTIR spektroskopija, meritve zeta potenciala koloidov; atomska absorpcijska spektroskopija), dajejo veliko možnosti za nadaljnje raziskave in izboljšave. Modifikacije površin TFC membran predstavljajo izvirni doprinos k novi razvojni perspektivi na področju materialov za izdelavo membran.
MAGISTRSKA DELA
Na Fakulteti za strojništvo Univerze v Ljubljani je z uspehom zagovarjal svoje magistrsko delo:
dne 15. decembra 2010 Jure VETRšEK z naslovom: »Modeliranje daljinskih sistemov z razpršenimi obnovljivimi viri toplote« (mentor: prof. dr. Sašo Medved).
*
Na Fakulteti za strojništvo Univerze v Mariboru sta z uspehom zagovarjala svoje magistrsko delo:
dne 10. decembra 2010 Matej LESKOVAR z naslovom: »Model projektnega inženiringa razvoja softvera in optimiranje poslovnih procesov pri naprednem vzdrževanju objektov« (mentor: prof. dr. Andrej Polajnar).
dne 10. decembra 2010 Renata šTUMBERGER z naslovom: »Model pretoka materiala v proizvodnji« (mentor: prof. dr. Andrej Polajnar).
DIPLOMIRALI SO
Na Fakulteti za strojništvo Univerze v Ljubljani so pridobili naziv univerzitetni diplomirani inženir strojništva:
dne 22. decembra 2010:Blaž Osterman z naslovom: »Preventivno
vzdrževanje orodij za brizganje termoplastov« (mentor: prof. dr. Jožef Vižintin);
aljaž Rogelj z naslovom: »analiza toka vrednosti - element vitke proizvodnje« (mentor: prof. dr. Marko Starbek, somentor: doc. dr. Janez kušar);
David Volk z naslovom: »Konceptualna rešitev aktivnega tečaja pokrova motorja vozila« (mentor: doc. dr. Jernej Klemenc, somentor: prof. dr. Matija Fajdiga);
Jure Zagorc z naslovom: »Sistem za testiranje malih gospodinjskih aparatov « (mentor: izr. prof. dr. Peter Butala);
dne 23. decembra 2010:dejan Cepič z naslovom: »Primerjava
tehnologij za sočasno proizvodnjo električne energije in toplote iz lesne biomase« (mentor: prof. dr. Alojz Poredoš, somentor: doc. dr. andrej kitanovski);
Primož keržič z naslovom: »Modeliranje in simulacija termoelektričnih generatorjev za rekuperacijo odpadne toplote v tovornih vozilih« (mentor: prof. dr. alojz Poredoš);
Primož Mravlje z naslovom: »Razvoj in vrednotenje krmilnega modula potnega ventila« (mentor: prof. dr. Marko Nagode);
Dejan Poljanec z naslovom: »Temperaturne obremenitve zobnikov iz polimernih materialov« (mentor: prof. dr. Mitjan kalin);
Jure Žagar z naslovom: »Vračanje toplote zavrženega zraka pri kompaktnih klimatskih napravah« (mentor: prof. dr. Vincenc Butala);
dne 24. decembra 2010:Miha Kumer z naslovom: »Analiza
primernosti vpeljave visokohitrostnega brušenja rezilnih pestičev« (mentor: doc. dr. Peter krajnik, somentor: prof. dr. Janez kopač);

Strojniški vestnik - Journal of Mechanical Engineering 57(2011)1, SI 14-17
SI 16
Primož lipar z naslovom: »Razvoj in izdelava sistema za identifikacijo virov hrupa« (mentor: prof. dr. Mirko čudina, somentor: doc. dr. Jurij Prezelj);
davor Šterk z naslovom: »Vpliv akustične kavitacije na prenos toplote« (mentor: prof. dr. Mirko čudina, somentor: doc. dr. Jurij Prezelj);
dne 28. decembra 2010:Matevž artač z naslovom: »Vodni udar v
tlačnem cevovodu« (mentor: prof. dr. Branko Širok, somentor: izr. prof. dr. anton Bergant);
Marko Cuderman z naslovom: »analiza enoslojnih in dvoslojnih navarov pri laserskem varjenju in pri varjenju TIG« (mentor: prof. dr. Janez Tušek);
Matej čubej z naslovom: »Varjenje okrova zaganjalnika po postopku EPP« (mentor: prof. dr. Janez Tušek);
Primož Prhavc z naslovom: »advekcijska vizualizacijska metoda« (mentor: prof. dr. Branko širok, somentor: doc. dr. Tom Bajcar).
*
Na Fakulteti za strojništvo Univerze v Mariboru so pridobili naziv univerzitetni diplomirani inženir strojništva:
dne 16. decembra 2010:Jaka Jurečič z naslovom: »Sledilnik sonca«
(mentor: doc. dr. Aleš Belšak, somentor: izr. prof. dr. Miran Ulbin);
Sanja Kotar z naslovom: »Projekt razvoja sokovnika delujočega na principu wanklovega motorja« (mentor FS: doc. dr. Iztok Palčič, mentor ePF: prof. dr. anton Hauc);
Gorazd Kozic z naslovom: »Primerjava nekonvencionalnih termičnih obdelovalnih postopkov« (mentor FS: izr. prof. dr. Miran Brezočnik, mentor ePF: prof. dr. duško Uršič);
Gregor Makovec z naslovom: »Priprava navodil in načrt marketinških aktivnosti za mostna dvigala v podjetju Metalna SRM d.o.o.« (mentor FS: doc. dr. Iztok Palčič, mentorica PF: doc. dr. aleksandra Pisnik korda);
Ivan Žižek z naslovom: »Oblikovanje priklopnika za transport jadralnih letal« (mentor: izr. prof. Vojmir Pogačar);
Franci Žižek z naslovom: »Zasnova ekspertnega sistema za inženirsko oblikovanje« (mentor: izr. prof. dr. Bojan Dolšak, somentor: izr. prof. Vojmir Pogačar);
dne 21. decembra 2010:Gregor Mandl z naslovom: »določanje
lastnosti tvp zvarov in ocena stroškov pri varjenju« (mentor FS: izr. prof. dr. Vladimir Gliha, somentor FS: doc. dr. Janez Kramberger, mentorica EPF: prof. dr. Majda Bastič).
*
Na Fakulteti za strojništvo Univerze v ljubljani so pridobili naziv diplomirani inženir strojništva:
dne 8. decembra 2010:Manca Duler z naslovom: »Zagotavljanje
kakovosti v manjšem družinskem podjetju« (mentor: prof. dr. Mirko Soković);
Marko kozmus z naslovom: »Homologacijski pogoji za osebna vozila in starodobnike v Sloveniji« (mentor: prof. dr. Matija Fajdiga, somentor: doc. dr. Jernej klemenc);
dne 10. decembra 2010:Izidor Benčina z naslovom: »lasersko
varjenje z različnimi premeri varilnih žic« (mentor: prof. dr. Janez Tušek);
Simon Dobaj z naslovom: »Zasnova hidravličnega sistema podajalnika lokov v premogovniku« (mentor: doc. dr. Niko Herakovič);
Klemen Zorc z naslovom: »Razvoj robotskega manipulatorja s tremi prostostnimi stopnjami za dvigovanje srednje težkih bremen« (mentor: doc. dr. Niko Herakovič, somentor: doc. dr. leon Žlajpah);
damjan Zupančič z naslovom: »Ogljični odtis izdelka« (mentor: prof. dr. Iztok Golobič);
dne 13. decembra 2010:Uroš klemenčič z naslovom: »Vizualizacija
tokovnega polja v vstopnem kanalu črpališča« (mentor: prof. dr. Branko širok, somentor: doc. dr. Tom Bajcar);
Boštjan Rener z naslovom: »Izdelava grafitnih elektrod za elektro erozijo« (mentor: prof. dr. Janez kopač);
anže Žakelj z naslovom: »Hidravlični ventili za vgradnjo na in v krmilne bloke« (mentor: doc. dr. Jožef Pezdirnik);
alen Žolgar z naslovom: »Spremljanje kakovosti hladilno mazalne tekočine« (mentor: prof. dr. Janez kopač);
dne 22. decembra 2010:Lovro Blatnik z naslovom: »Izboljšanje
tehnološkega postopka izdelave Skodelice nad vzmetjo« (mentor: prof. dr. Mirko Soković);

Strojniški vestnik - Journal of Mechanical Engineering 57(2011)1, SI 14-17
SI 17
Damjan Drašler z naslovom: »Zgodovinski razvoj ogrevanja, hlajenja in prezračevanja stavb« (mentor: prof. dr. Vincenc Butala);
Matej Redling z naslovom: »Preprečevanje nastanka eksplozivne atmosfere v reaktorski posodi« (mentor: doc. dr. Boris Jerman);
dne 24. decembra 2010:Klemen Gorenc z naslovom: »Razvoj naprave
za prelaganje keramičnih substratov« (mentor: doc. dr. Samo Zupan, somentor: prof. dr. Ivan Prebil);
Matjaž Smerdel z naslovom: »Obvladovanje deformacij pri injekcijskem brizganju termoplastov« (mentor: prof. dr. karl kuzman);
Miha Šteger z naslovom: »Hladilno-mazalne tekočine, vzdrževanje in ekološka sanacija« (mentor: prof. dr. Janez kopač);
Vasja Tominec z naslovom: »Vpliv parametrov lepljenja na trdnostne lastnosti spoja« (mentor: izr. prof. dr. Roman Šturm);
Jan Tomšič z naslovom: »CNC programiranje s programskim paketom HYPeRMIll« (mentor: prof. dr. Janez kopač).
*
Na Fakulteti za strojništvo Univerze v Mariboru so pridobili naziv diplomirani inženir strojništva:
dne 16. decembra 2010:Janko Vodišek z naslovom: »Kontrola
kvalitete izdelave zvarnih spojev pri preskušanju varilcev in varilnih postopkov« (mentor: izr. prof. dr. Bojan ačko);
darko Magdič z naslovom: »Modeliranje in izdelava linije za montažo bivalnih enot« (mentor: izr. prof. dr. Miran Brezočnik, somentor: prof. dr. Jože Balič);
Živko Jeseničnik z naslovom: »Razvoj robotskih celic za izdelavo vzglavnikov« (mentor: izr. prof. dr. Stanislav Pehan);
aleksander Volf z naslovom: »Skladiščno poslovanje v informacijskem sistemu SAP« (mentor: izr. prof. dr. Miran Brezočnik, somentor: izr. prof. dr. Borut Buchmeister);
Stanislav Toporiš z naslovom: »avtomatizacija beleženja podatkov s programom labview« (mentor: doc. dr. darko lovrec);
Blaž Jelen z naslovom: »Pregled in analiza sodobnih preoblikovalnih strojev za rezanje in upogibanje« (mentor: izr. prof. dr. Ivan Pahole);
Mario Faršang z naslovom: »Rekonstrukcija pnevmatične tlačne mreže« (mentor: doc. dr. darko lovrec);
denis Žitek z naslovom: »Računalniško podprt razvoj roke nakladalnika« (mentorica: viš. pred. dr. Marina Novak, somentor: izr. prof. dr. Bojan Dolšak).

Strojniški vestnik - Journal of Mechanical Engineering 57(2011)1, SI 18-20List of reviewers
SI 18
List of reviewers who reviewed manuscripts in 2010
Ačko Bojan, SloveniaAlbers Albert, GermanyAlfirević Ivo, CroatiaAvsec Jurij, Slovenia
Bachert Bernd, GermanyBajsić Ivan, SloveniaBalič Jože, Slovenia
Barišič Branimir, CroatiaBartlett Wade, USA
Batista Milan, SloveniaBergant Anton, SloveniaBiluš Ignacijo, Slovenia
Bína Jan, Czech RepublicBjorklund Stefan, Sweden
Bohemia Erik, UKBois Els Du, NetherlandBoltežar Miha, Slovenia
Bombek Gorazd, SloveniaBordeasu Ilare, Romania
Bordinassi Claudio, BrazilBorštnik-Bračič Anamarija, Slovenia
Brezočnik Miran, SloveniaBroek Johan, The Netherlands
Brunčko Mihael, SloveniaBuchmeister Borut, Slovenia
Busse Gerd, GermanyButala Peter, SloveniaCajner Franjo, Croatia
Canale, Lauralice C. F., BrazilCar Zlatan, CroatiaCiulli Enrico, Italy
Colak Oguz, TurkeyColas Rafael, Mexico
Csoban Attila, HungaryCvetićanin Livija, Serbia
Čep Robert, Czech RepublicČopič Martin, Slovenia
Črepinšek-Lipuš Lucija, SloveniaČuš Franc, Slovenia
Danzl Reinhard, Austria
Davim Paolo, PortugalDe Wilde Pieter, UK
Dereli Turkay, TurkeyDiaci Janez, SloveniaDikici Burak, TurkeyDjordević Boro, USA
Dobmann Gerd, GermanyDolinšek Slavko, Slovenia
Drev Darko, SloveniaDuffy Alex, UK
Duhovnik Jože, SloveniaEichlseder Wilfried, Austria
Emri Igor, SloveniaFajdiga Matija, Slovenia
Felde Imre, HungaryFlašker Jože, Slovenia
Forte Paola, ItalyFranković Bernard, Croatia
Gaied Imen, TunisiaGajić Zoran, USAGao Liang, China
Gečevska Valentina, MacedoniaGermani Michele, Italy
Gerritsen Bart, NetherlandGordon R. Pennock, USAGovekar Edvard, SloveniaGregl Dominik, Slovenia
Gregor-Svetec Diana, SloveniaGrimberg Raimond, RomaniaGrubišić Vatroslav, Germany
Grum Janez, SloveniaGubeljak Nenad, Slovenia
Gusel Leo, SloveniaHackenschmidt Reinhard, Germany
Herakovič Niko, SloveniaHerbert Danninger, Austria
Hlavač Libor, Czech RepublicHlebanja Gorazd, SloveniaHoglund Gunnel, SwedenHogmark Sture, Sweden

Strojniški vestnik - Journal of Mechanical Engineering 57(2011)1, SI 18-20
SI 19
Horvath Imre, HungaryHribernik Aleš, Slovenia
Hriberšek Matjaž, SloveniaHu Youmin, China
Hulin Huang, ChinaHurley David, USAImrak Erden, Turkey
Iqbal Atif, QatarIsik Yahya, Turkey
Jacobson Staffan, SwedenJenko Marjan, SloveniaJerman Boris, SloveniaJohn Peddieson, USA
Jovišević Vid, BIHJunkar Mihael, SloveniaJuričić Đani, Slovenia
Juzėnas Kazimieras , LithuaniaKabelac Stephan, Germany
Kalin Mitjan, SloveniaKalz Doreen, Germany
Kamnik Roman, SloveniaKampuš Zlatko, Slovenia
Kariž Zoran, SloveniaKasper Markus , SwisseKastrevc Mitja, Slovenia
Katrašnik Tomaž, SloveniaKatrašnik, Tomaž, Slovenia
Kawanda Yusuke, UKKegl Marko, SloveniaKek Tomaž, Slovenia
Klemenc Jernej, SloveniaKline Mihael, SloveniaKnežević Jezdimir, UK
Kocanda Andrzej, PolskaKoelman Herbert, NetherlandKooijman Adrie, Netherland
Kopač Janez, SloveniaKopček Michal, Slovakia
Kosel Tadej, SloveniaKovač Jernej, Slovenia
Kovačević Dušan, SerbiaKozak Dražan, Croatia
Kramar Davorin, SloveniaKramar Janez, Slovenia
Krizbergs Juris, LatviaKrsmanović Cvijan, Serbia
Kurić Ivan, SlovakiaKušar Janez, Slovenia
Kuzman Karl, SloveniaKuzmanović Siniša, Serbia
Langerak Robin, NetherlandLarsson Roland, SwedenLebar Andrej, SloveniaLeber Marjan, Slovenia
Lim Mei Yii, UKLiščić Božidar, Croatia
Liu Huibin, USALojen Gorazd, SloveniaLovrec Darko, Slovenia
Lübben Thomas, GermanyLulić Zoran, Croatia
Mahalec Ivan, CroatiaMajstorović Vidosav, Serbia
Majtorović Vidosav D., SerbiaMarčič Milan, Slovenia
Marjanović Dorian, CroatiaMath Miljenko, Croatia
Matjaž Ramšak, SloveniaMatko Drago, Slovenia
Mazal Pavel, Czech RepublicMencinger Jure, SloveniaMichaelis Klaus, GermanyMiltenović Vojislav, Serbia
Modic Jurij, SloveniaMook Gerhard, GermanyMožina Janez, Slovenia
Mudronja Vedran, CroatiaNanda Jyotirmaya, USANečas Vladimir, Slovakia
Noh Sang Do, KoreaOanta Emil M., Romania
Ocana Jose L., SpainOgnjanović Milosav, Serbia
Oman Janez, SloveniaOpalić Milan, Croatia
Opiyo Eliab, NetherlandOrbanić Henri, SloveniaPalanikumar K., India

Strojniški vestnik - Journal of Mechanical Engineering 57(2011)1, SI 18-20
SI 20
Palčič Iztok, SloveniaPar Vjekoslav, Croatia
Parmar Vikram, NetherlandPatte Rouland Beatrice , France
Pehan Stanislav, SloveniaPeszynski Kazimierz, Poland
Petelin Stojan, SloveniaPetrišič Peter, Slovenia
Podgornik Bojan, SloveniaPodržaj Primož, SloveniaPopović Vladimir, SerbiaPoredoš Alojz, Slovenia
Potočnik Primož, SloveniaPotrč Iztok, SloveniaPrasad Brian, USA
Prassianakis Ioanis, GreecePrebil Ivan, Slovenia
Predin Andrej, SloveniaPušenjak Rudi, SloveniaRavnik Jure, Slovenia
Rebolj Danijel, SloveniaRech Joel, France
Reinhart Gunther, GermanyReinoso Garcia, Oscar, Spain
Ren Zoran, SloveniaRojko Andreja, Slovenia
Rosso Mario, ItalyRuiz Oscar, ColombiaSadat Abdul B., USASakić Nikola, CroatiaSantos M. J., Portugal
Sauls Jack, USASchaller Jeffrey , USA
Scholtes Berthold, GermanySchouecker, Austria
Schreiber Peter, SlovakiaSedenkov Vladimir, BelarusSekavčnik Mihael, Slovenia
Semenski Damir, CroatiaShimomura Yoshiki, Japan
Sladić Saša, CroatiaSlavič Janko, SloveniaSluga Alojzij, Slovenia
Soković Mirko, SloveniaSpentzas Constantinos, Greece
Stanković Tino, CroatiaStoić Antun, Croatia
Svoljšak-Jerman Marta, SloveniaŠirok Branko, Slovenia
Štefanić Nedeljko, CroatiaŠtok Boris, Slovenia
Šturm Roman, SloveniaTakakuwa Someon, JapanTrenc Ferdinand, Slovenia
Tušek Janez, SloveniaUdiljak Toma, CroatiaUlaga Samo, SloveniaUlbin Miran, Slovenia
Unigovski Yakov, IsraelValdeci Donizete Gonçalves, Brazil
Vallianatos Filippos, GreeceVelagić Jasmin, BIH
Vesenjak Matej, SloveniaVeža Ivica, CroatiaVilar Rui, Portugal
Violeau Damien, FranceVižintin Jože, SloveniaVlahinić Saša, Croatia
Vujica Herzog Natasa, SloveniaXu Cuang Wen, China
Zhu Dan, ChinaZovak Goran, Croatia
Žavbi Roman, SloveniaŽun Iztok, Slovenia
Župerl Uroš, Slovenia
The Editorial would like to thank all the reviewers in participating in reviewing process. We appreciate the time and effort and greatly value the assistance as a manuscript reviewer for
Strojniški vestnik – Journal of Mechanical Engineering.

no. 1year 2011
volume 57Jour
nal o
f Mec
hani
cal E
ngin
eeri
ng -
Str
ojni
ški v
estn
ik57
(201
1) 1
Since 195557 (2
011)
1