journal of management & development...
TRANSCRIPT

Published by
Mid- Baneshwor, Kathmandu, NepalTel: 977-1-4488312 | 4475254 | Fax: 977-1-4472083
Email: [email protected] | URL: www.globalcollege.edu.np
(Tribhuvan University Affiliate)
Journal of Management & Development EconomicsApril 2015 Vol. 4 Issue No. 1 ISSN 2392-4551
A Peer Reviewed Journal
Chief EditorProf. Radhe S. Pradhan
Managing EditorDr. Khagendra P. Ojha
Executive EditorMr. Dev Raj Paneru
EditorsMr. Achyut GyawaliMr. Damaru PoudelMr. Santosh Poudel
Advisory BoardProf. Dr. Prem Raj PantProf. Dr. Puskar BajracharyaDr. Tilak RawalProf. Dr. Ajaya Bikram SthapitDr. Manish ThapaDr. Nar Bahadur Bista
Peer Reviewed byProf. Dr. Prem. R. PantProf. Dr. Radheshyam PradhanMr. Dev Raj PaneruMr. Santosh Poudel
Publishing TeamMr. Nabraj BhandariMr. Tulashi Ram ShresthaMr. Baburam Subedi
Design & LayoutDev Nandan Chaudhary
Journal of Management & Development EconomicsApril 2015 Vol. 4 Issue No. 1 ISSN 2392-4551

EditorialJournal of management and development economics is purely an official publication of GlobalCollege of Management, Tribhuvan University Affiliate, located at Mid Baenshwor Kathmandu.The journal is published annually as a regular research publication in April or May. It is not-for profit- publication of the college aimed to promote research and learning activities amongthe college faculties, researchers, university professors and graduate and undergraduate studentsand personnel in administrative positions involved jointly or individually in research ventures;academic or professional, though academic researchers are prioritized. As obvious from thetitle of the journal, mainly the research based; primary and secondary data based articles;qualitative or quantitative but exclusively from the field of management and economics areaccepted for publication.
The journal is the institutional property of Global College of Management and hence, publishingof the journal is solely in the responsibility of the research committee working as the steeringcommittee for the College's Quality Assurance and Accreditation (QAA) department formedin response to the college's commitment as an applicant institution to the QAA indictorsassigned by the University Grants Commission Nepal (The college has entered into the formalprocess for QAA from UGC, Nepal starting from 2013).
The articles published in this journal in all its issues are from economics, finance, and generalmanagement areas and some of the articles are secondary data based whereas others primary.The articles were assigned for peer review to the professors and practitioners in their respectivefield, amendments were recommended followed by editing corrections ensured before theywere processed in this journal as far as possible.
However, the editorial team does not bear responsibility for any incongruences in contentsand patterns presented in the articles as they are purely the products of their authors and hence,the authors are subject to ethical interrogations in the circumstances that are marked to violateethical parameters applicable in the field of academics and research. The articles have been arranged in alphabetical order of the authors' name. Concisely thepurpose of each article has been attached briefed here:
The first article by Achyut Gyanwali titled Influence of Corporate Income Tax on Debt-Financing: Evidence from Nepalese Manufacturing Companies aims at assessing the relationshipbetween corporate income tax and debt-equity mix, and estimate the influence of corporateincome tax on debt financing of the manufacturing companies of Nepal. The purpose of thearticle titled An Analysis of Electricity Consumption in Industrial Sector of Nepal by BholaNath Ghimire is to derive and estimate a consumption function for Nepalese indus trialelectricity use, and to investigate changes in consumption pattern over the time period
Journal of Management & Development EconomicsApril 2015 Vol. 4 Issue No. 1 ISSN 2392-4551

1980-1912. Does development of commercial banks spur economic growth? By Dr. DipakBahadur Bhandari and Keshab Acharya examines the degree of relationship and direction ofcausality between the development of commercial banks and economic growth of Nepal.
The article titled Teacher Management and Development in Higher Secondary Education: ACase of Higher Secondary Education Board of Nepal by Dev Raj Paneru qualitatively examineshuman resource management and development practices undertaken to manage and developteachers serving in the schools under HSEB, Nepal. Globalization: A Trozan Horse: Globalizationis a buzzword that has no precise definition by Prof. Dr. Kanhaiya Ram Bhakta Mathemaexamines how Globalization brings in interconnectedness in economic, cultural, and technologicaldomains via expansion in unrestricted trade.
An Analysis of Foreign Employment and Inflow of Remittance in Nepal by Mr. Mani RatnaLamsal examines the migration and inflow of remittance in Nepal. It deals with literaturereview on remittance, the inflow of remittance from various countries, the contribution ofremittance to GDP, consumption and expenditure pattern. Non-financial PerformanceMeasurement Practices in Nepalese Commercial Banks, by Naba Raj Adhikari, examines thenon-financial performance measurement practices in Nepalese commercial banks.
Dividend Policy, Performance, and the Sock Price in Nepal by Dr. Nabaraj Adhikari, aimsat investigating the dividend policy, performance, and the stock price in the pre-emergingcapital market of Nepal employing descriptive cum analytical research. The Cross-Sectionof Expected Stock Returns in Nepal by Prof. Dr. Radhe S. Pradhan aims at examining theability of beta and other company specific factors such as firm size, book to market ratio,sales to price ratio, dividend yield and earning price ratio to explain cross section of stockreturns in Nepal and finally, An Empirical Study on Stock Market, Bank and Economic Growthby Santosh Poudel, examines the relation between economic growth with financial growth.
The editorial team and research committee of the college welcomes all the academic andresearch endeavors to the standard applicable in research and studies in higher education.
Dev Raj PaneruExecutive Editor
Journal of Management and Development EconomicsA peer reviewed journal of Global College of Management
Mid- Baneshwor Kathmandu, Nepal.
Journal of Management & Development EconomicsApril 2015 Vol. 4 Issue No. 1 ISSN 2392-4551

NotesArticles are subject to editorial review by referees from the community of management andeconomics experts. Comments or notes regarding articles are welcome and will be consideredfor publication to the extent possible. The opinions and the interpretations expressed in thearticles are the personal opinions of the authors and reviewers and do not necessarily reflectthe views of the publisher and editors, or of any institution with the information with whichthe author may be associated. The editorial board does not guarantee the accuracy of the dataand the information included in the articles and accepts no responsibility, whatsoever, for anyconsequences of their use.
Subscription informationJournal of Management and Development Economics (JMDE) is a journal published annuallyby Global College of Management. The publication is for the benefit of the managementexperts, economists, planners, professionals as well as those interested in the field of managementand development. Copies of the journal may be subscribed/purchased from Global Collegeof Management. The subscription rates are as follows:
Mailing charge to be paid extraClaims for the missing numbers should be made within the month following the regular monthof publication. The publisher will supply the missing numbers free of cost only when it isconfirmed and when the reserve stock permits.
If you change your address, please notify us immediately, giving both your old and newaddresses. Allow five weeks for the change. Back issues prior to last years' volume, if available,can be obtained from the college. Request for the subscriptions should be addressed to:
Journal of Management and Development EconomicsGlobal College of Management, Mid-BaneshworKathmandu, Nepal014488312, 014472083
Individuals Library and InstitutionPer copy Per Copy
Nepal Rs.500 Rs.900
SAARC Countries US$10.0 US$15.0
Other Countries US$15.0 US$22.0
Journal of Management & Development EconomicsApril 2015 Vol. 4 Issue No. 1 ISSN 2392-4551

Format for subscription request....................................................................................................................................................................................................................................................................................................I would like to subscribe to Journal of Management and Development Economics an annualpublication of Global College of Management Mid Baneshwor, Kathmandu, Nepal.
Mode of payment: Cash/Cheque/Draft Total amount NRs./US$:..................................................................................................................................................
Name & Designation:....................................................................................................................................................................................................................................................................................................
Institution:....................................................................................................................................................................................................................................................................................................
Mailing Address:....................................................................................................................................................................................................................................................................................................
Telephone: ............................................... E-mail: .................................................................
Fax:....................................................................................................................................................................................................................................................................................................
Please transfer the amount to Global College of Management, Mid- Baneshwor, Kathmandu
- citizens Bank International Ltd., New Road, Kathmandu- Account No: 0070000179 CC, SWIFT: CTZNNPKT- please do not send cash by mail.- only cheques drawable in Kathmandu will be accepted.
For: 1 Year 2 Years …………………..Years.
Subscription type: Personal Institutional Vol. …………… Issue ……
Journal of Management & Development EconomicsApril 2015 Vol. 4 Issue No. 1 ISSN 2392-4551

Contents
AN ANALYSIS OF ELECTRICITY CONSUMPTION IN INDUSTRIALSECTOR OF NEPAL .............................................................................................. 11-18Bhola Nath Ghimire
TEACHER MANAGEMENT AND DEVELOPMENT IN HIGHERSECONDARY EDUCATION .................................................................................. 19-30
Dev Raj Paneru
DOES DEVELOPMENT OF COMMERCIAL BANKS SPUR ECONOMICGROWTH ................................................................................................................. 31-52Dr. Dipak Bahadur Bhandari & Keshab Acharya
GLOBALIZATION: A TROZAN HORSE "GLOBALIZATION IS A BUZZWORDTHAT HAS NO PRECISE DEFINITION." ............................................................. 53-60Dr. Kanhaiya Ram Bhakta Mathema
A Case of Higher Secondary Education Board of Nepal
INFLUENCE OF CORPORATE INCOME TAX ON DEBT FINANCING:EVIDENCE FROM NEPALESE MANUFACTURING COMPANIES ................. 1-10Achyut Gyawali (PhD Scholar)
AN ANALYSIS OF EMPLOYMENT AND INFLOW OF REMITTANCEIN NEPAL ................................................................................................................. 61-70Mani Ratna Lamsal
NON-FINANCIAL PERFORMANCE MEASUREMENT PRACTICESIN NEPALESE COMMERCIAL BANKS ................................................................ 71-76Naba Raj Adhikari, M. Phil
DIVIDEND POLICY PERFORMANCE, AND THE STOCK PRICE IN NEPAL .... 77-90Nabaraj Adhikari, PhD
THE CROSS-SECTION OF EXPECTED STOCK RETURNS IN NEPAL ............. 91-99Prof. Dr. Radhe S. Pradhan
AN EMPIRICAL STUDY ON STOCK MARKET, BANK AND ECONOMICGROWTH ................................................................................................................. 100-112Mr. Santosh Poudel
Journal of Management & Development EconomicsApril 2015 Vol. 4 Issue No. 1 ISSN 2392-4551

of] k]h vfnL /fVg]

Influence of corporate income tax on debt-financing: Evidence from Nepalese manufacturing companies 1
INFLUENCE OF CORPORATE INCOMETAX ON DEBT-FINANCING: EVIDENCEFROM NEPALESE MANUFACTURINGCOMPANIES
Achyut Gyawali (PhD Scholar)...?
AbstractThe main purpose of this paper is to assess the relationship between corporate income taxand debt-equity mix and estimate the influence of corporate income tax on debt financing ofthe manufacturing companies of Nepal. Debt-equity mix has been taken as the dependentvariable to represent the debt financing and effective tax rate has been used as independentvariable to represent the corporate income tax. The secondary data have been utilized toestimate the relationship between the variables and simple regression equation as used inAlessi (1965) study has been employed to infer the relationship. The results of the analysissuggest that debt financing is influenced by corporate income tax positively, but such influenceis not much significant in shaping specific mix of debt and equity capital of the manufacturingcompanies. However, the nature of influence is different across the profitability status of thecompanies.
Keyword: Corporate tax, Manufacturing companies, Debt-equity mix, profitability, Incometax
BackgroundA firm seeking to maximize welfare of its shareholders should take tax factors into elucidationwhile involving in the process of making financing decisions. It is because; the impositionof income tax on corporate business profit reduces the residual amount of income availablefor distribution of returns as dividends to the shareholders (Altman and Subrahmanyam, 1985:181). For corporate income tax purpose, the expenses made on the payment of interest to thebondholders of the company are allowed as a deduction, but the expenses made on disbursementof dividends to the shareholders are not allowed as a deduction. Income tax provision regardingwith eligibility of interest deduction from taxable income is favorable for the firms as it equallyadds benefit to generate valuable tax shield. The debt financing significantly helps increasefirm's cash-flow ancillary in the course of generating operation funds available for returndistribution to the shareholders through its tax shields (Pringle and Harris, 1987: 495). Hence,a resonance proportion of debt in financing mix also increases the market value of themanufacturing firms (Ross, et al., 2013:368). As a result, interest-bearing debts are attractiveto the manufacturing firms for financing their investments (King, 2012: 158). Therefore, the
Mr. Gyawali is the Lecturer of Management at Tribhuvan University. He is the PhD Scholar at T.U.
2 Achyut Gyawali
difference in tax treatment of interest and dividend affect financing choice between debt andequity (Chua, 1995).
Corporate income tax is potentially an important consideration in a firm's financing decision(Fama and French, 1998: 819). It has an effect on the ways of project financing. If it is financedwith the debt capital, tax relief is available on the interest payment (Hutchinson, et al.,1994:296). Therefore, financial managers remain constantly aware of tax consideration intheir day-to-day decisions and spend a considerable part of their managerial effort to reducethe incidence of income tax through an appropriate financing mix. Thus, corporate incometax is an influential factor in the choice of sources to raise required funds.
Funds to finance an investment proposal can be obtained either by borrowing from banks, byselling marketable securities, by selling non-business assets or parts of its business assets, byissuing additional securities or by utilizing the savings generated from business operations.Hence, an investment proposal is either financed by a composite capital mix or by any oneof the sources of funds. Composite capital mix depends on various factors and no uniformstandard can be laid down for all investments of a corporation (Saynyal, 1971: 817). Whenthe corporation uses debt, it must pay interest, on the other hand when it uses equity; it isexpected to distribute dividends to the equity investors. In case the debt is used, the interestexpenses paid by a corporation on it are allowed to deduct from operating income to obtainits taxable income. But the dividends paid to equity holders are not deductible. For this reason,corporate tax system favors debt financing over equity financing. However, it is not alwayspossible to finance an investment exclusively with debt capital, and the risk of doing sosetbacks the benefits of the higher expected income (Brigham, et al., 1999: 56-57). Thus, theproblem of financial manager is to choose proper level of debt to arrive at appropriate financingmix that results into tax benefits.
The major issue in corporate financing is to determine the appropriate mix between debt andequity. Extensive controversial views have come up on this issue. Regardless of the controversialviews, the tax law has given debt financing a definite cost advantage over preferred stock andcommon stock (Martin, et. al. 1991: 48). Taxes tend to place a premium on one form offinancing as compared to the other. For instance, income tax law allows deduction of allinterests paid before arriving at taxable income. This deductible interest makes debt capitalcheaper for corporations to use it for financing the investments (Keown, et. al., and 2001:425). Thus, the financial managers need to know how taxes influence financing decision ofthe firms.
Due to the attractiveness of debt, there would be a tendency for additional investment to bedebt financed (Arditti and Pinkerton, 1978: 65). To the contrary, Fama and Miller (1972),Jensen and Meckling (1976) suggested that debt is not much attractive to maximize thecombined wealth of security holders because it has a tendency to make risky investments.Similarly, Myers (1977) suggested that use of debt in financing mix causes firms to make lessinvestment of funds because the returns are to be shared with debt holders.
In Nepalese corporate income tax system also the interest paid on debt capital is a deductibleexpense whereas dividend paid for equity capital is not deductible for income tax purpose.It means, interest paid on debt reduces the amount of tax to be paid to the government. In

Influence of corporate income tax on debt-financing: Evidence from Nepalese manufacturing companies 3
contrast, the dividend is not the deductible expense and it does not save corporate tax. Thecorporate taxpayers using equity as the source of capital should pay more tax than those usingdebt as the source of capital. Because of this provision, it can be stated that Nepalese corporatetax system provides favoritism to debt capital over the equity capital of the companies, whichis reflected in the process of financing decision. Because of such discrimination between thedebt and equity capitals, there is a scope of favoring the debt financing by the manufacturingcompanies in the context of Nepal (Kandel, 2009:165).
A company may reduce its tax liability substantially if it finances its capital requirementthrough loans due to the deductibility of interest that results into lower tax burden. This isthe reason why debt financing is more attractive than equity financing and Nepalese companiesmay be thinly capitalized in order to reduce income tax liability (Khadka, 2001: 46). In thiscontext, the influence of corporate income tax on debt financing is emerging as an importantaspect to investigate empirically.
In Nepalese context, however, the influence of corporate income taxes on debt financing ofmanufacturing firms is a matter of study. There is absence of adequate studies especially onthe relationship between corporate income taxes and debt financing of Nepalese manufacturingcompanies. Most of the Nepalese studies, in this regard, concentrate macro level analysis, andadministrative aspect of the income taxes. It is therefore difficult to generalize specific Nepalesecase by applying the findings of international studies. In other words, the applicability of thefindings of previous international studies in the area of corporate income taxes and theirinfluence to debt financing of Nepalese companies remains questionable. Thus, this study hasdealt with the following issues:
1. Does corporate income tax influence debt-equity mix of manufacturing listed companies?2. What kind of relationship does exist between corporate income tax and debt-equity
mix of manufacturing companies?3. Is there any difference in the nature of relationship between corporate income tax and
debt-equity mix across profit-making and loss-making companies?
Objectives of the studyThe purpose of this paper is to assess the relationship between corporate income tax and debt-equity mix and estimate the influence of corporate income tax on debt financing of themanufacturing companies of Nepal. It also analyses on relationship does exist betweencorporate income tax and debt-equity mix of manufacturing companies and the nature ofrelationship between corporate income tax and debt-equity mix across profit-making and loss-making companies.
MethodologyIn this study an attempt has been made to assess the relationship between corporate incometax and debt-financing of manufacturing companies which are enlisted in Nepal SecurityExchange Limited. Altogether eight companies were selected by considering reported profitand loss. The manufacturing companies which have reported operating loss in any year outof the last five years (2006/07 to 2011/12) have been taken as loss-making companies. And

4 Achyut Gyawali
obviously, those companies which have reported profit for all last five years of study periodhave been taken as profit-making companies. In this study only secondary data have beenutilized for analysis. The financial accounting data for the period of ten years (2001/02 to2011/12) were collected from the annual and periodic publications of Nepal Stock ExchangeLimited (NEPSE), and Securities Board, Nepal (SEBO/N). The publications of NEPSE like:Financial Statements of Listed Companies, Trading Report, and Monthly Bulletin were utilizedas data sources. Similarly, the publications of SEBO/N like: Securities Board Nepal: AnnualReport, Securities Market Review, and Securities Board Nepal: Journal, were essentially takenas the sources for secondary data. The data that were collected in these ways have beenanalyzed with regression equations for each group of profit-making and loss-making companiesand for total sample.
Alessi (1965) incorporated corporate income tax rate as a single independent variable toinvestigate the effect of corporate income tax on debt-equity mix. In that study, he concludedthat the corporate income tax rate should be considered as a major independent variable inany model intended to explain variations in debt-equity mix. He considered the effect of othernon-tax variables on debt-equity mix to be somewhat less critical and confined to a simplelinear equation having the tax rate as the only independent variable.
Rao and Rao (1975) employed three measures of dependent variable debt-equity mix. Spencer(1969) argued that in an unconstrained reduced form equation the variables included areimportant only in their ability to represent a spectrum of variables which will remove thenontax influences while isolating the tax influence. In another study, Wang (1991) employedthree alternative measures of explanatory variable effective tax rate, computed as: the ratioof tax expenses to gross profit, the ratio of tax expenses to pre-tax profit and the ratio of taxexpenses to earning before interest and tax, in investigating the relationship between firm sizeand effective tax rate. Myers and Brealey (2000) pointed out that the debt equity ratio forcorporations as a whole depends on the corporate tax rate. If corporate tax rate is increased,migration starts again, leading to a higher debt to equity ratio for companies as a whole.
For better result, dependent as well as explanatory variables can be used alternatively toestimate the relationship between debt-equity mix and corporate income tax. Thus, in thisstudy different measures of debt-equity mix such as debt to networth ratio, debt to total assetsratio, and total debt to total assets ratio have been employed as dependent variables. In thesame way, two measures of corporate income tax rates like: statutory corporate tax rate andeffective tax rate have been employed as explanatory variables alternatively.
In the present study, the following equation has been taken as base to specify the equationsshowing linear relationship between debt-equity mix (measure of debt financing) and corporateincome tax rates.
Yt = a0 + a1 Zt-1 + u. …. … … … … (1)
Y = measures of debt-equity mix, Z = effective tax rate, u = error term, a = parameter to beestimated, t = current fiscal year under consideration (Rao and Rao, 1975: 11).Previous empirical studies have suggested that dependent as well as explanatory variablescould be used alternatively to estimate the relationship between debt-equity mix and corporate

Influence of corporate income tax on debt-financing: Evidence from Nepalese manufacturing companies 5
income tax rates (Rao and Rao, 1975:15). Thus, in this study, different measures of debt-equity mix such as debt to networth ratio; debt to total assets ratio, and total debt to total assetsratio were employed as dependent variables. Therefore, equation (1) has been adjusted withalternative measures of dependent variable (debt-equity mix) and the following specifiedlinear regression equations were employed to estimate the relationship between debt-equitymix and effective tax rate in the present study:
(D/NW)i, t = a0 + a1 Zi, t-1 + ui. …. …. (2)
(D/TA)i, t = a0 + a1 Zi, t-1 + ui. …. …. . (3)
(TD/TA)i, t = a0 + a1 Zi, t-1 + ui. …. …. (4)
D = long term and short term borrowings, NW = net worth, TA = total assets,TD = total debt, Z = effective corporate tax rate, t = current fiscal year under consideration;a0, a1 = parameters to be estimated, i = states of nature of the sample companies like: big,medium, small, profit-making, loss-making, and total sample; u = error term.
Debt-Equity MixDebt-equity mix is the financing mix. It is the proportion of debt and equity capitals used tofinance investments. The optimal debt-equity mix of a company normally depends on thenature of the business. There are different motives for borrowing by the firms. Among them,capturing the tax benefits of deductibility of interest is the one (Pringle and Harris, 1987: 493,506). In this context it is to be noted that the empirical results are sensitive to the ways ofmeasurement of variables. The usefulness of a model, hence, has to be tested with possiblealternative measures of the variables. Thus, the ratio of debt to net worth, the ratio of debtto total assets, the ratio of total debt to total assets etc. could be the alternative measures totest the debt-equity mix (Rao and Rao, 1975:15).
In the present study, debt-equity mix has been taken as the measure of debt financing. Threealternative measures of debt-equity mix were employed to examine the relationship betweendebt financing and corporate taxes. These measures were: debt to networth ratio, debt to totalassets ratio, and total debt to total assets ratio. Further, these measures of debt-equity mixwere computed by applying following formulas:
Long term borrowings + Short term borrowingsD/NW = --------------------------------------------------------------- … … (5) Total assets - Total liabilities
Long term borrowings + Short term borrowingsD/TA = -------------------------------------------------------------- … … (6) Total assets
6 Achyut Gyawali
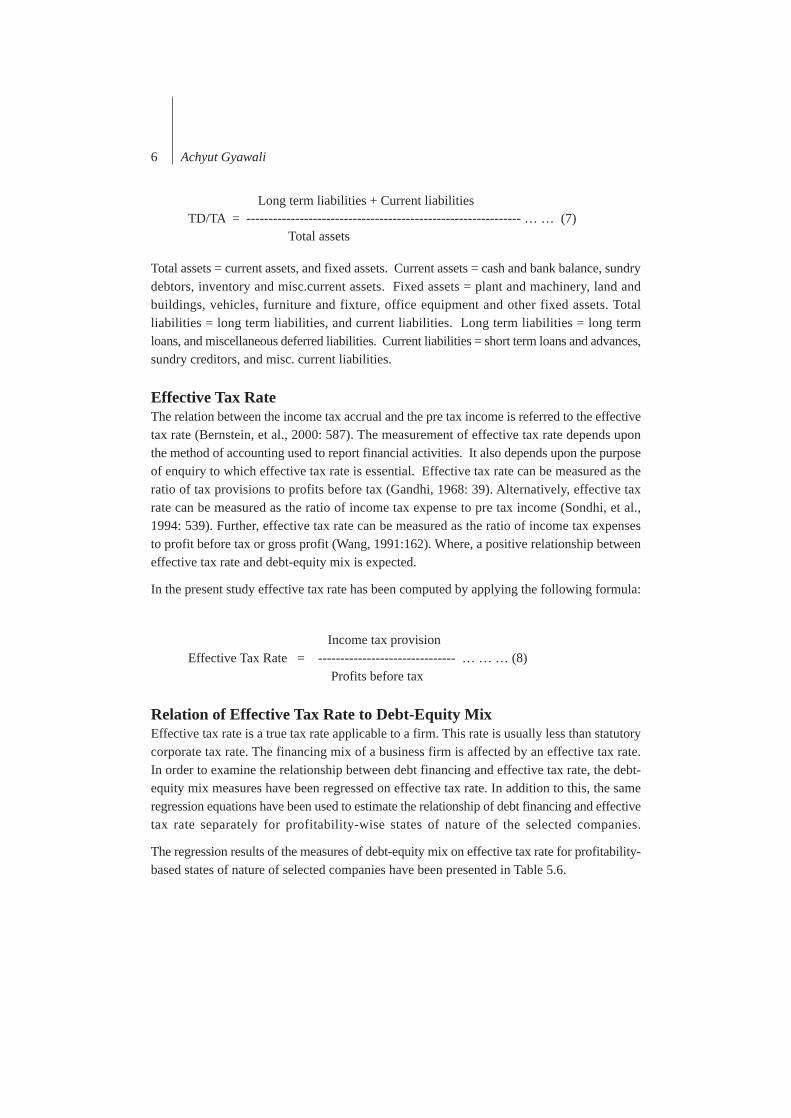
Long term liabilities + Current liabilitiesTD/TA = -------------------------------------------------------------- … … (7)
Total assets
Total assets = current assets, and fixed assets. Current assets = cash and bank balance, sundrydebtors, inventory and misc.current assets. Fixed assets = plant and machinery, land andbuildings, vehicles, furniture and fixture, office equipment and other fixed assets. Totalliabilities = long term liabilities, and current liabilities. Long term liabilities = long termloans, and miscellaneous deferred liabilities. Current liabilities = short term loans and advances,sundry creditors, and misc. current liabilities.
Effective Tax RateThe relation between the income tax accrual and the pre tax income is referred to the effectivetax rate (Bernstein, et al., 2000: 587). The measurement of effective tax rate depends uponthe method of accounting used to report financial activities. It also depends upon the purposeof enquiry to which effective tax rate is essential. Effective tax rate can be measured as theratio of tax provisions to profits before tax (Gandhi, 1968: 39). Alternatively, effective taxrate can be measured as the ratio of income tax expense to pre tax income (Sondhi, et al.,1994: 539). Further, effective tax rate can be measured as the ratio of income tax expensesto profit before tax or gross profit (Wang, 1991:162). Where, a positive relationship betweeneffective tax rate and debt-equity mix is expected.
In the present study effective tax rate has been computed by applying the following formula:
Income tax provisionEffective Tax Rate = ------------------------------- … … … (8) Profits before tax
Relation of Effective Tax Rate to Debt-Equity MixEffective tax rate is a true tax rate applicable to a firm. This rate is usually less than statutorycorporate tax rate. The financing mix of a business firm is affected by an effective tax rate.In order to examine the relationship between debt financing and effective tax rate, the debt-equity mix measures have been regressed on effective tax rate. In addition to this, the sameregression equations have been used to estimate the relationship of debt financing and effectivetax rate separately for profitability-wise states of nature of the selected companies.
The regression results of the measures of debt-equity mix on effective tax rate for profitability-based states of nature of selected companies have been presented in Table 5.6.

Influence of corporate income tax on debt-financing: Evidence from Nepalese manufacturing companies 7
Table:1Results of the Regression of Debt-equity Mix on Effective Tax Rate
S.N Dependent Constant ExplanatoryVariables Variable r2 F N
(Z)t-1
1 (D/NW)tProfit-making 0.458* 0.0736 0.011 0.457 43
(4.041) (0.676)
Loss-making 2.250* -0.269 0.009 0.300 34(6.865) (-0.548)
Total 1.257* -0.023 0.001 0.037 77(6.504) (-0.193)
2 (D/TA)tProfit-making 0.151* 0.0361*** 0.045 1.979 44
(5.433) (1.407)
Loss-making 0.554* -0.0541 0.032 1.068 34(15.889) (-1.033)
Total 0.322* 0.031 0.011 0.67 78(9.612) (0.259)
3 (TD/TA)tProfit-making 0.430* 0.0216 0.009 0.467 51
(14.158) (0.684)
Loss-making 0.717* 0.0137 0.002 0.071 34(21.051) (0.267)
Total 0.542* 0.046 0.012 0.168 85(18.304) (0.410)
Notes: Figures in parenthesis are t-values.* Significant at 1 percent, ** Significant at 5 percent, ***Significant at 10 percent,
The Table: 1 depicts regression results of debt-equity mix measures on effective tax rate forprofit-making and loss-making companies. The coefficient of explanatory variable effectivetax rate for profit-making companies is statistically significant at 10 percent level, with thedependent variable (D/TA)t. The sign associated with the coefficient indicates a positiverelationship between (D/TA) and effective tax rate. However, this coefficient (0.0381) isfollowed by weak r2 showing only about 5 percent variation in debt to total assets ratio isexplained by effective tax rate. Moreover, the 'F' value is observed statistically insignificant,which indicates that there is absence of statistical evidence about the good fitness of regressionequation. On the other hand, the coefficients of this explanatory variable with dependentvariables (D/NW)t and (TD/TA)t have showed positive signs, but these coefficients arestatistically insignificant.

8 Achyut Gyawali
For loss-making companies, it is observed that the coefficients of explanatory variable, effectivetax rate, showed negative signs pertaining to dependent variables (D/NW)t, and (D/TA)t.But, the observed coefficients are not statistically significant at 10 percent level. Thus, thenegative association of effective tax rate and debt-equity mix lacks considerable statisticaljustifications in the context of loss-making companies. The coefficient of explanatory variable,in relation to the dependent variable (TD/TA)t, is appeared with positive sign, suggestingpositive association of effective tax rate with total debt to total assets ratio. However, thiscoefficient is not statistically significant, reflecting negligible association between thesevariables.
For total sample, Table: 1 shows regression coefficients of effective tax rate having positivesign for two measures of dependent variable and negative sign for one measure of dependentvariable. The explanatory coefficients are statistically insignificant. Due to this, it can beconcluded that debt-equity mix and effective tax rate are related positively, but their relationshipis not statistically significant.
ConclusionThe regression coefficient of explanatory variable (effective tax rate) for profit-makingcompanies is observed significant with the dependent variable (D/TA)t. The sign associatedwith this coefficient has indicated a positive relationship between (D/TA) and effective taxrate. Likewise, the coefficients of effective tax rate with dependent variables (D/NW)t and(TD/TA)t have positive signs, however these coefficients are observed insignificant. Thus,an insignificant positive relationship has been found between effective tax rate and debt-equitymix of profit-making companies.
For loss-making companies, the regression coefficients of explanatory variable (effective taxrate) with dependent variables (D/NW)t, and (D/TA)t are observed with negative signs. But,the observed coefficients are not significant. Again, the coefficient of this explanatory variablein relation to the dependent variable (TD/TA)t has been observed with positive sign, suggestingpositive relationship of effective tax rate with debt-equity mix. However, this coefficient ofthe effective tax rate is also not significant. Thus, there is an insignificant negative relationshipbetween effective tax rate and debt-equity mix of loss-making companies.
The results, depending upon the measures of dependent variable used, are consistent with thefindings of Rao and Rao (1971) and Rao and Rao (1975) studies that the relationships ofeffective tax rate with debt-equity mix vary across the measures of dependent variable testedin the model. Moreover, the relationship of effective tax rate and debt-equity mix variesaccording to profitability status of the companies. For total sample, the regression coefficientsof effective tax rate with debt-equity mix are positive. Thus, an insignificant positive relationshiphas been found between effective tax rate and debt-equity mix. This observed relationshiphas indicated that the corporate income tax rate does not influence debt financing ofmanufacturing companies significantly. This finding has implication on financing behaviorof the companies that the Nepalese manufacturing companies do not consider the effects ofcorporate income tax on debt financing while making decision about the appropriate mix ofdebt and equity capital.
Influence of corporate income tax on debt-financing: Evidence from Nepalese manufacturing companies 9
Agrawal, R.P. (1969-July). Financing company expansion The chartered accountant, The Institute ofChartered Accountants of India, P.19.
Alam, Kazi Firoz, (1994). Taxation and investment policy: A survey report on the New Zealandmanufacturing industry. Accounting forum, School of Accounting, University of South Australia,Vol.17, No.4, PP.121-143.
Alessi, Louis De (1965 -Spring). The corporate income tax and debt to equity ratio. Wester economicjournal, PP. 195-199.
Altman, Edward I. and Subrahamanyam, Marit G. (1985). Recent advances in corporate finance"NewYork: Irwin Homewood Illinois
Arditti, F. D. and Pinkerton, J.M. (1978-March). The valuation and cost of capital of the levered firmwith growth opportunities. The journal of finance, Vol. 33, PP. 65-73.
Bernstein, Leopold A. and Wild John J., (2000). Financial statement analysis, theory, application andinterpretation. Seventh Edition, California:Mc Gray Hill.
Brigham, Eugene F., Gapenski Louis C. and Ehrhardt Michael C. (1999). Financial management, theoryand practice. Florida: The Dryden Press, Har Court Brace College Publishers.
Chua, Dale (1995). The concept of cost of capital: Marginal effective tax rate on investment. InParthasarathi Some (Ed.) "Tax policy" Washington: IMF.
Fama, Eugene F. and French Kenneth R. (1998). Taxes, financing decisions, and firm value. The journalof finance, Vol. 53, No. 3, PP. 819-843.
Fama, Eugene F. And Miller Merton H.(1972). The theory of finance. Hinsdale: Dryden Press.
Gandhi, Ved, P. (1968-April). Company tax incidence- industry studies. The indian economic review,Vol. 3, No. 1, PP. 33-47.
Hutchinson, Patrick, Alison Stewart, Gregory Warwick and Lumby Stephen (1994). Financial managementdecisions, principles and practices. Sydney: Thomas Nelson.
Jensen, Michael C. (1986). Agency costs of free cashflow, corporate finance and takeovers. Americaneconomic review, Vol. 76, PP. 323-329.
Jensen, Michael C. And Meckling, William H. (1976). Theory of the firm: Managerial behavior, agencycosts and ownership structure. Journal of financial economics, Vol. 3, PP. 305-360.
Keown, Arthur J., Martin John D., Petty J. William and Scott JR. David F. (2001). Foundations offinance, the logic and practice of financial management.
Third Edition. New Jersey: Prentice Hall International.
Khadka, Rup (1994). Nepalese taxation, a path for reform. Merburg: Merburg Consult for Self HelpPromotion. P.119.
References
10 Achyut Gyawali
Khadka, Rup (2001). Income taxation in Nepal: Retrospect and prospect. Kathmandu: Ratna PustakBhandar.
Kandel, Puspa (2009). Tax laws and tax planning in Nepal. Katmandu: Buddha Academic EnterprisesPvt.Ltd.
King, John R. (2013). Debt and equity financing. In Parthasarathi Some (Ed.) "Tax policy", Washington: IMF. P.158.
Martin, John D., Petty J. William, Keown Arthur J. and Scott David F. (1991). Basic financial management.New Jersey: Prentice Hall International.
Myers, Stewart C. (1977). Determinants of corporate borrowing. Journal of financial economics, Vol.13, No. 2, PP. 147-175.
Myers, Stewart C. And Brealey, Richard A. (2000). Principles of corporate finance. Sixth Edition, NewYork: McGraw Hill.
Pringle, John J. and Harris, Robert S. (1987). Essentials of managerial finance. Sydney: Scott Foresmanand Company.
Rao, S. C. Humananta and Rao, V. Ganapathi, (1971-Dec.). The effects of taxation on corporate capitalstructure. "Indian journal of commerce. Vol. 26, No. 90, PP. 239-248.
Rao, V. G. and Rao K. S. H., (1975-April). The corporate income tax and corporate debt policy. Indianeconomic review, Vol, 10.New Series, No. 1. PP. 7-25.
Ross, Jordan, Bradford D. and Westerfield, Randolph W. (2013). Essential of corporate finance. ThirdEdition, New York: McGraw Hill.
Saynyal, S. K. (1971-May). Trading on the equity: A tool in the hands of the financial manager. Thechartered accountant, The Institute of Chartered Accountants of India, P. 817.
Sondhi, C. Ashwinpaul, White I. Gerald, and Fried Dov, (1994). The analysis and use of financialstatements. New York: John Wiley & Sons, Inc.
Spencer, Byron G. (1969-Feb). The shifting of the corporate income tax in Canada. The Canadian journalof economics, PP. 21-34.
Wang, Shiing Wu (1991). The relation between firm size and effective tax rates: A test of firms' politicalsuccess." The accounting review, American accounting association, Vol. 66, No.1, PP. 158-169.

An Analysis of Electricity Consumption in Industrial Sector of Nepal 11
AN ANALYSIS OF ELECTRICITYCONSUMPTION IN INDUSTRIALSECTOR OF NEPAL
Bhola Nath Ghimire...?Abstract
Nepal has a huge hydropower potential. In fact, the perennial nature of Nepali rivers and thesteep gradient of the country's topography provide ideal conditions for the development ofsome of the world's largest hydroelectric projects in Nepal.The purpose of this article is to derive and estimate a consumption function for Nepaleseindustrial electricity use, and to investigate changes in consumption pattern over the timeperiod 1980-1912. The article employs data on the industrial electricity use, electricity andoil prices and data on the value of production, and specifies a log liner function, which isused running OLS regression. The data are divided in to two time periods 1980-1995 (beforeconflict) and 1996-2012 (conflict and then) in order to test for structural change and theChow test used in the research for testing structural change in consumption. The consumptionfor electricity in second period is higher than that of first period. The own price electricityconsumption and cross price elasticity of consumption have gone by statistically significantin both periods., and the Chow test also shown that there is structural break in consumptionfor hydroelectricity by Nepalese industries.Keyword: Electricity, consumption, elasticity, Chow test, structural break
IntroductionThe use of electricity and fossil fuels over the last decade seems to be accelerating as evidencedby an empirical research carried out recently in Nepal (Dahal, 2004). Nepal has a hugehydropower potential. In fact, the perennial nature of Nepali rivers and the steep gradient ofthe country's topography provide ideal conditions for the development of some of the world'slargest hydroelectric projects in Nepal. The average annual precipitation is approximately1700 mm (80% of which occurs during the monsoon season - June to September). The totalannual average run-off from the nation's 600 perennial rivers is over 200 billion m3 Currentestimates are that Nepal has approximately 42,000 MW of economically feasible hydropowerpotential. However, the present situation is that Nepal has developed only approximately705MW of hydropower. Therefore, bulk of the economically feasible generation has not beenrealized yet. By the end of FY 20012/13 from all projects across the country, 705 MW ofelectricity has been generated. Of the total electricity generated, 697 MW has been connectedto the national grid, while for the rest; the stand-alone micro hydro-electricity centers havebeen supplying them at the local level. Likewise, including the thermal electricity centres'production of 53.4 MW and solar centres' production of 100 KW, the total electricity productionhas reached 758 MW (Source: 13th periodic plan).
Mr. Ghimire is the Lecturer of Economics at Global College of Management

12 Bhola Nath Ghimire

An Analysis of Electricity Consumption in Industrial Sector of Nepal 13
Cross Price Elasticity of ConsumptionThe cross price elasticity of electricity consumption shows the change in consumption forelectricity when the price of the substitute, oil, changes. This cross price elasticity is definedas:
To test for a structural break, Chow test used in the model, which is defined as:
If the cross price elasticity of electricity consumption is positive the goods are said to be grosssubstitutes, implying that the consumption for electricity will increase as the price of thesubstitute increases.
Where RSSR is restricted residual sum of square and RSSUR is called unrestricted residualsum of square and RSSUR is the sum of RSS1 and RSS2. Result is obtained through use ofsoftware stata and all the diagnostic checks such including Autocorrelation, Hetroskedasticityand Multicollenearity done and the model modified as needed and result interpreted accordingly.
Analysis for Elasticity and Structural Break of Electricity Consumptionby Industrial Sector of NepalNepalese industries have been using coal, Hydroelectricity, Petroleum product and otherrecycling solid and liquid materials simultaneously. However according to research topic forsimplicity of the analysis I have used only Petroleum product as substitute source of energy

14 Bhola Nath Ghimire
along with electricity in my research. Its main reason is the price of coal and recycling materialare not found as collective form, from the authentic sources therefore I have avoided thefeasible happing of destruction in my model. The model is, free from autocorrelation andheteroskedasticity problem.
Price and Cross Price Elasticity of Electricity ConsumptionElasticity of consumption refers to change in quantity of goods and services by certainpercentage due to change in determinants of consumption by a one percentage. The Estimatedelasticity consumption of price and cross price based on model, 1 are shown in table 4.1.
Table 1: Estimation of the price elasticity and cross price elasticity of consumption
Variables Coeffi. std.error t-value prob. Coeffi. std.error t-value Prob. Coeffi. std.error t-value prob.
lnPEL -0.10 0.004 -21.25 0.00 -0.19 0.008 -23 0.00 -0.07 0.004 -19.68 0.00
lnPOIL 0.70 0.03 23.03 0.00 0.52 0.57 9.10 0.00 0.35 0.015 24.5 0.00
DW Test 1.54 1.34 1.89
LM Test 0.185 0.67 0.007 0.93 0.887 0.35
Heterosked.Test 12.24 0.20 7.08 0.215 11.20 0.26
R2 0.99 0.95 0.98
F 1030.39 0.00 53.98 0.00 408.19 0.00
Level of significance = 5%
Dependent variable = lnELTime period 1980 – 2012(n = 28) 1980 – 1995(n = 11) 1996 – 2012(n = 17)
Note: where EL = Electricity consumption, PEL = Price of electricity,POIL = Price of Petroleum product, ln = Natural logarithm and Coeffi. = Coefficient.
Own Price Elasticity of Electricity ConsumptionThe elasticity table 4.1 shows that the own price elasticity of electricity consumption issignificant at a five percentage level for the time- period 1980-2012 , 1980-1995 and1996-2012 as well. Where the coefficient for all periods are negative which implies that onepercentage change in price of electricity would lead to a decrease in industry's total consumptionof electricity by 0.10 percentage, 0.19 percentage and 0.07 percentage at1980-2012,1980-1995 and1996 -2012 periods respectively, ( when other things remain constant). It showsthat negative relationship between electricity consumption and price of electricity. Theconsumption is less elastic in the period 1996-2012 than 1980-1995. It could be happened atsecond period due to high consumption of electricity for industry, consumers were standingby to purchase electricity even though price is in increasing order. After signing the consensusof carbon- business agreement, just to reduce carbon mono-dioxide and for environmentfriendly sustainable development, people choose electricity as a first source of energy.Various explanations can be raised for this lower elasticity; first, the price of electricityremained very low and almost constant during the period 1980-2012. Second, industries werenot run properly before privatization programme and in this prospect, government's interestjust could be the cost of producing and transmitting electricity to the industry. Third, governmentmade several policy statements (such as hydropower development policy, rural energy policy,climate change policy etc.). It would keep the price of electricity as low as possible to attractinvestment in industrial sector.

An Analysis of Electricity Consumption in Industrial Sector of Nepal 15
Cross Price Elasticity of Electricity ConsumptionThe elasticity table 4.1 shows that the cross price elasticity of electricity consumption issignificant at a five-percentage level for the period 1980-2012, 1980-1995 and1996-2012 aswell. The coefficient for all periods are positive which implies that one percentage changein price of petroleum product would lead to a increase in industry's total consumption ofelectricity by 0.70 percentage , 0.52 percentage and 0.35 at 1980-2012 , 1980-1995 and1996-2012 periods respectively (when other things remain constant).
It shows that cross elasticity of consumption for electricity the overall period is more elasticthan samples. Therefore, we can say that when increased the price of petroleum product,consumers bought more units of electricity at overall period, it gives that petroleum productbecomes perfect substitute goods for electricity. However, industries were not ready to consumemore units of electricity after 1995 as comparison that of before, when the price of petroleumproduct increased by certain percentage. Industry bought more units of electricity before 1995comparatively after that of period. It could be happened due to high load shedding problems,consumer used their private plant, but previously consumer used energy run by diesel pumpedand when price of petroleum product increased definitely increased in the consumption(consumption) of electricity. At the beginning there were not enough policies regarding toelectricity can be one caused for more elastic. Although diesel has shown its potential as asubstitute for electricity, yet its escalating prices and strict environmental regulation in Nepalmay reduce the substitutability.
Chow Test AnalysisModel 1 assumes that there is no difference, consumption for electricity between the two timeperiods and therefore estimates the relationship between consumption for electricity in industryand price of electricity with its substitute goods price for the entire time period consisting 28observations. If the value of the test statistics is greater than the critical value from the F-distribution, which is an F (k, n1+n2-2k), then reject the null hypothesis that the parametersare stable over time.
Here we have restricted residual sum of square (RSSR) = 0.0870 with df 23 and Unrestrictedresidual sum of square (RSSUR) is given by sum of RSS1 and RSS2 i.e.RSSUR = RSS1 + RSS2 = 0.073.
Period Residual sum square Coefficient Calculated value Tabulated value
1980–2012 RSSR 0.870
1980–1995 RSS1 0.057 10.54(0.00) 3.05
1996–2012 RSS2 0.016
Level of significance 5%
Table 2: Chow test estimation
From the F tables, we find that for 4 and 22 df the 5 percent critical F value is 3.05, whichis smaller than calculated value (10.54). Therefore, we reject the null hypothesis that thecoefficients are the same in the two periods.The chow test shows that the consumption of electricity- price of electricity and price of oilrelation has undergone a structural change in Nepalese industries over the period1980-2012 has been tested. As above chow test could be easily generalized to handle casesof more than one structural break in the model.

16 Bhola Nath Ghimire
– Electricity consumption – Income of energy sector
1980 1990 2000 2010Year
Ele
ctric
ity c
onsu
mpt
ion
/ Inc
ome
108
64
Figure 1: Electricity consumption and Income of energy sectorNote: Electricity consumption is in GWh and Income is in ten millions Rs.
The figure 4.1 shows that the structure of change in consumption and income (Gross DomesticProduct from energy sectors) of electricity as changing period of time in Nepalese industriesbefore conflict period since 1980AD and after and then conflict 1996 AD separately.The income and electricity consumption by Nepalese industries both are increasing initiallyhowever, they are fluctuated in time-to-time (sometimes increasing with increasing rate,increasing with decreasing rate and decreasing). At the target period of time 1996AD, slightlydecreased in electricity consumption and its impact of income seemed in 1997 AD as a resultthe income curve slightly bended (it can be shown in figure 4.1) in 1996/97 AD. Civil war,internal and external disturbance in Nepalese industries, increasingly appeared politicalinstability disturbed in industrial sector as a result the measureable fluctuations came in tonotice of electricity consumption for industry of Nepal.
In the period of 1956-2012 the income elasticity, price elasticity and cross elasticity weregreater than previous period. It shows that due to political recovery phase after a decade civilwar, industrialization become a milestone for future economic activities so consumption forelectricity become more elastic in this period. The consumption for electricity slightly increasedas increased in size of population or consumers in various fiscal years. Nevertheless, thedrastically have not changed in consumption pattern as per possible potentiality of energy,its main cause can be lack of investment environment, political instability (mainly civil war)along with defective laws and policies.
Almost seven years after the end of a 10-year internal conflict, Nepal remains one of thepoorest countries worldwide, ranking 145th out of the187 countries on the Human DevelopmentIndex and enhancing almost 3.5% (in average) of Economic growth per annum. These valuesare less than south Asian average values. Harnessing hydroelectric potential along the Himalayaswill not only provide Nepal with a more reliable source of electricity, it would also addressthe costs currently borne by the population. Rural electrification could mitigate nationalinequalities by ringing health and economic well-being to millions of Nepalese.

An Analysis of Electricity Consumption in Industrial Sector of Nepal 17
Nepal's energy forecast to 2028 indicates the national electricity shortage will only becomemore severe in the future. In 2028, Nepal will face an energy output of 17404 GWh and thesystem peak load is furcated to reach about 3679 MW under a medium growth (NEA).
ConclusionThe purpose of this thesis has been to derive and estimate a consumption function for theNepalese industrial electricity use, this in order to investigate changes in consumption patternsover the time period 1980-2012. By using yearly data on total industrial electricity use,electricity and oil prices and the value of production, conducting OLS regressions on a loglinear consumption function on the entire time period, and , in order to test the model for astructural break, on the two time periods 1980-1995 and 1996-2012 elasticities of consumptionwere obtained.
The coefficients for the own price elasticity of consumption and the cross price elasticity ofconsumption in the first time period as well as second time period were statistically significantrespectively. Whereas own price elasticity and cross price elasticity of consumption both aremore elastic in first and second period than in second and first period respectively. Thisimplies that the industries consumption for electricity has gone from being entirely priceinsensitive to a situation where electricity use responds to changes in the own price also inthe short run. One possible explanation for this is that the electricity price incorporates ahigher uncertainly ever since the electricity market has been deregulated. This induces firmsto expand their flexibility in energy use, and thus make substitution between these inputseasier. It is always spell out using electricity is less economic than using alternative sources.Even the price of electricity is high; industries are ready to consume more units of electricity.It could be main attraction to the investors in electricity production field.The examination on the industrial electricity consumption presented in this report by usingregression analysis and Chow test shown the structural break in hydroelectricity consumption.It means there is changed in consumption for electricity by Nepalese industries in varioustime periods.
These result point out some important conclusions, electricity is today being used moreefficiently in production process than earlier, implying that the value of production is higherper used unit of electricity today. The industrial electricity consumption seems today to bemore influenced by environmental factors such as policy regulations on a more efficientenergy use and environmental policy regulations. Since the environmental awareness and thework on a more efficient energy, use is in an early phase it can be expected that these resultswill be strengthened over time.
ReferencesAltrnative energy promotion center/ energy sector assistant programme (AEPC/ESAP). (2001). Micro-
hydro data of Nepal: Kathmandu, Nepal.
Bhusal, T.P. (2009). Basic econometrics. Ayam Publication Pvt. Ltd., Kathmandu, Nepal.
CBS.(2010). Statistical year book of Nepal 2010. Central Bureau of Statistics, Nepal.
Chama, Y.(2012). An econometric analysis of zambian industrial electricity consumption. An unpublishedM.Phil. dissertation submitted to University of Oslo, Norway.

18 Bhola Nath Ghimire
Chaudhry, A. (2010,September). A panel data analysis of electricity consumption in Pakistan. The labourjournal of economics, Vol.3,pp. 75-106.
Dahal, M.K. (2004). Nepalese economy. Central department of economics and New Hira BooksEnterprises, Kathmandu, Nepal.
Dhungel, K. R. (2007). Trends and patterns of energy consumption in Nepal. An unpublished Ph.D.dissertation submitted to Tribhuvan University, Kathmandu, Nepal.
Dougherty, C. (2007). Introduction to econometrics. Oxford University Press, Newyork.
Enders, W. (2010). Applied econometric time series. Wiley India Pvt. Ltd., New Delhi, India.
Gujarati, D.N. (2006). Basic econometrics. Tata Mc Graw Hill companies.
Http://www.ippan.org.np/Hp in Nepal.html (3/13/2012)
Https://energypedia.info/index.php/Nepal-Country- Situation. (3/13/2012)
Https://trn.gorkhapatraonline.com/index.php/op-ed/11095. (10/10/ 2014).
Hunt, L.,& Judge, G.(2005). Estimating underlying energy demand trends using UK annual data. Appliedeconomics letters, 12(4), 239-244.
IEA.(2013). IEA electricity information. OECD electricity and heat supply and consumption.
Koutsoyiannis, A.(1977). Theory of econometrics. Palgrave, New York, U.S.A.
Lundberg, L. (2009). An econometric analysis of the Swedish industrial electricity consumption. Anunpublished master thesis submitted to Lulea University of Technology, Sweden.
Maddala, G.S.,& Lahiri, K.(2009). Introduction to econometrics. Wiley India Pvt. Ltd., New Delhi,India.
Madnani,G.M.(2005). Introduction to econometrics, principles and applications. Oxford & IBH publishingCo.Pvt.Ltd., New Delhi, India.
MOF. (2001). Economic survey fiscal year 2000/2001. Ministry of Finance, Kathmandu, Nepal.
MOF. (2014). Economic survey fiscal year 2013/2014. Ministry of Finance, Kathmandu, Nepal.
National Planning Commission. (2013). The thirteenth plan (2013-2016). National Planning CommissionSecretariat, Kathmandu, Nepal.
NEA. (2013). Nepal electricity authority FY 2012/2013 a year in review. Nepal Electricity Authority,Kathmandu, Nepal.
Nicholson, W.(2005). Microeconomic theory basic principles and extension. South Western, Thomson,Mason, Ohio.
NOC.(2014). Price survey of petroleum product in Nepal. FY2013/14, Nepal Oil Corporation, Kathmandu,Nepal.
NRB.(2010). Quarterly economic bulletin FY 2010/11. Nepal Rastra Bank, Nepal.
Parajuli,R.(2013). Energy consumption projection of Nepal: An econometric approach,www.elsevier.com/locate/renene.
Sharma, P.N.(2000). Further Nepal and use water resource. The true market, Year 3, No.5.
Water and Energy Commission. (2012). Review of consumption of energy in Nepal FY 2011/12. Waterand Energy Commission Secretariat/Government of Nepal, Kathmandu, Nepal.

A Case of Higher Secondary Education Board of Nepal
TEACHER MANAGEMENT ANDDEVELOPMENT IN HIGHERSECONDARY EDUCATION
Dev Raj Paneru...?
AbstractThis case study on higher secondary education board of Nepal examines qualitatively humanresource management and development practices undertaken to manage and develop teachersserving in the schools under HSEB in reference and against the stated vision, mission andobjectives of higher secondary education board of Nepal. An assessment of HSEB goals, HRMpractices undertaken by the board and universally accepted significance of HRM perspectiveswere used as main research strategies to address the research question stated here: Howdoes HSEB Nepal address teaching faculty management and development issues in an endeavorto address quality educational outcomes as envisioned in its policy documents? The analysisof statistical data from the HSEB office publications, electronic media, and qualitativeinformation, and research participants' opinions showed that integrating sustainable HRMpractices in line with other functions of HSEB was crucial for attaining academic objectivesmeasurably.Key words: management, development, enculturation, globalization, post -secondary,commissions, entrepreneurship, human resource management, efficient, effective.
Education in NepalNepalese education system seems to have endured uneven changes from the time of itsinception. Both internal and external factors are taken accountable for changes in the fieldof education till the date which have been unpredictable. The main stream political systemssuch as authoritarian governments under Rana oligarchy followed by dictatorial monarchies,then in the 21st century multiparty democracy and currently federal republic system yet tobe institutionalized are major internal factors and UNO guidelines, donor support for educationalong with internationalized mindset leading to English enculturation through globalization,are the external factors (Sharma &Sharma, 2066BS), taken accountable to have set Nepal'seducation into today's formal structures generallydivisible in three hierarchical layers. Thelevels are; 1. School level education ;1-5 primary, 6-8 lower secondary, and 9-10 secondary.2. Higher secondary; 11-12 grades and 3. Higher education; bachelors and masters level asuniversity programs, all administered, planed, budgeted, supervised and monitored by ministryof education as the apex body (Wikipedia, 2014).
Teacher Management and Development in Higher Secondary Education 19
Mr. Paneru is the Lecturer of managerial communication at Global College of Management. He is the PhDScholar at Kathmandu University and also an exchange student of Masaryla University Gech Republic underErasmus Mundus Action II

20 Dev Raj Paneru
Turns and bounds that education has so far travelled through are required to be reviewed inorder to gain some insight into the entire system. In this connection, prior to modern education,there was the system of imparting Sanskrit education based on Hinduism that is alleged tohave permitted Brahmins to study Vedas, Upanishada, Jyotish (Astronomy) and science ofrituals (KarmaKanda) and the Chhetris to learn administration and art of warfare. Hence,education was confined to these groups to support the kings in their administration and courts. Buddhist monks imparted education based on their religion during the Malla regime(Http://www.geocities, 2014).
Latterly, Prime Minister Jung Bahadur Rana, on returning home from Europe established anEnglish school in Thapathali Palace on 7th Ashoj 1910 BS to teach his children only and thus,is regarded to have been the founder of modern education. Subsequently, in 1915 BS, EducationDepartment was established that founded Darbar high school which later shifted to RaniPokhari and was named Bhanu Madhmik Vidhyalaya. Ranas as well gave place to Sanskritand Language schools called Bhasa Pathsalas. On closing some of the language schools,Chandra Samser established Tri-Chandra College in 1916 that obviously paved foundationof higher education first time in Nepal (Edusanjal.com, 2014). On demolition of Ranaoligarchy, democracy in 2007 BS merely competed to establish political system but faced asack in 2017 overtaken by King Mahendra who established Panchayat system.However, he is regarded for introducing modern education system by giving place to neweducational system plan in 2028 (Bhattarai, 2014). Ever since, education in Nepal is traceableclearly in the structures as school, and higher education which was further demarcated asschool education, proficiency level and university level. Following this development, educationplanning was embedded with development planning and ever since several commissions havecome into frame in endeavors to reform and modify education to make it time relevant andcontextually beneficial. Bhattarai (2014) observed,
The National Education Planning Commission, which was the first of its kind, was formedin 1954 after the dawn of democracy in 1950 in the country. After this, six other commissionsand committees have been made and they are: The National Education Committee in 1961,The National Education SystemPlan 1971, The Royal Commission on Higher Education 1983,The National Education Commission 1993, The High Level Education commission 1992; andThe Higher Education Task Force, 1999.
Nevertheless, it is often observed that though education has been named modern, it has notleft its past legacy of traditional approach and segregating values even till the date. ProficiencyLevel was operated in TU whereas CTEVT administered technical courses for the same levelsimultaneously. But as proficiency level comprising 11 and 12 grades was becomingburdensome and difficult to operate along with increasing volume of undergraduate andgraduate level education in TU, higher secondary education act was drafted in 1989 to segregatehigher secondary level from university education.
In the same context, Higher Secondary Education Assembly was constituted under thechairmanship of the Minister of Education that introduced Higher Secondary Education Board(HSEB) in 1989 under the same act. Ever since, the board is involved in running the 10+2system in the country which was also recommended as being important toward specializationby Nepal National Commission of Education 1992. This is alleged to have been an initiationfor incorporating extra two years in school education as a change in the existing educationalstructure. The development aimed at meeting the middle level human resource and imparting
Teacher Management and Development in Higher Secondary Education 21
necessary knowledge and skills to the students pursuing further education, need invited byglobalization (www.hseb.edu.np/introduction).
There are approximately 3600 higher secondary schools run in private and community effortshaving Nepali and English medium at present. Nearly, entire higher secondary level populationis accommodated in the schools under HSEBas there is no other entity in Nepal that takenresponsible to educate this age group populace except Cambridge A level run privately inmeager number of institutions with meager number of students and a few technical schoolsrunning CTEVT programs (Ghimire, 2014).
Higher Secondary Education BoardFormation of Higher Secondary Board is often linked with a common realization in theeducation stakeholders that higher secondary level is far more important in extending thenurturing period of school age children from 10 years to 12 years by integrating grade 11 and12 grades deemed essential in shaping and preparing them for university education with qualityand skills (http://www.hseb.edu.np/introduction, 2014). At this turn of the time, highersecondary education board is one of the largest educational administrative bodies like SLCboard and is entitled to planning, organizing, leading and controlling the entire higher secondaryeducation system for general education that includes administrating educational and evaluationactivities, as well as activities relating issuance of credentials.
Producing middle level human resources as well as preparing students for university educationis the key objective that HSEB has adopted since its inception in 1992 as an option to currentlyrunning proficiency level in Tribhuvan University which eventually was phased out in theyear 2010. Understandably, increasing volume of students that a single university was notable to accommodate on one hand and liberalized education policy that opened the horizonfor public as well as private sectors to contribute in the field of educational entrepreneurshipmore freely on the other hand are supposed to have resulted into formation of HSEB.Apart from its key objective that of developing middle level manpower, HSEB aims atpromoting marginal populace for higher secondary education; produce capable and competentscholars and contribute as a feeder level for university education. The higher secondaryeducation council is responsible to forward policy and recommend strategy to the cabinet ofministers so as to address mission, vision and objectives of the board apart from taking theresponsibilities such as granting affiliation to schools , managing teachers, developinginfrastructure, developing curriculum, & controlling quality(ibid).
Presently, there are approximately 36oo higher secondary schools and some of them are newaffiliates in2071 with approximately more than 300000 students taking admissions andappearing in grade 11 exams every year and thus, the entire institution is believed to beaccommodating about 1000000 students in total (Gurung, 2013 in Sampreshana, 2013;Sampreshana, 2014).
Owing to ever increasing size of higher secondary level population and growing number ofschools and institutions, the council of higher secondary education is alleged to be holdinga huge national responsibility of educating almost entire learning population of post secondarylevel. The fact is that along with the increased volume of consumer groups such as schoolsand their students, HSEB is expected to have been preoccupied with policy, management andadministration related functions at centre, region, and local level far more extensively nowthan it used to be prior to 2010, before PCL was phased out from TU (Sharma, 2013 inSampreshana, 2013). As stated in its office website (2014), the specific objectives of Higher

22 Dev Raj Paneru

Teacher Management and Development in Higher Secondary Education 23

24 Dev Raj Paneru
at providing introductory remarks only, it does not seem to be adequate in addressing a largenumber of crucial areas without which management is alleged to remain incomplete.
Olum (2004) has examined modern management theories and practices stressing on thegrowing importance of managerial skills for managing complex organizations indicatingcomplexity in managing human resources in the emerging cross cultural contexts. The paperconcludes utmost importance of human resource over other kinds of resources or conditionsand thus, it shows that organizations either prosper or fail excessively depends on capablehuman resource and this in turn is possible only if HRM is effective and efficient. Despitepowerful advocacy on importance of human resource management, the paper does not seemto specify internal components of human resource management nor does it speak about howto address human resource development issues.
A profile of higher secondary education: Statistics books (2071 BS) is a book of statistics andit presents information on entire national result of the board in seven different methods. Thedivisions of result presentation are 1. Group wise result status of grade XI and XII 2. HigherSecondary School type wise result status 3. Development region wise result status 4. Sectoraloffice wise result status 5. Eco-development wise result status 6. District wise result statusand 7. School wise result status (Statistics Book, 2071 BS).
The presented data in the book showed that HSEB result in the national level in the year 2065BS remained below 46%, it was nearly 47% in the year 2066 BS, the result in the year 2067deteriorated and went down to 44%, it again rose up to 48% in the year 2068 BS but in theyear 2069 the HSEB result went far further down to 42 %, it again progressed a little andreached 44% in gross in the year 2071. From the tabulated data in the book it becomes clearthat HSEB result has remained highest in all categories in the year 2068 and it sustained leastpercentage in the year 2069. Although result status presented in the book may be verysignificant in getting some insights on how HSEB has been functioning, in getting to knowabout students' academic performance which can as well be treated as an indicator of lettingsome insight upon performance of teaching faculties and schools as exam results are prettygood indicators for educating process and personnel competence (Gurung, 2014). However,as there is no other area of information appended in the book, it can't be taken useful ifrecordable data are required in other areas as curriculum, school, teacher, staff managementetc.. Besides, the book contains foreword by member secretary and vice-chairman who claimedthat the purpose of the book is to identify changes that have occurred since 2064BS till thedate and stated that it contains information on different activities of higher secondary educationboard. But in fact, it merely limits to presenting information on result status in seven differentheads including students and schools, regions etc. and hence, it does not speak anythingregarding management, development and status of teaching faculty under HSEB. Sampreshan (2014) a latest publication of HSEB in the form of bulletin stated vision, mission,and objectives that its vision is to develop the youth of 21st century Nepal as able citizenswho would be able to deal with forth coming challenges. The objectives are to develop middlelevel work force and to prepare capable scholars eligible to join university education. Thepublication presents some glimpses on teachers and head teachers training and otheradministration related information but does not seem to provide information about policy andpractices regarding management and development of higher secondary level teaching faculties.It presents the list of schools with their result of XI (2069) and XII (2070) and has only 3266schools listed appeared XI and XII examination in 2069 and 2070 respectively. The result ofXII seems to have been progressive in the year 2070 as it is 52% in gross. Despite ample

Teacher Management and Development in Higher Secondary Education 25
information on various areas, the bulletin does not seem to have given any space for informationabout HRM and HRD to link teaching faculty status.
SSRP MOE (2009), in full form school sector reform project is a national project that is aimedto redesign the school level education including higher secondary education which initiallyhad been a university proficiency level latterly handled by higher secondary board after itsestablishment in 1992. The document speaks in detail on the modalities e.g. structure,curriculum, administration and supervision and monitoring and over all frame of action. Thedocument proposes teaching faculty management as well as development as the keyresponsibilities of department of education which till the date seems to be providing twoteachers to a school on relief quota and the rest to be managed by the school managementcommittee itself for higher secondary level. Nevertheless, the SSRP does not seem to haveworked in details about modality of faculty management so far.
Reform in higher secondary education : Connecting education with the world bank bySharma, T.( 211). is an argumentative feature journal paper aiming to discuss various aspectsof integration of curricula to bring transformation on higher secondary education in Nepal.The paper is useful as it supports the idea of teacher collaboration while exercising thecollaboration of curricula but as it is limited to addressing its key concern i.e. to discuss andadvocate on various modalities of curricula integration, the paper speaks very little aboutteacher management issue. It rather speaks about collaborating teachers as a means to collaboratecurricula. There is no further detail on how teaching resources under HSEB are being managedand developed.
Review in ConclusionThe above reviewed journals, documents and books can be categorized as office documentsof HSEB, theory journal papers and information documents. The theoretical works show thathuman resource management and development is a very crucial area of concern for managementof any organization in any size and it has been more crucial in the today's changed contextsi.e. cross cultures as the external factors in organizations. In this regard, for HSEB as it aimsto develop youth in 21st century Nepal who would be able to tackle with the any kind ofchallenges in their professional life, effective and efficient management and development ofteaching personnel and resources in all its faculties would be essential. But the documentsshow that there are still no clear landmarks nor any frames to deal with this issue as the schoolsare left to manage and develop their teachers on their own except provision of only 2 teachingpersonnel provided to a school in all.
Study ContextThe present study is an exploratory study. Its field is Higher Secondary Education Board. Thehead office of the board is located at Sanothimi- Bhaktapur Nepal. Since the teaching facultymanagement and development issue is supposed to be one of the concerns of HSEB in thelight of the fact that education is centrally controlled phenomenon in the country, head officewas selected over other sectoral, regional and district offices for data generation purpose.Along with Kathmandu district office was contacted for a telephone conversation and thechief of the office was interviewed to learn whether the district offices coordinated the schoolsfor human resource management and development purposes or not.
The study was conducted using a qualitative case study approach in higher secondary boardhead office and one district office as stated above. The chief of the Kathmandu district

26 Dev Raj Paneru
office, the director of planning section in the HSEB head quarter, the under secretary of theplanning section, and the section officer of the computer section of HSEB head quarter werethe participants of this case who volunteered information spontaneously as interacted in personand telephone conversation both. All the mentioned participants were purposively selecteddue to the fact that the planning section and computer section were supposed to handle thefaculty related issues e.g. training and development activities. The computer section head wasinterviewed as the section had to responsibility to maintain data related to HSEB profile,section wise activities and programs and achievements. Under secretary was approached witha view to get the details on activities under planning section.
Data collectionHaving collected and analyzed data about result status, and faculty related programs beinghandled by HSEB from secondary sources i.e. statistics book of HSEB, primary data werecollected in two different periods from headquarter of HSEB and also from the district officeonce in January first week and secondly in the third week of January 2015. Semi structuredquestionnaire and interview guide lines were used to generate information from the researchparticipants. One participant from Kathmandu district office was interviewed on phone whereasother participants including the chief of planning section, undersecretary and chief of thecomputer section were interviewed in person for which pre- consent was obtained throughphone call two days prior to face to face interview of the participants. The participants wereconversantly interviewed and for this, the researcher performed two duties simultaneouslyi.e. interviewing the participants and note taking on their information so as to keep anonymityof the information (Skene, 2007). Note taking was carried out in electronic device i.e. laptopcomputer.
Data AnalysisThe data recorded in the soft form were used for sorting and analysis in accordance with theresearch questions and objectives i.e. to find out about the volume of teaching resources underHSEB, to examine the HRM practices of HSEB, to assess human resource developmentpractices, and evaluate relevance and effectiveness of the HSEB practices in relation with itsobjectives, and then reflection and interpretation of their meaning qualitatively. The datacontained guiding questions that were designed to address all the above stated objectives andresearch questions which I first sorted in their category so as to help interpretation with clarity.The guiding questions were used to sort out the answers and information derived from theresearch participants while analyzing them. A qualitative model of data analysis suggestedby Seidel (1998) who invented the ideas as 'noticing, collecting, and thinking about interestingthing' was practically applied in this study in the form of noticing by identifying the suggestedmeanings from the participants in their interviews, reviewing on the noticed meanings,collecting special information out of the data gathered and then reflecting on the types of dataand their denotative as well as connotative meanings.
Primary FindingsThis section presents findings of this study in the light of significance HRM and HRD practicesin general hold, in the view of objectives of HSEB and significance that teaching facultymanagement and development would have to achieve the pronounced objectives in the policydocument of HSEB.

Teacher Management and Development in Higher Secondary Education 27
Financing for Higher Secondary Education Teacher Management andDevelopmentFinancing for teaching faculties is a supply side of financing of education and it entails fundinginputs on human and material resources e.g. remuneration, compensation and developmentof the faculties for their skills and career promotion on one hand and development andaccessibility of physical as well as technological devices on the other hand that the planners,government bodies or managers need to ensure (Heakal, 2014). Neither HSEB nor thedepartment of education is clear about the number of teaching faculties involved in the schoolsas the authorities pointed out that they were responsible to support schools with only reliefquota whereas the rest had to be done by the concerned school management committees.In this regard, the HSEB under secretary informed that the HSEB has financed 4000 teachersof higher secondary level through relief quota in coordination with the department of educationand recently the board has decided to make the number 2000. The number of schools underHSEB is about 3600 among which approximately 1000 schools are privately managedinstitutions. In this connection, 6000 teachers with recently added quota, the ratio in all thecommunity schools turns out to be 2 teachers per school. From the information as sited here,it is obvious that the financing on higher secondary schools is a poor sight and has obviouslyaffected the funding inputs on teaching faculties and thus, it is worth stating that the highersecondary education is in common facing the issue of insufficient supply of teachers ascompared to its student volume. Besides, the contribution of local people and their resourcesis the only support through which the entire system seems to be under operation. Regardinghow far faculty management and development issues are adequate, it can be concluded thatit is not as all school committees in all areas of the country cannot be asserted to be equallyequipped to supply competent teaching resources in the number required.
Planning, Recruitment, Selection, Compensation, and Faculty DevelopmentHuman resource planning, recruitment, selection and compensation are key tools of humanresource management whereas, development of employees comprises the activities such astraining, assessment of training, reward and motivation and promotion (Agrawal, 2012).Regarding HRM and HRD in higher secondary education, the chief of the planning sectionmaintained, HSEB is stuffed with exam, curriculum and school affiliation related work loadmore than the capacity of its staff already and so, including the issues planning, recruitment,selection, compensation and faculty development would be impossible along with. I can'tsuggest that it should be endorsed in HSEB, rather, department of education should be assignedteaching resource management and development responsibilities.
The opinions as such clearly indicated that teaching faculty management and developmentwas treated as a secondary issue or no issue at all. The focus laid by the board was on howto conduct the exams, develop curriculum and affiliate schools particularly. Thus, it can bestated that despite advent of advance management practices imported by a number of Nepaleseorganizations through multinational and cross cultural companies and organizations, teachingfaculty management at HSEB as a mainstream organization of national and international valuewas still limited to traditional HRM concepts like in many government organizations treatingthe issue as personnel administration and labour relations functions (Agrawal, 2012, p. 41).The under secretary along with the district office chief informed regarding faculty compensationand development that all the teaching faculties even the one srecruited through government

28 Dev Raj Paneru
funding were temporary, though the planning chief informed that nominal training packageswere handled by HSEB every year but that was in no respect sufficient as compared to demandof the giant size of the faculties under the board.
No provision with HSEB till the study time to make the teachers permanent, plan demandand supply sides, compensate and develop the faculties is simply an indication that despitelarge volume of faculties' involvement in educating nearly 1000000 students throughout thenation in higher secondary education, the organization has failed in addressing the key issuewhich is no other than faculty management and development issue and therefore, it is worthmaking out that the vision of HSEB, 'develop capable youth of Nepal to deal with thechallenges of 21st century successfully' (Sampreshan, 2014), is still far behind from beingachieved.
Faculty Performance Management System in Higher Secondary EducationPerformance management is a practice of performance appraisal that must apply job standardoriented, comparison oriented and objective oriented methods to ensure validity and reliabilityin the appraisal of teachers' performance (Fancy, 1999 in Sharma Poudyal, 2013).
The chief of the planning section of HSEB opined, "department of education" was accountablefor monitoring and supervision of higher secondary schools and therefore, even teachers'performance was embedded within the task of school supervision." He further added,When schools recruited their faculties observing the criteria and qualifications prescribed byHSEB, this fairly worked as appraisal of faculties' performance and thus sufficed in performancemanagement."
The opinions as expressed by the HSEB authority clearly indicate that there was no systematicnor any scientific performance management system developed in HSEB though the volumeof the faculties was too huge to be imagined in any ordinary set up or organization of anykind. In the situation as such claiming for successful attainment of the stated goals or visionis likely to end in debates and doubts.
Module of Teacher Management and Development under HSEBFaculty management and development are purely two determinant actions of human resourcemanagement and development deemed highly crucial for organizational goal achievement asthese components deal with human skills and performance for quality and productivity of theorganization. All the HRM and HRD oriented activities such as collaborative goal setting,performance review and evaluation, discipline, reward, organizational citizenship behavior,training, job design, job evaluation, employee benefits, retrenchment, and retention are someof the major concerns that the human resource department of an organization must deal withso as to manage the whole organization effectively and efficiently (Robbins & DeCenzo, 2005).
All the research participants of this study agreed that HRM/D should not remain ignored areafrom the mainstream concerns because all of them thought that success or failure of anorganization in achieving its vision, mission and objectives at large is determined by howcompetent, dedicated and reliable its human resources tend to be and how proficiently theresources are managed by its HRM/D department. In the light of their expressed opinions, itseemed reasonable to suggest that either HSEB or department of education was required toestablish a separate human resource management and development section for higher secondarylevel so that the faculties would get recruited, controlled , managed and developed to makethe entire program sustainable like the SLC or junior school level programs for which public

Teacher Management and Development in Higher Secondary Education 29
financing has been handled directly by the government for teaching resources in Nepal. Theremight be various models of operating human resource department for higher secondary levelbut before all, the concerned stakeholders, planners and managers of the board and the entireorganizational entities needed to build a consensus on the need of sustainable mechanism thatwould eventually take the responsibility in hand. The chief of the planning said,Department of education need to be expanded from its currently practiced partial interventionand responsibility of providing relief quota teachers to schools to handling overall responsibilityof managing and developing the entire teaching faculties in the schools under HSEB nationwide.Further it was suggested after some discussions on complicacies likely to be faced by departmentof education in the light of the fact that it was already stuffed with national level responsibilityof managing and developing exceptionally large volume of teaching faculties for school levelthat the issue of HRM and HRD for higher secondary level could be made far more accountable,sustainable, efficient, and effective in handling all HRM/D related matters such as planning,job design and analysis , recruitment and selection, training and development, performanceappraisal, motivation, reward, compensation, discipline and labour relations and grievances,occupational safety and health if a separate Higher Secondary Education Teacher ServiceCommission could be incepted. The participants pointed out that internal resources of HSEBas well as external resources could be brought into use for this purpose and besides, it wasconcluded that HSEB would become more accountable and enriched if it could be integrateddirectly through a subsidiary unit like TSC as HR department.
ConclusionHSEB envisions catering the nation with quality education to prepare middle level manpowerand prepare capable scholars who would sustain university education positively. Its vision isundoubtedly super and commendable. The board accordingly has been undertaking verycrucial areas of action oriented to achieving its vision, mission and objectives. Planning,management and development of curriculum and evaluation system for the entire HSEB levelpopulation along with management of the technical and conceptual level staff are the keyfunctions that HSEB has been performing from its inception. Nevertheless, the study findingsshowed that the board has considerably ignored extensively in policy and in practice the mostcritical area called HRM/D under which an organization or its allocated department mustcarry out the functions e.g. planning, management and development of human resources(Agrawal,2012) as had to be the areas of concern for the board as a national organization. This seemsto have forced the schools to address the issue of HRM/D on their own to a large extent andthus, anomalies, inefficiencies and obstacles in teaching human resource management forhigher secondary education are often heard of as strong issues challenging HSEB and departmentof education against their estimated outcomes.
Even in a country like Bangladesh, laden with poverty fiercer than Nepal, the higher secondaryeducation is publically financed and teaching faculties are paid by the central government(Budget_Paper_2012), Nepali state needs to be prepared to incorporate HRM/D for facultyand staff for sustainability in its present performance and future goals as well.Thus, further need survey researches or researches that aim at fixing human resourcemanagement and resource development modalities are recommendable so that HSEB not onlypersists its programs in conventional manner but can come as a time fitting and a modernizednational organization with ever multiplied responsibilities, skills, technologies and attainmentsas envisioned in its policy.

30 Dev Raj Paneru
ReferencesBhattarai, K. P. (2014). Higher education in Nepal: Truth and challenges. Retrieved from
http://www.telegraphnepal.com/national/2007-08-22/higher-education-in-nepal;-truth-and-challenges.
Robbins, S. P. & DeCenzo, D. A. (2005). Fundamentals of human resource management. India: SanatPrinters.
Gurung, G. M. (2014). Seven problems of higher education. Kantipur national daily. Kathmandu:Kantipur Publications Ltd. September 19, 2014.
Legacy analytics(2015). Schaumburg, IL60173. Retrieved from www.legacyanalytics.net, January13.
Http://edusanjal.com/college/details/tri-chandra-multiple-campus retrieved from www.google.com(2014).
http://en.wikipedia.org/wiki/Education_in_Nepal retrieved on Nov. 12, 2014.
Http://www.geocities.ws/gknepaleyn/data/data/history.html, retrieved on 12- 26- 2014.
http://www.hseb.edu.np/introduction, retrieved from www.google.com/nepal, on January 19, 2015.
http://www.unicef.org/bangladesh/Education_Budget_Paper_2012_Dec_3.pdf retrieved fromwww.google.com/nepal on January 19, 2015.
Heakal, R.(2014). Economics basics: Supply and demand:http://www.investopedia.com/university/economics/economics3.asp
Kafle, B. D.(2060 BS). Education planning. Kathmandu : Bhudi Prakashan.
Koirala, N. P. (2014). Mission education: An interview with Narayan Prasad Koirala, the HSEB speaker.Sagarmatha television live, retrieved on Nov 9, 2014 6: 30 PM.
Olum, Y. (2004). Modern management theories and practices. Uganda: Makerere University Facultyof Social Sciences Department of Political Science and Public Administration.
Sampreshana (2013). Ucha madhyamik sikshya parishad ka gatibidhi sambandhi prakasan. Nepal:Higher Secondary Education Council.
Sampreshana (2014). Ucha madhyamik sikshya parishad ka gatibidhi sambandhi prakasan. Nepal:Higher Secondary Education Council.
School sector reform project (2009). Ministry of Education. Nepal
Sharma, C. & Sharma, N. (2066). Foundations of education. Kathmandu: M. K. Publishers andDistributors.
Sharma Poudyal, Ch. (2013). Private schooling and Fayol's principles of management: A Case fromNepal. Journal of education and research, Vol. 3, No. 3, pp.6-23.
Sharma, T.(2011). Reform in higher secondary education: Connecting education with the world of work.Higher secondary education journal, Vol 1, No. 1, Dec. Nepal.
Skene, C. (2007). Interviewing women: Using reflection to improve practice. Nurse researcher, 14(4),53-63.

Does Development of Commercial Banks Spur Economic Growth 31
DOES DEVELOPMENT OFCOMMERCIAL BANKS SPURECONOMIC GROWTH
Dr. Dipak Bahadur Bhandari & Keshab Acharya...?
AbstractThis paper examines the degree of relationship and direction of causality between thedevelopment of commercial banks and economic growth of Nepal. The impact of one onanother is critically important for policy makers too, and it is for this reason the researchersbelieve that the above issues must be investigated through an empirical study. The motivationfor this study therefore, arises from a number of shortcomings, various gaps and unresolvedissues in the literature on the linkages between commercial banks and economic growth. Itis anticipated that the approach and methods adopted in this research will help to bridge thisgap. The main aim of this research is to make a contribution towards the understanding ofthe relationship between the development of commercial banks and economic growth of Nepal.Granger causality test provides the mixed result. There is the bidirectional causality betweenper capita real GDP and domestic assets of commercial banks to the total domestic assets.Similarly, there is no causality between per capita real GDP and private sector credit to totalcredit of commercial banks. Granger causality test also shows the unidirectional causalityas per capita real GDP Granger causes private sector credit of commercial banks to GDPbut causality in the opposite direction is not supported statistically.
IntroductionThe financial sector is a lifeline of all economic activities. The performance of financialsystem determines economic growth through successful channeling of resources to theproductive areas, which is prerequisite for economic growth. Banks are among the mostimportant financial institutions in the economy. They are the principal source of credit formillions of individuals and families and for many unit of government. Banking sector in Nepalis facing a rapidly changing market. Nepalese banking industry has significant changes overpast decades as a result of liberalization, deregulation, advances in information technologyand globalization. The financial sector liberalization resulted into entry of new firms in themarket; deregulation widened the scope of activities and delimited the banking activities;advancement in technology resulted into new ways and tools to perform banking activities;and globalization added more pressure on competitiveness of individual banks. Nepal has areasonably diversified financial sector as evidenced by the number and variety of institutionsthat play an active role in the society. Relative to Nepal's small and underdeveloped economic
Dr. Bhandari is the Registrar of Pokhara University.Mr. Acharya is the Lecturer of Management & Finance at Uniglobe College, Pokhara University Affiliate.

32 Dr. Dipak Bahadur Bhandari & Keshab Acharya
base over the past 20 years, Nepal's financial sector has become deeper, and the number andtype of financial intermediation has grown rapidly with in this period. The Nepalese financialsector has grown significantly both in terms of business volume and size of assets and marketcapitalization (Shrestha & Bhandari, 2008).
A well functioning financial sector plays a crucial role in the process of economic developmentby efficiently mobilizing resources and allocating capital for productive investment projects.After the introduction of financial sector reforms, the number of banks and other financialinstitutions with variegated types of financial instruments has emerged up. As a first step ofinitiation to liberalize the financial sector since mid-1980s, entry barriers were removed. Threejoint venture banks were established in the three subsequent years from 1985. Following it,interest rates were liberalized gradually. Then, especially after the restoration of democracyin 1990, popularly elected government gave a major thrust on economic and financialliberalization in Nepal. The institutional network and volume of operations of the financialsystem has expanded and diversified. The number of other financial institutions has likewiseseen a quantum jump. Realizing the significance of the financial system in the economicdevelopment, the government formulated and implemented various policies and processesduring the past one and a half decade. They are, permission to establish joint venture banks,autonomy in the determination of the interest rate, scrapping of statutory liquidity ratio,implementation of the prudential guidelines, removal of credit ceilings, and introduction ofopen market operations and other indirect instruments of monetary policy. This has resultedsignificant improvements in quantitative as well as qualitative dimensions of the financialsystem (Bhetuwal, 2005).
Over the past decade, Nepal has made serious efforts to transform itself into a market-basedeconomic system and adopted the policy of financial sector reforms. The financial sectorreform aimed at enhancing savings mobilization and credit allocation to the private sector.However, growth experienced less than expectation, which also affected the performance ofits financial sector. Nepal formulated a comprehensive financial sector reform to deregulatethe financial markets from decades of government intervention, mainly, by late 1980s and1990s. Despite of the efforts on financial sector reform, critics argue that the reform has hadlittle impact on mobilization of financial savings. Instead, the reform led to high nominalinterest rates on lending (rather than deposit) and continuous devaluation of its currency.Improvements so far achieved after the introduction of reforms, mainly in the banking sectorare not satisfactory. Mainly the performances of public sector banks have been observed tobe poor. So, Nepalese banking sector is in the process of broad and comprehensive reforms.Still there are some loopholes making reform efforts less effective. It is, therefore, critical toexamine the causal relationship between the development of commercial banks and economicgrowth of Nepal (Shrestha, 2005).
Literature ReviewConceptual ReviewEconomists hold the view that the development of the financial sector is a crucial elementfor spurring economic growth. Through their role of allocating capital, monitoring managers,mobilizing savings and promoting technological changes among others, financial intermediariesplay a significant role in economic growth. Finance has for a long time been a neglected areain development literature, but a number of recent writings have helped to redress this imbalance.

Does Development of Commercial Banks Spur Economic Growth 33
This neglect of finance as regards economic development is somewhat surprising, consideringkey role that savings and investments play in the theory of economic growth as described byHarrod (1939), Domar (1946), Solow(1956) and the importance ascribed to it by Schumpeter(1911) in his theory of economic development, McKinnon (1973) and Shaw (1973) andproponents of their views. Whether or not they have provided definitive guidelines for financialpolicies, or even an understanding of the role of finance in economic growth, is anotherquestion.
Role of Financial Institutions in Economic GrowthFinancial development can be defined as the ability of a financial sector to acquire information,enforce contracts, facilitate transactions and create incentives for the emergence of particulartypes of financial contracts, markets and intermediaries, and all this at a low cost (Rajan andZingales, 2003; Levine, 1999). Financial development occurs when financial instruments,markets and intermediaries ameliorate - though not necessarily eliminate - the effects ofinformation, enforcement and transaction costs, and therefore better provide financial services.Thus, financial development involves improvements in the (i) production of ex-ante informationabout possible investments, (ii) monitoring of investments and implementation of corporategovernance, (iii) trading, diversification, and management of risks, (iv) mobilization andpooling of savings, and (v) exchange of goods and services. Each of these financialfunctions/services may influence saving and investment decisions and hence economic growth.Since many market frictions exist, and laws, regulations and policies differ remarkably acrosseconomies and over time, the impact of financial development on growth may have differentimplications for resource allocation and welfare in the economy.
There are two distinct views of the finance-growth nexus in the traditional developmenteconomics. The first view was first proposed by Schumpeter (1911) who contends that servicesprovided by financial intermediaries are essential drivers of innovation and growth. Thus,well-developed financial systems channel financial resources to their most productive use.Schumpeter's view was later formalised by Goldsmith (1969); McKinnon (1973); Shaw (1973);King and Levine (1993 a,b); Fry (1995) and Pagano (1993), to name just a few, who allbelieved that financial development is a catalyst for economic growth.The second view suggests that the increase in the demand for financial services resulting fromeconomic growth is the major driving force behind the development of the financial sector.This mechanism is stressed in the work of Robinson (1952). According to the latter as aneconomy grows, more financial institutions, financial products and services emerge in marketsin response to a higher and for financial services.
Although plausible, the importance and correlation between financial sector development andeconomic growth is not the only possible description of reality, since growth can also be goodfor finance. Indeed, many well-known scholars, including Robinson (1952) and Ireland (1994),have long rejected this hypothesis on purely theoretical grounds. In their view, a lack offinancial development is simply the manifestation of a lack of and for financial services. Asthe real sector of the economy expands, the various financial services increases, and will thusbe met by the financial sector. Robinson (1952) argued that financial development followsgrowth, and articulated this causality argument by suggesting that "where enterprise leadsfinance follows". Even though conclusions must be drawn with caution, the preponderanceof theoretical reasoning and empirical evidence suggests a positive, first-order relationship

34 Dr. Dipak Bahadur Bhandari & Keshab Acharya
between financial development and economic growth (i.e. finance is related with and leadsto economic growth).
If these opposing theories are a correct representation of reality, then policy efforts to promotefinancial development will be premature, and will in fact amount to a waste of scarce resources.However, if the opposite theory is not correct, policy-makers should focus attention on thecreation and promotion of modern financial institutions, including banks, non-banks and stockmarkets, in order to promote genuine and enduring economic growth.
Empirical ReviewGreenwood and Jovanovic (1990) and Bencivenga and Smith (1992) have given a new impetusto the relationship between financial development and growth as these models postulate thatsavings behavior directly influences not only equilibrium income levels but also growth rates.Thus, financial markets can have a strong impact on real economic activity. On the other hand,Luintel and Khan (1999) have used endogenous growth models to show a two-way relationshipbetween financial development and economic growth. However, despite the emergence ofnew growth theories, the debate on the direction of causality between financial developmentand economic growth remains apparent yet. Greenwood and Jovanovic (1990) have addressedthe context of financial structure and economic development to show causal relationshipbetween financial development and economic growth in Pareto-optimal competitive model.Economic growth provides the development of financial structure and, in turn, allows forhigher growth through efficiency in investment. Assuming that many entrepreneurs solicitcapital and that capital is scarce, financial intermediaries produce better information on firms,thereby fund firms to more promising and induce a more efficient allocation of capital.King and Levine (1993a, 1993b) have found that besides identifying the best productiontechnologies, financial intermediaries may also boost the rate of technological innovation byidentifying those entrepreneurs with the best chances of successfully initiating new goods andproduction processes. King and Levine (1993a) have examined the capital accumulation andproductivity growth channels of 77 countries over the period 1960-1989, by systematicallycontrolling for other factors affecting long-run growth, they construct additional measuresof the level of financial development, and analyze whether the level of financial developmentpredicts long-run economic growth, capital accumulation, and productivity growth. Theyfound very consistent results across the different financial development indicators. Theyhowever, simply found the potentially large long-term growth effects from changes in financialdevelopment.
Levine (1997) has assessed theoretical and empirical evidences on finance growth nexus thatthe financial system that active role in the economic growth. Development of financialinstitutions and markets are crucial for the long run growth process. The development in thenon-financial (i.e. real) sector, information and technological changes, innovations of computer,financial and monetary and other economic policy, legal and political system and institutionsetc have a direct influence in the development of the financial system
Further, Levine (2004) has suggested that the countries with better functioning financialsystem (whether bank-based or market-based), grow faster and it eases constrains on externalfinance. He has stressed on co-evolution of finance and growth. Technological innovationmay foster growth in the presence of a well functioning financial system. It also affects theoperation of financial systems by transforming the acquisition, processing, and dissemination
Does Development of Commercial Banks Spur Economic Growth 35
of information. Importantly, the financial system may provide different services at differentstages of economic development, so that the financial system promotes growth.Calderon and Liu (2003) have examined pooled data of 109 countries to examine the directionof causality between financial development and economic growth by employing GewkeDecomposition test. They found the five distinct results as; financial development generallyleads economic growth; bi-directional causality between financial development and economicgrowth; in developing countries, financial deepening causes more to growth than industrialcountries (supply leading supportive);financial development has larger effect on economicgrowth in long run; financial deepening contributes economic growth through more rapidcapital accumulation and productivity growth.
Jalil and Ma (2008) studied that the impact on the financial development and economic growthin China and Pakistan. Their hypothesis were "financial development leads to growth" underthe ARDL framework by using the deposit liability ratio and credit to private sector as theindicators of financial development. They found that a positive and significant relationshipbetween financial development and economic growth exists in the case of Pakistan. But, inthe case of China, their analysis showed that a positive and significant relationship for creditliability ratio and a positive, yet insignificant, relationship with credit to private sector.Fadare (2010) empirically identifies the effect of banking sector reforms on economic growthin Nigeria from 1999-2009 by using credit to the private sector and other variables as well.He found negative relationship however the result was insignificant. In a similar kind of studyconducted by Eslamloueyan and Sakhaei (2011) in Middle East suggest that there is bidirectionalcausality between financial development and economic growth in both the short- and longrun. Hassan, Sanchez and Suk Yu (2011) found a positive relationship between financialdevelopment and economic growth in developing countries. Moreover, they have shown atwo-way causality relationship between finance and growth for most regions and one-waycausality from growth to finance for the two poorest regions using short-term multivariateanalysis .They argued that a well-functioning financial system is a necessary but not sufficientcondition to reach steady economic growth in developing countries.
Nepalese PerspectiveDemetriades and Luintel (1996) have examined the effects of banking sector policies on theprocess of financial development and economic growth of Nepal over the period of 1960-1992 by using unrestricted error correction model (UECM). The dynamics between financialdevelopment and economic growth are examined by exogeneity tests. They have also constructedthe index of financial repression by using principal component method to quantify the influencesof banking sector policies on financial development, independently of the interest rate. Theycould not find support for real interest rate as determinant of financial development. Theyhave jointly determined financial development and economic growth. In other words, policiesdetermining financial depth also influence economic growth and vice-versa.Khanal (2003) has criticized economic reforms in Nepal for an abrupt initiation. Critics arefor accepting conditions of donor agencies, even if they were impossible to implement.Externally dictated reforms could not generate national consensus among working politicalparties as well. Reforms are criticized for no assessments of the existing domestic conditions,absence of participatory process to enlist cooperation of the stakeholders. As a result ofreforms, there was a massive devaluation of domestic currency, tariff rates at the lowest in

36 Dr. Dipak Bahadur Bhandari & Keshab Acharya

Does Development of Commercial Banks Spur Economic Growth 37
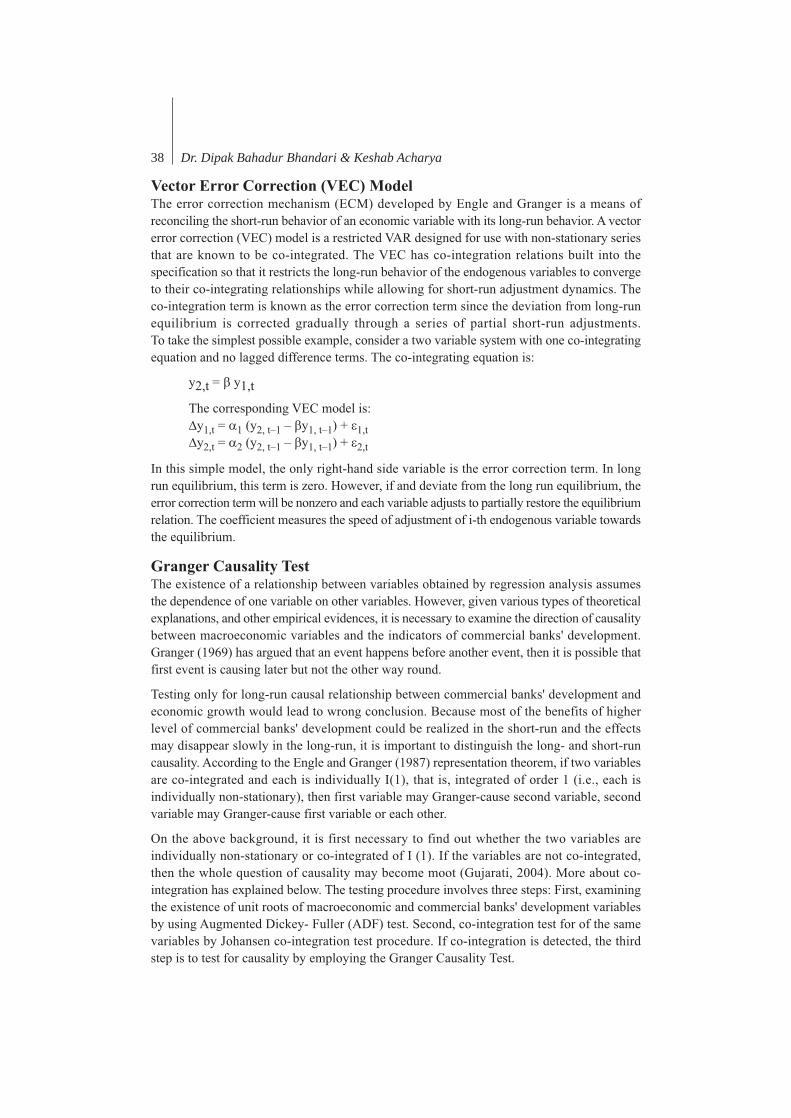
38 Dr. Dipak Bahadur Bhandari & Keshab Acharya
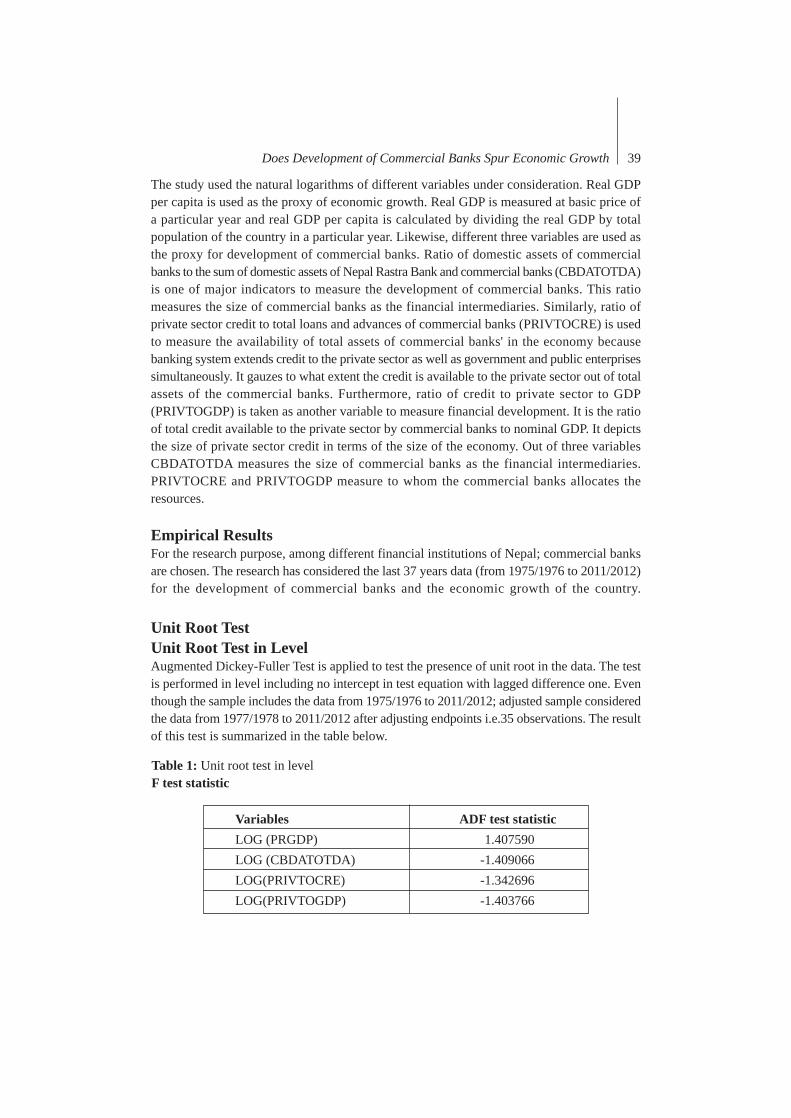
Does Development of Commercial Banks Spur Economic Growth 39
The study used the natural logarithms of different variables under consideration. Real GDPper capita is used as the proxy of economic growth. Real GDP is measured at basic price ofa particular year and real GDP per capita is calculated by dividing the real GDP by totalpopulation of the country in a particular year. Likewise, different three variables are used asthe proxy for development of commercial banks. Ratio of domestic assets of commercialbanks to the sum of domestic assets of Nepal Rastra Bank and commercial banks (CBDATOTDA)is one of major indicators to measure the development of commercial banks. This ratiomeasures the size of commercial banks as the financial intermediaries. Similarly, ratio ofprivate sector credit to total loans and advances of commercial banks (PRIVTOCRE) is usedto measure the availability of total assets of commercial banks' in the economy becausebanking system extends credit to the private sector as well as government and public enterprisessimultaneously. It gauzes to what extent the credit is available to the private sector out of totalassets of the commercial banks. Furthermore, ratio of credit to private sector to GDP(PRIVTOGDP) is taken as another variable to measure financial development. It is the ratioof total credit available to the private sector by commercial banks to nominal GDP. It depictsthe size of private sector credit in terms of the size of the economy. Out of three variablesCBDATOTDA measures the size of commercial banks as the financial intermediaries.PRIVTOCRE and PRIVTOGDP measure to whom the commercial banks allocates theresources.
Empirical ResultsFor the research purpose, among different financial institutions of Nepal; commercial banksare chosen. The research has considered the last 37 years data (from 1975/1976 to 2011/2012)for the development of commercial banks and the economic growth of the country.
Unit Root TestUnit Root Test in LevelAugmented Dickey-Fuller Test is applied to test the presence of unit root in the data. The testis performed in level including no intercept in test equation with lagged difference one. Eventhough the sample includes the data from 1975/1976 to 2011/2012; adjusted sample consideredthe data from 1977/1978 to 2011/2012 after adjusting endpoints i.e.35 observations. The resultof this test is summarized in the table below.
Table 1: Unit root test in levelF test statistic
Variables ADF test statisticLOG (PRGDP) 1.407590LOG (CBDATOTDA) -1.409066LOG(PRIVTOCRE) -1.342696LOG(PRIVTOGDP) -1.403766
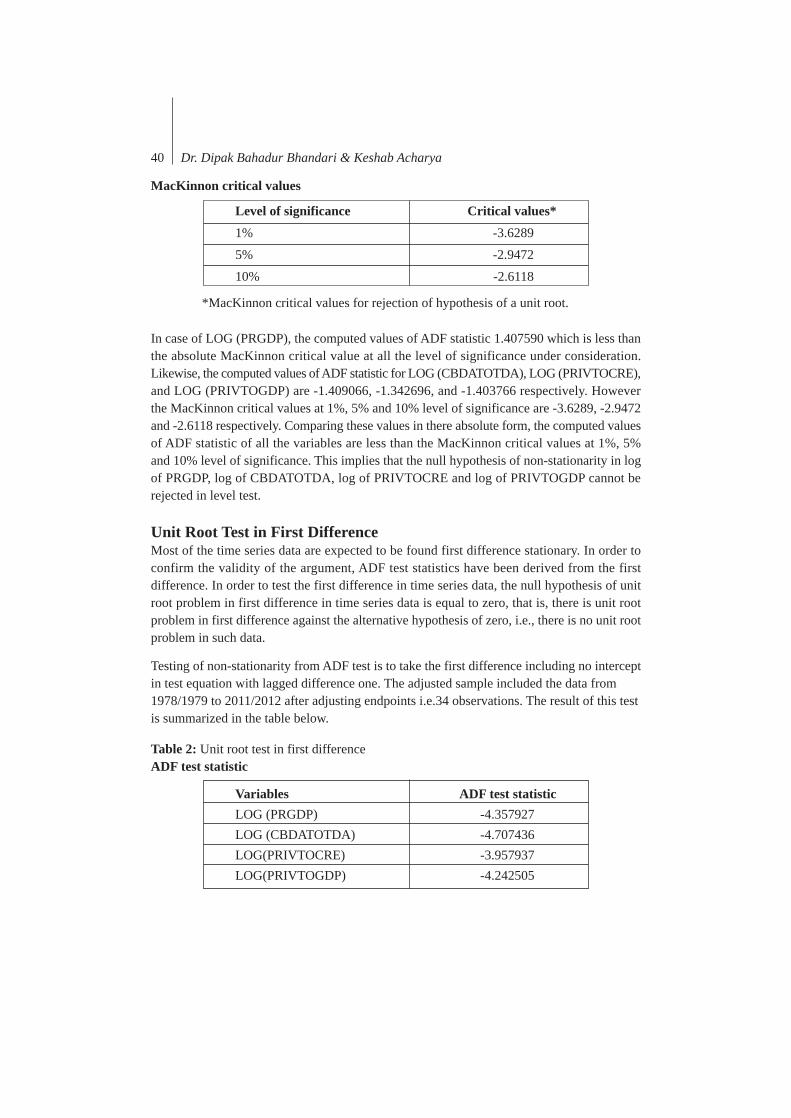
40 Dr. Dipak Bahadur Bhandari & Keshab Acharya
MacKinnon critical values
Level of significance Critical values*
1% -3.6289
5% -2.9472
10% -2.6118
*MacKinnon critical values for rejection of hypothesis of a unit root.
In case of LOG (PRGDP), the computed values of ADF statistic 1.407590 which is less thanthe absolute MacKinnon critical value at all the level of significance under consideration.Likewise, the computed values of ADF statistic for LOG (CBDATOTDA), LOG (PRIVTOCRE),and LOG (PRIVTOGDP) are -1.409066, -1.342696, and -1.403766 respectively. Howeverthe MacKinnon critical values at 1%, 5% and 10% level of significance are -3.6289, -2.9472and -2.6118 respectively. Comparing these values in there absolute form, the computed valuesof ADF statistic of all the variables are less than the MacKinnon critical values at 1%, 5%and 10% level of significance. This implies that the null hypothesis of non-stationarity in logof PRGDP, log of CBDATOTDA, log of PRIVTOCRE and log of PRIVTOGDP cannot berejected in level test.
Unit Root Test in First DifferenceMost of the time series data are expected to be found first difference stationary. In order toconfirm the validity of the argument, ADF test statistics have been derived from the firstdifference. In order to test the first difference in time series data, the null hypothesis of unitroot problem in first difference in time series data is equal to zero, that is, there is unit rootproblem in first difference against the alternative hypothesis of zero, i.e., there is no unit rootproblem in such data.
Testing of non-stationarity from ADF test is to take the first difference including no interceptin test equation with lagged difference one. The adjusted sample included the data from1978/1979 to 2011/2012 after adjusting endpoints i.e.34 observations. The result of this testis summarized in the table below.
Table 2: Unit root test in first differenceADF test statistic
Variables ADF test statisticLOG (PRGDP) -4.357927LOG (CBDATOTDA) -4.707436LOG(PRIVTOCRE) -3.957937LOG(PRIVTOGDP) -4.242505

Does Development of Commercial Banks Spur Economic Growth 41
MacKinnon critical values
Level of significance Critical values*
1% -3.6353
5% -2.9499
10% -2.6133
*MacKinnon critical values for rejection of hypothesis of a unit root.
The computed values of ADF statistic for LOG (PRGDP) is -4.357927 which is greater thanthe absolute MacKinnon critical value at all the level of significance under consideration.Likewise, the computed values of ADF statistic for LOG (CBDATOTDA), LOG (PRIVTOCRE),and LOG (PRIVTOGDP) are -4.707436, -3.957937, and -4.242505 respectively. Howeverthe MacKinnon critical values at 1%, 5% and 10% level of significance are -3.6353, -2.9499,and -2.6133 respectively. Comparing these values in there absolute form, the computed valuesof ADF statistic of all the variables are greater than the MacKinnon critical values at 1%, 5%and 10% level of significance. This implies that the null hypothesis of non-stationarity in logof PRGDP, log of CBDATOTDA, log of PRIVTOCRE and log of PRIVTOGDP are rejectedin first difference.
In summing up, all the variables which are not stationary in level form data are shownstationary in their first difference. The ADF statistics of all the four variables in their absoluteform are greater than MacKinnon critical value at 1%, 5% and 10% level of significance.Therefore, the first difference data are stationary or they are integrated of order 1 or I (1).
Co-integration TestIn order to derive the stable long-run relationship between economic growth and financialdevelopment' explanatory variables of Nepal, the Johansen co-integration tests have beenperformed to validate the variables whether they are co-integrated in same order. The testassumption is the linear deterministic trend in the data.
Table 3: Co-integration test between LOG (PRGDP) & LOG (CBDATOTDA)Lags interval: 1 to 1
Eigen value Likelihood ratio 5% critical value 1% critical value Hypothesized no. of CE(s)
0.326356 15.40158 15.41 20.04 None
0.043994 1.574698 3.76 6.65 At most 1
*(**) denotes rejection of the 5% (1%) significance levelL.R. rejects any co-integration at 5% significance level
Co-integration Test between LOG (PRGDP) and LOG (CBDATOTDA)The Johansen co-integration test has been performed in the series LOG (PRGDP) and LOG(CBDATOTDA). The included number of observation in between 1977/1978 to 2011/2012is 35. Furthermore, the test allowed for the linear deterministic trend in the data and there isno trend assumed in the co-integrating equation and test VAR. The assumed lag interval (pairs)in VAR is 1 to 1. The test results are presented in table below:

42 Dr. Dipak Bahadur Bhandari & Keshab Acharya
The values of likelihood ratio between these two variables are 15.40158 and 1.574698considering 'no hypothesized co-integrating equations' and 'at most one co-integrating equation'.However, critical values for 1% and 5% level of significance in the first case are 20.04 and15.41 respectively and that of second case are 6.65 and 3.76 respectively. As the likelihoodratio in both the cases is less than the critical value, there is no co-integration presence at 1%and 5% level of significance.
Similarly, test has been performed in the series LOG (PRGDP) and LOG (CBDATOTDA)assuming 1 to 2 lag interval (pairs) in vector auto regression variables (VAR). The includednumber of observation in between 1978/1979 to 2011/2012 is 34. The test results are givenin the following Table:
Table 4: Co-integration test between LOG (PRGDP) & LOG (CBDATOTDA)Lags interval: 1 to 2
Normalized co-integrating coefficients: 1 co-integrating equation(s)
Eigen value Likelihood ratio 5% critical value 1% critical value Hypothesized no. of CE(s)
0.470431 22.04219 15.41 20.04 None **
0.012529 0.428667 3.76 6.65 At most 1
*(**) denotes rejection of the 5% (1%) significance levelL.R. test indicates 1 co-integrating equation(s) at 5% significance level
LOG (PRGDP) LOG (CBDATOTDA) C
1.000000 -1.679785 -9.987995
(0.13398)
Log likelihood 148.4208
The values of likelihood ratio between these two variables are 22.04219 and 0.428667considering 'no hypothesized co-integrating equations' and 'at most one co-integrating equation'.However, critical values for 1% and 5% level of significance in the first case are 20.04 and15.41respectively and that of second case are 6.65 and 3.76 respectively. As the likelihoodratio the first case is greater than the critical value, there is the presence of one co-integratingequation at 1% and 5% level of significance. Furthermore, the co-integrating equation betweenLOG of PRGDP and LOG of CBDATOTDA with normalized co-integrating coefficients hasalso shown in the above table. The presence of co-integrating equation indicates that thereexists the long run relationship between LOG (PRGDP) and LOG (CBDATOTDA).
Co-integration Test between LOG (PRGDP) and LOG (PRIVTOCRE)The Johansen co-integration test has been performed in the series LOG (PRGDP) & LOG(PRIVTOCRE). The test allowed for the linear deterministic trend in the data and there is notrend assumed in co-integrating equation and test VAR. Furthermore, the assumed lag interval(pairs) in vector auto regression variables (VAR) is 1 to 1. The included number of observationin between 1977/1978 to 2011/2012 is 35. The test results are given in the table below:

Does Development of Commercial Banks Spur Economic Growth 43
Eigen value Likelihood ratio 5% critical value 1% critical value Hypothesized no. of CE(s)
0.212681 8.910216 15.41 20.04 None
0.015337 0.540952 3.76 6.65 At most 1
*(**) denotes rejection of the 5% (1%) significance levelL.R. rejects any co-integration at 5% significance level
The values of likelihood ratio between these two variables are 8.910216and 0.540952considering 'no hypothesized co-integrating equations' and 'at most one co-integrating equation'.However, critical values for 1% and 5% level of significance in the first case are 20.04 and15.41 respectively and that of second case are 6.65 and 3.76 respectively. As the likelihoodratio in both the cases is less than the critical value, there is no co-integration presence at 1%and 5% level of significance. Similarly, test has been performed in the series LOG (PRGDP)and LOG (PRIVTOCRE) assuming 1 to 2 lag interval (pairs) in vector auto regression variables(VAR). The included number of observation in between 1978/1979 to 2011/2012 is 34. Thetest results are given in the following Table:
Table 6: Co-integration test between LOG (PRGDP) & LOG (PRIVTOCRE)Lags interval: 1 to 2
Eigen value Likelihood ratio 5% critical value 1% critical value Hypothesized no. of CE(s)
0.202945 8.616186 15.41 20.04 None
0.026235 0.903907 3.76 6.65 At most 1
The values of likelihood ratio between these two variables are 8.616186 and 0.903907considering 'no hypothesized co-integrating equations' and 'at most one co-integrating equation'.However, critical values for 1% and 5% level of significance in the first case are 20.04 and15.41 respectively and that of second case are 6.65 and 3.76 respectively. As the likelihoodratio in both the cases is less than the critical value, there is no co-integration presence at 1%and 5% level of significance.
Co-integration Test between LOG (PRGDP) and LOG (PRIVTOGDP)The Johansen co-integration test has been performed in the series LOG (PRGDP) and LOG(PRIVTOGDP). The test allowed for the linear deterministic trend in the data and there is notrend assumed in co-integrating equation and test VAR. Furthermore, the assumed lag interval(pairs) in vector auto regression variables (VAR) is 1 to 1. The included number of observationin between 1977/1978 to 2011/2012 is 35. The test results are given in the following Table:
Table 7: Co-integration test between LOG (PRGDP) & LOG (PRIVTOGDP)Lags interval: 1 to 1
Eigen value Likelihood ratio 5% critical value 1% critical value Hypothesized no. of CE(s)
0.408527 19.48066 15.41 20.04 None *
0.030962 1.100784 3.76 6.65 At most 1
*(**) denotes rejection of the 5% (1%) significance levelL.R. test indicates 1 co-integrating equation(s) at 5% significance level
Table 5: Co-integration test between LOG (PRGDP) & LOG (PRIVTOCRE)Lags interval: 1 to 1

44 Dr. Dipak Bahadur Bhandari & Keshab Acharya
Normalized co-integrating coefficients: 1 co-integrating equation(s)
LOG (PRGDP) LOG (CBDATOTDA) C
1.000000 -0.387648 -10.35390
(0.02542)
Log likelihood 120.7601
The values of likelihood ratio between these two variables are 19.48066and 1.100784considering 'no hypothesized co-integrating equations' and 'at most one co-integrating equation'.However, critical values for 1% and 5% level of significance in the first case are 20.04 and15.41respectively and that of second case are 6.65 and 3.76 respectively. As the likelihoodratio the first case is greater than the critical value, there is the presence of one co-integratingequation at 5% level of significance. Furthermore, the co-integrating equation between LOGof PRGDP and LOG (PRIVTOGDP) with normalized co-integrating coefficients has alsoshown in the above table. The presence of co-integrating equation indicates that there existsthe long run relationship between LOG (PRGDP) and LOG (PRIVTOGDP).Similarly, test has been performed in the series LOG (PRGDP) and LOG (PRIVTOGDP)assuming 1 to 2 lag interval (pairs) in vector auto regression variables (VAR). The includednumber of observation in between 1978/1979 to 2011/2012 is 34. The test results are givenin the following Table:
Table 8: Co-integration test between LOG (PRGDP) & LOG (PRIVTOGDP)Lags interval: 1 to 2
Eigen value Likelihood ratio 5% critical value 1% critical value Hypothesized no. of CE(s)
0.296217 13.06768 15.41 20.04 None
0.032518 1.124004 3.76 6.65 At most 1
*(**) denotes rejection of the 5% (1%) significance levelL.R. rejects any co-integration at 5% significance level
The values of likelihood ratio between these two variables are 13.06768 and 1.124004considering 'no hypothesized co-integrating equations' and 'at most one co-integrating equation'.However, critical values for 1% and 5% level of significance in the first case are 20.04 and15.41 respectively and that of second case are 6.65 and 3.76 respectively. As the likelihoodratio in both the cases is less than the critical value, there is no co-integration presence at 1%and 5% level of significance.
The Johansen co-integration test indicated that there exists one co-integrating equation betweenlog of real GDP per capita and log of commercial bank assets to total domestic assets at 1%and 5% level of significance. Similarly, one co-integrating relationship is confirmed in betweenlog of per capita GDP and log of total credit available to the private sector through commercialbanks to GDP at 5% level of significance. The existence of co-integration implies that thereis long-run relationship between those variables during the review period. However, no co-integrating relationship is found between log of real GDP per capita and log of commercialbanks' credit to private sector to total credit.
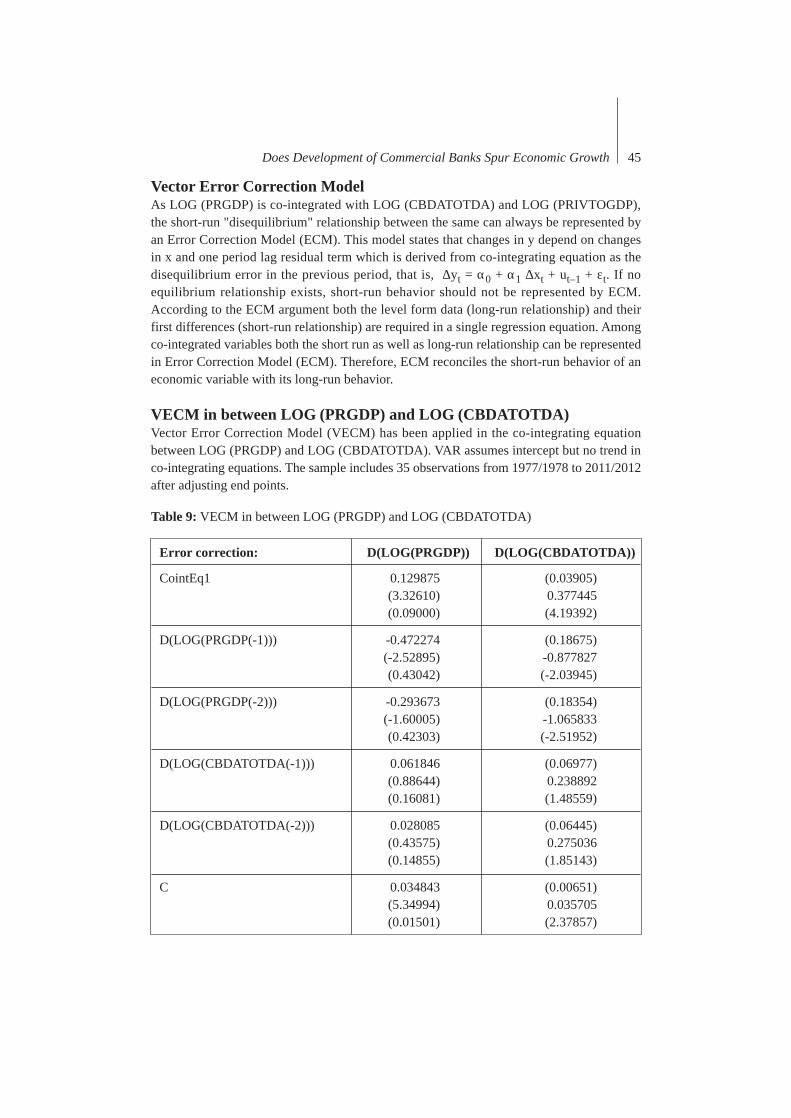
Does Development of Commercial Banks Spur Economic Growth 45
Vector Error Correction ModelAs LOG (PRGDP) is co-integrated with LOG (CBDATOTDA) and LOG (PRIVTOGDP),the short-run "disequilibrium" relationship between the same can always be represented byan Error Correction Model (ECM). This model states that changes in y depend on changesin x and one period lag residual term which is derived from co-integrating equation as thedisequilibrium error in the previous period, that is, Dyt = a0 + a1 Dxt + ut–1 + et. If noequilibrium relationship exists, short-run behavior should not be represented by ECM.According to the ECM argument both the level form data (long-run relationship) and theirfirst differences (short-run relationship) are required in a single regression equation. Amongco-integrated variables both the short run as well as long-run relationship can be representedin Error Correction Model (ECM). Therefore, ECM reconciles the short-run behavior of aneconomic variable with its long-run behavior.
VECM in between LOG (PRGDP) and LOG (CBDATOTDA)Vector Error Correction Model (VECM) has been applied in the co-integrating equationbetween LOG (PRGDP) and LOG (CBDATOTDA). VAR assumes intercept but no trend inco-integrating equations. The sample includes 35 observations from 1977/1978 to 2011/2012after adjusting end points.
Table 9: VECM in between LOG (PRGDP) and LOG (CBDATOTDA)
Error correction: D(LOG(PRGDP)) D(LOG(CBDATOTDA))
CointEq1 0.129875 (0.03905)(3.32610) 0.377445(0.09000) (4.19392)
D(LOG(PRGDP(-1))) -0.472274 (0.18675)(-2.52895) -0.877827(0.43042) (-2.03945)
D(LOG(PRGDP(-2))) -0.293673 (0.18354)(-1.60005) -1.065833(0.42303) (-2.51952)
D(LOG(CBDATOTDA(-1))) 0.061846 (0.06977)(0.88644) 0.238892(0.16081) (1.48559)
D(LOG(CBDATOTDA(-2))) 0.028085 (0.06445)(0.43575) 0.275036(0.14855) (1.85143)
C 0.034843 (0.00651)(5.34994) 0.035705(0.01501) (2.37857)

46 Dr. Dipak Bahadur Bhandari & Keshab Acharya
The vector error correction model has shown that about 12.98% of disequilibrium is 'corrected'each year by changes in economic growth indexes 'log of per capita real GDP' i.e. LOG(PRGDP). Similarly, about 37.74% of disequilibrium is 'corrected' each year by changes inone of the commercial banks' development index 'log of domestic assets of commercial banksto total domestic assets' i.e. LOG (CBDATOTDA). All other error correction in the variableshas been reported in the above table. Furthermore, Standard errors & t-statistics are reportedin parentheses.
VECM in between LOG (PRGDP) and LOG (PRIVTOGDP)As another co-integrating equation exists between LOG (PRGDP) and LOG (PRIVTOGDP),the vector error correction model is also applied in the equation between them. In this casealso VAR assumes intercept but no trend in co-integrating equations. The sample includes 35observations from 1977/1978 to 2011/2012 after adjusting end points.
Table 10: VECM in between LOG (PRGDP) and LOG (PRIVTOGDP)
Error Correction: D(LOG(PRGDP)) D(LOG(PRIVTOGDP))
CointEq1 -0.105988 0.985220(0.05838) (0.22874)
(-1.81553) (4.30709)
D(LOG(PRGDP(-1))) -0.095556 0.466226(0.17280) (0.67709)
(-0.55298) (0.68858)
D(LOG(PRIVTOGDP(-1))) -0.010892 0.418546(0.03605) (0.14125)
(-0.30215) (2.96312)
C 0.022087 0.029462(0.00579) (0.02270)(3.81270) (1.29800)
The vector error correction model has shown that about -10.59 % of disequilibrium is 'corrected'each year by changes in economic growth index 'log of per capita real GDP' i.e. LOG (PRGDP).Similarly, about 98.52% of disequilibrium is 'corrected' each year by changes in one of thecommercial banks' development indexes 'log of private sector credit by commercial banks toGDP' i.e. LOG(PRIVTOGDP). All other error correction in the variables has been reportedin the above table. Furthermore, Standard errors & t-statistics are reported in parentheses.
Granger Causality TestFrom the above Johansen co-integration test, it has been found that there exists the long termrelationship between log of real GDP per capita and log of commercial bank assets to totaldomestic assets at 1% and 5% level of significance. Similarly, the long term is relationshipis also confirmed in between log of per capita GDP and log of total credit available to the

Does Development of Commercial Banks Spur Economic Growth 47
Null hypothesis Obs Lags F-statistic Prob
Granger Causality Test between LOG (PRGDP) & LOG (CBDATOTDA)Table 11: Granger causality test between LOG (PRGDP) & LOG (CBDATOTDA)
LOG(PRGDP) does not Granger cause LOG(CBDATOTDA) 36 1 5.41109 0.02630
LOG(CBDATOTDA) does not Granger cause LOG(PRGDP) 36 1 4.45370 0.04249
LOG(PRGDP) does not Granger cause LOG(CBDATOTDA) 35 2 3.08689 0.06038
LOG(CBDATOTDA) does not Granger cause LOG(PRGDP) 35 2 3.52423 0.04220
LOG(PRGDP) does not Granger cause LOG(CBDATOTDA) 34 3 5.38914 0.00488
LOG(CBDATOTDA) does not Granger cause LOG(PRGDP) 34 3 3.83626 0.02076
LOG(PRGDP) does not Granger cause LOG(CBDATOTDA) 33 4 4.11155 0.01120
LOG(CBDATOTDA) does not Granger cause LOG(PRGDP) 33 4 2.22561 0.09635
Granger causality test has been performed between LOG (PRGDP) and LOG (CBDATOTDA)considering the different lag length. In case of null hypothesis 'LOG (PRGDP) does notGranger cause LOG (CBDATOTDA)' the F-statistics are 5.41109, 3.08689, 5.38914 and4.11155 for the lag length 1, 2, 3 and 4 respectively. In the meantime, the values of probabilityfor the lag length 1, 2, 3 and 4 are 0.02630, 0.06038, 0.00488, and 0.01120 respectively. Theabove table shows that values the F-statistics is significant at 2.63% level of significance forthe lag length 1. In case of lag length 2, it is significant at 6.03% level of significance. Whenlag length is considered as 3, F-statistics is significant at 0.5% level of significance. Similarly,in case of lag length 4, it is significant at 1.12% level of significance. That means the nullhypothesis 'LOG (PRGDP) does not Granger cause LOG (CBDATOTDA)' has been rejectedat 5% level of significance considering the lag length 1, 3 and 4 whereas for the lag length2, it has been rejected at 6% level of significance.
Similarly, In case of null hypothesis 'LOG (CBDATOTDA) does not Granger Cause LOG(PRGDP)' the F-statistics are 4.45370, 3.52423, 3.83626, and 2.22561 for the lag length 1,2, 3 and 4 respectively. Similarly, the values of probability for the lag length 1, 2, 3 and 4 are0.04249, 0.04220, 0.02076, and 0.09635 respectively. Analyzing the value of F-statistics andprobability, it can be concluded that the F-statistics is significant at 4.2 % level of significancefor the lag length 1. In case of lag length 2, it is significant at 4.2 % level of significance.When lag length is considered as 3, F-statistics is significant at 2 % level of significance.However, in case of lag length 4, it is significant at 9.6% level of significance. That meansthe null hypothesis 'LOG (CBDATOTDA) does not Granger Cause LOG (PRGDP)' has beenrejected at 5% level of significance considering the lag length 1, 2 and 3 whereas for the laglength 4, it has been rejected at 10% level of significance.
private sector through commercial banks to GDP at 5% level of significance. According tothe Engle and Granger (1987) representation theorem, if two variables are co-integrated andeach is individually I (1), that is, integrated of order 1 (i.e., each is individually non-stationary),then first variable may Granger-cause second variable, second variable may Granger-causefirst variable or each other. Granger causality test has been performed as follows:

48 Dr. Dipak Bahadur Bhandari & Keshab Acharya
Granger Causality Test between LOG (PRGDP) & LOG (PRIVTOCRE)Table 12: Granger causality test between LOG (PRGDP) & LOG (PRIVTOCRE)
Null hypothesis Obs Lags F-statistic Prob
LOG(PRGDP) does not Granger cause LOG(PRIVTOCRE) 36 1 1.85439 0.18250
LOG(PRIVTOCRE) does not Granger cause LOG(PRGDP) 36 1 0.37396 0.54504
LOG(PRGDP) does not Granger cause LOG(PRIVTOCRE) 35 2 2.84082 0.07416
LOG(PRIVTOCRE) does not Granger cause LOG(PRGDP) 35 2 0.17588 0.83958
LOG(PRGDP) does not Granger Cause LOG(PRIVTOCRE) 34 3 2.17972 0.11355
LOG(PRIVTOCRE) does not Granger Cause LOG(PRGDP) 34 3 0.40578 0.75005
LOG(PRGDP) does not Granger cause LOG(PRIVTOCRE) 33 4 1.41571 0.25900
LOG(PRIVTOCRE) does not Granger cause LOG(PRGDP) 33 4 0.03438 0.99757
Although there is no co-integrating relationship between LOG (PRGDP) and LOG(PRIVTOCRE), Granger causality test has been performed between them considering thedifferent lag length. In case of null hypothesis 'LOG (PRGDP) does not Granger Cause LOG(PRIVTOCRE)' the F-statistics are 1.85439, 2.84082, 2.17972, and 1.41571 for the lag length1, 2, 3 and 4 respectively. In the meantime, the values of probability for the lag length 1, 2,3 and 4 are 0.18250, 0.07416, 0.11355, and 0.25900 respectively. The above table shows thatthe values of F-statistics are insignificant at 5% level of significance for all the lag lengthsunder consideration. Only in the case of lag length 2, it is significant at 7.4% level ofsignificance. That means the null hypothesis 'LOG (PRGDP) does not Granger Cause LOG(PRIVTOCRE)' can't be rejected at 5% level of significance.
Similarly, in case of null hypothesis 'LOG (PRIVTOCRE) does not Granger Cause LOG(PRGDP)' the F-statistics are 0.37396, 0.17588, 0.40578, and 0.03438 for the lag length 1,2, 3 and 4 respectively. Also, the values of probability for the lag length 1, 2, 3 and 4 are0.54504, 0.83958, 0.75005, and 0.99757 respectively. Analyzing the value of F-statistics andprobability, it can be concluded that the F-statistics are insignificant at 5% level of significancefor all the lag length under consideration. That means the null hypothesis 'LOG (PRIVTOCRE)does not Granger Cause LOG (PRGDP)' can't be rejected at 5% level of significance.From the above analysis it can be concluded that there is no causality between log of percapita real GDP [LOG (PRGDP)] and log of private sector credit to total credit of commercialbanks [LOG (PRIVTOCRE)]. That means LOG (PRGDP) does not Granger cause LOG(PRIVTOCRE) and LOG (PRIVTOCRE) does not Granger cause LOG (PRGDP).
From the above analysis it can be concluded that there is bidirectional causality between logof per capita real GDP [LOG (PRGDP)] and log of domestic assets of commercial banks tothe total domestic assets [LOG (CBDATOTDA)]. That means LOG (CBDATOTDA) Grangercauses LOG (PRGDP) and LOG (PRGDP) Granger causes LOG (CBDATOTDA).

Does Development of Commercial Banks Spur Economic Growth 49
Granger Causality Test between LOG (PRGDP) & LOG (PRIVTOGDP)Table 13: Granger causality test between LOG (PRGDP) & LOG (PRIVTOGDP)
Null hypothesis Obs Lags F-statistic Prob
LOG(PRGDP) does not Granger cause LOG(PRIVTOGDP) 36 1 4.79680 0.03569
LOG(PRIVTOGDP) does not Granger cause LOG(PRGDP) 36 1 2.53809 0.12066
LOG(PRGDP) does not Granger cause LOG(PRIVTOGDP) 35 2 8.11699 0.00152
LOG(PRIVTOGDP) does not Granger cause LOG(PRGDP) 35 2 1.07791 0.35312
LOG(PRGDP) does not Granger cause LOG(PRIVTOGDP) 34 3 4.07156 0.01652
LOG(PRIVTOGDP) does not Granger cause LOG(PRGDP) 34 3 0.39794 0.75555
LOG(PRGDP) does not Granger cause LOG(PRIVTOGDP) 33 4 3.87350 0.01448
LOG(PRIVTOGDP) does not Granger cause LOG(PRGDP) 33 4 0.66784 0.62057
Granger causality test has also been performed between LOG (PRGDP) and LOG(PRIVTOGDP). In case of null hypothesis 'LOG (PRGDP) does not Granger cause LOG(PRIVTOGDP)' the F-statistics are 4.79680, 8.11699, 4.07156 and 3.87350 for the lag length1, 2, 3 and 4 respectively. Similarly, the values of probability for the lag length 1, 2, 3 and 4are 0.03569, 0.00152, 0.01652, and 0.01448 respectively. The above table shows that valuesthe F-statistics are significant at 3.5% level of significance for the lag length 1. In case of laglength 2, it is significant at 0.15% level of significance. For the lag length 3, F-statistics issignificant at 1.65% level of significance. Similarly, in case of lag length 4, it is significantat 1.4% level of significance. That means the null hypothesis 'LOG (PRGDP) does not Grangercause LOG (PRIVTOGDP)' has been rejected at 5% level of significance for all the lag lengthunder consideration.
Similarly, in case of null hypothesis 'LOG (PRIVTOGDP) does not Granger Cause LOG(PRGDP)' the F-statistics are 2.53809, 1.07791, 0.39794, and 0.66784 for the lag length 1,2, 3 and 4 respectively. Meanwhile, the values of probability for the lag length 1, 2, 3 and 4are 0.12066, 0.35312, 0.75555, and 0.62057 respectively. Analyzing the value of F-statisticsand probability, it can be concluded that the F-statistics are insignificant at 5% level ofsignificance for all the lag length under consideration. That means the null hypothesis 'LOG(PRIVTOGDP) does not Granger cause LOG (PRGDP)' can't be rejected at 5% level ofsignificance.
This analysis shows that there is unidirectional causality between log of per capita real GDP[LOG (PRGDP)] and log of private sector credit of commercial banks to GDP [LOG(PRIVTOGDP)]. The test suggests that LOG (PRGDP) Granger causes LOG (PRIVTOGDP)whereas LOG (PRIVTOGDP) does not Granger causes LOG (PRGDP).
In summing up, the result of Granger causality test provides the mixed result. Consideringthe first Granger causality test, the statistically significant F-statistic confirms the fact thatthere is the bidirectional causality between log of per capita real GDP and log of domesticassets of commercial banks to the total domestic assets. Similarly, in the second Grangercausality test, the insignificant F-statistic suggests that there is no causality between log ofper capita real GDP and log of private sector credit to total credit of commercial banks. Finally,the third Granger causality test shows the unidirectional causality as log of per capita real

50 Dr. Dipak Bahadur Bhandari & Keshab Acharya
GDP Granger causes log of private sector credit of commercial banks to GDP but causalityin the opposite direction is not supported statistically.
The results of present study partially resembles with the findings of King and Levine (1993a)as they found the strong positive relationship between each of the financial developmentindicators and the three growth indicators, long-run real per capita growth rates, capitalaccumulation and productivity growth. Furthermore, the study of Calderon and Liu (2003)revealed that the financial development generally leads economic growth but there is the bi-directional causality between financial development and economic growth. Levine (2004)stressed on co-evolution of finance and growth. Present study also supports these findingsas there is the bidirectional causality between log of per capita real GDP and log of domesticassets of commercial banks to the total domestic assets.
Jalil &Ma (2008) found that a positive and significant relationship between financial developmentand economic growth exists in the case of Pakistan. But, in the case of China, a positive andsignificant relationship for credit liability ratio and a positive, yet insignificant, relationshipwith credit to private sector were found. However, in this study there is no causality betweenlog of per capita real GDP & log of private sector credit to total credit of commercial banks.Also, there is the unidirectional causality as log of per capita real GDP Granger causes logof private sector credit of commercial banks to GDP but there is no causality in the oppositedirection.
Bhetuwal (2007) and Poudel (2005) found that financial development contributes positivelyto domestic economic growth. On the other hand, Shrestha (2005) did not find any significantrelationship between economic growth and financial development. The present study suggeststhe co-integration between development of commercial banks and economic growth althoughthere is bidirectional causality between log of per capita real GDP and log of domestic assetsof commercial banks to the total domestic assets; and unidirectional causality between logof per capita real GDP and log of private sector credit of commercial banks to GDP. In thiscontext of mixed results, the appropriate development of Nepalese financial sector is essentialso that it can play a critical and positive role in the economic growth of the nation.
ConclusionsThe analysis has clearly depicted the real picture of development of Nepalese commercialbanks. Until 1984, Nepalese financial system was suffering from several problems. It was notproliferated until 1984, although there were couples of banks and financial institutions. Theinitiation in financial sector reforms and introduction of market oriented economic policiesled a rapid expansion of financial institutions and instruments. It has resulted for diversificationof financial system during a short span of time. Additionally, the development of new financialinstruments and services, introduction of regulatory framework and institutionalization ofsavings has created new scene for economic growth and development.
The existence of co-integration implies that there is long-run relationship between log of realGDP per capita and log of commercial bank assets to total domestic assets; also between logof per capita GDP and log of total credit available to the private sector through commercialbanks to GDP. However, no co-integrating relationship is found between log of real GDP percapita and log of commercial banks' credit to private sector to total credit. Granger causalitytest provides the mixed result. The statistically significant F-statistic confirms the fact that
Does Development of Commercial Banks Spur Economic Growth 51
there is the bidirectional causality between log of per capita real GDP and log of domesticassets of commercial banks to the total domestic assets. Similarly, the insignificant F-statisticsuggests that there is no causality between log of per capita real GDP and log of private sectorcredit to total credit of commercial banks. Granger causality test also shows the unidirectionalcausality as log of per capita real GDP Granger causes log of private sector credit of commercialbanks to GDP but causality in the opposite direction is not supported statistically.
Economy of the country cannot reach to its growth potential and develop at an adequate pacewithout an active contribution of the financial sector. A well functioning financial systemefficiently mobilizes resources and allocates capital for productive investment projects.Commercial banks are the largest financial institutions dominant in the financial systemoccupying the major portion of the total financial assets. The development of commercialbanks' is important to the speed and direction of economic growth, by mobilizing idle financialresources for productive investment. To link up commercial banks' development and economicgrowth, the economic activities in the private sector must go simultaneously to strengthen thegrowth and reducing mass poverty.
Bencivenga,V.R., & Smith, B. D. (1992). Deficits, inflation and the banking system in developingcountries: The Optimal Degree of Financial Repression. Oxford economic papers 44: 767 - 790
Bhetuwal, K. R. (2005). Assessing the effectiveness of financial reforms. Doctoral thesis, MaharajaSayajirao University of Baroda, Department of Economics, Vadodara.
Bhetuwal, K. R. (2007). Financial liberalization and financial development in Nepal. Economic review,Nepal rastra bank, 23-41
Calderon, C., & Liu, L. (2003). The direction of causality between financial development and economicgrowth. Journal of development economics 72: 321-324
Demetriades, P.O., & Luintel, K.B. (1996). Banking sector policies and financial development in Nepal.Oxford bulletin of economics and statistics, 58(2): 355 - 372
Domar, E. (1946). Capital expansion, rate of growth and employment. Econometrica, 14: 137-147. (46),61-76.
Engle, R.F., & Granger, C.W.J. (1987). Cointegration and error correction: Representation, estimationand testing, econometrica, 55: 251-826.
Eslamloueyan, K., & Sakhaei, A. E. (2011). The short run and long run causality between financialdevelopment and economic growth in the middle east. Iranian journal of economic research,16
Fadare, S. O. (2010). Recent banking sector reforms and economic growth in Nigeria. Middle easternfinance and economics 8: 1450-2889.
Fry, M. (1995). Money, interest and banking in economic development. The John Hopkins Studies inDevelopment, Baltimore, John Hopkins University Press.
Goldsmith, R. W. (1969). Financial structure and development. New Haven, CT: Yale University Press.Granger, C.W.J. (1969). Investigating causal relations by econometric models and cross- spectral methods.
Econometrica, July 1969, pp. 424-438.Granger, C., & Newbold, P. (1974). Spurious regression in econometrics. Journal of econometrics 2.Greenwood, J., & Jovanovic, B. (1989). Financial development, growth and the distribution of income.
NBER working paper series no. 3189.Greenwood, J., & Jovanovic, B. (1990). Financial development, growth and the distribution of income.
Journal of political economy Vol. 98 No. 5, pp 1076-1107
References

52 Dr. Dipak Bahadur Bhandari & Keshab Acharya
Gujarati, D.N. (2004). Basic econometric. Tata McGraw-Hill Publishing Company Limited, New Delhi,(Fourth Edition).
Harrod, R.F. (1939). An Essay in dynamic theory. Economic journal, 48 (192) .14-33.Hassan, K., Sanchez, B., & Yu, J. (2011). Financial development and economic growth: New evidence
from panel data. The quarterly review of economics and finance, 51, pp.88-104.Ireland, P. (1994). Money and Growth: An alternative approach. American economic review, March,
47-65.Jalil, A., & Ma, Y. (2008). Financial development and economic growth: Time series evidence from
Pakistan and China. Journal of economic cooperation, November, 29(2). pp. 29-68Khanal, D. R. (2003). Why economic reform failed in Nepal: 9 Reasons. New business age, MarchKharel, R.S., & Pokhrel, R.D. (2012). Does Nepal? Financial structure matter for economic growth?
NRB working paper series, 31-46.King, R., & Levine, R. (1993a). Finance and growth: Schumpeter might be right. Quarterly journal of
economics Vol. 108(3). 717-737.King, R. G., & Levine, R. (1993b). Finance, entrepreneurship, and growth: Theory and evidence, Journal
of monetary economics 32, 513-42.Levine, R. (1997). Financial development and economic growth: Views and agenda. Journal of economic
literature 35, 688-726.Levine, R. (1999). Financial development and economics growth: view and agenda. World bank policy
research working paper, No 1678.Levine, R. (2004). Finance and growth: Theory and evidence. National bureau of economic research
working paper No.10766Luintel, K.B., & Khan, M. (1999). A Quantitative reassessment of the finance-growth nexus: Evidence
from a multivariate VAR. Journal of development economics 60, 381-405.McKinnon, R. (1973). Money and capital in economic development. Brookings Institution. Washington,
DC, USA.Nepal Rastra Bank. Various Issues. Quarterly economic bulletin. Kathmandu: Nepal Rastra Bank.NRB Economic Review: Occasional Paper (2003- 2010)Pagano, M. (1993). Financial markets and growth: An overview. European economic review 39, 613-622.Paudel, N. P. (2005). Financial system and economic development. In NRB, Nepal rastra bank in fifty
years. Kathmandu: NRB Quarterly economic bulletin: Nepal Rastra Bank, July 2011, Vol. 45,No. 4
Rajan, R. G., & Zingales, L. (1998). Financial dependence and growth. American economic review Vol.88(3), pp. 559 - 586.
Rajan, R. G., & Zingales, L. (2003). The great reversals: the politics of financial development in thetwentieth century. Journal of financial economics, 69, 5-50.
Robinson, J. (1952). The generalization of the general theory in the rate of interest and other essays.MacMillan, London.
Roubini, N., & Martin, S. (1992). Financial repression and economic growth. Journal of developmenteconomics. 1992, 39(1), 5-30.
Schumpeter, J. A. (1911). The theory of economic development, An inquiry into profits, capital, credit,interest, and the business cycle, Translation 1934, Cambridge MA, Harvard University Press.Second Printing 1936; third printing 1949.
Shaw, E. S. (1973). Financial deepening in economic development. Oxford University Press, New York.Shrestha, M. B. (2005). Financial Liberalization in Nepal. Ph.D. dissertation submitted to university
of Wollongon, Australia.Shrestha, M.K., & Bhandari, D.B. (2008). Financial markets & institutions. Asmita Publication 3rd editionSolow, R.M. (1956). A contribution to the theory of economic growth. Quarterly journal of economics,
70 (1). 65-94.

Globalization: A Trozan Horse "Globalization is a Buzzword That Has No Precise Definition 53
AbstractGlobalization brings in interconnectedness in economic, cultural, and technological domainsvia expansion in unrestricted trade. It is based on "one-size-fits-all" policies of IMF and theWorld Bank that does not click in all circumstances. A very large patch of cloud has appearedin most of the developing countries mired by the parallax of borderless market where goodsand services as well as capital are supposed to flow unrestricted benefiting the countries ontrade. A very large patch of cloud has appeared in most of the developing countries miredby the parallax of borderless market where goods and services as well as capital are supposedto flow unrestricted benefiting the countries on trade. The state of bailing out in Greek economycan be taken as an example. It more than hurts countries such as Nepal that are economicallynascent. The current balance of trade scenario of Nepal embedded with successive deficitsrightly presents globalization in countries with nascent economies as a Trozan Horse. Toavoid its Trozan Horse image there is the need for concerted efforts in the production frontierskeeping in mind that every dog has its day when it is recognized that there is the possibilityof product internationalization, increased capital mobility and knowledge growth providedglobalization is perceived to its spirit. Otherwise it simply gives rise to a dilemma wherebysomeone attempts to be in love simultaneously with two beautiful women.
Key Words: Trozan Horse, Globalization, Nepal, Developing Countries, Consensus, Lossand sufferings
GLOBALIZATION: A TROZANHORSE "GLOBALIZATION IS ABUZZWORD THAT HAS NOPRECISE DEFINITION."
Dr. Kanhaiya Ram Bhakta Mathema...?
BackgroundThe dynamics of globalization, though is in motion, is rather engulfed by the red-herrings.Accordingly, it is not that successful towards the sedentary configuration of much covetedeconomic volatility in many parts of the world. The state of bailing out in Greek economycan be taken as an example. It more than hurts countries such as Nepal that are economicallynascent.
This article is based on the reviews of some of the published works highlighting the pros andcons of globalization supported by some empirical evidences from the current status of Nepal'sstate in international trade. The thrust of the same is to present an eye opener to economicallynascent countries like Nepal in the contest of globalization that is circumscribed bymisapprehension of pareidolia.
Dr. Mathema is the Retired Professor of Economics from Tribhuvan University.

54 Dr. Kanhaiya Ram Bhakta Mathema
Encyclopedia of Business (2015) defines globalization as a "process by which the economiesof countries around the world become increasingly integrated over time. This integrationoccurs as technological advances expedite the trade of goods and services, the flow of capital,and the migration of people across international borders. The term has been used in this contextsince the 1980s, when computer technology first began making it easier and faster to conductbusiness internationally. Globalization can also refer to the efforts of businesses to expandtheir operations to new countries and markets".
The important attribute of globalization is nothing but in simple term means globalinterconnectedness in economic, cultural, and technological domains. No doubt, globalizationhas unleashed hosts of meritorious effects in countries irrespective of their economic standings.Nevertheless, the arrays of antagonistic waves against it all over have cast doubt about itsbenevolence particularly to the developing nations. People who are organizing againstglobalization are on the rise. "The plain truth is that market liberalization by itself does notlift all boats, and in some cases, it has caused severe damage to poor nations…what's more,there's no point denying that multinationals have contributed to labor, environmental, andhuman rights abuses as they pursue profit around the globe" (Encyclopedia of Business 2015)."Globalization could be frightening, stimulating, overwhelming, destructive or creative,depending on one's point of view". Actually, it is "one-size-fits-all" policies of IMF and theWorld Bank that does not click in all circumstances.
Tenet, Upshot and DebateOne of the tenets of globalization is no other than lowering of tariffs in trade between thenations to enlarge the trade volume depending upon each other's comparative advantage inthe production of goods. The hub has been World Bank promoted trickle down theory thathas predominated the thoughts of the bureaucrats and development economists alike up untilthe decades of the 1980s and early 1990s. Centripetalling the hub among others is WashingtonConsensus as well along the principles of GATT, actually, globalization was taken with fanfare,however, under the illusion that "what is good for a goose is good for a gander". The ongoingconvection is wrapped up within the concept of trickle down theory of growth. Looking atthe discrepancies brought about by globalization, it is always better to judge it under thefollowing premise of 2014 Human Development Report ". According to income-based measuresof poverty, 1.2 billion people live with $1.25 or less a day. However, according to the UNDPMultidimensional Poverty Index, almost 1.5 billion people in 91 developing countries areliving in poverty with overlapping deprivations in health, education and living standards. Andalthough poverty is declining overall, almost 800 million people are at risk of falling backinto poverty if setbacks occur. Many people face either structural or life-cycle vulnerabilities.The open secret of the Report mirrors the fact that globalization and by the same token openborder economy flattens the globe easing out for the interplay of the multinationals.
This is an upshot of globalization no one can bypass at present. Trickle-down economics hasbecome a myth whereby enriching multinationals does not necessarily benefit those who areat the bottom of the road to development (Stiglitz 2014). Stiglitz claims that globalization hasnot brought the promised economic benefits to some of the poorest nations in the world -evidenced by the fact that during the last decade of the twentieth century the number of peopleliving in poverty increased by almost 100 million.

Globalization: A Trozan Horse "Globalization is a Buzzword That Has No Precise Definition 55

56 Dr. Kanhaiya Ram Bhakta Mathema
Globalization: A Trozan Horse "Globalization is a Buzzword That Has No Precise Definition 57

58 Dr. Kanhaiya Ram Bhakta Mathema
The west, in general, has greatly benefited from the globalization. The production was movedto cheaper countries, companies started to make more profit, people started to make moremoney and we are all happy. However, some people in the west lost their job due to thatreason. Many miners, for example, were made redundant, because it is cheaper to import coalfrom China, than to exploit it in "expensive" UK or Germany, where labour cost are high. Alot of companies and manufactures had to quit, because they simply couldn't compete withbig corporations, that significantly lowered the process.
The developing countries also suffered from the globalization. The foreign industry highlyaffected their eco-system. People, who frequently work two times longer than in Europe, havevery low salaries. In addition, the workers cannot even demand better conditions, becausethey are under the constant threat of loosing job. After all, the corporations can move whereverthey want. So we can say, that corporations have grown in power so much, that they canvirtually blackmail the entire governments. "You want to raise the minimal wage in India?Ok, so we are moving to Bangladesh," for example.
As everything, the globalization has its plusses and minuses. Unfortunately, the wealth itbrought is not distributed equally. it's the richer who gained most of that phenomenon, whereasthe poor actually lost. Globalization bears fruit provided it could instill dynamism to Schumpeter'sgale in the developing world. Otherwise it just eludes those countries as if they were buyinghope. In the process, the in-swing of "beggar thy neighbor" in these countries by no meansshould be permitted.
In the words of James R. Rogers Department Head at Texas A&M University "… the oppositionto globalization seen in movements like "Occupy Wall Street" isn't simply about protectingwhat Americans already have, it also means continuing the poverty of less-developed countries.This doesn't mean that we should accept globalization uncritically, but it does mean thatdomestic responses will need to be as complicated as its effects". Recent popular titles onglobalization, "Lexus and the Olive Tree" Friedman, Thomas (1999) and "Jihad Vs. McWorld(Benjamin R. Barber, 1992)", attest to the seemingly contradictory unifying and divisiveforces inherent in globalization.
The true spectrum of globalization can be seen from the prism of World Economic ForumAgenda Councils, 2015. The top 10 trends visualized by the Forum can be taken as theexternalities diffused by globalization, particularly in the context of developing countries.They are: deeping income inequality, persistent jobless growth, lack of leadership, risinggeostrategic competition, weakening of representative democracy, rising pollution in thedeveloping world, increasing occurrence of severe weather events, intensifying nationalism,increasing water stress and growing importance og health in the economy. Reference here ismade only those directly connected with economic and financial globalization.Amina Mohammed's reflections on Outlook on the Global Agenda 2015 goes like this,"Deepening income inequality: De inequality is one of the key challenges of our time. Incomeinequality specifically is one of the most visible aspects of a broader and more complex issue,one that entails inequality of opportunity and extends to gender, ethnicity, disability, and age,among others. It was identified as the most significant trend of 2015 by our Network experts.This affects all countries around the world. In developed and developing countries alike, thepoorest half of the population often controls less than 10% of its wealth. This is a universalchallenge that the whole world must address. While it is true that around the world economicgrowth is picking up pace, deep challenges remain, including poverty, environmental degradation,persistent unemployment, political instability, violence and conflict. These problems, whichare reflected in many parts of this report, are often closely related to inequality.

Globalization: A Trozan Horse "Globalization is a Buzzword That Has No Precise Definition 59
The inherent dangers of neglecting inequality are obvious. People, especially young people,excluded from the mainstream end up feeling disenfranchised and become easy fodder ofconflict. This, in turn, reduces the sustainability Inequality is one of the key challenges of ourtime. Income inequality specifically is one of the most visible aspects of a broader and morecomplex issue, one that entails inequality of opportunity and extends to gender, ethnicity,disability, and age, among others. Ranking second in last year's Outlook, it was identified asthe most significant trend of 2015 by our Network's experts. This affects all countries aroundthe world. In developed and developing countries alike, the poorest half of the populationoften controls less than 10% of its wealth. This is a universal challenge that the whole worldmust address. While it is true that around the world economic growth is picking up pace, deepchallenges remain, including poverty, environmental degradation, persistent unemployment,political instability, violence and conflict. These problems, which are reflected in many partsof this report, are often closely related to inequality (Mohammed 2015).
Refutation of the ClaimMander et al (2001) evidentially refute the claims made by the proponents of globalizationthat the period (1970-2000) of economic globalization's most rapid ascendancy - shows thatit is bringing exactly the opposite outcome that its advocates claim. The evidence now comesnearly as much from the proponents of globalization as its opposition. Probably the mosttraumatic impacts of globalization policies - both in terms of poverty-creation, and environmentaldevastation - have come with the forced shift of local economies away from small-scalediversified agricultural models to the industrial export model, directed by global corporations.They go on to add that economic globalization has only proved to be successful in makingglobal corporations and a few elites wildly wealthy. For example, of the largest 100 economiesin the world, 52 are now corporations. In what the UN describes as the "staggering concentrationof wealth among the ultra-wealthy," total wealth controlled by people with assets of at least$1 million nearly quadrupled from 1986 to 2000, from $7.2 trillion to $27 trillion. Even withthe dot-com crash and the current global financial slump, Merrill Lynch predicts that wealthcontrolled by millionaires will continue to increase by 8 percent a year, reaching $40 trillionby 2005.
Reality and LessonConsidering the above one has to be cautious to blindly second the versions of the proponentsof globalization in countries like Nepal that most of the time suffer from huge deficit in balanceof trade lacking euphoria for product and productions. The challenges of globalization inNepal could be perceived from the fact that there is substantial rise in imports while exporthas deteriorated right from the 1990s when the image of globalization has started to protrude. In the FY2013 imports surged by 24 percent to Rs 316.21 billion while exports stood at justRs 44.98 billion. As a result, the country's trade deficit also surged by 27.2 percent to Rs271.22 billion. It has its adverse implication even in the country's overall balance of paymentsituation. The country's balance of payments (BoP) surplus declined by Rs 4.51 billion inthe seventh month (Nepal Rastra Bank Macro-economic Report, 2013-03-17). The BoPsurplus fell to Rs 1.59 billion in the seventh month from Rs 6.1 billion in the sixth, accordingto the Nepal Rastra Bank (NRB)'s latest Macro-economic Report.
The country's foreign exchange reserves also decreased to Rs 437.85 billion as of the seventhmonth, compared to Rs 439.46 billion in the same period last fiscal year. In the 5 months of2070, the trade deficit occurred by 20.32 billion (2 kharba 32 arba) higher by 21 per cent thatof the previous year. Trade deficit with India is 1 kharba 53 arba 79 caroad and oversees tradedeficit at the vicinity of 79 arba 19 corod (The Kathmandu Post , 16 March 2013). Accordingto The Kantipur Daily (2015), the scenario in the present fiscal year is all the more frightening.

60 Dr. Kanhaiya Ram Bhakta Mathema
In the first half of the current FY, trade deficit has amounted to Rs.314.00 billion. The importof goods and services during that period has registered at Rs 357.56 billion while the exportfigure stood at Rs 43.43billion. Citing Nepal Rastra Bank, the Daily says that the deficit hasjumped to a staggering mark of Rs 600.19 billion in the last fiscal year. In the last fiscal year,the amount of import was Rs.3333.00billion against the export of Rs.45.14billion. It hasactually distorted the overall balance of payment situation of Nepal.
The above picture has clearly presented globalization in Nepal as a Trozan Horse. Reapingbenefits from globalization is a dilemma whereby someone is attempting to be in lovesimultaneously with two beautiful women. Nevertheless, the reality is that we should take onthe challenges of globalization head on to be besmeared with glimmer of hope and avoid itsTrozan Horse image with dynamic efforts in the production frontiers keeping in mind thatevery dog has its day when it is recognized that there is the possibility of productinternationalization, increased capital mobility and knowledge growth provided globalizationis perceived to its spirit with a view to penetrating into the international markets.
Barber, Benjamin R.(1992). Jihad Vs. McWorld, Nelson, Canada
Development Research Group (2004) Challenges for developing countries, Development research group,World Bank, June 2004
Encyclopedia of Business (2015). Globalization, Encyclopedia of business 2nd ed.
Friedman, Thomas (1999). The lexus and the olive tree, Farrar, Straus & Giroux , New York
Jerry Mander, Debi Baker and David Korten (2001). Does globalization help the poor internationalforum on globalization? IFG bulletin, 2001, Volume 1, Issue 3,
Kilgour, David (2000). Globalization for the benefit of all notes for an address by Hon. David Kilgourto the closing session of the 7th World Summit of Young Entrepreneurs September 1, 2000 WorldTrade Centre, New York
Kohut, Andrew and Richard Wike (2008). Assessing globalization benefits and drawbacks of trade andintegration Pew research global attitudes project, Washington
Mohammed, Amina (2015). Outlook on the global agenda 2015 top 10 trends of 2015 World economicforum Agenda Councils, USA
Panel on High-Level Panel on Globalization and the State (2001) Report on 56th session of the UnitedNations general assembly, second committee, November 2001, New York
Patrickbatemaneconomics.blogspot.com Globalization: Who benefits / who loses? Economics, Saturday,10 September 2011
Schmukle,r Sergio L. and Richard Wike, (2004). Benefits and risks of financial globalization: Pewresearch global attitudes project
Stiglitz, Joseph E. (2002). Globalization and its discontents W.W. Norton & Company
Stiglitz, Joseph E. ( 2014). On the wrong side of globalization, The opinionator the opinion page, thegreat divide, March 15, 2014
The Kantipur Daily (2015). Trade deficit in six months amounted to Rs. 314.00 billion (Translated), 29January, 2015
The Kathmandu Post (2013). Nepal rastra bank macro-economic report 2013-03-17, The KathmanduPost, 16 March 2013
UNDP (2014). The 2014 human development report - Sustaining human progress: Reducing vulnerabilitiesand building resilience Human development report 2014, UNDP
References
AN ANALYSIS OF FOREIGNEMPLOYMENT AND INFLOW OFREMITTANCE IN NEPAL
Mani Ratna Lamsal...?
AbstractThe percentage of migrants from developing countries to developed and industrialized nationsis ever increasing. Because of this increasing tendencies of migrants in worldwide, the inflowof remittance in Nepal after 1990s is increasing significantly. According to World Bank report,some 2-3 millions new migrants leave their homeland each year. Of them, about half goesto industrial nations. Nepalese economy is becoming remittance economy in these days.This paper examines the migration and inflow of remittance in Nepal. It deals with literaturereview on remittance, the inflow of remittance from various countries, the contribution ofremittance to GDP, consumption and expenditure pattern.
Keyword: Labour migration, Remittance, Money transfer channels, Destination.
IntroductionMigration of people from one place to another has become a common phenomenon since thebeginning of human civilization. The migration in the beginning was for the sake of food andexploring new places for security purposes. But, gradually, migration took the shape in diverseforms and now has become a very common around the world. Millions of people from aroundthe world (especially from the developing countries) are migrating (i.e. leaving their homeland)for seeking better employment opportunities, education facilities and for many other purposes.Labour migration for overseas countries has particularly increased after globalization. InNepal, the migration in overseas countries has rapidly increased especially after the restorationof multi-party democratic system and implementation of liberlization policy since 1990s.Remittance is money transferred from workers abroad (which are called remitters) to theirhome country. According to IMF, total remittances include three items: workers remittance,compensation of employees and migrant transfers.
The proportion of migrants from poorer countries has become increasingly significant. Theflow of migrants to industrial countries has also risen. The World Bank (1995) suggests thatsome 2-3 million new migrants now leave developing countries each year; about half of themgo to industrial nations. India has placed itself in first position to inflow remittance receiving$45 billion in 2008 followed by China receiving $34 billion. Mexico, Philippines and Polandhave received $26 billion, $18 billion and $11 billion respectively in 2008. Bangladesh andNepal are other major remittance earning countries in the world (Ratha, et al, 2007).
An Analysis of Foreign Employment and Inflow of Remittance in Nepal 61
Mr. Lamsal is the Lecturer of Economics at Global College of Management.
Nepalese economy is passing through poverty and stagnation and suffers from inherentstructural constraints (Dahal, 2004). The master-bottlenecks of Nepalese economy are:landlockedness, rugged topography with limited croplands, lack of basic infrastructures, highextent of poverty, lack of commercial exploitation of natural resources and optimal utilizationof human resources, rampant corruption, absence of good governance, etc. The average GDPgrowth rate is around 3.5 percent p.a., which is too low in SAARC region. In such situation,remittance is becoming a crucial component/ base to rescue Nepalese economy from the low-level equilibrium trap, which could provide a new and sustainable life for Nepalese economy.Acceleration in overseas migration and remittances has been instrumental for survival, povertyalleviation and improvement in living standard of the people (Seddon, et al, 1999).
Remittance has been the single most dynamic factor to deal with dismal scenario of theNepalese economy. International migration for foreign employment has become strategy forsurvival of the rural subsistence household,(Shrestha, 2004). Foreign employment has increasedthe foreign exchange reserve, BOP is surplus, increased the liquidity in banking sector.
Research MethodologyThe main goal of this study is to analyze the role of foreign employment and remittance inNepal. The required data for this study has been taken from secondary sources- various issuesof economic survey, publications of Nepal Rastra Bank, published and unpublished researcharticles, books, etc. A descriptive, analytical and quantitative research design has been usedfor this study.
Foreign Employment: Historical PerspectivesLabour migration from the developing countries has been one of the major sources to fill upthe labour shortage in developed and industrialized countries. A large number of Turksmigrated to Germany, Pakistanis to Saudi Arabia and the Mexicans to the United States.Before world war- II, the purpose of migration was settlement in North America, Latin Americaand the Western Europe. However, since the world war - II, the settlement migration haschanged in the form of temporary migration of the labour - as seasonal or contract workers.After the oil boom in the Gulf, the destination of migrants from Asian developing countrybecomes Gulf countries due to rapid increase in demand for labour. Every year on average6 to 7 million people migrate from one country to another country particularly from developingto developed countries in search of foreign employment (Shrestha, 2004).The migration of Nepalese people for employment abroad has a long history. Nepalese startedforeign employment by travelling to Lahore in early 19th century to join the Sikh ruler RanjitSingh. Labour migration started after Anglo-Nepal Treaty of peace and Friendship of 1816.It has recruited 3000 Nepalese soldiers in Brithish Gorkha. Signing of peace and friendshipTreaty between India and Nepal in 1950 has granted Nepalese workers to move in Indiawithout work permit (Kayestha, 2002).
Nepalese workers started to migrate beyond India with the enactment of Foreign EmploymentAct 1985. The major destinations for Nepalese workers are: Malaysia, Gulf nation, HongKong, Singapore, South Korea, Macao, European nations, Japan, etc. Remittancehas become one of the major companies of Nepal's GDP since 1990s.
62 Mani Ratna Lamsal

Literature Review on RemittancesIn the comparison of international studies, very few studies have been done related to foreignemployment and remittance in Nepal. Different studies have shown different findings aboutremittance in Nepal. Some of the past studies have been reviewed to gain some theoreticalknowledge about foreign employment and remittances.
Highlighting the role of remittance, Sigdel (2010) suggested that remittance plays a centralrole in the economies of many labour sending countries including Nepal. The flow of remittancedoes it only determine the level of economic growth but its meaningful utilization developsthe remote areas, boosts up the economic activities, uplifts the living standard of people,increases the employment and output and GDP in long-run.
Neupane (2010) in his study 'An Analysis of Impact of Remittance on Nepalese Economy'said that remittance is one of the important avenues of national economy not only to minimizethe problem of unemployment but to minimize the level of poverty and foreign exchangeconstraints. He further writes that Nepalese economy will face serious economic downturnif there is reduction in flow of remittance.
Pant (2006) in his study ' Remittance inflow in Nepal: Economic impact and policy option'argued that remittance can generate a positive effect on the economy through various channelssuch as consumption, saving, investment, economic growth, reduction in poverty and inequality.A paper 'Remittance in the Pacific Region' presented in IMF by Browne and Mineshima(2007) claimed that Asian countries that receive more remittance include China, India, Nepal,Bangladesh, Srilanka and Philippines. Their aim is to increase saving and investment whenremittance is deposited in financial institution, it provides easy credit for various purposewhich promotes development in remittance recipient countries.
Are there any costs of remittance with a number of benefits? To answer the question, Robert(2004) has presented following costs and benefits of remittance.
Benefits Costs
1. As a stable source of foreign exchangethat eases foreign exchange constraintsand helps finance external deficits.
2. Is a potential source of saving andinvestment for capital formation anddevelopment.
3. Facilitates investment in children'seducation and human capital formation.
4. Raise the standard of living of recipients.
5. Reduces poverty and income inequalities
1. Eases pressure on govt. to implementreforms and reduce external imbalances(moral hazard)
2. Reduces saving of recipient families andthus negative impact on growth anddevelopment.
3. Reduces labour effort of recipient familiesand thus negatively impact on growth.
4. Migration leads to brain drain andnegative impact on the economy that arenot fully compensated by remittancestransfer.
5. Increases income inequalities.
An Analysis of Foreign Employment and Inflow of Remittance in Nepal 63

Factors Affecting Labour Movement and Foreign EmploymentAccording to the report of Population Census 2011 A.D. published by CBS, the annualpopulation growth rate of Nepal is 1.35% p.a. Every year 4,50,000 labour force enter intoNepalese Job market in search of job (Economic Survey, 2012/13). Hardly, one third of it canget some jobs in Nepal. It shows higher rate of unemployment. Globalization should beassociated with an increase in relative demand for worker in industrial economies. Wage andopportunity gaps, political instabilities, unemployment, low salary structures, are other causesof labour migration. Likewise, decrease in share of young people in developed countries andincrease in Asia, Africa and other country is another important cause of labour migration.Developed countries and getting cheaper labour force while poor countries gain fromcomparatively higher wages and remittances.
Foreign Employment and flow of RemittancesMigration from developing to developed countries has increased in the recent days. It'simportance and impact has been felt in every aspects of the life of the country. Migration andforeign employment has become a way of life to many youth of the country. In Nepal about4,50,000 productive youths enter the labour market annually. The three year interim plan hasset an objective of reducing country's unemployment situation there by reducing poverty level;enhancing contribution of foreign employment in strengthening of country's economy andmanaging safe and dignified foreign employment.
The total number of workers gone for foreign employment during the period between FY1994/95 and FY 2011/12 has reached 24,37,111. Various reports show that large numbers ofNepalese workers also have gone abroad for foreign employment without government permit.Based on official and unofficial records, more than 3 million Nepalese citizens gone abroadfor foreign employment (Economic Survey, 2013). Likewise, recent reports show that in anaverage, more than 1500 Nepalese people are going abroad in search of job.
The workers remittances for some selected countries are presented in Table 1 and Table 2.Table 1: Workers Remittances for selected countries(Amount in US$ Million)
64 Mani Ratna Lamsal
Source: Sigdel, Bamadev (2010), Table 1, P-113
Country 1996 2000
Albania 500 531
Bangladesh 1345 1958
Brazil 1866 1113
Columbia 635 1128
Croatia 603 531
India 8453 9054
Mexico 4224 6573
Sudan 220 638

Table 2: Remittances inflow in Selected SAARC Countries (US $ million)
Source: Sigdel, Bana Dev (2010), Table 2, P-114
Country 1997/98 1998/99 1999/00 2000/01 2001/02 2002/03
Bangladesh 1525.4 1705.7 1949.3 1882.1 2501.1 3062.0
India 11875.0 11830.0 12290.0 12125.0 14807.0 15170.0
Pakistan 1490.0 1060.0 983.0 1086.5 2389.0 4236.8
Sri lanka 817.7 867.5 930.5 979.0 1040.5 NA
Table 1 and Table 2 show the inflow of remittances in selected countries. As shown in Table-1, India received the largest amount of remittance i.e. US$ 8453 and US$9034 million in1996 and 2000 respectively. Likewise, Table 2 shows that India, Pakistan, Srilanka andBangaladesh are largest recipient of remittance in South Asia.The world wide flow of remittances in all over the world has been presented in Table 3.
Table 3: Global flows of International Migrant Remittances ($ million)
Source: International monetary fund, 2007
Table 3 represents the global flows of remittances from international migrants. It shows thedata between 2000 to 2005 A.D. The first destination for maximum remittances inflow areall developing countries because of maximum availablity of labour force, which is followedby lower middle income countries (MICS), Latin America and caribbean, upper middle incomecountries (MICS), Low income countries, South Asia. In 2000, total flow of remittances inworld was $131,786 million while it has reached to $257496 in 2005.
Which country of the world sends maximum remittances to stood at top first position? It isUnited States followed by Saudi Arabia, switzerland, Germany, etc. The list of topremittances sending countries with their ranks (for 2005) is presented in Table - 4.
2000 2001 2002 2003 2004 2005
All developing countries 85,231 96,348 116,697 145,016 163,176 188170
Low income countries 21,792 25,897 32,048 39,572 40,534 45815
Middle income 63,439 70,451 84,649 105444 122642 142355
Lower MICS 43263 48079 61485 75319 86076 95325
Upper MICS 20176 22372 23164 30125 36566 47030
East Asia and pacific 16682 20105 29476 35309 38774 43934
Europe and central Asia 13383 12980 14386 17299 22691 30812
Latin America and Caribbean 20127 24381 28097 34856 41103 47556
Middle east and North Africa 13202 15082 15595 20702 23419 23542
South Asia 17212 19185 24155 31094 29787 34883
Sub-sahara africa 4625 4615 4988 5756 7403 7443
World 131786 147015 169688 204671 230495 257496
An Analysis of Foreign Employment and Inflow of Remittance in Nepal 65
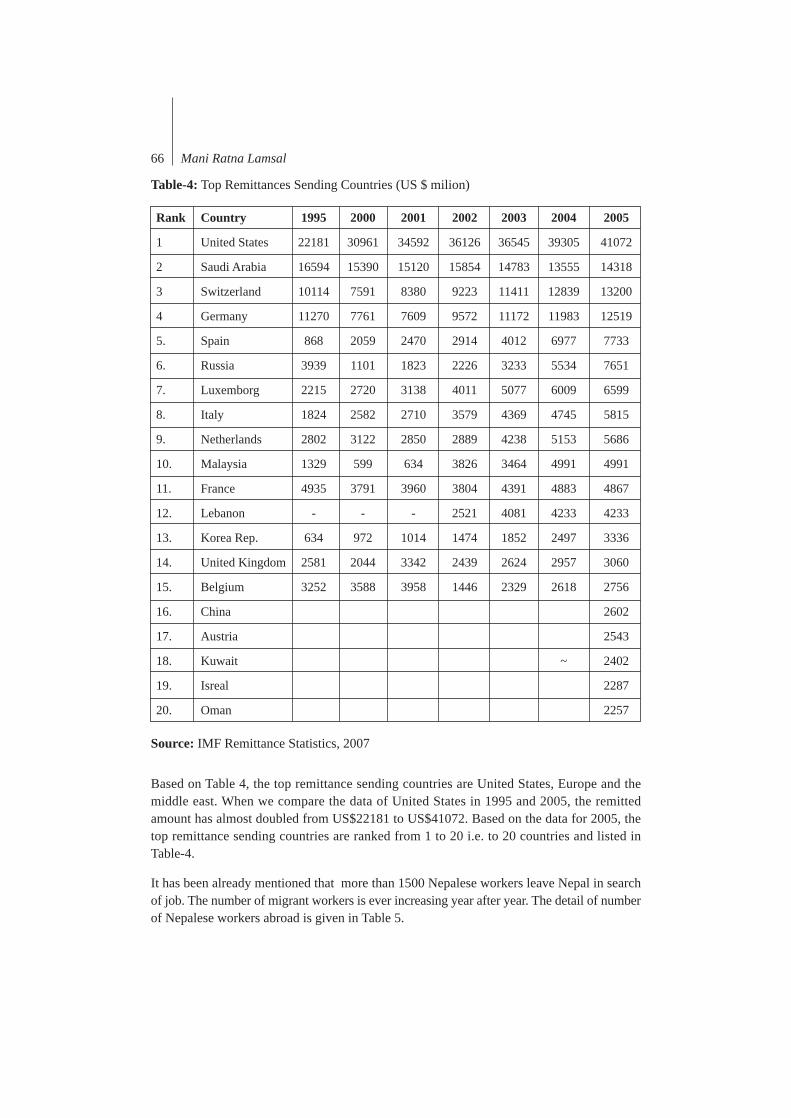
Table-4: Top Remittances Sending Countries (US $ milion)
Rank Country 1995 2000 2001 2002 2003 2004 2005
1 United States 22181 30961 34592 36126 36545 39305 41072
2 Saudi Arabia 16594 15390 15120 15854 14783 13555 14318
3 Switzerland 10114 7591 8380 9223 11411 12839 13200
4 Germany 11270 7761 7609 9572 11172 11983 12519
5. Spain 868 2059 2470 2914 4012 6977 7733
6. Russia 3939 1101 1823 2226 3233 5534 7651
7. Luxemborg 2215 2720 3138 4011 5077 6009 6599
8. Italy 1824 2582 2710 3579 4369 4745 5815
9. Netherlands 2802 3122 2850 2889 4238 5153 5686
10. Malaysia 1329 599 634 3826 3464 4991 4991
11. France 4935 3791 3960 3804 4391 4883 4867
12. Lebanon - - - 2521 4081 4233 4233
13. Korea Rep. 634 972 1014 1474 1852 2497 3336
14. United Kingdom 2581 2044 3342 2439 2624 2957 3060
15. Belgium 3252 3588 3958 1446 2329 2618 2756
16. China 2602
17. Austria 2543
18. Kuwait ~ 2402
19. Isreal 2287
20. Oman 2257
Source: IMF Remittance Statistics, 2007
Based on Table 4, the top remittance sending countries are United States, Europe and themiddle east. When we compare the data of United States in 1995 and 2005, the remittedamount has almost doubled from US$22181 to US$41072. Based on the data for 2005, thetop remittance sending countries are ranked from 1 to 20 i.e. to 20 countries and listed inTable-4.
It has been already mentioned that more than 1500 Nepalese workers leave Nepal in searchof job. The number of migrant workers is ever increasing year after year. The detail of numberof Nepalese workers abroad is given in Table 5.
66 Mani Ratna Lamsal

Table-5: Number of Nepalese Workers Abroad
Source: Department of Foreign Employment* First eight months
Table 5 shows the total number of Nepalese workers working abroad up to different years.Up to FY 2002/03, total number of working abroad was 347062 while it has been reached2437111 until the end of FY 2011/12.
The major destinations of Nepalese workers are Malaysia, Saudi Arabia, Qatar, UAE, Kuwait,South Korea, etc. The main destinations have been presented in Table 6.
Table-6: Destination of Nepalese Migrant workers in FY 2012/13
S.N. Country Male Female Total Percent1. Qatar 54639 582 55221 19.962. Malaysia 97543 4697 102240 36.943. Saudi Arab 60576 283 60859 21.994. UAE 32399 5686 38085 13.765. Kuwait 6150 3408 9558 3.466. Bahrain 2318 565 2883 1.057. Oman 2127 683 2810 1.018. South Korea 1613 151 1764 0.609. Lebanon 184 158 342 0.1210. Israel 30 29 59 0.0211. Afghanistan 211 2 213 0.0812. Japan 650 101 751 0.2813. Others 1634 368 2002 0.73
Total 260074 16713 276787 100
Source: Department of Foreign Employment.Note: Percentage values are calculated by researcher.
Fiscal Year No. of Workers
2002/03 347062
2003/04 452792
2004/05 591695
2005/06 756039
2006/07 959985
2007/08 1203657
2008/09 1413500
2009/10 1702239
2010/11 2055685
2011/12 2437111
2012/13* 2713898
An Analysis of Foreign Employment and Inflow of Remittance in Nepal 67

Table No. 5 shows that the total number of Nepalese people who have gone for foreignemployment in FY. 2012/13 is 276787 (2713898-2437111=276787). Of this number, 16,713are women while 260074 are men. Regarding to their destination, Table No. 6 clarifies thatMalaysia is the first destination with 36.94 percent labour for followed by Saudi Arab (21.99%),Qatar (19.96%), UAE (13.76%) and Kuwait (3.46%) respectively.
Inflow of Remittances in NepalEmployment in foreign countries provides opportunity to work in other countries. Thosepeople working abroad send money in the home country. The proportions of households thatreceive remittances are 56 percent in Nepal. The average income transfer in the form ofremittance is Rs. 80,436 (in nominal terms) per recipient household (NLSS-III, 2010/11). Ofthe total remittances, 77% of remittances are transferred by person, 19 percent via financialinstitution, 2 percent via hundi and 2 percent from other means.
According to NLSS-III, 79 percent of the total remittance received by the household is usedfor daily consumption, 7 percent is used for loans repayment, 4 percent for education, 2% forcapital formation, 4 percent for household property, etc. Out of the total inflow of remittances,85 percent remittances come only from five countries (Malaysia, Qatar, Saudi Arab, Japan,and America). The largest among of remittances i.e. 36 percent of total comes only fromMalaysia (Kantipur Daily, May 6, 2014). The summary statistics of remittanceinflow as prepared by Nepal living stndard summar-III is presented in Table 7.
Table 7: Summary Statistics of Remittances 1995/96 to 2010/11
Source: Nepal Living Standard Survey, 2010/11
68 Mani Ratna Lamsal

The year-wise inflow of remittances has been presented in Table No.8Table-8: Year wise inflow of Remittances (RS Billion)
Source: Various issues of economic survey, MOF.
Table 8 shows the various aspects of remittance. It depicts year wise inflow of remittancessince FY 1990/91 to FY 2011/12, the annual percentage change in inflow of remittance andthe ratio of remittance income to GDP of Nepal. In FY 1990/91, the total amount of remittanceincome received by Nepal was Rs. 550 million (i.e. Rs. 0.550 billion). Which was 0.46 percentof GDP. Up to FY 2000/01, there is volatile in inflow of remittances. We can see many negativeas well as positive annual changes in the inflow of remittances.
However, after 2000/01, there is only positive annual percentage change in inflow of remittancein Nepal. The remittances inflow has increased by 682.8 percent in 2000/01 as compared withprevious fiscal year 1999/00. Likewise, the FY. 2005/06, 2008/09 and 2011/12 are remarkableyears in which there are significant inflow of remittances in Nepal. The ratio of remittancesto GDP are also increasing. It is also good symbol for Nepalese economy, which is going tobe remittance economy.
Conclusion and RecommendationsMigration of labour from labour surplus (i.e. underdeveloped) country to labour-deficit country(developed or industrialized country) is becoming one of the major issues in these days. The
Fiscal year Remittance income Annual Remittance(Rs. billion) percentage change income/GDP (%)
1990/91 0.550 - 0.461991/92 0.423 -23.1 0.281992/93 0.550 30.0 0.321993/94 0.223 -59.4 0.111994/95 2.906 1203.1 1.331995/96 2.660 -8.4 1.071996/97 2.938 10.4 1.051997/98 4.084 37.4 1.361998/99 6.520 59.6 1.91
1999/2000 6.031 -7.5 1.512000/01 47.216 682.8 10.692001/02 47.536 0.67 10.352002/03 54.203 14.0 11.02003/04 58.587 8.1 10.92004/05 65.544 11.9 11.12005/06 97.688 49.0 14.92006/07 100.144 2.5 13.82007/08 142.68 42.2 17.52008/09 209.70 47.0 21.22009/10 231.73 10.5 19.42010/11 253.55 9.4 18.52011/12 359.55 41.8 23.1
An Analysis of Foreign Employment and Inflow of Remittance in Nepal 69
migrant worker's earning is sent back to their home country by various channels like: banks,money transfers, hundi system, via friends, etc. Appropriate use of remittance at variousmicro level help to uplift macro economic activities. Proper use of remittances reduces thepoverty, increases the availability of foreign currency, maintains the BOP surplus, helps inbusiness expansion, etc which are key macroeconomic activities.
In reality, the contribution of remittances to national economy is more than described byofficial data. A significant proportion of the remittances enters into nation by unofficialchannels. In recent years, the share of remittances in total foreign exchange earning hasexceeded income from tourism and export. So, every concerned people says that Nepaleseeconomy has been largely supported by remittances. In the year 1994/95 the number of workersgoing abroad as job seekers was just 2159 which has reached to 2437111 by the end of 2011/12.The inflow of remittances was Rs. 0.550 billion in 1990/91 which has reached to Rs. 359.55billion in FY 2011/12.
Despite the various importance of remittances, nearly 79 percent (See Table 7) remittanceincome is used for consumption purpose, purchasing land and houses, etc. But, there is lackingof appropriate use of remittances in productive sectors. Some important recommendation forconcerned person/ authorities are: provide easy access to information about foreign employment;job-related training which increases the efficiency, productivity and income; providing allservices related to foreign employment from one place, increasing the number of destination,managing the inflow of remittances from formal channels; formulating suitable policies tomotivate savings and productive investment of remitted income by discouraging unnecessaryconsumption.
ReferencesBrowne, C. and A. Mineshima (2007). Remittances in the pacific region, IMF Working Paper, IMF
Washington DC.Dahal, M.K. (2004). Nepalese economy: Towards building a strong economic nation - state in Nepalese
economy. Central Department of Economics (CEDECON), Tribhuvan University (TU), KirtipurKantipur Nepali National Daily, Tuesday, May 6, 2014.Kayastha, Narendra L. (2002). Nepalese migrant workers and remittance economy of Nepal. A paper
submitted to faculty of humanities and social sciences at Tribhuvan University.Ministry of Finance, Economic survey of Nepal (2012/13), Government of Nepal.Nepal Living Standard Survey - III ( 2010/11). Central bureau of statistics, Kathmandu.Neupane, Nirmal Kumar ( 2010). An analysis of impact of remittance on Nepalese economy. A dissartation
submitted to Central Department of Economics, T.U.Pant, B. (2006). Remittances inflow to Nepal: Economic impact and policy option. Nepal economic
review, Nepal Rastra Bank, Kathmandu.Ratha, D. et al (2007). Remittances trend 2007: Migration and development Brief - 3, Migration and
Remittance Team, World Bank.Robert, B. (2004). Remittance in Armenia: Size, impact and their contribution to develop-ment, USAID.Seddon, David; Jagannath Adhikari and Ganesh Gurung ( 1999). The new lahures: Foreign employment
and remittance economy of Nepal. Kathmandu: Nepal Institute for Development StudiesShresthe, Bijaya (2004). Foreign employment and the remittance economy of Nepal in Nepalese economy.
Kathmandu: Central Department of Economics (CEDECON), Tribhuvan University (TU), KirtipurSigdel, Bama Dev ( 2010). Dimentions of Nepalese economy. Human Actions for Rapid Development
(HARD), Kathmandu.World Bank ( 1995). World development report. Washington DC.
70 Mani Ratna Lamsal

Non-financial Performance Measurement Practices in Nepalese Commercial Banks 71
Abstract
Purpose- The purpose of this paper is to examine the non-financial performance measurement
practices in Nepalese commercial banks.
Design/methodology/approach- Descriptive as well as exploratory research design has been used. Data were obtained
through self administered structured questionnaire and interviews with high authority offive commercial banks established before 1990s. It has followed judgmental and conveniencesampling technique and a total of 27 usable responses were gathered and used in the dataanalysis.
Findings- Nepalese commercial banks are moderately using a limited number of non-financial
measures while measuring their performance. Strategic customer related non-financialmeasures have not been used yet in both types of banks. Lack of research and managementinformation system are the main problems encountered during the performance measurementpractices.
Originality/value- The paper shows that one important practical implication to emphasize the use of non-
financial measures that are fundamental to the long term success of organizations.
Key words- Performance Measurement, non-financial measures, out- ward looking, long-term focus,
intangible assets, commercial Banks.
Paper type- Research paper
NON-FINANCIAL PERFORMANCEMEASUREMENT PRACTICES INNEPALESE COMMERCIAL BANKS
Naba Raj Adhikari...?
Mr. Adhikari is the Asst. Deon and Associate Professor of Management at Tribhuvan University.

72 Naba Raj Adhikari
Namazi & Abhari (2010), pointed that prior to 1980's, organizations adopted financial measures(net profit, return on equity, return on investment, etc.) to appraise their performance. Accordingto Johnson and Kaplan (1987), performance measurement based on traditional cost ormanagement accounting system that was introduced in early 1900s is no longer suitable andless useful in today's business environment.
Measures 1960's 1970's 1980's 1990 onwards
Main Focus Financial Financial Financial / Financial /Managerial Non Financial
Key Accounting Accounting Unit Costs BalancedDevelopments Earnings Earnings Scorecard
Earnings Residual Joined EconomicPer share Income Budgets Value Added
Return on Return on Operating Activity-BasedInvestment Investment Profits Costing
Net Present Value Cash Flows
(Source: Swamy, 2002)
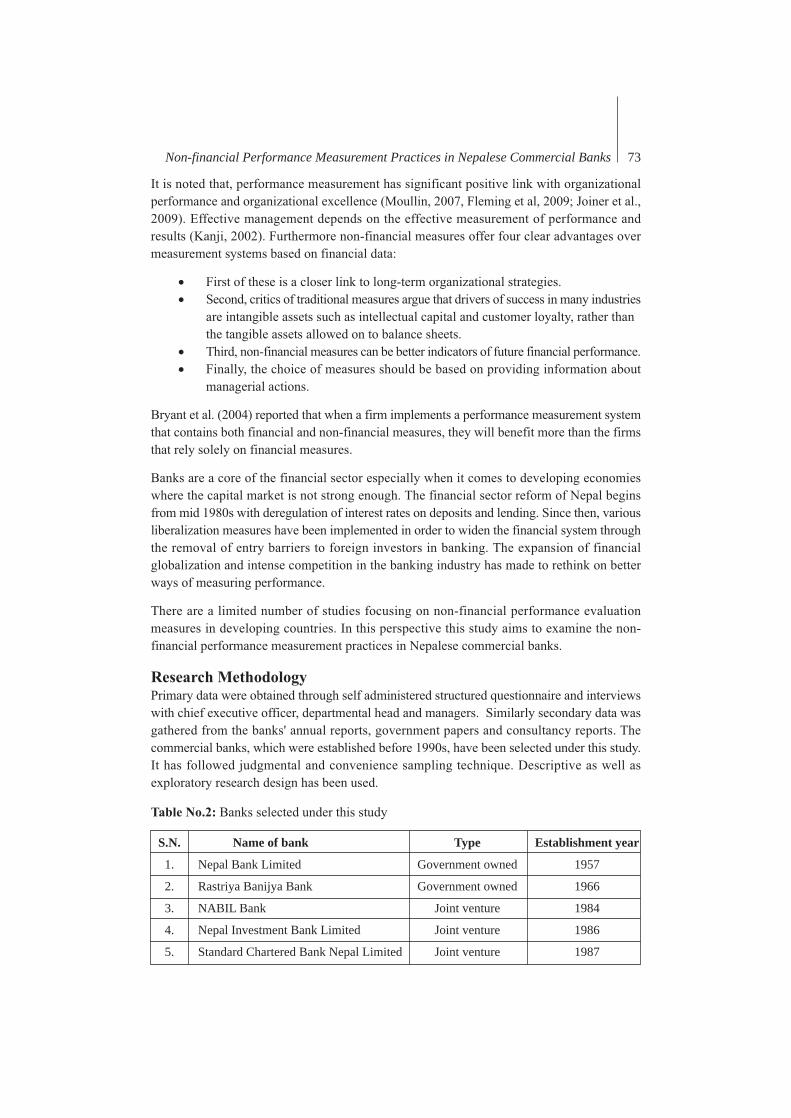
S.N. Name of bank Type Establishment year
1. Nepal Bank Limited Government owned 1957
2. Rastriya Banijya Bank Government owned 1966
3. NABIL Bank Joint venture 1984
4. Nepal Investment Bank Limited Joint venture 1986
5. Standard Chartered Bank Nepal Limited Joint venture 1987
Non-financial Performance Measurement Practices in Nepalese Commercial Banks 73
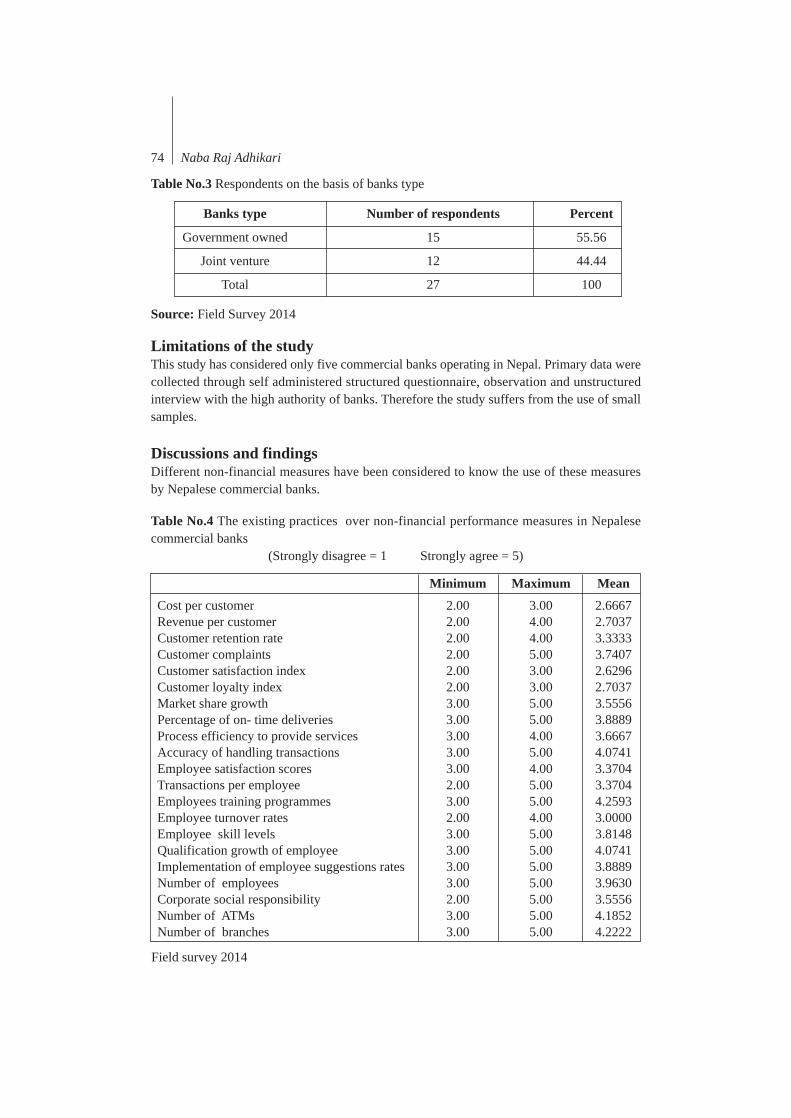
Table No.3 Respondents on the basis of banks type
Source: Field Survey 2014
Limitations of the studyThis study has considered only five commercial banks operating in Nepal. Primary data werecollected through self administered structured questionnaire, observation and unstructuredinterview with the high authority of banks. Therefore the study suffers from the use of smallsamples.
Discussions and findingsDifferent non-financial measures have been considered to know the use of these measuresby Nepalese commercial banks.
Table No.4 The existing practices over non-financial performance measures in Nepalesecommercial banks
(Strongly disagree = 1 Strongly agree = 5)
Field survey 2014
Banks type Number of respondents Percent
Government owned 15 55.56
Joint venture 12 44.44
Total 27 100
Minimum Maximum Mean
Cost per customer 2.00 3.00 2.6667Revenue per customer 2.00 4.00 2.7037Customer retention rate 2.00 4.00 3.3333Customer complaints 2.00 5.00 3.7407Customer satisfaction index 2.00 3.00 2.6296Customer loyalty index 2.00 3.00 2.7037Market share growth 3.00 5.00 3.5556Percentage of on- time deliveries 3.00 5.00 3.8889Process efficiency to provide services 3.00 4.00 3.6667Accuracy of handling transactions 3.00 5.00 4.0741Employee satisfaction scores 3.00 4.00 3.3704Transactions per employee 2.00 5.00 3.3704Employees training programmes 3.00 5.00 4.2593Employee turnover rates 2.00 4.00 3.0000Employee skill levels 3.00 5.00 3.8148Qualification growth of employee 3.00 5.00 4.0741Implementation of employee suggestions rates 3.00 5.00 3.8889Number of employees 3.00 5.00 3.9630Corporate social responsibility 2.00 5.00 3.5556Number of ATMs 3.00 5.00 4.1852Number of branches 3.00 5.00 4.2222
74 Naba Raj Adhikari

The above mentioned table indicates that the mean value of customer satisfaction index,customer loyalty index, new customer acquisition rate, cost per customer, revenue per customerand employee turnover rates are less than three. It means that these indicators approximatelynot in use by Nepalese banks. Furthermore strategic non-financial measures like customerrelated measures have not used. Employee training programmes, no. of ATMs, no. of branches,qualification growth of employee, number of employees and accuracy of handling transactionsare moderately used. The other measures are highly nominal in use. It concludes that Nepalesecommercial banks are moderately using a limited number of non-financial measures whilemeasuring their performance. But the respondents have expressed their views towards thesignificant importance of non-financial performance measures in performance measurementsystem.
Difficult to quantify the qualitative information related with non financial measures, lack ofresearch and study, lack of information and management information system are the mainproblems encountered during non-financial measurement practices in commercial banks underthis study. Financial measures have been significantly used while measuring the performancein Nepalese commercial banks.
ConclusionsMaintenance of an effective performance management system is a fundamental issue thatevery organization must continuously pay attention in order to ensure its survival. Thediscussion and analysis of this study reveals that Nepalese commercial banking sector hasrelying on the use of financial measures. Non-financial measures have got negligible importancein evaluating the performance. Strategic customer related non-financial measures have notbeen used. It is not a good symptom for Nepalese commercial banks to its long term success.Similarly lack of research and lack of management information system are the main problemsencountered during the use of non-financial measures.
Implications for Future ResearchWhile deciding conclusions of this study some possible areas that can be explored in futureresearch came into existence.
A comparative study on performance measurement practices and organizational performancecan be conducted between joint ventures banks and private commercial banks in Nepal.Similarly organizational performance can be explored before and after the merger of Nepalesecommercial banks.
Non-financial Performance Measurement Practices in Nepalese Commercial Banks 75
Reference
Bryant, L., Jones, D.A. and Widener, S.K. (2004). Managing value creation within the firm:an examination of multiple performance measures. Journal of management accountingresearch, Vol. 16, pp. 107-31.
Fleming, D.M., Chow, C.W., Chen, G. (2009). Strategy, performance-measurement systems,and performance. A study of Chinese firms, international journal of accounting, Vol.44, No. 3, pp. 256-278.

Johnson, H.T. and Kaplan, R.S. (1987). Relevance lost: The rise and fall of management accounting.Harvard business school press, Boston, MA.
Joiner, T.A., Spencer, X.S., and Salmon, S. (2009). The effectiveness of flexible manufacturing strategies:The mediating role of performance measurement systems. International journal of productivityand performance measurement, Vol. 58, No. 2, pp. 119-135.
Kanji, G. K. (2002). Performance measurement system. Total quality management, Vol. 13, No. 5, pp.715-728.
Kaplan, R.S. and Norton, D.P. (2001). The strategy-focused organization: How balanced scorecardcompanies thrive in the new business environment. Harvard business school press, Boston, MA
Kaplan, R.S. & Norton, D.P. (1996). The balanced scorecard: Translating strategy into action. Boston:Harvard business school press.
Lebas, M.J. (1995). Performance measurement and performance management. International journal ofproduction economics, Vol. 41, pp.23-35.
Moullin, M. (2007). Linking performance measurement and organizational excellence. Internationaljournal of health care quality assurance, Vol. 20, No. 3, pp. 181-183
Mullins, L.J (2010). Management and organizational behavior. England: Pearson Education Limited
NABIL Bank limited (2013). Annual report. Kathmandu: NABIL Bank Limited.
Namazi, M., & Abhari, H. (2010). An investigation of the balanced- scorecard's applications forperformance measurement of the firms accepted in the Tehran securities exchange market.Journal of applied sciences research, Vol. 6 No. 8, pp. 943-955
Neely, A. (1998). Measuring Business Performance. Profile books, London, UK.
Neely, A.D., Mills, J.F., Gregory, M.J. and Platts, K.W. (1995). Performance measurement systemdesign-a literature review and research agenda. International journal of operations, and productionmanagement, Vol. 15, No. 4, pp.80-116.
Nepal Investment Bank limited (2013). Annual report. Kathmandu: Nepal Investment Bank Limited.
Nepal Rastra Bank (2013). Banking and financial statistics, Kathmandu. Nepal rastra bank.
Nepal Rastra Bank (2013). Bank supervision report. Kathmandu: Nepal Rastra Bank.
Standard Chartered Bank Nepal Limited (2013). Annual report. Kathmandu: Standard Chartered BankNepal Limited
Swamy R. (2002). Strategic performance measurement in the new millennium. CMA management, May,pp.44-47
76 Naba Raj Adhikari
DIVIDEND POLICY, PERFORMANCE,AND THE STOCK PRICE IN NEPAL
Dr. Nabaraj Adhikari...?
Dividend Policy, Performance, and the Stock Price in Nepal 77
Abstract
Several studies have been documented in the extant literature on the relevance and irrelevanceof dividend policy or dividend policy and enterprise performance in developed and emergingcapital markets as well as a few studies on dividends and stock prices in pre-emerging capitalmarkets. There is lack of empirical studies on dividend policy, performance, and the stockprice in the extant literature. This paper, therefore, aims at investigating the dividend policy,performance, and the stock price in the pre-emerging capital market of Nepal employingdescriptive cum analytical research. A priori hypothesis between relationship of the variablesindicating dividend policy, performance and stock price are set based on empirical studies,and tested on the data from 22 listed enterprises covering a 5-year period, 2009 to 2013. Allregular dividend paying enterprises are selected and data obtained are analysed using portfolioanalysis and cross-section regression approach. The findings reveal that higher the dividendpayout, better the performance and that a dividend is a major factor affecting the stock priceand current year dividend per share affects negatively while dividend paid in the past yearand return on equity influence positively the stock price. The implication of the findings isthat devoting adequate time in designing and disseminating a dividend policy are desired inimproving the performance of listed companies and enhancing the stock price in the pre-emerging capital markets. As the paper addresses the gap in the extant literature, the findingscould be useful for research scholars, financial analysts and investors.
Keywords: Capital market; dividend policy; performance; pre-emerging; stock priceJEL classifications: C 31; C 87; G32; G 35
1 The earlier version of this paper was presented at 2nd International Conference on Economics andFinance organised by Nepal Rastra Bank during 26-28 February, 2015, Kathmandu, Nepal
* Dr Adhikari is the Director at Securities Board of Nepal (SEBON), Lalitpur, Email:[email protected]

78 Nabaraj Adhikari
IntroductionThere is considerable debate on whether dividend payouts affect value of the stock. Somestudies state that dividends increase shareholder wealth (Gordon, 1963; Walter, 1963). Someother studies state that dividends are irrelevant (Miller & Modigliani, 1961; Black & Scholes,1974; Miller & Scholes, 1978); and still other studies argue that dividends decrease shareholders'wealth (Litzenberger & Ramaswamy, 1979; Naranjo et al., 1998). Despite the numerousstudies, dividend policy remains an unresolved issue in corporate finance.
Amidu (2007) reveals that dividend policy affects enterprise performance as measured by itsprofitability. The results show a positive and significant relationship between return on assets,return on equity, growth in sales and dividend policy. Banz (1981) reveals that average returnson large stocks are lower while average returns on small stocks are higher. Bolster & Janjigian(1991) indicate that the value of the enterprise is greater for stocks with higher dividend yieldsas compared to stocks with lower dividend yields. In line of these studies, the present paperaims to find the relationship between dividend policy and performance of the listed companyin Nepal.
Solomon (1963) contends that dividends may offer tangible evidence of the enterprise's abilityto generate cash, and as a result, the dividend policy affects the value of the enterprise. Brennan(1970) proves that if effective capital gains tax rates are lower than effective rates on dividendincome, then investors will demand a higher rate of return on securities with higher dividendpayout. Pradhan (2003) argues that the share value is affected by dividend payments. It is thusthe other issue to be addressed in this paper is: Whether there is any influence of dividendpolicy on stock price using more recent data?
The remainder of the paper is organised as follows. Section 2 provides the review of literature.Research methodology is presented in Section 3. Analysis of data is made in Section 4. Section5 presents the findings and discussion. Lastly, Section 6 offers the policy implications.
Literature reviewMiller & Modigliani (1961), designated as MM hereafter present a comprehensive argumentfor dividend irrelevance by holding the enterprise's investment policy constant in their analysisof dividend policy and showing with perfect capital markets in which there is an absence oftaxes, rationality, and perfect information that dividends can be replaced at no cost; thusdividend policy is irrelevant to the valuation of share. MM views dividend policy as thefollowing trade-off: retaining earnings versus paying cash dividends and issuing new sharesof stock. According to them an enterprise can offset any dividends it pays by issuing newshares of stock. Since any dividend policy can easily be offset, they argue that dividend policydoes not influence the value of share.
Friend & Puckett (1964) use cross-section data to test the effect of dividend on stock price.Prior to this work, most studies had related stock prices to current dividends and retainedearnings, and reported that higher dividend payout was associated with higher price earningsratios. The study uses dividends, retained earnings and lagged earnings price ratio as independentvariables. Symbolically,
Pt = a + bDivt + cREt + d (E/P)t-1 (1)

Dividend Policy, Performance, and the Stock Price in Nepal 79
The study suggests that there is little basis for the customary view that in the stock marketgenerally, except for unusual growth stocks, a rupee of dividends has several times the impacton price of a rupee of retained earnings.
Khan & Khan (2012) studies the dividend policy and stock prices by taking a sample of 131companies listed in the Karachi Stock Exchange for a period of 10 years from 2001 to 2010.They use panel data approach to explain the relationship between stock dividend along withcash dividend and stock prices after controlling the profit after tax, earnings per share andreturn on equity. The findings indicate that dividend policy has significant positive effect onstock prices.
Masum (2014) shows the relationship between dividend declaration and its impacts on marketprice of shares of 30 commercial banks listed in Dhaka Stock Exchange (DSE) for the periodof five years from 2007- 2011. The model employed is:
Where, DY is dividend yield, RR is retention ratio, PAT is profit after tax, earnings per share,ROE is return on equity, ?t is the specific characteristics measure of each bank calledunobservable heterogeneity, and ?t is a parameter for time dummy variables which is equalfor all banks in each year but changes over time and ? is the error term. The empirical estimationof the model reveals that return on equity and earnings per share have statistically significantpositive impact on stock prices of the commercial banks of Bangladesh.
The assumption of perfect market, no taxation, no transaction cost, possibility of arbitrage,etc., are over simplified and it does not apply in the real world (Dhanani, 2005). For example,in Nepal, the capital market contains all sort of imperfections. Moreover, there is absenceof empirical studies on dividend policy, performance, and the stock price in the extant literature.A brief review of capital market trend during mid-July 2008 to mid-July 2011 reveals thaton 31 August, 2008 NEPSE index was reached to 1175.38 as the record points and on 15 June2011, NEPSE index was decreased to 292.31 as the lowest points and within a year also thereis a wide deviation between the highest and lowest points of the NEPSE index. NEPSE indexrose as high as 1175.38 points as on 31 August, 2008 and as low as 609.46 points as on 22January, 2009 leading to have 565.92 points deviation between the highest and the lowestindex in a single year starting from mid-July 2008 to mid-July 2009. These fluctuations inthe index were occurred without having any definite economic and other reasons. Such afluctuation in market index can be considered quite high and undesirable for the credibilityof capital market in the country.
In view of the gap in the extant literature as well as in the context of speculative marketscenario of the country as aforementioned, it is interesting to investigate dividend policy,performance, and the stock price of the enterprises in Nepal.
Research methodologyThis section deals with a description of the research methodology employed in addressingthe issues of this study.

80 Nabaraj Adhikari
Target population, data source, and sampling procedureThe population for this study consists of the enterprises listed on the Nepal Stock ExchangeLtd. (NEPSE). In mid-July 2013, there were 230 enterprises listed on NEPSE. The enterprisesare selected based on the availability of information. The criteria by which the enterprises areincluded in the sample are: (i) The enterprises must have available data for all years, that is2009-2013. (ii) The enterprises must have been listed on NEPSE before the aforementionedperiod of time. A review of data sources: individual annual reports of listed enterprises andannual trading reports of NEPSE reveal that till mid-July 2013, there were 22 listed enterprisespaying dividends regularly for the study period mid-July 2009 to mid-July 2013 with therequired data for the purpose of the study. The reason for selection for 5 years' time span isto have a large number of enterprises having uninterrupted dividend payouts in the sampleand that one business cycle is completed in 5-7 years (Rafique, 2012). Thus, cross-sectionaldata of 22 listed enterprises (first 17 are financial and last five are non-financial) for the periodof 2009 to 2013 (inclusive) with a total of 110 observations are used in the study as presentedin Appendix 1.
Basic regression model and variables with hypothesized signsTo examine the relationship between dividend policy and stock price of the enterprise, thefollowing model developed based on empirical findings is employed with the aid of StatisticalPackage for Social Science (SPSS) 20:
Pit = a0 + a1 EPSit + a2 ROEit + a3 BETAit + a4 DPSit + a5 LAGDPSit + a6 REPSit + µit (3)
Where, the variables and hypothesised signs are as follows:'Pit' is per share market price of enterprise 'i' in period't'; it is year-end closing price of theshare that indicates the value of the enterprise. It is dependent variable in the model.'EPSit' is earnings per share of enterprise 'i' in period't', that is, the amount of earnings pereach outstanding share of an enterprise's stock. Based on Khan & Khan (2012); & Masum(2014), it is hypothesised that per share market price is positively related to the earnings pershare.
'ROEit' is return on equity of enterprise 'i' in period't' which is net income after tax dividedby shareholders equity. Shareholders' equity is share capital plus reserves and surpluses.Based on Khan & Khan (2012); & Masum (2014), it is hypothesised that per share marketprice is positively related to the return on equity.
'BETAit' is systematic risk of the share of enterprise 'i' in period't' and is obtained from thefollowing formula: ? = COV (return on per share and return on market)/ market variance.BETA is considered proxy for enterprise risk in various empirical studies and is referred toas a measure of the sensitivity of the asset's return to variation in the market return, its systemicrisk (Rozeff, 1982; Alli et al., 1993; Holder et al., 1998). Based on Friend & Puckett (1964);Ardestani et al. (2013); & Ranti (2013)), it is hypothesised that per share market price isinversely associated with the risk of the enterprise.
'DPSit' is dividend per share of enterprise 'i' in period't', and it is proxy for the dividend policyof the enterprise in this paper as in Gul et al. (2012); S.A. & S.O. (2013); & Yegon et al.(2014). Based on Graham & Dodd (1951); Bolster & Janjigian (1991); Pradhan (2003); Khan
Dividend Policy, Performance, and the Stock Price in Nepal 81
& Khan (2012); & Adhikari (2014), it is hypothesised that per share market price will increasewith the dividend per share distributed by the enterprise.
'LAGDPSit' is dividend per share of enterprise 'i' in period't-1' that is past year dividend.Based on Baker & Powell (2000); & Adhikari (2014), it is hypothesised that per share marketprice will increase with the lagged dividend per share of the enterprise.'REPSit' is retained earnings per share of enterprise 'i' in period't' and it is earnings retainedby the enterprise after the payments of preferred dividends and cash dividends to equityshareholders. Based on Pradhan (2003); & Khan & Khan (2012), it is hypothesised that pershare market price will fall with the increase in retained earnings per share. 'µit' is randomerror term.
Analysis of dataExamination of the relationship between dividend policy, performance, and stock price isundertaken using the pooled cross-sectional data for various classifications of sample enterprises.As such, the study is attempted at two levels using overall sample, viz., (a) analysis ofproperties of portfolio formed on dividends and (b) regression analysis. The study is alsoattempted using group-specific samples by regression analysis. The following sub-sectionspresent the analysis and findings of data.
Overall analysisThe overall analysis of the dividend policy, performance and valuation of stock price of theenterprise comprises analysis of properties of portfolio formed on dividends and regressions.
Properties of portfolios formed on dividendsThe portfolios are formed on dividends of low and high dividend paying enterprises, and allsampled securities are sorted out into three portfolios based on dividends. The smallest tolargest enterprises are contained in portfolios 1, 2, and 3 respectively. The low to high ratiosof enterprise performance indicators are provided in portfolios 1 to 3. For each security,various measures of earnings per share, return on equity, risk-beta, dividend per share, laggeddividend per share, and retained earnings per share are computed. They are then classifiedaccording to the portfolios formed above, and average values are computed. The results arepresented in Table 1.
The results, among others, indicated that stocks with higher dividends have higher marketprice. The market prices per share have increased from Rs.511.06 for the smallest portfolioto Rs.2107.19 for the largest portfolio. Market prices of stocks paying higher dividends arealso more variable as compared to stocks paying lower dividends as revealed by standarddeviations of market price per share. Similarly, stocks with larger dividends have largerearnings. The earnings per share have increased from Rs.27.24 for the smallest portfolio toRs.152.17 for the largest portfolio.
The mean return on equity has increased from Rs.15.47 for the smallest portfolio to Rs.17.54for the intermediate portfolio to Rs.34.56 for the largest portfolio of stocks paying largerdividends. The return on equity is also more variable for the stocks paying higher dividendsas compared to stocks paying lower dividends as revealed by standard deviation of the returnon equity. The stocks with larger dividends have relatively lower risk as shown in Table 1from the lowest portfolio to the intermediate to the largest portfolio- the extent ofincrease in risk is quite low as compared to the extent of increase in dividends.
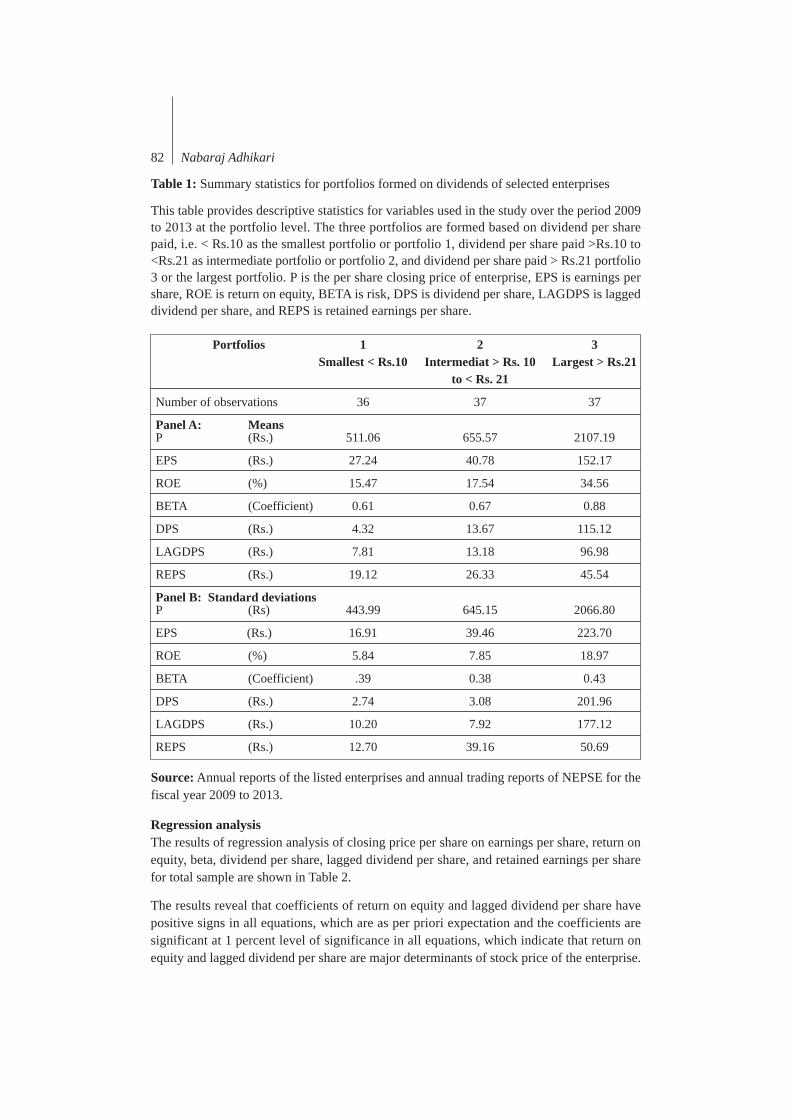
82 Nabaraj Adhikari
Table 1: Summary statistics for portfolios formed on dividends of selected enterprises
This table provides descriptive statistics for variables used in the study over the period 2009to 2013 at the portfolio level. The three portfolios are formed based on dividend per sharepaid, i.e. < Rs.10 as the smallest portfolio or portfolio 1, dividend per share paid >Rs.10 to<Rs.21 as intermediate portfolio or portfolio 2, and dividend per share paid > Rs.21 portfolio3 or the largest portfolio. P is the per share closing price of enterprise, EPS is earnings pershare, ROE is return on equity, BETA is risk, DPS is dividend per share, LAGDPS is laggeddividend per share, and REPS is retained earnings per share.
Source: Annual reports of the listed enterprises and annual trading reports of NEPSE for thefiscal year 2009 to 2013.
Portfolios 1 2 3Smallest < Rs.10 Intermediat > Rs. 10 Largest > Rs.21
to < Rs. 21
Number of observations 36 37 37
Panel A: MeansP (Rs.) 511.06 655.57 2107.19
EPS (Rs.) 27.24 40.78 152.17
ROE (%) 15.47 17.54 34.56
BETA (Coefficient) 0.61 0.67 0.88
DPS (Rs.) 4.32 13.67 115.12
LAGDPS (Rs.) 7.81 13.18 96.98
REPS (Rs.) 19.12 26.33 45.54
Panel B: Standard deviationsP (Rs) 443.99 645.15 2066.80
EPS (Rs.) 16.91 39.46 223.70
ROE (%) 5.84 7.85 18.97
BETA (Coefficient) .39 0.38 0.43
DPS (Rs.) 2.74 3.08 201.96
LAGDPS (Rs.) 10.20 7.92 177.12
REPS (Rs.) 12.70 39.16 50.69
Regression analysisThe results of regression analysis of closing price per share on earnings per share, return onequity, beta, dividend per share, lagged dividend per share, and retained earnings per sharefor total sample are shown in Table 2.
The results reveal that coefficients of return on equity and lagged dividend per share havepositive signs in all equations, which are as per priori expectation and the coefficients aresignificant at 1 percent level of significance in all equations, which indicate that return onequity and lagged dividend per share are major determinants of stock price of the enterprise.

Dividend Policy, Performance, and the Stock Price in Nepal 83
Current year dividend per share is also appeared to be an important determinant of stock priceas its coefficient is significant at 1 percent level of significance in all equations. Irrespectiveof priori expectation, the coefficient of current year dividend per share has negative sign,therefore, affecting negatively the stock price in Nepal.
Table 2: Regression results for total sample enterprisesThis table shows regression results for the model as defined by equation:
Pit = a0 + a1 EPSit + a2 ROEit + a3 BETAit + a4 DPSit + a5 LAGDPSit + a6 REPSit + µit.
The regression analysis is based on 22 enterprises over 5 years of data for a total of 110observations. P is the per share closing price of enterprise, which is dependent variable. Theindependent variables are defined as: EPS is earnings per share, ROE is return on equity,BETA is risk, DPS is dividend per share, LAGDPS is lagged dividend per share, and REPSis retained earnings per share.
T-statistics are shown in single parentheses under estimated values of the regression coefficients,and tolerances are shown in double parentheses under estimated t-statistics.
* & ** denote the significance of coefficients at 1 percent and 5 percent level of significancerespectively.
Equations Constant EPS ROE BETA DPS LAGDPS REPS R2 F-statistics
(1) 88.04 5.21 22.29 177 -16.39 22.05 -4.86 0.69 38.87*
(0.40) (0.86) (3.01)* (0.88) (-2.44)** (3.83)* (-.73)
((0.01)) ((0.52)) ((0.91)) ((0.01)) ((.02)) ((.09))
(2) 45.90 - 23.84 222.37 -12.59 22.86 0.30 0.69 46.61*
(0.21) (3.33)* (1.14) (-2.49)* (4.03)* (0.11)
((0.55)) ((0.98)) ((0.02)) ((0.02)) ((0.52))
(3) 193.76 - 24.67 - 12.93 23.31 0.03 0.69 57.77*
(1.12) (3.46)* (-2.56)* (4.11)* (0.01)
((0.56)) (0.02)) ((0.2)) ((0.53))
(4) 194.34 - 24.67 - 12.93 23.31 - 0.69 77.75*
(1.21) (3.47)* (-2.58)* (4.14)*
((0.56)) (0.02)) ((0.02))
(5) 68.57 6.10 24.05 237.63 -18.08 22.37 -5.92 0.66 33.42*
(0.30) (0.97) (3.15)* (1.14) (-2.60)* (3.76)* (-0.86)
((0.01)) ((0.52)) ((0.91)) (0.01)) ((0.02)) ((0.99))
(6) 19.27 - 25.86 290.71 -13.63 23.32 0.12 0.66 39.93*
(0.09) (3.49)* (1.45) (-2.61)* (3.98)* (0.04)
((0.55)) ((0.98)) ((0.02)) ((0.02)) ((0.52))
(7) 207.60 - 26.95 - -14.11 23.86 - 0.65 65.80*
(1.24) (3.66)* (-2.71) (4.09)*
((0.56)) ((0.02)) ((0.02))

84 Nabaraj Adhikari
To gauge robustness and sensitivity-to-specification error of the regression, each independentvariable having insignificant coefficient is removed from the complete model and the regressionsare re-estimated. These results are shown in Table 2, Equations 2-4. The coefficients of thevariables did not change in sign or size (regression coefficients are not sensitive to thesealterations in terms of sign and significance). In the additional three equations, the explanatorypower of the regression model as reflected by R2 did not increase at all. The closer tolerance(TOL) is to zero of the variable, the greater the degree of collinearity of that variable withthe other regressors (Gujarati & Porter, 2009). The TOL of dividend per share, lagged dividendper share, and earnings per share is close to zero indicating some degree of multicollinearitybetween these variables. To avoid multicollinearity problem the variable earnings per shareis removed from the Equation (2), Equation (3) and Equation (4), the results remain the samein terms of sign and significance of coefficients of the variables, hence, indicating thatmuticollinearity is not a significant problem. Further, to gauge robustness and sensitivity-to-stock price trend and fluctuation error of the regression, the average market price that isaverage of high, low and closing market price of stock is considered instead of closing priceof stock as a dependent variable in the model and the regressions are re-estimated. Theseresults are shown in Table 2, Equations 5-7. The coefficients of the variables did not changein sign or size. In these additional three equations, the explanatory power (R2) of the regressionmodel did not change remarkably. The R2, which has explained about 66 percent of cross-sectional variability in stock price with the independent variables used in the models, isconsidered as good. Similarly, F-value in all equations show that it is significant at 1 percentlevel of significance reflecting that regression equations provide statistically significant results.
Group specific analysisBased on nature of group of the enterprises involved and also number of selected listedenterprises, the overall sample is classified into two groups: (a) financial sector, and (b) non-financial sector. The results of regression analysis for financial sector sample are shown inTable 3.
Table 3: Regression results for financial sector enterprises
This table shows regression results for the model as defined by equation:
Pit = a0 + a1 EPSit + a2 ROEit + a3 BETAit + a4 DPSit + a55 LAGDPSit + a6 REPSit + µit.
The regression analysis is based on 17 enterprises over 5 years of data for a total of 85observations. P is the per share closing price of enterprise, which is dependent variable. Theindependent variables are defined as: EPS is earnings per share, ROE is return on equity,BETA is risk, DPS is dividend per share, LAGDPS is lagged dividend per share, and REPSis retained earnings per share.

Dividend Policy, Performance, and the Stock Price in Nepal 85
T-statistics are shown in single parentheses under estimated values of the regression coefficients,and tolerances are shown in double parentheses under estimated t-statistics.
* & ** denote the significance of coefficients at 1 percent and 5 percent level of significancerespectively.
The results reveal that coefficients of earnings per share and lagged dividend per share havepositive signs in all equations, which are as per priori expectation and the coefficients aresignificant at 1 percent level of significance in all equations, which indicate that earnings pershare and lagged dividend per share are major determinants of stock price of financial sectorenterprises in Nepal. Retained earnings per share is also appeared to be an important determinantof stock price as its coefficient is significant at 5 percent level of significance in majority ofequations. Irrespective of priori expectation, the coefficient of retained earnings per share hasnegative sign, therefore, affecting negatively to the stock price of financial sector enterprisesin Nepal.
To gauge robustness and sensitivity-to-specification error of the regression, each independentvariable having insignificant coefficient is removed from the complete model and the regressionsare re-estimated. These results including R2 and F-value are shown in Table 3, Equations 2-4
Equations Constant EPS ROE BETA DPS LAGDPS REPS R2 F-statistics
(1) 11.26 43.58 -2.32 -194.99 -17.73 17.88 -35.70 0.65 23.66*
(0.06) (3.66)* (-0.32) (-1.10) (-1.30) (2.38)* (-2.19)**
((0.04)) ((0.59)) ((0.74)) ((0.12)) ((0.42)) (0.09))
(2) -17.94 43.52 - -180.80 -18.94 18.36 -36.49 0.65 28.76*
(-0.12) (3.68)* (-1.06) (-1.46) (3.01)* (-2.28)**
((0.04)) ((0.79)) ((0.13)) ((0.45)) (0.09))
(3) -102.24 43.65 - - -21 18.60 -38.17 0.64 35.55*
(-0.77) (3.69)* (-1.64) (3.05)* (2.40)**
((0.04)) ((0.13)) ((0.45)) ((0.09))
(4) -181.46 26.83 - - - 17.77 -16.78 0.63 45.56*
(-1.46) (4.53)* (2.89)* (-1.83)
((0.18)) ((0.45)) ((0.28))
(5) 20.86 42.91 -2.64 -170.36 -14.72 19.51 -35.82 0.62 20.95*
(0.10) (3.23)* (-0.33) (-0.86) (0.97) (2.76)* (-1.97)*
((0.04)) ((0.59)) ((0.74)) ((0.12)) ((0.42)) ((0.09))
(6) -12.38 42.84 - -154.20 -16.10 20.05 -36.72 0.62 25.41*
(0.07) (3.24)* (-0.81) (-1.11) (2.94)* (-2.06)**
((0.04)) ((0.79)) ((0.13)) ((0.45)) ((0.09))
(7) -151.65 28.65 - - - 19.55 -19.95 0.61 41.51*
(-1.10) (4.37)* (2.88)* (-1.97)*
((0.18)) ((0.45)) ((0.28))

86 Nabaraj Adhikari
T-statistics are shown in single parentheses under estimated values of the regression coefficients,and tolerances are shown in double parentheses under estimated t-statistics.
* & ** denote the significance of coefficients at 1 percent and 5 percent level of significancerespectively.
as well as further robustness test results by considering average market price as dependentvariable in the model along with R2 and F-value as shown in Table 3, Equations 5-7 haveconfirmed the results of Equation (1) in Table 3.
The results of regression analysis for non-financial sector sample are shown in Table 4.
Table 4: Regression results for non-financial sector enterprisesThis table shows regression results for the model as defined by equation:
Pit = a0 + a1 EPSit+ a2 ROEit + a3 BETAit + a4 DPSit + a5 LAGDPSit + a6 REPSit + µit.
The regression analysis is based on 5 enterprises over 5 years of data for a total of 25observations. P is the per share closing price of enterprise, which is dependent variable. Theindependent variables are defined as: EPS is earnings per share, ROE is return on equity,BETA is risk, DPS is dividend per share, LAGDPS is lagged dividend per share, and REPSis retained earnings per share.
Equations Constant EPS ROE BETA DPS LAGDPS REPS R2 F-statistics
(1) 1005.35 -4.67 16.81 -650.51 -0.98 16.01 -1.06 0.87 19.47*(1.47) (-0.56) (0.89) (-0.65) (-0.08) (1.57) (-0.11)
((0.01)) ((0.21)) (0.51)) ((0.01)) ((0.01)) ((0.08))
(2) 1141.02 - 14.88 -825.24 -4.69 15.78 -5.96 0.86 24.28*(1.81) (0.81) (-0.88) (-0.49) (1.58) (-1.43)
((0.22)) (0.56)) ((0.01)) ((0.01)) (0.44))
(3) 1436.39 - - -881.16 -0.57 12.62 -6.88 0.86 30.58*(2.82)* (-0.95) (-0.07) (1.38) (-1.74)
((0.57)) ((0.01)) ((0.01)) ((0.47))
(4) 1018.06 - - - -1.0 12.14 -5.23 0.85 40.68*(4.04)* (-0.13) (1.34) (-1.47)
((0.01)) (0.01)) ((0.58))
(5) 950.50 -4 20.68 -668.51 -2.55 16.22 -1.58 0.89 24.26*(1.63) (-0.56) (1.28) (-0.78) (-0.26) (1.87) (-0.19)
((0.01)) ((0.21)) ((0.51)) ((0.01)) ((0.01)) (0.08))
(6) 1066.74 - 19.03 -818 -5.73 16.03 -5.77 0.89 30.13*(1.99) (1.22) (-1.02) (0.71) (1.89) (-1.63)
((0.22)) ((0.56)) ((0.01)) (0.01)) ((0.44))
(7) 1022.14 - - - -0.90 - -5.29 0.87 47.63*(4.63)* (-0.13) (-1.70)
((0.01)) ((0.58))
Dividend Policy, Performance, and the Stock Price in Nepal 87
The results reveal that coefficients of all variables are not statistically significant at 1 or 5percent level of significance in all equations, which indicate that stock price is not influencedby the variables used in the model. The result of Equation (1) in Table 4 is confirmed by therobustness tests in Equations (2) to (4) and further robustness test by considering averagemarket price as dependent variable in Equations (5) to (7). The result is also confirmed bythe goodness of fit of the model reflected by the R2 and F-value in all equations in Table 4.
Findings and discussionThe overall results for the analysis of dividend policy and performance of the enterprisesreveal that stocks with higher dividends have better performance in terms of earnings pershare, return on equity, and risk. The current year dividend per share affects negatively andlagged dividend per share affects positively to the stock price in overall sector. Consideringthe immediate influence of dividends, the present finding is inconsistent with the standardview of the role of dividend policy found in the literature that low-payout enterprises, ingeneral, will sell at a discount (Graham & Dodd, 1951; Harkavy, 1953; Gordon & Shapiro,1956; Durand, 1959; Clendenin, 1958; Fisher, 1961; Gordon, 1962; Hunt & Donaldson, 1971).Results of the tests of the effect of dividend policy on the value of stock price also contradictwith MM hypotheses that given the earnings, dividend is mere detail. When considered theinfluence of past dividends, the findings corroborate with the empirical evidence of Chawla& Srinivasan, 1987 in India; Khan & Khan, 2012 in Pakistan; and empirical evidence ofPradhan (2003) in Nepal.
The overall results imply that stock price in Nepal had no immediate positive response to thedividend payments during the study period and it was more prevalent in non-financial sectorenterprises as there was absence of influence of performance factors including dividends onstock price of this sector. The stock price rationality in financial sector as compared to non-financial sector is attributed to the regulation by Nepal Rastra Bank as a robust regulator.
Policy implicationsThe current year dividend and lagged dividend are the major determinants of stock price asrevealed in the paper. It is thus dividend policy is relevant and that corporate managers shoulddevote adequate time in designing and disseminating a dividend policy.
Stock pricing based on rumours in non-financial sector, and current year dividends affectingnegatively and delay in responding positively to the dividends by the stock price in overallsector as revealed in the paper is detrimental to the interest of current stockholders as wellas credibility of the capital market. Because of this, some concrete actions should be takenfor enhancing intensity to protect the investors, perfecting securities laws, improving supervision,and taking tougher enforcement action. Similarly, current and potential investors should beeducated on the fundamental performance factors of the enterprises, industry and economy.NEPSE and SEBON as a capital market operator and regulator respectively should beresponsible to address these issues.
As the paper addresses the gap in the extant literature, it extends new ways to study the stockmarket regarding the dividend policy, performance, and the valuation of stock thereby helpingto enhance the understanding and raise the level of pre-emerging capital market of Nepal.Hopefully, future researchers will add some value to this direction by increasing sample sizeand study period.

88 Nabaraj Adhikari
ReferencesAdhikari, N. (2014). Managers' views on dividend policy of Nepalese enterprises. NRB economic review,
26(1), 90-120.
Amidu, M. (2007). How does dividend policy affect performance of the firm on Ghana Stock Exchange,Investment management and financial innovations, 4(2), 104-112.
Alli, K. L., A. Qayyum K., & Gabriel G. R. (1993). Determinants of corporate dividend policy: a factorialanalysis. Financial review, 28, 523-547.
Ardestani, H. S., Siti Z. A. R., Rohaida B., & Mohammadghorban M. (2013). Dividend payout policy,investment opportunity set and corporate financing in the industrial products sector of Malaysia.Journal of applied finance and banking, 3(1), 123-136.
Baker, H. K., & Gary E. P. (2000). Determinants of corporate dividend policy. A survey of NYSE firms,Financial practice and education, 10(1), 29-40.
Banz, Rolf W. (1981). The relationship between return and market value of common stocks. Journalof financial economics, 9(1), 3-18.
Black, F., & Myron S. (1974). The effects of dividend yield and dividend policy on common stock pricesand returns. Journal of financial economics, 1, 1-20.
Bolster, Paul J., & Vahan J. (1991). Dividend policy and valuation effects of the tax reform Act of 1996.National tax journal, 44(4), Part 2, 511-518.
Brenann, M. J. (1970). Taxes, market valuation and corporate financial policy. National tax journal,23(4), 417-427.
Chawla, D., & G. S. (1987). Impact of dividend and retention on share price-An econometric study.Decision, 14(3), 137-140.
Clendenin, J. (Fall 1958). What do stockholders like? California management review, 1, 47-55.
Dhanani, A. (2005). Corporate dividend policy: The views of British financial managers. Journal ofbusiness finance & accounting, 37(7 & 8), 1625-1672.
Durand, D. (1959). The cost of capital and the theory of investment: Comment. American economicreview, 49, 639-654.
Fisher, G.R. (1961). Some factors influencing share prices. Economic journal, 71, 121-141.
Friend, I., & Marshall P. (1964). Dividends and stock prices. American economic review, 54(5), 656-682.
Gordon, M. J. (1963). Optimal investment and financing policy. Journal of finance, 18, 264-272.
______ , 1962.The savings investment and valuation of a corporation. Review of economics and statistics,40(44), 37-51.
______ , & Eli Shapiro (1956). Capital equipment analysis: The required rate of profit. Managementscience, 3, 102-110.
Graham, B. & David L. D. (1951). Security analysis: Principles and techniques (3rd ed.). McGraw-Hill Book Co, New York.

Dividend Policy, Performance, and the Stock Price in Nepal 89
Gujarati, Damodar N. & Dawn C. P. (2009). Basic econometrics (5th ed.). McGrew-Hill/Irwin, a businessunit of The McGraw-Hill Companies, Inc., 1221 Avenue of the Americas, New York, NY, 10020.
Gul, S., Muhammad S., Nasir R., Muhammad Farrukh I., & Muhammad B. K. (2012). The relationshipbetween dividend policy and shareholder's wealth. Economics and finance, 2 (2), 55-59.
Harkavy, O. (1953). The relation between retained earnings and common stock prices for large listedcorporations. Journal of finance, 8, 283-297.
Holder, E. M., Fredrick W. L., & J. Lawrence H. (1998). Dividend policy determinants: An investigationof the influences of stockholder theory. Financial management, 27(3), 73-82.
Hunt, W.& Donaldson (1971). Basic business finance: Text & Cases, Richard D. Irwin Inc.
Khan, A. A., & Iqbal, K. (2012). Dividend policy and stock prices, SAICON, Lahore: COMSATSInstitute of Information Technology.
Litzenberger, H. R., & Krishna R. (1979). The effect of personal taxes and dividends on capital assetprices: theory and empirical evidence. Journal of financial economics, 163-196.
Masum, A. A. (2014). Dividend policy and its impact on stock price-a study on commercial banks listedin Dhaka Stock Exchange. Global disclosure of economics and business, 3(1), 9-17.
Miller, M. H., & Franco M. (1961). Dividend policy, growth and the valuation of shares. Journal ofbusiness, 34(4), 411-433.
Miller, M. H. & Myron S. S. (1978). Dividends and taxes. Journal of financial economics, 6(4), 333-364.
Naranjo, A., M N., & Mike R. (1998). Stock returns, dividend yields, and taxes. Journal of finance,53(6), 2029-2057.
Pradhan, R. S. (2003). A survey of dividend policy and practices of Nepalese enterprises. Research inNepalese finance (1st ed.). Buddha Academic Publishers and Distributors Pvt. Ltd., Kathmandu.
Rafique, M. (2012). Factors affecting dividend payout: evidence from listed non-financial firms ofKarachi Stock Exchange. Business management dynamics, 1(11), 76-92.
Ranti, U. O. (2013). Determinants of dividend policy: a study of selected listed firms in Nigeria. Manager,change and leadership, 17, 107-119.
Rozeff, M. S. (Fall 1982). Growth, beta and agency costs as determinants of dividend payout ratios.Journal of financial research, 5(3), 249-259.
S.A., Adediran, & Alade S.O. (2013). Dividend policy and corporate performance in Nigeria. Americanjournal of social and management sciences, 4(2), 71-77.
Solomon, E. (1963). The theory of financial management, New York: Columbia University Press.
Walter, J. E. (1963). Dividend policy: Its influence on the enterprise. Journal of finance, 18, 280-291.
Yegon, C., Joseph C., & Jane S. (2014). Effects of dividend policy on firm's financial performance:Econometric analysis of listed manufacturing firms in Kenya. Research journal of finance andaccounting, 5(12), 136-144.

90 Nabaraj Adhikari
Appendix 1 : List of the selected listed enterprises for the paper including years ofdividend payments and number of observations
Note : S.N. indicates serial number for the enterprises selected.Source : Annual reports of the listed enterprises for the fiscal year mid-July 2008 to mid-
July 2013 and annual trading report of Nepal Stock Exchange Ltd.
S.N. Name of the enterprises Years Observations
1 Nabil Bank Limited (Nabil) 2009,10,11, 12, 13 5
2 Nepal Investment Bank Limited (NIBL) 2009,10,11,12,13 5
3 Standard Chartered Bank Nepal Limited (SCBNL) 2009,10,11,12, 13 5
4 Himalayan Bank Limited (HBL) 2009,10,11,12, 13 5
5 Nepal SBI Bank Limited (NSBL) 2009, 10,11,12,13 5
6 Bank of Kathmandu Limited (BKL) 2009,10,11,12,13 5
7 Everest Bank Limited (EBL) 2009,10,11,12, 13 5
8 Citizen Bank International Nepal Ltd.(CBINL) 2009, 10, 11, 12,13 5
9 Nirdhan Utthan Bank Ltd. (NUBL) 2009,10,11,12, 13 5
10 Swabalamwan Laghubitta Bikash Bank Ltd.(SLBBL) 2009,10,11,12,13 5
11 Chhimek Laghubitta Bikash Bank Ltd.(CLBBL) 2009,10,11, 12, 13 5
12 Mahalaxmi Finance Limited (MFL) 2009, 10,11,12,13 5
13 Pashchimanchal Finance Co. Limited (PFCL) 2009,10,11,12,13 5
14 Siddhartha Finance Limited (SFL) 2009,10,11,12,13 5
15 International Leasing and Finance Company Limited (ILFCL) 2009, 10,11, 12, 13 5
16 United Finance Company Limited (UFCL) 2009,10,11,12,13 5
17 Shree Investment Finance Company Limited (SIFCL) 2009, 10,11,12,13 5
18 Soaltee Hotel Limited (SHL) 2009, 10, 11, 12, 13 5
19 Bottlers Nepal Terai Limited (BNTL) 2009,10,11, 12, 13 5
20 Salt Trading Company Limited (STCL) 2009, 10,11, 12, 13 5
21 Butwal Power Company Ltd. (BPCL) 2009,10,11,12,13 5
22 Unilever Nepal Limited (UNL) 2009,10,11,12,13 5
Total observations 110

THE CROSS-SECTION OFEXPECTED STOCK RETURNSIN NEPAL Dr. Radhe S. Pradhan...?
AbstractThe CAPM asserts that market betas are sufficient to explain the cross section of expectedstock returns. However, beta showed either no relationship or a weak relationship with theexpected stock returns when other company specific variables affecting stock returns are used.This study aims at examining the ability of beta and other company specific factors such asfirm size, book to market ratio, sales to price ratio, dividend yield and earning price ratioto explain cross section of stock returns in Nepal. The study reveals that the beta has a veryweak relation with stock returns in Nepal. The coefficient of beta is not significant and hencethere is no evidence that beta explains variation of stock returns. The study showed that size,dividend yield, and book to market ratio has been found to be significant factors affectingstock returns in Nepal while beta, earning price ratio, and sales to price ratio do not explainthe variation in stock returns.
Key words: beta, book to market ratio, dividend yield, earning price, firm size, sales to priceratio, and stock returns.
IntroductionThe pricing implication of common stocks has drawn considerable attention since the publicationof seminal work of Markowitz (1952) - the mean-variance portfolio theory. Since then thereis an ongoing debate on whether the market risk factors explain better or there are some otheranomalies influencing common stock returns. Based on the mean-variance portfolio theory,Sharpe (1964), Linter (1965), and Black (1972) then proposed extensively argued asset pricingtheory- the capital asset pricing model (CAPM). The central prediction of the CAPM is thatthe rate of return associated with common stocks investment is determined by the extent towhich the common stock returns are correlated with market portfolio. CAPM asserts that themarket risk factors proxied by beta can capture significant variation in common stock returns.Asset pricing theories attempt to understand why some assets have higher returns than otherassets. In early stages of the corporate finance, investors and researchers began attributinghigher returns for higher risk. It is only with the development of the CAPM that economistwere able to quantify risk and the reward for bearing it. The CAPM asserts that expectedreturns of assets are a positive linear function of their market betas and market betas aresufficient to describe the cross section of expected returns.
However, empirical work on asset pricing has identified a number of variables that helpexplain cross sectional variation in stock returns in addition to the market risk variable.Notably, firm size (Banz, 1981; Keim, 1983), leverage (Bhandari,1988), P/E ratio (Basu,1983), ratio of cash flow to stock price (Rosenberg et al., 1985), book to market equity (Fama
The Cross-Section of Expected Stock Returns in Nepal 91
Prof. Pradhan is the Retired Professor of Finance from TU. He is also the Chairman of Professional EducatorsLimited, the owner company of Global College of Management.

92 Prof. Dr. Radhe S. Pradhan
and French, 1992), and past sales growth (Lakonishok et al., 1994) are among those that arefound to have significant explanatory power in asset pricing tests. In their seminal work,(Fama and French, 1992) found that book to market equity stands out as the most significantfactor in explaining cross section of returns. Market risk measured by beta, on the other hand,has no explanatory power. The challenge posed by the (Fama and French, 1992) findings totraditional structural models has created a significant hurdle to the understanding of morecomplex and dynamic properties of the cross section of stock return.
The study by (Chan et al., 1991) related the cross sectional differences in stock returns onJapanese stocks to the underlying behavior of four fundamentals variables: earnings yield,size, book to market ratio and cash flow yield. Of the four variables considered, book tomarket value ratio and cash flow yield have been found to be most significant variablesaffecting expected returns.
The empirical studies pointed out many inconsistencies in the CAPM that prescribes thatexpected stock return is directly related to systematic risk. The most noteworthy is the sizeeffect on expected stock return. The size, measured as the market value of equity (ME), hassignificant impact on the stock return, that is, smaller size of the firm, higher would be thereturns (Banz and Reinganum, 1981). In Malaysia, size variable alone explains about onethird of the expected stock returns (Pandey and Chee, 2001). The finding indicates thesignificance of B/M ratio disappears in multivariate regressions that also include E/P ratio.It is also indicated that market beta with or without other variables has a positive relation withstock return. The other significant variables include E/P ratio, dividend yield and leverage.The above shows that a number of studies have been conducted on the stock returns indeveloped and big capital markets but their relevance is yet to be seen in the context ofemerging capital markets. Information on stock returns in such emerging capital marketswould help development of realistic theoretical models and formulation of relevant hypothesesfor empirical testing in finance.
In Nepal, the listing of shares in stock exchange and their trading in the stock market is stillnot very popular. The Nepalese stock market is still characterized by a low trading volume,absence of professional brokers, early stage of growth, limited movement of share prices, andlimited information available to investors. Viewed in this way, this study devoted to stockreturns in Nepal carries a lot of significance. There is a need to arouse investors' interest instock markets leading to pursuit of higher returns. Little is known about the nature of stockreturns in Nepalese capital market.
A study on fundamentals of stock returns in Nepal revealed that dividend yield, capital gainyield and total yield are related to earnings yield, size book to market ratio and cash flowyield (Pradhan and Balampaki, 2006).
This study aims at examining the ability of beta and company specific factors like size, bookto market ratio, sales to price ratio, dividend yield and earning price ratio to explain stockreturns in context of Nepal.
The remainder of this paper is organized as follows. Section two describes the sample, data,and methodology. Section three presents the empirical results and the final section drawsconclusions and discusses the implications of the study findings.
Methodological aspectsThe study is based on the secondary data which were gathered for 23 banks in Nepal for theperiod 2006/07 to 2011/12, leading to the total of 138 observations. The secondary data have

The Cross-Section of Expected Stock Returns in Nepal 93
been obtained from data base maintained by office of the Security Board of Nepal (SEBON),NEPSE and other concerned banks.
The pooled cross-sectional data analysis has been undertaken in the study. The research designadopted in this study is causal comparative type as it deals with relationship of beta, size,book to market ratio, sales to price ratio, dividend yield, and earnings price ratio with stockreturns. More specifically, the study examines the effect of beta, size, book to market ratio,sales to price ratio, dividend yield, and earnings price ratio on stock returns. These data werecollected for the period 2006/07 to 2011/12. Table 1 shows the number of commercial banksselected for the study along with the study period and number of observations.
Table 1: Number of commercial banks selected for the study
S.No. Name of the commercial banks Study period Observations
1 Ratriya Banijya Bank Limited 2006/07-2011/12 62 Nepal SBI Bank Limited 2006/07-2011/12 63 Bank of Kathmandu Limited 2006/07-2011/12 64 Citizens' Bank International Limited 2006/07-2011/12 65 Laxmi Bank Limited 2006/07-2011/12 66 DCBL 2006/07-2011/12 67 Agricultural Development Bank Limited 2006/07-2011/12 68 Bank of Asia Limited 2006/07-2011/12 69 Nepal Investment Bank Limited 2006/07-2011/12 610 Nepal Standard and Chartered Bank Limited 2006/07-2011/12 611 Himalayan Bank Limited 2006/07-2011/12 612 NMB Bank Limited 2006/07-2011/12 613 Lumbini Bank Limited 2006/07-2011/12 614 NABIL Bank Limited 2006/07-2011/12 615 NIC Bank Limited 2006/07-2011/12 616 Global Bank Limited 2006/07-2011/12 617 Kumari Bank Limited 2006/07-2011/12 618 Everest Bank Limited 2006/07-2011/12 619 Machhapuchhre Bank 2006/07-2011/12 620 Prime Bank Limited 2006/07-2011/12 621 Sidhartha Bank Limited 2006/07-2011/12 622 Sunrise Bank Limited 2006/07-2011/12 623 Nepal Bangladesh Bank Limited 2006/07-2011/12 6
Total number of observations 138
The cross sectional pooled data analysis has been undertaken for the purpose of the study.The theoretical statement of the models is that the stock return (R) may be regarded as subjectto the constraints of beta, size, book to market ratio (BM), sales to price ratio (SP), dividendyield (DY) and earnings price ratio (E/Y). The theoretical statement may be framed as under:
R = f (Beta, Size, BM, SP, DY, E/P) ……...…… (i)

94 Prof. Dr. Radhe S. Pradhan
The descriptive statistics also shows that the banks differ greatly in terms of their earningsyield and dividend yield. Earnings yield has an average value of 32.12 with a minimum tomaximum value ranging from 20.34 to 52.17 respectively, dividend yield has a minimumvalue of 0.71 and maximum value of 5.13 leading the average of 3.15. Similarly, sales to priceratio has an average value of 2.12 and standard deviation of 0.43. The book to market valueof equity ratio of the banks varies significantly. It ranges from minimum of 0.45 times tomaximum of 2.02 times with a mean value and standard deviation of 1.05 and 0.32 timesrespectively.
Variables N Minimum Maximum Mean Std. Deviation
Return 138 19.15 56.59 51.65 9.45
Beta 138 0.45 0.95 0.73 0.34
Size 138 1829.32 20114.95 8152.23 7123.12
E/P 138 20.34 52.17 32.12 9.21
DY 138 0.71 5.13 3.15 2.11
SP 138 0.85 2.89 2.12 0.43
BM 138 0.45 2.02 1.05 0.32

The Cross-Section of Expected Stock Returns in Nepal 95
Regressions ResultsIn order to analyze the effect of beta, size, E/P, DY, SP and BM on stock returns, the regressionequations specified earlier are estimated and the results are presented in Table 4. The regressioncoefficients for beta are positive in all the regression equations indicating that higher the beta,higher would be the stock returns though the results are not significant at 5 percent level ofsignificance. Stock returns are better explained by size as beta coefficients are all positive andsignificant at 5 percent level of significance. It indicates that larger the size of the firm, higherwould be the stock returns. Among others, this finding supports the findings of Banz (1981),Reinganum (1981), Keim (1983) and Fama and French (1992).
Notes:1. Figures in parentheses are t-values.2. The sign * denotes that the results are significant at 5 percent level of significance.
lnReturn lnBeta lnSize lnE/P lnDY lnSP ln BM
lnReturn 1
lnBeta .295 1(.192)
lnSize .253 .521* 1(.162) (.012)
lnE/P .231 .326 .455 1(.289) (.115) (.112)
lnDY -.132 -.453* -.552 -.732 1(.389) (.069) (.023) (.012)
lnSP .267 .452* .567* .211* -.512* 1(.189) (.092) (.028) (.298) (.039)
lnBM -.457* -.221 -.239 -.235 .236 -.283 1(.102) (0.235) (.198) (.178) (.178) (.281)
Table 3: Computation of correlation coefficients for the selected commercial banks of Nepal
Correlation AnalysisHaving indicated the descriptive statisitics, the Pearson Correlation Coefficients have beencomputed and the results are presented in Table 3. All the correlations can be considered aslow since the highest correlation has been observed to be 0.567 between ln Size and ln SP.The lowest correlation of -0.132 has been observed between stock return and DY. The stock return is negatively related to DY and BM and positively related to beta, size, E/P and SP.Beta has a positive correlation with Size, E/P, and SP.

96 Prof. Dr. Radhe S. Pradhan
Adj.R- F DW
bar2
(1) 2.11 0.41 0.34 20.75 1.34(8.21) (0.92)
(2) 9.12 1.32 0.43 19.84 1.57(4.23) (2.32)*
(3) 7.21 -0.65 0.31 17.45 1.87(2.23) (1.32)
(4) 4.78 1.98 0.45 30.65 1.35(2.38) (2.87)*
(5) 10.32 -0.92 0.31 32.72 1.74(2.87) (0.78)
(6) -0.92 0.48 29.21 1.60(2.82)*
(7) 2.36 0.28 1.42 -1.85 0.78 35.67 2.09(2.23) (1.43) (2.91)* (1.13)
(8) 3.21 0.33 0.28 -1.73 0.82 39.28 1.94(3.23) (0.62) (2.84)* (3.27)*
(9) 6.21 0.46 0.86 0.54 -0.45 0.75 43.31 1.96(2.73) (0.83) (2.66)* (2.87)* (-3.24)*
(10) 3.59 0.392 1.43 0.45 2.21 -0.16 -0.67 0.82 47.95 2.04(3.86) (1.34) (3.13)* (1.45) (4.14)* (-.63) (-4.65)*
Regression Coefficients of
lnBeta lnSize lnE/P lnDY lnSP lnBMModels Intercept
However, the earnings yield (E/P) could explain the variation on stock returns as betacoefficients for this variable are sometimes positive and sometimes negative and the resultsare also not significant at 5 percent level of significance. But the dividend yield (DY) hasbeen found to be an important factor affecting stock returns as not only beta coefficients arepositive but they are also significant at 5 percent level of significance. It indicates that higherdividend yield leads to higher stock returns. This finding on dividend yield, among others,support the findings of Lamont (1980) and Boudoukh et al. (2007). Like earnings yield, salesto price ratio could not explain the variation in stock returns as the signs of beta coefficientare not consistent and the results are also not significant at 5 percent level of significance.However, book to market (BM) has been found to be an important factor affecting stockreturns as beta coefficients are consistently negative and significant at 5 percent level of
The Cross-Section of Expected Stock Returns in Nepal 97
significance in all the equations. It indicates that higher the book to market, lower would bethe stock returns. Among others, this finding is in consistency with the findings of Stattman(1980) and Chan et al. (1991).
Summary and conclusionAttempts were made by asset pricing theories to understand why some assets have higherreturns than other assets. According to CAPM, the expected stock returns are a positive linearfunction of their market betas. The model asserts that market betas are sufficient to explainthe cross section of expected stock returns. As a result, the CAPM has been widely used byportfolio mangers, institutional investors, financial mangers and individual investors to predictasset returns. Beta is a measure of systematic risk in CAPM and is assumed to be positivelyrelated to stock returns. However, several studies revealed that other variables could significantlyexplain the variation in stock returns and the beta showed either no relationship or a weakrelationship with the expected stock returns.
The studies on cross-sectional variation in common stock returns provide an important insightinto the understanding of pricing implication of common stock. This study aims at examiningthe ability of beta and company specific factors such as firm size, book to market ratio, salesto price ratio, dividend yield and earning price ratio to explain cross section of stock returnsof Nepalese stock market.
This study reveals that the beta has a very weak relation with stock returns. The result ofregressions show that the coefficient of beta is insignificant and it does not explain variationof stock returns. Firm size displays a positive and statistically significant coefficient inexplaining stock returns. The study, therefore, reveals that size has a significant impact onstock returns and suggests larger stocks have higher returns. The relationship of E/P withstock return is uncertain and hence does not explain the variation in stock returns. Thecoefficients for sales to price ratio (SP) are negative in all the equations but they are notsignificant. The dividend yield (DY) coefficient is positive and significant indicating thathigher dividend yield leads to higher stock returns. The book to market (BM) coefficients areall negative and significant also indicating that higher book to market leads to lower stockreturns or vice versa.
To conclude, size, dividend yield, and book to market ratio has been found to be significantfactors affecting stock returns in Nepal. Overall, beta, earning price ratio, and salesto price ratio have been observed to be poor predictors of stock returns.
References
Banz, R. W. (1981). The relationship between return and market value. Journal of financial economics,3-18.
Banz, R. W., & D. Reinganum, (1981). Size related anomalies and stock return seasonality. The journalof financial economics, 41(5), 54-67.
Barbee, W. C., S. Mukherji, & S., & G. A. Raines (1996). Do sales price and debt equity explain stockreturns better than book market and firm size. Financial analyst journal, 23(1), 56-60.

98 Prof. Dr. Radhe S. Pradhan
Barry, P., M. Blume, & K. Henry (2002). B/M and average stock returns. The journal of finance, 21(3),201-233.
Basu, S. (1983). The relationship between earnings yield, market value and return for NYSE commonstocks: Further evidence. Journal of financial economics, 41(12), 129-156.
Bhandari, L. C. (1988). Debt/equity ratio and expected common stock returns: Empirical evidence. Thejournal of finance, 43(2), 507-528.
Bhatta, G. (2010). Does Nepalese stock market follow random walk? SEBON Journal, 5, 18-58.
Black, F. (1972, June). Capital market equilibrium with restricted borrowing. The journal of business,45(3), 444-455.
Boudoukh, J., R. Michaely, M. Richardson, & M. R. Roberts (2007). On the importance of measuringpayout yield: Implications for emprical asset pricing. The journal of finance, 62(2), 21-45.
Chan, L. K., Y. Hamao, Y., & J. Lakonishok, (1991). Fundamentals and stock returns in Japan. Thejournal of finance, 46(5), 1739-1764.
Chan, Y. (1991). The cross sectional relationship between stock returns and domestic and global factorsin the Tokyo Stock Exchange. School of economics and finance, 51(5), 234-241.
Fama, E. F. (1990). Stock returns, expected returns, and real activity. The journal of finance, 45(4), 121-137.
Fama, E. F., & K. R. French, (1992, June). The cross-section of expected stock returns. The journal offinance, 47(2), 427-465.
Fama, E. F., & K. R. French, (1993). Common risk factors in the returns on stocks and bonds. Journalof financial economics, 33(4), 3-56.
Fama, E. F., & K. R. French (1995). Size and book to market factors in earnings and returns. The journalof finance, 50(1), 213-245.
Fama, E. F., & K. R. French (1996). Multifactor explanation of asset pricing anomalies. Journal offinance, 51(1), 55-84.
Fama, E. F., & K. R. Kenneth (2008). Dissecting anomalies. The Journal of Finance, 53(4), 1653-1675.
Fama, E. F., & J. D. MacBeth (1973). Risk, return, and equilibrium: Empirical tests. The journal ofpolitical economy, 81(3), 607-636.
Fama, E. F., & W. Schwert (1977). Asset returns and inflation. The journal of financial economics, 4(1),115-146.
Keim, D. B. (1983, June). Size related anomalies and stock return seasonality. Journal of financialeconomics, 13-32.
Keim, D. B. (1990). A new look at the effect of firm size and E/P ratio on stock return. The journal offinancial analysts, 46(2), 56-68.
Lakonishok, J., A. Schleifer, & R. W. Vishny (1994). Contrarian investment, extrapolation and risk. Thejournal of finance, 49(5), 1541-1578.

The Cross-Section of Expected Stock Returns in Nepal 99
Lamont, O. (1998, October). Earnings and expected returns. The journal of finance, 53(5), 1563-1587.
Lamont, O. A. (1980). Investment plans and stock returns. The journal of finance, 55(3), 213-246.
Lintner, J. (1965). The valuation of risk assets and the selection of risky investments in stock portfoliosand capital budgets. The review of economics and statistics, 471(1), 13-37.
Markowitz, H. (1952). Portfolio selection. The journal of finance, 7(1), 77-91.
Merton, R. C. (1973). An intertemporal capital asset pricing model. Econometrica, 41(5), 867-887.
Pandey, I., & Chee, H. K. (2001). The expected stock returns of Malaysian firms: A panel data analysis.The journal of financial review, 51(2), 121-143.
Porta, R. L. (1996, December). Expectations and the cross-section of stock returns. The journal offinance, 51(5), 1715-1742.
Pradhan, R. S. (1993). Stock market behavior in a small capital market:A case of Nepal. The Nepalesemanagement review, 9(1), 23-49.
Pradhan, R. S., & S. B. Balampaki (2006). Fundamentals of stock returns in Nepal. Research in Nepalesefinance, 9(1).
Reinganum, M. R. (1981). Misspecification of capital asset pricing empirical anomalies based on earningsyields and market values. The journal of financial economics, 9(1), 19-46.
Reinganum, M. R. (1990). Empirical tests of multi-factor pricing model. The journal of finance, 36(3),313-321.
Roll, R., & S. A. Ross (1994). On the cross-sectional relation between expected return and betas. Thejournal of finance, 49(1), 101-121.
Rosenberg, B., K. Reid, & R. Lanstein (1985). Persuasive evidence of market inefficiency. The journalof portfolio management, 11(3), 9-16.
Ross, S. A. (1976). The arbitrage theory of capital asset pricing. The journal of economic theory, 13(1),341-360.
Sharpe, W. F. (1964). Capital asset prices:A theory of market equilibrium under conditions of risk. Thejournal of finance, 19(3), 425-442.
Sharpe, W. F. (1991). Capital asset pricing with and without negative holdings. The journal of finance,42(2), 489-509.
Stattman, D. (1980). Book value and stock returns. The journal of finance, 32(1), 215-230.
Wang, D., & D. Xu (2004). What determines Chinese stock returns? Journal of financial analysts, 34(2),221-235.
Wong, K. A., R. K. Tan, & W. Liu (2006). The cross-section of stock returns on the Shanghai StockExchange. Quantitative finance and accounting, 26(1), 23-39.

100 Mr. Santosh Poudel
AbstractMany researchers have addressed that financial market also determines the sustainable growthof the economy. This study tries to find the relation between economic growth with financialgrowth. Financial growth indicators are stock market capitalization and liquidity. Bankinggrowth indicators are private credit by commercial banks. These indicators help in GDPgrowth through capital formation in the economy which is hereby termed as channels forgrowth. OLS regression model suggests that stock market and banking growth is positivelylinked with growth in GDP and capital formation. Test of significance suggests that onlybanking growth helps in economic growth. Test of autocorrelation, heterescedasticity andmulti-collinearity suggests the robustness of the study.
Key words: GDP, Capital Formation, Stock Market Capitalization, Liquidity, Bank Creditsetc.
IntroductionOver the years, there has been a long discussion on what factors and forces cause economicgrowth. Different pillars of economy are key factors for health of an economy. Many researchershave addressed that financial market also determines the sustainable growth of the economy.Financial market, more specifically stock market, is a market where securities of differentfirms are traded. Savings are converted into investment through the security market as investorslike to buy security market instruments like shares, bonds, futures and options for liquidity,income and tax aversion. We can sense the contribution of security market in the economicgrowth, capital formation and productivity improvements (King and Levine, 1993a).Stock Markets are basically similar to other kinds of market. People buy and sell, win andlose in this market. In stock market people buy and sell securities, stocks and bonds whichare less tangible than gold but not less valuable (Ritter and Silber (2008)). To establish hugeinfrastructures and industries require long run commitment of capital and these projects arenecessary for the economic development of nation. But investors are reluctant to give up oftheir savings to long-run. A cautious investor is always concerned with return and risk. In arisky market like in Nepal risk is a major factor in investment decision. This would requirecreating conducive investment atmosphere and developing efficient stock market, which helpto the investors to sell their share to other investors easily. As a result the capital is notprematurely removed (Levine and Zerovs (1996)).
AN EMPIRICAL STUDY ONSTOCK MARKET, BANK ANDECONOMIC GROWTH
Mr. Santosh Poudel...?
Mr. Poudel is the Program Coordinator at Global College of Management. He is the MPhil Scholar atKathmandu University School of Management (KUSOM).
An Empirical Study on Stock Market, Bank and Economic Growth 101
Stock market liquidity, the ability to trade equity easily, is crucial for economic growth.Without a liquid stock market, many profitable long-term investments, which require a long-run commitment of capital, would not be undertaken because savers would be unwilling torenounce control of their savings for long periods. A liquid equity market allows savers tosell their shares easily, quickly and inexpensively, thereby permitting firms to have permanentaccess to capital on favorable terms. By facilitating longer-term and more profitable investments,a liquid market improves the allocation of capital and enhances prospects for long-termeconomic growth. Liquidity lowers the cost of the foreign capital essential for development,increases investor incentive to acquire information on firms and improve corporate governance,thereby facilitating growth (Kyle, 1984; Holmstrom and Tirole, 1993; Neusser and Kugler,1998; Bencivenga et. al., 1996;).A third link between of stock market development on theeconomy is that the presence of stock markets would mitigate the principal agent problem,thus promoting efficient resource allocation and growth (Adjasi and Biekpe,2006). As thestock price is the mirror of a firm's performance, weakening corporate governance would bereflected as a fall in share price. In such a situation, management would have a disincentiveto work in their personal interests if their compensation is tied to stock performance (Jensenand Murphy, 1990). By exerting a continuous and strict control over the management of firms,stock markets provide proper incentives for managers to make investment decisions andpositively affect the average return on investments (Diamond and Verrecchia, 1982; Laffontand Tirole, 1988; Scharfstein, 1988). A strong stock market can generate, promote and acquiremore information about firms, the innovative activity of entrepreneurs, the aggregate stateof technology or their consequences also plays important role in the investment decisions,thereby promoting efficient resource allocation, improving the productivity of capital andachieving better growth (Caporale et al, 2004; Atje and Jovanovic, 1993; Grossman andStiglitz, 1980; Allen, 1993:81-108). A new stock exchange can increase economic growth byaggregating information about firms' prospects, thereby directing capital to investment withreturns (Greenwood and Jovanovic, 1990; King and Levine, 1993). Based on such accurateand improved information, the organization makes investment decisions through intelligentprofit projections which improve resource allocation and promote economic growth. Moreover,stock markets play a key role in allocating capital to the corporate sector, which will have areal effect on the economy on aggregate. A well-functioning financial sector channels limitedresources from surplus units to deficit units and in so doing providing an efficient allocationof resources, thereby resulting in economic growth (Majid, 2007:140-141). Another channelthrough which stock markets may positively affect capital accumulation and economic growthis the improvement of risk diversification through international financially integrated markets.The role of equity markets in providing portfolio diversification, enabling individual firmsto engage in specialized production is bound to result in efficiency gains (Acemoglu andZilibotti, 1997; Capasso, 2006). An increase in the degree of international integration of stockmarkets reduces the level of average investment risk through diversification and leads to ashift in the global portfolio from safe low-yield projects to riskier high-yields projects. Byfacilitating risk diversification through internationally integrated stock markets and increasingthe array of possible investments, stock markets can augment the rate of investment indiversified portfolios (Saint-Paul, 1992; Obstfeld, 1994). This shift boosts economic growthby inducing capital mobility, productivity and saving rates.
Nepal is encircled by and confronting with the problems of state of underdevelopment,turbulent socio-political situation preventing economic growth, and economic policy ofglobalization and liberalization, demanding global standards of economic behavior. Inadequate

102 Santosh Poudel
capital availability and its ineffective use is the crux of the problems of economic development.Stock market plays important role both by making provision of capital and encouraging itseffective use for economic growth.
Historically, the development of capital market dates back to 1936 with the flotation of shareby Biratnager Jute Mills Ltd (NEPSE (2002)). The then government of Nepal announcedindustrial policy in 1974 and under this policy an institution named Securities MarketingCentre (SMC) was established to deal in government securities- development bond, nationalsaving bonds and corporate securities of few companies. In 1976 the Securities MarketingCentre (SMC) was renamed by Securities Exchange Centre (SEC). At that time SEC itselfwas under taking job of brokering, underwriting, and managing public issue as only capitalmarket institution in Nepal. Under the financial sector liberalization policy, Government ofNepal converted SEC into Nepal Stock Exchange Ltd. (NEPSE) in 1993 and assigned theresponsibility of secondary market operation. And Government of Nepal established SecuritiesBoard of Nepal (SEBON) in 1993 as securities market regulatory authority. At the abovebackdrop, this paper aims to examine the relationship between stock market development andeconomic growth in Nepal.
Banking activities is also a key variable for economic growth as they help to channelize fundsof savings into investment. It is associated with creating a sound financial system with stockmarket to boost economic development. Mostly it helps to promote different sectors ofeconomy by lending loans. Historically many researches have indicated that bank's contributionin the economic growth is vital (Schumpter 1912) as it spurs funds into innovative andproductive activities. Almost one hundred years ago, Schumpeter (1912) already addressedthe relation between financial development and economic growth. He asserted that a well-functioning financial system should promote economic growth through the selection of theproductive investments which are the most likely to be successful and the efficient allocationof resources (via bank credits) to these innovative technologies. Since then, the financialsystem has significantly evolved. Access of private companies to funding through financialmarkets has been improved and stock markets have been established in almost any part ofthe world. New financial products have also been created which allow better risk diversificationand allocation. Although all these improvements may have had a positive impact on economicdevelopment in many countries through better resource allocation and risk diversification,recent events have also shown that misused financial innovations can have adverse effectson short run economic stability. Moreover, measures taken to reestablish systemic stabilityin the wake of the recent subprime crisis have important implications for economic developmentpolicies. If financial development facilitates long run economic development, expanding thebanking system and stock markets in developing countries might help promote their long runeconomic growth (Laurent, et. al 2011). One central question is then to investigate whetherfinancial development has had a positive impact on economic growth in the long run.
In addition, it is also of prime importance to determine whether the structure of the financialsystem is relevant. In other words, we want to know whether banks and stock markets canboth promote long run economic development.
This paper consists of three sections containing literature review in the first section, data andmodeling in second section followed by data analysis and finally third section concludes thepaper.

Literature ReviewFrom Schumpter in 1912 till today's research has concluded many things on multi-fieldperspective on relationship between financial system and economic growth with many models.Work of Levine and King in 1993 is a remarkable work in identifying relationship of bankand stock market with economic growth. Though Schumpter's work was a path-breaking formany studies in 1980s and Levine and King (1993) article on Stock market and Bank wascriticized for lack of economic modeling, many researches have taken their footsteps in theirstudies. Here we present some of the prominent literature on the work of bank, stock marketand economic growth.
Before presenting the evidence on the bank, stock market and economic growth relationship,we need to briefly describe the theory dedicated to this particular aspect of the literature. Inthis regard, theory provides conflicting predictions about whether banks and stock marketsare substitutes, complements, or whether one is more conducive to growth than the other.Boyd and Prescott (1986) stress the fundamental role of banks in producing information andreducing misallocation of resources while Stiglitz (1985) and Bhide (1993) show that stockmarkets will not enhance resource allocations and corporate government as banks. Somemodels stress that stock markets reduce the inefficiencies monopoly power of banks andtherefore encourage growth-enhancing activities (Allen and Gale (2000)). Finally, some modelsemphasize that it is bank and markets altogether that reduce information asymmetries andtransaction costs.
Levine and Zervos (1998) have focused on the relationship between economic growth andfinancial development using both bank and stock market indicators. They tested this relationshipfor a sample of 42 countries over the period [1976-1993]. They used banking development,GDP, market size capitalization as proxy, productivity growth and capital accumulation asvariables for study. They found that the initial level of stock market development liquidityand the initial level of banking development are positively and significantly associated withlong term economic growth, productivity growth and capital accumulation. They also findthat stock market size, as measured by market capitalization divided by GDP, is not correlatedwith growth indicators. The variables used are similar to King and Levine (1993a) and statisticalmethod to test the relation is also same. However, many critics commented on limited statisticaltesting and robustness testing on those results. So, this study uses OLS modeling to identifythe regression relationship between variables and dependent variable economic growth. Butfew variables will be omitted in this article as data about is unavailable in Nepal.Rousseau and Wachtel (2000), and Beck and Levine (2003) extend the Levine and Zervosapproach of stock markets, banks and growth by using panel techniques (GMM estimator).Rousseau and Wachtel (2000) use annual data and the difference estimator. Beck and Levine(2003) use data averaged over five-year periods, use the system estimator to reduce potentialbiases related to the difference estimator, and extend the sample through 1998. This study isbasically based panel data published by central bank and central bureau of statistics. Bothstudies used econometric modeling to show that banking and stock market developmentexplain altogether subsequent growth. These studies stressed the benefits of panel datatechniques.
An Empirical Study on Stock Market, Bank and Economic Growth 103

Data and variable definition:To see the relationship between economic growth and both stock market and bankingdevelopment we need empirical indicators of stock market liquidity, size given by capitalizationof market and a measure of banking development. This article also sees the measures growthof economic growth through growth in gross domestic product and capital formation by thestock market and other financial activities. This section defines the stock market indicators,banking development indicator and economic growth indicators. Information related to thestock market development has collected from annual report published by Nepal Stock Exchangefrom 1993-2014. Banking development indicators were collected from the annual report ofNepal Rastra Bank of the same time period.
Stock Market Development Indicators:Size: Capitalization measures the size of the stock market and equals the value of listeddomestic shares on domestic exchange divided by GDP. The size variable definition is similarto Levine and Zervos (1998). Higher the value of capitalization higher will be contributionto the economy as it shows growth in value of stock market.Liquidity: Liquidity market is a key variable in explaining the trend in transaction cost ashigh liquidity reflects the low transaction costs for the investors (Levine 1998). It is the valueof the trades of domestic shares on exchange market divided by the value of listed shares.
Banking Development Indicators:Banking sector helps economy by channelizing the deposits into profitable investments. Banksand financial institutions are major source of funding different private and public projects.So to see their contribution to the economy we must see credits given by the banking sectorto the private sector. Thus value of loans made by commercial banks and other deposit takingbanks to the private sector divided by GDP will be the indicator of banking development. Theratio is here referred as Banking Credit. Credit improves upon traditional financial depth,measures of banking development by isolating credit issued by banks, as opposed to creditissued by the central bank or other intermediaries, and by identifying credit to the privatesector, as opposed to credit issued to governments (Levine et al 1991).
Model:This study stands on two grounds of testing the relationship of stock market and bankingactivities. First it examines the relationship between these financial development indicatorsand per capital GDP growth and also studies two channels through which banks and stockmarkets may be linked to the growth of the economy. It sees how indicator of banks and stockmarket contributes in GDP growth and assesses how it affects capital formation. Two regressionmodels are used in the study to test the relationship with GDP growth and capital formation.
Model 1:
Where, Y1 refers to the growth in real per capital GDP growth used as dependent variable.X1 refers to the Market Capitalization of Nepal Stock Exchange (NEPSE) X2 refers to the
104 Santosh Poudel

Market Liquidity of NEPSE and X3 refers to private credits issued by the banks in Nepal usedas independent variable. Natural log of these variables has been used to regress the OLSregression relation.
Model 2:
Where, Y2 refers to Capital Formation in the economy used as dependent variable. X4 refersto the Market Capitalization of Nepal Stock Exchange (NEPSE) X5 refers to the MarketLiquidity of NEPSE and X6 refers to private credits issued by the banks in Nepal used asindependent variable. Natural log of these variables has been used to regress the OLS regressionrelation.
Summary Statistics and CorrelationsTable 1 presents summary statistics on the economic growth indicators using GDP and stockmarket growth indicators with banking development indicators whereas table 2 presentsstatistics using capital formation as growth indicators of economy. Total 21 yearly data relatedto the indicators during 1993-2013 has been included in the study. Table 3 presents thecorrelations among the study variables.
Table 1: Summary Statistics of Annual Averages during 1993-2013
Notes: GDP is the growth in the real per capital GDP in the economy; Capitalization is thestock market overall capitalization of NEPSE; Liquidity refers to value of shares traded inNEPSE ; Credit refers to the private sector lending by the banks. All the variables are thenatural log of actual values.
Table 2: Summary Statistics of Annual Averages during 1993-2013
Variable Obs Mean Std. Dev. Min Max
GDP 21 3.659249 .1462643 3.353381 3.865826Capitaliza~n 21 4.269085 .4335327 3.547041 5.087409
Liquidity 21 2.45167 .4407008 1.343409 3.176085Credit 21 4.35953 .5676206 3.227828 5.286007
Variable Obs Mean Std. Dev. Min Max
Cap_form 21 3.046254 .235471 2.636338 3.423388Capitaliza~n 21 4.269085 .4335327 3.547041 5.087409
Liquidity 21 2.45167 .4407008 1.343409 3.176085Credit 21 4.35953 .5676206 3.227828 5.286007
Notes: Cap_form is the Capital Formation in the economy; Capitalization is the stock marketoverall capitalization of NEPSE; Liquidity refers to value of shares traded in NEPSE; Creditrefers to the private sector lending by the banks. All the variables are the natural log of actualvalues.
An Empirical Study on Stock Market, Bank and Economic Growth 105

GDP Capital Formation Capitalization Liquidity Credit
GDP 1.00Capital 0.6596* 1.00Formation (0.0011)
Capitalization 0.6154* 0.2913 1.00(0.0030) (0.2002)
Liquidity -0.2282 -0.3836 0.0229 1.00(0.3199) (0.0860) (0.9215)
Credit 0.6347* 0.9545* 0.2479 -0.5040* 1.00(0.0020) (0.000) (0.2787) (0.0198)
Note: The figures represent the correlation coefficients among the variables of the study. Thevalue in the parentheses refers to the p-value testing the significance level of 95%. The sign* shows the significance.
As expected GDP growth has positive relationship with capitalization of stock market andcredit lent by the private banks in Nepal. However opposite of expectation, liquidity hasnegative relation with GDP growth. The relationship between GDP growth and marketcapitalization is positive significant and it is same with credit. Though relation of GDP growthis negative its coefficient is insignificant. We can conclude there is positive and significantrelationship of capitalization and credit with GDP growth. These findings are similar toBencivenga (1995) who found significant relation between stock market capitalization andGDP growth but contradict with Baro (1995). These findings about market liquidity andopposite the findings of Shliefer and Vishny (1986) who found positive implications stockmarket liquidity. Though relation of capitalization with capital formation is positive in absenceof significance we cannot say that boom in market capitalization supports capital formation.Private lending by banks is positively and significantly related with capital formation suggestingbanks are contributing in forming capital in the economy.
Regression AnalysisGDP growth and stock market indicators with bank development indicator:Linear regression analysis using capitalization, liquidity and bank credit as independentvariables and growth in GDP as dependent variable has been done. Following table suggestspositive relation dependent variable and independent variable. With high percentage of valueof R2 we can say that GDP is affected positively by the capitalization in stock market, liquidityin stock market and bank credit. However P-value suggests only bank credit is significant inaffecting the growth in GDP.
106 Santosh Poudel
Source SS df MS
Model .395856236 3 .131952079Residual .0320085 17 .001882853
Total .427864736 20 .021393237
Number of obs = 21F(3, 17) = 70.08Prob > F = 0.0000R-squared = 0.39252Adj R-squared = 0.9120Root MSE = .04339

An Empirical Study on Stock Market, Bank and Economic Growth 107
GDP Coef. Std. Err. t p> |t| [95% Conf. Interval]
Capitalization .0131174 .0234707 0.56 0.584 -.0364017 .0626363Liquidity .0408175 .0258986 1.58 0.133 -.0138239 .0954588
Credit .2594453 .02075 12.50 0.000 .2156667 .3032239_cons 2.372119 .1438584 16.49 0.000 2.068604 2.675633
Notes: GDP is the growth in the real per capita GDP in the economy; Capitalization is thestock market overall capitalization of NEPSE; Liquidity refers to value of shares traded inNEPSE; Credit refers to the private sector lending by the banks. Coef refers to the regressioncoefficients for the model prescribed in Model 1.
To see impact of various variables on dependent variable multiple regression models usingdifferent combination of independent variables has been used. Altogether six models has beencreated and their respective regression coefficient with test for goodness-of-fit has beenpresented in Table 4.
The results are similar with the multiple variable regression model stated in above summary.In each model bank credit has been positive and significant. We can easily conclude thatbanking activities are deterministic in deciding growth of GDP in Nepal.
Table 3: Regression Coefficients and Different Models
Model Capitalization Liquidity Credit R2
1 0.098 0.085 (0.2)
2 -0.127 0.15 (0.086)
3 0.245* 0.91 (0.000)
4 0.1 -0.13 0.24 (0.162) (0.074)
5 0.043 0.263* 0.92 (0.100) (0.000)
6 0.13 0.041 0.26* 0.91 (0.58) (0.133) (0.000)
Notes: Above values are the coefficients of OLS regression of different models keeping GDPgrowth as dependent variable and other variables as independent variables in 6 differentmodels. Values in parentheses refer to their respective p-value to test the significance. GDPis the growth in the real per capita GDP in the economy; Capitalization refers to the stockmarket overall capitalization of NEPSE; Liquidity refers to value of shares traded in NEPSEand Credit refers to the private sector lending by the banks. The sign * shows significantrelation at 95% level of significance. R2 is the test of goodness-of-fit.
Capital Formation growth and stock market indicators with bank development indicator:Now, to see the channel for growth in GDP relation of capital formation with stock marketindicators and bank development indicator has been used. If banks are helping to grow the

108 Santosh Poudel
Source SS df MS
Model .695233396 3 .231744465Residual .413698692 17 .024335217
Total 1.10893209 20 .055446604
Number of obs = 21F(3, 17) = 9.52Prob > F = 0.0006R-squared = 0.6269Adj R-squared = 0.5611Root MSE = .156
Capital_Form!n Coef. Std. Err. t p> |t| [95% Conf. Interval]
Capitalization .262796 .0843792 3.11 0.006 .0847715 .4408206Liquidity .0144728 .091078 0.16 0.878 -.1819676 .2109131
Credit .2191951 .074598 2.94 0.009 .0618071 .376583_cons .9332854 .5171835 1.80 0.089 -.1578763 2.024447
Notes: Capital Formation is value of capital created in the economy; Capitalization is thestock market overall capitalization of NEPSE; Liquidity refers to value of shares traded inNEPSE; Credit refers to the private sector lending by the banks. Coef. refers to the regressioncoefficients for the model prescribed in Model 2.
Summary suggests the independent variables have positive relation with dependent variable.We can see that capitalization, liquidity and bank credit is helping to form capital in theeconomy but only stock market capitalization and bank credit is having significant relationwith the capital formation.
Multiple models for different set of control variables also suggest similar result. In each casecapitalization and bank credit is showing positive and significant relation with capital formation.It concludes that value of stock trades and bank credit to private sector is serving significantlyto form capital in the economy.
Model Capitalization Liquidity Credit R2
1 0.33* 0.38(0.03)
2 -0.122 0.053(0.32)
3 0.26* 0.4(0.020)
4 0.34* -0.13 0.44(0.02) (0.187)
5 0.065 0.29* 0.41(0.56) (0.004)
6 0.26* 0.14 0.22* 0.63(0.006) (0.878) (0.009)
domestic products in Nepal that growth must be channelized through formation capital stockin the economy. OLS model has been used to see the relation and summary of the multiplevariable regression model has been presented below:

An Empirical Study on Stock Market, Bank and Economic Growth 109
Notes: Above values are the coefficients of OLS regression of different models keepingCapital Formation as dependent variable and other variables as independent variables in 6different models. Values in parentheses refer to their respective p-value to test the significance. GDP is the growth in the real per capita GDP in the economy; Capitalization refers to thestock market overall capitalization of NEPSE; Liquidity refers to value of shares traded inNEPSE and Credit refers to the private sector lending by the banks. The sign * shows significantrelation at 95% level of significance. R2 is the test of goodness-of-fit.
Test for RobustnessTo see the robustness of the results from the correlation and regression analysis autocorrelationtest is done. Durbin-Watson d-statistics of 1.88 suggests that autocorrelation is not clearlyseen in the model 1 whereas in model 2 it was clearly not seen as d-statistics is 2.00. (d-statistics above 2.00 suggests no autocorrelation). The calculation of the d-statistics usingSTATA has been included in the annex.
To see the probability of multi-collinearity condition index has been calculated. The valueof condition index (CI) is obtained as (Maximum eigenvalue /minimum eigenvalue) 0.5. Thebasis of decision for chance of multi-collinearity is that the value of condition index must beless than 10. In each model the value of condition index is below 10 suggesting no multi-collinearity among the independent variables.
The test of heteroscedasticity using Bruesch-Pagan Test suggests low correlation betweenfitted values of dependent variables and error in the regression model. The p-value in eachmodel is more than 0.05 suggesting no heterescedasticity. The calculation process of each testof robustness has been included in the annex.
Summary and ConclusionAlmost one hundred years ago, Schumpeter (1912) already addressed the relation betweenfinancial development and economic growth. He asserted that a well -functioning financialsystem should promote economic growth through the selection of the productive investmentswhich are the most likely to be successful and the efficient allocation of resources (via bankcredits) to these innovative technologies. In Nepal substantial growth in banking activitiesand share market capital gain is often linked with economic growth of the country. This studytries to see how financial development has helped in growth of GDP and tries to see thechannel of such growth through capital formation.
Correlation and regression analysis suggests that only banking activities are significant inpromoting economic growth as growth in GDP is significantly related with the bank credits.The relation of bank credit with capital formation is also positive and significant indicatingthat banks are helping in growth of GDP through capital formation. Though stock marketgrowth is positively related with GDP and capital formation but due lack to statistical verificationwe cannot conclude that stock market growth is significant in helping growth in the economy.

110 Santosh Poudel
Annex:
Test of AutocorrelationModel 1
Model 2
. gen asu = abs ( uh )
. estat dwatson
Durbin-Watson d-statistic (4, 21) = 1.884353
Test of multi-collinearityModel 1
. tset yeartime variable : year, 1 to 21 delta : 1 unit
. estat dwatson
Durbin-Watson d-statistic (4, 21) = 2.00638
. pca GDP Capitalization Liquidity CreditPrincipal components / correlation
Rotation: (unrotated = principal)
Number of obs = 21Number of comp. = 4Trace = 4Rho = 1.0000
Component Eigenvalue Difference Proportion Comulative
Comp 1 2.34882 1.3231 0.5872 0.5872Comp 2 1.02572 .43597 0.2564 0.8436Comp 3 .58975 .554038 0.1474 0.9911Comp 4 .0357125 . 0.0089 1.0000
The value of condition index (CI) is obtained as (Maximum eigenvalue /minimum eigenvalue)0.5
= (2.34882/0.0357125)0.5 = 2.55

An Empirical Study on Stock Market, Bank and Economic Growth 111
. pca GDP_form Capitalization Liquidity CreditPrincipal components / correlation
Rotation: (unrotated = principal)
Number of obs = 21Number of comp. = 4Trace = 4Rho = 1.0000
Component Eigenvalue Difference Proportion Comulative
Comp 1 2.17227 1.02117 0.5431 0.5431Comp 2 1.1511 .697619 0.2878 0.8308Comp 3 .453479 .697619 0.1134 0.9442Comp 4 .223154 . 0.0558 1.0000
The value of condition index (CI) is obtained as (Maximum eigenvalue /minimum eigenvalue)0.5
= (2.17227/0.223154)0.5 = 3.12Test of heteroscedasticity:
Breusch-Pagan Test for heteroscedasticity:Model 1
Breusch - Pagan / Cook-Weisberg test for heteroskedasticityHo : Constant varianceVariables : fitted values of uh
chi2 (1) = 0.55Prob > chi 2 = 0.4586
Model 2
Breusch - Pagan / Cook-Weisberg test for heteroskedasticityHo : Constant varianceVariables : fitted values of Cap_form
chi2 (1) = 3.54Prob > chi 2 = 0.0600
Model 2

112 Santosh Poudel
References
Raymond, A. & Boyan, J. (1993). Stock markets and developments, European economic review, 37.
Beck, T., Demirguc-Kunt, A., & Levine, R. (2009). A new database on financial development andstructure. World bank policy research working papers 4943. 40.
Beck, T. & Levine, R. (2004). Stock markets, banks, and growth: Panelevidence. Journal of bankingand finance, 28(3):423 { 442.
Beck, T., Levine, R., & Loayza, N. (2000). Finance and the sources of growth. Journal of financialeconomics, 58(1-2):261{300
Bhide, A. (1993). The hidden costs of stock market liquidity. Journal of financial economics, 34.
Diamond, Douglas W. (1984). Financial intermediation and delegated monitoring. Review of economicstudies, 51.
Fischer, S. (1993). The role of macroeconomic factors in growth. Journal of money economics, 32.
Kyle, A.S. (1984). Market Structure, Information, Futures Markets, and Price Formation. In Gary, G.S., Andrew, S. & Alexander, H. S. (eds.). International agricultural trade: Advanced reading inprice formation, market structure, and price instability. Boulder: Westview.
Majid, M.S.A. (2007). Re-examining the finance-growth nexus: Empirical evidence from Indonesia.Gadjah Mad international journal of business, (9) 2, 137-156
Rajan, R. G. & Zingales, L. (1998). Financial dependence and growth. American economic review, 88.
Schumpeter, J.A. (1912). Theorie der wirtschaflichen entwicklung. Leipzig, Germany: Dunker andHumblot,
Shleifer, A. & Summers, L. (1998). Breach of trust in hostile takeovers in A. Auerbach, (1998, eds).Corporate takeovers: Causes and consequences. Chicago, University of Chicago Press.
Shleifer, A. & Vishy, R.W. (1986). Large shareholders and corporate control. Journal of political economy,96.
Ministry of Finance, Economic Survey (1993-2013). Government of Nepal.
Security Board of Nepal, Annual Report (1993-2013). Government of Nepal.
Levine R., Zervos S. (1998). Stock markets, banks and economic growth. American economic association,Vol 88 No. 3.