journal of loss prevention in the process industries - risktrrisktr.com/dokumanlar/risk analysis and...
TRANSCRIPT

lable at ScienceDirect
Journal of Loss Prevention in the Process Industries 24 (2011) 477e523
Contents lists avai
Journal of Loss Prevention in the Process Industries
journal homepage: www.elsevier .com/locate/ j lp
Risk analysis and assessment methodologies in the work sites: On a review,classification and comparative study of the scientific literature of the period2000e2009
P.K. Marhavilas a,b,*, D. Koulouriotis b, V. Gemeni b
a Lab. of Electromagnetism, Dep. of Electrical & Computer Engineering, Democritus Univ. of Thrace, Vas. Sofias 12 St., 67100 Xanthi, GreecebDep. of Production & Management Engineering, Democritus Univ. of Thrace, Vas. Sofias 12 St., 67100 Xanthi, Greece
a r t i c l e i n f o
Article history:Received 1 November 2010Received in revised form17 February 2011Accepted 8 March 2011
Keywords:Risk analysisRisk assessmentRisk estimationRisk-assessment methodologiesRisk-assessment reviewingQualitativeQuantitativeHybrid techniques
* Corresponding author. Lab. of Electromagnetism, DEngineering, Democritus Univ. of Thrace, Vas. SofiasTel.: þ30 2541079973.
E-mail addresses: [email protected] (P.K. Ma(D. Koulouriotis), [email protected] (V. Gem
0950-4230/$ e see front matter � 2011 Elsevier Ltd.doi:10.1016/j.jlp.2011.03.004
a b s t r a c t
The objective of this work is to determine and study, analyze and elaborate, classify and categorize themain risk analysis and risk-assessment methods and techniques by reviewing the scientific literature.The paper consists of two parts: a) the investigation, presentation and elaboration of the main risk-assessment methodologies and b) the statistical analysis, classification, and comparative study of thecorresponding scientific papers published by six representative scientific journals of Elsevier B.V.covering the decade 2000e2009. The scientific literature reviewing showed that the risk analysis andassessment techniques are classified into three main categories: (a) the qualitative, (b) the quantitative,and (c) the hybrid techniques (qualitativeequantitative, semi-quantitative). The qualitative techniquesare based both on analytical estimation processes, and on the safety managerseengineers ability.According to quantitative techniques, the risk can be considered as a quantity, which can be estimatedand expressed by a mathematical relation, under the help of real accidents’ data recorded in a work site.The hybrid techniques, present a great complexity due to their ad hoc character that prevents a widespreading. The statistical analysis shows that the quantitative methods present the highest relativefrequency (65.63%) while the qualitative a lower one (27.68%). Furthermore the hybrid methods remainconstantly at a very low level (6.70%) during the entire processing period.
� 2011 Elsevier Ltd. All rights reserved.
1. Introduction
Public interest in the field of risk analysis has expanded in leapsand bounds during the last three decades, while risk analysis hasemerged as an effective and comprehensive procedure thatsupplements and complements the overall management of almostall aspects of our life. Managers of health care, the environment,and physical infrastructure systems all incorporate risk analysis intheir decision-making process. Moreover the omnipresent adap-tations of risk analysis by many disciplines, along with its deploy-ment by industry and government agencies in decision-making,have led to an unprecedented development of theory, method-ology, and practical tools (Haimes, 2009).
Risk has been considered as the chance that someone orsomething that is valuated will be adversely affected by the hazard
ep. of Electrical & Computer12 St., 67100 Xanthi, Greece.
rhavilas), [email protected]).
All rights reserved.
(Woodruff, 2005) while “hazard” is any unsafe condition orpotential source of an undesirable event with potential for harm ordamage (Reniers, Dullaert, Ale, & Soudan, 2005). Moreover, risk hasbeen defined as a measure under uncertainty of the severity ofa hazard (Høj & Kröger, 2002), or a measure of the probability andseverity of adverse effects (Haimes, 2009). In general, “danger”should be defined as an attribute of substances or processes, whichmay potentially cause harm (Høj & Kröger, 2002).
A complex humanemachine system is seen as being composedof humans, of machines, and of the interaction between them,which could properly be described by a system model. The role ofa system model is essential in thinking about how systems canmalfunction, or in other words in thinking about accidents. Afundamental distinction is whether accidents are due to specificmalfunctions or “error mechanisms”, or whether they are due tounfortunate coincidences. Over the years, the efforts to explain andpredict accidents have involved a number of stereotypical ways ofaccounting for how events may take place (Hollnagel, 2004, 2006;Hollnagel, Woods, & Leveson, 2006; Qureshi, 2007).
Furthermore, risk assessment is an essential and systematicprocess for assessing the impact, occurrence and the consequences

P.K. Marhavilas et al. / Journal of Loss Prevention in the Process Industries 24 (2011) 477e523478
of human activities on systems with hazardous characteristics (vanDuijne, Aken, & Schouten, 2008) and constitutes a needful tool forthe safety policy of a company. The diversity in risk analysisprocedures is such that there are many appropriate techniques forany circumstance and the choice has becomemore amatter of taste(Reniers et al., 2005; Rouvroye & van den Bliek, 2002). We canconsider the risk as a quantity, which can be measured andexpressed by a mathematical relation, under the help of real acci-dents’ data (Marhavilas & Koulouriotis, 2007, 2008; Marhavilas,Koulouriotis, & Voulgaridou, 2009).
The objective of this work is to determine and study, classify andcategorize, analyze and overview, the main risk analysis andassessment (RAA) methods and techniques by reviewing thescientific literature. The paper consists of two parts: a) thepresentation of the main risk-assessment methodologies andb) the statistical analysis, classification, and elaboration of thecorresponding scientific papers published by Elsevier B.V. coveringthe last decade.
2. An overview of risk analysis and assessment techniques
The procedure of reviewing the scientific literature, revealeda plethora of published technical articles on safety, and risk analysisreferred to many different fields, like engineering, medicine,chemistry, biology, agronomics, etc. These articles address concepts,tools, technologies, and methodologies that have been developedand practiced in such areas as planning, design, development,system integration, prototyping, and construction of physical infra-structure; in reliability, quality control, and maintenance. Further-more, our reviewing shows that the risk analysis and assessment(RAA) techniques are classified into three main categories: (a) thequalitative, (b) the quantitative, and (c) the hybrid techniques(qualitativeequantitative, semi-quantitative). The qualitative tech-niques are based both on analytical estimation processes, and on thesafety managerseengineers ability. According to quantitative tech-niques, the risk can be considered as a quantity, which can be esti-mated and expressed by a mathematical relation, under the help ofreal accidents’ data recorded in a work site. The hybrid techniques,present a great complexity due to their ad hoc character thatprevents a wide spreading. Fig. 1 illustrates the classification of the
Main Risk Analysis and As
Quantitative TechnQualitative Techniques
DMRA techn
Risk measuof societal r
QRA techniq
PRAT techni
QADS
Check-Lists
What-if Analysis
Safety Audits
Task Analysis
STEP technique
HAZOPCREA meth
PEA metho
WRA
Fig. 1. It is presented the classification of the main ris
main risk analysis and assessment methodologies. Below, wepresent an overview of them having in mind this classification.
2.1. Qualitative techniques
a) Checklists: Checklist analysis is a systematic evaluation againstpre-established criteria in the form of one or more checklists,which are enumeration of questions about operation, organi-zation, maintenance and other areas of installation safetyconcern and represent the simplest method used for hazardidentification. A brief summary of its characteristics is asfollows: (i) It is a systematic approach built on the historicalknowledge included in checklist questions, (ii) It is applicableto any activity or system, including equipment issues andhuman factors issues, (iii) It is generally performed by anindividual trained to understand the checklist questions, orsometimes by a small group, (iv) It is based mostly on inter-views, documentation reviews, and field inspections, (v) Itgenerates qualitative lists of conformance and non-confor-mance determinations with recommendations for correctingnon-conformances, (vi) The quality of evaluation is determinedprimarily by the experience of people creating the checklistsand the training of the checklist users, (vii) It is used for high-level or detailed analysis, including root cause analysis, (viii) Itis used most often to guide boarding teams through inspectionof critical vessel systems, (ix) It is also used as a supplement toor integral part of another method, especially what-if-analysis,to address specific requirements. Although checklist analysis ishighly effective in identifying various system hazards, thistechnique has two key limitations: (a) The structure of check-list analysis relies exclusively on the knowledge built into thechecklists to identify potential problems. If the checklist doesnot address a key issue, the analysis is likely to overlookpotentially important weaknesses. (b) Traditionally providesonly qualitative information. Most checklist reviews produceonly qualitative results, with no quantitative estimates of risk-related characteristics. This simplistic approach offers greatvalue for minimal investment, but it can answer morecomplicated risk-related questions only if some degree ofquantification is added, possibly with a relative ranking/risk
sessment Methodologies
iques Hybrid Techniques
ique
res isk
ue
que
od
d
HEAT / HFEA
FTA
ETA
RBM
k analysis and assessment (RAA) methodologies.

P.K. Marhavilas et al. / Journal of Loss Prevention in the Process Industries 24 (2011) 477e523 479
indexing approach (Arvanitogeorgos, 1999; Ayyub, 2003;Harms-Ringdahl, 2001; Marhavilas et al., 2009; Reniers et al.,2005; http://www.oshatrain.org).
b) What-if-analysis: It is an approach that (1) uses broad, looselystructured questioning to postulate potential upsets that mayresult in accidents or system performance problems and(2) determines what things can go wrong and judges theconsequences of those situations occurring (Ayyub, 2003;Doerr, 1991; Reniers et al., 2005). The main characteristics ofthe technique are briefly summarized as follows:� It is a systematic, but loosely structured, assessment, relyingon a team of experts to generate a comprehensive reviewand to ensure that appropriate safeguards are in place.
� Typically is performed by one or more teams with diversebackgrounds and experience that participate in groupreview meetings of documentation and field inspections.
� It is applicable to any activity or system.� It is used as a high-level or detailed risk-assessmenttechnique.
� It generates qualitative descriptions of potential problems,in the form of questions and responses, as well as lists ofrecommendations for preventing problems.
� The quality of the evaluation depends on the quality of thedocumentation, the training of the review team leader, andthe experience of the review teams.
� It is generally applicable for almost every type of risk-assessment application, especially those dominated byrelatively simple failure scenarios.
� Occasionally it is used alone, but most often is used tosupplement other, more structured techniques (especiallychecklist analysis).
The procedure for performing a what-if-analysis consists of thefollowing seven steps:
� We specify and clearly define the boundaries for which risk-related information is needed.
� We specify the problems of interest that the analysis willaddress (safety problems, environmental issues, economicimpacts, etc.).
� We subdivide the subject into its major elements (e.g. locationson thewaterway, tasks, or subsystems), so that the analysis willbegin at this level.
� We generate “what-if” questions for each element of theactivity or system.
� We respond to each of the “what-if” questions and developrecommendations for improvements wherever the risk ofpotential problems seems uncomfortable or unnecessary.
� We further subdivide the elements of the activity or system, ifit is necessary or more detailed analysis is desired. The sectionof some elements into successively finer levels of resolutionuntil further subdivision will (1) provide no more valuableinformation or (2) exceed the organization’s control or influ-ence to make improvements. Generally, the goal is to minimizethe level of resolution necessary for a risk assessment.
� We use the results in decision-making. So we evaluaterecommendations from the analysis and implement those thatwill bring more benefits than they will cost in the life cycle ofthe activity or system.
c) Safety audits: They are procedures by which operational safetyprograms of an installation, a process or a plant are inspected.They identify equipment conditions or operating proceduresthat could lead to a casualty or result in property damage orenvironmental impacts (Ayyub, 2003). An auditor or an auditteam reviews critical features to verify the implementation of
appropriate design criteria, operating conditions and proce-dures, safetymeasures and related risk-management programs.The result of an audit is a report that provides corporatemanagement with an overview of the level of performance forvarious safety aspects of operations. Reporting results shouldmake reasonable recommendations and suggestions aboutsafety procedure improvements and safety awareness of oper-ating personnel (Harms-Ringdahl, 2001; Reniers et al., 2005).
d) Task Analysis (TA): This process analyzes the way that peopleperform the tasks in their work environment and how thesetasks are refined into subtasks and describes how the operatorsinteract bothwith the system itself andwith other personnel inthat system. It can be used to create a detailed picture of humaninvolvement using all the information necessary for an analysisin an adequate degree of details (Brauchler & Landau, 1998;Doytchev & Szwillus, 2008; Kirwan, 1994; Kontogiannis,2003; Landau, Rohmert, & Brauchler, 1998). Task analysisinvolves the study of activities and communications under-taken by operators and their teams in order to achieve a systemgoal. The result of a task analysis is a Task Model. The taskanalysis process usually involves three phases: (i) collection ofdata about human interventions and system demands,(ii) representation of those data in a comprehensible format orgraph, and (iii) comparison between system demands andoperator capabilities. The primary objective of task analysis isto ensure compatibility between system demands and operatorcapabilities, and if necessary, to alter those demands so that thetask is adapted to the person. A widely used form of taskanalysis is the hierarchical task analysis (HTA). Through itshierarchical approach it provides a well-structured overview ofthe work processes even in realistically sized examples. HTA isan easy to use method of gathering and organizing informationabout human activities and human interaction, and enables theanalyst to find safety-critical tasks. It is time-consuming in caseof complex tasks and requires the cooperation of experts fromthe application domain, knowledgeable about the task opera-tion conditions. Other analysis techniques are the Tabular TaskAnalysis, Timeline Analysis, Operator Action Event Trees, theGOMS-methods (Goals, Operators, Methods, and SelectionRules), Critical Action and Decision Evaluation Technique etc(Brauchler & Landau, 1998; Landau et al., 1998).
e) The Sequentially Timed Event Plotting (STEP) technique: Itprovides a valuable overview of the timing and sequence ofevents/actions that contributed to the accident, or in otherwords, a reconstruction of the harm process by plotting thesequence of events that contributed to the accident. The mainconcepts in STEP are the initiation of the accident through anevent or change that disrupted the technical system, the agentswhich intervene to control the system and the elementary“event building blocks”. The analysts construct an STEP work-sheet which charts the evolution of events and system inter-ventions (on the horizontal axis) performed by the agents (onthe vertical axis). Subsequently, they identify the main events/actions that contributed to the accident and construct their“event building blocks” which contain the following informa-tion: a) the time at which the event started, b) the duration ofthe event, c) the agent which caused the event, d) thedescription of the event, and e) the name of the source whichoffered this information. In the second stage, the events areinterconnected with arrows. All events should have incomingand outgoing arrows which show “precede” and “follow”
relationships between events. Converging arrows showdependencies between events while divergent arrows showthe impact on following events (Hendrick & Benner, 1987;Kontogiannis, Leopoulos, & Marmaras, 2000).
P.K. Marhavilas et al. / Journal of Loss Prevention in the Process Industries 24 (2011) 477e523480
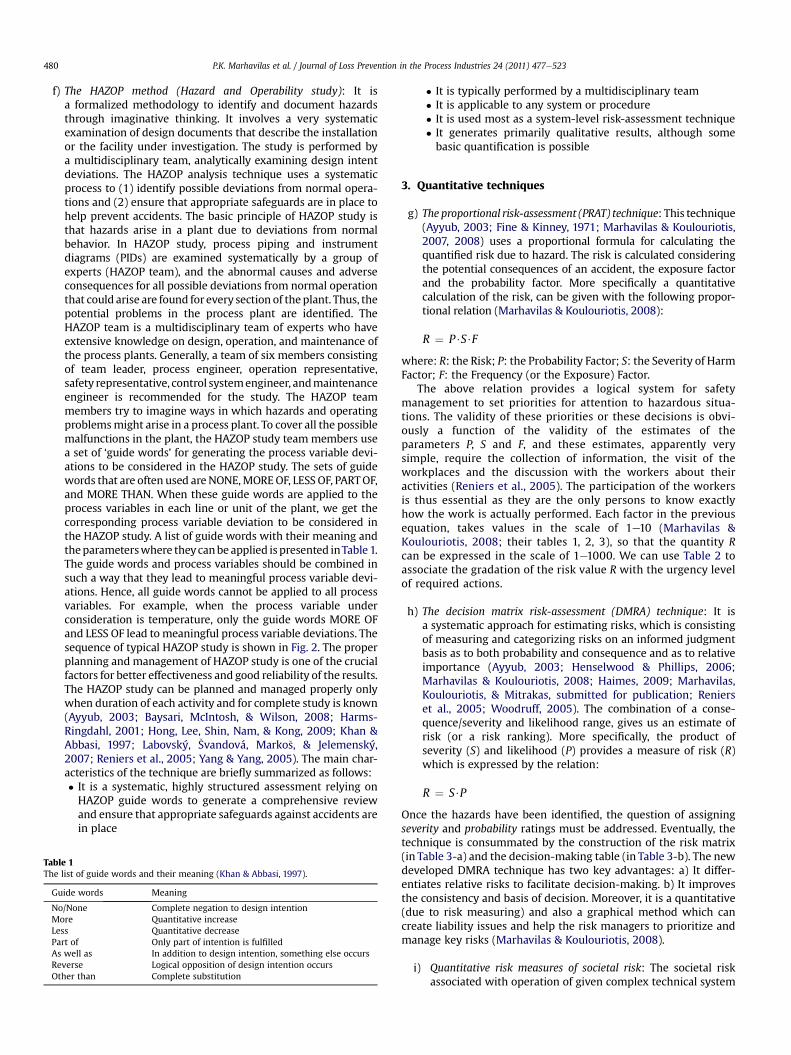
f) The HAZOP method (Hazard and Operability study): It isa formalized methodology to identify and document hazardsthrough imaginative thinking. It involves a very systematicexamination of design documents that describe the installationor the facility under investigation. The study is performed bya multidisciplinary team, analytically examining design intentdeviations. The HAZOP analysis technique uses a systematicprocess to (1) identify possible deviations from normal opera-tions and (2) ensure that appropriate safeguards are in place tohelp prevent accidents. The basic principle of HAZOP study isthat hazards arise in a plant due to deviations from normalbehavior. In HAZOP study, process piping and instrumentdiagrams (PIDs) are examined systematically by a group ofexperts (HAZOP team), and the abnormal causes and adverseconsequences for all possible deviations from normal operationthat could arise are found for every section of theplant. Thus, thepotential problems in the process plant are identified. TheHAZOP team is a multidisciplinary team of experts who haveextensive knowledge on design, operation, and maintenance ofthe process plants. Generally, a team of six members consistingof team leader, process engineer, operation representative,safety representative, control systemengineer, andmaintenanceengineer is recommended for the study. The HAZOP teammembers try to imagine ways in which hazards and operatingproblemsmight arise in a process plant. To cover all the possiblemalfunctions in the plant, the HAZOP study teammembers usea set of ‘guide words’ for generating the process variable devi-ations to be considered in the HAZOP study. The sets of guidewords that are often used are NONE,MOREOF, LESS OF, PARTOF,and MORE THAN. When these guide words are applied to theprocess variables in each line or unit of the plant, we get thecorresponding process variable deviation to be considered inthe HAZOP study. A list of guide words with their meaning andtheparameterswhere theycanbe applied is presented inTable 1.The guide words and process variables should be combined insuch a way that they lead to meaningful process variable devi-ations. Hence, all guide words cannot be applied to all processvariables. For example, when the process variable underconsideration is temperature, only the guide words MORE OFand LESS OF lead to meaningful process variable deviations. Thesequence of typical HAZOP study is shown in Fig. 2. The properplanning and management of HAZOP study is one of the crucialfactors for better effectiveness and good reliability of the results.The HAZOP study can be planned and managed properly onlywhen duration of each activity and for complete study is known(Ayyub, 2003; Baysari, McIntosh, & Wilson, 2008; Harms-Ringdahl, 2001; Hong, Lee, Shin, Nam, & Kong, 2009; Khan &Abbasi, 1997; Labovský, �Svandová, Marko�s, & Jelemenský,2007; Reniers et al., 2005; Yang & Yang, 2005). The main char-acteristics of the technique are briefly summarized as follows:� It is a systematic, highly structured assessment relying onHAZOP guide words to generate a comprehensive reviewand ensure that appropriate safeguards against accidents arein place
Table 1The list of guide words and their meaning (Khan & Abbasi, 1997).
Guide words Meaning
No/None Complete negation to design intentionMore Quantitative increaseLess Quantitative decreasePart of Only part of intention is fulfilledAs well as In addition to design intention, something else occursReverse Logical opposition of design intention occursOther than Complete substitution
� It is typically performed by a multidisciplinary team� It is applicable to any system or procedure� It is used most as a system-level risk-assessment technique� It generates primarily qualitative results, although somebasic quantification is possible
3. Quantitative techniques
g) The proportional risk-assessment (PRAT) technique: This technique(Ayyub, 2003; Fine & Kinney, 1971; Marhavilas & Koulouriotis,2007, 2008) uses a proportional formula for calculating thequantified risk due to hazard. The risk is calculated consideringthe potential consequences of an accident, the exposure factorand the probability factor. More specifically a quantitativecalculation of the risk, can be given with the following propor-tional relation (Marhavilas & Koulouriotis, 2008):
R ¼ P$S$F
where: R: the Risk; P: the Probability Factor; S: the Severity of Harm
Factor; F: the Frequency (or the Exposure) Factor.The above relation provides a logical system for safetymanagement to set priorities for attention to hazardous situa-tions. The validity of these priorities or these decisions is obvi-ously a function of the validity of the estimates of theparameters P, S and F, and these estimates, apparently verysimple, require the collection of information, the visit of theworkplaces and the discussion with the workers about theiractivities (Reniers et al., 2005). The participation of the workersis thus essential as they are the only persons to know exactlyhow the work is actually performed. Each factor in the previousequation, takes values in the scale of 1e10 (Marhavilas &Koulouriotis, 2008; their tables 1, 2, 3), so that the quantity Rcan be expressed in the scale of 1e1000. We can use Table 2 toassociate the gradation of the risk value R with the urgency levelof required actions.
h) The decision matrix risk-assessment (DMRA) technique: It isa systematic approach for estimating risks, which is consistingof measuring and categorizing risks on an informed judgmentbasis as to both probability and consequence and as to relativeimportance (Ayyub, 2003; Henselwood & Phillips, 2006;Marhavilas & Koulouriotis, 2008; Haimes, 2009; Marhavilas,Koulouriotis, & Mitrakas, submitted for publication; Renierset al., 2005; Woodruff, 2005). The combination of a conse-quence/severity and likelihood range, gives us an estimate ofrisk (or a risk ranking). More specifically, the product ofseverity (S) and likelihood (P) provides a measure of risk (R)which is expressed by the relation:
R ¼ S$P
Once the hazards have been identified, the question of assigning
severity and probability ratings must be addressed. Eventually, thetechnique is consummated by the construction of the risk matrix(in Table 3-a) and the decision-making table (in Table 3-b). The newdeveloped DMRA technique has two key advantages: a) It differ-entiates relative risks to facilitate decision-making. b) It improvesthe consistency and basis of decision. Moreover, it is a quantitative(due to risk measuring) and also a graphical method which cancreate liability issues and help the risk managers to prioritize andmanage key risks (Marhavilas & Koulouriotis, 2008).i) Quantitative risk measures of societal risk: The societal riskassociated with operation of given complex technical system

Take one process
unit
Choose deviation e.g.temp, flow rate,
pressure
Is deviation possible?
What changes in plant will tell the deviation
Is it hazardous?
Will operator know that there
is deviation?
What changes in plant will prevent deviation or make it less likely or
protect against consequences?
Is cost of changes
justified?
Consider other modifications
Are all parameters
studied?
Has all equipments of
unit been studied?
Stop
NoYes
Yes
No
Yes
NoYes
NoYes
No
Yes
Fig. 2. Procedure of HAZOP study (Khan & Abbasi, 1997).
P.K. Marhavilas et al. / Journal of Loss Prevention in the Process Industries 24 (2011) 477e523 481
is evaluated (Kosmowski, 2002, 2006) on the basis of a set ofthe triples:
R ¼ fhSk; Fk;Nkig
Table 2Gradation of the risk value in association with the urgency level of required actions(Marhavilas & Koulouriotis, 2008).
Risk Value (R) Urgency level of required actions
700e1000 Immediate action500e700 Required Action earlier than 1 day300e500 Required Action earlier than 1 month200e300 Required Action earlier than 1 year<200 Immediate action is not necessary but it is
required the event surveillance
where Sk is k-th accident scenario (usually representing an accidentcategory) defined in the determined modeling process, Fk is thefrequency of this scenario (evaluated as probability per time unit,usually one year), and Nk denotes the consequences of k-thscenario, i.e. potential losses (the number of injuries and fatalities)or financial losses. On the basis of the above relation the FeN curve(CCDF: complementary cumulative distribution function) is to bedrawn. Fig. 3 illustrates an example of such curve in double loga-rithmic co-ordinates to be compared with criteria lines: D (lowerline) and G (upper line). The social risk for a given technical systemis accepted when FeN curve is below the criterion line D (a definedfunction with regard to societal preferences) for all N. If the FeNcurve is situated between criteria lines D and G, then the ALARP (aslow as reasonably practicable) principle should be applied toindicate the ways to reduce risk. If for any N the FeN curve is above

Table 3The decisionmatrix risk-assessment technique: (a) The riskmatrix. (b) The decision-making table (Marhavilas & Koulouriotis, 2008).
Hazard probability ratings (P)
Severity of conse-quences ratings
(S)
6 5 4 3 2 1
6 36 30 24 18 12 6
5 30 25 20 15 10 5
4 24 20 16 12 8 4
3 18 15 12 9 6 3
2 12 10 8 6 4 2
1 6 5 4 3 2 1
Unacceptable 18-36
Undesirable 10-16
Acceptable with controls 5-9
Acceptable 1-4
Fig. 3. Examples of the FeN curve and criteria functions for societal risk.
P.K. Marhavilas et al. / Journal of Loss Prevention in the Process Industries 24 (2011) 477e523482
the upper criteria line G, the risk is intolerable and the systemmustre-designed (e.g. functionally and structurally modified) to reducerisk as required. Ameasure of societal risk can be the average rate ofdeath evaluated according to the formula:
R ¼Xk
FkNk
where: Fk is the frequency of k-th accident scenario [a�1]; and Nk isthe number of fatalities resulting from k-th scenario.
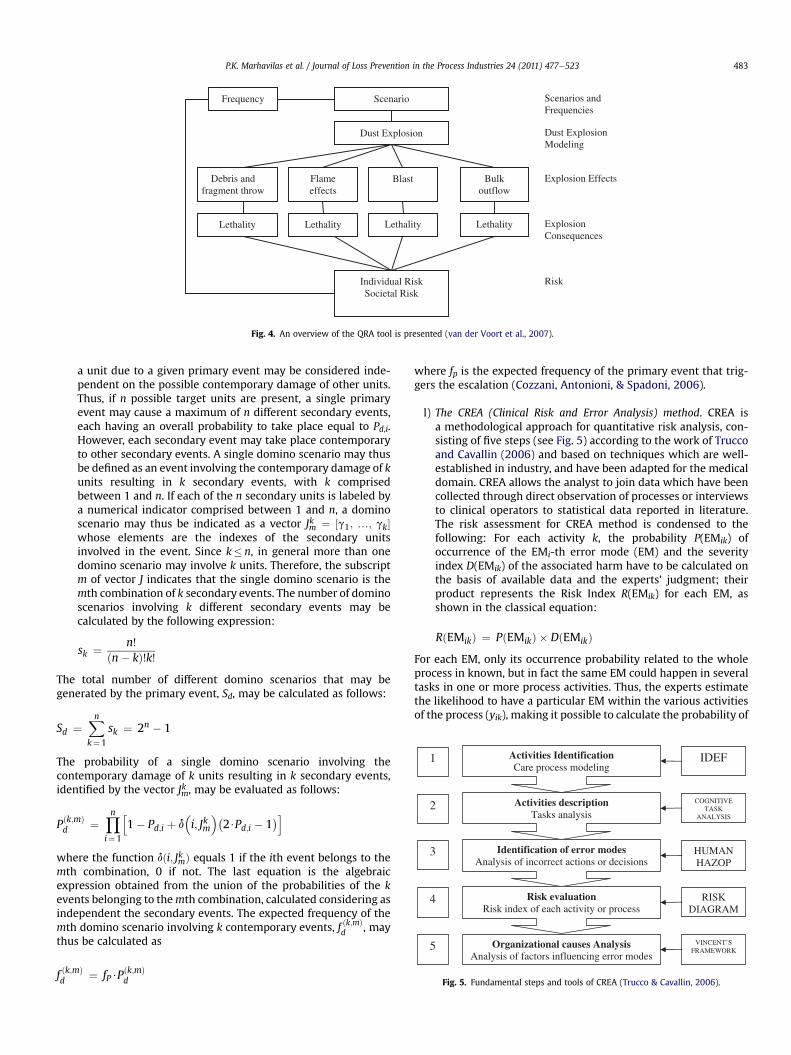
j) The QRA (Quantitative Risk-Assessment) tool. The QRA tool hasbeen developed for the external safety of industrial plants witha dust explosion hazard. This tool provides a consistent basis toanalyze the individual and societal risk, it consists of a combi-nation of sub models, and an overview is presented in Fig. 4.First the scenarios and their frequencies are defined. Theindividual risk is defined as the probability (frequency) oflethality for an unprotected person in the vicinity ofa hazardous location. The societal risk takes the actual envi-ronment into account. For example, an industrial plant isdivided into two groups of modules, defined by their size,shape, and constructional properties. Then the relevantexplosion scenarios are determined, together with theirfrequency of occurrence. These include scenarios in which onemodule participates, as well as domino scenarios. Thefrequency is partly based on casuistry. The QRA tool offers thepossibility to define four types of objects: unprotected people,cars, domestic houses and office buildings, each with their ownprotection level against the different explosion effects. Thedevelopment of the dust explosion and the process of ventingand the launch of module parts are predicted for each scenario.
As a result the individual risk is independent of the contribu-tions from window failure due to blast effects. The flame jet isonly relevant if the height of its origin is situated less than 5 mabove the unprotected person. Debris throwing and bulkoutflow are always relevant for the individual risk. The resultsare input for explosion effect calculations, followed bya prediction of the consequences for people. The consequencesand the scenario frequency are then combined to the individualand societal risk, which can be compared to the relevantregulations (Van der Voort et al., 2007).
k) Quantitative assessment of domino scenarios (QADS). Thedomino effect is assumed as an accident in which a primaryevent propagates to nearby equipment, triggering one or moresecondary events resulting in overall consequences moresevere than those of the primary event. Furthermore, an acci-dent is usually considered as a “domino event” only if its overallseverity is higher or at least comparable to that of the primaryaccidental scenario, while domino accidental scenarios resultfrom the escalation of a primary accidental event. The escala-tion is usually caused by the damage of at least one equipmentitem, due to the physical effects of the primary event. Fourelements may be considered to characterize a domino event:(i) A primary accidental scenario, which triggers the dominoeffect. (ii) A propagation effect following the primary event,due to the effect of escalation vectors caused by the primaryevent on secondary targets. (iii) One or more secondary acci-dental scenarios, involving the same or different plant units,causing the propagation of the primary event. (iv) An escala-tion of the consequences of the primary event, due to the effectof the secondary scenarios. The quantitative assessment ofdomino accidents requires the identification, the frequencyevaluation and the consequence assessment of all the credibledomino scenarios, including all the different combinations ofsecondary events that may be originated by each primaryevent. The identification of the credible domino scenariosshould be based on escalation criteria addressing the possibledamage of equipment due to the physical effects generated inthe primary scenarios. In the approach to the frequencyassessment of domino scenarios, the damage probability of
Frequency Scenario
Dust Explosion
Debris and fragment throw
Flame effects
Blast Bulkoutflow
Lethality Lethality Lethality Lethality
Individual Risk Societal Risk
Dust Explosion Modeling
Scenarios and Frequencies
Explosion Effects
Explosion Consequences
Risk
Fig. 4. An overview of the QRA tool is presented (van der Voort et al., 2007).
P.K. Marhavilas et al. / Journal of Loss Prevention in the Process Industries 24 (2011) 477e523 483
a unit due to a given primary event may be considered inde-pendent on the possible contemporary damage of other units.Thus, if n possible target units are present, a single primaryevent may cause a maximum of n different secondary events,each having an overall probability to take place equal to Pd,i.However, each secondary event may take place contemporaryto other secondary events. A single domino scenario may thusbe defined as an event involving the contemporary damage of kunits resulting in k secondary events, with k comprisedbetween 1 and n. If each of the n secondary units is labeled bya numerical indicator comprised between 1 and n, a dominoscenario may thus be indicated as a vector Jkm ¼ ½g1; .; gk�whose elements are the indexes of the secondary unitsinvolved in the event. Since k� n, in general more than onedomino scenario may involve k units. Therefore, the subscriptm of vector J indicates that the single domino scenario is themth combination of k secondary events. The number of dominoscenarios involving k different secondary events may becalculated by the following expression:
sk ¼ n!ðn� kÞ!k!
5
Risk evaluationRisk index of each activity or process
Identification of error modesAnalysis of incorrect actions or decisions
Activities descriptionTasks analysis
Activities IdentificationCare process modeling
1
2
3
4
Organizational causes AnalysisAnalysis of factors influencing error modes
IDEF
COGNITIVE TASK
ANALYSIS
VINCENT’S FRAMEWORK
HUMANHAZOP
RISKDIAGRAM
Fig. 5. Fundamental steps and tools of CREA (Trucco & Cavallin, 2006).
The total number of different domino scenarios that may begenerated by the primary event, Sd, may be calculated as follows:
Sd ¼Xnk¼1
sk ¼ 2n � 1
The probability of a single domino scenario involving thecontemporary damage of k units resulting in k secondary events,identified by the vector Jkm, may be evaluated as follows:
Pðk;mÞd ¼
Yni¼1
h1� Pd;i þ d
�i; Jkm
��2$Pd;i � 1
�i
where the function dði; JkmÞ equals 1 if the ith event belongs to themth combination, 0 if not. The last equation is the algebraicexpression obtained from the union of the probabilities of the kevents belonging to themth combination, calculated considering asindependent the secondary events. The expected frequency of themth domino scenario involving k contemporary events, f ðk;mÞ
d , maythus be calculated as
f ðk;mÞd ¼ fP$P
ðk;mÞd
where fp is the expected frequency of the primary event that trig-gers the escalation (Cozzani, Antonioni, & Spadoni, 2006).
l) The CREA (Clinical Risk and Error Analysis) method. CREA isa methodological approach for quantitative risk analysis, con-sisting of five steps (see Fig. 5) according to the work of Truccoand Cavallin (2006) and based on techniques which are well-established in industry, and have been adapted for the medicaldomain. CREA allows the analyst to join data which have beencollected through direct observation of processes or interviewsto clinical operators to statistical data reported in literature.The risk assessment for CREA method is condensed to thefollowing: For each activity k, the probability P(EMik) ofoccurrence of the EMi-th error mode (EM) and the severityindex D(EMik) of the associated harm have to be calculated onthe basis of available data and the experts’ judgment; theirproduct represents the Risk Index R(EMik) for each EM, asshown in the classical equation:
RðEMikÞ ¼ PðEMikÞ � DðEMikÞ
For each EM, only its occurrence probability related to the wholeprocess in known, but in fact the same EM could happen in severaltasks in one or more process activities. Thus, the experts estimatethe likelihood to have a particular EM within the various activitiesof the process (yik), making it possible to calculate the probability of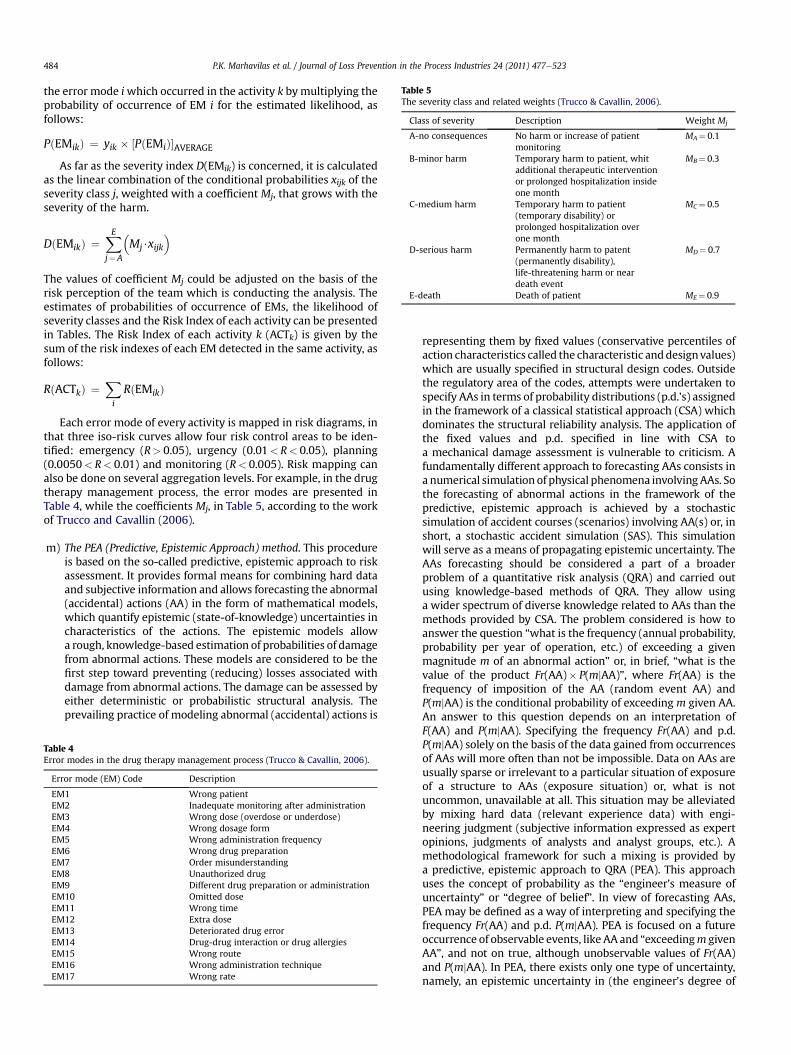
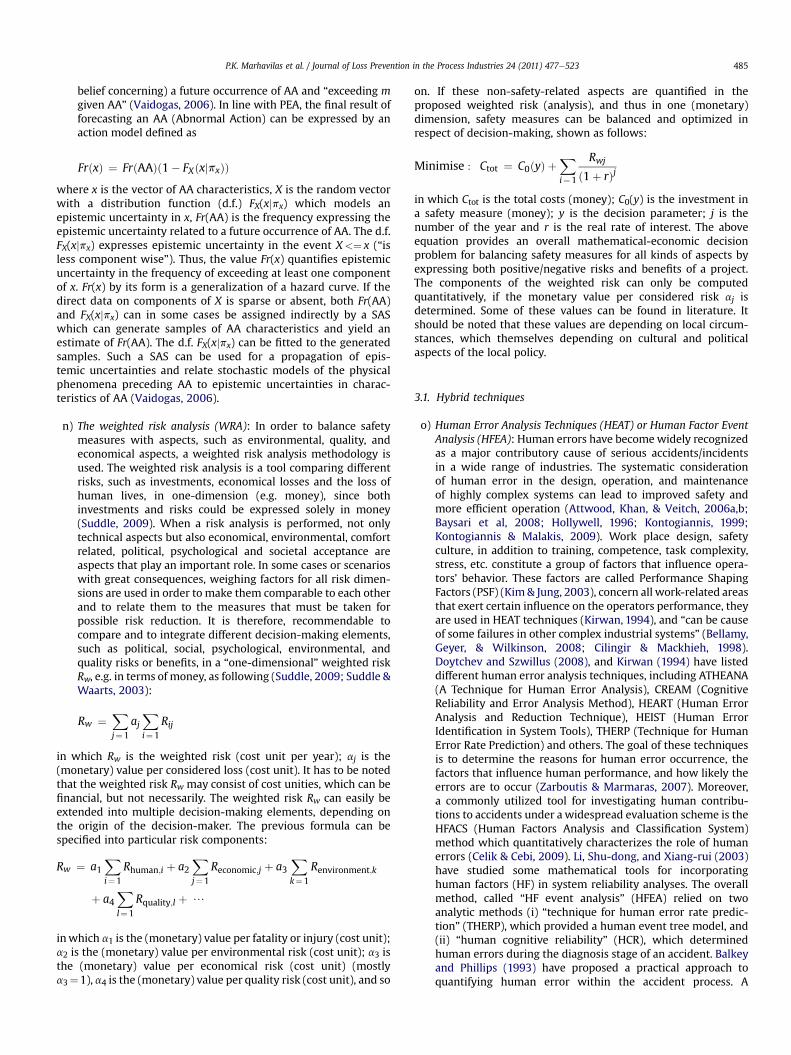
Table 5The severity class and related weights (Trucco & Cavallin, 2006).
Class of severity Description Weight Mj
A-no consequences No harm or increase of patientmonitoring
MA¼ 0.1
B-minor harm Temporary harm to patient, whitadditional therapeutic interventionor prolonged hospitalization insideone month
MB¼ 0.3
C-medium harm Temporary harm to patient(temporary disability) orprolonged hospitalization overone month
MC¼ 0.5
D-serious harm Permanently harm to patent(permanently disability),life-threatening harm or neardeath event
MD¼ 0.7
E-death Death of patient ME¼ 0.9
P.K. Marhavilas et al. / Journal of Loss Prevention in the Process Industries 24 (2011) 477e523484
the error mode iwhich occurred in the activity k bymultiplying theprobability of occurrence of EM i for the estimated likelihood, asfollows:
PðEMikÞ ¼ yik � ½PðEMiÞ�AVERAGEAs far as the severity index D(EMik) is concerned, it is calculated
as the linear combination of the conditional probabilities xijk of theseverity class j, weighted with a coefficient Mj, that grows with theseverity of the harm.
DðEMikÞ ¼XEj¼A
�Mj$xijk
�
The values of coefficient Mj could be adjusted on the basis of therisk perception of the team which is conducting the analysis. Theestimates of probabilities of occurrence of EMs, the likelihood ofseverity classes and the Risk Index of each activity can be presentedin Tables. The Risk Index of each activity k (ACTk) is given by thesum of the risk indexes of each EM detected in the same activity, asfollows:
RðACTkÞ ¼Xi
RðEMikÞ
Each error mode of every activity is mapped in risk diagrams, inthat three iso-risk curves allow four risk control areas to be iden-tified: emergency (R> 0.05), urgency (0.01< R< 0.05), planning(0.0050< R< 0.01) and monitoring (R< 0.005). Risk mapping canalso be done on several aggregation levels. For example, in the drugtherapy management process, the error modes are presented inTable 4, while the coefficients Mj, in Table 5, according to the workof Trucco and Cavallin (2006).
m) The PEA (Predictive, Epistemic Approach) method. This procedureis based on the so-called predictive, epistemic approach to riskassessment. It provides formal means for combining hard dataand subjective information and allows forecasting the abnormal(accidental) actions (AA) in the form of mathematical models,which quantify epistemic (state-of-knowledge) uncertainties incharacteristics of the actions. The epistemic models allowa rough, knowledge-based estimation of probabilities of damagefrom abnormal actions. These models are considered to be thefirst step toward preventing (reducing) losses associated withdamage from abnormal actions. The damage can be assessed byeither deterministic or probabilistic structural analysis. Theprevailing practice of modeling abnormal (accidental) actions is
Table 4Error modes in the drug therapy management process (Trucco & Cavallin, 2006).
Error mode (EM) Code Description
EM1 Wrong patientEM2 Inadequate monitoring after administrationEM3 Wrong dose (overdose or underdose)EM4 Wrong dosage formEM5 Wrong administration frequencyEM6 Wrong drug preparationEM7 Order misunderstandingEM8 Unauthorized drugEM9 Different drug preparation or administrationEM10 Omitted doseEM11 Wrong timeEM12 Extra doseEM13 Deteriorated drug errorEM14 Drug-drug interaction or drug allergiesEM15 Wrong routeEM16 Wrong administration techniqueEM17 Wrong rate
representing them by fixed values (conservative percentiles ofaction characteristics called the characteristic anddesignvalues)which are usually specified in structural design codes. Outsidethe regulatory area of the codes, attempts were undertaken tospecify AAs in terms of probability distributions (p.d.’s) assignedin the framework of a classical statistical approach (CSA) whichdominates the structural reliability analysis. The application ofthe fixed values and p.d. specified in line with CSA toa mechanical damage assessment is vulnerable to criticism. Afundamentally different approach to forecasting AAs consists ina numerical simulation of physical phenomena involving AAs. Sothe forecasting of abnormal actions in the framework of thepredictive, epistemic approach is achieved by a stochasticsimulation of accident courses (scenarios) involving AA(s) or, inshort, a stochastic accident simulation (SAS). This simulationwill serve as a means of propagating epistemic uncertainty. TheAAs forecasting should be considered a part of a broaderproblem of a quantitative risk analysis (QRA) and carried outusing knowledge-based methods of QRA. They allow usinga wider spectrum of diverse knowledge related to AAs than themethods provided by CSA. The problem considered is how toanswer the question “what is the frequency (annual probability,probability per year of operation, etc.) of exceeding a givenmagnitude m of an abnormal action” or, in brief, “what is thevalue of the product Fr(AA)� P(mjAA)”, where Fr(AA) is thefrequency of imposition of the AA (random event AA) andP(mjAA) is the conditional probability of exceeding m given AA.An answer to this question depends on an interpretation ofF(AA) and P(mjAA). Specifying the frequency Fr(AA) and p.d.P(mjAA) solely on the basis of the data gained from occurrencesof AAs will more often than not be impossible. Data on AAs areusually sparse or irrelevant to a particular situation of exposureof a structure to AAs (exposure situation) or, what is notuncommon, unavailable at all. This situation may be alleviatedby mixing hard data (relevant experience data) with engi-neering judgment (subjective information expressed as expertopinions, judgments of analysts and analyst groups, etc.). Amethodological framework for such a mixing is provided bya predictive, epistemic approach to QRA (PEA). This approachuses the concept of probability as the “engineer’s measure ofuncertainty” or “degree of belief”. In view of forecasting AAs,PEA may be defined as a way of interpreting and specifying thefrequency Fr(AA) and p.d. P(mjAA). PEA is focused on a futureoccurrence of observable events, like AA and “exceedingm givenAA”, and not on true, although unobservable values of Fr(AA)and P(mjAA). In PEA, there exists only one type of uncertainty,namely, an epistemic uncertainty in (the engineer’s degree of
P.K. Marhavilas et al. / Journal of Loss Prevention in the Process Industries 24 (2011) 477e523 485
belief concerning) a future occurrence of AA and “exceeding mgiven AA” (Vaidogas, 2006). In line with PEA, the final result offorecasting an AA (Abnormal Action) can be expressed by anaction model defined as
FrðxÞ ¼ FrðAAÞð1� FXðxjpxÞÞ
where x is the vector of AA characteristics, X is the random vectorwith a distribution function (d.f.) FX(xjpx) which models anepistemic uncertainty in x, Fr(AA) is the frequency expressing theepistemic uncertainty related to a future occurrence of AA. The d.f.FX(xjpx) expresses epistemic uncertainty in the event X<¼ x (“isless component wise”). Thus, the value Fr(x) quantifies epistemicuncertainty in the frequency of exceeding at least one componentof x. Fr(x) by its form is a generalization of a hazard curve. If thedirect data on components of X is sparse or absent, both Fr(AA)and FX(xjpx) can in some cases be assigned indirectly by a SASwhich can generate samples of AA characteristics and yield anestimate of Fr(AA). The d.f. FX(xjpx) can be fitted to the generatedsamples. Such a SAS can be used for a propagation of epis-temic uncertainties and relate stochastic models of the physicalphenomena preceding AA to epistemic uncertainties in charac-teristics of AA (Vaidogas, 2006).n) The weighted risk analysis (WRA): In order to balance safetymeasures with aspects, such as environmental, quality, andeconomical aspects, a weighted risk analysis methodology isused. The weighted risk analysis is a tool comparing differentrisks, such as investments, economical losses and the loss ofhuman lives, in one-dimension (e.g. money), since bothinvestments and risks could be expressed solely in money(Suddle, 2009). When a risk analysis is performed, not onlytechnical aspects but also economical, environmental, comfortrelated, political, psychological and societal acceptance areaspects that play an important role. In some cases or scenarioswith great consequences, weighing factors for all risk dimen-sions are used in order to make them comparable to each otherand to relate them to the measures that must be taken forpossible risk reduction. It is therefore, recommendable tocompare and to integrate different decision-making elements,such as political, social, psychological, environmental, andquality risks or benefits, in a “one-dimensional” weighted riskRw, e.g. in terms of money, as following (Suddle, 2009; Suddle &Waarts, 2003):
Rw ¼Xj¼1
ajXi¼1
Rij
in which Rw is the weighted risk (cost unit per year); aj is the(monetary) value per considered loss (cost unit). It has to be notedthat the weighted risk Rw may consist of cost unities, which can befinancial, but not necessarily. The weighted risk Rw can easily beextended into multiple decision-making elements, depending onthe origin of the decision-maker. The previous formula can bespecified into particular risk components:
Rw ¼ a1Xi¼1
Rhuman;i þ a2Xj¼1
Reconomic;j þ a3Xk¼1
Renvironment;k
þ a4Xl¼1
Rquality;l þ /
inwhich a1 is the (monetary) value per fatality or injury (cost unit);a2 is the (monetary) value per environmental risk (cost unit); a3 isthe (monetary) value per economical risk (cost unit) (mostlya3¼1), a4 is the (monetary) value per quality risk (cost unit), and so
on. If these non-safety-related aspects are quantified in theproposed weighted risk (analysis), and thus in one (monetary)dimension, safety measures can be balanced and optimized inrespect of decision-making, shown as follows:
Minimise : Ctot ¼ C0ðyÞ þXi¼1
Rwj
ð1þ rÞj
in which Ctot is the total costs (money); C0(y) is the investment ina safety measure (money); y is the decision parameter; j is thenumber of the year and r is the real rate of interest. The aboveequation provides an overall mathematical-economic decisionproblem for balancing safety measures for all kinds of aspects byexpressing both positive/negative risks and benefits of a project.The components of the weighted risk can only be computedquantitatively, if the monetary value per considered risk aj isdetermined. Some of these values can be found in literature. Itshould be noted that these values are depending on local circum-stances, which themselves depending on cultural and politicalaspects of the local policy.
3.1. Hybrid techniques
o) Human Error Analysis Techniques (HEAT) or Human Factor EventAnalysis (HFEA): Human errors have becomewidely recognizedas a major contributory cause of serious accidents/incidentsin a wide range of industries. The systematic considerationof human error in the design, operation, and maintenanceof highly complex systems can lead to improved safety andmore efficient operation (Attwood, Khan, & Veitch, 2006a,b;Baysari et al, 2008; Hollywell, 1996; Kontogiannis, 1999;Kontogiannis & Malakis, 2009). Work place design, safetyculture, in addition to training, competence, task complexity,stress, etc. constitute a group of factors that influence opera-tors’ behavior. These factors are called Performance ShapingFactors (PSF) (Kim& Jung, 2003), concern all work-related areasthat exert certain influence on the operators performance, theyare used in HEAT techniques (Kirwan, 1994), and “can be causeof some failures in other complex industrial systems” (Bellamy,Geyer, & Wilkinson, 2008; Cilingir & Mackhieh, 1998).Doytchev and Szwillus (2008), and Kirwan (1994) have listeddifferent human error analysis techniques, including ATHEANA(A Technique for Human Error Analysis), CREAM (CognitiveReliability and Error Analysis Method), HEART (Human ErrorAnalysis and Reduction Technique), HEIST (Human ErrorIdentification in System Tools), THERP (Technique for HumanError Rate Prediction) and others. The goal of these techniquesis to determine the reasons for human error occurrence, thefactors that influence human performance, and how likely theerrors are to occur (Zarboutis & Marmaras, 2007). Moreover,a commonly utilized tool for investigating human contribu-tions to accidents under a widespread evaluation scheme is theHFACS (Human Factors Analysis and Classification System)method which quantitatively characterizes the role of humanerrors (Celik & Cebi, 2009). Li, Shu-dong, and Xiang-rui (2003)have studied some mathematical tools for incorporatinghuman factors (HF) in system reliability analyses. The overallmethod, called “HF event analysis” (HFEA) relied on twoanalytic methods (i) “technique for human error rate predic-tion” (THERP), which provided a human event tree model, and(ii) “human cognitive reliability” (HCR), which determinedhuman errors during the diagnosis stage of an accident. Balkeyand Phillips (1993) have proposed a practical approach toquantifying human error within the accident process. A

P.K. Marhavilas et al. / Journal of Loss Prevention in the Process Industries 24 (2011) 477e523486
mathematical relationship was proposed to model the likeli-hood (P) of occurrence of a human error event, as follows:
Pðhuman errorÞ ¼��
1� 1#options
�� feedback
� adjuster� redundancy
The variables in the equation are expected to affect the likeli-hood (P) of human error according to the following comments:
� #Options: as the choices faced by an individual increase, sodoes the opportunity for, and likelihood of, error.
� Feedback: visual feedback (e.g. the ability to actually see anaction performed) will reduce the likelihood of human error.
� Adjusters (external or internal): these cover the environmentexperienced by the operatore including temperature, humidity,clothing, mental and physical capabilities, and training.
� Redundancy: this is defined as a real-time repeat of the inves-tigation of whether a human error is occurring.
p) Fault-tree analysis (FTA): It is a deductive technique focusing onone particular accident event and providing a method fordetermining causes of that event. In other words FTA is ananalysis technique that visually models how logical relation-ships between equipment failures, human errors, and externalevents can combine to cause specific accidents. Fault trees areconstructed from events and gates. Basic events can be used torepresent technical failures that lead to accidents while inter-mediate events can represent operator errors that may inten-sify technical failures. The gates of the fault trees can be used torepresent several ways in which machine and human failurescombine to give rise to the accident. For instance, an AND gateimplies that both initial events need to occur in order to giverise to the intermediate event. Conversely, an OR gate meansthat either of two initial events can give rise to the intermediateevent (Ayyub, 2003; Haimes, 2009; Harms-Ringdahl, 2001;Hong et al., 2009; Kontogiannis et al., 2000; Reniers et al.,2005; Vesely, Goldberg, Roberts, & Haasl, 1981; Yuhua &Datao, 2005). Below it is presented a summary of thegraphics most commonly used to construct a fault tree.� Top event and intermediate events: The rectangle is used torepresent the TOP event and any intermediate fault events ina fault tree. The TOP event is the accident that is beinganalyzed. Intermediate events are system states or occur-rences that somehow contribute to the accident.
� Basic events: The circle is used to represent basic events ina fault tree. It is the lowest level of resolution in the faulttree.
� Undeveloped events: The diamond is used to representhuman errors and events that are not further developed inthe fault tree.
� AND gates: The event in the rectangle is the output event ofthe AND gate below the rectangle. The output event asso-ciated with this gate exists only if all of the input events existsimultaneously.
� OR gates: The event in the rectangle is the output event of theOR gate below the rectangle. The output event associatedwith this gate exists if at least one of the input events exists.
� Inhibit gates: The event in the rectangle is the output event ofthe INHIBIT gate below the rectangle. This gate is a specialcase of the AND gate. The output event associated with thisgate exists only if the input event exists and if the qualifyingcondition (the inhibiting condition shown in the oval) issatisfied.
� Transfer symbols: Transfer symbols are used to indicate thatthe fault tree continues on a different page.
Procedure for Fault-Tree Analysis: The procedure for performinga fault-tree analysis consists of the following eight steps:
� Define the system of interest. Specify and clearly define theboundaries and initial conditions of the system for whichfailure information is needed.
� Define the TOP event for the analysis. Specify the problem ofinterest that the analysis will address. This may be a specificquality problem, shutdown, safety issue, etc.
� Define the treetop structure. Determine the events and condi-tions (i.e. intermediate events) that most directly lead to theTOP event.
� Explore each branch in successive levels of detail. Determine theevents and conditions that most directly lead to each inter-mediate event. Repeat the process at each successive level ofthe tree until the fault-tree model is complete.
� Solve the fault tree for the combinations of events contributing tothe TOP event. Examine the fault-tree model to identify all thepossible combinations of events and conditions that can causethe TOP event of interest. A combination of events and condi-tions sufficient and necessary to cause the TOP event is calleda minimal cut set. For example, a minimal cut set for over-pressurizing a tank might have two events: (1) pressurecontroller fails and (2) relief valve fails.
� Identify important dependent failure potentials and adjust themodel appropriately. Study the fault-tree model and the list ofminimal cut sets to identify potentially important dependen-cies among events. Dependencies are single occurrences thatmay cause multiple events or conditions to occur at the sametime. This step is qualitative common cause failure analysis.
� Perform quantitative analysis. Use statistical characterizationsregarding the failure and repair of specific events and condi-tions in the fault-tree model to predict future performance forthe system.
� Use the results in decision-making. Use results of the analysis toidentify the most significant vulnerabilities in the system andto make effective recommendations for reducing the risksassociated with those vulnerabilities.
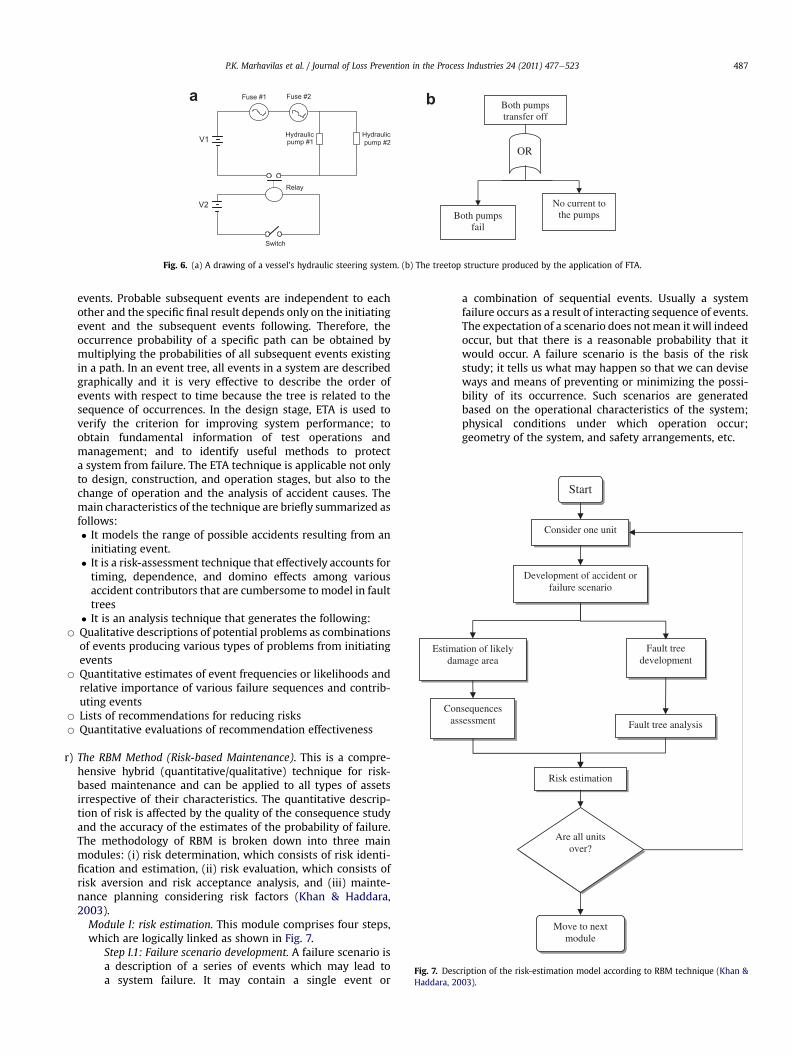
For example a vessel’s hydraulic steering system (Fig. 6a) willfail if both hydraulic pumps fail to operate. The TOP event for theanalysis is “both pumps transfer off”, and the treetop structure isillustrated in Fig. 6b.
q) The ETA method (Event Tree Analysis). Event tree analysis (ETA)is a technique that uses decision trees and logically developsvisual models of the possible outcomes of an initiating event.Furthermore, it is a graphical representation of the logic modelthat identifies and quantifies the possible outcomes followingthe initiating event. The models explore how safeguards andexternal influences, called lines of assurance, affect the path ofaccident chains (Ayyub, 2003; Beim & Hobbs, 1997; Hong et al.,2009). In this method, an initiating event such as the mal-functioning of a system, process, or construction is consideredas the starting point and the predictable accidental results,which are sequentially propagated from the initiating event,are presented in order graphically. ETA is a system modelrepresenting system safety based on the safeties of subevents.It is called an event tree because the graphical presentation ofsequenced events grows like a tree as the number of eventsincrease. An event tree consists of an initiating event, probablesubsequent events and final results caused by the sequence of
Hydraulic pump #1
Hydraulic pump #2
Fuse #1 Fuse #2
V1
V2
Switch
Relay
Both pumps transfer off
Both pumps fail
No current to the pumps
OR
a b
Fig. 6. (a) A drawing of a vessel’s hydraulic steering system. (b) The treetop structure produced by the application of FTA.
Start
Consider one unit
Development of accident or failure scenario
Fault tree development
Estimation of likely damage area
Fault tree analysis
Consequences assessment
Risk estimation
Are all units over?
Move to next module
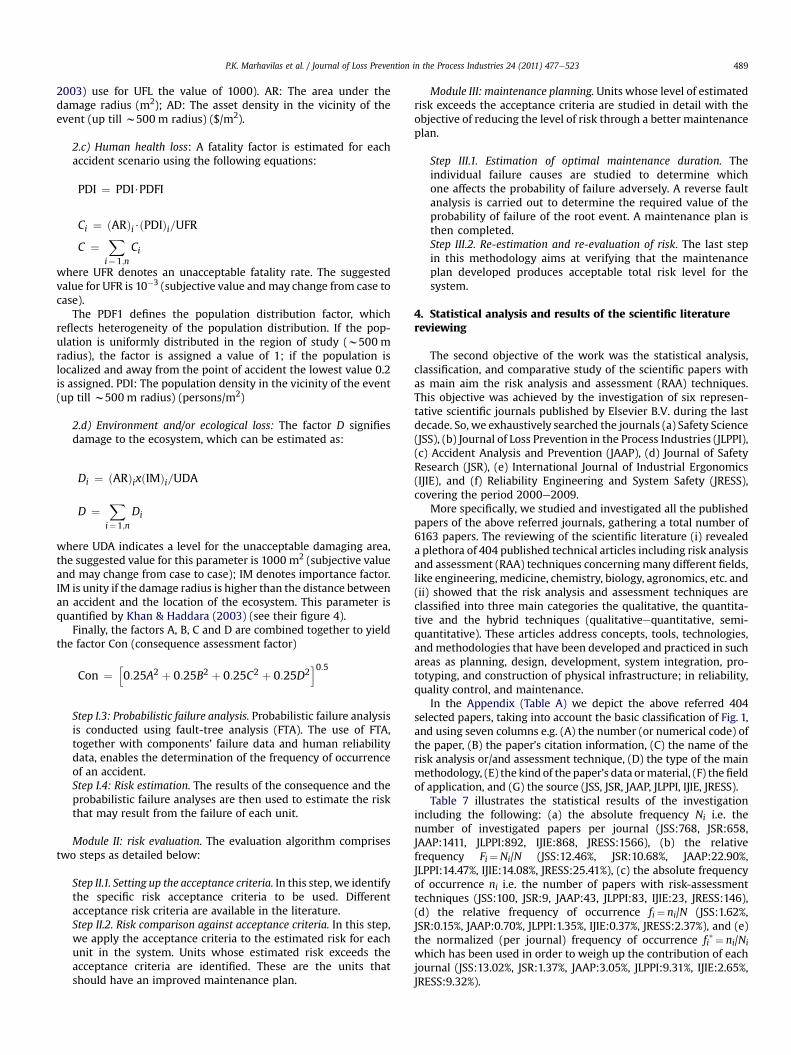
Fig. 7. Description of the risk-estimation model according to RBM technique (Khan &Haddara, 2003).
P.K. Marhavilas et al. / Journal of Loss Prevention in the Process Industries 24 (2011) 477e523 487
events. Probable subsequent events are independent to eachother and the specific final result depends only on the initiatingevent and the subsequent events following. Therefore, theoccurrence probability of a specific path can be obtained bymultiplying the probabilities of all subsequent events existingin a path. In an event tree, all events in a system are describedgraphically and it is very effective to describe the order ofevents with respect to time because the tree is related to thesequence of occurrences. In the design stage, ETA is used toverify the criterion for improving system performance; toobtain fundamental information of test operations andmanagement; and to identify useful methods to protecta system from failure. The ETA technique is applicable not onlyto design, construction, and operation stages, but also to thechange of operation and the analysis of accident causes. Themain characteristics of the technique are briefly summarized asfollows:� It models the range of possible accidents resulting from aninitiating event.
� It is a risk-assessment technique that effectively accounts fortiming, dependence, and domino effects among variousaccident contributors that are cumbersome tomodel in faulttrees
� It is an analysis technique that generates the following:B Qualitative descriptions of potential problems as combinations
of events producing various types of problems from initiatingevents
B Quantitative estimates of event frequencies or likelihoods andrelative importance of various failure sequences and contrib-uting events
B Lists of recommendations for reducing risksB Quantitative evaluations of recommendation effectiveness
r) The RBM Method (Risk-based Maintenance). This is a compre-hensive hybrid (quantitative/qualitative) technique for risk-based maintenance and can be applied to all types of assetsirrespective of their characteristics. The quantitative descrip-tion of risk is affected by the quality of the consequence studyand the accuracy of the estimates of the probability of failure.The methodology of RBM is broken down into three mainmodules: (i) risk determination, which consists of risk identi-fication and estimation, (ii) risk evaluation, which consists ofrisk aversion and risk acceptance analysis, and (iii) mainte-nance planning considering risk factors (Khan & Haddara,2003).Module I: risk estimation. This module comprises four steps,which are logically linked as shown in Fig. 7.
Step I.1: Failure scenario development. A failure scenario isa description of a series of events which may lead toa system failure. It may contain a single event or
a combination of sequential events. Usually a systemfailure occurs as a result of interacting sequence of events.The expectation of a scenario does notmean it will indeedoccur, but that there is a reasonable probability that itwould occur. A failure scenario is the basis of the riskstudy; it tells us what may happen so that we can deviseways and means of preventing or minimizing the possi-bility of its occurrence. Such scenarios are generatedbased on the operational characteristics of the system;physical conditions under which operation occur;geometry of the system, and safety arrangements, etc.

Table 6Quantification scheme for system performance function (Khan & Haddara, 2003).
Class Description Function (operation)
I Very important for system operation 8e10Failure would cause system tostop functioning
II Important for good operation 6e8Failure would cause impaired performanceand adverse consequences
III Required for good operation 4e6Failure may affect the performance and maylead to subsequent failure of the system
IV Optional for good performance 2e4Failure may not affect the performanceimmediately but prolonged failure maycause system to fail
V Optional for operation 0e2Failure may not affect thesystem’s performance
Fig. 8. It is presented the distribution of the relative occurrence-frequencies fi¼ ni/N,concerning papers including RAA techniques, as a result of six scientific journalsreviewing, covering the period of 2000e2009.
P.K. Marhavilas et al. / Journal of Loss Prevention in the Process Industries 24 (2011) 477e523488
Step I.2: Consequence assessment. The objective here is toprioritize equipment and their components on the basisof their contribution to a system failure. Consequenceanalysis involves assessment of likely consequences ifa failure scenario does materialize. Initially, consequencesare quantified in terms of damage radii (the radius of thearea in which the damage would readily occur), damageto property (shattering of window panes, caving ofbuildings), and toxic effects (chronic/acute toxicity,mortality). The calculated damage radii are used to assessthe effect on human health, and environmental andproduction losses. The total consequence assessment isa combination of four major categories:
2.a) System performance loss: Factor A accounts for the system’sperformance loss due to component/unit failure. This is esti-mated semi-qualitatively based on the expert’s opinion. In thework of Khan and Haddara (2003), it is suggested using thefollowing relation for determining the value of this parameter:Ai¼ function (performance), where details of the function aregiven in Table 6.
2.b) Financial loss: Factor B accounts for the damage to the propertyor assets and may be estimated for each accident scenariousing the following relations:
Table 7It presents for the period 2000e2009, the statistical results of six scientific journals investechniques.
Journal Number of investigatedpapers(Absolute frequency Ni)
Relative frequency(Fi¼Ni/N)[%]
Nuris(A
(A) (B) (C)¼ (B)/N (D
Safety science (JSS) 768 12.46 10Journal of Safety Research (JSR) 658 10.68Accident Analysis and
Prevention (JAAP)1411 22.90 4
Journal of Loss Preventionin the Process Industries (JLPPI)
892 14.47 8
International Journal ofIndustrial Ergonomics (IJIE)
868 14.08 2
Reliability Engineering& System Safety (JRESS)
1566 25.41 14
Total 6163 100.00 40
Annotations: Total absolute frequency (i.e. the total number of investigated papers): N¼risk-assessment techniques): n¼ 404; Total relative frequency of occurrence: f¼ 0.0656
Bi ¼ ðARÞi$ðADÞi=UFL
B ¼Xi¼1;n
Bi
where i denotes the number of events (i.e. fire, explosion, toxicrelease, etc.). The UFL in the first equation signifies the level of anunacceptable loss. This value is subjective and may change fromcase to case as per an organization’s criterion (Khan & Haddara,
tigation, concerning papers with as main aim the risk analysis and assessment (RAA)
mber of papers withk-assessment techniquesbsolute frequency of occurrence ni)
Relative frequencyof occurrence(fi¼ ni/N)[%]
Normalized per journalfrequency of occurrence(fi*¼ ni/Ni)[%]
) (E)¼ (D)/N (F)¼ (D)/(B)
0 1.62 13.029 0.15 1.373 0.70 3.05
3 1.35 9.31
3 0.37 2.65
6 2.37 9.32
4 6.56
6163; Total absolute frequency of occurrence (i.e. the total number of papers with(6.56%).
P.K. Marhavilas et al. / Journal of Loss Prevention in the Process Industries 24 (2011) 477e523 489
2003) use for UFL the value of 1000). AR: The area under thedamage radius (m2); AD: The asset density in the vicinity of theevent (up till w500 m radius) ($/m2).
2.c) Human health loss: A fatality factor is estimated for eachaccident scenario using the following equations:
PDI ¼ PDI$PDFI
Ci ¼ ðARÞi$ðPDIÞi=UFRC ¼
Xi¼1;n
Ci
where UFR denotes an unacceptable fatality rate. The suggestedvalue for UFR is 10�3 (subjective value andmay change from case tocase).
The PDF1 defines the population distribution factor, whichreflects heterogeneity of the population distribution. If the pop-ulation is uniformly distributed in the region of study (w500 mradius), the factor is assigned a value of 1; if the population islocalized and away from the point of accident the lowest value 0.2is assigned. PDI: The population density in the vicinity of the event(up till w500 m radius) (persons/m2)
2.d) Environment and/or ecological loss: The factor D signifiesdamage to the ecosystem, which can be estimated as:
Di ¼ ðARÞixðIMÞi=UDA
D ¼Xi¼1;n
Di
where UDA indicates a level for the unacceptable damaging area,the suggested value for this parameter is 1000 m2 (subjective valueand may change from case to case); IM denotes importance factor.IM is unity if the damage radius is higher than the distance betweenan accident and the location of the ecosystem. This parameter isquantified by Khan & Haddara (2003) (see their figure 4).
Finally, the factors A, B, C and D are combined together to yieldthe factor Con (consequence assessment factor)
Con ¼h0:25A2 þ 0:25B2 þ 0:25C2 þ 0:25D2
i0:5
Step I.3: Probabilistic failure analysis. Probabilistic failure analysisis conducted using fault-tree analysis (FTA). The use of FTA,together with components’ failure data and human reliabilitydata, enables the determination of the frequency of occurrenceof an accident.Step I.4: Risk estimation. The results of the consequence and theprobabilistic failure analyses are then used to estimate the riskthat may result from the failure of each unit.
Module II: risk evaluation. The evaluation algorithm comprisestwo steps as detailed below:
Step II.1. Setting up the acceptance criteria. In this step, we identifythe specific risk acceptance criteria to be used. Differentacceptance risk criteria are available in the literature.Step II.2. Risk comparison against acceptance criteria. In this step,we apply the acceptance criteria to the estimated risk for eachunit in the system. Units whose estimated risk exceeds theacceptance criteria are identified. These are the units thatshould have an improved maintenance plan.
Module III: maintenance planning. Units whose level of estimatedrisk exceeds the acceptance criteria are studied in detail with theobjective of reducing the level of risk through a better maintenanceplan.
Step III.1. Estimation of optimal maintenance duration. Theindividual failure causes are studied to determine whichone affects the probability of failure adversely. A reverse faultanalysis is carried out to determine the required value of theprobability of failure of the root event. A maintenance plan isthen completed.Step III.2. Re-estimation and re-evaluation of risk. The last stepin this methodology aims at verifying that the maintenanceplan developed produces acceptable total risk level for thesystem.
4. Statistical analysis and results of the scientific literaturereviewing
The second objective of the work was the statistical analysis,classification, and comparative study of the scientific papers withas main aim the risk analysis and assessment (RAA) techniques.This objective was achieved by the investigation of six represen-tative scientific journals published by Elsevier B.V. during the lastdecade. So, we exhaustively searched the journals (a) Safety Science(JSS), (b) Journal of Loss Prevention in the Process Industries (JLPPI),(c) Accident Analysis and Prevention (JAAP), (d) Journal of SafetyResearch (JSR), (e) International Journal of Industrial Ergonomics(IJIE), and (f) Reliability Engineering and System Safety (JRESS),covering the period 2000e2009.
More specifically, we studied and investigated all the publishedpapers of the above referred journals, gathering a total number of6163 papers. The reviewing of the scientific literature (i) revealeda plethora of 404 published technical articles including risk analysisand assessment (RAA) techniques concerning many different fields,like engineering, medicine, chemistry, biology, agronomics, etc. and(ii) showed that the risk analysis and assessment techniques areclassified into three main categories the qualitative, the quantita-tive and the hybrid techniques (qualitativeequantitative, semi-quantitative). These articles address concepts, tools, technologies,and methodologies that have been developed and practiced in suchareas as planning, design, development, system integration, pro-totyping, and construction of physical infrastructure; in reliability,quality control, and maintenance.
In the Appendix (Table A) we depict the above referred 404selected papers, taking into account the basic classification of Fig. 1,and using seven columns e.g. (A) the number (or numerical code) ofthe paper, (B) the paper’s citation information, (C) the name of therisk analysis or/and assessment technique, (D) the type of the mainmethodology, (E) the kind of the paper’s data ormaterial, (F) the fieldof application, and (G) the source (JSS, JSR, JAAP, JLPPI, IJIE, JRESS).
Table 7 illustrates the statistical results of the investigationincluding the following: (a) the absolute frequency Ni i.e. thenumber of investigated papers per journal (JSS:768, JSR:658,JAAP:1411, JLPPI:892, IJIE:868, JRESS:1566), (b) the relativefrequency Fi¼Ni/N (JSS:12.46%, JSR:10.68%, JAAP:22.90%,JLPPI:14.47%, IJIE:14.08%, JRESS:25.41%), (c) the absolute frequencyof occurrence ni i.e. the number of papers with risk-assessmenttechniques (JSS:100, JSR:9, JAAP:43, JLPPI:83, IJIE:23, JRESS:146),(d) the relative frequency of occurrence fi¼ ni/N (JSS:1.62%,JSR:0.15%, JAAP:0.70%, JLPPI:1.35%, IJIE:0.37%, JRESS:2.37%), and (e)the normalized (per journal) frequency of occurrence fi*¼ ni/Ni
which has been used in order to weigh up the contribution of eachjournal (JSS:13.02%, JSR:1.37%, JAAP:3.05%, JLPPI:9.31%, IJIE:2.65%,JRESS:9.32%).
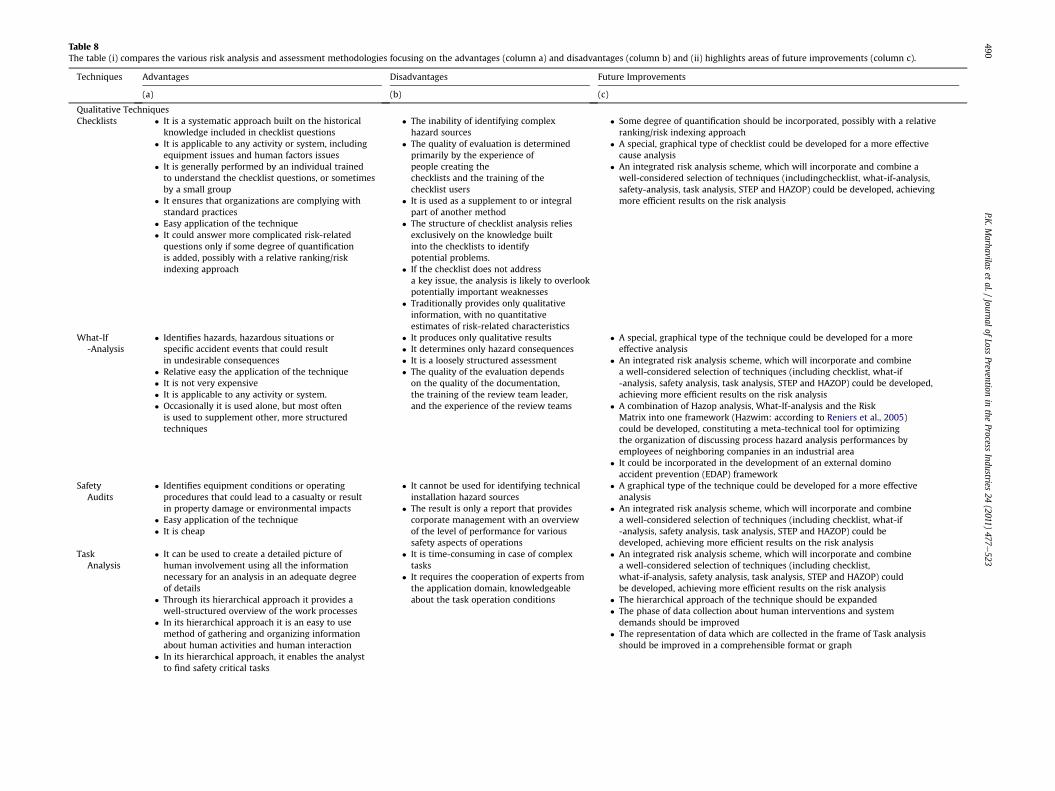
Table 8The table (i) compares the various risk analysis and assessment methodologies focusing on the advantages (column a) and disadvantages (column b) and (ii) highlights areas of future improvements (column c).
Techniques Advantages Disadvantages Future Improvements
(a) (b) (c)
Qualitative TechniquesChecklists � It is a systematic approach built on the historical
knowledge included in checklist questions� It is applicable to any activity or system, includingequipment issues and human factors issues
� It is generally performed by an individual trainedto understand the checklist questions, or sometimesby a small group
� It ensures that organizations are complying withstandard practices
� Easy application of the technique� It could answer more complicated risk-relatedquestions only if some degree of quantificationis added, possibly with a relative ranking/riskindexing approach
� The inability of identifying complexhazard sources
� The quality of evaluation is determinedprimarily by the experience ofpeople creating thechecklists and the training of thechecklist users
� It is used as a supplement to or integralpart of another method
� The structure of checklist analysis reliesexclusively on the knowledge builtinto the checklists to identifypotential problems.
� If the checklist does not addressa key issue, the analysis is likely to overlookpotentially important weaknesses
� Traditionally provides only qualitativeinformation, with no quantitativeestimates of risk-related characteristics
� Some degree of quantification should be incorporated, possibly with a relativeranking/risk indexing approach
� A special, graphical type of checklist could be developed for a more effectivecause analysis
� An integrated risk analysis scheme, which will incorporate and combine awell-considered selection of techniques (includingchecklist, what-if-analysis,safety-analysis, task analysis, STEP and HAZOP) could be developed, achievingmore efficient results on the risk analysis
What-If-Analysis
� Identifies hazards, hazardous situations orspecific accident events that could resultin undesirable consequences
� Relative easy the application of the technique� It is not very expensive� It is applicable to any activity or system.� Occasionally it is used alone, but most oftenis used to supplement other, more structuredtechniques
� It produces only qualitative results� It determines only hazard consequences� It is a loosely structured assessment� The quality of the evaluation dependson the quality of the documentation,the training of the review team leader,and the experience of the review teams
� A special, graphical type of the technique could be developed for a moreeffective analysis
� An integrated risk analysis scheme, which will incorporate and combinea well-considered selection of techniques (including checklist, what-if-analysis, safety analysis, task analysis, STEP and HAZOP) could be developed,achieving more efficient results on the risk analysis
� A combination of Hazop analysis, What-If-analysis and the RiskMatrix into one framework (Hazwim: according to Reniers et al., 2005)could be developed, constituting a meta-technical tool for optimizingthe organization of discussing process hazard analysis performances byemployees of neighboring companies in an industrial area
� It could be incorporated in the development of an external dominoaccident prevention (EDAP) framework
SafetyAudits
� Identifies equipment conditions or operatingprocedures that could lead to a casualty or resultin property damage or environmental impacts
� Easy application of the technique� It is cheap
� It cannot be used for identifying technicalinstallation hazard sources
� The result is only a report that providescorporate management with an overviewof the level of performance for varioussafety aspects of operations
� A graphical type of the technique could be developed for a more effectiveanalysis
� An integrated risk analysis scheme, which will incorporate and combinea well-considered selection of techniques (including checklist, what-if-analysis, safety analysis, task analysis, STEP and HAZOP) could bedeveloped, achieving more efficient results on the risk analysis
TaskAnalysis
� It can be used to create a detailed picture ofhuman involvement using all the informationnecessary for an analysis in an adequate degreeof details
� Through its hierarchical approach it provides awell-structured overview of the work processes
� In its hierarchical approach it is an easy to usemethod of gathering and organizing informationabout human activities and human interaction
� In its hierarchical approach, it enables the analystto find safety critical tasks
� It is time-consuming in case of complextasks
� It requires the cooperation of experts fromthe application domain, knowledgeableabout the task operation conditions
� An integrated risk analysis scheme, which will incorporate and combinea well-considered selection of techniques (including checklist,what-if-analysis, safety analysis, task analysis, STEP and HAZOP) couldbe developed, achieving more efficient results on the risk analysis
� The hierarchical approach of the technique should be expanded� The phase of data collection about human interventions and systemdemands should be improved
� The representation of data which are collected in the frame of Task analysisshould be improved in a comprehensible format or graph
P.K.M
arhavilaset
al./Journal
ofLoss
Preventionin
theProcess
Industries24
(2011)477
e523
490

STEPtechnique
� It provides a valuable overview of the timing andsequence of events/actions that contributed to theaccident
� It provides a reconstruction of the harm process byplotting the sequence of events that contributed tothe accident
� It is time-consuming in case ofcomplex sequence of events
� It produces only qualitative results
� An integrated risk analysis scheme, which will incorporate andcombine a well-considered selection of techniques (including checklist,what-if-analysis, safety analysis ask analysis, STEP and HAZOP) couldbe developed, achieving more e cient results on the risk analysis
� A special, graphical type of the chnique could be developed for amore effective analysis
HAZOP � It is a formalized and systematic methodology toidentify and document hazards through imaginativethinking
� Identifies system deviations and their causes thatcan lead to undesirable consequences and determinerecommended actions to reduce the frequency and/orconsequences of the deviations
� It determines hazard causes andhazard consequences
� Very popular technical method� It is applicable to any system or procedure� It is a highly structured assessment relying on guidewords to generate a comprehensive review
� It is expensive and difficult� It requires a multidisciplinary teamof experts to be used
� It produces only qualitative results� It is a time-consuming technique
� An integrated risk analysis sche e, which will incorporate and combinea well-considered selection of t hniques (including checklist,what-if-analysis, safety analysis ask analysis, STEP and HAZOP)could be developed, achieving m re efficient results on the risk analysis
� A combination of Hazop analysi WhateIf-analysis and the Risk Matrixinto one framework (Hazwim: a cording to Reniers et al., 2005) could bedeveloped, constituting a meta- chnical tool for optimizing theorganization of discussing proce hazard analysis performances byemployees of neighboring comp nies in an industrial area
� It could be incorporated in the velopment of an external domino accidentprevention (EDAP) framework
� The technique could be extende by the development of dominoeffects-specific guidewords and arameters
Quantitative TechniquesPRAT � Easy application of the technique
� It is a quantitative technique� The mathematical risk evaluation� Safe results, based on the recordeddata of undesirable events or accidents
� It combines risk analysis with risk evaluation� It can be incorporated in databases� It can help with their numerical results otherrisk-assessment techniques
� It can help the safety managers/engineers topredict hazards, unsafe conditions andundesirable events/situations, and also toprevent fatal accidents.
� It can be applied to any company/corporation orproductive procedure
� It requires efficient safety managersto record the undesirable events
� It is a time-consuming technique inorder to record data of undesirableevents of a company
� The results depend on the opinion ofexpert safety managers or productionengineers
� It could be incorporated in data ses, where statistic information of accidentsare being registered, in order to elp other risk-assessment techniques
� It could be incorporated in com ter automated toolkits in order to identifythe weak spots in an industrial ea
� It could be incorporated to an in egrated quantitative risk analysis scheme,which will combine a well-cons ered selection of widespread quantitativetechniques
� It could be combined with stoch stic (like time-series (TSP)) and quantitativerisk-assessment (like PRAT, SRE ethodologies, achieving a more realisticforecasting and risk-assessment rocess in the worksites (see the proposedPRAT-TSP-SRE scheme of Marha ilas & Koulouriotis, submitted for publication)
DMRA � Easy application of the technique� Safe results, based on the recorded dataof undesirable events or accidents
� It combines risk analysis with risk evaluation� It can help the safety managers/engineersto predict hazards, unsafe conditions andundesirable events/situations, and also to preventfatal accidents.
� It can be applied to any company/corporationor productive procedure
� It is a quantitative and also a graphicalmethod which can create liability issues and helpthe risk managers to prioritize andmanage key risks
� The results depend on the opinion ofexpert safety managers or productionengineers
� A combination of Hazop analysi WhateIf-analysis and the Risk Matrix intoone framework (Hazwim: accor ng to Reniers et al., 2005) could be developed,constituting a meta-technical to for optimizing the organization of discussingprocess hazard analysis perform nces by employees of neighboring companiesin an industrial area
� It could be incorporated in the velopment of an external domino accidentprevention (EDAP) framework
� It could be incorporated in data ses, where statistic information of accidentsare being registered, in order to elp other risk-assessment techniques
� It could be incorporated in com ter automated toolkits in order to identifythe weak spots in an industrial ea
� It could be incorporated to an in egrated quantitative risk analysis scheme,which will combine a well-cons ered selection of widespread quantitativetechniques
(continued on next page)
P.K.M
arhavilaset
al./Journal
ofLoss
Preventionin
theProcess
Industries24
(2011)477
e523
491
, tffite
mec, tos,ctessade
dp
bahpuartid
a) mpv
s,diola
de
bahpuartid
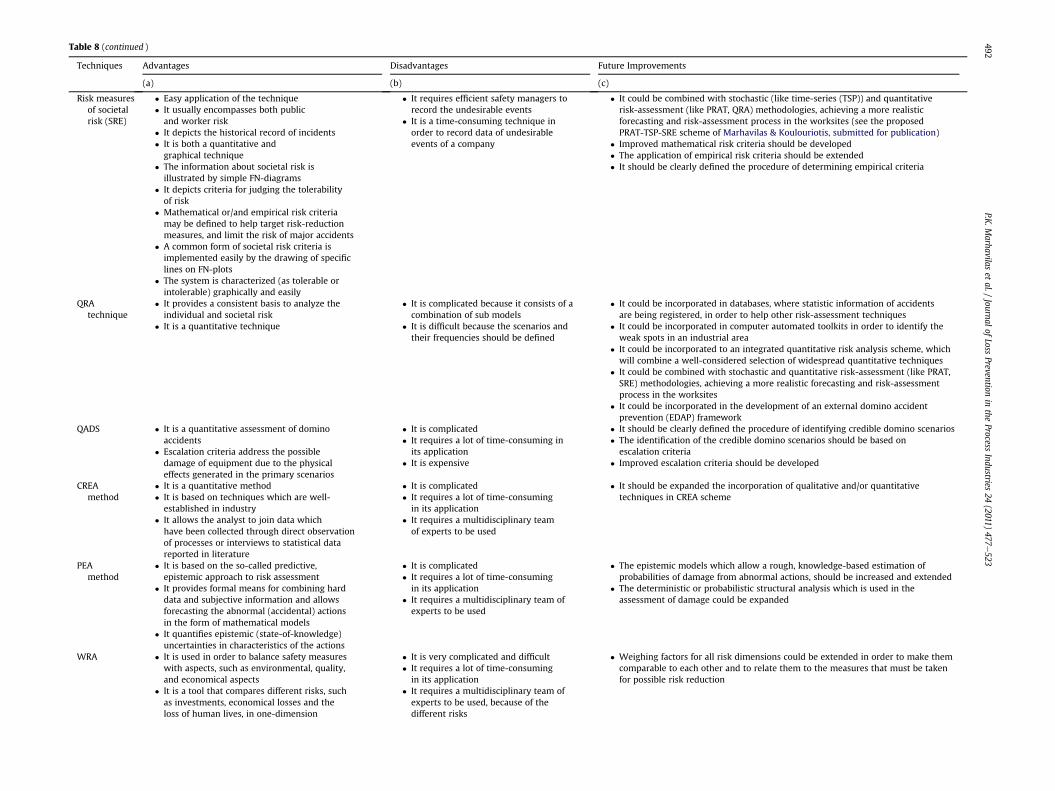
Table 8 (continued )
Techniques Advantages Disadvantages Future Improvements
(a) (b) (c)
Risk measuresof societalrisk (SRE)
� Easy application of the technique� It usually encompasses both publicand worker risk
� It depicts the historical record of incidents� It is both a quantitative andgraphical technique
� The information about societal risk isillustrated by simple FN-diagrams
� It depicts criteria for judging the tolerabilityof risk
� Mathematical or/and empirical risk criteriamay be defined to help target risk-reductionmeasures, and limit the risk of major accidents
� A common form of societal risk criteria isimplemented easily by the drawing of specificlines on FN-plots
� The system is characterized (as tolerable orintolerable) graphically and easily
� It requires efficient safety managers torecord the undesirable events
� It is a time-consuming technique inorder to record data of undesirableevents of a company
� It could be combined with stochastic (like time-series (TSP)) and quantitativerisk-assessment (like PRAT, QRA) methodologies, achieving a more realisticforecasting and risk-assessment process in the worksites (see the proposedPRAT-TSP-SRE scheme of Marhavilas & Koulouriotis, submitted for publication)
� Improved mathematical risk criteria should be developed� The application of empirical risk criteria should be extended� It should be clearly defined the procedure of determining empirical criteria
QRAtechnique
� It provides a consistent basis to analyze theindividual and societal risk
� It is a quantitative technique
� It is complicated because it consists of acombination of sub models
� It is difficult because the scenarios andtheir frequencies should be defined
� It could be incorporated in databases, where statistic information of accidentsare being registered, in order to help other risk-assessment techniques
� It could be incorporated in computer automated toolkits in order to identify theweak spots in an industrial area
� It could be incorporated to an integrated quantitative risk analysis scheme, whichwill combine a well-considered selection of widespread quantitative techniques
� It could be combined with stochastic and quantitative risk-assessment (like PRAT,SRE) methodologies, achieving a more realistic forecasting and risk-assessmentprocess in the worksites
� It could be incorporated in the development of an external domino accidentprevention (EDAP) framework
QADS � It is a quantitative assessment of dominoaccidents
� Escalation criteria address the possibledamage of equipment due to the physicaleffects generated in the primary scenarios
� It is complicated� It requires a lot of time-consuming in
its application� It is expensive
� It should be clearly defined the procedure of identifying credible domino scenarios� The identification of the credible domino scenarios should be based on
escalation criteria� Improved escalation criteria should be developed
CREAmethod
� It is a quantitative method� It is based on techniques which are well-established in industry
� It allows the analyst to join data whichhave been collected through direct observationof processes or interviews to statistical datareported in literature
� It is complicated� It requires a lot of time-consumingin its application
� It requires a multidisciplinary teamof experts to be used
� It should be expanded the incorporation of qualitative and/or quantitativetechniques in CREA scheme
PEAmethod
� It is based on the so-called predictive,epistemic approach to risk assessment
� It provides formal means for combining harddata and subjective information and allowsforecasting the abnormal (accidental) actionsin the form of mathematical models
� It quantifies epistemic (state-of-knowledge)uncertainties in characteristics of the actions
� It is complicated� It requires a lot of time-consumingin its application
� It requires a multidisciplinary team ofexperts to be used
� The epistemic models which allow a rough, knowledge-based estimation ofprobabilities of damage from abnormal actions, should be increased and extended
� The deterministic or probabilistic structural analysis which is used in theassessment of damage could be expanded
WRA � It is used in order to balance safety measureswith aspects, such as environmental, quality,and economical aspects
� It is a tool that compares different risks, suchas investments, economical losses and theloss of human lives, in one-dimension
� It is very complicated and difficult� It requires a lot of time-consumingin its application
� It requires a multidisciplinary team ofexperts to be used, because of thedifferent risks
� Weighing factors for all risk dimensions could be extended in order to make themcomparable to each other and to relate them to the measures that must be takenfor possible risk reduction
P.K.M
arhavilaset
al./Journal
ofLoss
Preventionin
theProcess
Industries24
(2011)477
e523
492

Hybrid TechniquesHEAT/HFEA � It is a commonly utilized tool for investigating
human contributions to accidents under awidespread evaluation scheme
� It is very complicated and difficult � Sufficient mathematical tools for incorporating human factors in system reliabilityanalyses should be developed
� Practical approaches of quantifying human error within the accident process shouldbe developed
FTA � It identifies and models combinationsof equipment failures, human errors,and external conditions that can resultin an accident
� It is performed primarily by an individualworking with system experts throughinterviews and field inspections
� It is a deductive modeling approach� It produces quantitative and qualitativeresults
� It is a highly structured method� It determines accidents causes in depth� It is generally applicable for almost everytype of risk-assessment application
� It can be used as an effective root causeanalysis tool in several applications
� It is very complicated and difficult� It requires a lot of time-consumingin its application
� It is expensive� It is used most often as a system-levelrisk-assessment technique
� It could be combined with other accident scenario analysis techniques (ETA,Petri-Nets) in order to achieve the accident reconstruction, where the human factoris involved
� It should be used to the development of accident analysis techniques whichthoroughly investigates the accidents
ETA � Identifies various sequences of events,both failures and successes that can leadto an accident
� It is a graphical representation of thelogic model that identifies and quantifiesthe possible outcomes following theinitiating event
� It is an inductive modeling approach� It produces quantitative and qualitativeresults
� It is applicable not only to design,construction, and operation stages,but also to the change of operationand the analysis of accident causes
� It is very complicated and difficult� It requires a lot of time-consumingin its application
� It is expensive
� It could be combined with other accident scenario analysis techniques (FTA,Petri-Nets) in order to achieve the accident reconstruction, where the humanfactor is involved
� It should be used to the development of accident analysis techniques whichthoroughly investigates the accidents
RBM � It is a comprehensive quantitativeand qualitative technique
� It can be applied to all types of assetsirrespective of their characteristic
� The quantitative description of riskis affected by the quality of theconsequence study and the accuracyof the estimates of the probability of failure
� It could be incorporated to an integrated quantitative risk analysis scheme,which will combine a well-considered selection of widespread quantitativetechniques
� It could be improved a the combination scheme with other qualitative andquantitative techniques, as FTA, ETA, PRAT
P.K.M
arhavilaset
al./Journal
ofLoss
Preventionin
theProcess
Industries24
(2011)477
e523
493
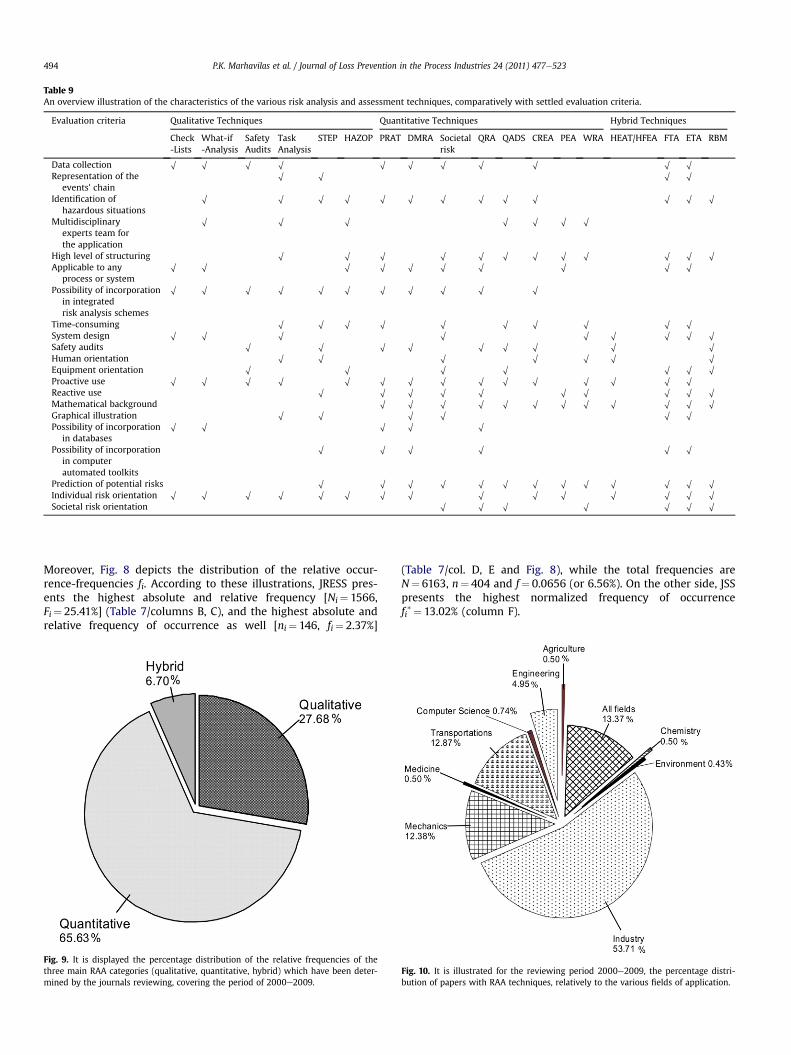
Table 9An overview illustration of the characteristics of the various risk analysis and assessment techniques, comparatively with settled evaluation criteria.
Evaluation criteria Qualitative Techniques Quantitative Techniques Hybrid Techniques
Check-Lists
What-if-Analysis
SafetyAudits
TaskAnalysis
STEP HAZOP PRAT DMRA Societalrisk
QRA QADS CREA PEA WRA HEAT/HFEA FTA ETA RBM
Data collection O O O O O O O O O O ORepresentation of the
events’ chainO O O O
Identification ofhazardous situations
O O O O O O O O O O O O O
Multidisciplinaryexperts team forthe application
O O O O O O O
High level of structuring O O O O O O O O O O O OApplicable to any
process or systemO O O O O O O O O O
Possibility of incorporationin integratedrisk analysis schemes
O O O O O O O O O O O
Time-consuming O O O O O O O O O OSystem design O O O O O O O O OSafety audits O O O O O O O O OHuman orientation O O O O O O OEquipment orientation O O O O O O OProactive use O O O O O O O O O O O O O O OReactive use O O O O O O O O O OMathematical background O O O O O O O O O O O OGraphical illustration O O O O O OPossibility of incorporation
in databasesO O O O O
Possibility of incorporationin computerautomated toolkits
O O O O O O
Prediction of potential risks O O O O O O O O O O O O OIndividual risk orientation O O O O O O O O O O O O O O OSocietal risk orientation O O O O O O O
P.K. Marhavilas et al. / Journal of Loss Prevention in the Process Industries 24 (2011) 477e523494
Moreover, Fig. 8 depicts the distribution of the relative occur-rence-frequencies fi. According to these illustrations, JRESS pres-ents the highest absolute and relative frequency [Ni¼ 1566,Fi¼ 25.41%] (Table 7/columns B, C), and the highest absolute andrelative frequency of occurrence as well [ni¼ 146, fi¼ 2.37%]
Fig. 9. It is displayed the percentage distribution of the relative frequencies of thethree main RAA categories (qualitative, quantitative, hybrid) which have been deter-mined by the journals reviewing, covering the period of 2000e2009.
(Table 7/col. D, E and Fig. 8), while the total frequencies areN¼ 6163, n¼ 404 and f¼ 0.0656 (or 6.56%). On the other side, JSSpresents the highest normalized frequency of occurrencefi*¼ 13.02% (column F).
Fig. 10. It is illustrated for the reviewing period 2000e2009, the percentage distri-bution of papers with RAA techniques, relatively to the various fields of application.

Fig. 11. It is depicted for the reviewing period of 2000e2009 the yearly percentagedistribution of papers with RAA, relatively to the three main RAA classes (qualitative,quantitative, hybrid).
P.K. Marhavilas et al. / Journal of Loss Prevention in the Process Industries 24 (2011) 477e523 495
In Table 8 we compare the various risk analysis and assessmentmethodologies focusing on the advantages (column a) and disad-vantages (column b) and we highlight as well, areas of futureimprovements (column c). To continue, in Table 9 we present anoverview of the characteristics of the various risk analysis andassessment techniques, comparatively with a list of several settledevaluation criteria.
In Fig. 9 we display the percentage distribution of the relativefrequencies of the three main RAA classes (qualitative, quantitative,hybrid) which have been determined by the journals reviewing,covering the period of 2000e2009. The pie-chart shows that the“quantitative” methods present the highest relative frequency(quantitative: 65.63%, qualitative: 27.68%, hybrid: 6.70%).
Furthermore, in Fig. 10 we show the percentage distribution ofthe papers including RAA techniques, relatively to the various fieldsof application (Agriculture: 0.50%, Chemistry: 0.50%, Environment:0.50%, Industry: 53.71%, Mechanics: 12.38%, Medicine: 0.50%,Transportations: 12.87%, Computer Science: 0.74%, Engineering:4.95%, All fields: 13.37%). The main discernible feature of this pie-chart is that the field of “Industry” concentrates the greatestnumber of the papers with RAA methods.
The bar-chart of Fig. 11 depicts for the period 2000e2009 theyearly percentage distribution of the papers with RAA, relatively tothe three main RAA classes (qualitative, quantitative, hybrid). Thegraph shows that there is a gradual increasing (with intensiveinclination) of papers including quantitative techniques from 2003to 2009 with a maximum percentage amount (16.70%) in year2009. On the other side the distribution of the papers with“hybrid” techniques remains constantly low (�1.6%) during theentire period of reviewing (2000e2009), while the papers with“qualitative” techniques present a low level distribution (�3.3%)during the interval 2000e2008 but an intensive increase in year2009 (8.9%).
5. Conclusions
The objective of this work is to analyze and classify themain riskanalysis and assessment (RAA) methods by reviewing the scientificliterature. It consists of two parts: a) the overview of the main RAAmethodologies and b) the classification and statistical analysis ofthe corresponding scientific papers published by six representativescientific journals of Elsevier B.V. covering the last decade(2000e2009).
The main results and conclusions of this work are summarizedto the following points:
� The reviewing of the scientific literature, revealed a plethora ofpublished technical articles on safety, and risk analysis referredto many different fields, like engineering, mechanics, industry,medicine, chemistry, biology, agronomics, etc.
� These articles address concepts, tools, technologies, andmethodologies that have been developed and practiced in suchareas as planning, design, development, system integration,prototyping, and construction of physical infrastructure, inreliability, quality control, and maintenance.
� The RAA techniques are classified into three main categories:(a) the qualitative, (b) the quantitative, and (c) the hybridtechniques (qualitativeequantitative, semi-quantitative).
� The papers with RAA techniques still constitute a very smallpart of the scientific literature i.e. taking into account the abovereferred investigationwhich covers the period 2000e2009, thetotal relative frequency is only 6.56%.
� The quantitative methods present the highest relativefrequency (65.63%) while the qualitative a lower one (27.68%).Furthermore the hybrid methods remain constantly at a verylow level (6.70%) during the entire processing period of2000e2009.
� The qualitative techniques are based both on analytical esti-mation processes, and on the safety managerseengineersability. According to quantitative techniques, the risk can beconsidered as a quantity, which can be estimated andexpressed by a mathematical relation, under the help of realaccidents’ data recorded in a work site. The hybrid techniques,present a great complexity due to their ad hoc character thatprevents a wide spreading.
� The field of “Industry” concentrates the greatest number ofRAA methods (53.71%), while other fields with significantpercentages are “Mechanics” (12.38%) and “Transportations”(12.87%).
� The yearly percentage distribution of papers with RAA showsthat there is a gradual increasing (with intensive inclination) ofpapers including quantitative techniques from 2003 to 2009with a maximum percentage amount (16.70%) in year 2009.The distribution of “hybrid” techniques remains constantly low(�1.6%) during all the reviewing period (2000e2009), whilethe “qualitative” techniques present a low level distribution(�3.3%) during the interval 2000e2008 but an intensiveincrease in year 2009 (8.9%).
A general basic ascertainment is that all of this knowledgehas not been fully shared among the various scientific fields, sowe think that the scientific community faces with the challengeto duplicate and transfer the commonalities from one field toanother.
Acknowledgments
We acknowledge C. Mitrakas, Production & Management Engi-neer, for his help on the preparation of some drawings.
Appendix
The following table presents the classification results of the404 papers with as main aim the risk analysis and assessment(RAA) techniques, which were determined by the investigationof 6163 papers of six scientific journals covering the period2000e2009.

Table A.
Nr Paper Citation Technique’s name Method’s type Type of paper dataor material
Field of application Journal
(A) (B) (C) (D) (E) (F) (G)
1 Determination of the optimal escape routes ofunderground mine networks in emergency cases(Jalali & Noroozi, 2009)
Double-Sweep, FloydWarshall and Dantzigalgorithms
Quantitative Case study Mechanics JSS
2 The relationship between culture and safety on offshoresupply vessels (Antonsen, 2009)
Checklists/Safety Audits Quantitative& Qualitative
Empirical data Industry JSS
3 Incorporating organizational factors into probabilisticrisk assessment of complex socio-technical systems:Principles and theoretical foundations (Mohaghegh& Mosleh, 2009a,b)
Socio-technical risk Quantitative Theoretical foundations& Empirical data
Mechanics(socio-technical systems)
JSS
4 The development of a more risk-sensitive and flexibleairport safety area strategy: Part I & Part II. (Wong,Pitfield, Caves, & Appleyard, 2009a,b)
Quantitative Accidents data& aviation database
Mechanics (aviation) JSS
5 Classification of errors contributing to rail incidents andaccidents: A comparison of two human erroridentification techniques (Baysari, Caponecchia,McIntosh, & Wilson, 2009)
HFACS kai TRACEr Quantitative& Qualitative
Accidents data Industry JSS
6 Economic cost of occupational accidents: Evidence froma small island economy (Shalini, 2009)
Quantitative& Qualitative
Empirical data Industry JSS
7 Toward an evaluation of accident investigationmethodsin terms of their alignment with accident causationmodels (Katsakiori, Sakellaropoulos, &Manatakis, 2009)
FTA, MORT, MES, SCAT,CTM, OARU, TRIPOD, AEB,ISIM, NSB, WAIT, HSG245
Hybrid Theoretical foundations& Empirical data
Industry JSS
8 The implementation of a human factors engineeringchecklist for humanesystem interfaces upgrade innuclear power plants (Jou et al., 2009)
Checklists Quantitative& Qualitative
Empirical data(Case study)
Mechanics(nuclear power plants)
JSS
9 Severity analysis of Indian coal mine accidents e Aretrospective study for 100 years (Maiti, Khanzode,& Ray, 2009)
Event evaluationalgorithm (EEA)
Quantitative Accidents data Mechanics (coal mine) JSS
10 Working safely with foreign contractors and personnel(Schubert & Dijkstra, 2009)
Qualitative Empirical data Industry JSS
11 Designing of integrated quality and safety managementsystem (IQSMS) for shipping operations (Celik, 2009)
IQMS Quantitative Theoretical foundations Mechanics JSS
12 Indicators to compare risk expressions, grouping, andrelative ranking of risk for energy systems: Applicationwith some accidental events from fossil fuels (Colli,Arellano, Kirchsteiger, & Ale, 2009; Colli, Serbanescu,& Ale, 2009)
Probabilistic RiskAnalysis (PRA)
Quantitative Accidents data Mechanics JSS
13 General assessment of the occupational accidents thatoccurred in Turkey between the years 2000 and 2005(Unsar & Sut, 2009)
Quantitative Accidents data Mechanics JSS
14 Portable ladder assessment tool development andvalidation e Quantifying best practices in the field(Dennerlein, Ronk, & Perry, 2009)
Checklists Quantitative Empirical data Mechanics(Constructions)
JSS
15 The weighted risk analysis (Suddle, 2009) WRA Quantitative Empirical data(Case study)
Engineering JSS
16 A proactive approach to human error detection andidentification in aviation and air traffic control(Kontogiannis & Malakis, 2009)
Qualitative Theoretical foundations Mechanics (aviation) JSS
17 A fuzzy multi-attribute model for risk evaluation inworkplaces (Grassi, Gamberini, Mora, & Rimini, 2009)
Fuzzy multi-attribute Quantitative Theoretical foundations Industry JSS
18 Method to assess and optimize dependability ofcomplex macro-systems: Application to a railwaysignaling system (Vernez & Vuille, 2009)
Functional failure mode,effects and criticalityanalysis (FMECA)
Quantitative Accidents data Industry (railway) JSS
19 A real-time warning model for teamwork performanceand system safety in nuclear power plants (Hwang et al.,2009)
Real-time warningmodel (RTWM)
Quantitative Theoretical foundations Mechanics(nuclear power plants)
JSS
P.K.M
arhavilaset
al./Journal
ofLoss
Preventionin
theProcess
Industries24
(2011)477
e523
496

20 A simultaneous equations model of crash frequency bycollision type for rural intersections (Ye, Pendyala,Washington, Konduri, & Oh, 2009)
The Negative BinomialRegression model
Quantitative Accidents data Industry (transportation) JSS
21 Effectiveness of temporary traffic control measures inhighway work zones (Li & Bai, 2009)
Binary logisticregression method
Quantitative Accidents data Industry (transportation) JSS
22 Safety management systems: Performance differencesbetween adopters and non-adopters (Bottani, Monica,& Vignali, 2009)
Confirmatory factoranalysis (CFA)
Qualitative Empirical data Industry JSS
23 Economic assessment of human errors inmanufacturing environment (Liu, Hwang, & Liu, 2009;Liu, Guo, Rogers, & Mannan, 2009; Liu et al., 2009)
Cost estimationmodel
Quantitative Empirical data Industry (constructions) JSS
24 A Bayesian network analysis of workplace accidentscaused by falls from a height (Martín, Rivas, Matías,Taboada, & Argüelles, 2009)
Bayesian networkanalysis
Quantitative Empirical data Industry JSS
25 Quantitative analysis of ATM safety issues usingretrospective accident data: The dynamic risk modelingproject (Leva et al., 2009)
PROCOS stochasticmodel
Quantitative Accidents data/Theoreticalfoundations
Industry (transportation) JSS
26 Toward system for the management of safety on boardartisanal fishing vessels: Proposal for checklists andtheir application (Piniella & Fernández-Engo)
Checklists Qualitative Empirical data Industry (navigation) JSS
27 Injury and loss concentration by sinkings in fishingfleets (Perez-Labajos, Blanco, Azofra, Achutegui,& Eguía, 2009)
Quantitative Empirical data(Case study)
Industry (fishing) JSS
28 Study on the methodology for evaluating urban andregional disaster carrying capacity and its application(Chen, Tao, & Zhang, 2009)
UR-DCC evaluationmodel
Quantitative Empirical data Environment JSS
29 A method to identify strategies for the improvement ofhuman safety behavior by considering safety climateand personal experience (Zhou, Fang, & Wang, 2008)
Bayesian networkanalysis
Quantitative Empirical data Industry (constructions) JSS
30 Knowledge transfer in organizational reliabilityanalysis: From post-accident studies to normaloperations studies (Etienne, 2008)
Qualitative Empirical data Industry JSS
31 The impact of prevention measures and organizationalfactors on occupational injuries (Arocena, Núñez,& Villanueva, 2008)
Negative binomialregression
Quantitative Empirical data Industry JSS
32 Analysis of trample disaster and a case study e Mihongbridge fatality in China in 2004 (Zhen, Mao, & Yuan,2008)
Soft SystematicMethodology (SSM)
Quantitative Accidents data Mechanics JSS
33 Toward risk assessment for crane activities (Aneziris,Papazoglou, Baksteen, et al., 2008; Aneziris, Papazoglou,Mud, et al., 2008)
Workgroup OccupationalRisk Model (WORM)
Quantitative Accidents data Mechanics JSS
34 Expert judgment study for placement ladder bowtie(Kurowicka, Cooke, Goossens, & Ale, 2008)
Bowtie diagram Quantitative Accidents data Mechanics JSS
35 The exposureedamage approach in the quantificationof occupational risk in workplaces involving dangeroussubstances (Papadakis & Chalkidou, 2008)
COMAH Quantitative Accidents data (case study) Industry JSS
36 Suicide prevention in railway systems: Application ofa barrier approach (Rådbo, Svedung, & Andersson,2008)
FTA Hybrid Empirical data Industry (railway) JSS
37 Impact of enforcement on traffic accidents andfatalities: A multivariate multilevel analysis (Yannis,Papadimitriou, & Antoniou, 2008)
Poisson multivariatemultilevel modell
Quantitative Accidents data Industry (transportation) JSS
38 A fuzzy analytic network process (ANP) model toidentify faulty behavior risk (FBR) in work system(Da�gdeviren, Yüksel, & Kurt, 2008)
FBR, ANP Quantitative Fuzzy sets Industry JSS
39 Injuries in U.S. mining operations e A preliminary riskanalysis (Komljenovic, Groves, & Kecojevic, 2008)
Holistic risk-managementprocess
Quantitative Accidents data Mechanics JSS
40 Assessment of safety management information systemsfor general contractors (Jung, Kang, Kim, & Park, 2008)
SMIS assessment process Quantitative Empirical data Industry (constructions) JSS
(continued on next page)
P.K.M
arhavilaset
al./Journal
ofLoss
Preventionin
theProcess
Industries24
(2011)477
e523
497

Table A. (continued )
Nr Paper Citation Technique’s name Method’s type Type of paper dataor material
Field of application Journal
(A) (B) (C) (D) (E) (F) (G)
41 Explaining safe work practices in aviation linemaintenance (Pettersen & Aase, 2008)
Qualitative Empirical data Mechanics (aviation) JSS
42 Quantifying occupational risk: The development of anoccupational risk model (Ale et al., 2008)
Occupational RiskModel (ORM)
Quantitative Accidents data Engineering JSS
43 Quantified risk assessment for fall from height (Aneziris,Papazoglou, Baksteen, et al., 2008; Aneziris, Papazoglou,Mud, et al., 2008)
Workgroup OccupationalRisk Model (WORM)
Quantitative Accidents data Mechanics JSS
44 Considerations in developing complete and quantifiedmethods for risk assessment (van Duijne et al., 2008)
Quantitative Theoretical founda ns Engineering JSS
45 DomPrevPlanning: User-friendly software for planningdomino effects prevention (Reniers & Dullaert, 2007)
DPP Quantitative& Qualitative
Accidents data Industry(chemical installations)
JSS
46 Driving task analysis as a tool in traffic safety researchand practice (Fastenmeier & Gstalter, 2007)
TA Qualitative Theoretical founda ns Industry (transportation) JLPPI
47 Assessment of hazardous material risks for rail yardsafety (Glickman & Erkut, 2007)
FTA Hybrid Empirical data Industry (railway) JSS
48 A prospective hazard and improvement analyticapproach to predicting the effectiveness of medicationerror interventions (Karnon et al., 2007)
PHIA Quantitative Facts Medicine JSS
49 Exploring the organizational preconditions foroccupational accidents in food industry: A qualitativeapproach (Stave & Törner, 2007)
Grounded TheoryApproach
Qualitative Accidents data Industry (food) JSS
50 The contribution of qualitative analyses of occupationalhealth and safety interventions: An example througha study of external advisory interventions (Baril-Gingras, Bellemare, & Brun, 2006)
Longitudinal qualitativeanalysis method
Qualitative Theoretical founda nsand Empirical data
Engineering JSS
51 Perception and observation of residential safety duringearthquake exposure: A case study (Akason, Olafsson,& Sigbjörnsson, 2006)
Quantitative& Qualitative
Facts Mechanics JSS
52 Toward a causal model for air transport safetydanongoing research project (Ale et al., 2006)
FTA and Bayesian nets Hybrid Empirical data Mechanics JSS
53 Team crystallization (SIO2): Dynamic model of teameffectiveness evaluation under the dynamic and tacticalenvironment at nuclear installation (Kim, Kim, & Moon,2006)
Team crystallizationdynamic mode
Quantitative Accidents data Mechanics JSS
54 A quantitative approach to clinical risk assessment: TheCREA method (Trucco & Cavallin, 2006)
CREA Quantitative Facts Medicine JSS
55 HEPI: A new tool for human error probabilitycalculation for offshore operation (Khan, Amyotte,& DiMattia, 2006)
HEPI Quantitative Accidents data Mechanics JSS
56 Transferability of accident prediction models (Sawalha& Sayed, 2006)
Negative binomialregression
Quantitative Accidents data Industry(transportation)
JSS
57 A framework for measuring safety level for productionenvironments (Ayomoh & Oke, 2006)
SIM, HTSD and GP Hybrid Facts Mechanics JSS
58 Understanding risks in socially vulnerable contexts: Thecase of waste burning in cement kilns in Brazil (de SouzaPorto & de Oliveira Fernandes, 2006)
Vulnerability analysis Qualitative Empirical data Industry(constructions)
JSS
59 Designing for safety in passenger ships utilizingadvanced evacuation analysesdA risk-based approach(Vanem & Skjong, 2006)
What-if Quantitative Accidents data Industry (navigation) JSS
60 A new approach to quantitative assessment of reliabilityof passive systems (Kirchsteiger, 2005)
PSA Quantitative Facts Engineering JSS
61 Operationalizing normal accident theory for safety-related computer systems (Sammarco, 2005)
NAT Quantitative Facts Engineering JSS
P.K.M
arhavilaset
al./Journal
ofLoss
Preventionin
theProcess
Industries24
(2011)477
e523
498
tio
tio
tio

62 Statistical analysis of dangerous goods accidents inJapan (Ohtani & Kobayashi, 2005)
Quantificationmethod of thethird type
Quantitative Empirical data Industry(transportation)
JSS
63 Effectiveness of safety belts and Hierarchical Bayesiananalysis of their relative use (Abdalla, 2005)
HierarchicalBayesian analysis
Quantitative Empirical data Industry(transportation)
JSS
64 A statistical model to estimate the probability of slip andfall incidents (Chang, 2004)
Probability model Quantitative Statistics Mechanics JSS
65 Qualification of Formal Safety Assessment: anexploratory study (Rosqvist & Tuominen, 2004)
Formal SafetyAssessment
Qualitative Facts Industry(navigation)
JSS
66 A Petri Net-based approach for ergonomic task analysisand modeling with emphasis on adaptation to systemchanges (Kontogiannis, 2003)
Petri Net approach Qualitative Facts Engineering JSS
67 Apprenticeship in a work setting: the contribution andlimits of operational resources constructed by workers(Chatigny & Montreuil, 2003)
Qualitative Empirical data Industry (food) JSS
68 Assessment of programmable systems using Bayesianbelief nets (Gran, 2002)
Bayesian belief nets Quantitative Facts Engineering JSS
69 Qualitative analyses of accidents and incidents toidentify competencies. The electrical systemsmaintenance case (Vidal-Gomel & Samurçay, 2002)
Qualitative Empirical data Engineering JSS
70 Use of Probabilistic Safety Assessment (PSA) for nuclearinstallations (Niehaus, 2002)
Probabilistic SafetyAssessment
Quantitative Facts Mechanics JSS
71 Probabilistic risk-assessment practices in the USA fornuclear power plants (Garrick & Christie, 2002)
PRA Quantitative Facts Mechanics JSS
72 An interactive multiobjective model for the strategicmaritime transportation of petroleum products: riskanalysis and routing (Iakovou, 2001)
Quantitative Facts Industry(transportation)
JSS
73 Engineering analysis of hazards to life safety in fires: thefire effluent toxicity component (Hartzell, 2001)
Quantitative Empirical data Chemistry JSS
74 Quantification of behavior for engineering designstandards and escape time calculations(Purser & Bensilum, 2001)
Quantitative Empirical data Engineering JSS
75 A systemic approach to effective chemical emergencymanagement (Kourniotis, Kiranoudis, & Markatos,2001)
Systemic approach Quantitative Empirical data Chemistry JSS
76 An algorithm for the implementation of safetyimprovement programs (Cagno, Di Giulio, & Trucco,2001)
Algorithmic approach Quantitative Empirical data Industry JSS
77 Early hazard identification of chemical plants withstatechart modeling techniques (Graf & Schmidt-Traub,2000)
HAZOP Qualitative Empirical data Mechanics JSS
78 Application of finite mixture models for vehicle crashdata analysis (Park & Lord, 2009)
Negative binomialregression (Finitemixtures of Poisson)
Quantitative Empirical data Industry(transportation)
JAAP
79 Safety evaluation of multilane arterials in Florida(Abdel-Aty, Devarasetty, & Pande, 2009)
Bayesian method Quantitative Facts Industry(transportation)
JAAP
80 Collision prediction models using multivariate Poisson-lognormal regression (El-Basyouny & Sayed, 2009)
Poisson-lognormalregression
Quantitative Empirical data Industry(transportation)
JAAP
81 Markov switching multinomial logit model: Anapplication to accident-injury severities (Malyshkina &Mannering, 2009)
Markov switching Quantitative Empirical data Industry(transportation)
JAAP
82 Kernel density estimation and K-means clustering toprofile road accident hotspots (Anderson, 2009)
Kernel densityestimation
Quantitative Accidents data Industry(transportation)
JAAP
83 Validation of a Full Bayes methodology forobservational beforeeafter road safety studies andapplication to evaluation of rural signal conversions(Lan, Persaud, Lyon, & Bhim, 2009)
Full Bayesmethodology
Quantitative Empirical data Industry(transportation)
JAAP
(continued on next page)
P.K.M
arhavilaset
al./Journal
ofLoss
Preventionin
theProcess
Industries24
(2011)477
e523
499
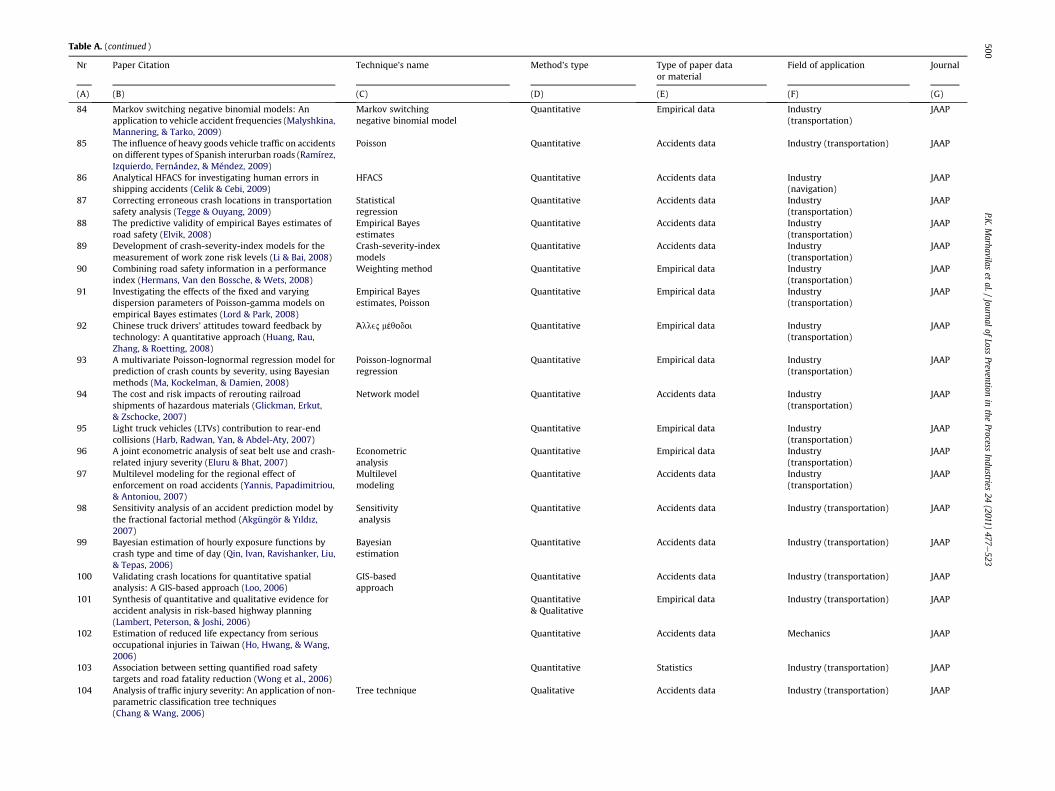
Table A. (continued )
Nr Paper Citation Technique’s name Method’s type Type of paper dataor material
Field of application Journal
(A) (B) (C) (D) (E) (F) (G)
84 Markov switching negative binomial models: Anapplication to vehicle accident frequencies (Malyshkina,Mannering, & Tarko, 2009)
Markov switchingnegative binomial model
Quantitative Empirical data Industry(transportation)
JAAP
85 The influence of heavy goods vehicle traffic on accidentson different types of Spanish interurban roads (Ramírez,Izquierdo, Fernández, & Méndez, 2009)
Poisson Quantitative Accidents data Industry (transportation) JAAP
86 Analytical HFACS for investigating human errors inshipping accidents (Celik & Cebi, 2009)
HFACS Quantitative Accidents data Industry(navigation)
JAAP
87 Correcting erroneous crash locations in transportationsafety analysis (Tegge & Ouyang, 2009)
Statisticalregression
Quantitative Accidents data Industry(transportation)
JAAP
88 The predictive validity of empirical Bayes estimates ofroad safety (Elvik, 2008)
Empirical Bayesestimates
Quantitative Accidents data Industry(transportation)
JAAP
89 Development of crash-severity-index models for themeasurement of work zone risk levels (Li & Bai, 2008)
Crash-severity-indexmodels
Quantitative Accidents data Industry(transportation)
JAAP
90 Combining road safety information in a performanceindex (Hermans, Van den Bossche, & Wets, 2008)
Weighting method Quantitative Empirical data Industry(transportation)
JAAP
91 Investigating the effects of the fixed and varyingdispersion parameters of Poisson-gamma models onempirical Bayes estimates (Lord & Park, 2008)
Empirical Bayesestimates, Poisson
Quantitative Empirical data Industry(transportation)
JAAP
92 Chinese truck drivers’ attitudes toward feedback bytechnology: A quantitative approach (Huang, Rau,Zhang, & Roetting, 2008)
Άlle2 mέqodoi Quantitative Empirical data Industry(transportation)
JAAP
93 A multivariate Poisson-lognormal regression model forprediction of crash counts by severity, using Bayesianmethods (Ma, Kockelman, & Damien, 2008)
Poisson-lognormalregression
Quantitative Empirical data Industry(transportation)
JAAP
94 The cost and risk impacts of rerouting railroadshipments of hazardous materials (Glickman, Erkut,& Zschocke, 2007)
Network model Quantitative Accidents data Industry(transportation)
JAAP
95 Light truck vehicles (LTVs) contribution to rear-endcollisions (Harb, Radwan, Yan, & Abdel-Aty, 2007)
Quantitative Empirical data Industry(transportation)
JAAP
96 A joint econometric analysis of seat belt use and crash-related injury severity (Eluru & Bhat, 2007)
Econometricanalysis
Quantitative Empirical data Industry(transportation)
JAAP
97 Multilevel modeling for the regional effect ofenforcement on road accidents (Yannis, Papadimitriou,& Antoniou, 2007)
Multilevelmodeling
Quantitative Accidents data Industry(transportation)
JAAP
98 Sensitivity analysis of an accident prediction model bythe fractional factorial method (Akgüngör & Yıldız,2007)
Sensitivityanalysis
Quantitative Accidents data Industry (transportation) JAAP
99 Bayesian estimation of hourly exposure functions bycrash type and time of day (Qin, Ivan, Ravishanker, Liu,& Tepas, 2006)
Bayesianestimation
Quantitative Accidents data Industry (transportation) JAAP
100 Validating crash locations for quantitative spatialanalysis: A GIS-based approach (Loo, 2006)
GIS-basedapproach
Quantitative Accidents data Industry (transportation) JAAP
101 Synthesis of quantitative and qualitative evidence foraccident analysis in risk-based highway planning(Lambert, Peterson, & Joshi, 2006)
Quantitative& Qualitative
Empirical data Industry (transportation) JAAP
102 Estimation of reduced life expectancy from seriousoccupational injuries in Taiwan (Ho, Hwang, & Wang,2006)
Quantitative Accidents data Mechanics JAAP
103 Association between setting quantified road safetytargets and road fatality reduction (Wong et al., 2006)
Quantitative Statistics Industry (transportation) JAAP
104 Analysis of traffic injury severity: An application of non-parametric classification tree techniques(Chang & Wang, 2006)
Tree technique Qualitative Accidents data Industry (transportation) JAAP
P.K.M
arhavilaset
al./Journal
ofLoss
Preventionin
theProcess
Industries24
(2011)477
e523
500

105 Estimation of incident clearance times using BayesianNetworks approach (Ozbay & Noyan, 2006)
BayesianNetworks
Quantitative& Qualitative
Facts Industry (transportation) JAAP
106 Bayesian methodology incorporating expert judgmentfor ranking countermeasure effectiveness underuncertainty: Example applied to at grade railroadcrossings in Korea (Washington & Oh, 2006)
Bayesianmethodology
Quantitative Empirical data Industry (transportation& railway)
JAAP
107 Accident prediction model for railway-highwayinterfaces (Oh, Washington, & Nam, 2006)
Statistical regressionmodels
Quantitative Empirical data Industry (transportation& railway)
JAAP
108 Application of a human error framework to conducttrain accident/incident investigations (Reinach & Viale,2006)
HFACS, HFACS-RR Qualitative Empirical data Industry JAAP
109 Different quantitative measures of the impact of injurydeaths on the community in the Guangxi Province,China (Lam, Yang, Liu, Geng, & Liu, 2005)
Quantitative Accidents data Mechanics JAAP
110 Sources of error in road safety scheme evaluation:a quantified comparison of current methods (Hirst,Mountain, & Maher, 2004)
Quantitative Empirical data Industry (transportation) JAAP
111 Quantifying the role of risk-taking behavior in causationof serious road crash-related injury (Turner & McClure,2004)
Quantitative Empirical data Industry (transportation) JAAP
112 A qualitative assessment methodology for road safetypolicy strategies (Wong, Leung, Loo, Hung, & Lo, 2004)
Qualitative Statistics Industry (transportation) JAAP
113 Using logistic regression to estimate the influence ofaccident factors on accident severity (Al-Ghamdi, 2002)
Logisticregression
Quantitative Accidents data Industry (transportation) JAAP
114 Effects of work zone presence on injury and non-injurycrashes (Khattak, Khattak, & Council, 2002)
Poisson Quantitative Accidents data Industry (transportation) JAAP
115 Multiple state hazard models and workers’compensation claims: an examination of workerscompensation data from Ontario (Campolieti, 2001)
Quantitative Accidents data Industry JAAP
116 Diagnosis and monetary quantification of occupationalinjuries by indices related to human capital loss:analysis of a steel company as an illustration (Sheu,Hwang, & Wang, 2000)
Quantitative Accidents data Industry JAAP
117 A comparative analysis of mathematical models forrelating indoor and outdoor toxic gas concentrations inaccidental releases (Montoya, Planas, & Casal, 2009)
Mathematicalmodels
Quantitative Facts Industry (chemicalinstallations)
JLPPI
118 Risk-based maintenance strategy and its applications ina petrochemical reforming reaction system (Hu, Cheng,Li, & Tang, 2009)
Risk-basedmaintenance
Hybrid Facts Industry JLPPI
119 Performance evaluation of process safety managementsystems of paint manufacturing facilities(Chang & Liang, 2009)
MAVT Quantitative Empirical data Industry (colour industry) JLPPI
120 The costs of industrial accidents for the organization:Developing methods and tools for evaluation and costebenefit analysis of investment in safety (Gavious,Mizrahi, Shani, & Minchuk, 2009)
Theory ofConstraints
Quantitative Empirical data Industry JLPPI
121 A mathematical model to predict the heating-up oflarge-scale wood piles (Ferrero, Lohrer, Schmidt, Noll,& Malow, 2009)
Quantitative Empirical data Industry (wood) JLPPI
122 Inherent safety of substances: Identification ofaccidental scenarios due to decomposition products(Cordella, Tugnoli, Barontini, Spadoni, & Cozzani, 2009)
Quantitative Empirical data Industry (chemicalinstallations)
JLPPI
123 Criticality evaluation of petrochemical equipment basedon fuzzy comprehensive evaluation and a BP neuralnetwork (Guo, Gao, Yang, & Kang, 2009)
Failure mode and effectsanalysis (FMEA)
Quantitative Theoreticalfoundations
Industry JLPPI
(continued on next page)
P.K.M
arhavilaset
al./Journal
ofLoss
Preventionin
theProcess
Industries24
(2011)477
e523
501
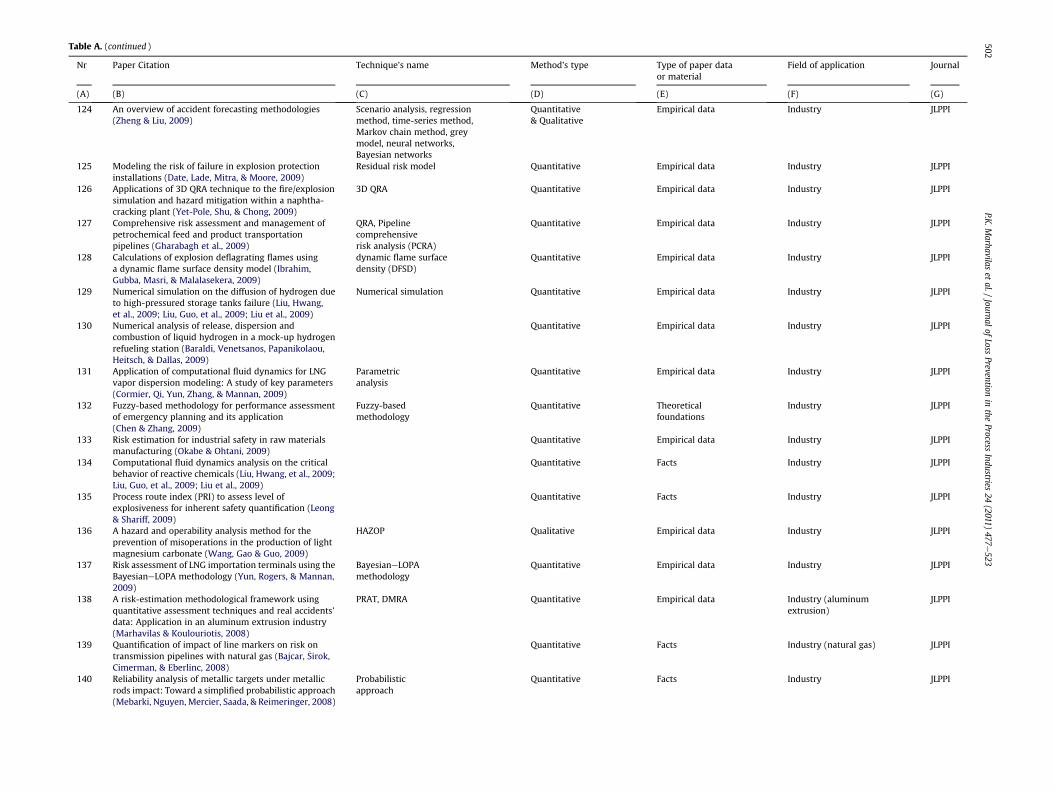
Table A. (continued )
Nr Paper Citation Technique’s name Method’s type Type of paper dataor material
Field of application Journal
(A) (B) (C) (D) (E) (F) (G)
124 An overview of accident forecasting methodologies(Zheng & Liu, 2009)
Scenario analysis, regressionmethod, time-series method,Markov chain method, greymodel, neural networks,Bayesian networks
Quantitative& Qualitative
Empirical data Industry JLPPI
125 Modeling the risk of failure in explosion protectioninstallations (Date, Lade, Mitra, & Moore, 2009)
Residual risk model Quantitative Empirical data Industry JLPPI
126 Applications of 3D QRA technique to the fire/explosionsimulation and hazard mitigation within a naphtha-cracking plant (Yet-Pole, Shu, & Chong, 2009)
3D QRA Quantitative Empirical data Industry JLPPI
127 Comprehensive risk assessment and management ofpetrochemical feed and product transportationpipelines (Gharabagh et al., 2009)
QRA, Pipelinecomprehensiverisk analysis (PCRA)
Quantitative Empirical data Industry JLPPI
128 Calculations of explosion deflagrating flames usinga dynamic flame surface density model (Ibrahim,Gubba, Masri, & Malalasekera, 2009)
dynamic flame surfacedensity (DFSD)
Quantitative Empirical data Industry JLPPI
129 Numerical simulation on the diffusion of hydrogen dueto high-pressured storage tanks failure (Liu, Hwang,et al., 2009; Liu, Guo, et al., 2009; Liu et al., 2009)
Numerical simulation Quantitative Empirical data Industry JLPPI
130 Numerical analysis of release, dispersion andcombustion of liquid hydrogen in a mock-up hydrogenrefueling station (Baraldi, Venetsanos, Papanikolaou,Heitsch, & Dallas, 2009)
Quantitative Empirical data Industry JLPPI
131 Application of computational fluid dynamics for LNGvapor dispersion modeling: A study of key parameters(Cormier, Qi, Yun, Zhang, & Mannan, 2009)
Parametricanalysis
Quantitative Empirical data Industry JLPPI
132 Fuzzy-based methodology for performance assessmentof emergency planning and its application(Chen & Zhang, 2009)
Fuzzy-basedmethodology
Quantitative Theoreticalfoundations
Industry JLPPI
133 Risk estimation for industrial safety in raw materialsmanufacturing (Okabe & Ohtani, 2009)
Quantitative Empirical data Industry JLPPI
134 Computational fluid dynamics analysis on the criticalbehavior of reactive chemicals (Liu, Hwang, et al., 2009;Liu, Guo, et al., 2009; Liu et al., 2009)
Quantitative Facts Industry JLPPI
135 Process route index (PRI) to assess level ofexplosiveness for inherent safety quantification (Leong& Shariff, 2009)
Quantitative Facts Industry JLPPI
136 A hazard and operability analysis method for theprevention of misoperations in the production of lightmagnesium carbonate (Wang, Gao & Guo, 2009)
HAZOP Qualitative Empirical data Industry JLPPI
137 Risk assessment of LNG importation terminals using theBayesianeLOPA methodology (Yun, Rogers, & Mannan,2009)
BayesianeLOPAmethodology
Quantitative Empirical data Industry JLPPI
138 A risk-estimation methodological framework usingquantitative assessment techniques and real accidents’data: Application in an aluminum extrusion industry(Marhavilas & Koulouriotis, 2008)
PRAT, DMRA Quantitative Empirical data Industry (aluminumextrusion)
JLPPI
139 Quantification of impact of line markers on risk ontransmission pipelines with natural gas (Bajcar, �Sirok,Cimerman, & Eberlinc, 2008)
Quantitative Facts Industry (natural gas) JLPPI
140 Reliability analysis of metallic targets under metallicrods impact: Toward a simplified probabilistic approach(Mebarki, Nguyen, Mercier, Saada, & Reimeringer, 2008)
Probabilisticapproach
Quantitative Facts Industry JLPPI
P.K.M
arhavilaset
al./Journal
ofLoss
Preventionin
theProcess
Industries24
(2011)477
e523
502
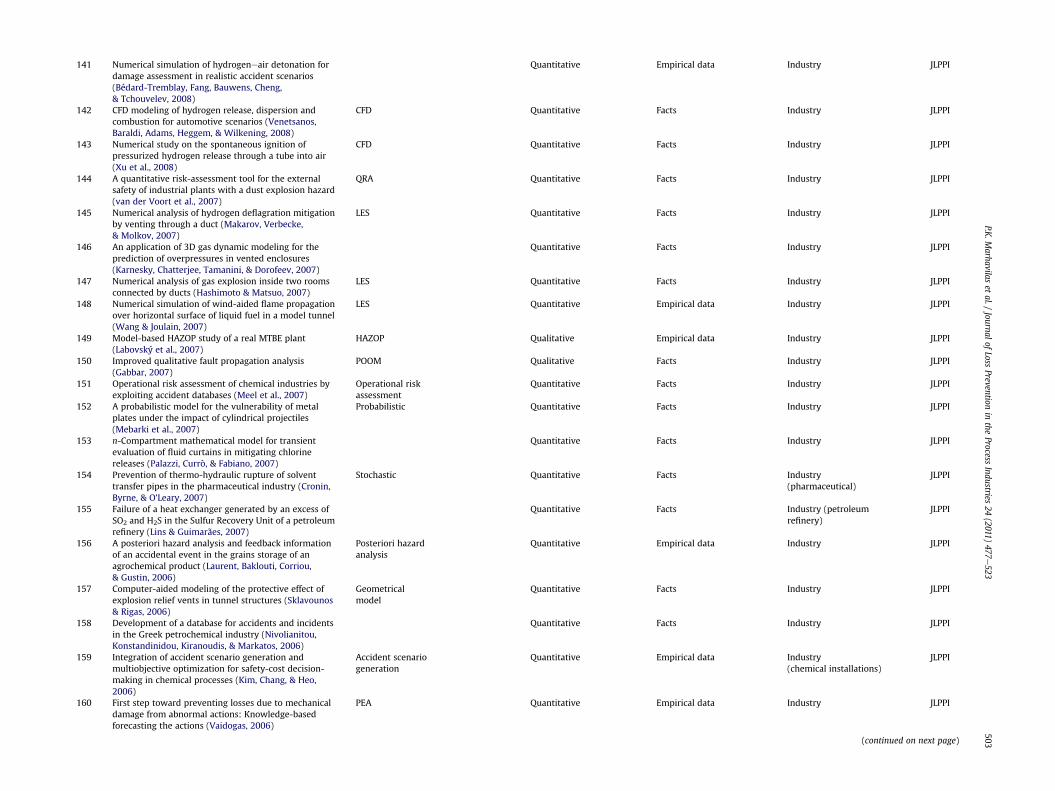
141 Numerical simulation of hydrogeneair detonation fordamage assessment in realistic accident scenarios(Bédard-Tremblay, Fang, Bauwens, Cheng,& Tchouvelev, 2008)
Quantitative Empirical data Industry JLPPI
142 CFD modeling of hydrogen release, dispersion andcombustion for automotive scenarios (Venetsanos,Baraldi, Adams, Heggem, & Wilkening, 2008)
CFD Quantitative Facts Industry JLPPI
143 Numerical study on the spontaneous ignition ofpressurized hydrogen release through a tube into air(Xu et al., 2008)
CFD Quantitative Facts Industry JLPPI
144 A quantitative risk-assessment tool for the externalsafety of industrial plants with a dust explosion hazard(van der Voort et al., 2007)
QRA Quantitative Facts Industry JLPPI
145 Numerical analysis of hydrogen deflagration mitigationby venting through a duct (Makarov, Verbecke,& Molkov, 2007)
LES Quantitative Facts Industry JLPPI
146 An application of 3D gas dynamic modeling for theprediction of overpressures in vented enclosures(Karnesky, Chatterjee, Tamanini, & Dorofeev, 2007)
Quantitative Facts Industry JLPPI
147 Numerical analysis of gas explosion inside two roomsconnected by ducts (Hashimoto & Matsuo, 2007)
LES Quantitative Facts Industry JLPPI
148 Numerical simulation of wind-aided flame propagationover horizontal surface of liquid fuel in a model tunnel(Wang & Joulain, 2007)
LES Quantitative Empirical data Industry JLPPI
149 Model-based HAZOP study of a real MTBE plant(Labovský et al., 2007)
HAZOP Qualitative Empirical data Industry JLPPI
150 Improved qualitative fault propagation analysis(Gabbar, 2007)
POOM Qualitative Facts Industry JLPPI
151 Operational risk assessment of chemical industries byexploiting accident databases (Meel et al., 2007)
Operational riskassessment
Quantitative Facts Industry JLPPI
152 A probabilistic model for the vulnerability of metalplates under the impact of cylindrical projectiles(Mebarki et al., 2007)
Probabilistic Quantitative Facts Industry JLPPI
153 n-Compartment mathematical model for transientevaluation of fluid curtains in mitigating chlorinereleases (Palazzi, Currò, & Fabiano, 2007)
Quantitative Facts Industry JLPPI
154 Prevention of thermo-hydraulic rupture of solventtransfer pipes in the pharmaceutical industry (Cronin,Byrne, & O’Leary, 2007)
Stochastic Quantitative Facts Industry(pharmaceutical)
JLPPI
155 Failure of a heat exchanger generated by an excess ofSO2 and H2S in the Sulfur Recovery Unit of a petroleumrefinery (Lins & Guimarães, 2007)
Quantitative Facts Industry (petroleumrefinery)
JLPPI
156 A posteriori hazard analysis and feedback informationof an accidental event in the grains storage of anagrochemical product (Laurent, Baklouti, Corriou,& Gustin, 2006)
Posteriori hazardanalysis
Quantitative Empirical data Industry JLPPI
157 Computer-aided modeling of the protective effect ofexplosion relief vents in tunnel structures (Sklavounos& Rigas, 2006)
Geometricalmodel
Quantitative Facts Industry JLPPI
158 Development of a database for accidents and incidentsin the Greek petrochemical industry (Nivolianitou,Konstandinidou, Kiranoudis, & Markatos, 2006)
Quantitative Facts Industry JLPPI
159 Integration of accident scenario generation andmultiobjective optimization for safety-cost decision-making in chemical processes (Kim, Chang, & Heo,2006)
Accident scenariogeneration
Quantitative Empirical data Industry(chemical installations)
JLPPI
160 First step toward preventing losses due to mechanicaldamage from abnormal actions: Knowledge-basedforecasting the actions (Vaidogas, 2006)
PEA Quantitative Empirical data Industry JLPPI
(continued on next page)
P.K.M
arhavilaset
al./Journal
ofLoss
Preventionin
theProcess
Industries24
(2011)477
e523
503
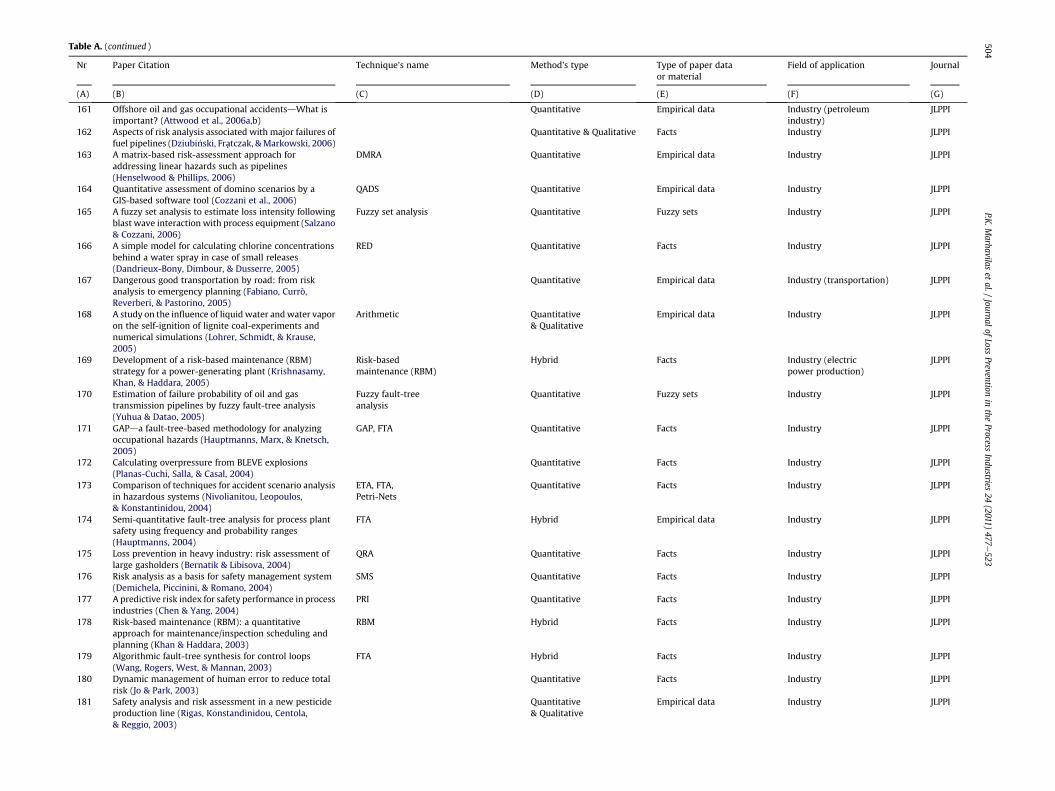
Table A. (continued )
Nr Paper Citation Technique’s name Method’s type Type of paper dataor material
Field of application Journal
(A) (B) (C) (D) (E) (F) (G)
161 Offshore oil and gas occupational accidentsdWhat isimportant? (Attwood et al., 2006a,b)
Quantitative Empirical data Industry (petroleumindustry)
JLPPI
162 Aspects of risk analysis associated with major failures offuel pipelines (Dziubi�nski, Fratczak, &Markowski, 2006)
Quantitative & Qualitative Facts Industry JLPPI
163 A matrix-based risk-assessment approach foraddressing linear hazards such as pipelines(Henselwood & Phillips, 2006)
DMRA Quantitative Empirical data Industry JLPPI
164 Quantitative assessment of domino scenarios by aGIS-based software tool (Cozzani et al., 2006)
QADS Quantitative Empirical data Industry JLPPI
165 A fuzzy set analysis to estimate loss intensity followingblast wave interaction with process equipment (Salzano& Cozzani, 2006)
Fuzzy set analysis Quantitative Fuzzy sets Industry JLPPI
166 A simple model for calculating chlorine concentrationsbehind a water spray in case of small releases(Dandrieux-Bony, Dimbour, & Dusserre, 2005)
RED Quantitative Facts Industry JLPPI
167 Dangerous good transportation by road: from riskanalysis to emergency planning (Fabiano, Currò,Reverberi, & Pastorino, 2005)
Quantitative Empirical data Industry (transportation) JLPPI
168 A study on the influence of liquid water andwater vaporon the self-ignition of lignite coal-experiments andnumerical simulations (Lohrer, Schmidt, & Krause,2005)
Arithmetic Quantitative& Qualitative
Empirical data Industry JLPPI
169 Development of a risk-based maintenance (RBM)strategy for a power-generating plant (Krishnasamy,Khan, & Haddara, 2005)
Risk-basedmaintenance (RBM)
Hybrid Facts Industry (electricpower production)
JLPPI
170 Estimation of failure probability of oil and gastransmission pipelines by fuzzy fault-tree analysis(Yuhua & Datao, 2005)
Fuzzy fault-treeanalysis
Quantitative Fuzzy sets Industry JLPPI
171 GAPda fault-tree-based methodology for analyzingoccupational hazards (Hauptmanns, Marx, & Knetsch,2005)
GAP, FTA Quantitative Facts Industry JLPPI
172 Calculating overpressure from BLEVE explosions(Planas-Cuchi, Salla, & Casal, 2004)
Quantitative Facts Industry JLPPI
173 Comparison of techniques for accident scenario analysisin hazardous systems (Nivolianitou, Leopoulos,& Konstantinidou, 2004)
ETA, FTA,Petri-Nets
Quantitative Facts Industry JLPPI
174 Semi-quantitative fault-tree analysis for process plantsafety using frequency and probability ranges(Hauptmanns, 2004)
FTA Hybrid Empirical data Industry JLPPI
175 Loss prevention in heavy industry: risk assessment oflarge gasholders (Bernatik & Libisova, 2004)
QRA Quantitative Facts Industry JLPPI
176 Risk analysis as a basis for safety management system(Demichela, Piccinini, & Romano, 2004)
SMS Quantitative Facts Industry JLPPI
177 A predictive risk index for safety performance in processindustries (Chen & Yang, 2004)
PRI Quantitative Facts Industry JLPPI
178 Risk-based maintenance (RBM): a quantitativeapproach for maintenance/inspection scheduling andplanning (Khan & Haddara, 2003)
RBM Hybrid Facts Industry JLPPI
179 Algorithmic fault-tree synthesis for control loops(Wang, Rogers, West, & Mannan, 2003)
FTA Hybrid Facts Industry JLPPI
180 Dynamic management of human error to reduce totalrisk (Jo & Park, 2003)
Quantitative Facts Industry JLPPI
181 Safety analysis and risk assessment in a new pesticideproduction line (Rigas, Konstandinidou, Centola,& Reggio, 2003)
Quantitative& Qualitative
Empirical data Industry JLPPI
P.K.M
arhavilaset
al./Journal
ofLoss
Preventionin
theProcess
Industries24
(2011)477
e523
504

182 Quantification of inherent safety aspects of the Dowindices (Etowa, Amyotte, Pegg, & Khan, 2002)
Quantitative Facts Industry JLPPI
183 Technical modeling in integrated risk assessment ofchemical installations (Papazoglou, Aneziris, Post,& Ale, 2002)
Quantitative Facts Industry (chemicalinstallation)
JLPPI
184 A new algorithm for computer-aided fault-treesynthesis (Wang, Teague,West, &Mannan, 2002;Wang,Wu, & Chang, 2002)
FTA Hybrid Empirical data Industry JLPPI
185 Analysis of hazard areas associated with high-pressurenatural-gas pipelines (Jo & Ahn, 2002)
Quantitative Facts Industry JLPPI
186 An integrated framework to the predictive erroranalysis in emergency situation (Kim & Jung, 2002)
Task Analysis Qualitative Facts Industry JLPPI
187 A methodology for assessing risk from releasedhydrocarbon in an enclosed area (Lee, 2002)
The ProbitApproach
Quantitative Facts Industry JLPPI
188 Numerical study of dust lifting in a channel with verticalobstacles (Klemens et al., 2001)
Quantitative Facts Industry JLPPI
189 Evaluation of limits for effective flame acceleration inhydrogen mixtures (Dorofeev, Kuznetsov, Alekseev,Efimenko, & Breitung, 2001)
Quantitative Facts Industry JLPPI
190 Use of computational modeling to identify the cause ofvapor cloud explosion incidents (Clutter & Whitney,2001)
Quantitative Facts Industry JLPPI
191 A procedure for analyzing the flight of missiles fromexplosions of cylindrical vessels (Hauptmanns, 2001)
Monte Carloevaluation
Quantitative Facts Industry JLPPI
192 Analytical expressions for the calculation of damagepercentage using the probit methodology (Vílchez,Montiel, Casal, & Arnaldos, 2001)
The ProbitApproach
Quantitative Facts Industry JLPPI
193 Risk analysis of a typical chemical industry using ORAprocedure (Khan & Abbasi, 2001)
ORA Quantitative& Qualitative
Facts Industry (chemicalinstallation)
JLPPI
194 A mathematical model for predicting thermal hazarddata (Liaw, Yur, & Lin, 2000)
Quantitative Facts Industry JLPPI
195 Risk analysis of LPG transport by road and rail (Bubbico,Ferrari, & Mazzarotta, 2000)
Quantitative Facts Industry (transportation) JLPPI
196 A systematic Hazop procedure for batch processes, andits application to pipeless plants (Mushtaq & Chung,2000)
HAZOP Qualitative Empirical data Industry JLPPI
197 Data mining of tree-based models to analyze freewayaccident frequency (Chang & Chen, 2005)
ETA Quantitative Empirical data Engineering JSR
198 Net-cost model for workplace interventions (Lahiri,Gold, & Levenstein, 2005)
Net-Cost model Quantitative Facts Mechanics JSR
199 A comprehensive framework for assessing and selectingappropriate scaffolding based on analytic hierarchyprocess (Fang, Shen, Wu, & Liu, 2003)
Analytic hierarchyprocess
Quantitative& Qualitative
Facts Mechanics JSR
200 Consequences and likelihood in risk estimation:A matter of balance in UK health and safetyrisk-assessment practice (Woodruff, 2005)
Hybrid Facts Industry JSS
201 Combining task analysis and fault-tree analysis foraccident and incident analysis: A case study fromBulgaria (Doytchev & Szwillus, 2009)
FTA, TA, HEIST Hybrid Facts Industry (energyproduction)
JAAP
202 Safety in construction e a comprehensive description ofthe characteristics of high safety standards inconstruction work, from the combined perspective ofsupervisors and experienced workers(Törner & Pousette, 2009)
Checklists,Safety audits
Qualitative Empirical data Industry (constructions) JSR
203 A note on the effectiveness of the house-arrestalternative for motivating DWI offenders to installignition interlocks (Roth, Marques, & Voas, 2009)
DWI Quantitative Facts Transportation JSR
(continued on next page)
P.K.M
arhavilaset
al./Journal
ofLoss
Preventionin
theProcess
Industries24
(2011)477
e523
505

Table A. (continued )
Nr Paper Citation Technique’s name Method’s type Type of paper dataor material
Field of application Journal
(A) (B) (C) (D) (E) (F) (G)
204 A framework for understanding the development oforganizational safety culture (Parker, Lawrie, & Hudson,2006)
Checklists,Safety audits
Qualitative Empirical data Engineering JSS
205 Observational learning and workplace safety: Theeffects of viewing the collective behavior of multiplesocial models on the use of personal protectiveequipment (Olson, Grosshuesch, Schmidt, Gray,& Wipfli, 2009)
Qualitative Experimental data Industry JSR
206 Work environment risk factors for injuries in woodprocessing (Holcroft & Punnett, 2009)
Qualitative Facts Industry (wood) JSR
207 The role of production and teamwork practices inconstruction safety: A cognitive model and an empiricalcase study (Mitropoulos & Cupido, 2009)
HRC Qualitative Empirical data Industry (constructions) JSR
208 Global trend according to estimated number ofoccupational accidents and fatal work-related diseasesat region and country level (Hämäläinen, Saarela,& Takala, 2009)
Qualitative Accidents data All fields JSR
209 What is most important for safety climate: Thecompany belonging or the local working environment?e A study from the Norwegian offshore industry(Høivik, Tharaldsen, Baste, & Moen, 2009)
ANOVA Hybrid Facts Industry (petroleum) JSS
210 Risk-assessment tools incorporating human errorprobabilities in the Japanese small-sized establishment(Moriyama & Ohtani, 2009)
HEP/HEA Hybrid Theoretical foundations& Empirical data
Industry JSS
211 Measurement techniques for organizational safetycausal models: Characterization and suggestions forenhancements (Mohaghegh & Mosleh, 2009a,b)
Probabilistic RiskAssessment (PRA)
Quantitative Theoretical foundations& Empirical data
All JSS
212 Age and lost working days as a result of an occupationalaccident: A study in a shiftwork rotation system(Blanch, Torrelles, Aluja, & Salinas, 2009)
LWDI Quantitative Facts Industry JSS
213 Deterioration of the useful visual field with aging duringsimulated driving in traffic and its possibleconsequences for road safety (Rogé & Pebaylé, 2009)
Quantitative Facts Transportations JSS
214 A method for assessing health and safety managementsystems from the resilience engineering perspective(Costella, Saurin, & de Macedo Guimarães, 2009)
MAHS Hybrid Experimental data Industry (car) JSS
215 Development of a relative risk model for roof and sidefall fatal accidents in underground coal mines in India(Maiti & Khanzode, 2009)
SME Quantitative Facts Industry JSS
216 Relation between occupational safety management andfirm performance (Fernández-Muñiz, Montes-Peón, &Vázquez-Ordás, 2009)
Qualitative Theoreticalfoundations
All JSS
217 Safety is the antonym of risk for some perspectives ofrisk (Aven, 2009)
Qualitative Theoreticalfoundations
All JSS
218 From hanger-on to trendsetter: Decision-making onamajor safety initiative in a steel companymaintenancedepartment (van Ginneken & Hale, 2009)
Qualitative Statistics Industry JSS
219 Globalization and workplace hazards in developingnations (Baram, 2009)
Qualitative Theoreticalfoundations
All JSS
220 Role of beliefs in accident and risk analysis andprevention (Kouabenan, 2009)
Qualitative Theoreticalfoundations
All JSS
221 Complaints regarding occupational health and safety inthe area of Thessaloniki (Greece) (Mekos, 2009)
Quantitative Statistics All JSS
P.K.M
arhavilaset
al./Journal
ofLoss
Preventionin
theProcess
Industries24
(2011)477
e523
506
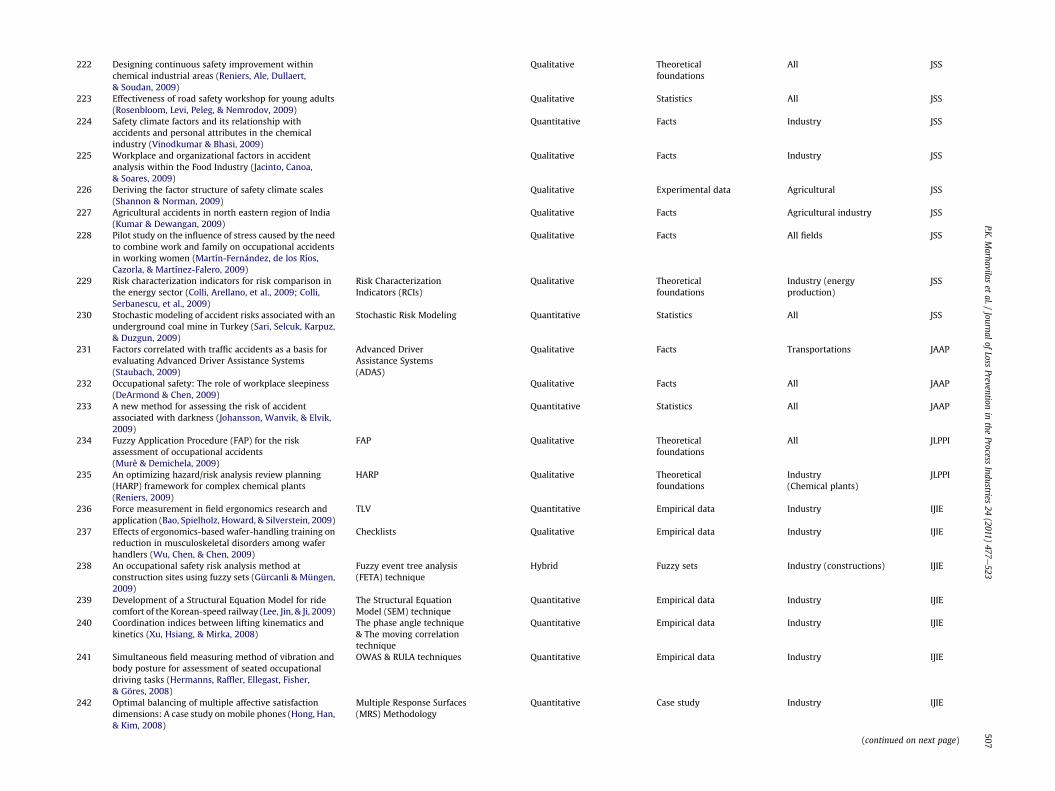
222 Designing continuous safety improvement withinchemical industrial areas (Reniers, Ale, Dullaert,& Soudan, 2009)
Qualitative Theoreticalfoundations
All JSS
223 Effectiveness of road safety workshop for young adults(Rosenbloom, Levi, Peleg, & Nemrodov, 2009)
Qualitative Statistics All JSS
224 Safety climate factors and its relationship withaccidents and personal attributes in the chemicalindustry (Vinodkumar & Bhasi, 2009)
Quantitative Facts Industry JSS
225 Workplace and organizational factors in accidentanalysis within the Food Industry (Jacinto, Canoa,& Soares, 2009)
Qualitative Facts Industry JSS
226 Deriving the factor structure of safety climate scales(Shannon & Norman, 2009)
Qualitative Experimental data Agricultural JSS
227 Agricultural accidents in north eastern region of India(Kumar & Dewangan, 2009)
Qualitative Facts Agricultural industry JSS
228 Pilot study on the influence of stress caused by the needto combine work and family on occupational accidentsin working women (Martín-Fernández, de los Ríos,Cazorla, & Martínez-Falero, 2009)
Qualitative Facts All fields JSS
229 Risk characterization indicators for risk comparison inthe energy sector (Colli, Arellano, et al., 2009; Colli,Serbanescu, et al., 2009)
Risk CharacterizationIndicators (RCIs)
Qualitative Theoreticalfoundations
Industry (energyproduction)
JSS
230 Stochastic modeling of accident risks associated with anunderground coal mine in Turkey (Sari, Selcuk, Karpuz,& Duzgun, 2009)
Stochastic Risk Modeling Quantitative Statistics All JSS
231 Factors correlated with traffic accidents as a basis forevaluating Advanced Driver Assistance Systems(Staubach, 2009)
Advanced DriverAssistance Systems(ADAS)
Qualitative Facts Transportations JAAP
232 Occupational safety: The role of workplace sleepiness(DeArmond & Chen, 2009)
Qualitative Facts All JAAP
233 A new method for assessing the risk of accidentassociated with darkness (Johansson, Wanvik, & Elvik,2009)
Quantitative Statistics All JAAP
234 Fuzzy Application Procedure (FAP) for the riskassessment of occupational accidents(Murè & Demichela, 2009)
FAP Qualitative Theoreticalfoundations
All JLPPI
235 An optimizing hazard/risk analysis review planning(HARP) framework for complex chemical plants(Reniers, 2009)
HARP Qualitative Theoreticalfoundations
Industry(Chemical plants)
JLPPI
236 Force measurement in field ergonomics research andapplication (Bao, Spielholz, Howard, & Silverstein, 2009)
TLV Quantitative Empirical data Industry IJIE
237 Effects of ergonomics-based wafer-handling training onreduction in musculoskeletal disorders among waferhandlers (Wu, Chen, & Chen, 2009)
Checklists Qualitative Empirical data Industry IJIE
238 An occupational safety risk analysis method atconstruction sites using fuzzy sets (Gürcanli & Müngen,2009)
Fuzzy event tree analysis(FETA) technique
Hybrid Fuzzy sets Industry (constructions) IJIE
239 Development of a Structural Equation Model for ridecomfort of the Korean-speed railway (Lee, Jin, & Ji, 2009)
The Structural EquationModel (SEM) technique
Quantitative Empirical data Industry IJIE
240 Coordination indices between lifting kinematics andkinetics (Xu, Hsiang, & Mirka, 2008)
The phase angle technique& The moving correlationtechnique
Quantitative Empirical data Industry IJIE
241 Simultaneous field measuring method of vibration andbody posture for assessment of seated occupationaldriving tasks (Hermanns, Raffler, Ellegast, Fisher,& Göres, 2008)
OWAS & RULA techniques Quantitative Empirical data Industry IJIE
242 Optimal balancing of multiple affective satisfactiondimensions: A case study on mobile phones (Hong, Han,& Kim, 2008)
Multiple Response Surfaces(MRS) Methodology
Quantitative Case study Industry IJIE
(continued on next page)
P.K.M
arhavilaset
al./Journal
ofLoss
Preventionin
theProcess
Industries24
(2011)477
e523
507
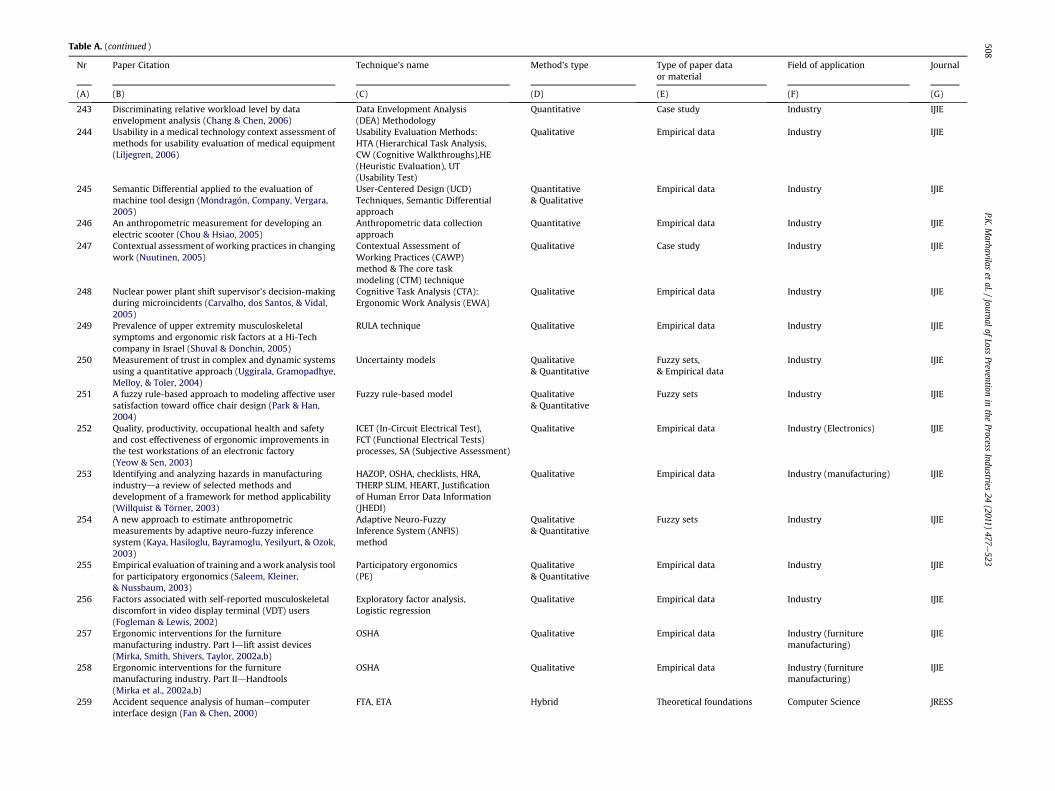
Table A. (continued )
Nr Paper Citation Technique’s name Method’s type Type of paper dataor material
Field of application Journal
(A) (B) (C) (D) (E) (F) (G)
243 Discriminating relative workload level by dataenvelopment analysis (Chang & Chen, 2006)
Data Envelopment Analysis(DEA) Methodology
Quantitative Case study Industry IJIE
244 Usability in a medical technology context assessment ofmethods for usability evaluation of medical equipment(Liljegren, 2006)
Usability Evaluation Methods:HTA (Hierarchical Task Analysis,CW (Cognitive Walkthroughs),HE(Heuristic Evaluation), UT(Usability Test)
Qualitative Empirical data Industry IJIE
245 Semantic Differential applied to the evaluation ofmachine tool design (Mondragón, Company, Vergara,2005)
User-Centered Design (UCD)Techniques, Semantic Differentialapproach
Quantitative& Qualitative
Empirical data Industry IJIE
246 An anthropometric measurement for developing anelectric scooter (Chou & Hsiao, 2005)
Anthropometric data collectionapproach
Quantitative Empirical data Industry IJIE
247 Contextual assessment of working practices in changingwork (Nuutinen, 2005)
Contextual Assessment ofWorking Practices (CAWP)method & The core taskmodeling (CTM) technique
Qualitative Case study Industry IJIE
248 Nuclear power plant shift supervisor’s decision-makingduring microincidents (Carvalho, dos Santos, & Vidal,2005)
Cognitive Task Analysis (CTA):Ergonomic Work Analysis (EWA)
Qualitative Empirical data Industry IJIE
249 Prevalence of upper extremity musculoskeletalsymptoms and ergonomic risk factors at a Hi-Techcompany in Israel (Shuval & Donchin, 2005)
RULA technique Qualitative Empirical data Industry IJIE
250 Measurement of trust in complex and dynamic systemsusing a quantitative approach (Uggirala, Gramopadhye,Melloy, & Toler, 2004)
Uncertainty models Qualitative& Quantitative
Fuzzy sets,& Empirical data
Industry IJIE
251 A fuzzy rule-based approach to modeling affective usersatisfaction toward office chair design (Park & Han,2004)
Fuzzy rule-based model Qualitative& Quantitative
Fuzzy sets Industry IJIE
252 Quality, productivity, occupational health and safetyand cost effectiveness of ergonomic improvements inthe test workstations of an electronic factory(Yeow & Sen, 2003)
ICET (In-Circuit Electrical Test),FCT (Functional Electrical Tests)processes, SA (Subjective Assessment)
Qualitative Empirical data Industry (Electronics) IJIE
253 Identifying and analyzing hazards in manufacturingindustryda review of selected methods anddevelopment of a framework for method applicability(Willquist & Törner, 2003)
HAZOP, OSHA, checklists, HRA,THERP SLIM, HEART, Justificationof Human Error Data Information(JHEDI)
Qualitative Empirical data Industry (manufacturing) IJIE
254 A new approach to estimate anthropometricmeasurements by adaptive neuro-fuzzy inferencesystem (Kaya, Hasiloglu, Bayramoglu, Yesilyurt, & Ozok,2003)
Adaptive Neuro-FuzzyInference System (ANFIS)method
Qualitative& Quantitative
Fuzzy sets Industry IJIE
255 Empirical evaluation of training and awork analysis toolfor participatory ergonomics (Saleem, Kleiner,& Nussbaum, 2003)
Participatory ergonomics(PE)
Qualitative& Quantitative
Empirical data Industry IJIE
256 Factors associated with self-reported musculoskeletaldiscomfort in video display terminal (VDT) users(Fogleman & Lewis, 2002)
Exploratory factor analysis,Logistic regression
Qualitative Empirical data Industry IJIE
257 Ergonomic interventions for the furnituremanufacturing industry. Part Idlift assist devices(Mirka, Smith, Shivers, Taylor, 2002a,b)
OSHA Qualitative Empirical data Industry (furnituremanufacturing)
IJIE
258 Ergonomic interventions for the furnituremanufacturing industry. Part IIdHandtools(Mirka et al., 2002a,b)
OSHA Qualitative Empirical data Industry (furnituremanufacturing)
IJIE
259 Accident sequence analysis of humanecomputerinterface design (Fan & Chen, 2000)
FTA, ETA Hybrid Theoretical foundations Computer Science JRESS
P.K.M
arhavilaset
al./Journal
ofLoss
Preventionin
theProcess
Industries24
(2011)477
e523
508
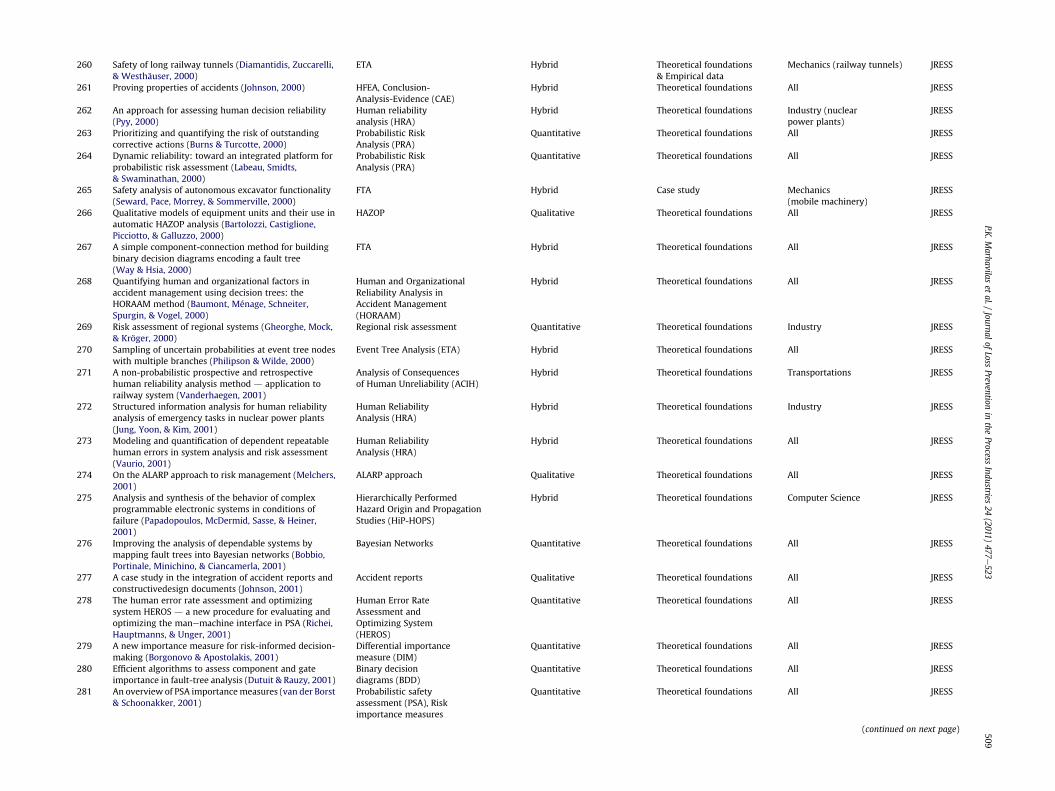
260 Safety of long railway tunnels (Diamantidis, Zuccarelli,& Westhäuser, 2000)
ETA Hybrid Theoretical foundations& Empirical data
Mechanics (railway tunnels) JRESS
261 Proving properties of accidents (Johnson, 2000) HFEA, Conclusion-Analysis-Evidence (CAE)
Hybrid Theoretical foundations All JRESS
262 An approach for assessing human decision reliability(Pyy, 2000)
Human reliabilityanalysis (HRA)
Hybrid Theoretical foundations Industry (nuclearpower plants)
JRESS
263 Prioritizing and quantifying the risk of outstandingcorrective actions (Burns & Turcotte, 2000)
Probabilistic RiskAnalysis (PRA)
Quantitative Theoretical foundations All JRESS
264 Dynamic reliability: toward an integrated platform forprobabilistic risk assessment (Labeau, Smidts,& Swaminathan, 2000)
Probabilistic RiskAnalysis (PRA)
Quantitative Theoretical foundations All JRESS
265 Safety analysis of autonomous excavator functionality(Seward, Pace, Morrey, & Sommerville, 2000)
FTA Hybrid Case study Mechanics(mobile machinery)
JRESS
266 Qualitative models of equipment units and their use inautomatic HAZOP analysis (Bartolozzi, Castiglione,Picciotto, & Galluzzo, 2000)
HAZOP Qualitative Theoretical foundations All JRESS
267 A simple component-connection method for buildingbinary decision diagrams encoding a fault tree(Way & Hsia, 2000)
FTA Hybrid Theoretical foundations All JRESS
268 Quantifying human and organizational factors inaccident management using decision trees: theHORAAM method (Baumont, Ménage, Schneiter,Spurgin, & Vogel, 2000)
Human and OrganizationalReliability Analysis inAccident Management(HORAAM)
Hybrid Theoretical foundations All JRESS
269 Risk assessment of regional systems (Gheorghe, Mock,& Kröger, 2000)
Regional risk assessment Quantitative Theoretical foundations Industry JRESS
270 Sampling of uncertain probabilities at event tree nodeswith multiple branches (Philipson & Wilde, 2000)
Event Tree Analysis (ETA) Hybrid Theoretical foundations All JRESS
271 A non-probabilistic prospective and retrospectivehuman reliability analysis method d application torailway system (Vanderhaegen, 2001)
Analysis of Consequencesof Human Unreliability (ACIH)
Hybrid Theoretical foundations Transportations JRESS
272 Structured information analysis for human reliabilityanalysis of emergency tasks in nuclear power plants(Jung, Yoon, & Kim, 2001)
Human ReliabilityAnalysis (HRA)
Hybrid Theoretical foundations Industry JRESS
273 Modeling and quantification of dependent repeatablehuman errors in system analysis and risk assessment(Vaurio, 2001)
Human ReliabilityAnalysis (HRA)
Hybrid Theoretical foundations All JRESS
274 On the ALARP approach to risk management (Melchers,2001)
ALARP approach Qualitative Theoretical foundations All JRESS
275 Analysis and synthesis of the behavior of complexprogrammable electronic systems in conditions offailure (Papadopoulos, McDermid, Sasse, & Heiner,2001)
Hierarchically PerformedHazard Origin and PropagationStudies (HiP-HOPS)
Hybrid Theoretical foundations Computer Science JRESS
276 Improving the analysis of dependable systems bymapping fault trees into Bayesian networks (Bobbio,Portinale, Minichino, & Ciancamerla, 2001)
Bayesian Networks Quantitative Theoretical foundations All JRESS
277 A case study in the integration of accident reports andconstructivedesign documents (Johnson, 2001)
Accident reports Qualitative Theoretical foundations All JRESS
278 The human error rate assessment and optimizingsystem HEROS d a new procedure for evaluating andoptimizing the manemachine interface in PSA (Richei,Hauptmanns, & Unger, 2001)
Human Error RateAssessment andOptimizing System(HEROS)
Quantitative Theoretical foundations All JRESS
279 A new importance measure for risk-informed decision-making (Borgonovo & Apostolakis, 2001)
Differential importancemeasure (DIM)
Quantitative Theoretical foundations All JRESS
280 Efficient algorithms to assess component and gateimportance in fault-tree analysis (Dutuit & Rauzy, 2001)
Binary decisiondiagrams (BDD)
Quantitative Theoretical foundations All JRESS
281 An overview of PSA importancemeasures (van der Borst& Schoonakker, 2001)
Probabilistic safetyassessment (PSA), Riskimportance measures
Quantitative Theoretical foundations All JRESS
(continued on next page)
P.K.M
arhavilaset
al./Journal
ofLoss
Preventionin
theProcess
Industries24
(2011)477
e523
509

Table A. (continued )
Nr Paper Citation Technique’s name Method’s type Type of paper dataor material
Field of application Journal
(A) (B) (C) (D) (E) (F) (G)
282 Identification, ranking, and management of risks ina major system acquisition (Lambert, Haimes, Li,Schooff, & Tulsiani, 2001)
Hierarchical holographicmodeling (HHM)
Qualitative Theoretical foundations All JRESS
283 A fuzzy-logic-based approach to qualitative safetymodeling for marine systems (Sii, Ruxton, & Wang,2001)
Fuzzy-logic-basedapproach
Qualitative Fuzzy sets All JRESS
284 CDF sensitivity analysis technique for rankinginfluential parameters in the performance assessmentof the proposed high-level waste repository at YuccaMountain, Nevada, USA (Mohanty & Wu, 2001)
CDF sensitivity analysistechnique
Quantitative Theoretical foundations Environment JRESS
285 Quantitative analysis methodology in safety-criticalmicroprocessor applications (Camargo, Canzian,Almeida, Paz, & Basseto, 2001)
Quantitative analysis insafety-criticalmicroprocessors
Quantitative Theoretical foundations& Case study
Computer Science JRESS
286 Integration of interlock system analysis with automatedHAZOP analysis (Cocchiara, Bartolozzi, Picciotto,& Galluzzo, 2001)
HAZOP Qualitative Theoretical foundations Engineering JRESS
287 Risk indicators as a tool for risk control (Øien, 2001a,b) Risk influencing factors Quantitative Theoretical foundations Industry (petroleum) JRESS288 A framework for the establishment of organizational
risk indicators (Øien, 2001a,b)Organizational riskindicators
Quantitative Theoretical foundations Industry (petroleum) JRESS
289 Use of risk assessment in the nuclear industry withspecific reference to the Australian situation (Cameron& Willers, 2001)
HIFAR PSA (Probabilisticsafety assessment),
Quantitative Theoretical foundations Industry (nuclear) JRESS
290 Risk assessment of LPG automotive refueling facilities(Melchers & Feutrill, 2001)
Quantified riskanalysis (QRA)
Quantitative Theoretical foundations& Empirical data
Transportations JRESS
291 Risk assessment in maritime transportation (GuedesSoares & Teixeira, 2001)
Quantified riskassessment
Quantitative Theoretical foundations Transportations(maritime)
JRESS
292 A dynamic fault tree (Cepin & Mavko, 2002) FTA Hybrid Theoretical foundations All JRESS293 Quantifying uncertainty under a predictive, epistemic
approach to risk analysis (Apeland, Aven, & Nilsen,2002)
Quantified riskanalysis (QRA)
Quantitative Theoretical foundations& Empirical data
All JRESS
294 Comparing safety analysis techniques (Rouvroye & vanden Bliek, 2002)
Enhanced MarkovAnalysis
Quantitative Theoretical foundations All JRESS
295 Automated multiple failure FMEA (Price & Taylor, 2002) Failure mode andeffects analysis (FMEA)
Qualitative Theoretical foundations Engineering (electrical) JRESS
296 Automatic hazard analysis of batch operations withPetri-Nets (Wang, Teague, et al., 2002; Wang,Wu, et al., 2002)
Petri Net-based model Quantitative Theoretical foundations& Case study
Engineering JRESS
297 A tool based approach to checking logical consistency inaccident reports (Krishnan, 2002)
Accident reports Qualitative Theoretical foundations Engineering JRESS
298 Optimization of safety equipment outages improvessafety (Cepin, 2002)
Probabilistic safetyassessment
Quantitative Theoretical foundations Engineering JRESS
299 Risk analysis in plant commissioning: the MultilevelHazop (Cagno, Caron, & Mancini, 2002)
Multilevel HAZOP Qualitative Theoretical foundations& Case study
Engineering JRESS
300 Mode automata and their compilation into fault trees(Rauzy, 2002)
Mode automata Qualitative Theoretical foundations Engineering JRESS
301 Social and economic criteria of acceptable risk (Lind,2002)
Cost-utility analysis Quantitative Theoretical foundations All JRESS
302 Component choice for managing risk in engineeredsystems with generalized risk/cost functions (Guikema& Paté-Cornell, 2002)
Riskecost functions Quantitative Theoretical foundations Engineering JRESS
303 An analysis of safety-critical digital systems forrisk-informed design (Kang & Sung, 2002)
Probabilistic safetyassessment (PSA)
Qualitative Theoretical foundations& Case study
Industry (nuclear) JRESS
304 Modified failure mode and effects analysis usingapproximate reasoning (Pillay & Wang, 2003)
FMEA Quantitative Fuzzy sets Industry (Marine) JRESS
P.K.M
arhavilaset
al./Journal
ofLoss
Preventionin
theProcess
Industries24
(2011)477
e523
510

305 Development of a safety-critical software requirementsverification method with combined CPN and PVS:a nuclear power plant protection system application(Son & Seong, 2003)
Colored Petri Net (CPN) &Prototype VerificationSystem (PVS)
Qualitative& Quantitative
Empirical data Industry (nuclearpower plants)
JRESS
306 A quantification algorithm for a repairable system in theGO methodology (Zupei, Yao, & Xiangrui, 2003)
The GO methodology Quantitative Epmpirical data Mechanics (engineering) JRESS
307 Fault-tree structures of override control systems(Ju, Chen, & Chang, 2003)
Fault-Tree Analysis (FTA) Qualitative Theoretical foundations Industry (chemical plants) JRESS
308 Safety analysis of the height control system for theElbtunnel (Ortmeier et al., 2003)
Fault-Tree Analysis (FTA) Qualitative Empirical data Mechanics (tunneling) JRESS
309 Sequential application of heterogeneous models for thesafety analysis of a control system: a case study (Bobbioet al., 2003)
FTA, Bayesian Network &Stochastic Petri Net (SPN)
Qualitative Empirical data Industry (powergeneration systems)
JRESS
310 A rule induction approach to improve Monte Carlosystem reliability assessment (Rocco, 2003)
Decision Tree Approach Qualitative Dataset All JRESS
311 Posbist fault-tree analysis of coherent systems (Huang,Tong, & Zuo, 2004)
Posbist Fault-Tree Analysis Qualitative& Quantitative
Statistical data& Fuzzy sets
Mechanics (coherent systems) JRESS
312 Monte Carlo estimation of the differential importancemeasure: application to the protection system ofa nuclear reactor (Marseguerra & Zio, 2004)
Monte Carlo simulation Quantitative Empirical data Industry (nuclearpower plants)
JRESS
313 Dynamic reliability and risk assessment of the accidentlocalization system of the Ignalina NPP RBMK-1500reactor (Kopustinskas, Augutis, & Rimkevi�cius, 2005)
Accident Localization System,FTA & ALS dynamic model
Qualitative& Quantitative
Theoretical foundations Mechanics JRESS
314 Fault-tree construction of hybrid system requirementsusing qualitative formal method (Lee & Cha, 2005)
FTA & Causal RequirementsSafety Analysis (CRSA)
Qualitative Empirical data Mechanics JRESS
315 Approximate estimation of system reliability via faulttrees (Dutuit & Rauzy, 2005)
FTA & Binary DecisionDiagrams (BDD)
Qualitative& Quantitative
Empirical data Industry JRESS
316 Risk-informed design of IRIS using a level-1probabilistic risk assessment from its conceptual designphase (Mizuno, Ninokata, & Finnicum, 2005)
PRA Qualitative& Quantitative
Database Industry (nuclearpower plants)
JRESS
317 A quantitative assessment of LCOs for operations usingsystem dynamics (Kang & Jae, 2005)
PRA & System dynamicsmethod
Quantitative Empirical data Industry (nuclearpower plants)
JRESS
318 A Monte Carlo simulation approach for approximatingmulti-state two-terminal reliability (Ramirez-Marquez& Coit, 2005)
Monte Carlo simulation Quantitative Empirical data All JRESS
319 A discrete-time Bayesian network reliability modelingand analysis framework (Boudali & Dugan, 2005)
PRA: Fault-Tree Analysis& Bayesian Networks
Qualitative& Quantitative
Empirical data Industry JRESS
320 Biased Monte Carlo optimization: the basic approach(Campioni, Scardovelli, & Vestrucci, 2005)
Monte Carlo method (MC)& Importance Sampling (IS)technique
Quantitative Empirical data All JRESS
321 Analysis of truncation limit in probabilistic safetyassessment (�Cepin, 2005)
Probabilistic SafetyAssessment
Quantitative Theoretical foundations& Case study
All JRESS
322 Software safety analysis of function block diagramsusing fault trees (Oh, Yoo, Cha, & Son, 2005)
FTA Qualitative Empirical data Industry (nuclearpower plants)
JRESS
323 Monte Carlo-based assessment of system availability. Acase study for cogeneration plants (Marquez, Heguedas,& Iung, 2005)
Monte Carlo method(MC)
Quantitative Empirical data Industry (Electrical powergeneration systems)
JRESS
324 Enhancing software safety by fault trees: experiencesfrom an application to flight critical software (Weber,Tondok, & Bachmayer, 2005)
FTA Qualitative Empirical data Mechanics (aviation) JRESS
325 A historical overview of probabilistic risk-assessmentdevelopment and its use in the nuclear power industry:a tribute to the late Professor Norman Carl Rasmussen(Keller & Modarres, 2005)
PSA Quantitative Theoretical foundations& Case study
Industry (nuclearpower plants)
JRESS
326 First-order differential sensitivity analysis of a nuclearsafety system by Monte Carlo simulation (Marseguerra,Zio, & Podofillini, 2005)
Monte Carlo method(MC)
Quantitative Empirical data Industry (nuclearpower plants)
JRESS
327 Optimal maintenance decisions under imperfectinspection (Kallen & van Noortwijk, 2005)
Risk-Based Inspection(RBI) techniques
Quantitative Empirical data Industry JRESS
(continued on next page)
P.K.M
arhavilaset
al./Journal
ofLoss
Preventionin
theProcess
Industries24
(2011)477
e523
511

Table A. (continued )
Nr Paper Citation Technique’s name Method’s type Type of paper dataor material
Field of application Journal
(A) (B) (C) (D) (E) (F) (G)
328 A support tool for identifying evaluation issues of roadsafety measures (Jagtman, Hale, & Heijer, 2005)
HAZOP Qualitative Empirical data Industry JRESS
329 Evaluation of tunnel safety: toward an economic safetyoptimum (Arends, Jonkman, Vrijling, & van Gelder,2005)
PSA Quantitative Empirical data Industry (tunnels) JRESS
330 Identification of reference accident scenarios in SEVESOestablishments (Delvosalle et al., 2005)
FTA, ETA & Identificationof Major Accident Hazards(MIMAH) methodology
Qualitative Accident data& Empirical data
Industry JRESS
331 A synergetic approach for assessing and improvingequipment performance in offshore industry based ondependability (Ebrahimipour & Suzuki, 2006)
Principle ComponentAnalysis, ImportanceAnalysis & DataEnvelopment Analysis
Quantitative Fuzzy sets Industry JRESS
332 Evaluation and comparison of estimation methods forfailure rates and probabilities (Vaurio & Jänkälä, 2006)
Parametric Robust EmpiricalBayes (PREB) estimationmethodology
Quantitative Empirical data Industry JRESS
333 An analytic model for situation assessment of nuclearpower plant operators based on Bayesian inference(Kim & Seong, 2006)
Human Reliability Analysis(HRA) methods
Quantitative Empirical data Industry (nuclearpower plants)
JRESS
334 The ‘PROCESO’ index: a new methodology for theevaluation of operational safety in the chemicalindustry (Maroño, Peña, & Santamaria, 2006)
Operational Safety Index:the ‘Proceso’ Index(PROCedure for theEvaluation of Operational Safety)
Quantitative Dataset Industry (chemicalprocess plants)
JRESS
335 Causeeconsequence analysis of non-repairable phasedmissions (Vyzaite, Dunnett, & Andrews, 2006)
The Causeeconsequencediagram methods
Qualitative& Quantitative
Accident data Industry (non-repairablephased missions)
JRESS
336 Reliability evaluation of the power supply of anelectrical power net for safety-relevant applications(Dominguez-Garcia, Kassakian, & Schindall, 2006)
FMEA & Markov model Qualitative& Quantitative
Empirical data Mechanics JRESS
337 Application of Bayesian network to the probabilistic riskassessment of nuclear waste disposal (Lee & Lee, 2006)
Bayesian network Quantitative Empirical data Industry (nuclearwaste disposal)
JRESS
338 Process monitoring based on classification tree anddiscriminant analysis (Zhou, Hahn, & Mannan, 2006)
Classification tree &Fisher DiscriminantAnalysis (FDA)
Quantitative Case study Industry (processmonitoring)
JRESS
339 Bayesian framework for managing preferences indecision-making (Maes & Faber, 2006)
Bayesian approach Quantitative Empirical data Industry JRESS
340 Gradient and parameter sensitivity estimation forsystems evaluated using Monte Carlo analysis(Ahammed & Melchers, 2006)
Monte Carlo analysis Quantitative Theoretical foundations All JRESS
341 Application of condition-based HRA method fora manual actuation of the safety features in a nuclearpower Plant (Kang & Jang, 2006)
condition-based HRAmethod (CBHRA)
Quantitative Empirical data Industry (nuclearpower plants)
JRESS
342 Reliability-based failure cause assessment of collapsedbridge during construction (Choi, Lee, Choi, Cho,& Mahadevan, 2006)
ETA & Bayesian approach Qualitative& Quantitative
Empirical data Mechanics(construction)
JRESS
343 A fuzzy modeling application of CREAM methodologyfor human reliability analysis (Konstandinidou,Nivolianitou, Kiranoudis, & Markatos, 2006)
CREAM methodology Quantitative Fuzzy sets Industry JRESS
344 Reliability analysis of reinforced concrete grids withnonlinear material behavior (Neves, Chateauneuf,Venturini, & Lemaire, 2006)
Reliability analysis Quantitative Empirical data Mechanics (construction) JRESS
345 Bayesian analysis of repairable systems showinga bounded failure intensity (Guida & Pulcini, 2006)
The Bayesian procedure Quantitative Dataset Mechanics JRESS
346 A combined goal programmingdAHP approach tomaintenance selection problem (Bertolini & Bevilacqua,2006)
The Analytic HierarchyProcess (AHP) technique
Quantitative Empirical data Industry (oil refinery plants) JRESS
P.K.M
arhavilaset
al./Journal
ofLoss
Preventionin
theProcess
Industries24
(2011)477
e523
512

347 Designing a Bayesian network for preventivemaintenance from expert opinions in a rapid andreliable way (Celeux, Corset, Lannoy, & Ricard, 2006)
Bayesian Network Quantitative Empirical data Industry (nuclearpower plants)
JRESS
348 Reprioritization of failures in a system failure mode andeffects analysis by decision-making trial and evaluationlaboratory technique (Seyed-Hosseini, Safaei,& Asgharpour, 2006)
FMEA & Decision-MakingTrial and Evaluation Laboratorytechnique (DEMATEL)
Quantitative Empirical data All JRESS
349 A supplemental algorithm for the repairable system inthe GO methodology (Shen, Dai, & Huang, 2006)
The GO methodology Quantitative Theoretical foundation All JRESS
350 An evaluation system of the setting up of predictivemaintenance programmes (Carnero, 2006)
The Analytic HierarchyProcess (AHP) technique
Qualitative& Quantitative
Theoretical foundation Mechanics JRESS
351 Cause and effect analysis by fuzzy relational equationsand a genetic algorithm (Rotshtein, Posner,& Rakytyanska, 2006)
Cause and effectanalysis
Quantitative Fuzzy sets Industry (expert systemsof diagnosis andquality control)
JRESS
352 The use of global uncertainty methods for theevaluation of combustion mechanisms (Tomlin, 2006)
Monte Carlo & MorrisMethod
Quantitative Empirical data Iindustry (Chemical) JRESS
353 Local and global uncertainty analysis of complexchemical kinetic systems (Zádor, Zsély, & Turányi, 2006)
Monte Carlo & MorrisMethod
Quantitative Empirical data Iindustry (Chemical) JRESS
354 Sensitivity estimations for Bayesian inference modelssolved by MCMC methods (Pérez, Martín, & Rufo, 2006)
Markov ChainMonte Carlo(MCMC) methods
Quantitative Empirical data Industry (nuclearpower plants)
JRESS
355 Multidisciplinary perspective on accident investigation(Basnyat, Chozos, & Palanque, 2006)
Human ErrorAnalysis (HEA) &Barrier analysis
Qualitative Accidents data Industry (mining) JRESS
356 Bayesian networks in reliability (Langseth & Portinale,2006)
Bayesian Networks Quantitative Empirical data Mechanics JRESS
357 Deterministic and stochastic approach for safety andreliability optimization of captive power plantmaintenance scheduling using GA/SA-based hybridtechniques: A comparison of results (Mohanta, Sadhu,& Chakrabarti, 2007)
Levelized reservemethod & Levelizedrisk method
Quantitative Empirical data Industry (aluminium) JRESS
358 The simulator experimental study on the operatorreliability of Qinshan nuclear power plant (Zhang, He,Dai, & Huang, 2007)
Human ReliabilityAnalysis (HRA)
Quantitative Theoretical foundation& Case study
Industry (nuclearpower plants)
JRESS
359 Formal safety assessment based on relative risks modelin ship navigation (Hu, Fang, Xia, & Xi, 2007)
Formal SafetyAssessment (FSA)
Quantitative Fuzzy sets Industry (ship navigation) JRESS
360 Practical extensions to NHPP application in repairablesystem reliability analysis (Krivtsov, 2007)
Non-homogeneousPoisson Process(NHPP)
Quantitative Facts Industry JRESS
361 A support vector machine integrated system for theclassification of operation anomalies in nuclearcomponents and systems (Rocco & Zio, 2007)
Support VectorMachine (SVM)approach
Quantitative Facts Industry (nuclearpower plants)
JRESS
362 Bayesian risk-based decision method for modelvalidation under uncertainty (Jiang & Mahadevan,2007)
Bayesian Risk-BasedDecision method
Quantitative Experimental data All JRESS
363 Proposal for a sustainable framework process for thegeneration, validation, and application of humanreliability assessment within the engineering designlifecycle (Kennedy, Siemieniuch, Sinclair, Kirwan,& Gibson, 2007)
Human ReliabilityAssessment (HRA)techniques
Qualitative& Quantitative
Facts Mechanics JRESS
364 An analytic solution for a fault tree with circular logicsin which the systems are linearly interrelated (Lim& Jang, 2007)
FTA Quantitative Theoretical foundation All JRESS
365 A Monte Carlo simulation approach to the availabilityassessment of multi-state systems with operationaldependencies (Zio, Marella, & Podofillini, 2007a,b)
Monte Carlosimulationapproach
Quantitative Theoretical foundation& Case study
All JRESS
366 Seismic PSA method for multiple nuclear power plantsin a site (Hakata, 2007)
PSA Quantitative Facts Industry (nuclearpower plants)
JRESS
(continued on next page)
P.K.M
arhavilaset
al./Journal
ofLoss
Preventionin
theProcess
Industries24
(2011)477
e523
513
s
s
s
s
s

Table A. (continued )
Nr Paper Citation Technique’s name Method’s type Type of paper dataor material
Field of application Journal
(A) (B) (C) (D) (E) (F) (G)
367 Test interval optimization of safety systems of nuclearpower plant using fuzzy-genetic approach (Rao, Gopika,Kushwaha, Verma, & Srividya, 2007; Rao, Kushwaha,Verma, & Srividya, 2007)
PSA Quantitative Fuzzy sets Industry (nuclearpower plants)
JRESS
368 Quantification of epistemic and aleatory uncertaintiesin level-1 probabilistic safety assessment studies (Rao,Kushwaha, Verma, & Srividya, 2007)
PSA Quantitative Facts Industry (nuclearpower plants)
JRESS
369 A practical method for accurate quantification of largefault trees (Choi & Cho, 2007)
The (MinimalCut Set) MCS-basedfault-tree method
Quantitative Theoretical foundations All JRESS
370 Incorporating organizational factors into probabilisticsafety assessment of nuclear power plants throughcanonical probabilistic models (Galán, Mosleh,& Izquierdo, 2007)
PSA & BayesianNetworks
Quantitative Dataset Industry (nuclearpower plants)
JRESS
371 EUROCONTROLdSystemic Occurrence AnalysisMethodology (SOAM)dA “Reason”-basedorganizational methodology for analyzing incidents andaccidents (Licu, Cioran, Hayward, & Lowe, 2007)
The Safety OccurrenceAnalysis Methodology(SOAM)
Qualitative Facts Industry JRESS
372 Condition-based fault-tree analysis (CBFTA): A newmethod for improved fault-tree analysis (FTA),reliability and safety calculations (Shalev & Tiran, 2007)
Condition-BasedFTA (CBFTA)
Quantitative Statistical data Mechanics JRESS
373 Thermalehydraulic passive system reliability-baseddesign approach (Burgazzi, 2007)
Limit State Function(LSF)-based approach
Quantitative Empirical data Mechanics JRESS
374 Importance measures-based prioritization forimproving the performance of multi-state systems:application to the railway industry (Zio, Marella,& Podofillini, 2007)
The Monte Carlo(MC) method
Quantitative Empirical data Industry (railway) JRESS
375 An improved decomposition scheme for assessing thereliability of embedded systems by using dynamic faulttrees (Huang & Chang, 2007)
Dynamic Fault-TreesAnalysis (DyFA)
Quantitative Theoretical foundations All JRESS
376 Bayesian networks for multilevel system reliability(Wilson & Huzurbazar, 2007)
Bayesian Networks(BNs)
Quantitative Theoretical foundations All JRESS
377 Addressing dependability by applying an approach formodel-based risk assessment (Gran, Fredriksen,& Thunem, 2007)
Model-BasedRisk-Assessment(MBRA) approach
Qualitative Theoretical foundations All JRESS
378 Using fuzzy self-organizing maps for safety-criticalsystems (Kurd & Kelly, 2007)
FMEA Qualitative& Quantitative
Fuzzy sets Mechanics JRESS
379 Analysis of surveillance test interval by Markov processfor SDS1 in CANDU nuclear power plants (Cho & Jiang,2008)
Markov process Quantitative Empirical data Industry (nuclearpower plants)
JRESS
380 A simplified CREAM prospective quantification processand its application (He, Wang, Shen, & Huang, 2008)
CREAM Quantitative Empirical data Industry (nuclearpower plants)
JRESS
381 The MDTA-based method for assessing diagnosisfailures and their risk impacts in nuclear power plants(Kim, Jung, & Son, 2008)
The MDTA-basedmethod
Qualitative& Quantitative
Empirical data Industry (nuclearpower plants)
JRESS
382 An analytical approach to quantitative effect estimationof operation advisory system based on human cognitiveprocess using the Bayesian belief network (Lee, Kim,& Seong, 2008)
The Bayesian BeliefNetwork model
Qualitative& Quantitative
Theoretical foundations Industry (nuclearpower plants)
JRESS
383 A new method for estimating human errorprobabilities: AHPeSLIM (Park & Lee, 2008)
AHPeSLIM method(Analytic HierarchyProcess e SuccessLikelihood IndexMethod)
Qualitative& Quantitative
Empirical data All JRESS
P.K.M
arhavilaset
al./Journal
ofLoss
Preventionin
theProcess
Industries24
(2011)477
e523
514
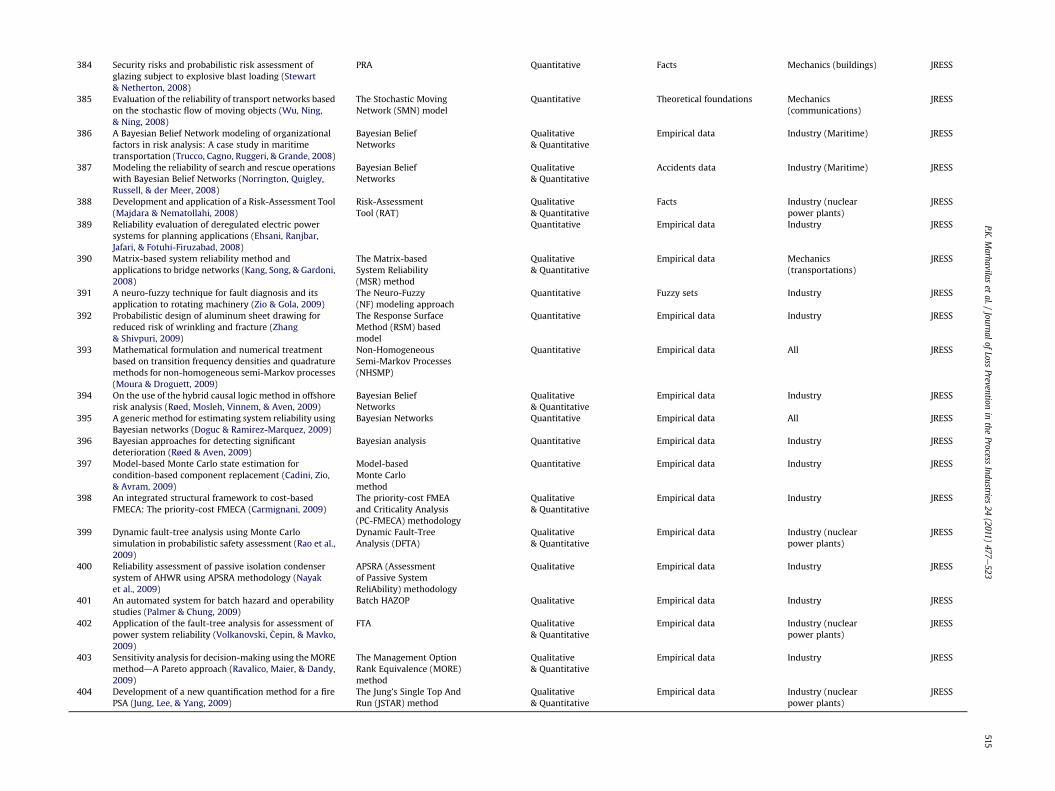
384 Security risks and probabilistic risk assessment ofglazing subject to explosive blast loading (Stewart& Netherton, 2008)
PRA Quantitative Facts Mechanics (buildings) JRESS
385 Evaluation of the reliability of transport networks basedon the stochastic flow of moving objects (Wu, Ning,& Ning, 2008)
The Stochastic MovingNetwork (SMN) model
Quantitative Theoretical foundations Mechanics(communications)
JRESS
386 A Bayesian Belief Network modeling of organizationalfactors in risk analysis: A case study in maritimetransportation (Trucco, Cagno, Ruggeri, & Grande, 2008)
Bayesian BeliefNetworks
Qualitative& Quantitative
Empirical data Industry (Maritime) JRESS
387 Modeling the reliability of search and rescue operationswith Bayesian Belief Networks (Norrington, Quigley,Russell, & der Meer, 2008)
Bayesian BeliefNetworks
Qualitative& Quantitative
Accidents data Industry (Maritime) JRESS
388 Development and application of a Risk-Assessment Tool(Majdara & Nematollahi, 2008)
Risk-AssessmentTool (RAT)
Qualitative& Quantitative
Facts Industry (nuclearpower plants)
JRESS
389 Reliability evaluation of deregulated electric powersystems for planning applications (Ehsani, Ranjbar,Jafari, & Fotuhi-Firuzabad, 2008)
Quantitative Empirical data Industry JRESS
390 Matrix-based system reliability method andapplications to bridge networks (Kang, Song, & Gardoni,2008)
The Matrix-basedSystem Reliability(MSR) method
Qualitative& Quantitative
Empirical data Mechanics(transportations)
JRESS
391 A neuro-fuzzy technique for fault diagnosis and itsapplication to rotating machinery (Zio & Gola, 2009)
The Neuro-Fuzzy(NF) modeling approach
Quantitative Fuzzy sets Industry JRESS
392 Probabilistic design of aluminum sheet drawing forreduced risk of wrinkling and fracture (Zhang& Shivpuri, 2009)
The Response SurfaceMethod (RSM) basedmodel
Quantitative Empirical data Industry JRESS
393 Mathematical formulation and numerical treatmentbased on transition frequency densities and quadraturemethods for non-homogeneous semi-Markov processes(Moura & Droguett, 2009)
Non-HomogeneousSemi-Markov Processes(NHSMP)
Quantitative Empirical data All JRESS
394 On the use of the hybrid causal logic method in offshorerisk analysis (Røed, Mosleh, Vinnem, & Aven, 2009)
Bayesian BeliefNetworks
Qualitative& Quantitative
Empirical data Industry JRESS
395 A generic method for estimating system reliability usingBayesian networks (Doguc & Ramirez-Marquez, 2009)
Bayesian Networks Quantitative Empirical data All JRESS
396 Bayesian approaches for detecting significantdeterioration (Røed & Aven, 2009)
Bayesian analysis Quantitative Empirical data Industry JRESS
397 Model-based Monte Carlo state estimation forcondition-based component replacement (Cadini, Zio,& Avram, 2009)
Model-basedMonte Carlomethod
Quantitative Empirical data Industry JRESS
398 An integrated structural framework to cost-basedFMECA: The priority-cost FMECA (Carmignani, 2009)
The priority-cost FMEAand Criticality Analysis(PC-FMECA) methodology
Qualitative& Quantitative
Empirical data Industry JRESS
399 Dynamic fault-tree analysis using Monte Carlosimulation in probabilistic safety assessment (Rao et al.,2009)
Dynamic Fault-TreeAnalysis (DFTA)
Qualitative& Quantitative
Empirical data Industry (nuclearpower plants)
JRESS
400 Reliability assessment of passive isolation condensersystem of AHWR using APSRA methodology (Nayaket al., 2009)
APSRA (Assessmentof Passive SystemReliAbility) methodology
Qualitative Empirical data Industry JRESS
401 An automated system for batch hazard and operabilitystudies (Palmer & Chung, 2009)
Batch HAZOP Qualitative Empirical data Industry JRESS
402 Application of the fault-tree analysis for assessment ofpower system reliability (Volkanovski, �Cepin, & Mavko,2009)
FTA Qualitative& Quantitative
Empirical data Industry (nuclearpower plants)
JRESS
403 Sensitivity analysis for decision-making using theMOREmethoddA Pareto approach (Ravalico, Maier, & Dandy,2009)
The Management OptionRank Equivalence (MORE)method
Qualitative& Quantitative
Empirical data Industry JRESS
404 Development of a new quantification method for a firePSA (Jung, Lee, & Yang, 2009)
The Jung’s Single Top AndRun (JSTAR) method
Qualitative& Quantitative
Empirical data Industry (nuclearpower plants)
JRESS
P.K.M
arhavilaset
al./Journal
ofLoss
Preventionin
theProcess
Industries24
(2011)477
e523
515
P.K. Marhavilas et al. / Journal of Loss Prevention in the Process Industries 24 (2011) 477e523516
Annotations: JSS: Safety Science; JLPPI: Journal of Loss Prevention inthe Process Industries; JAAP: Accident Analysis and Prevention; JSR:Journal of Safety Research; IJIE: International Journal of IndustrialErgonomics; JRESS: Reliability Engineering & System Safety.
References
Abdalla, I. M. (2005). Effectiveness of safety belts and hierarchical Bayesian analysisof their relative use. Safety Science, 43(2), 91e103.
Abdel-Aty, M., Devarasetty, P. C., & Pande, A. (2009). Safety evaluation of multilanearterials in Florida. Accident Analysis and Prevention, 41(4), 777e788.
Ahammed, M., & Melchers, R. E. (2006). Gradient and parameter sensitivity esti-mation for systems evaluated using Monte Carlo analysis. Reliability Engineering& System Safety, 91(5), 594e601.
Akason, J. B., Olafsson, S., & Sigbjörnsson, R. (2006). Perception and observation ofresidential safety during earthquake exposure: a case study. Safety Science,44(10), 919e933.
Akgüngör, A. P., & Yıldız, O. (2007). Sensitivity analysis of an accident predictionmodel by the fractional factorial method. Accident Analysis and Prevention,39(1), 63e68.
Ale, B. J. M., Baksteen, H., Bellamy, L. J., Bloemhof, A., Goossens, L., Hale, A., et al.(2008). Quantifying occupational risk: the development of an occupational riskmodel. Safety Science, 46(2), 176e185.
Ale, B. J. M., Bellamy, L. J., Cooke, L. J., Goossens, L. H. J., Hale, A. R., Roelen, A. L. C.,et al. (2006). Towards a causal model for air transport safetydan ongoingresearch project. Safety Science, 44(8), 657e673.
Al-Ghamdi, A. S. (2002). Using logistic regression to estimate the influence ofaccident factors on accident severity. Accident Analysis and Prevention, 34(6),729e741.
Anderson, T. K. (2009). Kernel density estimation and K-means clustering to profileroad accident hotspots. Accident Analysis and Prevention, 41(3), 359e364.
Aneziris, O. N., Papazoglou, I. A., Baksteen, H., Mud, M., Ale, B. J., Bellamy, L. J., et al.(2008). Quantified risk assessment for fall from height. Safety Science, 46(2),198e220.
Aneziris, O. N., Papazoglou, I. A., Mud, M. L., Damen, M., Kuiper, J., Baksteen, H., et al.(2008). Towards risk assessment for crane activities. Safety Science, 46(6),872e884.
Antonsen, S. (2009). The relationship between culture and safety on offshore supplyvessels. Safety Science, 47(8), 1118e1128.
Apeland, S., Aven, T., & Nilsen, T. (2002). Quantifying uncertainty under a predictive,epistemic approach to risk analysis. Reliability Engineering & System Safety,75(1), 93e102.
Arends, B. J., Jonkman, S. N., Vrijling, J. K., & van Gelder, P. H. A. J. M. (2005). Eval-uation of tunnel safety: towards an economic safety optimum. ReliabilityEngineering & System Safety, 90(2e3), 217e228.
Arocena, P., Núñez, I., & Villanueva, M. (2008). The impact of prevention measuresand organisational factors on occupational injuries. Safety Science, 46(9),1369e1384.
Arvanitogeorgos, A. (1999). Risk analysis in industry. Greek Institute of Health andSafety in the Work, ELINYAE. ISBN 960-7678-16-2.
Attwood, D., Khan, F., & Veitch, B. (2006a). Occupational accident models. Journal ofLoss Prevention in the Process Industries, 19(6), 664e682.
Attwood, D., Khan, F., & Veitch, B. (2006b). Offshore oil and gas occupational acci-dentsdwhat is important? Journal of Loss Prevention in the Process Industries,19(5), 386e398.
Aven, T. (2009). Safety is the antonym of risk for some perspectives of risk. SafetyScience, 47(7), 925e930.
Ayomoh, M. K. O., & Oke, S. A. (2006). A framework for measuring safety level forproduction environments. Safety Science, 44(3), 221e239.
Ayyub, B. M. (2003). Risk analysis in engineering and economics. Chapman & Hall/CRC, ISBN 1-58488-395-2.
Bajcar, T., �Sirok, B., Cimerman, F., & Eberlinc, M. (2008). Quantification of impact ofline markers on risk on transmission pipelines with natural gas. Journal of LossPrevention in the Process Industries, 21(6), 613e619.
Balkey, J. P., & Phillips, J. H. (1993). Using OSHA process safety management standardto reduce human error, PVP. In Reliability and risk in pressure vessels and piping,vol. 251. New York: ASME.
Bao, S., Spielholz, P., Howard, N., & Silverstein, B. (2009). Force measurement in fieldergonomics research and application. International Journal of Industrial Ergo-nomics, 39(2), 333e340.
Baraldi, D., Venetsanos, A. G., Papanikolaou, E., Heitsch, M., & Dallas, V. (2009).Numerical analysis of release, dispersion and combustion of liquid hydrogen ina mock-up hydrogen refuelling station. Journal of Loss Prevention in the ProcessIndustries, 22(3), 303e315.
Baram, M. (2009). Globalization and workplace hazards in developing nations.Safety Science, 47(6), 756e766.
Baril-Gingras, G., Bellemare, M., & Brun, J. P. (2006). The contribution of qualitativeanalyses of occupational health and safety interventions: an example througha study of external advisory interventions. Safety Science, 44(10), 851e874.
Bartolozzi, V., Castiglione, L., Picciotto, A., & Galluzzo, M. (2000). Qualitative modelsof equipment units and their use in automatic HAZOP analysis. ReliabilityEngineering & System Safety, 70(1), 49e57.
Basnyat, S., Chozos, N., & Palanque, P. (2006). Multidisciplinary perspective onaccident investigation. Reliability Engineering & System Safety, 91(12),1502e1520.
Baumont, G., Ménage, F., Schneiter, J. R., Spurgin, A., & Vogel, A. (2000). Quantifyinghuman and organisational factors in accident management using decisiontrees: the HORAAM method. Reliability Engineering & System Safety, 70(2),113e124.
Baysari, M. T., Caponecchia, C., McIntosh, A. S., & Wilson, J. R. (2009). Classificationof errors contributing to rail incidents and accidents: a comparison of twohuman error identification techniques. Safety Science, 47(7), 948e957.
Baysari, M. T., McIntosh, A. S., & Wilson, J. R. (2008). Understanding the humanfactors contribution to railway accidents and incidents in Australia. AccidentAnalysis and Prevention, 40(5), 1750e1757.
Bédard-Tremblay, L., Fang, L., Bauwens, L., Cheng, Z., & Tchouvelev, A. V. (2008).Numerical simulation of hydrogeneair detonation for damage assessment inrealistic accident scenarios. Journal of Loss Prevention in the Process Industries,21(2), 154e161.
Beim, G. K., & Hobbs, B. F. (1997). Event tree analysis of lock closure risks. Journal ofWater Resources Planning and Management ASCE, 123, 137e198.
Bellamy, L. J., Geyer, T. A. W., & Wilkinson, J. (2008). Development of a functionalmodel which integrates human factors, safety management systems and widerorganisational issues. Safety Science, 46(3), 461e492.
Bernatik, A., & Libisova, M. (2004). Loss prevention in heavy industry: risk assess-ment of large gasholders. Journal of Loss Prevention in the Process Industries,17(4), 271e278.
Bertolini, M., & Bevilacqua, M. (2006). A combined goal programmingdAHPapproach to maintenance selection problem. Reliability Engineering & SystemSafety, 91(7), 839e848.
Blanch, A., Torrelles, B., Aluja, A., & Salinas, J. A. (2009). Age and lost working days asa result of an occupational accident: a study in a shiftwork rotation system.Safety Science, 47(10), 1359e1363.
Bobbio, A., Ciancamerla, E., Franceschinis, G., Gaeta, R., Minichino, M., & Portinale, L.(2003). Sequential application of heterogeneous models for the safetyanalysisof a control system: a case study. Reliability Engineering & System Safety, 81(3),269e280.
Bobbio, A., Portinale, L., Minichino, M., & Ciancamerla, E. (2001). Improving theanalysis of dependable systems by mapping fault trees into Bayesian networks.Reliability Engineering & System Safety, 71(3), 249e260.
Borgonovo, E., & Apostolakis, G. E. (2001). A new importance measure for risk-informed decisionmaking. Reliability Engineering & System Safety, 72(2),193e212.
van der Borst, M., & Schoonakker, H. (2001). An overview of PSA importancemeasures. Reliability Engineering & System Safety, 72(3), 241e245.
Bottani, E., Monica, L., & Vignali, G. (2009). Safety management systems: perfor-mance differences between adopters and non-adopters. Safety Science, 47(2),155e162.
Boudali, H., & Dugan, J. B. (2005). A discrete-time Bayesian network reliabilitymodelling and analysis framework. Reliability Engineering & System Safety,87(3), 337e349.
Brauchler, R., & Landau, K. (1998). Task analysis. Part II e the scientific basis(knowledge base for the guide). International Journal of Industrial Ergonomics,22(1e2), 13e35.
Bubbico, R., Ferrari, C., & Mazzarotta, B. (2000). Risk analysis of LPG transport byroad and rail. Journal of Loss Prevention in the Process Industries, 13(1), 27e31.
Burgazzi, L. (2007). Thermalehydraulic passive system reliability-based designapproach. Reliability Engineering & System Safety, 92(9), 1250e1257.
Burns, K., & Turcotte, R. (2000). Prioritizing and quantifying the risk of outstandingcorrective actions. Reliability Engineering & System Safety, 68(1), 85e94.
Cadini, F., Zio, E., & Avram, D. (2009). Model-based Monte Carlo state estimation forcondition-based component replacement. Reliability Engineering & SystemSafety, 94(3), 752e758.
Cagno, E., Caron, F., & Mancini, M. (2002). Risk analysis in plant commissioning: themultilevel Hazop. Reliability Engineering & System Safety, 77(3), 309e323.
Cagno, E., Di Giulio, A., & Trucco, P. (2001). An algorithm for the implementation ofsafety improvement programs. Safety Science, 37(1), 59e75.
Camargo, J. B., Jr., Canzian, E., Almeida, J. R., Jr., Paz, S. M., & Basseto, B. A. (2001).Quantitative analysis methodology in safety-critical microprocessor applica-tions. Reliability Engineering & System Safety, 74(1), 53e62.
Cameron, R. F., & Willers, A. (2001). Use of risk assessment in the nuclear industrywith specific reference to the Australian situation. Reliability Engineering &System Safety, 74(3), 275e282.
Campioni, L., Scardovelli, R., & Vestrucci, P. (2005). Biased Monte Carlo optimiza-tion: the basic approach. Reliability Engineering & System Safety, 87(3), 387e394.
Campolieti, M. (2001). Multiple state hazard models and workers’ compensationclaims: an examination of workers compensation data from Ontario. AccidentAnalysis and Prevention, 33(2), 197e202.
Carmignani, G. (2009). An integrated structural framework to cost-based FMECA:the priority-cost FMECA. Reliability Engineering & System Safety, 94(4), 861e871.
Carnero, M. C. (2006). An evaluation system of the setting up of predictive main-tenance programmes. Reliability Engineering & System Safety, 91(8), 945e963.
Carvalho, P. V. R., dos Santos, I. L., & Vidal, M. C. R. (2005). Nuclear power plant shiftsupervisor’s decision making during microincidents. International Journal ofIndustrial Ergonomics, 35(7), 619e644.
Celeux, G., Corset, F., Lannoy, A., & Ricard, B. (2006). Designing a Bayesian networkfor preventive maintenance from expert opinions in a rapid and reliable way.Reliability Engineering & System Safety, 91(7), 849e856.

P.K. Marhavilas et al. / Journal of Loss Prevention in the Process Industries 24 (2011) 477e523 517
Celik, M. (2009). Designing of integrated quality and safety management system(IQSMS) for shipping operations. Safety Science, 47(5), 569e577.
Celik, M., & Cebi, S. (2009). Analytical HFACS for investigating human errors inshipping accidents. Accident Analysis and Prevention, 41(1), 66e75.
Cepin, M., & Mavko, B. (2002). A dynamic fault tree. Reliability Engineering & SystemSafety, 75(1), 83e91.
Cepin, M. (2002). Optimization of safety equipment outages improves safety. Reli-ability Engineering & System Safety, 77(1), 71e80.
�Cepin, M. (2005). Analysis of truncation limit in probabilistic safety assessment.Reliability Engineering & System Safety, 87(3), 395e403.
Chang, W. R. (2004). A statistical model to estimate the probability of slip and fallincidents. Safety Science, 42(9), 779e789.
Chang, L. Y., & Chen, W. C. (2005). Data mining of tree-based models to analyzefreeway accident frequency. Journal of Safety Research, 36(4), 365e375.
Chang, S. Y., & Chen, T. H. (2006). Discriminating relative workload level by dataenvelopment analysis. International Journal of Industrial Ergonomics, 36(9),773e778.
Chang, J. I., & Liang, C. L. (2009). Performance evaluation of process safetymanagement systems of paint manufacturing facilities. Journal of Loss Preven-tion in the Process Industries, 22(4), 398e402.
Chang, L. Y., & Wang, H. W. (2006). Analysis of traffic injury severity: an applicationof non-parametric classification tree techniques. Accident Analysis and Preven-tion, 38(5), 1019e1027.
Chatigny, C., & Montreuil, S. (2003). Apprenticeship in a work setting: the contri-bution and limits of operational resources constructed by workers. SafetyScience, 41(4), 377e391.
Chen, G., & Zhang, X. (2009). Fuzzy-based methodology for performance assess-ment of emergency planning and its application. Journal of Loss Prevention in theProcess Industries, 22(2), 125e132.
Chen, G., Tao, L., & Zhang, H. (2009). Study on the methodology for evaluating urbanand regional disaster carrying capacity and its application. Safety Science, 47(1),50e58.
Chen, J. R., & Yang, Y. T. (2004). A predictive risk index for safety performance inprocess industries. Journal of Loss Prevention in the Process Industries, 17(3),233e242.
Cho, S., & Jiang, J. (2008). Analysis of surveillance test interval by Markov process forSDS1 in CANDU nuclear power plants. Reliability Engineering & System Safety,93(1), 1e13.
Choi, J. S., & Cho, N. Z. (2007). A practical method for accurate quantification of largefault trees. Reliability Engineering & System Safety, 92(7), 971e982.
Choi, H.-H., Lee, S.-Y., Choi, I.-Y., Cho, H.-N., & Mahadevan, S. (2006). Reliability-based failure cause assessment of collapsed bridge during construction. Reli-ability Engineering & System Safety, 91(6), 674e688.
Chou, J. R., & Hsiao, S. W. (2005). An anthropometric measurement for developingan electric scooter. International Journal of Industrial Ergonomics, 35(11),1047e1063.
Cilingir, C., & Mackhieh, A. (1998). Effects of performance shaping factors on humanerror. International Journal of Industrial Ergonomics, 22, 285e292.
Clutter, J. K., & Whitney, M. G. (2001). Use of computational modelling to identifythe cause of vapor cloud explosion incidents. Journal of Loss Prevention in theProcess Industries, 14(5), 337e347.
Cocchiara, M., Bartolozzi, V., Picciotto, A., & Galluzzo, M. (2001). Integration ofinterlock system analysis with automated HAZOP analysis. Reliability Engi-neering & System Safety, 74(1), 99e105.
Colli, A., Arellano, A. L. V., Kirchsteiger, C., & Ale, B. J. M. (2009). Risk characterisationindicators for risk comparison in the energy sector. Safety Science, 47(1), 59e77.
Colli, A., Serbanescu, D., & Ale, B. J. M. (2009). Indicators to compare risk expres-sions, grouping, and relative ranking of risk for energy systems: applicationwith some accidental events from fossil fuels. Safety Science, 47(5), 591e607.
Cordella, M., Tugnoli, A., Barontini, F., Spadoni, G., & Cozzani, V. (2009). Inherentsafety of substances: identification of accidental scenarios due to decomposi-tion products. Journal of Loss Prevention in the Process Industries, 22(4),455e462.
Cormier, B. R., Qi, R., Yun, G. W., Zhang, Y., & Mannan, M. S. (2009). Application ofcomputational fluid dynamics for LNG vapor dispersion modelling: a study ofkey parameters. Journal of Loss Prevention in the Process Industries, 22(3),332e352.
Costella, M. F., Saurin, T. A., & de Macedo Guimarães, L. B. (2009). A method forassessing health and safety management systems from the resilience engi-neering perspective. Safety Science, 47(8), 1056e1067.
Cozzani, V., Antonioni, G., & Spadoni, G. (2006). Quantitative assessment of dominoscenarios by a GIS-based software tool. Journal of Loss Prevention in the ProcessIndustries, 19(5), 463e477.
Cronin, K., Byrne, E., & O’Leary, P. (2007). Prevention of thermo-hydraulic rupture ofsolvent transfer pipes in the pharmaceutical industry. Journal of Loss Preventionin the Process Industries, 20(1), 7e14.
Da�gdeviren, M., Yüksel, _I, & Kurt, M. (2008). A fuzzy analytic network process (ANP)model to identify faulty behavior risk (FBR) in work system. Safety Science,46(5), 771e783.
Dandrieux-Bony, A., Dimbour, J.-P., & Dusserre, G. (2005). A simple model forcalculating chlorine concentrations behind a water spray in case of smallreleases. Journal of Loss Prevention in the Process Industries, 18(4e6), 245e253.
Date, P., Lade, R. J., Mitra, G., & Moore, P. E. (2009). Modelling the risk of failure inexplosion protection installations. Journal of Loss Prevention in the ProcessIndustries, 22(4), 492e498.
de Souza Porto, M. F., & de Oliveira Fernandes, L. (2006). Understanding risks insocially vulnerable contexts: the case of waste burning in cement kilns in Brazil.Safety Science, 44(3), 241e257.
DeArmond, S., & Chen, P. Y. (2009). Occupational safety: the role of workplacesleepiness. Accident Analysis and Prevention, 41(5), 976e984.
Delvosalle, C., Fiévez, C., Pipart, A., Fabrega, J. C., Planas, E., Christou, M., et al. (2005).Identification of reference accident scenarios in SEVESO establishments. Reli-ability Engineering & System Safety, 90(2e3), 238e246.
Demichela, M., Piccinini, N., & Romano, A. (2004). Risk analysis as a basis for safetymanagement system. Journal of Loss Prevention in the Process Industries, 17(3),179e185.
Dennerlein, J. T., Ronk, C. J., & Perry, M. J. (2009). Portable ladder assessment tooldevelopment and validation e quantifying best practices in the field. SafetyScience, 47(5), 636e639.
Diamantidis, D., Zuccarelli, F., & Westhäuser, A. (2000). Safety of long railwaytunnels. Reliability Engineering & System Safety, 67(2), 135e145.
Doerr, W. W. (1991). What-if analysis. In H. R. Greenberg, & J. J. Cramer (Eds.), Riskassessment and risk management for the chemical process industry. New York:Wiley.
Doguc, O., & Ramirez-Marquez, J. E. (2009). A generic method for estimating systemreliability using Bayesian networks. Reliability Engineering & System Safety,94(2), 542e550.
Dominguez-Garcia, A. D., Kassakian, J. G., & Schindall, J. E. (2006). Reliability eval-uation of the power supply of an electrical power net for safety-relevantapplications. Reliability Engineering & System Safety, 91(5), 505e514.
Dorofeev, S. B., Kuznetsov, M. S., Alekseev, V. I., Efimenko, A. A., & Breitung, W.(2001). Evaluation of limits for effective flame acceleration in hydrogenmixtures. Journal of Loss Prevention in the Process Industries, 14(6), 583e589.
Doytchev, D. E., & Szwillus, G. (2009). Combining task analysis and fault treeanalysis for accident and incident analysis: a case study from Bulgaria. AccidentAnalysis and Prevention, 41(6), 1172e1179.
Doytchev, D. E., & Szwillus, G. (2008). Combining task analysis and fault treeanalysis for accident and incident analysis: a case study from Bulgaria. AccidentAnalysis and Prevention, . doi:10.1016/j.aap.2008.07.014.
van Duijne, F. H., Aken, D., & Schouten, E. G. (2008). Considerations in developingcomplete and quantified methods for risk assessment. Safety Science, 46(2),245e254.
Dutuit, Y., & Rauzy, A. (2001). Efficient algorithms to assess component and gateimportance in fault tree analysis. Reliability Engineering & System Safety, 72(2),213e222.
Dutuit, Y., & Rauzy, A. (2005). Approximate estimation of system reliability via faulttrees. Reliability Engineering & System Safety, 87(2), 163e172.
Dziubi�nski, M., Fratczak, M., & Markowski, A. S. (2006). Aspects of risk analysisassociated with major failures of fuel pipelines. Journal of Loss Prevention in theProcess Industries, 19(5), 399e408.
Ebrahimipour, V., & Suzuki, K. (2006). A synergetic approach for assessing andimproving equipment performance in offshore industry based on depend-ability. Reliability Engineering & System Safety, 91(1), 10e19.
Ehsani, A., Ranjbar, A. M., Jafari, A., & Fotuhi-Firuzabad, M. (2008). Reliabilityevaluation of deregulated electric power systems for planning applications.Reliability Engineering & System Safety, 93(10), 1473e1484.
El-Basyouny, K., & Sayed, T. (2009). Collision prediction models using multivariatePoisson-lognormal regression. Accident Analysis and Prevention, 41(4), 820e828.
Eluru, N., & Bhat, C. R. (2007). A joint econometric analysis of seat belt use andcrash-related injury severity. Accident Analysis and Prevention, 39(5),1037e1049.
Elvik, R. (2008). The predictive validity of empirical Bayes estimates of road safety.Accident Analysis and Prevention, 40(6), 1964e1969.
Etienne, J. (2008). Knowledge transfer in organisational reliability analysis: frompost-accident studies to normal operations studies. Safety Science, 46(10),1420e1434.
Etowa, C. B., Amyotte, P. R., Pegg, M. J., & Khan, F. I. (2002). Quantification ofinherent safety aspects of the Dow indices. Journal of Loss Prevention in theProcess Industries, 15(6), 477e487.
Fabiano, B., Currò, F., Reverberi, A. P., & Pastorino, R. (2005). Dangerous goodtransportation by road: from risk analysis to emergency planning. Journal ofLoss Prevention in the Process Industries, 18(4e6), 403e413.
Fan, C.-F., & Chen, W.-H. (2000). Accident sequence analysis of humanecomputerinterface design. Reliability Engineering & System Safety, 67(1), 29e40.
Fang, D., Shen, Q., Wu, S., & Liu, G. (2003). A comprehensive framework for assessingand selecting appropriate scaffolding based on analytic hierarchy process.Journal of Safety Research, 34(5), 589e596.
Fastenmeier, W., & Gstalter, H. (2007). Driving task analysis as a tool in traffic safetyresearch and practice. Safety Science, 45(9), 952e979.
Fernández-Muñiz, B., Montes-Peón, J. M., & Vázquez-Ordás, C. J. (2009). Relationbetween occupational safety management and firm performance. SafetyScience, 47(7), 980e991.
Ferrero, F., Lohrer, C., Schmidt, B. M., Noll, M., & Malow, M. (2009). A mathematicalmodel to predict the heating-up of large-scale wood piles. Journal of LossPrevention in the Process Industries, 22(4), 439e448.
Fine, W. T., & Kinney, W. D. (1971). Mathematical evaluation for controlling hazards.Journal of Safety Research, 3(4), 157e166.
Fogleman, M., & Lewis, R. J. (2002). Factors associated with self-reported muscu-loskeletal discomfort in video display terminal (VDT) users. International Journalof Industrial Ergonomics, 29(6), 311e318.

P.K. Marhavilas et al. / Journal of Loss Prevention in the Process Industries 24 (2011) 477e523518
Gabbar, H. A. (2007). Improved qualitative fault propagation analysis. Journal of LossPrevention in the Process Industries, 20(3), 260e270.
Galán, S. F., Mosleh, A., & Izquierdo, J. M. (2007). Incorporating organisationalfactors into probabilistic safety assessment of nuclear power plants throughcanonical probabilistic models. Reliability Engineering & System Safety, 92(8),1131e1138.
Garrick, B. J., & Christie, R. F. (2002). Probabilistic risk assessment practices in theUSA for nuclear power plants. Safety Science, 40(1e4), 177e201.
Gavious, A., Mizrahi, S., Shani, Y., & Minchuk, Y. (2009). The costs of industrialaccidents for the organization: developing methods and tools for evaluationand costebenefit analysis of investment in safety. Journal of Loss Prevention inthe Process Industries, 22(4), 434e438.
Gharabagh, M. J., Asilian, H., Mortasavi, S. B., Mogaddam, A. Z., Hajizadeh, E., &Khavanin, A. (2009). Comprehensive risk assessment and management ofpetrochemical feed and product transportation pipelines. Journal of LossPrevention in the Process Industries, 22(4), 533e539.
Gheorghe, A. V., Mock, R., & Kröger, W. (2000). Risk assessment of regional systems.Reliability Engineering & System Safety, 70(2), 141e156.
van Ginneken, J., & Hale, A. (2009). From hanger-on to trendsetter: decision makingon a major safety initiative in a steel company maintenance department. SafetyScience, 47(6), 884e889.
Glickman, T. S., & Erkut, E. (2007). Assessment of hazardous material risks for railyard safety. Safety Science, 45(7), 813e822.
Glickman, T. S., Erkut, E., & Zschocke, M. S. (2007). The cost and risk impacts ofrerouting railroad shipments of hazardous materials. Accident Analysis andPrevention, 39(5), 1015e1025.
Graf, H., & Schmidt-Traub, H. (2000). Early hazard identification of chemical plantswith statechart modelling techniques. Safety Science, 36(1), 49e67.
Gran, B. A. (2002). Assessment of programmable systems using Bayesian belief nets.Safety Science, 40(9), 797e812.
Gran, B. A., Fredriksen, R., & Thunem, A. P.-J. (2007). Addressing dependability byapplying an approach for model-based risk assessment. Reliability Engineering &System Safety, 92(11), 1492e1502.
Grassi, A., Gamberini, R., Mora, C., & Rimini, B. (2009). A fuzzy multi-attribute modelfor risk evaluation in workplaces. Safety Science, 47(5), 707e716.
Guida, M., & Pulcini, G. (2006). Bayesian analysis of repairable systems showinga bounded failure intensity. Reliability Engineering & System Safety, 91(7),828e838.
Guikema, S. D., & Paté-Cornell, M. E. N. (2002). Component choice for managing riskin engineered systems with generalized risk/cost functions. Reliability Engi-neering & System Safety, 78(3), 227e238.
Guo, L., Gao, J., Yang, J., & Kang, J. (2009). Criticality evaluation of petrochemicalequipment based on fuzzy comprehensive evaluation and a BP neural network.Journal of Loss Prevention in the Process Industries, 22(4), 469e476.
Gürcanli, G. E., & Müngen, U. (2009). An occupational safety risk analysis method atconstruction sites using fuzzy sets. International Journal of Industrial Ergonomics,39(2), 371e387.
Haimes, Y. Y. (2009). Risk modelling, assessment, and management (3rd ed.). A JohnWiley & Sons Inc. Publication, ISBN 978-0-470-28237-3.
Hakata, T. (2007). Seismic PSA method for multiple nuclear power plants in a site.Reliability Engineering & System Safety, 92(7), 883e894.
Hämäläinen, P., Saarela, K. L., & Takala, J. (2009). Global trend according to esti-mated number of occupational accidents and fatal work-related diseases atregion and country level. Journal of Safety Research, 40(2), 125e139.
Harb, R., Radwan, E., Yan, X., & Abdel-Aty, M. (2007). Light truck vehicles (LTVs)contribution to rear-end collisions. Accident Analysis and Prevention, 39(5),1026e1036.
Harms-Ringdahl, L. (2001). Safety analysis, principles and practice in occupationalsafety (2nd ed.). CRC Press. ISBN: 9780415236553, p. 302.
Hartzell, G. E. (2001). Engineering analysis of hazards to life safety in fires: the fireeffluent toxicity component. Safety Science, 38(2), 147e155.
Hashimoto, A., & Matsuo, A. (2007). Numerical analysis of gas explosion inside tworooms connected by ducts. Journal of Loss Prevention in the Process Industries,20(4e6), 455e461.
Hauptmanns, U. (2001). A procedure for analyzing the flight of missiles fromexplosions of cylindrical vessels. Journal of Loss Prevention in the ProcessIndustries, 14(5), 395e402.
Hauptmanns, U. (2004). Semi-quantitative fault tree analysis for process plantsafety using frequency and probability ranges. Journal of Loss Prevention in theProcess Industries, 17(5), 339e345.
Hauptmanns, U., Marx, M., & Knetsch, T. (2005). GAPda fault-tree based method-ology for analyzing occupational hazards. Journal of Loss Prevention in theProcess Industries, 18(2), 107e113.
He, X., Wang, Y., Shen, Z., & Huang, X. (2008). A simplified CREAM prospectivequantification process and its application. Reliability Engineering & SystemSafety, 93(2), 298e306.
Hendrick, K., & Benner, L., Jr. (1987). Investigating accidents with STEP. New York:Marcel Dekker Inc.
Henselwood, F., & Phillips, G. (2006). A matrix-based risk assessment approach foraddressing linear hazards such as pipelines. Journal of Loss Prevention in theProcess Industries, 19(5), 433e441.
Hermanns, I., Raffler, N., Ellegast, R. P., Fischer, S., & Göres, B. (2008). Simultaneousfield measuring method of vibration and body posture for assessment of seatedoccupational driving tasks. International Journal of Industrial Ergonomics,38(3e4), 255e263.
Hermans, E., Van den Bossche, F., & Wets, G. (2008). Combining road safety infor-mation in a performance index. Accident Analysis and Prevention, 40(4),1337e1344.
Hirst, W. M., Mountain, L. J., & Maher, M. J. (2004). Sources of error in road safetyscheme evaluation: a quantified comparison of current methods. AccidentAnalysis and Prevention, 36(5), 705e715.
Ho, J. J., Hwang, J. S., & Wang, J. D. (2006). Estimation of reduced life expectancyfrom serious occupational injuries in Taiwan. Accident Analysis and Prevention,38(5), 961e968.
Høivik, D., Tharaldsen, J. E., Baste, V., & Moen, B. E. (2009). What is most importantfor safety climate: the company belonging or the local working environment? Astudy from the Norwegian offshore industry. Safety Science, 47(10), 1324e1331.
Høj, N. P., & Kröger, W. (2002). Risk analyses of transportation on road and railwayfrom a European perspective. Safety Science, 40(1e4), 337e357.
Holcroft, C. A., & Punnett, L. (2009). Work environment risk factors for injuries inwood processing. Journal of Safety Research, 40(4), 247e255.
Hollnagel, E. (2004). Barriers and accident prevention. Aldershot: Ashgate PublishingLimited, UK, ISBN 0-7546-4301-8.
Hollnagel, E. (2006). Resilienceethe challenge of the unstable. In E. Hollnagel,D. D. Woods, & N. Leveson (Eds.), Resilience engineering: Concepts and precepts(pp. 9e17). Aldershot: Ashgate Publishing Limited, UK, ISBN 0-7546-4641-6.
Hollnagel, E., Woods, D. D., & Leveson, N. (2006). Resilience engineering: Conceptsand precepts. Aldershot: Ashgate Publishing Limited, UK, ISBN 0-7546-4641-6.
Hollywell, P. D. (1996). Incorporating human dependent failures in risk assessmentsto improve estimates of actual risk. Safety Science, 22(1e3), 177e194.
Hong, E.-S., Lee, I.-M., Shin, H.-S., Nam, S.-W., & Kong, J.-S. (2009). Quantitative riskevaluation based on event tree analysis technique: application to the design ofshield TBM. Tunnelling and Underground Space Technology, 24(3), 269e277.
Hong, S. W., Han, S. H., & Kim, K. J. (2008). Optimal balancing of multiple affectivesatisfaction dimensions: a case study on mobile phones. International Journal ofIndustrial Ergonomics, 38(3e4), 272e279.
Hu, H., Cheng, G., Li, Y., & Tang, Y. (2009). Risk-based maintenance strategy and itsapplications in a petrochemical reforming reaction system. Journal of LossPrevention in the Process Industries, 22(4), 392e397.
Hu, S., Fang, Q., Xia, H., & Xi, Y. (2007). Formal safety assessment based on relativerisks model in ship navigation. Reliability Engineering & System Safety, 92(3),369e377.
Huang, C.-Y., & Chang, Y.-R. (2007). An improved decomposition scheme forassessing the reliability of embedded systems by using dynamic fault trees.Reliability Engineering & System Safety, 92(10), 1403e1412.
Huang, H.-Z., Tong, X., & Zuo, M. J. (2004). Posbist fault tree analysis of coherentsystems. Reliability Engineering & System Safety, 84(2), 141e148.
Huang, Y. H., Rau, P. L. P., Zhang, B., & Roetting, M. (2008). Chinese truck drivers’attitudes toward feedback by technology: a quantitative approach. AccidentAnalysis and Prevention, 40(4), 1553e1562.
Hwang, S. L., Liang, G. F., Lin, J. T., Yau, Y. J., Yenn, T. C., Hsu, C. C., et al. (2009). A real-time warning model for teamwork performance and system safety in nuclearpower plants. Safety Science, 47(3), 425e435.
Iakovou, E. T. (2001). An interactive multiobjective model for the strategic maritimetransportation of petroleum products: risk analysis and routing. Safety Science,39(1e2), 19e29.
Ibrahim, S. S., Gubba, S. R., Masri, A. R., & Malalasekera, W. (2009). Calculations ofexplosion deflagrating flames using a dynamic flame surface density model.Journal of Loss Prevention in the Process Industries, 22(3), 258e264.
Jacinto, C., Canoa, M., & Soares, C. G. (2009). Workplace and organisational factors inaccident analysis within the Food Industry. Safety Science, 47(5), 626e635.
Jagtman, H. M., Hale, A. R., & Heijer, T. (2005). A support tool for identifying eval-uation issues of road safety measures. Reliability Engineering & System Safety,90(2e3), 206e216.
Jalali, S. E., & Noroozi, M. (2009). Determination of the optimal escape routes ofunderground mine networks in emergency cases. Safety Science, 47(8),1077e1082.
Jiang, X., & Mahadevan, S. (2007). Bayesian risk-based decision method for modelvalidation under uncertainty. Reliability Engineering & System Safety, 92(6),707e718.
Jo, Y.-D., & Ahn, B. J. (2002). Analysis of hazard areas associated with high-pressurenatural-gas pipelines. Journal of Loss Prevention in the Process Industries, 15(3),179e188.
Jo, Y. D., & Park, K. S. (2003). Dynamic management of human error to reduce totalrisk. Journal of Loss Prevention in the Process Industries, 16(4), 313e321.
Johansson, Ö., Wanvik, P. O., & Elvik, R. (2009). A new method for assessing the riskof accident associated with darkness. Accident Analysis and Prevention, 41(4),809e815.
Johnson, C. (2001). A case study in the integration of accident reports and con-structivedesign documents. Reliability Engineering & System Safety, 71(3),311e326.
Johnson, C. W. (2000). Proving properties of accidents. Reliability Engineering &System Safety, 67(2), 175e191.
Jou, Y. T., Lin, C. J., Yenn, T. C., Yang, C. W., Yang, L. C., & Tsai, R. C. (2009). Theimplementation of a human factors engineering checklist for humanesysteminterfaces upgrade in nuclear power plants. Safety Science, 47(7), 1016e1025.
Ju, S.-N., Chen, C.-L., & Chang, C.-T. (2003). Fault-tree structures of override controlsystems. Reliability Engineering & System Safety, 81(2), 163e181.
Jung, Y., Kang, S., Kim, Y. S., & Park, C. (2008). Assessment of safety managementinformation systems for general contractors. Safety Science, 46(4), 661e674.
P.K. Marhavilas et al. / Journal of Loss Prevention in the Process Industries 24 (2011) 477e523 519
Jung, W. S., Lee, Y.-H., & Yang, J.-E. (2009). Development of a new quantificationmethod for a fire PSA. Reliability Engineering & System Safety, 94(10), 1650e1657.
Jung, W. D., Yoon, W. C., & Kim, J. W. (2001). Structured information analysis forhuman reliability analysis of emergency tasks in nuclear power plants. Reli-ability Engineering & System Safety, 71(1), 21e32.
Kallen, M. J., & van Noortwijk, J. M. (2005). Optimal maintenance decisions underimperfect inspection. Reliability Engineering & System Safety, 90(2e3), 177e185.
Kang, H. G., & Jang, S.-C. (2006). Application of condition-based HRA method fora manual actuation of the safety features in a nuclear power Plant. ReliabilityEngineering & System Safety, 91(6), 627e633.
Kang, K. M., & Jae, M. (2005). A quantitative assessment of LCOs for operations usingsystem dynamics. Reliability Engineering & System Safety, 87(2), 211e222.
Kang, H. G., & Sung, T. (2002). An analysis of safety-critical digital systems for risk-informed design. Reliability Engineering & System Safety, 78(3), 307e314.
Kang, W.-H., Song, J., & Gardoni, P. (2008). Matrix-based system reliability methodand applications to bridge networks. Reliability Engineering & System Safety,93(11), 1584e1593.
Karnesky, J., Chatterjee, P., Tamanini, F., & Dorofeev, S. (2007). An application of 3Dgasdynamic modelling for the prediction of overpressures in vented enclosures.Journal of Loss Prevention in the Process Industries, 20(4e6), 447e454.
Karnon, J., McIntosh, A., Dean, J., Bath, P., Hutchinson, A., Oakley, J., et al. (2007).A prospective hazard and improvement analytic approach to predicting theeffectiveness of medication error interventions. Safety Science, 45(4), 523e539.
Katsakiori, P., Sakellaropoulos, G., & Manatakis, E. (2009). Towards an evaluation ofaccident investigation methods in terms of their alignment with accidentcausation models. Safety Science, 47(7), 1007e1015.
Kaya, M. D., Hasiloglu, A. S., Bayramoglu, M., Yesilyurt, H., & Ozok, A. F. (2003).A new approach to estimate anthropometric measurements by adaptive neuro-fuzzy inference system. International Journal of Industrial Ergonomics, 32(2),105e114.
Keller, W., & Modarres, M. (2005). A historical overview of probabilistic riskassessment development and its use in the nuclear power industry: a tribute tothe late Professor Norman Carl Rasmussen. Reliability Engineering & SystemSafety, 89(3), 271e285.
Kennedy, G. A. L., Siemieniuch, C. E., Sinclair, M. A., Kirwan, B. A., & Gibson, W. H.(2007). Proposal for a sustainable framework process for the generation, vali-dation, and application of human reliability assessment within the engineeringdesign lifecycle. Reliability Engineering & System Safety, 92(6), 755e770.
Khan, F. I., & Abbasi, S. A. (1997). Mathematical model for HAZOP study time esti-mation. Journal of Loss Prevention in the Process Industries, 10(4), 249e251.
Khan, F. I., & Abbasi, S. A. (2001). Risk analysis of a typical chemical industry usingORA procedure. Journal of Loss Prevention in the Process Industries, 14(1), 43e59.
Khan, F. I., & Haddara, M. R. (2003). Risk-based maintenance (RBM): a quantitativeapproach for maintenance/inspection scheduling and planning. Journal of LossPrevention in the Process Industries, 16(6), 561e573.
Khan, F. I., Amyotte, P. R., & DiMattia, D. G. (2006). HEPI: a new tool for human errorprobability calculation for offshore operation. Safety Science, 44(4), 313e334.
Khattak, A. J., Khattak, A. J., & Council, F. M. (2002). Effects of work zone presence oninjury and non-injury crashes. Accident Analysis and Prevention, 34(1), 19e29.
Kim, J. W., & Jung, W. D. (2002). An integrated framework to the predictive erroranalysis in emergency situation. Journal of Loss Prevention in the ProcessIndustries, 15(2), 97e104.
Kim, J. W., & Jung, W. D. (2003). A taxonomy of performance influencing factors forhuman reliability analysis of emergency tasks. Journal of Loss Prevention in theProcess Industries, 16(6), 479e495.
Kim, M. C., & Seong, P. H. (2006). An analytic model for situation assessment ofnuclear power plant operators based on Bayesian inference. Reliability Engi-neering & System Safety, 91(3), 270e282.
Kim, S. C., Chang, S. H., & Heo, G. (2006). Team crystallization (SIO2): dynamic modelof team effectiveness evaluation under the dynamic and tactical environment atnuclear installation. Safety Science, 44(8), 701e721.
Kim, J., Jung, W., & Son, Y. S. (2008). The MDTA-based method for assessing diag-nosis failures and their risk impacts in nuclear power plants. Reliability Engi-neering & System Safety, 93(2), 337e349.
Kim, D., Kim, J., & Moon, I. (2006). Integration of accident scenario generation andmultiobjective optimization for safety-cost decision making in chemicalprocesses. Journal of Loss Prevention in the Process Industries, 19(6), 705e713.
Kirchsteiger, C. (2005). A new approach to quantitative assessment of reliability ofpassive systems. Safety Science, 43(10), 771e777.
Kirwan, B. (1994). A guide to practical human reliability assessment. Boca Raton:Taylor & Francis Press.
Klemens, R., Kosinski, P., Wolanski, P., Korobeinikov, V. P., Markov, V. V.,Menshov, I. S., et al. (2001). Numerical study of dust lifting in a channel withvertical obstacles. Journal of Loss Prevention in the Process Industries, 14(6),469e473.
Komljenovic, D., Groves, W. A., & Kecojevic, V. J. (2008). Injuries in U.S. miningoperations e a preliminary risk analysis. Safety Science, 46(5), 792e801.
Konstandinidou, M., Nivolianitou, Z., Kiranoudis, C., & Markatos, N. (2006). A fuzzymodelling application of CREAM methodology for human reliability analysis.Reliability Engineering & System Safety, 91(6), 706e716.
Kontogiannis, T. (1999). User strategies in recovering from errors in manemachinesystems. Safety Science, 32(1), 49e68.
Kontogiannis, T. (2003). A petri net-based approach for ergonomic task analysis andmodelling with emphasis on adaptation to system changes. Safety Science,41(10), 803e835.
Kontogiannis, T., & Malakis, S. (2009). A proactive approach to human errordetection and identification in aviation and air traffic control. Safety Science,47(5), 693e706.
Kontogiannis, T., Leopoulos, V., & Marmaras, N. (2000). A comparison of accidentanalysis techniques for safety-critical man-machine systems. InternationalJournal of Industrial Ergonomics, 25, 327e347.
Kopustinskas, V., Augutis, J., & Rimkevi�cius, S. (2005). Dynamic reliability and riskassessment of the accident localization system of the Ignalina NPP RBMK-1500reactor. Reliability Engineering & System Safety, 87(1), 77e87.
Kosmowski, K. T. (2002). Methodology for the risk analysis in reliability and safetymanagement of nuclear power plants. Gdansk: Gdansk University of Technology.
Kosmowski, K. T. (2006). Functional safety concept for hazardous systems and newchallenges. Journal of Loss Prevention in the Process Industries, 19, 298e305.
Kouabenan, D. R. (2009). Role of beliefs in accident and risk analysis and preven-tion. Safety Science, 47(6), 767e776.
Kourniotis, S. P., Kiranoudis, C. T., & Markatos, N. C. (2001). A systemic approach toeffective chemical emergency management. Safety Science, 38(1), 49e61.
Krishnan, P. (2002). A tool based approach to checking logical consistency in acci-dent reports. Reliability Engineering & System Safety, 76(3), 217e226.
Krishnasamy, L., Khan, F., & Haddara, M. (2005). Development of a risk-basedmaintenance (RBM) strategy for a power-generating plant. Journal of LossPrevention in the Process Industries, 18(2), 69e81.
Krivtsov, V. V. (2007). Practical extensions to NHPP application in repairable systemreliability analysis. Reliability Engineering & System Safety, 92(5), 560e562.
Kumar, G. V. P., & Dewangan, K. N. (2009). Agricultural accidents in north easternregion of India. Safety Science, 47(2), 199e205.
Kurd, Z., & Kelly, T. P. (2007). Using fuzzy self-organising maps for safety criticalsystems. Reliability Engineering & System Safety, 92(11), 1563e1583.
Kurowicka, D., Cooke, R., Goossens, L., & Ale, B. (2008). Expert judgment study forplacement ladder bowtie. Safety Science, 46(6), 921e934.
Labeau, P. E., Smidts, C., & Swaminathan, S. (2000). Dynamic reliability: towards anintegrated platform for probabilistic risk assessment. Reliability Engineering &System Safety, 68(3), 219e254.
Labovský, J., �Svandová, Z., Marko�s, J., & Jelemenský, L’udovít (2007). Model-basedHAZOP study of a real MTBE plant. Journal of Loss Prevention in the ProcessIndustries, 20, 230e237.
Lahiri, S., Gold, J., & Levenstein, C. (2005). Net-cost model for workplace interven-tions. Journal of Safety Research, 36(3), 241e255.
Lam, L. T., Yang, L., Liu, Y., Geng, W. K., & Liu, D. C. (2005). Different quantitativemeasures of the impact of injury deaths on the community in the GuangxiProvince, China. Accident Analysis and Prevention, 37(4), 761e766.
Lambert, H. J., Peterson, D. K., & Joshi, N. N. (2006). Synthesis of quantitative andqualitative evidence for accident analysis in risk-based highway planning.Accident Analysis and Prevention, 38(5), 925e935.
Lambert, J. H., Haimes, Y. Y., Li, D., Schooff, R. M., & Tulsiani, V. (2001). Identification,ranking, and management of risks in a major system acquisition. ReliabilityEngineering & System Safety, 72(3), 315e325.
Lan, B., Persaud, B., Lyon, C., & Bhim, R. (2009). Validation of a full Bayes method-ology for observational beforeeafter road safety studies and application toevaluation of rural signal conversions. Accident Analysis and Prevention, 41(3),574e580.
Landau, K., Rohmert, W., & Brauchler, R. (1998). Task analysis. Part I e Guidelines forthe practitioner. International Journal of Industrial Ergonomics, 22(1e2), 3e11.
Langseth, H., & Portinale, L. (2007). Bayesian networks in reliability. ReliabilityEngineering & System Safety, 92(1), 92e108.
Laurent, A., Baklouti, M., Corriou, J. P., & Gustin, J. L. (2006). A posteriori hazardanalysis and feedback information of an accidental event in the grains storageof an agrochemical product. Journal of Loss Prevention in the Process Industries,19(6), 509e515.
Lee, K. W. (2002). A methodology for assessing risk from released hydrocarbon in anenclosed area. Journal of Loss Prevention in the Process Industries, 15(1), 11e17.
Lee, J.-S., & Cha, S.-D. (2005). Fault tree construction of hybrid system requirementsusing qualitative formal method. Reliability Engineering & System Safety, 87(1),121e131.
Lee, C.-J., & Lee, K. J. (2006). Application of Bayesian network to the probabilistic riskassessment of nuclear waste disposal. Reliability Engineering & System Safety,91(5), 515e532.
Lee, J. H., Jin, B. S., & Ji, Y. (2009). Development of a Structural Equation Model forride comfort of the Korean high-speed railway. International Journal of IndustrialErgonomics, 39(1), 7e14.
Lee, S. J., Kim, M. C., & Seong, P. H. (2008). An analytical approach to quantitativeeffect estimation of operation advisory system based on human cognitiveprocess using the Bayesian belief network. Reliability Engineering & SystemSafety, 93(4), 567e577.
Leong, C. T., & Shariff, A. M. (2009). Process route index (PRI) to assess level ofexplosiveness for inherent safety quantification. Journal of Loss Prevention in theProcess Industries, 22(2), 216e221.
Leva, M. C., De Ambroggi, M., Grippa, D., De Garis, R., Trucco, P., & Oliver Sträter, O.(2009). Quantitative analysis of ATM safety issues using retrospective accidentdata: the dynamic risk modelling project. Safety Science, 47(2), 250e264.
Li, Y., & Bai, Y. (2008). Development of crash-severity-index models for themeasurement of work zone risk levels. Accident Analysis and Prevention, 40(5),1724e1731.
Li, Y., & Bai, Y. (2009). Effectiveness of temporary traffic control measures inhighway work zones. Safety Science, 47(3), 453e458.

P.K. Marhavilas et al. / Journal of Loss Prevention in the Process Industries 24 (2011) 477e523520
Li, Z., Shu-dong, H., & Xiang-rui, H. (2003). THERPþHCR-based model for humanfactor event analysis and its application. Hedongli Gongcheng/Nuclear PowerEngineering, 24(3), 272e276.
Liaw, H. J., Yur, C. C., & Lin, Y. F. (2000). A mathematical model for predicting thermalhazard data. Journal of Loss Prevention in the Process Industries, 13(6), 499e507.
Licu, T., Cioran, F., Hayward, B., & Lowe, A. (2007). EUROCONTROLdSystemicOccurrence Analysis Methodology (SOAM)da “Reason”-based organisationalmethodology for analysing incidents and accidents. Reliability Engineering &System Safety, 92(9), 1162e1169.
Liljegren, E. (2006). Usability in a medical technology context assessment ofmethods for usability evaluation of medical equipment. International Journal ofIndustrial Ergonomics, 36(4), 345e352.
Lim, H.-G., & Jang, S.-C. (2007). An analytic solution for a fault tree with circularlogics in which the systems are linearly interrelated. Reliability Engineering &System Safety, 92(6), 804e807.
Lind, N. (2002). Social and economic criteria of acceptable risk. Reliability Engi-neering & System Safety, 78(1), 21e25.
Lins, V. F. C., & Guimarães, E. M. (2007). Failure of a heat exchanger generated by anexcess of SO2 and H2S in the sulfur recovery unit of a petroleum refinery. Journalof Loss Prevention in the Process Industries, 20(1), 91e97.
Liu, H., Hwang, S. L., & Liu, T. H. (2009). Economic assessment of human errors inmanufacturing environment. Safety Science, 47(2), 170e182.
Liu, L., Guo, Y., Rogers, W. J., & Mannan, M. S. (2009). Computational fluid dynamicsanalysis on the critical behavior of reactive chemicals. Journal of Loss Preventionin the Process Industries, 22(2), 187e196.
Liu, Y. L., Zheng, J. Y., Xu, P., Zhao, Y. Z., Bie, H. Y., Chen, H. G., et al. (2009). Numericalsimulation on the diffusion of hydrogen due to high pressured storage tanksfailure. Journal of Loss Prevention in the Process Industries, 22(3), 265e270.
Lohrer, C., Schmidt, M., & Krause, U. (2005). A study on the influence of liquid waterand water vapour on the self-ignition of lignite coal-experiments and numer-ical simulations. Journal of Loss Prevention in the Process Industries, 18(3),167e177.
Loo, B. P. Y. (2006). Validating crash locations for quantitative spatial analysis: a GIS-based approach. Accident Analysis and Prevention, 38(5), 879e886.
Lord, D., & Park, P. Y. (2008). Investigating the effects of the fixed and varyingdispersion parameters of Poisson-gamma models on empirical Bayes estimates.Accident Analysis and Prevention, 40(4), 1441e1457.
Ma, J., Kockelman, K. M., & Damien, P. (2008). A multivariate Poisson-lognormalregression model for prediction of crash counts by severity, using Bayesianmethods. Accident Analysis and Prevention, 40(3), 964e975.
Maes, M. A., & Faber, M. H. (2006). Bayesian framework for managing preferences indecision-making. Reliability Engineering & System Safety, 91(5), 556e569.
Maiti, J., & Khanzode, V. V. (2009). Development of a relative risk model for roof andside fall fatal accidents in underground coal mines in India. Safety Science, 47(8),1068e1076.
Maiti, J., Khanzode, V. V., & Ray, P. K. (2009). Severity analysis of Indian coal mineaccidents e a retrospective study for 100 years. Safety Science, 47(7),1033e1042.
Majdara, A., & Nematollahi, M. R. (2008). Development and application of a riskassessment tool. Reliability Engineering & System Safety, 93(8), 1130e1137.
Makarov, D., Verbecke, F., & Molkov, V. (2007). Numerical analysis of hydrogendeflagration mitigation by venting through a duct. Journal of Loss Prevention inthe Process Industries, 20(4e6), 433e438.
Malyshkina, N. V., & Mannering, F. L. (2009). Markov switching multinomial logitmodel: an application to accident-injury severities. Accident Analysis andPrevention, 41(4), 829e838.
Malyshkina, N. V., Mannering, F. L., & Tarko, A. P. (2009). Markov switching negativebinomial models: an application to vehicle accident frequencies. AccidentAnalysis and Prevention, 41(2), 217e226.
Marhavilas, P. K., & Koulouriotis, D. E. (2007). Risk estimation in the constructions’worksites by using a quantitative assessment technique and statistical infor-mation of accidents. Technika Chronika Sci. J.TCG, Scientific Journal of TechnicalChamber of Greece. ISSN: 1106-4935, I(1e2). ISSN: 1106-4935, 47e60.
Marhavilas, P. K., & Koulouriotis, D. E. (2008). A risk estimation methodologicalframework using quantitative assessment techniques and real accidents’ data:application in an aluminum extrusion industry. Journal of Loss Prevention in theProcess Industries, 21(6), 596e603. doi:10.1016/j.jlp.2008.04.009.
Marhavilas, P. K., Koulouriotis, D. E., & Mitrakas C. Developing a new compre-hensive risk assessment process: application in the Greek Public ElectricPower Provider using occupational accidents’ data. Safety Science, Submittedfor publication.
Marhavilas, P. K., Koulouriotis, D. E., & Mitrakas C. Developing a new comprehensiverisk assessment process: application in the Greek Public Electric Power Providerusing occupational accidents’ data. Safety Science, Elsevier, submitted forpublication.
Marhavilas, P. K., Koulouriotis, D. E., & Voulgaridou, K. (2009). Development ofa quantitative risk assessment technique and application on an industry’sworksite using real accidents’ data. Scientific Journal of Hellenic Association ofMechanical & Electrical Engineers, 416, 14e20.
Maroño, M., Peña, J. A., & Santamaría, J. (2006). The ‘PROCESO’ index: a newmethodology for the evaluation of operational safety in the chemical industry.Reliability Engineering & System Safety, 91(3), 349e361.
Marquez, A. C., Heguedas, A. S., & Iung, B. (2005). Monte Carlo-based assessment ofsystem availability. A case study for cogeneration plants. Reliability Engineering& System Safety, 88(3), 273e289.
Marseguerra, M., & Zio, E. (2004). Monte Carlo estimation of the differentialimportance measure: application to the protection system of a nuclear reactor.Reliability Engineering & System Safety, 86(1), 11e24.
Marseguerra, M., Zio, E., & Podofillini, L. (2005). First-order differential sensitivityanalysis of a nuclear safety system by Monte Carlo simulation. ReliabilityEngineering & System Safety, 90(2e3), 162e168.
Martín, J. E., Rivas, T., Matías, J. M., Taboada, J., & Argüelles, A. (2009). A Bayesiannetwork analysis of workplace accidents caused by falls from a height. SafetyScience, 47(2), 206e214.
Martín-Fernández, S., de los Ríos, I., Cazorla, A., & Martínez-Falero, E. (2009). Pilotstudy on the influence of stress caused by the need to combine work and familyon occupational accidents in working women. Safety Science, 47(2), 192e198.
Mebarki, A., Nguyen, Q. B., Mercier, F., Saada, R. A., & Reimeringer, M. (2008).Reliability analysis of metallic targets under metallic rods impact: towardsa simplified probabilistic approach. Journal of Loss Prevention in the ProcessIndustries, 21(5), 518e527.
Mebarki, A., Nguyen, Q. B., Mercier, F., Saada, R. A., Meftah, F., & Reimeringer, M.(2007). A probabilistic model for the vulnerability of metal plates under theimpact of cylindrical projectiles. Journal of Loss Prevention in the ProcessIndustries, 20(2), 128e134.
Meel, A., O’Neill, L. M., Levin, J. H., Seider, W. D., Oktem, U., & Keren, N. (2007).Operational risk assessment of chemical industries by exploiting accidentdatabases. Journal of Loss Prevention in the Process Industries, 20(2), 113e127.
Mekos, K. Z. (2009). Complaints regarding occupational health and safety in thearea of Thessaloniki (Greece). Safety Science, 47(5), 647e651.
Melchers, R. E. (2001). On the ALARP approach to risk management. ReliabilityEngineering & System Safety, 71(2), 201e208.
Melchers, R. E., & Feutrill, W. R. (2001). Risk assessment of LPG automotive refu-elling facilities. Reliability Engineering & System Safety, 74(3), 283e290.
Mirka, G. A., Smith, C., Shivers, C., & Taylor, J. (2002a). Ergonomic interventions forthe furniture manufacturing industry. Part Idlift assist devices. InternationalJournal of Industrial Ergonomics, 29(5), 263e273.
Mirka, G. A., Smith, C., Shivers, C., & Taylor, J. (2002b). Ergonomic interventions forthe furniture manufacturing industry. Part IIdHandtools. International Journalof Industrial Ergonomics, 29(5), 275e287.
Mitropoulos, P. T., & Cupido, G. (2009). The role of production and teamworkpractices in construction safety: a cognitive model and an empirical case study.Journal of Safety Research, 40(4), 265e275.
Mizuno, Y., Ninokata, H., & Finnicum, D. J. (2005). Risk-informed design of IRIS usinga level-1 p.obabilistic risk assessment from its conceptual design phase. Reli-ability Engineering & System Safety, 87(2), 201e209.
Mohaghegh, Z., & Mosleh, A. (2009a). Incorporating organisational factors intoprobabilistic risk assessment of complex socio-technical systems: principlesand theoretical foundations. Safety Science, 47(8), 1139e1158.
Mohaghegh, Z., & Mosleh, A. (2009b). Measurement techniques for organisationalsafety causal models: characterization and suggestions for enhancements.Safety Science, 47(10), 1398e1409.
Mohanta, D. K., Sadhu, P. K., & Chakrabarti, R. (2007). Deterministic and stochasticapproach for safety and reliability optimization of captive power plant main-tenance scheduling using GA/SA-based hybrid techniques: a comparison ofresults. Reliability Engineering & System Safety, 92(2), 187e199.
Mohanty, S., & Wu, Y.-T. (2001). CDF sensitivity analysis technique for rankinginfluential parameters in the performance assessment of the proposed high-level waste repository at Yucca Mountain, Nevada, USA. Reliability Engineering &System Safety, 73(2), 167e176.
Mondragón, S., Company, P., & Vergara, M. (2005). Semantic differential applied tothe evaluation of machine tool design. International Journal of Industrial Ergo-nomics, 35(11), 1021e1029.
Montoya, M. I., Planas, E., & Casal, J. (2009). A comparative analysis of mathematicalmodels for relating indoor and outdoor toxic gas concentrations in accidentalreleases. Journal of Loss Prevention in the Process Industries, 22(4), 381e391.
Moriyama, T., & Ohtani, H. (2009). Risk assessment tools incorporating human errorprobabilities in the Japanese small-sized establishment. Safety Science, 47(10),1379e1397.
Moura, M.das C., & Droguett, E. L. (2009). Mathematical formulation and numericaltreatment based on transition frequency densities and quadrature methods fornon-homogeneous semi-Markov processes. Reliability Engineering & SystemSafety, 94(2), 342e349.
Murè, S., & Demichela, M. (2009). Fuzzy Application Procedure (FAP) for the riskassessment of occupational accidents. Journal of Loss Prevention in the ProcessIndustries, 22(5), 593e599.
Mushtaq, F., & Chung, P. W. H. (2000). A systematic Hazop procedure for batchprocesses, and its application to pipeless plants. Journal of Loss Prevention in theProcess Industries, 13(1), 41e48.
Nayak, A. K., Jain, V., Gartia, M. R., Prasad, H., Anthony, A., Bhatia, S. K., et al. (2009).Reliability assessment of passive isolation condenser system of AHWR usingAPSRA methodology. Reliability Engineering & System Safety, 94(6), 1064e1075.
Neves, R. A., Chateauneuf, A., Venturini, W. S., & Lemaire, M. (2006). Reliabilityanalysis of reinforced concrete grids with nonlinear material behavior. Reli-ability Engineering & System Safety, 91(6), 735e744.
Niehaus, F. (2002). Use of Probabilistic Safety Assessment (PSA) for nuclear instal-lations. Safety Science, 40(1e4), 153e176.
Nivolianitou, Z., Konstandinidou, M., Kiranoudis, C., & Markatos, N. (2006). Devel-opment of a database for accidents and incidents in the Greek petrochemicalindustry. Journal of Loss Prevention in the Process Industries, 19(6), 630e638.

P.K. Marhavilas et al. / Journal of Loss Prevention in the Process Industries 24 (2011) 477e523 521
Nivolianitou, Z. S., Leopoulos, V. N., & Konstantinidou, M. (2004). Comparison oftechniques for accident scenario analysis in hazardous systems. Journal of LossPrevention in the Process Industries, 17(6), 467e475.
Norrington, L., Quigley, J., Russell, A., & der Meer, R. V. (2008). Modelling the reli-ability of search and rescue operations with Bayesian Belief Networks. Reli-ability Engineering & System Safety, 93(7), 940e949.
Nuutinen, M. (2005). Contextual assessment of working practices in changing work.International Journal of Industrial Ergonomics, 35(10), 905e930.
Oh, J., Washington, S. P., & Nam, D. (2006). Accident prediction model for railway-highway interfaces. Accident Analysis and Prevention, 38(2), 346e356.
Oh, Y., Yoo, J., Cha, S., & Son, H. S. (2005). Software safety analysis of function blockdiagrams using fault trees. Reliability Engineering & System Safety, 88(3),215e228.
Ohtani, H., & Kobayashi, M. (2005). Statistical analysis of dangerous goods accidentsin Japan. Safety Science, 43(5e6), 287e297.
Øien, K. (2001a). A framework for the establishment of organisational risk indica-tors. Reliability Engineering & System Safety, 74(2), 147e167.
Øien, K. (2001b). Risk indicators as a tool for risk control. Reliability Engineering &System Safety, 74(2), 129e145.
Okabe, M., & Ohtani, H. (2009). Risk estimation for industrial safety in raw materialsmanufacturing. Journal of Loss Prevention in the Process Industries, 22(2),176e181.
Olson, R., Grosshuesch, A., Schmidt, S., Gray, M., & Wipfli, B. (2009). Observationallearning and workplace safety: the effects of viewing the collective behavior ofmultiple social models on the use of personal protective equipment. Journal ofSafety Research, 40(5), 383e387.
Ortmeier, F., Schellhorn, G., Thums, A., Reif, W., Hering, B., & Trappschuh, H. (2003).Safety analysis of the height control system for the Elbtunnel. Reliability Engi-neering & System Safety, 81(3), 259e268.
Ozbay, K., & Noyan, N. (2006). Estimation of incident clearance times using BayesianNetworks approach. Accident Analysis and Prevention, 38(3), 542e555.
Palazzi, E., Currò, F., & Fabiano, B. (2007). n-Compartment mathematical model fortransient evaluation of fluid curtains in mitigating chlorine releases. Journal ofLoss Prevention in the Process Industries, 20(2), 135e143.
Palmer, C., & Chung, P. W. H. (2009). An automated system for batch hazard andoperability studies. Reliability Engineering & System Safety, 94(6), 1095e1106.
Papadakis, G. A., & Chalkidou, A. A. (2008). The exposureedamage approach in thequantification of occupational risk in workplaces involving dangeroussubstances. Safety Science, 46(6), 972e991.
Papadopoulos, Y., McDermid, J., Sasse, R., & Heiner, G. (2001). Analysis and synthesisof the behaviour of complex programmable electronic systems in conditions offailure. Reliability Engineering & System Safety, 71(3), 229e247.
Papazoglou, I. A., Aneziris, O. N., Post, J. G., & Ale, B. J. M. (2002). Technical modellingin integrated risk assessment of chemical installations. Journal of Loss Preventionin the Process Industries, 15(6), 545e554.
Park, J., & Han, S. H. (2004). A fuzzy rule-based approach to modelling affective usersatisfaction towards office chair design. International Journal of IndustrialErgonomics, 34(1), 31e47.
Park, K. S., & Lee, J. (2008). A new method for estimating human error probabilities:AHPeSLIM. Reliability Engineering & System Safety, 93(4), 578e587.
Park, B. J., & Lord, D. (2009). Application of finite mixture models for vehicle crashdata analysis. Accident Analysis and Prevention, 41(4), 683e691.
Parker, D., Lawrie, M., & Hudson, P. (2006). A framework for understanding thedevelopment of organisational safety culture. Safety Science, 44(6), 551e562.
Pérez, C. J., Martín, J., & Rufo, M. J. (2006). Sensitivity estimations for Bayesianinference models solved by MCMC methods. Reliability Engineering & SystemSafety, 91(10e11), 1310e1314.
Perez-Labajos, C. A., Blanco, B., Azofra, M., Achutegui, J. J., & Eguía, E. (2009). Injuryand loss concentration by sinkings in fishing fleets. Safety Science, 47(2),277e284.
Pettersen, K. A., & Aase, V. (2008). Explaining safe work practices in aviation linemaintenance. Safety Science, 46(3), 510e519.
Philipson, L. L., & Wilde, P. D. (2000). Sampling of uncertain probabilities at eventtree nodes with multiple branches. Reliability Engineering & System Safety, 70(2),197e203.
Pillay, A., & Wang, J. (2003). Modified failure mode and effects analysis usingapproximate reasoning. Reliability Engineering & System Safety, 79(1), 69e85.
Piniella, F., & Fernández-Engo, M. A. (2009). Towards system for the management ofsafety on board artisanal fishing vessels: proposal for check-lists and theirapplication. Safety Science, 47(2), 265e276.
Planas-Cuchi, E., Salla, J. M., & Casal, J. (2004). Calculating overpressure from BLEVEexplosions. Journal of Loss Prevention in the Process Industries, 17(6), 431e436.
Price, C. J., & Taylor, N. S. (2002). Automated multiple failure FMEA. ReliabilityEngineering & System Safety, 76(1), 1e10.
Purser, D. A., & Bensilum, M. (2001). Quantification of behaviour for engineeringdesign standards and escape time calculations. Safety Science, 38(2), 157e182.
Pyy, P. (2000). An approach for assessing human decision reliability. ReliabilityEngineering & System Safety, 68(1), 17e28.
Qin, X., Ivan, J. N., Ravishanker, N., Liu, J., & Tepas, D. (2006). Bayesian estimation ofhourly exposure functions by crash type and time of day. Accident Analysis andPrevention, 38(6), 1071e1080.
Qureshi, Z. H. (2007). A review of accident modelling approaches for complex socio-technical systems. In: Proc. 12th Australian conference on safety-relatedprogrammable systems, Adelaide, Australia.
Rådbo, H., Svedung, I., & Andersson, R. (2008). Suicide prevention in railwaysystems: application of a barrier approach. Safety Science, 46(5), 729e737.
Ramírez, B. A., Izquierdo, F. A., Fernández, C. G., & Méndez, A. G. (2009). Theinfluence of heavy goods vehicle traffic on accidents on different types ofSpanish interurban roads. Accident Analysis and Prevention, 41(1), 15e24.
Ramirez-Marquez, J. E., & Coit, D. W. (2005). A Monte-Carlo simulation approach forapproximating multi-state two-terminal reliability. Reliability Engineering &System Safety, 87(2), 253e264.
Rao, K. D., Gopika, V., Kushwaha, H. S., Verma, A. K., & Srividya, A. (2007). Testinterval optimization of safety systems of nuclear power plant using fuzzy-genetic approach. Reliability Engineering & System Safety, 92(7), 895e901.
Rao, K. D., Gopika, V., Sanyasi Rao, V. V. S., Kushwaha, H. S., Verma, A. K., &Srividya, A. (2009). Dynamic fault tree analysis using Monte Carlo simulation inprobabilistic safety assessment. Reliability Engineering & System Safety, 94(4),872e883.
Rao, K. D., Kushwaha, H. S., Verma, A. K., & Srividya, A. (2007). Quantification ofepistemic and aleatory uncertainties in level-1 p.obabilistic safety assessmentstudies. Reliability Engineering & System Safety, 92(7), 947e956.
Rauzy, A. (2002). Mode automata and their compilation into fault trees. ReliabilityEngineering & System Safety, 78(1), 1e12.
Ravalico, J. K., Maier, H. R., & Dandy, G. C. (2009). Sensitivity analysis for decision-making using the MORE methodda Pareto approach. Reliability Engineering &System Safety, 94(7), 1229e1237.
Reinach, S., & Viale, A. (2006). Application of a human error framework to conducttrain accident/incident investigations. Accident Analysis and Prevention, 38(2),396e406.
Reniers, G. (2009). An optimizing hazard/risk analysis review planning (HARP)framework for complex chemical plants. Journal of Loss Prevention in the ProcessIndustries, 22(2), 133e139.
Reniers, G. L. L., & Dullaert, W. (2007). DomPrevPlanning�: user-friendly softwarefor planning domino effects prevention. Safety Science, 45(10), 1060e1081.
Reniers, G. L. L., Ale, B. J. M., Dullaert, W., & Soudan, K. (2009). Designing continuoussafety improvement within chemical industrial areas. Safety Science, 47(5),578e590.
Reniers, G. L. L., Dullaert, W., Ale, B. J. M., & Soudan, K. (2005). Developing anexternal domino prevention framework: Hazwim. Journal of Loss Prevention inthe Process Industries, 18, 127e138.
Richei, A., Hauptmanns, U., & Unger, H. (2001). The human error rate assessmentand optimizing system HEROS d a new procedure for evaluating and opti-mizing the manemachine interface in PSA. Reliability Engineering & SystemSafety, 72(2), 153e164.
Rigas, F., Konstandinidou, M., Centola, P., & Reggio, G. T. (2003). Safety analysis andrisk assessment in a new pesticide production line. Journal of Loss Prevention inthe Process Industries, 16(2), 103e109.
Rocco, S. C. M. (2003). A rule induction approach to improve Monte Carlo systemreliability assessment. Reliability Engineering & System Safety, 82(1), 85e92.
Rocco, S. C. M., & Zio, E. (2007). A support vector machine integrated system for theclassification of operation anomalies in nuclear components and systems.Reliability Engineering & System Safety, 92(5), 593e600.
Røed, W., & Aven, T. (2009). Bayesian approaches for detecting significant deteri-oration. Reliability Engineering & System Safety, 94(2), 604e610.
Røed, W., Mosleh, A., Vinnem, J. E., & Aven, T. (2009). On the use of the hybrid causallogic method in offshore risk analysis. Reliability Engineering & System Safety,94(2), 445e455.
Rogé, J., & Pébayle, T. (2009). Deterioration of the useful visual field with ageingduring simulated driving in traffic and its possible consequences for road safety.Safety Science, 47(9), 1271e1276.
Rosenbloom, T., Levi, S., Peleg, A., & Nemrodov, D. (2009). Effectiveness of roadsafety workshop for young adults. Safety Science, 47(5), 608e613.
Rosqvist, T., & Tuominen, R. (2004). Qualification of formal safety assessment: anexploratory study. Safety Science, 42(2), 99e120.
Roth, R., Marques, P. R., & Voas, R. B. (2009). A note on the effectiveness of thehouse-arrest alternative for motivating DWI offenders to install ignition inter-locks. Journal of Safety Research, 40(6), 437e441.
Rotshtein, A. P., Posner, M., & Rakytyanska, H. B. (2006). Cause and effect analysis byfuzzy relational equations and a genetic algorithm. Reliability Engineering &System Safety, 91(9), 1095e1101.
Rouvroye, J. L., & van den Bliek, E. G. (2002). Comparing safety analysis techniques.Reliability Engineering & System Safety, 75(3), 289e294.
Saleem, J. J., Kleiner, B. M., & Nussbaum, M. A. (2003). Empirical evaluation oftraining and a work analysis tool for participatory ergonomics. InternationalJournal of Industrial Ergonomics, 31(6), 387e396.
Salzano, E., & Cozzani, V. (2006). A fuzzy set analysis to estimate loss intensityfollowing blast wave interaction with process equipment. Journal of LossPrevention in the Process Industries, 19(4), 343e352.
Sammarco, J. J. (2005). Operationalizing normal accident theory for safety-relatedcomputer systems. Safety Science, 43(9), 697e714.
Sari, M., Selcuk, A. S., Karpuz, C., & Duzgun, H. S. B. (2009). Stochastic modelling ofaccident risks associated with an underground coal mine in Turkey. SafetyScience, 47(1), 78e87.
Sawalha, Z., & Sayed, T. (2006). Transferability of accident prediction models. SafetyScience, 44(3), 209e219.
Schubert, U., & Dijkstra, J. J. (2009). Working safely with foreign contractors andpersonnel. Safety Science, 47(6), 786e793.

P.K. Marhavilas et al. / Journal of Loss Prevention in the Process Industries 24 (2011) 477e523522
Seward, D., Pace, C., Morrey, R., & Sommerville, I. (2000). Safety analysis of auton-omous excavator functionality. Reliability Engineering & System Safety, 70(1),29e39.
Seyed-Hosseini, S. M., Safaei, N., & Asgharpour, M. J. (2006). Reprioritization offailures in a system failure mode and effects analysis by decision making trialand evaluation laboratory technique. Reliability Engineering & System Safety,91(8), 872e881.
Shalev, D. M., & Tiran, J. (2007). Condition-based fault tree analysis (CBFTA): a newmethod for improved fault tree analysis (FTA), reliability and safety calculations.Reliability Engineering & System Safety, 92(9), 1231e1241.
Shalini, R. T. (2009). Economic cost of occupational accidents: evidence from a smallisland economy. Safety Science, 47(7), 973e979.
Shannon, H. S., & Norman, G. R. (2009). Deriving the factor structure of safetyclimate scales. Safety Science, 47(3), 327e329.
Shen, Z., Dai, X., & Huang, X. (2006). A supplemental algorithm for the repairablesystem in the GO methodology. Reliability Engineering & System Safety, 91(8),940e944.
Sheu, J. J., Hwang, J. S., & Wang, J. D. (2000). Diagnosis and monetary quantificationof occupational injuries by indices related to human capital loss: analysis ofa steel company as an illustration. Accident Analysis and Prevention, 32(3),435e443.
Shuval, K., & Donchin, M. (2005). Prevalence of upper extremity musculoskeletalsymptoms and ergonomic risk factors at a Hi-Tech company in Israel. Interna-tional Journal of Industrial Ergonomics, 35(6), 569e581.
Sii, H. S., Ruxton, T., & Wang, J. (2001). A fuzzy-logic-based approach to qualitativesafety modelling for marine systems. Reliability Engineering & System Safety,73(1), 19e34.
Sklavounos, S., & Rigas, F. (2006). Computer-aided modelling of the protective effectof explosion relief vents in tunnel structures. Journal of Loss Prevention in theProcess Industries, 19(6), 621e629.
Soares, C. G., & Teixeira, A. P. (2001). Risk assessment in maritime transportation.Reliability Engineering & System Safety, 74(3), 299e309.
Son, H. S., & Seong, P. H. (2003). Development of a safety critical softwarerequirements verification method with combined CPN and PVS: a nuclearpower plant protection system application. Reliability Engineering & SystemSafety, 80(1), 19e32.
Staubach, M. (2009). Factors correlated with traffic accidents as a basis for evalu-ating advanced driver assistance systems. Accident Analysis and Prevention,41(5), 1025e1033.
Stave, C., & Törner, M. (2007). Exploring the organisational preconditions foroccupational accidents in food industry: a qualitative approach. Safety Science,45(3), 355e371.
Stewart, M. G., & Netherton, M. D. (2008). Security risks and probabilistic riskassessment of glazing subject to explosive blast loading. Reliability Engineering& System Safety, 93(4), 627e638.
Suddle, S. (2009). The weighted risk analysis. Safety Science, 47(5), 668e679.Suddle, S. I., & Waarts, P. H. (2003). In Bedford., van Gelder., Swets., & Zeitlinger.
(Eds.), The safety of risk or the risk of safety? Safety and reliability, Vol. 2 (pp.1511e1518). The Netherlands: Lisse.
Tegge, R., & Ouyang, Y. (2009). Correcting erroneous crash locations in trans-portation safety analysis. Accident Analysis and Prevention, 41(1), 202e209.
Tomlin, A. S. (2006). The use of global uncertainty methods for the evaluation ofcombustion mechanisms. Reliability Engineering & System Safety, 91(10e11),1219e1231.
Törner, M., & Pousette, A. (2009). Safety in construction e a comprehensivedescription of the characteristics of high safety standards in construction work,from the combined perspective of supervisors and experienced workers. Journalof Safety Research, 40(6), 399e409.
Trucco, P., & Cavallin, M. (2006). A quantitative approach to clinical risk assessment:the CREA method. Safety Science, 44(6), 491e513.
Trucco, P., Cagno, E., Ruggeri, F., & Grande, O. (2008). A Bayesian Belief Networkmodelling of organisational factors in risk analysis: a case study in maritimetransportation. Reliability Engineering & System Safety, 93(6), 845e856.
Turner, C., & McClure, R. (2004). Quantifying the role of risk-taking behaviour incausation of serious road crash-related injury. Accident Analysis and Prevention,36(3), 383e389.
Uggirala, A., Gramopadhye, A. K., Melloy, B. J., & Toler, J. E. (2004). Measurement oftrust in complex and dynamic systems using a quantitative approach. Inter-national Journal of Industrial Ergonomics, 34(3), 175e186.
Unsar, S., & Sut, N. (2009). General assessment of the occupational accidents thatoccurred in Turkey between the years 2000 and 2005. Safety Science, 47(5),614e619.
Vaidogas, E. R. (2006). First step towards preventing losses due to mechanicaldamage from abnormal actions: knowledge-based forecasting the actions.Journal of Loss Prevention in the Process Industries, 19(5), 375e385.
van der Voort, M. M., Klein, A. J. J., de Maaijer, M., van den Berg, A. C., vanDeursen, J. R., & Versloot, N. H. A. (2007). A quantitative risk assessment tool forthe external safety of industrial plants with a dust explosion hazard. Journal ofLoss Prevention in the Process Industries, 20(4e6), 375e386.
Vanderhaegen, F. (2001). A non-probabilistic prospective and retrospective humanreliability analysis method d application to railway system. Reliability Engi-neering & System Safety, 71(1), 1e13.
Vanem, E., & Skjong, R. (2006). Designing for safety in passenger ships utilizingadvanced evacuation analysesdA risk based approach. Safety Science, 44(2),111e135.
Vaurio, J. K. (2001). Modelling and quantification of dependent repeatable humanerrors in system analysis and risk assessment. Reliability Engineering & SystemSafety, 71(2), 179e188.
Vaurio, J. K., & Jänkälä, K. E. (2006). Evaluation and comparison of estimationmethods for failure rates and probabilities. Reliability Engineering & SystemSafety, 91(2), 209e221.
Venetsanos, A. G., Baraldi, D., Adams, P., Heggem, P. S., & Wilkening, H. (2008). CFDmodelling of hydrogen release, dispersion and combustion for automotivescenarios. Journal of Loss Prevention in the Process Industries, 21(2), 162e184.
Vernez, D., & Vuille, F. (2009). Method to assess and optimise dependability ofcomplex macro-systems: application to a railway signalling system. SafetyScience, 47(3), 382e394.
Vesely, W. E., Goldberg, F. F., Roberts, N. H., & Haasl, D. F. (1981). Fault Tree Hand-book. Washington, DC: US Nuclear Regulatory Commission.
Vidal-Gomel, C., & Samurçay, R. (2002). Qualitative analyses of accidents and inci-dents to identify competencies. The electrical systems maintenance case. SafetyScience, 40(6), 479e500.
Vílchez, J. A., Montiel, H., Casal, J., & Arnaldos, J. (2001). Analytical expressions forthe calculation of damage percentage using the probit methodology. Journal ofLoss Prevention in the Process Industries, 14(3), 193e197.
Vinodkumar, M. N., & Bhasi, M. (2009). Safety climate factors and its relationshipwith accidents and personal attributes in the chemical industry. Safety Science,47(5), 659e667.
Volkanovski, A., �Cepin, M., & Mavko, B. (2009). Application of the fault tree analysisfor assessment of power system reliability. Reliability Engineering & SystemSafety, 94(6), 1116e1127.
Vyzaite, G., Dunnett, S., & Andrews, J. (2006). Causeeconsequence analysis of non-repairable phasedmissions. Reliability Engineering & System Safety, 91(4), 398e406.
Wang, H. Y., & Joulain, P. (2007). Numerical simulation of wind-aided flame prop-agation over horizontal surface of liquid fuel in a model tunnel. Journal of LossPrevention in the Process Industries, 20(4e6), 541e550.
Wang, F., Gao, J., & Guo, K. (2009). A hazard and operability analysis method for theprevention of misoperations in the production of light magnesium carbonate.Journal of Loss Prevention in the Process Industries, 22(2), 237e243.
Wang, Y., Rogers, W. J., West, H. H., & Mannan, M. S. (2003). Algorithmic fault treesynthesis for control loops. Journal of Loss Prevention in the Process Industries,16(5), 427e441.
Wang, Y., Teague, T., West, H., & Mannan, S. (2002). A new algorithm for computer-aided fault tree synthesis. Journal of Loss Prevention in the Process Industries,15(4), 265e277.
Wang, Y. F., Wu, J. Y., & Chang, C. T. (2002). Automatic hazard analysis of batchoperations with petri nets. Reliability Engineering & System Safety, 76(1), 91e104.
Washington, S., & Oh, J. (2006). Bayesian methodology incorporating expert judg-ment for ranking countermeasure effectiveness under uncertainty: exampleapplied to at grade railroad crossings in Korea. Accident Analysis and Prevention,38(2), 234e247.
Way, Y. S., & Hsia, D. Y. (2000). A simple component-connection method forbuilding binary decision diagrams encoding a fault tree. Reliability Engineering& System Safety, 70(1), 59e70.
Weber, W., Tondok, H., & Bachmayer, M. (2005). Enhancing software safety by faulttrees: experiences from an application to flight critical software. ReliabilityEngineering & System Safety, 89(1), 57e70.
Willquist, P., & Törner, M. (2003). Identifying and analysing hazards inmanufacturing industryda review of selected methods and development ofa framework for method applicability. International Journal of Industrial Ergo-nomics, 32(3), 165e180.
Wilson, A. G., & Huzurbazar, A. V. (2007). Bayesian networks for multilevel systemreliability. Reliability Engineering & System Safety, 92(10), 1413e1420.
Wong, S. C., Leung, B. S. Y., Loo, B. P. Y., Hung, W. T., & Lo, H. K. (2004). A qualitativeassessment methodology for road safety policy strategies. Accident Analysis andPrevention, 36(2), 281e293.
Wong, D. K. Y., Pitfield, D. E., Caves, R. E., & Appleyard, A. J. (2009a). The develop-ment of a more risk-sensitive and flexible airport safety area strategy: Part II.Accident location analysis and airport risk assessment case studies. SafetyScience, 47(7), 913e924.
Wong, D. K. Y., Pitfield, D. E., Caves, R. E., & Appleyard, A. J. (2009b). The develop-ment of a more risk-sensitive and flexible airport safety area strategy: Part I.The development of an improved accident frequency model. Safety Science,47(7), 903e912.
Wong, S. C., Sze, N. N., Yip, H. F., Loo, B. P. Y., Hung, W. T., & Lo, H. K. (2006).Association between setting quantified road safety targets and road fatalityreduction. Accident Analysis and Prevention, 38(5), 997e1005.
Woodruff, J. M. (2005). Consequence and likelihood in risk estimation: a matter ofbalance in UK health and safety risk assessment practice. Safety Science,43(5e6), 345e353.
Wu, H. C., Chen, H. C., & Chen, T. (2009). Effects of ergonomics-based wafer-handling training on reduction in musculoskeletal disorders among waferhandlers. International Journal of Industrial Ergonomics, 39(1), 127e132.
Wu, W., Ning, A., & Ning, X. (2008). Evaluation of the reliability of transportnetworks based on the stochastic flow of moving objects. Reliability Engineering& System Safety, 93(6), 838e844.
Xu, B. P., El Hima, L., Wen, J. X., Dembele, S., Tam, V. H. Y., & Donchev, T. (2008).Numerical study on the spontaneous ignition of pressurized hydrogen releasethrough a tube into air. Journal of Loss Prevention in the Process Industries, 21(2),205e213.

P.K. Marhavilas et al. / Journal of Loss Prevention in the Process Industries 24 (2011) 477e523 523
Xu, X., Hsiang, S. M., & Mirka, G. A. (2008). Coordination indices between liftingkinematics and kinetics. International Journal of Industrial Ergonomics,38(11e12), 1062e1066.
Yang, S.-H., & Yang, L. (2005). Automatic safety analysis of control systems. Journalof Loss Prevention in the Process Industries, 18, 178e185.
Yannis, G., Papadimitriou, E., & Antoniou, C. (2007). Multilevel modelling for theregional effect of enforcement on road accidents. Accident Analysis andPrevention, 39(4), 818e825.
Yannis, G., Papadimitriou, E., & Antoniou, C. (2008). Impact of enforcement on trafficaccidents and fatalities: a multivariate multilevel analysis. Safety Science, 46(5),738e750.
Ye, X., Pendyala, R. M., Washington, S. P., Konduri, K., & Oh, J. (2009). A simultaneousequations model of crash frequency by collision type for rural intersections.Safety Science, 47(3), 443e452.
Yeow, P. H. P., & Sen, R. N. (2003). Quality, productivity, occupational health andsafety and cost effectiveness of ergonomic improvements in the test worksta-tions of an electronic factory. International Journal of Industrial Ergonomics,32(3), 147e163.
Yet-Pole, I. P., Shu, C. M., & Chong, C. H. (2009). Applications of 3D QRA technique tothe fire/explosion simulation and hazard mitigation within a naphtha-crackingplant. Journal of Loss Prevention in the Process Industries, 22(4), 506e515.
Yuhua, D., & Datao, Y. (2005). Estimation of failure probability of oil and gastransmission pipelines by fuzzy fault tree analysis. Journal of Loss Prevention inthe Process Industries, 18(2), 83e88.
Yun, G. W., Rogers, W. J., & Mannan, M. S. (2009). Risk assessment of LNG impor-tation terminals using the BayesianeLOPA methodology. Journal of LossPrevention in the Process Industries, 22(1), 91e96.
Zádor, J., Zsély, I. G., & Turányi, T. (2006). Local and global uncertainty analysis ofcomplex chemical kinetic systems. Reliability Engineering & System Safety,91(10e11), 1232e1240.
Zarboutis, N., & Marmaras, N. (2007). Design of formative evacuation plans usingagent-based simulation. Safety Science, 45(9), 920e940.
Zhang, L., He, X., Dai, L.-C., & Huang, X.-R. (2007). The simulator experimental studyon the operator reliability of Qinshan nuclear power plant. Reliability Engi-neering & System Safety, 92(2), 252e259.
Zhang, W., & Shivpuri, R. (2009). Probabilistic design of aluminum sheet drawingfor reduced risk of wrinkling and fracture. Reliability Engineering & SystemSafety, 94(2), 152e161.
Zhen, W., Mao, L., & Yuan, Z. (2008). Analysis of trample disaster and a case study eMihong bridge fatality in China in 2004. Safety Science, 46(8), 1255e1270.
Zheng, X., & Liu, M. (2009). An overview of accident forecasting methodologies.Journal of Loss Prevention in the Process Industries, 22(4), 484e491.
Zhou, Q., Fang, D., & Wang, X. (2008). A method to identify strategies for theimprovement of human safety behavior by considering safety climate andpersonal experience. Safety Science, 46(10), 1406e1419.
Zhou, Y., Hahn, J., & Mannan, M. S. (2006). Process monitoring based on classifi-cation tree and discriminant analysis. Reliability Engineering & System Safety,91(5), 546e555.
Zio, E., & Gola, G. (2009). A neuro-fuzzy technique for fault diagnosis and itsapplication to rotating machinery. Reliability Engineering & System Safety, 94(1),78e88.
Zio, E., Marella, M., & Podofillini, L. (2007a). A Monte Carlo simulation approach tothe availability assessment of multi-state systems with operational depen-dencies. Reliability Engineering & System Safety, 92(7), 871e882.
Zio, E., Marella, M., & Podofillini, L. (2007b). Importance measures-based prioriti-zation for improving the performance of multi-state systems: application to therailway industry. Reliability Engineering & System Safety, 92(10), 1303e1314.
Zupei, S., Yao, W., & Xiangrui, H. (2003). A quantification algorithm for a repairablesystem in the GO methodology. Reliability Engineering & System Safety, 80(3),293e298.