journal of itc sangeet research academy, vol. 23, december
TRANSCRIPT

Raga Identification by using Swara Intonation
Shreyas Belle, Rushikesh Joshi and Preeti Rao
Abstract—In this paper we investigate
information pertaining to the intonation of swaras (scale-degrees) in Hindustani Classical Music for automatically identifying ragas. We briefly explain why raga identification is an interesting problem and the various attributes that characterize a raga. We look at two approaches by other authors that exploit some of these characteristics. Then we review musicological studies that mention intonation variability of swaras across ragas, providing us a basis for using swara intonation information in raga recognition. We describe an experiment that compares the intonation characteristics for distinct ragas with the same set of swaras. Features derived from swara intonation are used in a statistical classification framework to classify audio segments corresponding to different ragas with the same swaras.
Index Terms— Hindustani Music, Raga Identification, Swara, Intonation.
I. INTRODUCTION agas form a very important concept in Hindustani classical music and capture the
mood and emotion of performances. A raga is a tonal framework for composition and improvisation. It embodies a unique musical idea.
As a result, automatic raga identification can provide a basis for searching for similar songs and generating automated play-lists that are suited for a certain aesthetic theme. It can also be used by novice musicians who find it difficult to distinguish ragas which are very similar to each other. It might also evolve into a system which checks how accurately a person is performing a certain raga. The distinguishing characteristics of ragas are typically the scale (set of notes/swaras) that is used, the order and hierarchy of its swaras, their manner or intonation and ornamentation, their relative strength, duration and frequency of occurrence. The present work addresses the problem of raga identification from an audio recording of a Hindustani classical vocal performance. In particular, we extract information about how the swaras of the performance are intoned to achieve this.
Manuscript received January 22, 2010. Shreyas Belle, was with the Department of Computer
Science and Engineering, Indian Institute of Technology Bombay, Mumbai, 400076, India (phone: +91-99308-45442; e-mail: [email protected]).
Preeti Rao, is with the Department of Electrical Engineering, Indian Institute of Technology Bombay, Mumbai, 400076, India (phone: +91-22-2576-7695; e-mail: [email protected]).
Rushikesh Joshi is with the Department of Computer Science and Engineering, Indian Institute of Technology Bombay, Mumbai, 400076, India (phone: +91-22-2576-7730; e-mail: [email protected]).
II. PREVIOUS WORK Previously reported work on raga detection has
been limited to using information regarding the probability distribution of the swaras and, to some extent, their temporal sequences. Pitch-class Distributions (PCDs) and Pitch-class Dyad Distributions (PCDDs) which represent the probabilities of the dyads, have been used as features for raga recognition [1]. The database consisted of 20 hours of unaccompanied ragas along with some commercial recordings which were split into 30 s and 60 s segments. There were a total of 31 distinct ragas. With an SVM classifier and 10-fold cross-validation, 75.2% and 57.1% accuracy was achieved with PCDs and PCDDs respectively. In [2], an automatic raga identification system is described that combines the use of Hidden Markov Models (HMMs) and
R
Journal of ITC Sangeet Research Academy, vol. 23, December, 2009

Pakad matching to identify ragas. The idea behind using HMMs was that the sequence of notes for a raga is very well defined. Given a certain note, the transition to another note would have a well defined probability. Generally each raga has a pakad which is a characteristic sequence of notes that is usually played while performing a raga. Detection of these sequences facilitated the identification of the raga. The dataset consisted of 31 samples from 2 ragas. An overall accuracy was 87% was achieved.
The authors of [3] have observed that Hindustani vocal music artists are particular about the specific position in which they intone a certain swara within its pitch interval. They have also seen that these positions are such that their frequencies are in ratios of small integers. This results in consonance of the swaras. Depending on the sequence in which notes are allowed to be performed in the raga, the artist may have to choose a certain position of a note to ensure consonance with the previous or next note. This would also result in different intonations of certain swaras for ragas that have the same scale but are otherwise distinct. We can safely say that professional performers would closely adhere to these ratios. In [4], the variation in the frequencies of each swara for many ragas has been shown. This motivates us to explore information about the positioning of the pitch of each swara in performances for raga recognition. While the previous work made use of probability of occurrence of pitches, dyads, sequences of notes and the occurrence of pakads, they did not make use of intonation information of each swara. It is our hypothesis that two ragas with the same scale will differ in the way their notes are intoned. This will help in classifying ragas which are easily confused while using methods mentioned in previous studies.
Most of the quoted previous studies were restricted to unaccompanied vocal performances specially recorded for the investigations. This was necessary due to the difficulty of pitch tracking in polyphonic music (i.e. with accompanying tabla, tanpura or harmonium as is typical in vocal music performances). In the present work, we use a recently available semi-automatic polyphonic melody extraction interface on commercial recordings of vocal classical music [5].
III. DETAILS OF DATASET For the purpose of our experiments we selected
vocal performances by various artists in four ragas, namely Desh, Tilak Kamod, Bihag, and Kedar. Desh and Tilak Kamod make use of the same scale. Similarly Bihag and Kedar have the same scale. For each raga we chose multiple performances each by a different artist. All performances were converted to mono channel with a sampling rate of 22050Hz, 16 bits per sample. From all these performances, segments in which the artist lingered on notes for some time without much ornamentation were chosen to be analyzed. The exact details of the ragas, artists, segment length have been provided in Table I.
IV. EXPERIMENTAL METHODOLOGY Each selected segment was heard for its entire
length by a trained musician to confirm that it contained enough information to make it possible to detect the raga that was being performed.
The trained musician pointed out that the raga was, in fact, recognised by her within the first 30 s of the segment. We used the entire segment as a single token for the purpose of automatic identification however.
For each of these segments, the vocal pitch was extracted at regular intervals and written to a pitch contour file. These pitch values were used in conjunction with the tonics (which were manually detected) of the performances to create Folded Pitch Distributions (FPDs). From these, PCDs were generated.
A. Pitch Extraction The raw audio waveforms of the selected
segments were passed to the polyphonic melody extractor which detected the pitch of the singing voice. The details of how the pitch was detected are available in [5]. Pitches were extracted every 20 ms from the range of 100 Hz to 1000 Hz with a resolution of 0.01 Hz. The obtained pitch contour was validated by listening to the re-synthesised pitch contour. Any vocal detection errors or pitch tracking errors were corrected by selecting the specific segments of the input audio and running the melody extractor with manually adjusted
parameters. Accurate pitch contours corresponding to the vocal melody were thus extracted for all the segments in the study.
We tried further to extract steady note sequences of at least 200 ms duration from the pitch contour such that the difference between the maximum and minimum pitch values of the continuous sequence within than 50 cents. Unfortunately the number of steady sequences extracted was too few for further analysis. A larger database along with an experimentally tuned set of parameters (minimum acceptable duration, maximum pitch variation permitted) could help us with an investigation restricted to steady notes.
B. Folded Pitch Distributions A pitch distribution gives the probability of
occurrence of a pitch value over the segment duration. The distribution that we used had bins corresponding to pitches ranging from, 100 Hz to 1000 Hz with 1 Hz intervals. While generating a pitch distribution for a pitch contour, the probability for a bin corresponding to frequency f was given by the number of pitch values with the frequency f in the pitch contour.
The pitch distribution was folded into one octave to compute an FPD as follows. An arbitrary position (256Hz) was chosen for the initial bin of the FPD. The remaining bins were logarithmically spaced at 5 cent intervals to give a total of 240 bins. A pitch f in the pitch distribution was assigned to bin n in the FPD such that
2240 log mod 240256
fn Round ⎛ ⎞= ⎜ ⎟⎝ ⎠
The FPD was then normalized by dividing the value in every bin by the sum of all the bins. For a given input tonic pitch F, and the corresponding FPD bin number computed as N, all the bins in a 100 cent window around the Nth bin were examined and the peak was found. The bin corresponding to the peak was considered to be the tonic bin. The FPD was then rotated so that the tonic bin became the first bin.
C. Pitch Class Distributions PCDs are distributions with 12 bins that
represent the probability of occurrence of the 12 swaras over one octave. The first bin corresponds to shadj, second to komal rishabh, third to shuddha rishabh and so on. Each bin was centred
about the corresponding swara centre assuming an equally tempered scale. This means that the first bin was at 0 cents, second at 100 cents, third at 200 cents and so on. The boundary between two bins was defined as the arithmetic mean of the centre of the two bins in cents.
The PCDs were constructed from tonic aligned FPDs as follows. After the bin boundaries were defined for the PCD, all the FPD bins which fell within the boundaries of a PCD bin contributed to that PCD bin. For example, the bins from 50 to 149 of the FPD were added to give the value of the 2nd bin of the PCD. Though PCDs give a good summary of the probability of usage of the 12 swaras they loose out the finer details about how they are intoned.
D. Swara Features In order to exploit information about the
specific intonation of the swaras, we returned to the tonic aligned FPD. First the FPD was divided into 12 partitions of 100 cents each, such that the first partition was centred about 0 cents. Each partition corresponded to one swara with the first one corresponding to shadj. The following four features were chosen from the pitch distribution of each swara. Peak: The most likely position of the swara (in cents), Mean: The mean position of the swara (in cents), Sigma: The standard deviation of a swara (in cents), and Prob: Overall probability of a swara. These four features for each swara were extracted from the FPD of each performance segment listed in Table I.
A graphical representation of Peak, Mean and Prob for two segments is shown in Fig. 1. The Peak of a swara corresponds to the bin in its partition which has the maximum probability. It captures information about the frequency position that is used most of the time while performing that swara. The Sigma of a swara was computed by finding the standard deviation of the distribution of the partition. This captures how much variation is there in the pitch while performing a certain swara. It gives an idea of how often or not the performer glides from this swara to others or uses other ornamentations such as vibrato. The Mean of a swara was computed by finding the mean position amongst the bins from the distribution of the partition. If a swara was being used and not just glided through, the Mean would have been

very close to Peak. If the swara was not being used but only glided through, then usually Peak and Mean would have a lot of separation (e.g., ga, dha, ni in Fig. 1.b.). The Prob of a swara was computed by summing up the probability of occurrence of each bin in the partition corresponding to that swara.
V. CLASSIFICATION RESULTS AND DISCUSSION Tables II and III give the Peak, Mean and
Sigma that were extracted as swara features from the various segments that were analyzed. The multiple columns under each feature correspond to different performances (in the same order as they appear in Table I). The values of these features are discussed below. Only swaras that are used while performing the considered raga are shown in the table.
From the tables it is observed that most of the time, for two ragas with the same scale, the peaks for a given swara overlap. Even then there are distinguishing factors. For example Sigma(Re) shows a higher value in Desh than in Tilak Kamod and it is vice-versa in the case of Sigma(ni). Sigma(Dha) is greater in Bihag than in Kedar.
Re, Ga, Pa and Ni of Kedar have higher values of Mean than they do in Bihag. Another interesting point is that Peak(Dha) > Mean(Dha) in Kedar whereas Peak(Dha) < Mean(Dha) in Bihag. This can be observed in Fig. 1. Peak(ni) > Mean(ni) in Desh whereas Peak(ni) < Mean(ni) in Tilak Kamod.
We were interested in seeing how Swara features compare with PCDs (12-dimensional feature vector comprising the probability of occurrence of each of the swaras) while carrying out classification. For classification of the ragas, we used a Nearest Neighbour Classifier with leave-one-out cross validation. Each segment mentioned in Table I was used as a token. To compute distance measures between various instances, in the case of PCDs we used a KL (Kullback-Leibler) distance ‘KLdist’ which was obtained from the KL (Kullback-Leibler) divergence ‘KL’ as shown below.
2( )( || ) ( ) log( )f
p fKL p q p fq f
= ∑ (1)
( , ) ( || ) ( || )KLdist p q KL p q KL q p= + (2) Where ‘p’ and ‘q’ are two probability
distributions between which distance is measured. The swara features were represented by a 48
dimensional (12 swaras × 4 features each) vector. We used a combination of Euclidean distance and KL distance to measure the distance between them. Given two swara feature vectors ‘Si’ and ‘Sj’, the distance was computed as
12
1( , ) ( , )
ii j k kk
D S S d swara swara=
= ∑ j (3)
Where “ ” is the 4-dimensional
representation of the kikswara
th swara of Si and
2 2
2 2
( , )
( , )
( ) (
( ) (
i j
i j
i j i j
i j i
k k
k k
k k k k
k k k
d swara swara
KLdist prob prob
peak peak mean mean
sigma sigma prob prob
)
)jk
=
×
− + −
+ − + −
(4)
Classification results indicated that in the case
of the first scale group, while using PCDs, both segments of Desh were classified correctly but two out of three segments of Tilak Kamod were classified wrongly as Desh. While using swara features, all the segments were properly classified. In the case of the second scale group, irrespective of whether PCDs or swara features were used, segments of Bihag were classified correctly but those of Kedar were classified incorrectly.
VI. CONCLUSION AND FUTURE WORK Though the positions of peaks and means that
we got do not match what was shown in [4], swara features are potentially able to capture intonation information that facilitates distinguishing two ragas that use the same scale. A more complete validation would require a database with more ragas of the same scale containing far more segments per raga.
Although while dividing the FPD into 12 partitions we assumed equal temperament, we don't know what tuning system was used by the artist. Because of this, the value of Mean might

not have been completely accurate. If we define partition boundaries on the basis of peaks, we might be able compute superior values of Mean.
The importance of a swara is not only dependent on the duration for which it is sung but also how loudly it is sung. Use of this information might result in better FPDs. This can be done by constructing weighted FPDs which would use the harmonic energy of the pitches in the pitch contour as weights.
Each raga might have a set of consonance pairs depending on the grammar that is being used. By detecting the steady pitches in performances and examining the consonance among them it might be possible to detect the raga that is being performed.
The entire process of raga recognition, as presented here, involves extraction of pitches, using these to construct features in conjunction with the tonic and then classification of the features. The only part that is done manually is tonic detection. We are currently working on automating this task and have been able to achieve around 80% accuracy.
REFERENCES [1] P. Chordia and A. Rae., “Raag recognition using
pitch-class and pitch-class dyad distributions,” in ISMIR 2007 8th Intl. Conf. on Music Information Retrieval, 2007.
[2] Gaurav Pandey, Chaitanya Mishra, and Paul Ipe., “Tansen: A system for automatic raga identification,” in Proc. 1st Indian Intl. Conf. on Artificial Intelligence, pages 1350–1363, 2003.
[3] A. K. Datta, R. Sengupta, N. Dey, and D. Nag. Experimental Analysis of Shrutis from Performances in Hindustani Music. Scientific Research Department, ITC Sangeet Research Academy, 1, N. S. C. Bose Road, Tollygunge, Kolkata 700040, India, 2006.
[4] V. Abel, C. Barlow, B. Bel, P. Decroupet, K. Howard, A. La Berge, C. Lee, D. Lekkas, H. Moeller, W. Swets, S. Tempelaars, J. Tenney, B. Thornton, H. Touma, W. van der Meer, and D. Wolf., “The RatioBook,” 2001.
[5] V. Rao and P. Rao., “Improving polyphonic melody extraction by dynamic programming based multiple F0 tracking,” in Proc. 12th Intl. Conf. Digital Audio Effects (DAFx-09), Como, Italy, Sept. 2009.
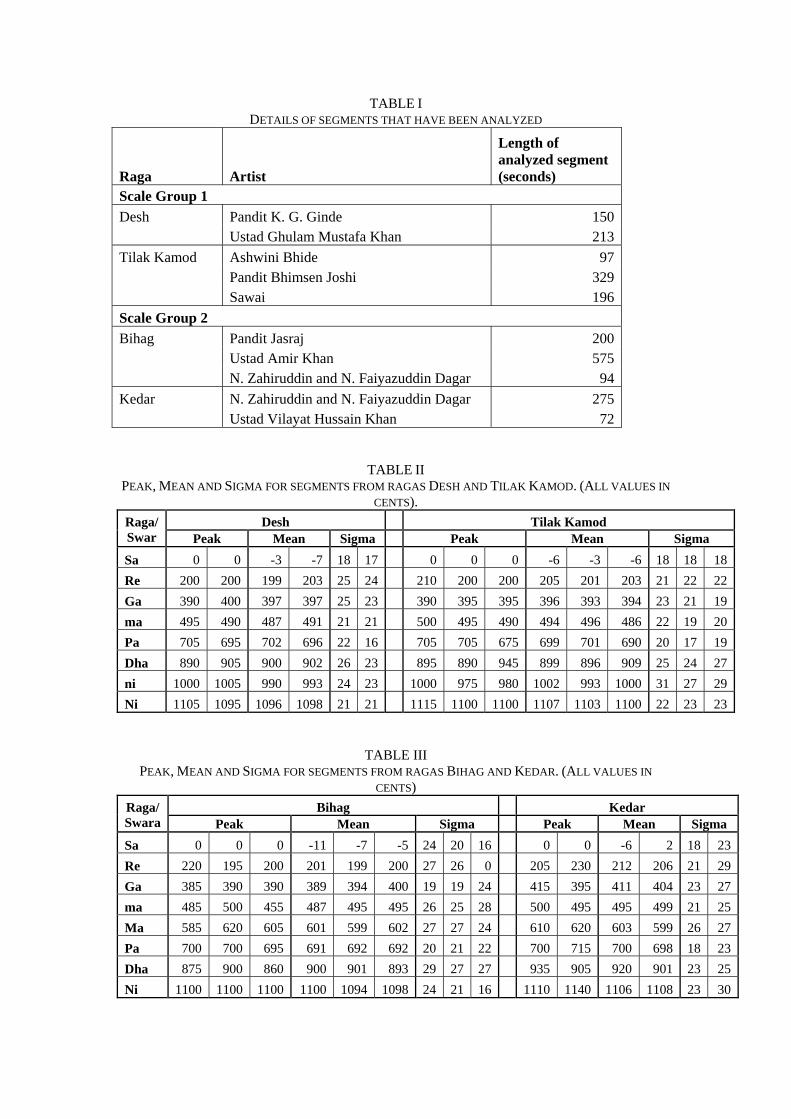
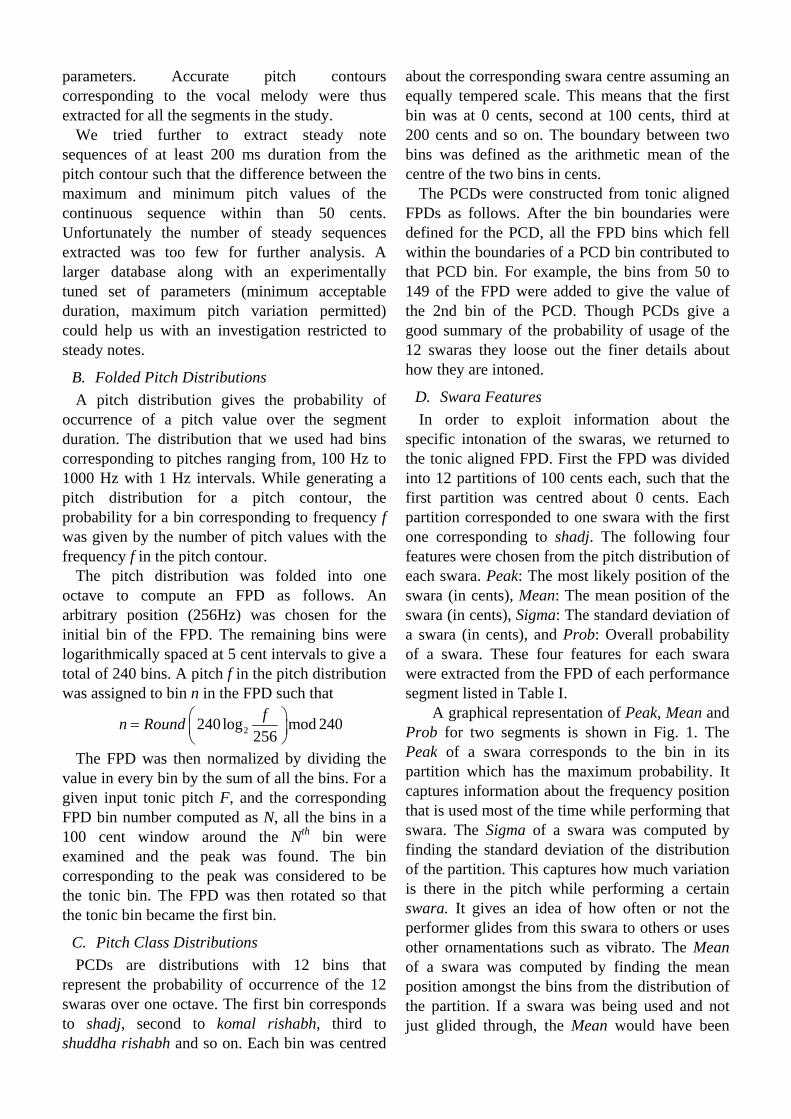
TABLE I DETAILS OF SEGMENTS THAT HAVE BEEN ANALYZED
Raga Artist
Length of analyzed segment (seconds)
Scale Group 1 Desh Pandit K. G. Ginde 150 Ustad Ghulam Mustafa Khan 213 Tilak Kamod Ashwini Bhide 97 Pandit Bhimsen Joshi 329 Sawai 196 Scale Group 2 Bihag Pandit Jasraj 200 Ustad Amir Khan 575 N. Zahiruddin and N. Faiyazuddin Dagar 94 Kedar N. Zahiruddin and N. Faiyazuddin Dagar 275 Ustad Vilayat Hussain Khan 72
TABLE II PEAK, MEAN AND SIGMA FOR SEGMENTS FROM RAGAS DESH AND TILAK KAMOD. (ALL VALUES IN
CENTS). Desh Tilak Kamod Raga/
Swar Peak Mean Sigma Peak Mean Sigma Sa 0 0 -3 -7 18 17 0 0 0 -6 -3 -6 18 18 18Re 200 200 199 203 25 24 210 200 200 205 201 203 21 22 22Ga 390 400 397 397 25 23 390 395 395 396 393 394 23 21 19ma 495 490 487 491 21 21 500 495 490 494 496 486 22 19 20Pa 705 695 702 696 22 16 705 705 675 699 701 690 20 17 19Dha 890 905 900 902 26 23 895 890 945 899 896 909 25 24 27ni 1000 1005 990 993 24 23 1000 975 980 1002 993 1000 31 27 29Ni 1105 1095 1096 1098 21 21 1115 1100 1100 1107 1103 1100 22 23 23
TABLE III PEAK, MEAN AND SIGMA FOR SEGMENTS FROM RAGAS BIHAG AND KEDAR. (ALL VALUES IN
CENTS) Bihag Kedar Raga/
Swara Peak Mean Sigma Peak Mean Sigma Sa 0 0 0 -11 -7 -5 24 20 16 0 0 -6 2 18 23Re 220 195 200 201 199 200 27 26 0 205 230 212 206 21 29Ga 385 390 390 389 394 400 19 19 24 415 395 411 404 23 27ma 485 500 455 487 495 495 26 25 28 500 495 495 499 21 25Ma 585 620 605 601 599 602 27 27 24 610 620 603 599 26 27Pa 700 700 695 691 692 692 20 21 22 700 715 700 698 18 23Dha 875 900 860 900 901 893 29 27 27 935 905 920 901 23 25Ni 1100 1100 1100 1100 1094 1098 24 21 16 1110 1140 1106 1108 23 30

(a)
(b) Fig. 1. FPD, PCD, Peak and Mean for (a) segment in raga Bihag by Pandit Jasraj and (b) segment in raga Kedar by Dagar Brothers. The thin lines give probabilities of bins of the FPD. The thick lines give probabilities of the bins of the PCD and for the sake of easy representation they are positioned at the points where mean of the swaras occur. Crosses give the position of the peak of the swaras (their y-axis position is irrelevant).