journal of immunological methods - ufjf.br ·...
TRANSCRIPT
Journal of Immunological Methods 376 (2012) 79–88
Contents lists available at SciVerse ScienceDirect
Journal of Immunological Methods
j ourna l homepage: www.e lsev ie r .com/ locate / j im
Research paper
Optimization of a whole blood intracellular cytokine assay for measuringinnate cell responses to mycobacteria
Muki S. Shey a, E. Jane Hughes a, Marwou de Kock a, Charlene Barnard a, Lynnett Stone a,Tobias R. Kollmann b, Willem A. Hanekom a, Thomas J. Scriba a,⁎a South African Tuberculosis Vaccine Initiative, Institute of Infectious Diseases and Molecular Medicine and School of Child and Adolescent Health, University of CapeTown, Cape Town, South Africab Division of Infectious and Immunological Diseases, Department of Pediatrics, University of British Columbia, Vancouver, British Columbia, Canada
a r t i c l e i n f o
⁎ Corresponding author at: University of Cape Townences, Anzio Road, Observatory, Cape Town, WesterTel.: +27 21 4066427; fax: +27 21 4066693.
E-mail address: [email protected] (T.J. Scrib
0022-1759/$ – see front matter © 2011 Elsevier B.V. Adoi:10.1016/j.jim.2011.11.011
a b s t r a c t
Article history:Received 17 June 2011Received in revised form 10 October 2011Accepted 23 November 2011Available online 1 December 2011
Innate cells are essential for host defense against invading pathogens, and the induction anddirection of adaptive immune responses to infection. We developed and optimized a flow cyto-metric assay that allows measurement of intracellular cytokine expression by monocytes, den-dritic cells (DC) and granulocytes, as well as cellular uptake of green-fluorescent protein(GFP)-expressing mycobacteria, in very small volumes of peripheral blood.We show that innate cell stimulation resulted in increased granularity of monocytes and mDCand decreased granulocyte granularity that precluded flow cytometric discernment of granu-locytes from monocytes and myeloid DC by forward and side scatter gating. Anti-CD66a/c/eantibody staining allowed reliable identification and exclusion of granulocytes for subsequentdelineation of monocytes and myeloid DC. Intracellular cytokine expression by granulocytes,monocytes and mDC was remarkably sensitive to the dose of mycobacterial inoculum. More-over, activation of monocytes and mDC with live BCG reduced expression levels of CD14 andCD11c, respectively, necessitating optimization of staining conditions to reliably measurethese lineage markers. Finally, we characterized expression of IL-12/23p40, TNF-α, IL-6, andIL-10, by GFP+ and GFP- monocytes and mDC from 25 healthy adults.This assay may be applied to the study of innate cell responses to any GFP-expressing patho-gen, and can be performed on blood volumes as low as 200 μL per condition, making theassay particularly suitable for pediatric studies.
© 2011 Elsevier B.V. All rights reserved.
Keywords:MycobacteriaFlow cytometryMonocytesDendritic cellsGranulocytesInnate cytokines
1. Introduction
Innate immunity is critical for host defense against invad-ing pathogens, and the induction and direction of adaptiveimmune responses to infection (Kollmann et al., 2009). Innatephagocytic cells, such as macrophages and neutrophils, con-stitute the first line of defense. Upon recognition of pathogenassociated molecular patterns (PAMPs) through pattern rec-ognition receptors (PRRs), these cells become activated and
, Faculty of Health Sci-n Cape, South Africa.
a).
ll rights reserved.
may phagocytose, kill and eliminate the infecting microor-ganism (Blomgran and Ernst, 2011; Dorhoi et al., 2011; Eumet al., 2010; Silva, 2009). Activated cells also secrete cytokinesand chemokines, which mediate recruitment of additionalcells and orchestrate an inflammatory response (Dorhoi etal., 2011).
In addition, antigen-presenting cells that have internalizedpathogen, such as dendritic cells (DC), traffic to draining lymphnodes where they present processed antigens to naïve T cells(Banchereau and Steinman, 1998; Mellman and Steinman,2001). The quality and magnitude of the ensuing T cell responsemay depend on a number of factors, including the number of in-vading organisms, the type and combination of PRR(s) triggered,and the subsequent efficiency of phagocytosis, innate cell

80 M.S. Shey et al. / Journal of Immunological Methods 376 (2012) 79–88
activation, pathogen killing and processing, and the release of in-flammatory mediators (Dorhoi et al., 2011; Kapsenberg, 2003;Mazzoni and Segal, 2004). Intracellular pathogens, such asmyco-bacteria, possess a number of escapepathways that arrest phago-some acidification and maturation to allow survival andreplication within the phagocyte (Russell, 2011; Flynn andChan, 2003). Optimal cytokine and chemokine-mediated cross-talk between innate and adaptive cells is required for optimal ac-tivation of macrophages to overcome this subversion and medi-ate pathogen killing (Flynn and Chan, 2003).
Several studies have described flow cytometric methodsfor ex vivo characterization of peripheral blood monocytesand DCs (Autissier et al., 2010; Fung et al., 2010; Ida et al.,2006; Wang et al., 2006, 2009). In these studies granulocytesare typically excluded based on their unique size and granu-larity, before identifying monocytes and mDC using lineagemarkers, such as CD14 and CD11c.
We developed and optimized a flow cytometric assay thatmeasures intracellular expression of key pro- and anti-inflammatory cytokines by peripheral blood innate cells inresponse to live mycobacteria. We show that upon activationwith viable mycobacteria or LPS, changes to several proper-ties of innate cells have to be accounted for to accurately de-lineate peripheral blood innate cell subsets and measureintracellular cytokine expression. We describe multiple im-portant factors for assay success and apply this intracellularcytokine staining assay to characterize the innate cellresponse to the live mycobacterium, M. bovis BacilleCalmette-Guerin (BCG), using 200 μL of whole blood percondition.
2. Materials and methods
2.1. Participant recruitment and enrollment
Healthy adults, aged 18–50 years, were enrolled at theSouth African Tuberculosis Vaccine Initiative Field Site inthe Cape Town region of South Africa. Exclusion criteria in-cluded pregnancy, HIV-1 infection, M.tb infection and anyother acute or chronic infection. HIV-1 infection was diag-nosed by rapid HIV antibody test (HIV Determine 1&2),while M.tb infection was defined as a positive interferongamma (IFN-γ) response to ESAT6/CFP-10 protein, measuredby ELISA, as described previously (Kagina et al., 2009). Thestudy protocol was approved by the Research Ethics Commit-tee of the University of Cape Town, and all participants pro-vided written informed consent.
2.2. TLR ligands and bacteria, and antibodies
Ultrapure lipopolysacharide (LPS, TLR4 ligand, 100 ng/mLfinal concentration), isolated from Salmonella minnesota, wasobtained from InvivoGen. This LPS concentration was previ-ously found to induce optimal cytokine expression by innatecells in whole blood (Jansen et al., 2008). Viable BCG expres-sing green fluorescent protein (BCG-GFP, Pasteur strain;3.5×10⁵ CFU/mL final concentration, unless otherwise stat-ed, donated by Muazzam Jacobs, University of Cape Town)was cultured in our laboratory. Bacteria were harvested atlog phase 3 weeks after start of culture (optical density of0.8) and CFU counts determined by plating bacteria on agar
plates. LPS and bacteria were prepared at 10 times the finalconcentration in RPMI 1640, and 20 μL was added into 96round bottom well plates.
The following antibodies were used, CD14-QDot605(clone Tuk4, Invitrogen), CD14-Pacific Blue (clone M5E2, BDPharmingen), TNF-α-PECy7 (clone Mab11, BD Pharmingen),CD11c-PerCPCy5.5 (clone Bu15), HLA DR-AlexaFluor700(clone L243), IL-12/23p40-Pacific Blue (clone C11.5), IL-10-PE (clone JES3-19 F1) and IL-6-APC (clone MQ2-13A5), allfrom Biolegend. CD66a/c/e (ASL-32, Biolegend) was conju-gated in-house to QDot565 (Invitrogen) using the manufac-turer's protocol.
2.3. Blood collection and processing
Heparinized blood was collected from each participantand processed immediately (maximum delay betweenblood collection and incubation with ligands was 30 min).We previously investigated the effects of delayed processingof blood and showed that delay by 60 min or more affectedcytokine expression by mDC (Mendelson et al., 2006). Anundiluted blood volume of 180 μL was added to wells of a96-well plate containing LPS or bacteria. The cultures wereincubated at 37 °C, 5% CO2 in humidified conditions. RPMI1640 was used as medium control. After 3 h of incubation,brefeldin A (BFA, 10 μg/mL, Sigma-Aldrich) was added toeach well and the plate was incubated for 3 additionalhours as previously optimized (Jansen et al., 2008). After atotal incubation of 6 h, EDTA was added (2 mM final concen-tration, Sigma-Aldrich) and blood incubated for 10 min atroom temperature in order to detach adherent cells. To lysered cells and fix white cells, FACS Lysing Solution (BD Biosci-ences) was added and cells were incubated at room temper-ature for 10 min. This lysing step was repeated to ensurecomplete red cell lysis. Fixed white cells were either stainedimmediately or cryopreserved in 10% DMSO in heat inacti-vated fetal calf serum (10% DMSO/FCS) or in FACS LysingSolution.
2.4. Intracellular cytokine staining and flow cytometricacquisition
Cryopreserved, stimulated cells were thawed in batch,and cells were washed twice with either phosphate bufferedsaline (PBS, without calcium and magnesium) or BD Perm/Wash buffer (BD Biosciences). Cells were stained with fluo-rescent antibodies in a total volume of 30 μL in either PBSor BD Perm/Wash, at 4 °C for 1 h. Stained cells were washedand 1 million cells or the total sample volume were acquiredon a BD LSR II flow cytometer.
2.5. Data analysis
Flow cytometry data were analyzed using FlowJo v9.2.Results from single-stained and unstained mouse κ beadswere used to calculate compensations, for each run. Celldoublets were excluded using forward scatter-area versusforward scatter-height parameters. Cytokine co-expressionby innate cell subsets was assessed by boolean gating. Sub-traction of background cytokine expression (unstimulatedsamples) was done using Pestle V1.6.2, while data sorting

81M.S. Shey et al. / Journal of Immunological Methods 376 (2012) 79–88
and analysis were done with Spice V5.1 (Roederer et al., 2011;http://exon.niaid.nih.gov/spice, accessed February 25th, 2011).GraphPad Prism v5 was used for data presentation and sta-tistical analysis. The Mann–Whitney or Wilcoxon signed ranktests were used to compare data sets. P values b0.05 wereconsidered significant.
3. Results
3.1. CD66a/c/e allows identification and exclusion of granulocytes
The different size and granularity of granulocytes, com-pared with monocytes and mDC, allows identification ofthese cell subsets by ex vivo flow cytometric analysis(Autissier et al., 2010; Fung et al., 2010). Upon stimulationwith live mycobacterium BCG-GFP, or LPS, we observed a de-crease in side scatter fluorescence of granulocytes, while theside scatter fluorescence for mDC and monocytes increased(Fig. 1A). This precluded separation of mDC and monocytesfrom granulocytes using forward and side scatter parameters.
The CD66 isoforms a, c, d and e are members of the carci-noembryonic antigen (CEA) family of the Ig superfamily, andare exclusively expressed on granulocytes and epithelial cells(Gray-Owen and Blumberg, 2006). Staining with anti-CD66a/c/e antibody allowed identification of peripheral blood granu-locytes (CD66a/c/e+, Fig. 1B). Since granulocytes express highlevels of HLA DR and low levels of CD14 and CD11c, exclusionof granulocytes was required for accurate identification ofCD14-HLA DR+CD11c+ mDC and HLA DR+CD14+ monocytes.Upon granulocyte exclusion the frequency of cells falling intothe HLA DR+ gate decreased from 61% (IQR, 58–72%) to 9%(IQR, 7–13%, Fig. 1C-E). Similarly, the proportion of HLADR+CD14- cells expressing CD11c amongst all leucocytes de-creased from 55% (IQR, 51–58%) to 1% (IQR, 0.7–1.5%) upon ex-clusion of CD66a/c/e+ cells (Fig. 1C–E).
3.2. BCG-activated monocytes downregulate CD14 expression
We investigated whether innate cell activation affects ex-pression levels of innate lineage markers and flow cytometricdelineation of monocytes, mDC and granulocytes. Lower fre-quencies of CD14+ monocytes were detected upon BCG stim-ulation, compared with unstimulated samples. This wasobserved when expression of CD14 was measured by flowcytometric staining with QDot605 or Pacific Blue conjugatedanti-CD14 antibodies (Fig. 2A and B). A decrease in medianfluorescence intensity of CD14 was also observed upon BCGstimulation, albeit only when QDot605-conjugated anti-CD14 was used. A recent study reported that the HLADR+CD11c+CD14-/dim cell population may also containCD14-CD16+ monocytes (Cros et al., 2010). We could not de-lineate these monocyte sub-populations, as we did not mea-sure CD16 expression in our analyses.
No difference in the frequency of CD66a/c/e+ granulo-cytes or CD11c+ mDC among HLA DR+CD14- cells was ob-served upon BCG stimulation, and CD11c fluorescence wasonly moderately decreased (p=0.03, Fig. 2A and data notshown). Similar results were obtained when whole bloodwas incubated with LPS (data not shown).
The downregulation of CD14 and CD11c necessitated opti-mal blood processing and antibody staining conditions to
identify these key lineage markers after incubation of wholeblood with BCG or LPS. Because monocytes are adhesive cells,we tested whether EDTA treatment after stimulation would in-crease thenumber of CD14+monocytes. Althoughwe observeda higher proportion of CD14+ cells in most donors after EDTAtreatment, compared with untreated samples, this differencewas not significant (Supplementary Fig. 2). Regardless, EDTAtreatment was included for all subsequent experiments. Usingthis protocol, a median (IQR) of 8049 mDC (6152-11,432),27,218 monocytes (19,447-33,437) and 368,000 granulocytes(273,500-412,500) were acquired for analysis.
3.3. QDot-conjugates are sensitive to staining buffer
Given the difference in staining performance between theQDot and Pacific Blue conjugated anti-CD14 antibodies, wefurther optimized staining conditions for QDot conjugates.QDots are fluorescent nanocrystals commonly used for imag-ing and flow cytometric analysis (Zarkowsky et al., 2011).Performance of these fluorochromes can be sensitive to com-ponents in staining buffers, such as heavy metals (Chen et al.,2002; Meallet-Renault et al., 2006). To optimize the antibodystaining method for innate cell delineation, we tested theperformance of fluorochrome-conjugated antibodies in dif-ferent staining buffers. We observed low fluorescence ofCD66a/c/e-QDot565 and CD14-QDot605 staining when cellswere incubated with a single cocktail of all 8 antibodies inPBS (Fig. 2C). The low signal of these markers precluded reli-able delineation of monocyte and DC subsets, especially afterBCG or LPS stimulation. By contrast, cell staining with the sin-gle antibody cocktail in BD Perm/Wash buffer resulted inhigher fluorescence of the QDot-conjugates, allowing moreprecise gating of cell subsets. When cells were first stainedwith non-QDot-conjugated antibodies in PBS, followed by asecond staining step with anti-CD66a/c/e-QDot565 andanti-CD14-QDot605 in BD Perm/Wash buffer, the fluores-cence of CD14-QDot605 was even brighter. However, thisdid not enhance CD66a/c/e-QDot565 fluorescence markedly.The fluorescence of non QDot-conjugated antibodies did notchange when PBS or BD Perm/Wash was used as stainingbuffer (data not shown).
1 mM EDTA in staining buffer has been shown to improveQDot fluorescence (Zarkowsky et al., 2011). We did not ob-serve any improvement in fluorescence of QDot-conjugatedantibodies when cells were stained in PBS containing 1 mMEDTA (data not shown). We therefore proceeded withsingle-step staining in BD Perm/Wash buffer for all subse-quent experiments.
3.4. Green fluorescent protein-expressing BCG (BCG-GFP) allowsmeasurement of BCG binding and/or internalization by innatecells
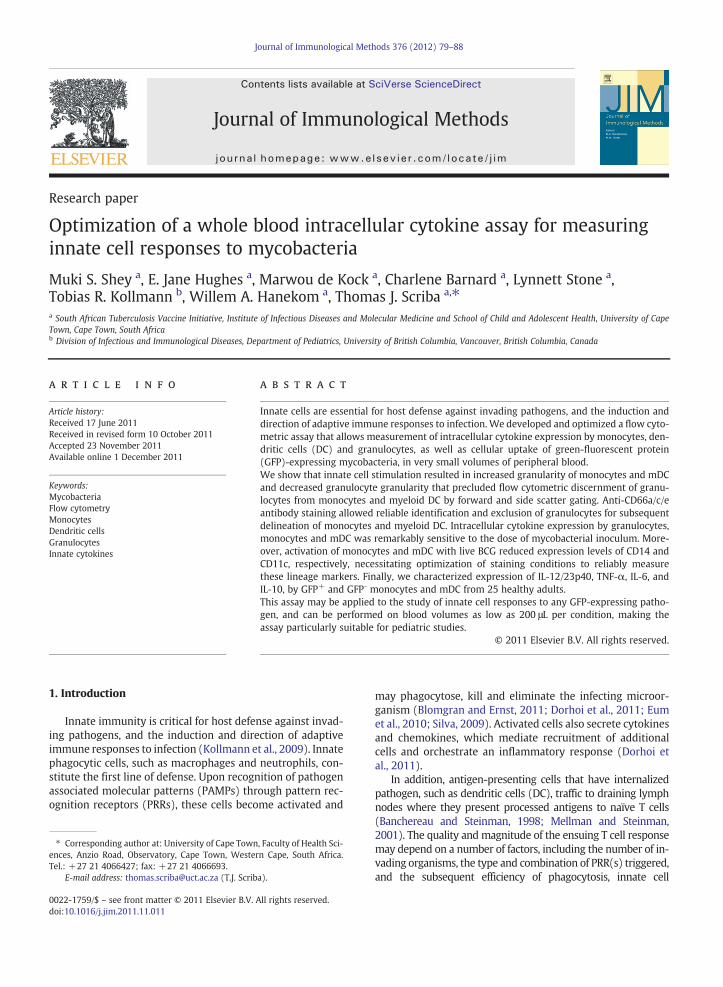
Upon pathogen recognition, activated innate cells maybind to and/or phagocytose the microbe and express cyto-kines and chemokines (Gille et al., 2009). Alternatively, acti-vation and cytokine expression may occur in the absence ofpathogen binding or phagocytosis. We used a GFP-expressing BCG to allow detection of innate cells that havebound and/or internalized BCG, by flow cytometry (Fig. 3A).The concentration of BCG inoculum was an important

82 M.S. Shey et al. / Journal of Immunological Methods 376 (2012) 79–88
determinant of innate cell response to BCG. The proportion ofGFP+monocytes and granulocytes reached a plateau at an in-oculum concentration of 3.5×10⁵ CFU/mL of whole blood,whereas the proportion of GFP+ mDC appeared to reach amaximum at a lower inoculum dose of 1.7×10⁵ CFU/mL(Fig. 3B, upper panel). Surprisingly, expression of the pro-
inflammatory cytokine IL-6 was remarkably sensitive to themycobacterial inoculum concentration (Fig. 3A and B). IL-6 ex-pression bymonocytes, mDC and granulocytes peaked at amy-cobacterial inoculum of 3.5×10⁵ CFU/mL and markedlydecreased at higher doses (Fig. 3B). The dose of 3.5×10⁵ CFU/mL was chosen for subsequent experiments.

Fig. 2. Cell activation downregulates CD14. Whole blood from 5 donors was incubated with no antigen or 3.5×10⁵ CFU/mL BCG-GFP for 6 h before flow cytometricanalysis of cell subsets. (A) Representative plots showing flow cytometric detection of cells falling into the CD14+ and HLA DR+ (top plots) and CD11c+ (lowerplots) gates. (B) Frequencies and CD14 median fluorescence intensities (MFI) of monocytes detected with anti-CD14 QDot (left panels) or anti-CD14 Pacific Blue(right panels). The Wilcoxon signed rank test was used for statistical analysis. (C) Comparison of QDot-conjugate antibody staining of whole blood from a singlerepresentative donor after single step staining in PBS or Perm/Wash or two-step staining in PBS (for non QDot-conjugated antibodies), then Perm/Wash (forQDot-conjugated antibodies).
83M.S. Shey et al. / Journal of Immunological Methods 376 (2012) 79–88
3.5. Different frequencies of innate cells directly bind or internal-ize BCG
We next determined the proportion of GFP+ cells amongeach innate cell subset, as well as the proportion of each sub-set among GFP+ cells. A median proportion of 45% (IQR, 37–
Fig. 1. Optimizing flow cytometric detection of innate cell subsets. (A) Forward scatcytes (bottom row), after incubation of whole blood with no antigen, BCG-GFP or LPSas CD14-, HLA DR+ and CD11c+ (refer to Supplementary Fig. 1C for gating strategy)(C and D). CD14 and HLA DR expression by peripheral blood innate cells (left plotsafter (D) exclusion of CD66a/c/e+ granulocytes. (E) Frequencies of CD14- HLA DR+
in 25 adults. The frequencies of cell subsets among total leukocytes falling into the Ctary Fig. 1C for gating strategy).
50%) of granulocytes were GFP+ (Fig. 4A). A lower propor-tion of monocytes were GFP+ (Median, 36%; IQR, 31–38%)while mDC displayed the lowest proportion of GFP+ cells(median, 26%; IQR, 23–30%) (Fig. 4A). A similar, but markedlymore pronounced picture was observed when we assessedthe relative proportions of these innate cell subsets among
ter and side scatter properties of granulocytes and mDC (top row) or mono-. Granulocytes were identified as CD66a/c/e+, monocytes as CD14+ andmDC. (B) Identification and exclusion of granulocytes by anti-CD66a/c/e staining), and CD11c expression by CD14-, HLA DR+ cells (right plots), before (C) orand CD11c+ mDC pre and post exclusion gating of CD66a/c/e+ granulocytes,D14- HLA DR+ or CD11c+ gates are shown in each plot (refer to Supplemen-
Fig. 3. Measurement of BCG uptake by innate cells. (A) Representative dot plots of IL-6 expression by GFP+ or GFP- monocytes, mDC or granulocytes, after incu-bation without BCG-GFP (upper row), or with 3.5×10⁵ CFU/mL (middle row), or 10×105 CFU/mL of BCG-GFP (bottom row). The frequencies of cells falling intoeach of the 2 boolean gates are shown. (B) Frequencies of GFP+ monocytes, mDC, or granulocytes (upper row) after titration of BCG-GFP into whole blood from 5donors. (Bottom row) Frequencies of total IL-6 expressing monocytes, mDC or granulocytes at different BCG-GFP inocula.
84 M.S. Shey et al. / Journal of Immunological Methods 376 (2012) 79–88
GFP+ cells. Granulocytes comprised 87% (IQR, 82–89), mono-cytes comprised 7% (IQR, 5–9%), while mDC contributed 1%(IQR, 0.8–1.4%) of all GFP+ innate cells (Fig. 4B). Granulo-cytes were thus the peripheral blood innate cell subset withthe highest capacity for binding and/or internalization ofBCG.
3.6. Freezing medium is not a critical determinant of assayperformance
Batch thawing of samples cryopreserved after stimulationand fixation allows more standardized antibody staining forflow cytometry. To determine the effect of cryopreservation

85M.S. Shey et al. / Journal of Immunological Methods 376 (2012) 79–88
on assay performance, we compared the frequencies of mono-cytes and mDC when cells were stained immediately after cul-ture without cryopreservation, with cells that werecryopreserved. Prior cryopreservation did not significantly af-fect the frequencies of mDC or monocyte subsets in unstimu-lated or BCG-stimulated blood (Supplementary Fig. 3A, right).Choice of cryopreservationmediummayalso affect cellular pro-teins and thus antibody staining.We evaluated the use of eitherFACS Lysing Solution (FLS) or 10% DMSO in FCS as cryopreser-vation media. Frequencies of CD14+ and CD11c+ cells in unsti-mulated or BCG-stimulated whole blood were also notsignificantly affected by the choice of cryopreservationmedium(Supplementary Fig. 3B). Although cryopreservation did appearto result in lower frequencies of IL-6 expressingmonocytes andmDC in 4 donors, this difference was not significant (Supple-mentary Fig. 3C). Similarly, frequencies of IL-6-expressingmonocytes appeared to be higher when FACS Lysing solutionwas used, compared with DMSO in FCS, but this was not signif-icant (Supplementary Fig. 3C). Cryopreservation medium didnot influence frequencies of IL-6-expressing mDC after incuba-tion of whole blood with BCG. Subsequent experiments wereperformed with 10% DMSO as freezing medium.
3.7. Cytokine expression by BCG-GFP-negative cells
Finally, we applied the optimized whole blood innate ICSassay to compare cytokine expression between innate cells
Fig. 4. Comparison of mDC, monocyte or granulocyte phagocytosis of myco-bacteria. Whole blood from in 25 donors was incubated with 3.5×10⁵ CFU/mLBCG-GFP for 6 h before flow cytometric analysis of cell subsets. (A) Proportionof GFP+ cells among each innate cell subset. (B) Proportion of each innate cellsubset amongGFP+ cells. Horizontal lines represent themedian, boxes representthe IQR and whiskers represent the range.
that bound and/or internalized BCG (GFP+) and GFP-negativecells. A substantial proportion of GFP- monocytes and mDCexpressed the pro-inflammatory cytokines IL-6, IL-12/23p40and/or TNF-α, in various combinations, albeit at lower frequen-cies than GFP+ monocytes and mDC (Fig. 5A). Notably, mono-cytes expressing IL-12/23p40 alone were observed at a higherfrequency in GFP-, compared with GFP+ cells (Fig. 5A). Mono-cytes expressing IL-6 alone and mDC co-expressing IL-6 andTNF-α were the dominant cytokine-expressing subsets inboth GFP+ and GFP- cells (Fig. 5A and B).
Upon LPS stimulation, monocytes expressing IL-6 alonealso comprised the dominant subset, while cells co-expressing IL-6 and TNF-α were prominent (Fig. 5C). By con-trast, similar frequencies mDC expressed IL-6 alone or co-expressed IL-6 and TNF-α (Fig. 5D).
IL-10-expressing cells were detected at very low frequen-cies compared with IL-6, TNF-α and IL-12/23p40, and IL-10was not co-expressed with these pro-inflammatory cytokines(data not shown). Again, IL-10-expressing monocytes andmDC were observed at higher proportions amongst GFP+
cells, compared with GFP- cells (Fig. 5E and F). LPS stimula-tion induced higher frequencies of IL-10-expressing mono-cytes, compared with BCG (Fig. 5E). BCG binding orinternalization induced a higher frequency of cells expressingcytokines.
4. Discussion
We developed and optimized an assay for measuring in-tracellular cytokine expression by peripheral blood innatecells in response to viable mycobacteria using very small vol-umes of blood. Our method presents a number of importantvariables for optimal performance of this innate cell ICSassay: 1. Exclusion of granulocytes is required for reliableflow cytometric delineation of myeloid DC and monocytesin whole blood; 2. Anti-CD66a/c/e antibody staining allowsflow cytometric identification and analysis of granulocytesamong activated innate cells; this was not possible using for-ward and side scatter parameters; 3. Innate cells that havenot bound or phagocytosed mycobacteria express cytokines,and this cytokine expression is exquisitely sensitive to thedose of mycobacterial inoculum; 4. Fluorescent antibodystaining buffer and cell activation are important determi-nants of performance and outcomes of the ICS assay.
We show that the increase in monocyte and mDC granu-larity, and decrease in granulocyte granularity, after wholeblood stimulation with BCG or LPS precludes discernment ofgranulocytes from monocytes and mDC. Further, granulocyteexpression of the mDC lineage marker, CD11c, necessitatedexclusion of granulocytes to identify peripheral blood mDC.We show that anti-CD66a/c/e antibody allows identificationand exclusion of granulocytes, and subsequent identificationof monocytes and mDC using key lineage markers. Our re-sults highlight that innate assays should take into accountthe marked changes that occur upon innate cell activation.In our hands, the changes in granularity ruled out identifica-tion of granulocytes by side and forward scatter parameters,which is the most common method for phenotyping innatecells ex vivo (Autissier et al., 2010; Fung et al., 2010).
Our results also underscore an important considerationwhen identifying DC subsets in whole blood, since no single

Fig. 5. Differential cytokine expression by GFP+ and GFP- innate cells. Whole blood from 25 donors was incubated with 3.5×10⁵ CFU/mL BCG-GFP for 6 h beforeflow cytometric analysis of cell subsets. Cytokine co-expression patterns in monocytes (A) or mDC (B) that have phagocytosed BCG (GFP+) or not (GFP-). Cyto-kine co-expression patterns in monocytes (C) or mDC (D) after LPS stimulation. Frequencies of IL-10-expressing monocytes (E) or mDC (F) after whole bloodincubation with BCG-GFP or LPS. Horizontal lines represent the median, boxes represent the IQR and whiskers represent the range. Differences between GFP+
and GFP- cells were calculated with the Wilcoxon signed rank test.
86 M.S. Shey et al. / Journal of Immunological Methods 376 (2012) 79–88
marker is expressed exclusively by all DC subsets. The mostcommon DC identification methods enumerate HLA DR+
and CD11c+ DC after excluding T cells (CD3), B cells (CD19or CD20), NK cells (CD56 or CD16), and monocytes (CD14)using lineage markers (Autissier et al., 2010; Ida et al.,2006; Wang et al., 2006, 2009). However, exclusion gatingof lineage marker-positive cells may lead to exclusion of im-mature DC, which express low levels of CD14 and CD16(Wang et al., 2006). We propose a combination of markersthat allows identification of unstimulated or activated granu-locytes, monocytes and mDC without these confounders,while allowing simultaneous analysis of cytokine expressionpatterns of these cells using a single antibody cocktail.Wang et al. (2006) also showed that CD66a/c/d/e antibody-containing lineage cocktails allowed detection of higher fre-quencies of DC, compared with cocktails containing anti-CD14 antibodies (Wang et al., 2006).
Incubation of whole blood with BCG or LPS led to marked-ly lower frequencies of CD14+ monocytes. Our results thatEDTA treatment did not change CD14+ cell frequencies sig-nificantly suggest that greater adherence of monocytesupon activation was an unlikely contributor to this finding.
Downregulation of CD14 was previously reported upon stim-ulation with high doses of TLR7/8 or TLR4 ligands (Jansen etal., 2008). CD14 downregulation is also described in responseto histamines in monocytes (Takahashi et al., 2003), LPS andE. coli in rabbit alveolar macrophages (Lin et al., 2004). How-ever, M.tb infection has been shown to upregulate the ex-pression of CD14 on monocytes (Shams et al., 2003). Giventhe role of CD14 as the TLR4 co-receptor for LPS binding,the downregulation is likely due to macropinocytosis-mediated internalization upon TLR4 stimulation (Mollen etal., 2008; Poussin et al., 1998). Lower frequencies of CD14+
cells after stimulation may also be due to shedding of CD14or monocyte death. A spontaneous decrease in CD14 withoutstimulation has been reported, which could be due to inter-nalization of membrane-bound CD14 followed by processingand secretion of soluble CD14, or the rapid recycling of CD14-TLR4-MD2 complexes between the plasma membrane andthe Golgi apparatus (Bosshart and Heinzelmann, 2011). Incu-bation of PBMC with E. coli or Group B streptococcus alsoleads to a reduction in viable monocytes (Gille et al., 2009).Similarly, monocytes are known to rapidly die through eitherclassical apoptosis or alternative cell death processes after

87M.S. Shey et al. / Journal of Immunological Methods 376 (2012) 79–88
phagocytosis of mycobacteria (Webster et al., 2010). Notably,HLA DR+CD11c+CD14-/dim cell population may also containCD14-CD16+ monocytes (Cros et al., 2010). Peripheralblood frequencies of CD16+ monocytes were reported to in-crease during M.tb infection, but these cells were more sus-ceptible to apoptosis, and, unlike CD14+ monocytes, did notdifferentiate in vitro into monocyte-derived-macrophages(Castano et al., 2011). We could not delineate these mono-cyte sub-populations, as we did not measure CD16 expres-sion in our analyses.
The reduction in CD14+ frequency and fluorescence ne-cessitated optimization of staining conditions for detectionof monocytes. QDot-conjugated antibodies (CD14 andCD66a/c/e) performed best when antibody staining was per-formed in BD Perm/Wash buffer. Fluorescence of QDot nano-cystals is sensitive to staining buffers, and depends onconcentrations of heavy metals (Chen and Rosenzweig,2002; Meallet-Renault et al., 2006). Low concentrations of cu-pric ions were recently shown to eliminate QDot fluorescence(Zarkowsky et al., 2011). The latter study showed that 1 mMEDTA completely protected the fluorescent properties ofthese nanocrystals. However, in our hands staining in 1 mMEDTA/PBS did not result in enhanced QDot fluorescence.
Infection of innate cells with GFP-expressing BCG permitsevaluation of the proportion of cells that have phagocytosedBCG, and allows comparison of cytokine expression by BCG-containing cells with those that have not internalized BCG.Importantly, our GFP-based assay system did not allow dis-crimination between cells that have phagocytosed BCG andcells with surface-bound mycobacteria. Although not investi-gated here, we anticipate that the proportion of cells with in-ternalized BCG markedly exceeds those with surface-boundBCG, as was previously shown for human epithelial cells (deBoer et al., 1996). Interestingly, while the proportion ofGFP+ cells increased with greater bacterial inocula, the pro-portion of functional, IL-6 expressing cells peaked at an inoc-ulum of 3.5×10⁵ CFU/mL. IL-6 expression of these cellsdropped rapidly at higher bacterial loads. Our data highlightthat titrating the mycobacterial inoculum when measuringinnate cell cytokine expression is an important optimizationstep. The exact mechanism for the lower cytokine expressionat high bacterial inocula is not clear, but may be related to theknown inhibitory effect of polar lipids, such as phenolic gly-colipids (PGL), found in the cell wall of BCG (Reed et al.,2004; Vergne and Daffe, 1998). PGL derived from M.tbH37Rv or BCG was shown to inhibit the production of TNF-αand IL-6 by murine bone marrow derived macrophages(BMM) in a dose-dependent manner (Reed et al., 2004). Itis unknown whether this sensitivity of in vitro innate cellcytokine expression to mycobacterial dose applies to innatecell behavior in vivo. Such sensitivity would imply that infectionwith high doses of pathogen might lead to suboptimal in-flammatory responses.
We observed cytokine expression by a considerable pro-portion of GFP- cells. A higher frequency of GFP- monocytesexpressed IL-12/23p40 alone, compared with GFP+ mono-cytes. The significance of this observation is unknown. Cyto-kine expression by GFP- innate cells is likely due tobystander activation by cytokines secreted by phagocyticcells, or other cells that can directly recognize mycobacteria,such as NK or γδ T cells.
Granulocytes were the major peripheral blood phagocytesof BCG, although little or no cytokine response was detectedin these cells. This finding is consistent with a recent studyshowing that neutrophils were the predominant M.tb-infected cell subset in sputum and bronchoalveolar lavagefrom patients with multidrug resistant TB (Eum et al., 2010).However, these data do not accordwith several murine studiesthat invariably showed alveolar macrophages and DC to be thepredominant populations of BCG-infected lung cells in vivo(Humphreys et al., 2006; Pecora et al., 2009). Despite beingpresent at high numbers in lungs of infectedmice, granulocyteswere not infected to the same extent (Humphreys et al., 2006).These differences may simply be due to distinct immune char-acteristics or presentation of TB infection/disease in mice andhumans (Eum et al., 2010). The different markers andmethodsfor identification of cell subsets may also underlie the discrep-ant outcomes; for example, we identified granulocytes asCD66a/c/e+ while Humphreys et al. (2006) identified thesecells as CD11b+/HiCD11c-.
A limitation of the flow cytometric ICS assay described herewas the absence of a viabilitymarker to exclude dead cells. Stim-ulation with BCG or LPS was performed on fresh whole blood,which reduced the likelihood of cell death typically observedwhen culturing thawed cells. In line with this, we observed noor only very minor evidence of artifactual antibody stainingand/or autofluorescence. Although not tested here, a stainingstep with a fixation-resistant viability dye may be incorporatedafter red cell lysis, but before cell fixation, to allow exclusion ofdead cells, as we recently described for another whole bloodassay (Soares et al., 2010). We also could not assess whetherBCG in GFP+ cells was intracellular or on the surface.
To summarize, we developed an innate cell ICS assay thatmeasures cytokine expression by flow cytometry to myco-bacteria. This assay may be applicable to studying innatecell responses to any fluorescent pathogen, and can be per-formed on blood volumes as low as 200 μL per condition,making it particularly suitable for pediatric studies.
Conflict of interest
The authors declare that they have no commercial orfinancial conflicts of interest.
Supplementary materials related to this article can befound online at doi:10.1016/j.jim.2011.11.011.
Acknowledgments
We would like to thank the study participants. TJS andWAH are supported by the NIH (RO1AI087915). WAH isalso supported by the TB Research Unit of the NIH (NO1 AI70022) and by the Wellcome Trust-supported Clinical Infec-tious Disease Research Initiative of the University of CapeTown. MSS is supported by a South African Tuberculosisand AIDS Training scholarship (SATBAT: D0711100-22.CM).All authors are supported by the Aeras Foundation, in part.
References
Autissier, P., Soulas, C., Burdo, T.H., Williams, K.C., 2010. Evaluation of a 12-color flow cytometry panel to study lymphocyte, monocyte, and den-dritic cell subsets in humans. Cytometry A 77 (5), 410 (May).

88 M.S. Shey et al. / Journal of Immunological Methods 376 (2012) 79–88
Banchereau, J., Steinman, R.M., 1998. Dendritic cells and the control of im-munity. Nature 392 (6673), 245 (Mar 19).
Blomgran, R., Ernst, J.D., 2011. Lung neutrophils facilitate activation of naiveantigen-specific CD4+ T cells during Mycobacterium tuberculosis infec-tion. J. Immunol. 186 (12), 7110 (Jun 15).
Bosshart, H., Heinzelmann, M., 2011. Spontaneous decrease of CD14 cell sur-face expression in human peripheral blood monocytes ex vivo. J. Immu-nol. Methods 368 (1–2), 80 (May 31).
Castano, D., Garcia, L.F., Rojas, M., 2011. Increased frequency and cell death ofCD16(+) monocytes with Mycobacterium tuberculosis infection. Tuber-culosis (Edinb.) 91 (5), 348 (Sep).
Chen, Y., Rosenzweig, Z., 2002. Luminescent CdS quantum dots as selectiveion probes. Anal. Chem. 74 (19), 5132 (Oct 1).
Chen, G., Stievater, T.H., Batteh, E.T., Li, X., Steel, D.G., Gammon, D., et al.,2002. Biexciton quantum coherence in a single quantum dot. Phys.Rev. Lett. 88 (11), 117901 (Mar 18).
Cros, J., Cagnard, N., Woollard, K., Patey, N., Zhang, S.Y., Senechal, B., et al.,2010. Human CD14dimmonocytes patrol and sense nucleic acids and vi-ruses via TLR7 and TLR8 receptors. Immunity 33 (3), 375 (Sep 24).
de Boer, E.C., Bevers, R.F., Kurth, K.H., Schamhart, D.H., 1996. Double fluores-cent flow cytometric assessment of bacterial internalization and bindingby epithelial cells. Cytometry 25 (4), 381 (Dec 1).
Dorhoi, A., Reece, S.T., Kaufmann, S.H., 2011. For better or for worse: the im-mune response against Mycobacterium tuberculosis balances pathologyand protection. Immunol. Rev. 240 (1), 235 (Mar).
Eum, S.Y., Kong, J.H., Hong, M.S., Lee, Y.J., Kim, J.H., Hwang, S.H., et al., 2010.Neutrophils are the predominant infected phagocytic cells in the air-ways of patients with active pulmonary TB. Chest 137 (1), 122 (Jan).
Flynn, J.L., Chan, J., 2003. Immune evasion by Mycobacterium tuberculosis:living with the enemy. Curr. Opin. Immunol. 15 (4), 450 (Aug).
Fung, E., Esposito, L., Todd, J.A., Wicker, L.S., 2010. Multiplexed immunophe-notyping of human antigen-presenting cells in whole blood by poly-chromatic flow cytometry. Nat. Protoc. 5 (2), 357.
Gille, C., Leiber, A., Mundle, I., Spring, B., Abele, H., Spellerberg, B., et al., 2009.Phagocytosis and postphagocytic reaction of cord blood and adult bloodmonocyte after infectionwith green fluorescent protein-labeled Escherichiacoli and group B Streptococci. Cytometry B Clin. Cytom. 76 (4), 271 (Jul).
Gray-Owen, S.D., Blumberg, R.S., 2006. CEACAM1: contact-dependent con-trol of immunity. Nat. Rev. Immunol. 6 (6), 433 (Jun).
Humphreys, I.R., Stewart, G.R., Turner, D.J., Patel, J., Karamanou, D., Snelgrove, R.J.,et al., 2006. A role for dendritic cells in the dissemination of mycobacterialinfection. Microbes Infect. 8 (5), 1339 (Apr).
Ida, J.A., Shrestha, N., Desai, S., Pahwa, S., Hanekom, W.A., Haslett, P.A., 2006.A whole blood assay to assess peripheral blood dendritic cell function inresponse to Toll-like receptor stimulation. J. Immunol. Methods 310(1–2), 86 (Mar 20).
Jansen, K., Blimkie, D., Furlong, J., Hajjar, A., Rein-Weston, A., Crabtree, J., etal., 2008. Polychromatic flow cytometric high-throughput assay to ana-lyze the innate immune response to Toll-like receptor stimulation. J.Immunol. Methods 336 (2), 183 (Jul 31).
Kagina, B.M., Abel, B., Bowmaker, M., Scriba, T.J., Gelderbloem, S., Smit, E., etal., 2009. Delaying BCG vaccination from birth to 10 weeks of age mayresult in an enhanced memory CD4 T cell response. Vaccine 27 (40),5488 (Sep 4).
Kapsenberg, M.L., 2003. Dendritic-cell control of pathogen-driven T-cell po-larization. Nat. Rev. Immunol. 3 (12), 984 (Dec).
Kollmann, T.R., Crabtree, J., Rein-Weston, A., Blimkie, D., Thommai, F., Wang,X.Y., et al., 2009. Neonatal innate TLR-mediated responses are distinctfrom those of adults. J. Immunol. 183 (11), 7150 (Dec 1).
Lin, S.M., Frevert, C.W., Kajikawa, O., Wurfel, M.M., Ballman, K., Mongovin, S.,et al., 2004. Differential regulation of membrane CD14 expression andendotoxin-tolerance in alveolar macrophages. Am. J. Respir. Cell Mol.Biol. 31 (2), 162 (Aug).
Mazzoni, A., Segal, D.M., 2004. Controlling the Toll road to dendritic cell po-larization. J. Leukoc. Biol. 75 (5), 721 (May).
Meallet-Renault, R., Herault, A., Vachon, J.J., Pansu, R.B., Amigoni-Gerbier, S.,Larpent, C., 2006. Fluorescent nanoparticles as selective Cu(II) sensors.Photochem. Photobiol. Sci. 5 (3), 300 (Mar).
Mellman, I., Steinman, R.M., 2001. Dendritic cells: specialized and regulatedantigen processing machines. Cell 106 (3), 255 (Aug 10).
Mendelson, M., Hanekom, W.A., Ntutela, S., Vogt, M., Steyn, L., Maartens, G., etal., 2006. Quantitative and functional differences between peripheralblood myeloid dendritic cells from patients with pleural and parenchymallung tuberculosis. Clin. Vaccine Immunol. 13 (12), 1299 (Dec).
Mollen, K.P., Gribar, S.C., Anand, R.J., Kaczorowski, D.J., Kohler, J.W., Branca,M.F., et al., 2008. Increased expression and internalization of the endo-toxin coreceptor CD14 in enterocytes occur as an early event in the de-velopment of experimental necrotizing enterocolitis. J. Pediatr. Surg. 43(6), 1175 (Jun).
Pecora, N.D., Fulton, S.A., Reba, S.M., Drage, M.G., Simmons, D.P., Urankar-Nagy, N.J., et al., 2009. Mycobacterium bovis BCG decreases MHC-II ex-pression in vivo on murine lung macrophages and dendritic cells duringaerosol infection. Cell. Immunol. 254 (2), 94.
Poussin, C., Foti, M., Carpentier, J.L., Pugin, J., 1998. CD14-dependent endo-toxin internalization via a macropinocytic pathway. J. Biol. Chem. 273(32), 20285 (Aug 7).
Reed, M.B., Domenech, P., Manca, C., Su, H., Barczak, A.K., Kreiswirth, B.N., etal., 2004. A glycolipid of hypervirulent tuberculosis strains that inhibitsthe innate immune response. Nature 431 (7004), 84 (Sep 2).
Roederer, M., Nozzi, J.L., Nason, M.C., 2011. SPICE: exploration and analysis ofpost-cytometric complex multivariate datasets. Cytometry A 79 (2), 167(Feb).
Russell, D.G., 2011. Mycobacterium tuberculosis and the intimate discourseof a chronic infection. Immunol. Rev. 240 (1), 252 (Mar).
Shams, H., Wizel, B., Lakey, D.L., Samten, B., Vankayalapati, R., Valdivia, R.H.,et al., 2003. The CD14 receptor does not mediate entry of Mycobacteri-um tuberculosis into human mononuclear phagocytes. FEMS Immunol.Med. Microbiol. 36 (1–2), 63 (May 15).
Silva, M.T., 2009. When two is better than one: macrophages and neutro-phils work in concert in innate immunity as complementary and coop-erative partners of a myeloid phagocyte system. J. Leukoc. Biol. 87 (1),93 (Oct 7 22).
Soares, A., Govender, L., Hughes, J., Mavakla, W., de Kock, M., Barnard, C., etal., 2010. Novel application of Ki67 to quantify antigen-specific in vitrolymphoproliferation. J. Immunol. Methods 362 (1–2), 43 (Oct 31).
Takahashi, H.K., Morichika, T., Iwagaki, H., Tamura, R., Kubo, S., Yoshino, T., etal., 2003. Histamine downregulates CD14 expression via H2 receptors onhuman monocytes. Clin. Immunol. 108 (3), 274 (Sep).
Vergne, I., Daffe, M., 1998. Interaction of mycobacterial glycolipids with hostcells. Front. Biosci. 3, d865 (Aug 5).
Wang, K., Nishimoto, K.P., Mehta, R.S., Nelson, E.L., 2006. An alternative flowcytometry strategy for peripheral blood dendritic cell enumeration inthe setting of repetitive GM-CSF dosing. J. Transl. Med. 4, 18.
Wang, J.C., Kobie, J.J., Zhang, L., Cochran, M., Mosmann, T.R., Ritchlin, C.T., etal., 2009. An 11-color flow cytometric assay for identifying, phenotyping,and assessing endocytic ability of peripheral blood dendritic cell subsetsin a single platform. J. Immunol. Methods 341 (1–2), 106 (Feb 28).
Webster, S.J., Daigneault, M., Bewley, M.A., Preston, J.A., Marriott, H.M.,Walmsley, S.R., et al., 2010. Distinct cell death programs in monocytesregulate innate responses following challenge with common causes ofinvasive bacterial disease. J. Immunol. 185 (5), 2968 (Sep 1).
Zarkowsky, D., Lamoreaux, L., Chattopadhyay, P., Koup, R.A., Perfetto, S.P.,Roederer, M., 2011. Heavy metal contaminants can eliminate quantumdot fluorescence. Cytometry A 79 (1), 84 (Jan).