journal of financial stability - becker friedman institute | · journal of financial stability 9...
TRANSCRIPT

A
Da
b
c
a
ARRAA
JGGGGG
KSCS
1
dlsfohgMUbfit
T
(
tf
1d
Journal of Financial Stability 9 (2013) 105– 116
Contents lists available at SciVerse ScienceDirect
Journal of Financial Stability
journal homepage: www.elsevier.com/locate/jfstabil
simple indicator of systemic risk
ilip K. Patroa,∗, Min Qib, Xian Sunc
Market Risk Analysis Division, Office of the Comptroller of the Currency, United StatesCredit Risk Analysis Division, Office of the Comptroller of the Currency, United StatesCarey Business School, Johns Hopkins University, United States
r t i c l e i n f o
rticle history:eceived 15 December 2010eceived in revised form 13 March 2012ccepted 16 March 2012vailable online 26 March 2012
EL classification:011018
a b s t r a c t
We examine the relevance and effectiveness of stock return correlations among financial institutions as anindicator of systemic risk. By analyzing the trends and fluctuations of daily stock return correlations anddefault correlations among the 22 largest bank holding companies and investment banks from 1988 to2008, we find that daily stock return correlation is a simple, robust, forward-looking, and timely systemicrisk indicator. There is an increasing trend in stock return correlation among banks, whereas there is noobvious correlation trend among non-banks. We also disaggregate the stock returns into systematic andidiosyncratic components and find that the correlation increases are largely driven by the increases incorrelations between banks’ idiosyncratic risks, which give rise to increasing systemic risk. Correlationspikes tend to predict or coincide with significant economic or market events, especially during the
2128
eywords:ystemic riskorrelation
2007–2008 financial crisis. Furthermore, we show that stock return correlations offer a perspective onthe level of systemic risk in the financial sector that is not already captured by default correlations. Stockreturn correlations are not subject to data limitations or model specification errors that other potentialsystemic risk measures may face. Therefore, we recommend that regulators and businesses monitor dailystock return correlations among those large and highly leveraged financial institutions to track the level
dtaa
ceeFwta
tock returns of systemic risk.
. Introduction
The 2008 financial crisis, which was triggered by large write-owns of bank assets related to subprime mortgages, has been
abeled as the most serious financial crisis since the Great Depres-ion. One distinguishing characteristic of this crisis has been theailure or distress of several large banks across the globe. Somef the large U.S. banks that were affected, and in many cases,ad to be rescued by the government included Bear Stearns, Citi-roup, Lehman Brothers, Merrill Lynch, Wachovia, and Washingtonutual. Many overseas banks, such as BNP Paribas, IKB, RBS, andBS were also severely affected by this crisis.1 This effect on
anks, in turn, resulted in a severe credit and liquidity crisis in thenancial markets. This type of risk, wherein the entire financial sys-em, including several markets and institutions is simultaneously∗ Corresponding author at: 250 E Street SW, Washington, DC 20219, United States.el.: +1 202 927 7730; fax: +1 301 433 8433.
E-mail addresses: [email protected] (D.K. Patro), [email protected]. Qi), [email protected] (X. Sun).
1 Clearly, non-bank financial firms also played major roles in the crisis. Some ofhese firms include Ambac, AIG, Fannie Mae, Freddie Mac, and MBIA; however, ourocus in this paper is on banks.
btpsFoseAoas
572-3089/$ – see front matter. Published by Elsevier B.V.oi:10.1016/j.jfs.2012.03.002
Published by Elsevier B.V.
istressed, is generally described as systemic risk. If realized, sys-emic risk impacts not only financial markets and institutions, butlso the real economy as a whole due to decreases in capital supplynd increases in capital costs.
Many governments and monetary agencies have expressed con-erns about the recent financial crisis and its potential systemicffects and are calling for better management of systemic risk. Forxample, the Basel Committee on Bank Supervision (BCBS) and theinancial Stability Board (FSB) are considering policy options to dealith systemically important firms; similarly the Dodd-Frank Act in
he U.S. has created a Financial Stability Oversight Council (FSOC)nd will create an Office of Financial Research (OFR). However,efore rushing to policy changes, such as requiring financial insti-utions to higher capital or liquidity requirements, or regulatingrime brokers (King and Maier, 2009), it is essential to better under-tand systemic risk and how it can be measured and monitored.or example, in testimony before the House Oversight Committeef the U.S. Congress, Lo (2008) stated that a formal definition ofystemic risk is a starting point for regulatory reform, wherein sev-ral quantitative measures of systemic risk should be monitored.
charya (2009) models systemic risk as the correlation of returnsn bank assets. Recently, Caruana (2010) examines systemic risk asnegative externality in the cross-sectional and the time dimen-ions, and discusses financial regulatory policies designed to reduce

1 nancia
ep
aptcaip(fijcp
(brtsazasfidwahSasstrl
sttthlut
st(gtpteogs
nd
hdttocoplc
stumdidrdyclc
2
tAosalasn1
dibsagcltand exposure of a systemic failure. It is important to distinguishsystemic risk from a systemic event and from systemic failure. Sys-temic risk is not systemic failure, even when such a risk is high.
3 The term default correlation connotes different things in different contexts.Following Jarrow and van Deventer (2005), we calculate default correlations fromthe time-series of default probabilities provided by the various default models ofKamakura.
4 These results are available upon request.5
06 D.K. Patro et al. / Journal of Fi
xternalities along each dimension, the role of monetary and fiscalolicy, and the national and international policy coordination.
The main contribution of this paper is to analyze the relevancend effectiveness of large banks’ stock return correlations as a sim-le indicator of systemic risk. Correlation is one of several measureshat have been proposed by Lo (2008) and Acharya (2009) as indi-ators of systemic risk. Clearly, high correlations among banks are
necessary condition for systemic failures because a single events unlikely to cause broad-based dislocation over a relatively shorteriod of time if correlations are low. For example, Das and Uppal2004) study the effect on portfolio choice of systemic risk. Theynd that returns on international equities are characterized by
umps that occur at the same time across countries, implying thatonditional correlations between equity returns are higher in theeriods with higher systemic risk.
In this analysis, we exclusively select bank holding companiesBHCs) and investment banks with total assets in excess of $100illion as of the last quarter of 2006 and examine their daily stocketurn correlations. The reason to include the large banks is becausehey are highly leveraged. Therefore, the correlations among themhould be an economically significant indicator. These correlationsre estimated for quarterly, yearly, and other sub-period hori-ons from 1988 to 2008. First, we observe that the average meannd median stock return correlations among these 22 banks havehown an upward trend and have tripled from 1988 to 2008. Thesendings support the recommendation of Acharya (2009) that pru-ential regulation should also consider the correlated risk of banksith other banks. On the other hand, stock return correlations
mong non-bank firms in the Dow Jones Industrial Average (DJIA)ave only increased by approximately 25% over the same period.econd, several correlation spikes have been observed over theforementioned 21-year period. These spikes are associated withignificant economic events, such as the 1998 Russian financial cri-is that triggered the collapse of Long Term Capital Management,he 2001 recession, and the 2007 subprime crisis that triggered theecent financial crisis.2 Interestingly, non-banks also show higherevels of stock return correlations around these times.
We also examine if the increase in correlations are driven byystematic risk or idiosyncratic risk by using the Fama-Frenchhree-factor model and a four-factor model which includes thehree factors of the Fama-French model and a “bank” industry fac-or. We find that although on average banks’ idiosyncratic risksave been decreasing, there is significant increase in the corre-
ations of banks’ idiosyncratic returns suggesting that banks arendertaking more correlated investments, which in turn gives riseo increasing systemic risk.
Our empirical findings on the trend of the correlations of banks’ystematic returns and idiosyncratic returns are consistent withhe systemic risk-shifting incentive of banks suggested by Acharya2009), who argues that banks prefer correlated investments whichive rise to an inefficiently high correlation of asset returns in ordero survive together, or fail together. Traditional bank regulatoryractices are based only on a bank’s own risk, which are likelyo fail to detect aggregate risk-shifting behavior. We offer clearmpirical evidence that the use of correlations of stock returns canffer meaningful insights to banks’ individual risk as well as aggre-ate risk, and thus should be considered in macro-prudential bankupervision.
Another contribution of this paper is to investigate an alter-ative correlation measure, namely, default correlations based onefault probabilities produced by reduced-form, structural, and
2 See Rigobon (2003) for a complete list of dates with large market moves.
nai(fisop
l Stability 9 (2013) 105– 116
ybrid credit risk models.3 Mixed results can be observed fromefault correlations for the purpose of monitoring systemic risk. Ashe subprime crisis began to unfold in 2007, the default correla-ions produced by almost all of the credit risk models covered inur study did not increase, and in fact, decreased. Although defaultorrelations spiked in the first quarter of 2008, models relyingn default correlation movements would be reactive rather thanroactive in managing systemic risk. Furthermore, default corre-
ations significantly vary across different default methods. Defaultorrelation results are not included due to space limitations.4
In sum, our objective is to examine if a “simple” indicator mayerve the purpose of monitoring systemic risk. We contribute tohe literature by pointing out that stock return correlations are aseful indicator of systemic risk. The pattern of correlation move-ents, such as spikes, can be used with other measurements to
etermine the likelihood of systemic failure. The rest of the papers organized as follows. In Section 2, we review the literature andiscuss the arguments that support the use of stock return cor-elations as an indicator of systemic risk. Section 3 describes theata collected in this study and the methodology used in the anal-sis, while Section 4 discusses the empirical results on stock returnorrelations and default correlations. Section 5 presents the corre-ations of systematic returns and idiosyncratic returns. Section 6oncludes.
. Literature review and supporting arguments
Systemic risk was first investigated in the early 1990s aroundhe passage of the Federal Deposit Insurance Corp. Improvementct of 1991 (FDICIA). Since this time, systemic risk has been vig-rously investigated and, in particular, has been the focus of manytudies since the beginning of the recent financial crisis. De Bandtnd Hartmann (2000) provide a very comprehensive survey of theiterature that addresses systemic risk. One strand of literature hasttempted to define systemic risk. As new literature emerges, thereeems to be more disagreement than consensus regarding the defi-ition of systemic risk (Bartholomew and Whalen, 1995; Goldstein,995; Kaufman, 1995).
We believe the following definition of systemic risk shouldirect the development of systemic risk measures: systemic risk
s the likelihood of experiencing a systemic failure, a broad-basedreakdown of the financial system that is triggered by a strongystemic event (e.g., a financial institution failure), which severelynd negatively impacts the financial markets and the economy ineneral.5 This definition also relates systemic risk to how credit riskan be generally measured using the probability of default (PD),oss given default (LGD), and exposure at default (EAD). In this con-ext, systemic risk can be measured by the probability, severity,
Our measure aims to indicate systemic risk for financial markets as a whole andot measure the “systemic” importance of an individual bank. Therefore, we do notddress the issue of which banks may be more “systemic” than others – for suchssues, we refer the reader to papers by Adrian and Brunnermeier (2009), Thomson2009), and the IMF (2009). Others who similarly try to estimate systemic risk for thenancial system include Bartram et al. (2007). Some papers focus on the financialystem as a whole and try to capture financial sector linkages, whereas others focusn the institutional level. Clearly, the former has implications for the latter. Ouraper belongs to the former group.

nancia
Wtgcnfi
clshoK
slfcmtawsdieA(a
ubohbpciistaotcat
totbtCeltttro
pdb
eabcdascttTa
rsspsap
aaaeoihstieimuttoMccrrgff
edet(ttdTaH
ca
D.K. Patro et al. / Journal of Fi
hether a systemic failure happens or not depends on whetherhere is a sufficiently strong triggering event and whether that trig-ering event occurs in a high enough risk environment as to likelyause systemic failure. Systemic risk cannot be completely elimi-ated, nor is there a desire or need to. It is simply a by-product ofnancial innovation, as are other types of risk (Lo, 2008).
Another strand of literature investigates what may causehanges in the level of systemic risk, for example, changes in theevel of inter-bank lending (Rochet and Tirole, 1996), financialystem consolidation (De Nicolo and Kwast, 2002), VaR-inducederding behavior in bank trading patterns (Jorion, 2006), and thepaque and largely unregulated hedge funds (Chan et al., 2006;ambhu et al., 2007).
A third strand of literature aims to develop systemic risk mea-ures for monitoring purposes. We intend to advance this strand ofiterature with our current study. Systemic risk can be measuredor markets as a whole or at the firm level to identify systemi-ally important firms. For both markets and firms, these measuresay be direct, using analytical models, or indirect, using indica-
ors that are considered to relate to systemic risk. An example of direct measure for markets is Segoviano and Goodhart (2009),ho estimate a joint probability of distress, as well as a banking
tability index for the financial sector. Similarly, an example of airect model-based measure of the systemic importance of a firm
s the CoVaR measure of Adrian and Brunnermeier (2009). Otherxamples of model-based measures include Acharya et al. (2011),llenspach and Monnin (2006), Aspachs et al. (2007), Avesani et al.
2006), Goodhart et al. (2005, 2006), Lehar (2005), Zambrana (2010)nd Zhang et al. (2009).
On the other hand, the difficulties in measuring systemic risksing models are well documented, and models have frequentlyeen observed to produce results that are counter to priors. Sec-ndly, we do not have an exogenous measure of systemic risk andave to rely on expert judgment and priors to validate the model-ased measures. Therefore, indicator-based approaches have beenroposed as a means to indirectly measure systemic risk using indi-ators that are believed to be related to systemic risk or systemicmportance. For example, the IMF/BIS/FSB (2009) proposed usingndicators for size, interconnectedness, and substitutability to mea-ure the systemic importance of a firm. Thomson (2009) proposedo use size and the four C’s (contagion, concentration, correlation,nd conditions) as criteria to determine the systemic importancef a firm. Similarly, our paper proposes that stock return correla-ion is a useful indicator of systemic risk for markets as a whole. Itan also be argued that, while holding the firm level PDs constant,
higher correlation implies a higher joint PD for the system, suchhat correlation can serve as a useful indicator of systemic risk.
There is also a considerable amount of literature that has inves-igated bank contagion, which is often discussed in the contextf systemic risk; however, most of the empirical investigationsherein have been event studies, in which the authors examineanks’ reactions (such as risk premiums or stock price reactions) orheir timing of reaction to bad news (e.g. Aharony and Swary, 1983;arron, 1982; Slovin et al., 1999). These studies provide importantvidence of market reactions to various systemic events, but haveittle implication for an effective measure of systemic risk becausehey only show the systemic risk around such events. We believehat measuring and examining the correlation of financial institu-ion stock returns over time can serve as an indicator of systemicisk, not only around the time of a triggering event, but also on ann-going basis as the level of systemic risk evolves.
De Nicolo and Kwast (2002) have similarly examined stockrice correlations and have found a significant upward trend in theegree of inter-dependency among their sample of large complexanking organizations from 1988 to 1999. In addition, they found
mowa
l Stability 9 (2013) 105– 116 107
vidence that this trend might be caused by financial consolidationctivities among these banking organizations. Our paper is differentecause we show differences in correlation patterns among finan-ial institutions and non-financial institutions and also examineefault correlations. Most importantly, we study the relationshipsmong correlation movements, market or triggering events andystemic failure, and the relevance and effectiveness of stock returnorrelations as an indicator of systemic risk. Finally, our analysis isimely since it covers the recent subprime crisis which is consideredo be the most severe financial crisis since the great depression.herefore our analysis and findings complements and extends thenalysis done by previous researchers.
We focus on stock return correlations as an indicator of systemicisk because of their natural advantages. First, unlike most balanceheet or company financial variables, the information reflected intock prices is typically viewed as forward looking. Because therimary goal of managing systemic risk is to monitor the level ofystemic risk on an on-going basis so as to prevent systemic failuresnd the associated costs, forward-looking indicators, such as stockrices, offer relevant information.
Second, correlation in stock risk premia is shown to explain vari-tions in asset returns better than fundamental variables (Ammernd Mei, 1996). Indeed, stock prices reflect investors’ perceptionsbout a firm’s future profitability, which should reflect the differ-nce between the expected return on total assets and the costf debt. Expectations on asset returns have played a crucial rolen the recent financial crisis. As the default and delinquent ratesave soared among sub-prime mortgages, the values of loans andecurities backed by such collaterals have been significantly writ-en down. The substantial write-down of these asset values hasmpacted both the net incomes and capital levels of banks. Inad-quate capital levels have sometimes led to regulatory actions,ncluding the closure of banks or mergers and acquisitions arrange-
ents, which are a less dramatic form of bank failures. Investorssually react to their perception of a bank’s capital adequacy inhe future, which may happen long before a massive write-downakes place. For example, Wachovia’s stock prices plummeted 27%n September 26, 2008, the day after the seizure of Washingtonutual, as investors worried that the bank may not have enough
apital to weather the credit crunch. In fast moving and efficientapital markets, expectations and new information are quicklyeflected in current security prices. Furthermore, because creditisk is still a major risk that banks need to manage, the conta-ion of credit risk on the banks’ asset side should also be watchedor potential systemic failure. Stock return correlations serve thisunction well.
Third, extant literature shows that stock returns can be anffective indicator of default risk. In fact, one popular approach toeriving default correlation among firms’ uses the correlation fromquity market data as an input (Hull et al., 2004). The logic behindhis approach is that equity is a call option on underlying firm assetsMerton, 1974), and thus, the correlation of equity returns reflectshe correlation of firms’ values. Not surprisingly, equity volatili-ies have been shown to significantly correlate with bond ratingowngrades/reviews (Di Cesare, 2006), bond yields (Campbell andaksler, 2003), spread movements of credit default swaps (Nordennd Weber, 2009), and bank fragility (Bongini et al., 2002; Ito andarada, 2004).
Finally, in comparison to the other potential systemic risk indi-ators proposed in the literature, stock return correlations have thedditional advantage of being simple, robust, and not subject to
odel errors or data limitations. Unlike bond yields, CDS spreads,r other market indicators, stock prices have the advantage of beingidely traded among market participants over a long history and
re easily available on almost every business day for all publicly
1 nancia
tuwala
3
3
($pomSvpfiMMiNraBMib
traycuhDcrrttt
mf2ylaco
tifn
tfl
abltqgwtnst
t1a5dlps2tbnavi
3
stmassmSt
rmatc
4
4
08 D.K. Patro et al. / Journal of Fi
raded banks.6 We propose a way in which stock prices may besed along with other systemic risk measures, such as the net-ork approach, the co-risk model, the distress dependence matrix
nd the default intensity model used in IMF (2009), to help regu-ators and businesses monitor the level of systemic risk and takeppropriate actions in a timely fashion.
. Data and methodology
.1. Sample selection
Because our interest is in large U.S. bank holding companiesBHCs), all bank holding companies with total assets in excess of100 billion as of the last quarter of 2006 are included in our sam-le. We also selected investment banks with total assets in excessf $100 billion as of 2006, which included the five largest invest-ent banks (Goldman Sachs, Morgan Stanley, Merrill Lynch, Bear
tearns, and Lehman Brothers) at that time. Because our primaryariable of interest is stock returns, we limit our sample to onlyublicly traded firms. This limitation resulted in a sample of 22rms. Two of the five former investment banks (Goldman Sachs andorgan Stanley) are now BHCs, Bear Stearns has merged with J.P.organ Chase, and Merrill Lynch has merged with Bank of Amer-
ca. Furthermore, there have been BHC mergers between PNC andational City, and Wells Fargo and Wachovia. For simplicity, we
efer to the sample of firms as banks. These 22 banks account for substantial portion of the banking assets in the U.S. The top fourHCs alone account for around two thirds of all banking assets.ore importantly, because these banks are the largest and most
nterconnected, they are most likely to be the source as well as theearer of the consequences of systemic risk.
Our sample begins in 1988, the year in which the Basel Commit-ee on Bank Supervision first published a set of minimum capitalequirements for banks (under what is now referred to as Basel I),nd ends in 2008. This time period is relatively long, including 21ears that cover several business cycles and periods of significanthanges in banking regulations, and is thus a sufficient period fors to examine how correlations have changed over time. We alsoave a control sample of non-bank firms that we selected from theow Jones Industrial Average to examine how correlations havehanged over time for non-bank firms. Our primary focus is on dailyeturns because they allow for the meaningful calculation of stocketurn correlations on a short horizon, an important property in theimely measurement of systemic risk. We also estimated correla-ions using weekly returns. Because the results are very similar tohose using daily returns, they are not reported.
Panel A of Table 1 presents the list of banks along with theean and standard deviations of annualized daily stock returns for
our five-year periods (1988–1992, 1993–1997, 1998–2002, and003–2007) and 2008.7 In comparison to shorter horizon, the five-ear periods contain a large sample of daily stock returns and areess likely to be biased by unique market or economic events, thus
llowing us to examine if unconditional correlations have trulyhanged over time; however, in order to ascertain the robustnessf our findings to different time period splits, we also run our6 Compared to stocks, credit derivative activities are highly concentrated amonghe largest bank holding companies and there are some signals of “insider trading”n the CDS market (see, for example, Acharya and Johnson, 2007). Furthermore, evenor the large bank holding companies, except for a few names, the CDS market isot very liquid.7 We did not intend to separately analyze 2008, although it happened to be one of
he most severe years in our sample. Separate analysis of 2008 is a natural leftoverrom the five-year period divisions, since our sample started in 1988. In fact, weater analyze the time period ranging from 2007 to 2008 using quarterly data.
irpsotPpst
l Stability 9 (2013) 105– 116
nalysis using alternate windows that are based on changes inanking regulation and/or economic cycles. Because the results are
argely similar, our discussions herein are based on the aforemen-ioned five-year window. We run our analysis year by year anduarter by quarter to capture correlation movements around trig-ering events. In order to further support our correlation analysis,e also estimate the correlation for the sample of firms in the DJIA
o determine if what we observe for banks can also be observed foron-bank firms. Panel B of Table 1 reports the mean returns andtandard deviations for the sample of non-bank firms currently inhe DJIA.
We can observe the following from Table 1. For many banks,he mean stock returns in periods 1 and 2 (1988–1992 and993–1997) are fairly stable, substantially decrease in periods 3nd 4 (1998–2002 and 2003–2007), and reach a bottom in period
(2008). For most banks, stock return volatility measured by stan-ard deviation is the lowest in 2003–2007, but jumps in 2008 to a
evel that is on average five times as high as the level observed in theeriod of 2003–2007. Of the 22 aforementioned banks, Wachoviahows the largest volatility jump, from 3.185 in the period of003–2007 to 31.630 in 2008 (9.9 times as high), and Capital Onehe smallest jump, from 5.067 to 14.230 (2.8 times as high). For non-anks, although 2008 also shows the lowest stock returns (mostlyegative) and the highest volatility, the volatility in 2008 is on aver-ge twice as high as that observed in 2003–2007, with a lowestolatility increase of 50% for McDonalds and a highest volatilityncrease of 230% for General Motors.
.2. Methodology
We use three correlation measures in our correlation analy-is. These include the usual parametric Pearson correlation andhe non-parametric Spearman and Kendall correlations. We esti-
ate correlations using three different correlation measures toscertain the robustness of our findings and ensure that our mea-ures are not biased by potential non-linear dependencies betweentock returns. Since the Pearson correlation is the most often usedeasure of correlation and our findings are robust based on the
pearman and Kendall correlations, we only report the tables forhe Pearson correlations due to space limitations.8
For each type of correlation, we first estimate the pair-wise cor-elations for all of the aforementioned 22 banks and then take theean and the median of these pair-wise correlations bank by bank
s well as across banks to obtain our inferences. A signed rankest is applied to test the null hypothesis that the mean or medianorrelations are equal in two time periods.
. Empirical results on correlations
.1. Trend in pair-wise correlations
In Table 2 , we report pair-wise Pearson correlations for annual-zed daily stock returns in each period and the p-values of a signedank test of the null hypothesis that the correlations in two adjacenteriods are equal. Panel A of the table presents the mean Pear-on correlations, Panel B shows the median Pearson correlationf each bank with the rest of the 21 banks, and Panel C presentshe mean and median Pearson correlations of each non-bank. Theearson correlations show a statistically significant increase from
eriod 1 to period 2 for all 18 banks that have non-missing Pear-on correlations, and from period 2 to period 3 for all 20 bankshat have non-missing mean Pearson correlations. From period 38 The results using the other two correlations are available upon request.

D.K. Patro et al. / Journal of Financial Stability 9 (2013) 105– 116 109
Table 1Descriptive statistics for annualized daily stock returns.
Mean Standard deviation
Period 11988–1992
Period 21993–1997
Period 31998–2002
Period 42003–2007
Period 52008
Period 11988–1992
Period 21993–1997
Period 31998–2002
Period 42003–2007
Period 52008
Panel A: mean and standard deviation for banksBB&T 0.206 0.287 0.110 0.004 0.326 5.112 3.612 4.867 3.089 12.840Bank of America 0.310 0.236 0.144 0.085 −0.483 5.231 3.826 6.359 2.680 16.190Bank of New York 0.261 0.362 0.086 0.188 −0.131 5.382 4.202 6.889 3.756 14.410Bear Stearns 0.292 0.326 0.190 0.108 −1.730 5.682 4.775 7.246 4.289 35.140Capital One – 0.475 0.303 0.131 0.039 – 5.985 9.566 5.067 14.230Citigroup 0.223 0.449 0.182 0.013 −0.772 5.118 5.139 6.993 3.273 18.910Countrywide 0.538 0.271 0.141 0.015 −0.650 7.913 5.704 6.576 6.623 20.300Fifth Third 0.305 0.292 0.180 −0.122 −0.380 3.692 3.342 5.666 3.597 18.170Goldman Sachs – – 0.119 0.258 −0.582 – – 7.648 4.023 12.840JPMorgan 0.259 0.282 0.072 0.157 0.098 5.907 4.223 7.571 3.507 13.640Lehman Brothers – 0.361 0.334 0.208 −4.510 – 5.567 9.307 4.594 31.630Merrill Lynch 0.285 0.390 0.166 0.101 −0.738 5.290 5.124 8.195 4.122 19.590MetLife – – 0.320 0.190 −0.056 – – 6.189 3.542 15.610Morgan Stanley 0.293 0.315 0.233 0.133 −0.281 4.265 4.900 8.682 4.435 22.480National City 0.182 0.261 0.062 −0.056 −0.737 3.683 3.478 5.065 3.569 25.570PNC 0.179 0.213 0.047 0.130 −0.003 4.591 3.945 5.648 3.038 10.820Regions 0.261 0.246 0.041 0.029 −0.244 3.566 3.053 5.096 3.186 19.950State Street 0.355 0.253 0.161 0.198 −0.397 4.616 4.480 6.601 4.037 13.840SunTrust 0.253 0.278 0.032 0.057 −0.230 4.394 3.381 5.028 3.078 14.880US Bank 0.158 0.337 0.062 0.131 0.047 4.839 3.413 6.964 2.857 9.822Wachovia 0.254 0.232 0.043 0.053 0.368 4.874 3.457 5.808 3.185 31.630Wells Fargo 0.333 0.316 0.123 0.084 0.417 4.600 4.004 5.348 2.790 13.430
Panel B: mean and standard deviations for non-banks3M 0.145 0.162 0.155 0.094 −0.277 3.166 3.337 4.937 2.957 5.753AT&T 0.229 0.205 0.047 0.147 −0.228 3.266 3.582 6.227 3.553 7.348Alcoa 0.158 0.190 0.167 0.149 −0.817 4.148 4.214 6.860 4.699 13.280Boeing 0.238 0.233 0.025 0.234 −0.585 4.333 4.028 6.502 3.695 7.761Caterpillar 0.028 0.315 0.098 0.275 −0.306 4.265 4.487 6.250 4.136 8.204Chevron 0.187 0.223 0.044 0.262 −0.066 3.486 3.319 4.520 3.255 8.968Coca-Cola 0.356 0.272 −0.017 0.102 −0.224 4.012 3.493 5.170 2.456 5.750Disney 0.253 0.208 −0.030 0.164 −0.205 4.095 3.917 6.892 3.790 7.983DuPont 0.171 0.245 0.029 0.054 −0.407 3.807 3.748 5.910 3.092 7.714GE 0.191 0.297 0.089 0.119 −0.626 3.627 3.266 5.852 2.802 8.979GM 0.115 0.199 0.051 0.014 −1.340 4.686 4.320 6.182 5.743 18.730HP 0.105 0.340 0.092 0.255 −0.204 5.729 5.486 8.743 4.672 7.495Home Dep. 0.637 0.161 0.133 0.079 0.058 5.165 4.500 7.451 3.684 8.508IBM −0.097 0.355 0.179 0.079 −0.141 3.590 4.973 6.588 2.967 5.813Intel 0.321 0.455 0.154 0.136 −0.361 6.434 5.836 9.322 4.614 8.518J&J 0.246 0.246 0.170 0.063 −0.026 3.804 3.967 4.667 2.408 4.806Kraft – – 0.191 0.006 −0.085 – – 4.094 3.118 5.042McDonald 0.206 0.165 −0.014 0.308 0.160 4.092 3.470 5.451 3.713 5.518Merck 0.233 0.243 0.092 0.080 −0.474 3.632 4.231 5.268 4.223 8.030Microsoft 0.463 0.418 0.201 0.111 −0.473 5.883 5.045 7.160 3.439 7.850
−0.0−0.1
tbavf0sPtm1ntbPa1
o
cmobs1hp
wdpFss
P&G 0.236 0.270 0.097 0.134
Pfizer 0.292 0.350 0.127 −0.009
o period 4, the signed rank test is significant for 14 out of 22anks, and from period 4 to 2008, for 13 out of 22 banks. Theverage mean Pearson correlations across all non-missing obser-ations increase from 0.2612 in period 1 to 0.3729 in period 2,rom 0.5514 in period 3 to 0.5884 in period 4, and eventually reach.6137 in 2008. Similar patterns can be observed for median Pear-on correlations among banks. On average, the mean and medianearson correlations more than doubled in 2008 in comparisono their levels in 1988–1992. In the extreme case of BB&T, the
ean and median Pearson correlations in 2008 are more than2 times higher than the levels observed in the first period. Foron-banks, there is a dramatic drop in correlations from period 1o period 2, followed by much slower correlation increases thananks over the rest of the periods. Although the mean and medianearson correlations reached their peaks in 2008, they are on
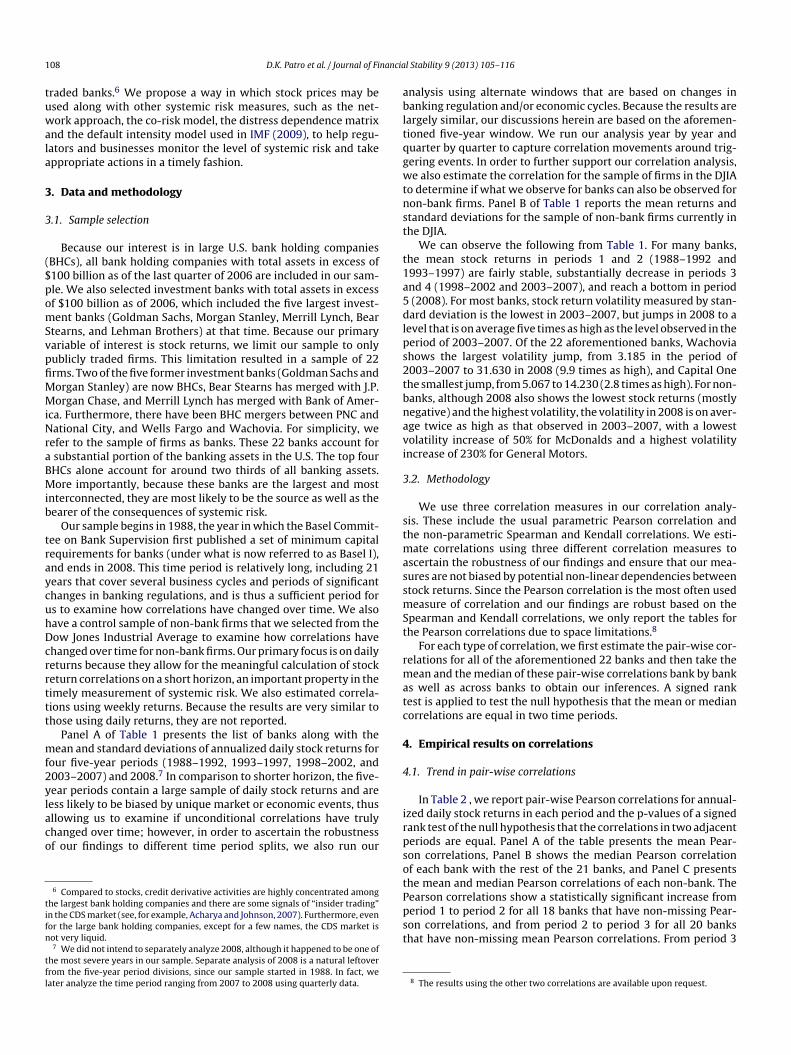
verage only 70% higher in 2008 in comparison to their levels in988–1992.The above correlation trending patterns over the five time peri-ds for banks and non-banks are illustrated in Fig. 1. Regardless of
tbit
88 3.428 3.544 5.583 2.268 4.95836 4.047 4.426 5.970 3.484 6.083
orrelation measure (Pearson, Kendall, or Spearman), the mean andedian correlations among banks can be observed to steadily rise
ver time, whereas the mean and median correlations among non-anks decrease from 1988 to 1992 and from 1993 to 1997 and thenteadily increase over time. Except for the Pearson correlations in988–1992 and 2008, the correlations among banks are generallyigher than the correlations among non-banks in the same timeeriods.
Fig. 2 plots, year by year, the average mean and median pair-ise Pearson and Kendall correlations calculated from annualizedaily stock returns for banks and non-banks over the entire sam-ling period of 1988–2008. A few observations can be made fromig. 2. First, mean and median correlations are very close for theame type of firm and are based on the same correlation mea-ure. Second, the average Pearson correlations are always higher
han the average Kendall correlations, and this pattern holds foroth banks and non-banks. Third, despite periods of fluctuations, anncreasing trend is obvious in correlations among banks, whereashere is no obvious trend in correlations among non-banks. This

110 D.K. Patro et al. / Journal of Financial Stability 9 (2013) 105– 116
Table 2Pair-wise Pearson correlations of daily stock returns.
Period 11988–1992
Period 21993–1997
Period 31998–2002
Period 42003–2007
Period 52008
p-Values1–2
p-Values2–3
p-Values3–4
p-Values4–5
Panel A: mean Pearson correlations and significance of period-to-period changes for banksBB&T 0.054 0.271 0.604 0.649 0.672 0.000 0.000 0.022 0.511Bank of America 0.324 0.443 0.599 0.608 0.723 0.000 0.000 0.560 0.001Bank of New York 0.324 0.446 0.580 0.559 0.654 0.000 0.000 0.236 0.001Bear Stearns 0.288 0.348 0.550 0.584 0.300 0.000 0.000 0.020 0.000Capital One – 0.283 0.481 0.493 0.681 – 0.000 0.336 0.000Citigroup 0.281 0.417 0.606 0.637 0.666 0.000 0.000 0.053 0.193Countrywide 0.216 0.308 0.443 0.425 0.517 0.000 0.000 0.113 0.000Fifth Third 0.217 0.318 0.543 0.549 0.629 0.000 0.000 0.714 0.002Goldman Sachs – – 0.518 0.610 0.614 – – 0.000 0.883JPMorgan 0.316 0.435 0.594 0.651 0.674 0.000 0.000 0.000 0.568Lehman Brothers – 0.296 0.548 0.616 0.557 – 0.000 0.000 0.012Merrill Lynch 0.321 0.429 0.556 0.630 0.685 0.000 0.000 0.000 0.084MetLife – – 0.364 0.519 0.534 – – 0.000 0.493Morgan Stanley 0.281 0.407 0.571 0.614 0.554 0.000 0.000 0.016 0.023National City 0.249 0.377 0.595 0.596 0.525 0.000 0.000 0.953 0.002PNC 0.286 0.399 0.604 0.595 0.635 0.000 0.000 0.565 0.213Regions 0.211 0.273 0.547 0.612 0.621 0.000 0.000 0.000 0.731State Street 0.272 0.317 0.576 0.511 0.618 0.000 0.000 0.000 0.000SunTrust 0.277 0.439 0.610 0.606 0.682 0.000 0.000 0.824 0.013US Bank 0.206 0.406 0.530 0.606 0.678 0.000 0.000 0.000 0.038Wachovia 0.285 0.426 0.567 0.637 0.598 0.000 0.000 0.000 0.135Wells Fargo 0.294 0.419 0.546 0.637 0.685 0.000 0.000 0.000 0.156
Average 0.261 0.373 0.551 0.588 0.614 – – – –
Panel B: median Pearson correlation and significance of period-to-period changes for banksBB&T 0.056 0.269 0.625 0.656 0.719 0.000 0.000 0.026 0.317Bank of America 0.335 0.473 0.595 0.601 0.760 0.000 0.000 0.352 0.001Bank of New York 0.335 0.473 0.606 0.573 0.682 0.000 0.000 0.226 0.000Bear Stearns 0.289 0.324 0.522 0.560 0.293 0.000 0.000 0.026 0.000Capital One – 0.279 0.491 0.494 0.720 – 0.000 0.579 0.000Citigroup 0.315 0.435 0.617 0.646 0.663 0.000 0.000 0.061 0.143Countrywide 0.219 0.318 0.448 0.429 0.518 0.000 0.000 0.240 0.000Fifth Third 0.227 0.328 0.563 0.568 0.683 0.000 0.000 0.511 0.001Goldman Sachs – – 0.467 0.589 0.631 – – 0.000 0.626JPMorgan 0.310 0.442 0.608 0.660 0.698 0.000 0.000 0.000 0.154Lehman Brothers – 0.282 0.504 0.595 0.535 – 0.000 0.000 0.012Merrill Lynch 0.347 0.432 0.505 0.609 0.709 0.000 0.000 0.000 0.039MetLife – – 0.370 0.531 0.564 – – 0.000 0.212Morgan Stanley 0.266 0.401 0.536 0.604 0.569 0.000 0.000 0.023 0.023National City 0.262 0.390 0.622 0.609 0.529 0.000 0.000 0.960 0.003PNC 0.278 0.432 0.645 0.595 0.646 0.000 0.000 0.490 0.154Regions 0.220 0.283 0.577 0.616 0.646 0.000 0.000 0.000 0.602State Street 0.289 0.322 0.577 0.514 0.652 0.000 0.000 0.000 0.000SunTrust 0.289 0.476 0.651 0.598 0.743 0.000 0.000 0.828 0.004US Bank 0.210 0.407 0.560 0.620 0.690 0.000 0.000 0.000 0.013Wachovia 0.293 0.432 0.586 0.639 0.617 0.000 0.000 0.000 0.212Wells Fargo 0.314 0.426 0.568 0.629 0.699 0.000 0.000 0.000 0.072
Average 0.270 0.381 0.557 0.588 0.635 – – – –
Mean Median
Period 11988–1992
Period 21993–1997
Period 31998–2002
Period 42003–2007
Period 52008
Period 11988–1992
Period 21993–1997
Period 31998–2002
Period 42003–2007
Period 52008
Panel C: mean and median Pearson correlations for non-banks3M 0.430 0.214 0.285 0.320 0.662 0.413 0.202 0.248 0.334 0.674AT&T 0.373 0.192 0.207 0.308 0.667 0.361 0.186 0.200 0.304 0.676Alcoa 0.328 0.180 0.262 0.336 0.629 0.330 0.166 0.236 0.329 0.636Boeing 0.357 0.212 0.237 0.306 0.614 0.358 0.202 0.221 0.300 0.627Caterpillar 0.315 0.212 0.281 0.323 0.645 0.306 0.206 0.236 0.328 0.636Chevron 0.293 0.204 0.184 0.274 0.658 0.278 0.187 0.183 0.269 0.663Coca-Cola 0.448 0.280 0.215 0.308 0.577 0.469 0.255 0.238 0.318 0.576Disney 0.370 0.223 0.244 0.348 0.716 0.378 0.212 0.246 0.359 0.726DuPont 0.403 0.248 0.282 0.375 0.691 0.393 0.235 0.243 0.373 0.693GE 0.477 0.316 0.363 0.416 0.580 0.467 0.312 0.377 0.427 0.585GM 0.356 0.195 0.283 0.251 0.454 0.345 0.188 0.304 0.249 0.471HP 0.328 0.235 0.223 0.292 0.593 0.319 0.206 0.202 0.289 0.571Home Dep. 0.387 0.226 0.291 0.341 0.608 0.381 0.222 0.307 0.330 0.626IBM 0.358 0.216 0.249 0.349 0.658 0.361 0.197 0.221 0.329 0.676Intel 0.336 0.225 0.254 0.336 0.641 0.324 0.192 0.231 0.335 0.636J&J 0.432 0.258 0.242 0.278 0.658 0.408 0.222 0.214 0.282 0.660Kraft – – 0.147 0.222 0.622 – – 0.131 0.227 0.612
D.K. Patro et al. / Journal of Financial Stability 9 (2013) 105– 116 111
Table 2 (Continued)
Mean Median
Period 11988–1992
Period 21993–1997
Period 31998–2002
Period 42003–2007
Period 52008
Period 11988–1992
Period 21993–1997
Period 31998–2002
Period 42003–2007
Period 52008
McDonald 0.360 0.225 0.207 0.261 0.597 0.348 0.207 0.201 0.264 0.605Merck 0.426 0.250 0.252 0.234 0.563 0.410 0.207 0.228 0.215 0.551Microsoft 0.339 0.245 0.258 0.347 0.660 0.340 0.226 0.223 0.328 0.672P&G 0.413 0.291 0.194 0.306 0.665 0.415 0.277 0.208 0.303 0.671Pfizer 0.351 0.246 0.249 0.307 0.691 0.340 0.195 0.214 0.299 0.695
Average 0.375 0.233 0.246 0.311 0.629 0.369 0.214 0.232 0.309 0.634
Note: Panel A reports the mean of each bank’s daily stock returns correlation with the other banks for that time period. p-Values from a signed rank test comparing thecorrelations between two consecutive periods are reported, 1–2 stands for period 1 and period 2, 2–3 for period 2 and period 3, and so on.P er banb 2, 2–3P with t
rfaPbdcafi
bb1ml
pe2tmococia
FAt
anel B reports the median of each bank’s daily stock returns correlation with the othetween two consecutive periods are reported, 1–2 stands for period 1 and period
anel C reports the mean and median of each firm’s daily stock returns correlation
esult confirms the trending pattern for banks and the lack thereofor non-banks that we observed in Tables 2 and 3. Fourth, the aver-ge correlation among banks decreases from 2007 to 2008 based onearson correlations and increases slower than among non-banksased on Kendal correlations. This might be due to the unprece-ented market interventions in 2008, such as the TARP Program,apital injection, emergency lending from the Fed, government-ssisted mergers and acquisitions, and short-selling restriction onnancial stocks.
Finally, there appears to be a regime shift in 1995 for bothanks and non-banks. On the one hand, the correlations among
anks stay relatively low and are not very volatile from 1988 to995, but then later increase to much higher levels and becomeore volatile. Furthermore, according to Tables 2 and 3, the corre-ations among banks are not that qualitatively different between
iott
Panel A. Average M
0.0
0.1
0.2
0.3
0.4
0.5
0.6
0.7
0.8
AvgMnPearson
(Banks)
AvgMnPearson
(Non-banks)
AvgMnKendall
(Banks)
A
Panel B.Average Me
0.0
0.1
0.2
0.3
0.4
0.5
0.6
0.7
0.8
AvgMedPearson(Banks)
AvgMedPearson(Non-banks)
AvgMedKendall(Banks)
Av(
1988-1992 1993-1997 1998-2
ig. 1. Average mean and median pair-wise Pearson, Kendall, and Spearman correlationvgMnPearson is the average of the pairwise Pearson correlations, AvgMnKendall is the a
he pairwise Spearman correlations. Similarly, AvgMedPearson, AvgMedKendall and AvgM
ks for that time period. p-Values from a signed rank test comparing the correlations for period 2 and period 3, and so on.he other firms for that time period.
eriods 1 and 2, and periods 3 and 4; however, these correlationsxperience material jumps from period 2 to period 3 (and also in008, which may be caused by different reasons in comparison tohe jump observed from period 2 to period 3). This regime change
ay partly be explained by the repeal of the Glass-Steagall Actn November 12, 1999. Provisions that prohibit a bank holdingompany from owning other financial companies were repealedn that day by the Gramm-Leach-Bliley Act. This repeal enabledommercial lenders, such as Citigroup, to underwrite and tradenstruments, such as mortgage-backed securities and collater-lized debt obligations, and to establish so-called structured
nvestment vehicles (or SIVs), that bought those securities. On thether hand, the correlations among non-banks follow a decreasingrend from 1988 to 1995, and then show an increasing trendhereafter.ean Correlations
vgMnKendall
(Non-banks)
AvgMnSpearman
(Banks)
AvgMnSpearman
(Non-banks)
dian Co rrelations
gMedKendallNon-banks)
AvgMedSpearman(Banks)
AvgMedSpearman(Non-banks)
002 2003-2007 2008
s of daily stock returns (banks and non-banks) in sub-periods, 1988–2008. Note:verage of the pairwise Kendall correlations and AvgMnSpearman is the average of
edSpearman are the medians of the respective pairwise correlations.
112 D.K. Patro et al. / Journal of Financial Stability 9 (2013) 105– 116
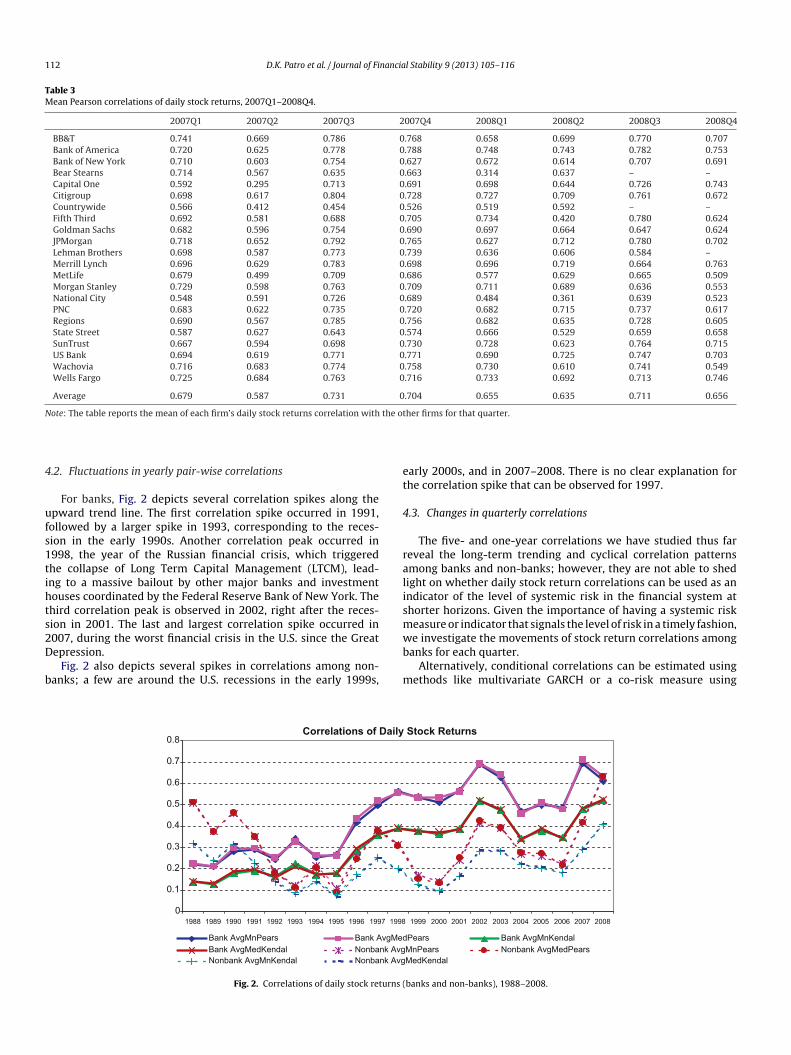
Table 3Mean Pearson correlations of daily stock returns, 2007Q1–2008Q4.
2007Q1 2007Q2 2007Q3 2007Q4 2008Q1 2008Q2 2008Q3 2008Q4
BB&T 0.741 0.669 0.786 0.768 0.658 0.699 0.770 0.707Bank of America 0.720 0.625 0.778 0.788 0.748 0.743 0.782 0.753Bank of New York 0.710 0.603 0.754 0.627 0.672 0.614 0.707 0.691Bear Stearns 0.714 0.567 0.635 0.663 0.314 0.637 – –Capital One 0.592 0.295 0.713 0.691 0.698 0.644 0.726 0.743Citigroup 0.698 0.617 0.804 0.728 0.727 0.709 0.761 0.672Countrywide 0.566 0.412 0.454 0.526 0.519 0.592 – –Fifth Third 0.692 0.581 0.688 0.705 0.734 0.420 0.780 0.624Goldman Sachs 0.682 0.596 0.754 0.690 0.697 0.664 0.647 0.624JPMorgan 0.718 0.652 0.792 0.765 0.627 0.712 0.780 0.702Lehman Brothers 0.698 0.587 0.773 0.739 0.636 0.606 0.584 –Merrill Lynch 0.696 0.629 0.783 0.698 0.696 0.719 0.664 0.763MetLife 0.679 0.499 0.709 0.686 0.577 0.629 0.665 0.509Morgan Stanley 0.729 0.598 0.763 0.709 0.711 0.689 0.636 0.553National City 0.548 0.591 0.726 0.689 0.484 0.361 0.639 0.523PNC 0.683 0.622 0.735 0.720 0.682 0.715 0.737 0.617Regions 0.690 0.567 0.785 0.756 0.682 0.635 0.728 0.605State Street 0.587 0.627 0.643 0.574 0.666 0.529 0.659 0.658SunTrust 0.667 0.594 0.698 0.730 0.728 0.623 0.764 0.715US Bank 0.694 0.619 0.771 0.771 0.690 0.725 0.747 0.703Wachovia 0.716 0.683 0.774 0.758 0.730 0.610 0.741 0.549Wells Fargo 0.725 0.684 0.763 0.716 0.733 0.692 0.713 0.746
Average 0.679 0.587 0.731 0.704 0.655 0.635 0.711 0.656
N the ot
4
ufs1tihts2D
b
et
4
ralismwe investigate the movements of stock return correlations among
ote: The table reports the mean of each firm’s daily stock returns correlation with
.2. Fluctuations in yearly pair-wise correlations
For banks, Fig. 2 depicts several correlation spikes along thepward trend line. The first correlation spike occurred in 1991,ollowed by a larger spike in 1993, corresponding to the reces-ion in the early 1990s. Another correlation peak occurred in998, the year of the Russian financial crisis, which triggeredhe collapse of Long Term Capital Management (LTCM), lead-ng to a massive bailout by other major banks and investmentouses coordinated by the Federal Reserve Bank of New York. Thehird correlation peak is observed in 2002, right after the reces-ion in 2001. The last and largest correlation spike occurred in007, during the worst financial crisis in the U.S. since the Great
epression.Fig. 2 also depicts several spikes in correlations among non-anks; a few are around the U.S. recessions in the early 1999s,
b
m
Correlations of Daily
0
0.1
0.2
0.3
0.4
0.5
0.6
0.7
0.8
1988 1989 1990 1991 1992 1993 1994 1995 1996 1997 1998
Bank AvgMnPears Bank AvgMed Bank AvgMedKendal Nonbank Avg
Nonbank AvgMnKendal Nonbank Avg
Fig. 2. Correlations of daily stock returns (
her firms for that quarter.
arly 2000s, and in 2007–2008. There is no clear explanation forhe correlation spike that can be observed for 1997.
.3. Changes in quarterly correlations
The five- and one-year correlations we have studied thus fareveal the long-term trending and cyclical correlation patternsmong banks and non-banks; however, they are not able to shedight on whether daily stock return correlations can be used as anndicator of the level of systemic risk in the financial system athorter horizons. Given the importance of having a systemic riskeasure or indicator that signals the level of risk in a timely fashion,
anks for each quarter.Alternatively, conditional correlations can be estimated using
ethods like multivariate GARCH or a co-risk measure using
Stock Returns
1999 2000 2001 2002 2003 2004 2005 2006 2007 2008
Pears Bank AvgMnKendal
MnPears Nonbank AvgMedPears
MedKendal
banks and non-banks), 1988–2008.

nancia
qrCauprt
4
qci2tmcnoffittatasr
tawlpiacjst
FotgiTpttcfalsitt
r
4
pi
tsaoeClrhtsqaa
paKPFocmToftkoLt1sr
mmomtnskcmr
dfcrap
D.K. Patro et al. / Journal of Fi
uantile regressions for extreme returns instead of calculating cor-elations from daily returns for each quarter (such as Ang andhen, 2002; Karolyi and Stulz, 1996).9 These methods do have theirdvantages and elegance; however, because of their complexity,ncertainty in model selection and specification, and difficulties inarameter estimation, they are inherently subject to more modelisk. Our objective is to examine if a “simple” indicator may servehe purpose of monitoring systemic risk.
.3.1. Extreme movements in quarterly correlation changesFig. 3 depicts quarterly correlation changes from the second
uarter of 1988 to the fourth quarter of 2008. Despite severalorrelation spikes, the average correlation change is 5% (medians zero) over the sampling period, with a standard deviation of9%. Four extreme changes are more than two standard devia-ions above the mean. In the fourth quarter of 1995, correlation
ore than doubled, jumping from 14% to 32%. The second largesthange occurred in the first quarter of 2007, when correlationearly doubled, increasing from 35% to 68%. The next largest changeccurred in the fourth quarter of 1989, when correlation rose 86%,rom 15% to 27%, and the last extreme change occurred in therst quarter of 1993, when correlation increased 71%, from 17%o 29%. Although our emphasis in this study is not to determinehe causes of systemic failure, we notice that significant economicnd market events did occur around these stock return correla-ion spikes. Furthermore, these jumps in stock return correlationsmong financial institutions suggest that it is important to mea-ure and investigate tail dependencies when measuring systemicisk.
Among those abnormal correlation movements that did noturn into systemic events, correlations immediately decreasedfter the spike to previous levels. This decrease is consistentith the characteristics of stock price behaviors. As stated ear-
ier, stock prices reflect investors’ perceptions of a firm’s futurerofitability based on information observed at that time. As more
nformation becomes available, investors adjust their perceptionsccordingly and calm down; however, this pattern is not thease during the recent financial crisis. Although the correlationumped 92% to almost 70% in the first quarter of 2007, withlight ups and downs, it has remained at this increased level forwo years.
Not every escalated systemic risk turns into systemic failure.or example, among the last four extreme correlation movements,nly the recent movement turned into financial crisis; however,his finding does not necessarily mean that correlation is not aood measurement of systemic risk. As in any other type of risk,t measures the likelihood of the realization of the systemic event.herefore, an increase in stock return correlation should be inter-reted as a higher likelihood of systemic failure in the case of ariggering event occurring, and not necessarily a likelihood of ariggering event or an actual systemic failure. If the stock returnorrelation is low, a triggering event is unlikely to cause systemicailure. For example, given the same type of triggering event (e.g.,
failure of a major financial institution), systemic failure is moreikely to happen in the last decade than in the early 1990s due to theignificantly higher correlation in recent years. Therefore, the real-zation of a systemic failure depends on the change of correlation,
he level of correlation, and other factors that are not examined inhis study (such as triggering events and liquidity).9 See, for example, the co-risk measure estimated in Chapter 2 of the IMF (2009)eport.
si
P
l Stability 9 (2013) 105– 116 113
.3.2. Correlation patterns during the 2007–2008 financial crisisIn order to zoom in on what happened during the financial crisis
eriod of 2007 and 2008, we report quarterly Pearson correlationsn Table 3.10 We can make the following observations from Table 3.
First, the average mean Pearson correlations across the 22 inves-igated banks remained relatively high, ranging from 0.587 in theecond quarter of 2007 to 0.731 in third quarter of 2007, with anverage of 0.670 from the first quarter of 2007 to the fourth quarterf 2008. Second, there are discernable variations among the differ-nt banks and over time. For example, the average correlations ofitigroup with the rest of the investigated 21 banks hit the highest
evel of 0.804 in the third quarter of 2007, whereas the average cor-elations of Capital One with the rest of the investigated 21 banksit the lowest level of 0.295 in the second quarter of 2007. Third,he average mean Pearson correlations across the 22 banks showome peaks and troughs from the first quarter of 2007 to the fourthuarter of 2008. The peaks occurred in the third quarters of 2007nd 2008, and the troughs occurred in the second quarters of 2007nd 2008.
In order to gain some insights into the causes of the correlationeaks and troughs in these two years, we plot the average meannd median Pearson correlations, the average mean and medianendall correlations, and the number of market events over time inanel A of Fig. 4. The number of market events is obtained from theinancial Turmoil Timeline compiled by the Federal Reserve Bankf New York starting in June 2007. The Financial Turmoil Timelineovers all of the major market events. For example, there are twoajor events in the last quarter of 2007, both involving Citigroup.
he events began with a string of major bank write-downs basedn subprime mortgage losses on October 16 and raised $7.5 billionrom the Abu Dhabi Investment Authority on November 27. Thehird quarter of 2008 exhibits the greatest number of (11) mar-et events during the eight quarter period, ranging from a runn deposits at IndyMac on July 11 after the FDIC took over, toehman’s announcement of a $3.9 billion loss in the third quar-er on September 10 and their filing for bankruptcy on September5, to WaMu’s closure by OTS on September 25. Therefore, we con-ider the number of market events as a reasonable proxy for theealized level of systemic risk.
From Panel A of Fig. 4, it appears that there are some co-ovements between stock return correlations and the number ofarket events. Correlation peaks often coincide with the number
f market events. For example, a peak in the average mean andedian Pearson and Kendall stock return correlations occurred in
he third quarter of 2008, which is the quarter with the largestumber of market events, and a correlation trough occurred in theecond quarter of 2008, which is the quarter with only two mar-et events. This pattern is especially obvious based on the Kendallorrelation, but is rather mixed across different default correlationeasures based on the reduced-form, structural and hybrid credit
isk models, as shown in Panels B, C and D, respectively, in Fig. 4.Whether the observed increase in stock return correlations is
riven by the systematic component of returns due to commonactors or it is driven by the idiosyncratic (or the unsystematic)omponent of returns can help us understand better why the cor-elations can serve as a useful indicator of systemic risk. Highnd increasing correlations in the idiosyncratic bank specific com-onent should be paid particular attention because it increases
ystemic risk or probability of joint failure. That is what we examinen the next section.10 Kendall and Spearman correlations show similar patterns in comparison toearson correlations and are therefore not reported.

114 D.K. Patro et al. / Journal of Financial Stability 9 (2013) 105– 116
92.45%
70.62%
85.78%
125.57%
-60.00%
-40.00%
-20.00%
0.00%
20.00%
40.00%
60.00%
80.00%
100.00%
120.00%
140.00%
19
88
Q2
19
89
Q2
19
90
Q2
19
91
Q2
19
92
Q2
19
93
Q2
19
94
Q2
19
95
Q2
19
96
Q2
19
97
Q2
19
98
Q2
19
99
Q2
20
00
Q2
20
01
Q2
20
02
Q2
20
03
Q2
20
04
Q2
20
05
Q2
20
06
Q2
20
07
Q2
20
08
Q2
% C
ha
ng
e in
Av
gM
n P
ea
rso
n
0.0000
0.1000
0.2000
0.3000
0.4000
0.5000
0.6000
0.7000
0.8000
Av
gM
n P
ea
rso
n
AvgMnPearsn(% change)
AvgMnPearsn
Fig. 3. Quarter by quarter changes (%) in average mean Pearson correlations of daily stock returns (banks), 1988Q2–2008Q4.
Panel A. Daily Stock Returns
0.40
0.50
0.60
0.70
0.80
2007Q1 2007Q2 2007Q3 2007Q4 2008Q1 2008Q2 2008Q3 2008Q4
Avera
ge M
ean
or
Med
ian
Co
rrela
tio
ns
0
2
4
6
8
10
12N
um
ber
of
Mark
et
Even
ts
#MktEvents AvgMnPearson AvgMedPearson AvgMnKendal AvgMedKendal
Panel B. 1-Year KDP JC4
0.00
0.15
0.30
0.45
0.60
2007Q1 2007Q2 2007Q3 2007Q4 2008Q1 2008Q2 2008Q3 2008Q4
Av
era
ge
Me
an o
r M
ed
ian
Co
rre
lati
on
s
0
2
4
6
8
10
12
Nu
mb
er
of
Ma
rek
t E
ve
nts
#MktEvents AvgMnPearson AvgMedPearson AvgMnKendal AvgMedKendal
Panel C.1-Year KDP MS4
0.10
0.30
0.50
0.70
0.90
2007Q1 2007Q2 2007Q3 2007Q4 2008Q1 2008Q2 2008Q3 2008Q4
Av
era
ge
Me
an
or
Me
dia
n
Co
rre
lati
on
s
0
2
4
6
8
10
12
Nu
mb
er
of
Ma
rke
t E
ve
nts
#MktEventsa AvgMnPearson AvgMedPearson AvgMnKendal AvgMedKendal
Panel D.1-Year KDP JM4
0.00
0.20
0.40
0.60
0.80
2007Q1 2007Q2 2007Q3 2007Q4 2008Q 1 2008Q 2 2008Q 3 2008Q4
Avera
ge M
ean
or
Med
ian
Co
rrela
tio
ns
0
2
4
6
8
10
12
Nu
mb
er
of
Mark
et
Even
ts
#MktEvents AvgMnPearson AvgMedPearson AvgMnKendal AvgMedKendal
based
5
ttArracccs
wt
iamfitte
Fig. 4. Correlations of stock returns and default correlations
. Systematic risk vs. idiosyncratic risk
The increasing trend of stock return correlations could be dueo increases in systematic risk as the financial industry continueso consolidate (De Nicolo and Kwast, 2002).11 On the other hand,charya (2009) suggests that even when the level of idiosyncraticisk (or individual bank failure) reduces, aggregate risk may stillise if banks elect to invest in correlated assets, which accentu-tes systemic risk. In order to determine whether the increasedorrelations are driven by correlations of systematic or idiosyn-
ratic returns, we disaggregate the stock returns to a systematicomponent and an idiosyncratic component by applying thetandard Fama-French three-factor model. For robustness check,11 We would like to thank the anonymous referee for this suggestion.
aolbbo
on reduced form, structural and hybrid models, 2007–2008.
e also use a four-factor model in which a bank index is added tohe Fama-French three-factor model.
The three factor model includes the excess return on the marketndex, the small minus big (SMB) premium which is a size factornd a high minus low (HML) factor which is based on book toarket ratios, representing a premium for value over growth
rms. Fama and French (1993) provide detailed discussions ofhese factors and how they are estimated. The website referredo in Footnote 16 has details about these factors. The empiricalvidence in that paper as well as others indicates that these factorsre able to explain cross-sectional variations in the systematic riskf U.S. firms. In forming industry portfolios, there are different
evels of industry aggregation possible. We select the bank indexased on 48 industry portfolios since that captures the returns onank stocks up to a four digit SIC code. We regress the daily returnsf the bank’s stock on these three and four factors and analyze the
D.K. Patro et al. / Journal of Financial Stability 9 (2013) 105– 116 115
0
0.1
0.2
0.3
0.4
0.5
0.6
0.7
0.8
0.9
1988 1992 1993 1997 1998 2002 2003 2007 2008
Idiosyncra�c Risk_3 Factor Idiosyncra�c Risk_4 Factor
Fig. 5. Trend of average idiosyncratic returns: Fama-French 3-factor model and 4-factor model.
0.00
0.20
0.40
0.60
0.80
1.00
1.20
1988 1992 1993 1997 1998 2002 2003 2007 2008
bps
pms“rvtwtiiIss
trscF
smcso
l
0.00
0.05
0.10
0.15
0.20
0.25
0.30
1988 1992 1993 1997 1998 2002 2003 2007 2008
MeanEhatCorrPearson MedianEhatCorrPearsonMeanEhatCorrKendal MedianEhatcorrK enda lMeanEhatCorrSpearM MedianEhatCorrSpearM
Wp
i3ot4igaiiecmas
stitctbvasabto
6
cirs
MeanYhatCorrPearson MedianYhatCorrPearsonMeanYhatCorrKendal MedianYhatCorrKenda lMeanYhatCorrSpearman MedianYhatCorrSpearma n
Fig. 6. Correlations of systematic returns: Fama-French 4-factor model.
etas (the systematic risk), the error terms (the idiosyncratic com-onent) as well as the R-squares. The regressions are estimatedeparately for each bank for each time period of interest.
Fig. 5 presents the average idiosyncratic returns over the sub-eriods retrieved from the three-factor model and the four-factorodel, respectively. Basically, they are the percent of “unexplained
um of squares” (i.e., one minus the R-squared). We use thebank” industry portfolio provided by French to calculate the excesseturns of the “bank” factor.12 Both equally weighted returns andalue weighted returns are examined and the results are qualita-ively the same. Therefore, we only present the results with equallyeighted index hereafter. The trend shown in Fig. 5 clearly suggests
hat banks’ individual risks are declining over time, a finding sim-lar to De Nicolo and Kwast (2002). Adding an additional bankingndustry factor, however, does not increase the explanatory power.t suggests that the “bank” industry factor does not capture anyignificant amount of commonality of the banks included in ourample of the largest financial institutions in U.S.
We then calculate the pair-wise correlations of banks’ sys-ematic (explained) returns and idiosyncratic (residual) returns,espectively, as we have done for stock returns in the previousections. To save space, we only present the mean and medianorrelations using Pearson, Kendall and Spearman methods inigs. 6 and 7.13
Fig. 6 presents the average pair-wise correlations of banks’ystematic returns. Although there is an increasing trend, theagnitude is very small. For example, except for the Kendall
orrelations, the correlations of banks’ systematic returns increaseteadily from the lower 90% during period 1 (1988–1992) to its peakf 99% during period 4 (2003–2007), and start to decline in 2008.
12 Please see http://mba.tuck.dartmouth.edu/pages/faculty/ken.french/dataibrary.html#Research. We use 48 industry classifications.13 The detailed results and tables are available from the authors upon request.
tajpcist
Fig. 7. Correlations of idiosyncratic returns: Fama-French 4-factor model.
hile the level of Kendall correlations is lower, it shows similarattern as the other correlations.
Fig. 7 shows the average pair-wise correlations of banks’diosyncratic returns. There is a significant increase during period
(1998–2002). Specifically, the average of the Pearson correlationsf the mean idiosyncratic returns increases from 11% in period 2o 26% in period 3. Although it decreases slightly to 22% in period, it is still much higher than the 6% in period 1. The significant
ncrease in the correlations of banks’ idiosyncratic returns sug-ests that while banks’ average idiosyncratic risks have declineds suggested in Fig. 5, they may have had increasingly correlatednvestments, which may lead to higher systemic risk as manifestedn the higher correlations of banks’ idiosyncratic risks. Note, how-ver, the figures shows that unlike correlations of stock returns,orrelations of systematic and idiosyncratic returns do not increaseonotonically over time, indicating that there may be other factors
t play. What drives these trends would a fruitful topic for futuretudies.
Our empirical findings on the trend of the correlations of banks’ystematic returns and idiosyncratic returns are consistent withhe aggregate risk-shifting incentive among banks–they prefer annefficiently high correlation of asset returns in order to surviveogether, or fail together (Acharya, 2009). Our findings are alsoonsistent with De Jonghe (2010) who addresses the issue using aail beta and shows that non-interest generating activities increaseanks’ tail beta. Traditional bank regulatory practices focus on pre-ention of individual bank failures. That has changed since the crisisnd we offer clear empirical evidence that the use of correlations oftock returns can offer meaningful insights to banks’ individual risknd aggregate risk, and thus should be useful for macro-prudentialank supervision. The fact that increase in correlations is driven byhe idiosyncratic component provides further support for the usef the stock returns.
. Conclusions
By analyzing the trends and fluctuations of daily stock returnorrelations and default correlations among 22 U.S. bank hold-ng companies and investment banks, we find that daily stocketurn correlation is a simple, robust, forward-looking, and timelyystemic risk indicator. It captures the trend as well as the fluc-uations in the levels of systemic risk in the U.S. economy. Andditional advantage of this simple indicator is that it is not sub-ect to the model specification errors and data limitations that otherotential systemic risk measures may face. Furthermore, this indi-
ator can be easily estimated for non-bank and non-US financialnstitutions. Our finding that the idiosyncratic risk in the bankingector has become more correlated provides further support thathe systemic risk in the banking system has increased since these
1 nancia
hd
tFpatohrttmmrtota
cciravsoasmg
A
opvDrr
R
A
A
A
A
AA
A
A
A
A
A
B
B
B
C
C
C
C
D
D
D
D
D
F
G
G
G
H
I
I
I
J
J
K
K
K
K
L
L
M
N
R
R
S
S
T
Z
16 D.K. Patro et al. / Journal of Fi
igher correlations indicate a higher joint probability of failureuring times of stress.
Our findings on stock return correlations should help regula-ors and businesses better understand and monitor systemic risk.irst, systemic risk always exists. Like other types of risk, it is a by-roduct of financial activity. However the level of systemic risk cannd does vary over time, which has been our focus. Therefore, a bet-er management of systemic risk calls for an ongoing monitoringf the movements of risk measures. Second, we observe that thereas been a shift from a low systemic risk regime to a high systemicisk regime since 1996. The average correlation is above 0.5 duringhis period, which has created a high-risk environment in which ariggering event might cause systemic failure. Third, unusual move-
ents of systemic risk, especially upward movements, should beore closely watched. Therefore, we recommend that systemic risk
egulators such as the FSOC monitor daily stock return correla-ions among financial institutions on a continual basis. Althoughur emphasis in this study is not to determine the causes of sys-emic failure, we notice that significant economic events did occurround stock return correlation spikes.
Once an indicator of systemic risk is established, future researchould explore the causes of systemic risk and ways to prevent finan-ial crisis. For example, what caused the regime shift of correlationsn 1995 and 1996? If it is true that banks choose to be highly cor-elated so as to survive together and avoid dying alone (Acharyand Yorulmazer, 2008), what could be done to reduce such moti-ation? Can consolidation, which contributed to the increases intock return correlations among financial institutions in the periodf 1988–1999 (De Nicolo and Kwast, 2002), also explain the trendnd cyclical patterns after 1999 that we have documented in thistudy? These are important issues in managing systemic risk anditigating the disruptive effects caused by systemic failure and are
ood topics for future research.
cknowledgments
This work was initiated while Xian Sun was working at the Officef the Comptroller of the Currency. The views expressed in thisaper are those of the authors and do not necessarily reflect theiews of the Office of the Comptroller of the Currency or the U.S.epartment of the Treasury. We are grateful to the editor and the
eferees for useful suggestions. We are solely responsible for anyemaining errors.
eferences
charya, V., Johnson, T., 2007. Insider trading in credit derivatives. Journal of Finan-cial Economics 84, 110–141.
charya, V., Yorulmazer, T., 2008. Information contagion and bank herding. Journalof Money, Credit and Banking 40, 215–231.
charya, V., 2009. A theory of systemic risk and design of prudential bank regulation.Journal of Financial Stability 5, 224–255.
charya, V., Pedersen, L.H., Philippon, T., Richardson, M., 2011. Measuring systemicrisk. Federal Reserve Bank of Cleveland Working Paper 10-02.
drian, T., Brunnermeier, M.K., 2009. CoVaR. Princeton University Working Paper.harony, J., Swary, I., 1983. Contagion effects of bank failures: evidence from capital
markets. Journal of Business 56, 305–322.llenspach, N., Monnin, P., 2006. International integration, common exposures and
systemic risk in the banking sector: an empirical investigation. Swiss NationalBank Working Paper.
mmer, J., Mei, J., 1996. Measuring international economic linkages with stock mar-ket data. Journal of Finance 51, 1743–1763.
ng, A., Chen, J., 2002. Asymmetric correlations of equity portfolios. Journal of Finan-cial Economics 63, 443–494.
spachs, O., Goodhart, C., Tsomocos, D., Zicchino, L., 2007. Towards a measure of
financial fragility. Annals of Finance 3, 37–74.vesani, R., Pascual, A.G., Li, J., 2006. A new risk indicator and stress testing tool: amultifactor nth-t-default CDS basket. IMF Working Paper (06/105).
artram, S., Brown, G., Hund, J., 2007. Estimating systemic risk in the internationalfinancial system. Journal of Financial Economics 86, 835–869.
Z
l Stability 9 (2013) 105– 116
artholomew, P., Whalen, G., 1995. Fundamentals of systemic risk. Researchin Financial Services: Banking, Financial Markets, and Systemic Risk 7,3–17.
ongini, P., Laeven, L., Majnoni, G., 2002. How good is the market at assessing bankfragility? A horse race between different indicators. Journal of Banking andFinance 26, 1011–1028.
ampbell, J.Y., Taksler, G.B., 2003. Equity volatility and corporate bond yields. Journalof Finance 58, 2321–2349.
arron, A.S., 1982. Financial crisis: recent experience in U.S. and international mar-kets. Brookings Papers on Economic Activity 2, 395–422.
aruana, J., 2010. Systemic Risk: How to Deal with It?, http://www.bis.org/publ/othp08.htm.
han, N.M., Getmansky, M., Haas, S.M., Lo, A.W., 2006. Systemic risk and hedge funds.In: Carey, M., Stulz, R.M. (Eds.), The Risks of Financial Institutions. University ofChicago Press, Chicago/London, pp. 235–338.
as, S.R., Uppal, R., 2004. Systemic risk and international portfolio choice. Journal ofFinance 59, 2809–2834.
e Bandt, O., Hartmann, P., 2000. Systemic risk: a survey. ECB Working Paper No.35.
e Jonghe, O., 2010. Back to the basics in banking? A micro-analysis of bankingsystem stability. Journal of Financial Intermediation 19, 387–417.
e Nicolo, G., Kwast, M., 2002. Systemic risk and financial consolidation: are theyrelated? Journal of Banking and Finance 26, 861–880.
i Cesare, A., 2006. Do market-based indicators anticipate rating agencies? Evidencefor international banks. Bank of Italy Economic Research Paper No. 593.
ama, E.F., French, K.R., 1993. Common risk factors in the returns on stocks andbonds. Journal of Financial Economics 33, 3–56.
oldstein, M., December 1995. International Financial Markets and Systemic Risk.Institute of International Economics Mimeo, Washington, DC.
oodhart, C., Sunirand, P., Tsomocos, D., 2005. A risk assessment model for banks.Annals of Finance 1, 197–224.
oodhart, C., Sunirand, P., Tsomocos, D., 2006. A model to analyse financial fragility.Economic Theory 27, 107–142.
ull, J., Predescu, M., White, A., 2004. The relationship between credit default swapspreads, bond yields, and credit rating announcements. Journal of Banking andFinance 28, 2789–2811.
MF, 2009. Global Financial Stability Report, http://www.imf.org/external/pubs/ft/gfsr/2009/01/index.htm.
MF/BIS/FSB, 2009. Guidance to Assess the Systemic Importance of Financial Insti-tutions, Markets and Instruments: Initial Considerations.
to, T., Harada, K., 2004. Bank fragility in Japan. CESifo Working Paper Series No.1137.
arrow, R., van Deventer, D., 2005. Estimating default correlations using a reducedform model. Risk (January), 83–88.
orion, P., 2006. Bank trading risk and systemic risk. In: The Risks of Financial Insti-tutions. NBER.
ambhu, J., Weidman, S., Krishnan, N., 2007. New Directions for UnderstandingSystemic Risk. National Academies Press.
arolyi, A., Stulz, R., 1996. Why do markets move together? An investi-gation of U.S.–Japan stock return comovements. Journal of Finance 51,951–986.
aufman, G.G., 1995. Comment on systemic risk. Research in Financial Services:Banking, Financial Markets, and Systemic Risk 7, 47–52.
ing, M.R., Maier, P., 2009. Hedge funds and financial stability: regulatingprime brokers will mitigate systemic risks. Journal of Financial Stability 5,283–297.
ehar, A., 2005. Measuring systemic risk: a risk management approach. Journal ofBanking and Finance 29, 2577–2603.
o, A.W., 2008. Hedge funds, systemic risk, and the financial crisis of 2007–2008:written testimony for the House Oversight Committee hearing on hedge funds.MIT Working Paper.
erton, R.C., 1974. On the pricing of corporate debt: the risk structure of interestrates. Journal of Finance 29, 449–470.
orden, L., Weber, M., 2009. The co-movement of credit default swap, bond andstock markets: an empirical analysis. European Financial Management 15,529–562.
igobon, R., 2003. On the measurement of the international propagation of shocks:is it stable? Journal of Financial Economics 61, 261–283.
ochet, J.C., Tirole, J., 1996. Interbank lending and systemic risk. Journal of Money,Credit and Banking 28, 733–762.
egoviano, M., Goodhart, C., 2009. Banking stability measures. IMF Working Paper09/04. International Monetary Fund, Washington.
lovin, M.B., Sushka, M.E., Poloncheck, J.A., 1999. An analysis of contagion andcompetitive effects at commercial banks. Journal of Financial Economics 54,197–225.
homson, J.B., 2009. On systemically important financial institutions and progres-sive systemic mitigation. Federal Reserve Bank of Cleveland Policy DiscussionPaper No. 27.
ambrana, M.S., 2010. Systemic risk analysis using forward-looking distance-
to-default series. Federal Reserve Bank of Cleveland Working Paper10-05.hang, B.Y., Zhou, H., Zhu, H., 2009. Explaining credit default swap spreads withequity volatility and jump risks of individual firms. Review of Financial Studies22, 5099–5131.