journal of financial economicscharvey/research/... · 2013-04-08 · managerial attitudes and...
TRANSCRIPT

Contents lists available at SciVerse ScienceDirect
Journal of Financial Economics
Journal of Financial Economics ] (]]]]) ]]]–]]]
0304-40
http://d
$ We
Alon B
Gervais
Hong Li
Schoar,
Mitchel
meeting
Federal
and Bus
tion me
Kees Ko
their he
magazin
subscrib
Nadja G
appreci
Sharman Corr
Durham
E-m
Pleas(201
journal homepage: www.elsevier.com/locate/jfec
Managerial attitudes and corporate actions$
John R. Graham a,b, Campbell R. Harvey a,b, Manju Puri a,b,n
a Fuqua School of Business, Duke University, Durham, NC 27708, USAb National Bureau of Economic Research, Cambridge, MA 02912, USA
a r t i c l e i n f o
Article history:
Received 13 September 2010
Received in revised form
25 May 2012
Accepted 25 June 2012
JEL classification:
G30
G32
G34
Keywords:
Managers
Attitudes
Personality traits
Risk-aversion
Capital structure
Debt
Acquisitions
Corporate policies
Behavioral corporate finance
5X/$ - see front matter & 2013 Elsevier B.V
x.doi.org/10.1016/j.jfineco.2013.01.010
appreciate the comments of Zahi Ben-Da
rav, Murillo Campello, Steve Dimmock,
, Dirk Hackbarth, Bill Holstein, Janet Kersn
u, Mary Frances Luce, Pete Nicholas, David R
Hersh Sheffrin, Meir Statman, Jack Soll, Mo
l, David Walonick, Ivo Welch, and seminar
s, San Francisco, Case Western Universit
Reserve Bank of Kansas City, Norwegian S
iness Administration, Bergen, and the West
etings. San Diego for helpful comments. We
edijk, Peter Roosenboom, Susan Simko and
lp in implementing the survey, and Chief Exe
e, CFO Asia, and CFO Europe for allowing
ers. Special thanks to Martine Cools, Abe d
uenster, and Bruno Laranjeira for translat
ate the research assistance of Benjamin Ee
, and Jie Yang. All errors are our own.
esponding author at: Fuqua School of Busin
, NC 27708, USA. Tel.: þ1 919 660 7657; fa
ail address: [email protected] (M. Puri).
e cite this article as: Graham, J.R., e3), http://dx.doi.org/10.1016/j.jfine
a b s t r a c t
We administer psychometric tests to senior executives to obtain evidence on their
underlying psychological traits and attitudes. We find US CEOs differ significantly from
non-US CEOs in terms of their underlying attitudes. In addition, we find that CEOs are
significantly more optimistic and risk-tolerant than the lay population. We provide
evidence that CEOs’ behavioral traits such as optimism and managerial risk-aversion are
related to corporate financial policies. Further, we provide new empirical evidence that
CEO traits such as risk-aversion and time preference are related to their compensation.
& 2013 Elsevier B.V. All rights reserved.
. All rights reserved.
vid, Jack Bovender,
Don Durfee, Simon
ar, Ahmed Khwaja,
obinson, Antoinette
rton Sorenson, Will
participants at ASSA
y, Duke University,
chool of Economics
ern Finance Associa-
thank Andy Clifton,
Cheri Varnadoe for
cutive magazine, CFO
us to survey their
e Jong, Frank Ecker,
ing the survey. We
, Hai Huang, Nikhil
ess, Duke University,
x: þ1 919 660 8030.
t al., Managerial attituco.2013.01.010i
1. Introduction
What causes firms to behave the way they do? Theanswers to this important question are not well under-stood. Traditional economic theory suggests companiesshould simply pursue positive net present value projectsto maximize shareholder wealth. However, firms aroundthe globe seem to behave differently, leading some tospeculate that heterogeneous objective functions arebeing maximized (see, e.g., Allen, 2005). Even within theUS, firms in the same industry, of similar size and facingsimilar investment opportunities behave differently.
To what extent do personality characteristics varyamong US managers and non-US firms? What is theimportance of individual heterogeneity in corporations?The idea that individual heterogeneity matters in corpo-rate finance/governance has recently become a primary
des and corporate actions. Journal of Financial Economics

J.R. Graham et al. / Journal of Financial Economics ] (]]]]) ]]]–]]]2
focus in behavioral finance. Recent papers suggest thatmanagers matter—there are findings on managerial fixedeffects (Bertrand and Schoar, 2003); on managerial over-confidence proxies relating to firm behavior (Malmendierand Tate, 2005, 2008); and on Chief Executive Officer(CEO) characteristics in private equity firms being relatedto outcome success (Kaplan, Klebanov, and Sorensen,2012).
We use a survey-based approach to provide newinsight into the people and processes behind corporatedecisions. This method allows us to address issues thattraditional empirical work based on large archival datasources cannot. For example, we are able to administerpsychometric personality tests, gauge risk-aversion, andmeasure other behavioral phenomena. Our mode ofinquiry is similar to those of experimental economists(who often administer gambling experiments) and psy-chologists (who administer psychometric tests). As far aswe are aware, no other study attempts to measureattitudes of senior management directly through person-ality tests to distinguish CEOs from others and U.S toplevel executives from non-US top level executives.We also relate CEO attributes to firm-level policies.
Our survey quantifies behavioral traits of senior execu-tives and also harvests information related to careerpaths, education, and demographics. We ask these samequestions of chief executives and chief financial officers,among public and private firms, and in both the US andoverseas. We can thus compare traits and attitudes for USand non-US CEOs to see if there is indeed a significantdifference in attitudes. We also ask questions related tostandard corporate finance decisions such as leveragepolicy, debt maturity, and acquisition activity. This allowsus to relate attitudes and managerial attributes to corpo-rate actions. We also examine how managerial attributessuch as risk-aversion and time preference relate to com-pensation at the firm level.
We use the survey responses to address the followingbroad questions. How do US CEOs differ from lay people,and also how do they differ from Chief Financial Officers(CFOs) and non-US CEOs in terms of behavioral and othercharacteristics? Are managerial psychological traits,career experiences, or education correlated with corpo-rate decision-making? Do behavioral traits such as risk-aversion and time preference explain compensationpackages (e.g., is risk-aversion related to lower pay-performance sensitivity as predicted by theory)?
We compare CEOs to CFOs and others in terms ofpersonality traits and career characteristics, as well asmake attitude comparisons of CEOs to established normsin the psychology literature. We find that CEOs are muchmore risk-tolerant than the lay population of similar ageprofile (studied in Barsky, Kimball, Juster, and Sharpio,1997). It is notable that CEOs are also much moreoptimistic than the lay population as compared to thenorms in the psychology literature (Scheier, Carver, andBridges, 1994). We find, as might be expected, that CEOsand CFOs have different personal characteristics andcareer paths. Interestingly, we also find significant differ-ences between CEOs and CFOs in terms of attitudes.In particular, our psychometric tests suggest that CEOs
Please cite this article as: Graham, J.R., et al., Managerial attitu(2013), http://dx.doi.org/10.1016/j.jfineco.2013.01.010i
are much more optimistic than CFOs. Our results alsosuggest that US-based CEOs and CFOs are more optimisticthan their non-US counterparts. This provides evidence onone channel through which US and non-US firms differ:their executives differ in terms of attitudes and traits,perhaps a reflection of firms outside the US havingdifferent norms or maximizing different objective func-tions (Allen, 2005).
Our paper focuses on CEOs because they are theprincipal corporate decision-makers. In particular, wefocus on two key areas that CEOs feel they have the mostinfluence on: mergers and acquisitions (M&A) and capitalstructure (see Graham, Harvey, and Puri, 2012). Weinvestigate which factors and experiences (e.g., person-ality traits or career path) of the decision-maker (CEO)affect capital structure and acquisition decisions. Weshow that these corporate policies are significantlyrelated to the personality traits of executives. For exam-ple, we find that companies initiate more mergers andacquisitions when their chief executive is more risk-tolerant. Beyond risk tolerance, one might expect thatthe level of a chief executive’s optimism might be relatedto the corporate decisions her company makes. Forexample, optimistic CEOs might expect that recent profit-ability will continue into the future, or that the future willbe better than the recent past. Consistent with this viewand the arguments of Landier and Thesmar (2009), wefind evidence that optimistic CEOs use more short-termdebt than do firms led by less optimistic CEOs. There isalso a growing literature that suggests that males tend tobe more overconfident than females (see, e.g., Barber andOdean, 2001). Correspondingly, we find that male CEOsare more likely to have higher debt ratios, and in parti-cular, higher short-term debt ratios than their femalecounterparts.
We find that firms with high historical or future ratesof growth are more likely to be run by risk-tolerant CEOs.These chief executives are likely to be younger. They arealso more likely to be taller than average. To the extentthat height corresponds to confidence (as suggested else-where; see, e.g., Persicao, Postlewaite, and Silverman(2004) and Deaton and Arora (2009)), these results areconsistent with more confident, more risk-tolerant,younger CEOs being more likely to run growth companies.
We cannot determine the direction of causalitybetween corporate growth and executive personality.Managers may self-select into companies (or companiesmay hire managers) who have the ‘‘right’’ personalitytraits for the particular company. What we document isthat there is a significant relationship between CEOcharacteristics and company characteristics.
We also examine the CEOs’ target compensation interms of the proportion due to fixed salary, and sepa-rately, the part that is performance-dependent, i.e., bonus,stock, and options. We find that risk-averse CEOs aresignificantly more likely to be compensated by salary andless likely to be compensated with performance-relatedpackages. We further find that CEOs who are impatient(i.e., have a high rate of time preference) are more likelyto be paid proportionately more in salary. These resultsare intuitive. Standard agency theory, including both
des and corporate actions. Journal of Financial Economics

1 In a companion paper (Graham, Harvey, and Puri, 2012), we
examine how capital is allocated, and decision-making authority is
delegated, within firms, and use several questions from the survey that
are not studied in this paper.
J.R. Graham et al. / Journal of Financial Economics ] (]]]]) ]]]–]]] 3
screening/adverse selection models and moral hazard mod-els, predicts a fundamental trade-off between increasingincentives and risk, i.e., the more risk-averse the agent, themore costly it is to provide pay-performance incentives.Despite this, it has been very hard to find support for thisprediction in the empirical literature (see, e.g., Prendergast,2002). Our finding that pay-performance sensitivity actuallydecreases with risk-aversion is, to our knowledge, one of thefirst direct pieces of evidence consistent with this theore-tical prediction. Further, our findings that differences intime preference are also important for explaining compen-sation patterns is consistent with standard agency theorybut is a prediction that has largely been ignored in theliterature. Our results that CEOs are, on average, much lessrisk-averse than the general population also fits well withthis framework. Risk aversion makes incentive pay costly,and increases the participation constraint of the manager.As a result, firms prefer to hire less risk-averse agents asmanagers, all else equal.
While the survey approach allows us to ask manyunique questions, it is not without potential problems.Surveys measure beliefs, not necessarily actions. Perhapssome of the survey questions are misunderstood orotherwise produce noisy measures of the desired trait orcharacteristic. Moreover, at least for some questions,executives can potentially parrot explanations that theythink researchers want to hear, rather than state theirtrue beliefs. In addition, field studies may face the objec-tion that market participants do not necessarily have tounderstand the reason they do what they do in order tomake (close to) optimal decisions. It is also possible thatthe respondents are not representative of the underlyingpopulation, an issue that we investigate below. Given thatwe conduct our survey at one point in time, it is notpossible to determine causation for the most part. Forexample, we cannot say for sure whether risk-tolerantCEOs use less short-term debt or whether firms that havea policy of using short-term debt attract less risk-tolerantemployees. Likewise, in most cases, it is not possible forus to distinguish whether the personality trait causes thecorporate policy from whether an executive ‘‘learns’’ atrait on the job, nor can we separate a managerial fixedeffect from a company fixed effect. In the latter case, acompany might optimally seek out an executive withcertain traits due to the needs of the business. Indeed, ourresults are consistent with such an interpretation.
Even with these considerations, our study provides newinsights and contributes to several different researchstreams. First, we administer the first-ever psychometrictests of sitting executives and provide evidence that USCEOs differ significantly from non-US CEOs in terms ofattitudes and attributes, from CFOs, and also from the laypopulation. The differences in attitudes help provide onepossible rationale for differences in firm behavior acrosscountries. Second, we contribute to the literature thatinvestigates whether executives’ characteristics and psycho-logical traits are related to corporate decisions. Third, ourresults provide direct evidence on a role for risk-aversionand time preference in executive compensation—a resultpredicted by standard agency theory but one on whichdirect evidence has been scarce.
Please cite this article as: Graham, J.R., et al., Managerial attitu(2013), http://dx.doi.org/10.1016/j.jfineco.2013.01.010i
The rest of the paper is organized as follows. Section 2describes the survey instrument that we use, and explainsthe design of the questions and delivery mechanism. Section3 presents our analysis of who makes which decision withinthe firm, how managerial traits correspond to corporateactions, whether there is matching between companies andmanagers, and the differences between CEOs and others.Some conclusions are offered in the final section.
2. Method
2.1. Survey mechanism
A common approach used in prior work is to inferexecutive attitudes from observed executive actions.While this is a laudable technique, questions arise aboutthe validity of the action as a broad-based proxy, andsamples are limited to companies for which such manage-rial actions are observable. We adopt a different approachin which we gauge managers’ personality traits andattitudes using well-established questions that have beenshown in psychology and economics to be valid measuresof peoples’ attitudes.
To assess risk-aversion, we examine managers’responses to a series of gambles similar to Barsky,Kimball, Juster, and Sharpio (1997), who administer suchquestions in the Health and Retirement Survey. To assessoptimism, we borrow from well-established psychologyliterature using standard psychometric tests (Scheier,Carver, and Bridges, 1994 Life Orientation Test-Revisedor LOT-R test) that have been widely used in psychologyresearch. To measure time preferences, we assess timepredilection for gains and losses. To gauge sure lossaversion, we present managers with a gamble that, ifrejected, indicates that they are averse to sure losses.
As far as we are aware, no other study attempts tomeasure attitudes of senior management directly throughsuch personality tests and relate them to firm-levelpolicies. In addition, because the survey is anonymous,we also gather information on other measures and vari-ables thought to be important, as described below.
2.2. Survey design
Our survey is wide-ranging, our hope being to capturemany facets of corporate decision-making. Our surveywas designed to address multiple issues, including howattitudes of senior management relate to firm-level poli-cies.1 Below we focus on the key variables that we use inthis study and how they are created.
2.2.1. Measuring attitudes
Personal risk-aversion: We follow the approach in Barsky,Kimball, Juster, and Sharpio (1997) to measure personalrisk-aversion. In their paper, Barsky et al. use surveymethods to measure risk-aversion in the Health and
des and corporate actions. Journal of Financial Economics
J.R. Graham et al. / Journal of Financial Economics ] (]]]]) ]]]–]]]4
Retirement Survey, which involves over 11,000 responsesfrom adults aged 51 to 61. The principal requirement for aquestion aimed at measuring risk-aversion is that it mustinvolve gambles over lifetime income. The nature of thequestions in Barsky et al. is as follows:
Suppose that you are the only income earner in yourfamily, and you have a good job guaranteed to give youyour current (family) income every year for life. You aregiven the opportunity to take a new and equally goodjob, with a 50–50 chance it will double your (family)income and a 50–50 chance that it will cut your (family)income by a third. Would you take the new job?
Barsky, Kimball, Juster, and Sharpio (1997) cautionthat because changing jobs is costly, there may be a statusquo bias that would predispose an individual to reject therisky alternative. This is also discussed in Shefrin (2005).Accordingly, we modify the Barsky et al. approach,rewording the question as a choice between two alter-native new jobs, one with a safe income stream, the otherbeing risky. The series of questions that we use is:
Suppose you are the only income earner in yourfamily. Your doctor recommends you move becauseof allergies. You have to choose between two possiblejobs (choose one):
(a)
Pl(2
100% chance that the job pays your current incomefor life.
(b)
50% chance that the job pays twice your currentincome for life and 50% chance that the job pays 2/3of your current income for life.If the respondent picked (a), the survey continues to ask:
Which job would you choose if the choices wereinstead:
(c)
100% chance that the job pays your current incomefor life.(d)
50% chance that the job pays twice your currentincomes for life and 50% chance that the job pays 4/5 of your current income for life.If the respondent picked (b), the survey continues to ask:
Which job would you choose if the choices wereinstead:
(e)
100% chance that the job pays your current incomefor life.(f)
50% chance that the job pays twice your currentincome for life and 50% chance that the job pays 1/2of your current income for life.2 References to articles that use LOT-R can be found at http://www.
psy.miami.edu/faculty/ccarver/sclLOT-R.html and in Puri and Robinson
(2007).
In our analysis, we classify people who answer (a) and (c)as being the least risk-tolerant.
2.2.1.1. Optimism. We measure optimism using psycho-metric tests specifically designed to gauge optimism. Inparticular we, use the Life Orientation Test—Revised
ease cite this article as: Graham, J.R., et al., Managerial attitu013), http://dx.doi.org/10.1016/j.jfineco.2013.01.010i
(LOT-R), as devised by Scheier, Carver, and Bridges (1994).The LOT-R has been used extensively in the psychologyliterature;2 it has the advantages that it is a very crediblemeasure in psychology, it is brief and easy to use, and has awell-established interpretation. Its brevity makes it ideal foruse in a survey such as ours where questionnaire length is animportant consideration.
In this test, respondents are asked to answer a numberof questions on a 0–4 point scale ranging from ‘‘I agreea lot,’’ ‘‘I agree a little,’’ ‘‘I neither agree nor disagree,’’‘‘I disagree a little,’’ and ‘‘I disagree a lot.’’ There are tenquestions: six pertinent questions with four filler ques-tions. The six scored questions are:
1. In uncertain times, I usually expect the best.2. If something can go wrong for me, it will.3. I’m always optimistic about my future.4. I hardly ever expect things to go my way.5. I rarely count on good things happening to me.6. Overall, I expect more good things to happen to methan bad.
Coding is done so that high values indicate optimism.Thus, questions 1, 3 and 6 are numerically coded with a 4if the respondent answers ‘‘I agree a lot’’ and zero if theyanswer ‘‘I disagree a lot.’’ Questions 2, 4, and 5 are codedas 4 if the respondent answers ‘‘I disagree a lot,’’ and zeroif the respondent answers ‘‘I agree a lot.’’ This gives us arange of mean responses from 0–4. We classify as opti-mistic respondents who average 3 or higher for thesequestions.
2.2.1.2. Time preference. We ask the following question tomeasure time preference for gains (see, e.g., Loewenstein,Read, and Baumeister, 2003):
Would you rather win US$10,000 now or winUS$13,000 a year from now?
If the respondent answers that s/he would rather winUS$10,000 today, s/he is categorized as being impatientbecause s/he has an implicit discount rate of more than 30%.
2.2.1.3. Aversion to sure losses. If an executive is averse tosure losses, then this may lead her/him to undertakeactions such as ‘‘throwing good money after bad’’ inhopes of turning around what appears to be a sure loss.We pose the following question to measure aversion tosure losses:
Last year your company invested $5 million US in aproject that was expected to generate cash flows of$10 million US after one year. A year has passed andthe project yielded nothing.
Now you have the opportunity to invest an additionalsum in this same project. There is a 20% chance thatthe project will generate a $10 million US cash flow ina year’s time and nothing thereafter. There is an 80%
des and corporate actions. Journal of Financial Economics

4 Ideally, we would like to know the SAT score of the school at the
time that the CEO attended; our computed SAT scores are an approx-
imation for this. We follow Chevalier and Ellison (1999) methodology,
which briefly, is as follows. We use Lovejoy’s College Guide as our main
source for SAT scores. Where there is a range of SAT scores, we take the
midpoint of the middle 50% of freshmen scores as reported in Lovejoy’s
College Guide. If the middle 50% is not available, we take the average SAT
scores or ACT scores at the university. For 64% of our sample, the scores
are calculated directly. For the rest, we approximate: if only mean SAT
scores are available then we use the sum of the mean math and verbal
scores. Some schools report ACT mid-50% range only. For these we
construct predicted values from a regression of SAT math high on ACT
math low, ACT math high, ACT math low squared, and ACT math high
squared. If only the average ACT math and reading scores are reported,
then we rerun similar regressions using the midpoint of the SAT 50%
ranges as the dependent variable and the midpoint of the ACT 50%
ranges and the midpoint squared as independent variables. If only
composite ACT scores are reported, then we use them as if they
represent only reading and math scores and rerun the above regressions.
If only selectivity scores are reported, then we assign to these schools
J.R. Graham et al. / Journal of Financial Economics ] (]]]]) ]]]–]]] 5
chance that the new investment will generate nothingat all. How much would you be willing to invest today?
$__________million dollars US.
If the respondent replies $2 million or more we classifyher/him as averse to sure losses because this actionindicates a willingness to overpay to continue the projectin order to avoid the ‘‘sure loss’’ of terminating theproject today.
2.2.2. Demographics/career related variables
This is an anonymous survey, hence we gather infor-mation on the personal characteristics of the executives,their past career/education, and related demographics,since past work suggests they can be important, and wetherefore incorporate them as controls. We collect infor-mation on height, gender, age, past experience, whetherthey obtained an MBA, and whether they graduated froma prestigious college. We briefly describe the rationalebehind these variables and their construction below.
Height: Economists have documented a height-wagedisparity that is almost of the same magnitude as thegender, wage disparity (see, e.g., Persicao, Postlewaite,and Silverman, 2004). One explanation given for thisdisparity is that height, especially in the adolescent years,is important in developing confidence, which ultimatelytranslates into the wage disparity. (For example, the (tall)star athlete has his confidence built up during his youth,as coaches and other adults laud his accomplishments;this confidence carries over into other aspects of theathlete’s life.) This literature would suggest that heightmight be a reasonable proxy for confidence. Case andPaxson (2008) suggest that height might proxy for cogni-tive ability. Accordingly, height might capture somethingthat our behavioral questions do not. We define a male tobe tall if he is 5 feet 10 inches or above, and a woman istall if she is 5 feet 4 inches and above, both of which areone inch greater than the average adult height among USresidents.
Male: There is a growing literature that suggests thatthe degree of confidence differs between men andwomen, and that men tend to be more overconfident(see, e.g., Barber and Odean, 2001).
MBA: An MBA degree can signal many things. It canrepresent valuable knowledge gleaned from a good busi-ness education. On the other hand, it might indicateconservatism as those who really want to shoot for thestars early on might decide that an MBA is not necessary.3
Age: An executive’s age can potentially affect decisionsin important ways. Younger CEOs may be bolder. On theother hand, age can reflect experience and perspective,allowing executives to take more risks. Some evidencesuggests that personal risk-aversion appears to increasewith age till age 70 and then decline (see Shefrin, 2005).There is also some evidence that the sophistication offinancial decisions varies with age (see Agarwal, Driscoll,Gabaix, and Laibson, 2009).
3 In contrast, Chevalier and Ellison (1999) find that fund managers
with MBAs tend to take on more systematic risk.
Please cite this article as: Graham, J.R., et al., Managerial attitu(2013), http://dx.doi.org/10.1016/j.jfineco.2013.01.010i
Past experience: The executive’s career path (whethertheir background is from finance, accounting, legal, sales/marketing, or other routes) could affect outlook andcomfort level in certain kinds of decisions. Accordingly,we ask the respondent whether his/her work experienceprior to becoming an executive was primarily in opera-tions, legal, sales/marketing, accounting, finance/treasury,research, or other.
Prestigious college: Graduating from a college with highSAT scores can be a sign of innate intelligence. It is alsopossible that graduating from a prestigious collegeendows certain expectations on the kind of work thatone does and the kind of company that one joins.Accordingly, we use SAT scores of the colleges that theexecutives attend to gauge how prestigious the school is.The methodology we employ is similar to Chevalier andEllison (1999).4
2.2.3. Company characteristics
We collect information on a number of companycharacteristics. We are unable to match to Compustatdata since the survey does not require companies toidentify themselves; hence, we collect company-specificdata in the survey itself. The purpose is to determinewhether we can identify a relation between personal ordemographic information and corporate actions. Addi-tionally, we search for evidence consistent with a match-ing of executives and companies. Accordingly, we gatherthe following information.
Size: The size of the firm can be important for a varietyof reasons. Large size can imply a certain amount ofstability and has implications for growth. Research sug-gests that large firms typically have more debt (Frank andGoyal, 2007). Hence, we control for size in our tests.Large firms are defined as those with sales revenuesexceeding $1B.
Operating segments: The number of operating segments ofthe company tells us something about diversification.Accordingly, one of the questions in the survey is how many
the mean SAT score of the schools with the same selectivity index.
Insofar as in mid-tier schools the CEO is likely to be in the right tail of
the distribution, the median SAT scores from such schools are likely to
understate CEO’s personal SAT score.
des and corporate actions. Journal of Financial Economics
5 Graham, Harvey, and Rajgopal (2005) obtain a response rate of
10%, Trahan and Gitman (1995) 12%, Graham and Harvey (2001) 9%, and
Brav Graham, Harvey, and Michaely (2005) 16%. In addition, Slemrod
and Venkatesh (2002) survey tax preparers (12% response rate) and
corporate taxpayers (9% response rate) about compliance costs. The
referenced quarterly CFO survey can be found at http://www.cfosurvey.
org.
J.R. Graham et al. / Journal of Financial Economics ] (]]]]) ]]]–]]]6
operating segments (i.e., distinct operating divisions likeautos, food, and retail) does your company have?
Public or private: We ask respondents to indicatewhether their firm is public or private. This is an impor-tant characteristic of the company in its own right, andcan be related to some corporate decisions, e.g., acquisi-tion activity.
Debt ratio: The amount of debt that a company uses isthe subject of much discussion in finance and behavioraleconomics. One consideration important to our analysis isthat using more debt ‘‘levers up’’ the firm, producing morerisk and higher expected returns, a preference whichmight be related to executive personality traits. Sometheories (e.g., Heaton, 2002; Hackbarth, 2008) argues thatmanagers’ behavioral traits affect the use of debt. Hence,we ask respondents to indicate the total debt/total assetsratio for their companies.
Short-term debt ratio: Some theories suggest thatbehavioral characteristics matter more for short termdebt as opposed to the total debt undertaken by the firm(see, e.g., Landier and Thesmar, 2009). Accordingly, we askfor the short-term debt/total debt ratio for the firm.
Number of acquisitions: Dating back to Roll’s (1986)Hubris Hypothesis on takeovers, many argue that acquisi-tions are often driven by managerial characteristics asopposed to being purely value-maximizing transactions.The large literature on bidder returns, which are near zeroor negative on average, is consistent with such a story(see, e.g., Andrade, Mitchell, and Stafford, 2001). Accord-ingly, one of our objectives is to investigate whethermanagerial characteristics are related to acquisition activ-ity. Hence, we ask about number of acquisitions as well asamongst the management team, who has most of theinput in mergers and acquisitions. The survey designallows us to identify the subset of CEOs who believe theyare the dominant M&A decision-maker. For this purposewe use the question: ‘‘Amongst the management team,who has most of the input in mergers and acquisitions.’’The CEO answers based on a 7-point scale, where 1represents ‘‘I make decision without help from others,’’7 represents ‘‘others make decisions,’’ and the midpoint is‘‘share decision equally with others.’’
Historic growth: We are interested in investigating thetypes of companies for which different sorts of managerswork. If there is some matching of managerial traits tocompany characteristics, rapidly growing companieswould be a logical place to see such matching. Hence,we ask the executives to report average annual salesrevenue growth rate for their company over the lastthree years.
Expected growth: Presumably, it is not just historicalgrowth that is important but future anticipated growth aswell. Hence, we also ask managers to project the annualgrowth rate in sales for their companies over the nextthree years.
Compensation: Executives arguably have some discre-tion about the composition of their compensationpackages. All else equal, managers with certain character-istics (e.g., high risk-aversion) would prefer compensationpackages with a larger salary component and a smallervariable component. In any given year, these components
Please cite this article as: Graham, J.R., et al., Managerial attitu(2013), http://dx.doi.org/10.1016/j.jfineco.2013.01.010i
might vary. Hence, we ask managers about the targetpercentage of their total compensation that is in the formof salary, bonus, stock and options awards, and other.
2.3. Survey delivery
We created an initial survey instrument based onexisting theoretical and empirical research. We thensolicited feedback from a number of academics, practi-tioners, and CEOs on the initial version of the survey.Based on this feedback, we shortened and focused thesurvey. We also sought and incorporated the advice ofmarketing research experts on the survey’s design andexecution. A copy of the faxed English language version ofthe final survey instrument can be found at http://faculty.fuqua.duke.edu/� jgraham/CEOCFO.pdf. For most of theparticipants, rather than a fax, the version of the surveythey were administered consisted of a series of linkedweb pages.
We survey both CEOs and CFOs. We contacted threegroups of CEOs. The largest group was approximately10,000 executives who subscribe to Chief Executive maga-zine. Chief Executive has more than 70,000 subscribers,and we emailed an invitation to participate in the surveyto the CEO subscribers who work at the largest 10,000companies (among their 70,000 subscribers). There was abounceback rate of about 2.3% on the emails, meaningthat approximately 9,770 executives received the invita-tion. We also reached out to readers of Chief Executive
with an advertisement in the magazine that invited themto go to an Internet link to participate in the experiment.This printed advertisement attracted fewer than twodozen participants, and if we were to delete these CEOsfrom the sample, our results do not change. Due to theirsmall number, we do not separate out these CEOs for theremainder of the paper but instead merge them in withthe other Chief Executive respondents.
The second group of CEOs we contacted is 800 (net ofbounced emails) chief executive readers of CFO magazine.We emailed the same survey invitation to these execu-tives. The third group of CEOs attended the WorldEconomic Forum in Davos during January 2005. We faxedsurveys to 142 Davos’ executives and received sevenresponses. If we were to delete these responses, it wouldnot alter our results. Due to their small number, we do notseparate out these CEOs for the remainder of the paper.
In total, we surveyed approximately 10,700 CEOs, onceimproper email addresses are eliminated. All of theseinvitations were issued on approximately February 1,2006. We sent a reminder to all those emailed onFebruary 14. Across all these groups, 1,180 CEOsresponded, for a response rate of approximately 11%,which is typical of recent survey response rates.5 In the
des and corporate actions. Journal of Financial Economics

J.R. Graham et al. / Journal of Financial Economics ] (]]]]) ]]]–]]] 7
analysis below, we focus primarily on the 1,017 CEOs whowork for firms headquartered in the United States.
During the first two weeks of February 2006, we alsoinvited four groups of US CFOs to participate.6 The largestgroup of surveyed CFOs consists of subscribers to CFO
magazine. On our behalf, the magazine emailed 6,800invitations (net of bounced emails) to subscribers of theUS version of its primary publication, CFO magazine.Separately, Duke University emailed 2,000 (net ofbounced emails) CFOs who had participated in previousquarterly CFO Global Business Outlook surveys conductedby researchers at Duke and CFO (see http://www.cfosurvey.org). The response rate for the quarterly survey istypically 5% to 6%. The third group was 253 CFOs whoparticipated in the Forum on Corporate Finance. Finally,107 financial officers who are alumni of Duke Universitywere faxed a survey instrument (the results do not changeif faxed responses are ignored). All total, approximately9,000 US-based CFOs were surveyed. We received 549responses, for a response rate of approximately 6%.
We also surveyed Asian and European chief financialofficers. In particular, we invited subscribers to CFO Europeand CFO Asia magazines to participate. In the demographicquestions, we verify that these respondents in fact work infirms that are headquartered in these geographic regions.CFO Europe sent approximately 5,600 email invitations andCFO Asia 4,500, both figures net of emails that bounced. Atotal of 396 European CFOs responded, as did 264 AsianCFOs, yielding response rates of approximately 7% and 6%,respectively. The Asian group was not sent an emailreminder because the reminder date fell near the ChineseNew Year. The European response rate may be a littlehigher because we gave the executives the opportunity totake the survey in any of four languages: English, French,German, or Dutch. The Asian survey was only available inEnglish. Overall, we had 1,276 CFOs respond across differ-ent regions. In this paper, the non-US executives and CFOsare primarily included as a comparison group for executivepersonality traits and characteristics.
2.4. Summary statistics
Table 1, Panel A contains self-reported summaryinformation about the characteristics of sample firms. Inour sample, 11.5% of the firms are public, with mean salesrevenue of $551 million. While much research studiespublic firms, one advantage of our sample is that we learna great deal about private firms. This is important becauselittle private-firm research is conducted even though 87%of US firms with assets greater than $10 million areprivate.7 At the same time, it is important to interpretour results with the public/private breakdown in mind.
We gather a number of demographic characteristics ofthe CEOs relating to personality traits as well as careerand education. Some summary statistics about CEOs aregiven in Table 2. In our sample, 9.8% of US CEOs have low
6 Most of those surveyed have the job title CFO. Some have the title
of Treasurer, Assistant Treasurer, VP Finance, Comptroller, or a similar
title. We refer to this group collectively as CFOs.7 http://spccapital.com/FAQS.1.6-1.htm#FAQ12.
Please cite this article as: Graham, J.R., et al., Managerial attitu(2013), http://dx.doi.org/10.1016/j.jfineco.2013.01.010i
risk tolerance. Thus, most CEOs seem willing to take onrisk, which is perhaps a necessary ingredient of the jobthat CEOs undertake. Or, perhaps risk-takers that succeedare the ‘‘winners’’ who ultimately rise to the CEO position.
In our sample, 80.2% of the CEOs are very optimistic asgauged by the LOT-R test. CEOs are very optimistic inabsolute terms, and also as compared to CFOs and asbenchmarked against the norms in the psychology litera-ture (see Scheier, Carver, and Bridges, 1994). We discussthe differences further in Section 3 below.
More than one-third of CEOs have an MBA degree.They are predominantly male (92.3%). The median maleheight is 71 inches while the median female height is 66inches. One-third are impatient in terms of having adiscount rate greater than 30%. In terms of career path,16% of the sample comes from a finance/accountingbackground. The mean CEO is 54 years old and attendeda university with a mean SAT score of 1160.
3. CEO characteristics
In this section, we compare the personality traits ofCEOs to other people. For example, how similar are theyto CFOs or to the general population?
3.1. Comparisons between US CEOs, US CFOs, and non-US
executives
For risk-aversion, we have a benchmark from theBarsky, Kimball, Juster, and Sharpio (1997) study. Oursurvey uses similar questions to Barsky et al. on risk-aversion but we find very different results. Barsky et al.posed these questions in the Health and RetirementSurvey (HRS), which had a mean respondent age of 55.6years. Our mean CEO age is roughly similar at 54.1 years.In Barsky et al., over 64% of the respondents are reportedto display low risk tolerance. In sharp contrast, we findthat only 9.8% of our CEOs display low risk tolerance.
CEOs are likely to have larger wealth than the laypopulation, which could affect some measures of risktolerance. However, as Barsky, Kimball, Juster, andSharpio (1997) show, one can back out the coefficient ofrelative risk-aversion from the questions, and this mea-sure of risk-aversion should not be a function of wealth.For the very risk-averse, on which we focus, the coeffi-cient of relative risk-aversion is greater than 3.76.8 Ourresults suggest that 9.8% of CEOs have a relative risk-aversion greater than 3.76 as compared to 64% of asimilar-aged lay population. CEOs are often perceived tobe visionaries and risk-takers. Our results of very largedifferences in the degree of risk-aversion between CEOsand the lay population support this popular wisdom.
We are also able to benchmark the dispositionaloptimism of US CEOs against a number of measures. TheUS CEOs in our sample are highly optimistic. They have amean LOT-R score of 20.34 (standard deviation of 3.50).
8 As explained in Section 2, our question is slightly different from
that in Barsky , Kimball, Juster, and Sharpio (1997). Our very risk-averse
category corresponds to Category I in Table I in Barskey et al.
des and corporate actions. Journal of Financial Economics
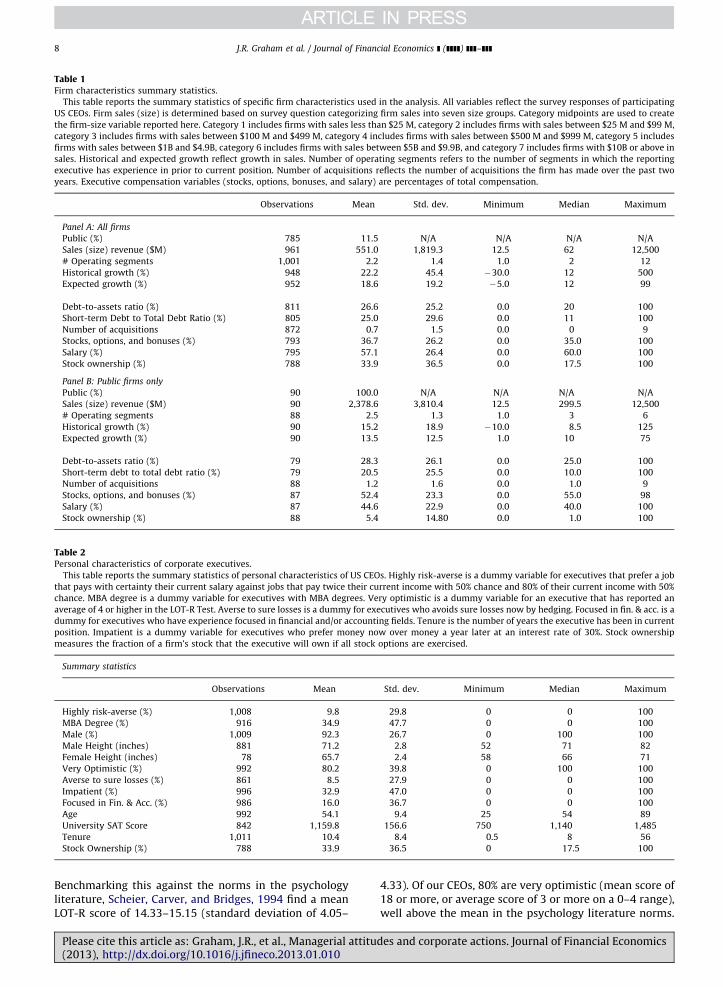
Table 1Firm characteristics summary statistics.
This table reports the summary statistics of specific firm characteristics used in the analysis. All variables reflect the survey responses of participating
US CEOs. Firm sales (size) is determined based on survey question categorizing firm sales into seven size groups. Category midpoints are used to create
the firm-size variable reported here. Category 1 includes firms with sales less than $25 M, category 2 includes firms with sales between $25 M and $99 M,
category 3 includes firms with sales between $100 M and $499 M, category 4 includes firms with sales between $500 M and $999 M, category 5 includes
firms with sales between $1B and $4.9B, category 6 includes firms with sales between $5B and $9.9B, and category 7 includes firms with $10B or above in
sales. Historical and expected growth reflect growth in sales. Number of operating segments refers to the number of segments in which the reporting
executive has experience in prior to current position. Number of acquisitions reflects the number of acquisitions the firm has made over the past two
years. Executive compensation variables (stocks, options, bonuses, and salary) are percentages of total compensation.
Observations Mean Std. dev. Minimum Median Maximum
Panel A: All firms
Public (%) 785 11.5 N/A N/A N/A N/A
Sales (size) revenue ($M) 961 551.0 1,819.3 12.5 62 12,500
# Operating segments 1,001 2.2 1.4 1.0 2 12
Historical growth (%) 948 22.2 45.4 �30.0 12 500
Expected growth (%) 952 18.6 19.2 �5.0 12 99
Debt-to-assets ratio (%) 811 26.6 25.2 0.0 20 100
Short-term Debt to Total Debt Ratio (%) 805 25.0 29.6 0.0 11 100
Number of acquisitions 872 0.7 1.5 0.0 0 9
Stocks, options, and bonuses (%) 793 36.7 26.2 0.0 35.0 100
Salary (%) 795 57.1 26.4 0.0 60.0 100
Stock ownership (%) 788 33.9 36.5 0.0 17.5 100
Panel B: Public firms only
Public (%) 90 100.0 N/A N/A N/A N/A
Sales (size) revenue ($M) 90 2,378.6 3,810.4 12.5 299.5 12,500
# Operating segments 88 2.5 1.3 1.0 3 6
Historical growth (%) 90 15.2 18.9 �10.0 8.5 125
Expected growth (%) 90 13.5 12.5 1.0 10 75
Debt-to-assets ratio (%) 79 28.3 26.1 0.0 25.0 100
Short-term debt to total debt ratio (%) 79 20.5 25.5 0.0 10.0 100
Number of acquisitions 88 1.2 1.6 0.0 1.0 9
Stocks, options, and bonuses (%) 87 52.4 23.3 0.0 55.0 98
Salary (%) 87 44.6 22.9 0.0 40.0 100
Stock ownership (%) 88 5.4 14.80 0.0 1.0 100
Table 2Personal characteristics of corporate executives.
This table reports the summary statistics of personal characteristics of US CEOs. Highly risk-averse is a dummy variable for executives that prefer a job
that pays with certainty their current salary against jobs that pay twice their current income with 50% chance and 80% of their current income with 50%
chance. MBA degree is a dummy variable for executives with MBA degrees. Very optimistic is a dummy variable for an executive that has reported an
average of 4 or higher in the LOT-R Test. Averse to sure losses is a dummy for executives who avoids sure losses now by hedging. Focused in fin. & acc. is a
dummy for executives who have experience focused in financial and/or accounting fields. Tenure is the number of years the executive has been in current
position. Impatient is a dummy variable for executives who prefer money now over money a year later at an interest rate of 30%. Stock ownership
measures the fraction of a firm’s stock that the executive will own if all stock options are exercised.
Summary statistics
Observations Mean Std. dev. Minimum Median Maximum
Highly risk-averse (%) 1,008 9.8 29.8 0 0 100
MBA Degree (%) 916 34.9 47.7 0 0 100
Male (%) 1,009 92.3 26.7 0 100 100
Male Height (inches) 881 71.2 2.8 52 71 82
Female Height (inches) 78 65.7 2.4 58 66 71
Very Optimistic (%) 992 80.2 39.8 0 100 100
Averse to sure losses (%) 861 8.5 27.9 0 0 100
Impatient (%) 996 32.9 47.0 0 0 100
Focused in Fin. & Acc. (%) 986 16.0 36.7 0 0 100
Age 992 54.1 9.4 25 54 89
University SAT Score 842 1,159.8 156.6 750 1,140 1,485
Tenure 1,011 10.4 8.4 0.5 8 56
Stock Ownership (%) 788 33.9 36.5 0 17.5 100
J.R. Graham et al. / Journal of Financial Economics ] (]]]]) ]]]–]]]8
Benchmarking this against the norms in the psychologyliterature, Scheier, Carver, and Bridges, 1994 find a meanLOT-R score of 14.33–15.15 (standard deviation of 4.05–
Please cite this article as: Graham, J.R., et al., Managerial attitu(2013), http://dx.doi.org/10.1016/j.jfineco.2013.01.010i
4.33). Of our CEOs, 80% are very optimistic (mean score of18 or more, or average score of 3 or more on a 0–4 range),well above the mean in the psychology literature norms.
des and corporate actions. Journal of Financial Economics

J.R. Graham et al. / Journal of Financial Economics ] (]]]]) ]]]–]]] 9
Interestingly CEOs are much more optimistic than CFOs,with only 65% of CFOs being classified as very optimistic.(See Table 3, Panel A.)
Table 3Comparison of executive characteristics across samples.
This table reports the summary statistics of specific personal characteristics
characteristics of US CEOs against those of US CFOs, US CEOs with Non-US CEO
methods. The first, unconditional, uses the entire sample. The second sampl
randomly sampling when the number of observations are uneven. The third sam
compares US CEOs to US CFOs using the three sampling methods described abov
non-US CEOs in the same way. Panel C compares the characteristics of US CFOs
are defined as in Table 2. Summary statistics reflect means where applicable. S
number of observations is included in the panel header.
Panel A: Comparisons between US CEOs and US CFOs based on three sampling m
(1) Unconditional�1011 CEOs/534 CFOs (
US CEOs vs US CFOs U
Highly risk-averse (%) 9.8 8.4
MBA degree (%) 34.9 51.8nnn
Male (%) 92.3 90.4
Male height (inches) 71.2 71.0
Female height (inches) 65.7 65.1
Very optimistic (%) 80.2 65.3nnn
Averse to sure losses (%) 8.5 13.2nnn
Impatient (%) 32.8 26.4nnn
Focused in fin. & acc. (%) 15.6 86.7nnn
Age 54.1 48.6nnn
University SAT score 1159.8 1113.5nnn 1
Tenure (years) 10.4 6.8nnn
Stock ownership (%) 33.9 3.8nnn
Panel B: Comparisons between US CEOs and non-US CEOs based on three sampl
(1) Unconditional�1011 US/162 Non-US (
US CEOs vs Non-US CEOs U
Highly risk-averse (%) 9.8 16.7nnn
MBA degree (%) 34.9 48.2nnn
Male (%) 92.3 94.4
Male height (inches) 71.2 69.3nnn
Female height (inches) 65.7 56.9nnn
Very optimistic (%) 80.2 54.1nnn
Averse to sure losses (%) 8.5 19.7nnn
Impatient (%) 32.8 41.4nn
Focused in fin. & acc. (%) 15.6 25.3nnn
Age 54.1 50.0nnn
University SAT score 1159.8 1208.7 1
Tenure (years) 10.4 9.0n
Stock ownership (%) 33.9 33.6
Panel C: Comparisons between US CFOs and non-US CFOs based on three sampli
(1) Unconditional�534 US/ 707 Non-US (
US CFOs vs Non-US CFOs U
Highly risk-averse (%) 8.4 13.9nnn
MBA degree (%) 51.8 33.6nnn
Male (%) 90.4 87.6
Male height (inches) 71.0 69.1nnn
Female height (inches) 65.1 63.4
Very optimistic (%) 65.3 47.9nnn
Averse to sure losses (%) 13.2 13.9
Impatient (%) 26.4 37.9nnn
Focused in fin. & acc. (%) 86.7 85.3
Age 48.6 43.3nnn
University SAT score 1113.5 1118.8 1
Tenure (years) 6.8 5.9nnn
Stock ownership (%) 3.8 6.1nn
Please cite this article as: Graham, J.R., et al., Managerial attitu(2013), http://dx.doi.org/10.1016/j.jfineco.2013.01.010i
Given our results that CEOs are optimists as perpsychometric tests, a related question is whether othersalso perceive CEOs to be optimistic. In order to assess this,
of participating executives used in the analysis. Panels A–C compare the
s and US CFOs with Non-US CFOs, respectively, based on three sampling
ing method matches firms one-on-one based on public/private status,
ple method matches firms one-on-one based on size categories. Panel A
e, while Panel B compares the characteristics of US CEOs against those of
against those of non-US CFOs for the three sampling methods. Variables
ignificance at the 10% level is denoted by n, 5% by nn, and 1% by nnn. The
ethods
2) Public/private matching�383 (3) Size matching�417
S CEOs vs US CFOs US CEOs vs US CFOs
10.8 7.0n 10.6 8.7
34.1 49.3nnn 32.8 49.5nnn
93.7 93.0 95.7 90.1nnn
71.1 70.9 71.2 70.9
66.2 64.5nn 66.4 64.7nn
83.5 65.7nnn 79.7 66.3nnn
8.8 11.7 7.8 11.6n
30.4 24.9n 28.0 26.8
15.9 85.2nnn 16.8 87.7nnn
54.0 49.0nnn 55.0 48.7nnn
165.8 1109.0nnn 1145.2 1106.3nnn
9.9 7.1nnn 10.3 6.9nnn
28.7 4.5nnn 20.0 3.8nnn
ing methods
2) Public/private matching�120 (3) Size matching�153
S CEOs vs Non-US CEOs US CEOs vs Non-US CEOs
5.8 17.6nnn 9.2 17.1nn
33.9 51.9nnn 39.9 48.9
92.5 95.0 94.7 94.7
70.9 69.7nnn 71.1 69.2nnn
67.1 53.1 66.8 55.7
80.7 57.6nnn 78.7 53.1nnn
4.3 17.9nnn 8.6 19.7nnn
28.3 38.7n 36.2 41.1
18.3 26.9 19.0 25.0
54.9 49.7nnn 52.9 49.7nn
154.2 1189.6 1157.5 1201.5
10.0 8.0n 10.3 8.5n
31.7 33.4 40.2 33.6
ng methods
2) Public/private matching�431 (3) Size matching�430
S CFOs vs Non-US CFOs US CFOs vs Non-US CFOs
7.1 13.9nnn 7.7 14.9nnn
52.0 31.7nnn 52.3 34.3nnn
92.6 90.0 90.2 89.3
70.9 68.7nnn 71.0 69.2nnn
64.9 64.4 65.1 63.9nn
65.1 47.7nnn 64.9 51.6nnn
13.3 14.1 13.6 12.8
24.5 38.8nnn 26.8 35.3nnn
85.5 85.2 86.4 87.0
48.8 43.5nnn 48.8 43.5nnn
117.6 1100.0 1115.1 1093.0
6.9 5.8nnn 6.7 5.5nnn
4.0 6.4n 3.9 5.3
des and corporate actions. Journal of Financial Economics

10 We examine the data for internal consistency and typographical
errors. As a result, one entry with negative debt/assets and two entries
with short-term debt ratio exceeding 100% are dropped; entries with a
J.R. Graham et al. / Journal of Financial Economics ] (]]]]) ]]]–]]]10
we conduct another survey in March 2007. In this survey,we ask CFOs about their perception of CEO optimism. Thespecific question we ask is, ‘‘Compared to your level ofoptimism, is the CEO of your company more or lessoptimistic about the financial prospects of your owncompany?’’ CFOs can respond whether their CEO is moreoptimistic, less optimistic, or about the same as the CFO’soptimism. Of 453 CFOs who responded to this question,only 5.1% of the CFOs say they are more optimistic thantheir CEOs. The next question follows up and asks ‘‘Whydo you think your CEO’s optimism differs from yours?’’We have 292 responses to this question from CFOs. Thepredominant responses, 35.7%, say that CEOs are moreoptimistic about almost everything i.e., CEOs are moreoptimistic about all aspects of life, above and beyond theCEO’s extra optimism about business prospects. Theresults of this second survey deepen our earlier finding.Not only are CEOs more optimistic as per psychometrictests, they are also perceived to be more optimistic bytheir CFO colleagues. Taking these results together, thissuggests that CEOs are indeed special in terms of theirpersonality characteristics, in particular, being more risk-tolerant as well as more optimistic than others.
We are able to use data that we collected from the surveyto further compare a number of characteristics of CEOs toCFOs (see Table 3, Panel A). We first examine differences inUS CEOs and CFOs. It can be seen that CEOs are much lesslikely to have MBA degrees than are CFOs. CEOs are alsolikely to be older, and to have attended more prestigiousuniversities. CEOs are less averse to sure losses and theirmain career path is less likely to be finance/accounting,relative to CFOs. CEOs tend to be more impatient than CFOs:there are a significantly larger proportion of CEOs with a highrate of time preference as compared to CFOs.
We need to be careful about drawing conclusions fromthese comparisons because they are unconditional, not hav-ing first matched the executives by firm characteristics.Hence, we recalculate the differences in characteristics ofCEOs and CFOs after matching for whether the company ispublic or private. Panel A of Table 3, column 2 shows that theresults are similar when matching by public versus privatestatus. We separately match by size in column 3. Aftermatching, we find similar results with the only exceptionbeing that the differences in time preference no longerrobustly significant. The results suggest that CEOs not onlyhave different career paths from CFOs but importantly, differin terms of their attitudes.
Next, we examine how US CEOs and CFOs differ fromexecutives from other parts of the world (Panels B and Cin Table 3). We find both CEOs and CFOs from the UnitedStates tend to be more risk-tolerant than executiveswhose companies are not located in the United States.9
They are also more optimistic, and older.Further, non-US CEOs and CFOs tend to be less patient, as
indicated by their higher rate of time preference, relative totheir US counterparts. Foreign CEOs also have a higheraversion to sure losses than US CEOs. The only place that
9 US CEOs and CFOs both tend to be taller (though this could be
because of a native population height differential).
Please cite this article as: Graham, J.R., et al., Managerial attitu(2013), http://dx.doi.org/10.1016/j.jfineco.2013.01.010i
we find significant difference between US and non-US CEOsthat does not hold in CFOs relates to educational background.US CEOs are less likely to have an MBA than their non-UScounterparts, but US CFOs are more likely to have an MBAthan their non-US counterparts.
Again, we need to be careful in drawing conclusionssince these comparisons are unconditional. Hence, werecalculate the differences in characteristics of US CEOs tonon-US CEOs after matching for whether the company ispublic or private. Panel B of Table 3, column 2 shows thatthe results are similar when matching by public versusprivate status. We separately match by size in column 3.After matching, we find the results that are robust to allthree sampling methods are that US CEOs are less risk-averse, more optimistic, and less averse to sure losses. Theresults suggest that US CEOs tend to be very different interms of their attitudes from non-US CEOs.
We conduct a similar exercise in Panel C of Table 3where we examine the differences in US CFOs as com-pared to non-US CFOs matching by private/public statusand by size. We find that similar to the difference inattitudes between US CEOs and non-US CEOs, US CFOs areless risk-averse, more optimistic, and more patient thantheir non-US counterparts. In addition US CFOs are morelikely to have an MBA degree.
In all, our results suggest that CEOs, particularly in theUS, tend to possess certain personal traits, which may wellbe an integral part of having what it takes to become a CEOand/or to operate effectively as a chief executive. Our resultssuggest the importance of personality traits in occupationalchoice, an area where there has been relatively littleevidence [an exception is Puri and Robinson (2007, inpress.]. Further, the differences we find in US CEOs, andnon-US CEOs’ attitudes may help explain why corporateobjectives and behavior differ across countries, a subject ofsome debate (see, e.g., Allen, 2005).
3.2. Firm characteristics
The summary statistics indicate that the median firmhas two operating segments and has experienced medianhistorical sales growth of 12%. The median debt-to-assetsratio is 20%, and the short-term debt to total debt ratio is11%.10 The mean (median) number of acquisitions overthe past two years is 0.7 (0). Performance-sensitivecompensation (stock, options, bonus) accounts for about37% of the total compensation of the average executive inour sample, and salary accounts for about 57%, with therest composed of ‘other’ compensation. Note that ouranalysis is based primarily on self-reported survey data.Table 1, Panel B reports the same information for publicfirms only. Since we have only 90 public firms, the sample
fraction of debt ratio are changed to percentages; number of acquisitions
at 100 (next highest is 26) are dropped (three observations); and where
the total of stock, option, bonus, salary, and other compensation is
outside the range of 90–110% of total compensation (15 observations),
we treat these as missing.
des and corporate actions. Journal of Financial Economics

Ta
ble
4C
orr
ela
tio
nT
ab
le.
Th
ista
ble
rep
ort
sth
eco
rre
lati
on
sb
etw
ee
nb
oth
firm
an
de
xe
cuti
ve
cha
ract
eri
stic
sfo
ro
ur
ma
ina
na
lysi
ssa
mp
leo
fU
SC
EO
s.O
ldis
ad
um
my
va
ria
ble
for
ex
ecu
tiv
es
old
er
tha
nth
em
ed
ian
of
the
surv
ey
ex
ecu
tiv
es.
Te
nu
reis
con
sid
ere
dlo
ng
ifth
ee
xe
cuti
ve
ha
sb
ee
nin
the
po
siti
on
for
lon
ge
rth
an
the
me
dia
nle
ng
tho
fo
ffice
inth
esa
mp
leo
fU
SC
EO
s.P
rest
igio
us
coll
eg
eis
ad
um
my
for
ex
ecu
tiv
es
wh
ost
ud
ied
at
a
US
un
ive
rsit
yw
ith
av
era
ge
SA
Tsc
ore
sin
the
fou
rth
qu
art
ile
of
the
surv
ey
sam
ple
.La
rge
firm
isa
du
mm
yfo
rfi
rms
rep
ort
ed
toh
av
em
ore
tha
n$
1B
insa
les.
Ta
llis
ad
um
my
va
ria
ble
for
ma
lee
xe
cuti
ve
so
ve
r5
fee
t1
0in
che
sa
nd
fem
ale
ex
ecu
tiv
es
ov
er
5fe
et
4in
che
s.O
the
rv
ari
ab
les
are
de
fin
ed
as
inT
ab
le2
.S
ign
ifica
nce
at
the
10
%le
ve
lis
de
no
ted
by
n,
5%
by
nn,
an
d1
%b
ynnn.
Hig
hly
risk
-
av
ers
e
Ve
ry
op
tim
isti
c
Av
ers
eto
sure
loss
es
Imp
ati
en
tM
BA
Ma
leT
all
Focu
sed
infi
n.
&a
cc.
Old
Pu
bli
cP
rest
igio
us
coll
eg
e
Pre
stig
iou
s
coll
eg
e
His
tori
cal
gro
wth
Ve
ryo
pti
mis
tic
�0
.01
3
Av
ers
eto
sure
loss
es
0.0
02
0.0
38
Imp
ati
en
t0
.03
9�
0.0
17
0.0
83nn
MB
A�
0.0
41
0.0
10
�0
.07
3nn�
0.0
50
Ma
le�
0.0
04
�0
.04
7�
0.0
06
�0
.09
3nnn
0.0
48
Ta
ll�
0.0
31
0.0
34
0.0
36
0.0
13
0.0
20
0.0
06
Focu
sed
infi
n.
&a
cc.
0.0
36
�0
.03
6�
0.0
14
�0
.08
2nn
0.1
72nnn
0.0
64nn�
0.0
20
Old
0.1
24nnn
0.0
14
�0
.06
8nn�
0.0
40
�0
.13
9nnn
0.0
81nn�
0.0
13
�0
.05
1
Pu
bli
c0
.01
50
.00
10
.00
7�
0.0
41
0.0
05
�0
.00
00
.00
0�
0.0
12
0.0
20
Pre
stig
iou
sco
lle
ge
�0
.01
1�
0.0
14
�0
.02
7�
0.0
66
0.0
42
�0
.11
9nnn
0.0
03
�0
.04
0�
0.0
75nn
0.0
07
4$
1B
Firm
�0
.00
60
.02
10
.00
7�
0.0
11
�0
.02
40
.03
7�
0.0
15
0.0
05
0.0
50
0.3
87nnn�
0.0
42
His
tori
cal
gro
wth
�0
.02
4nnn
0.0
05
0.0
35
0.0
58
0.0
65
�0
.01
90
.02
3nnn�
0.0
51nn
�0
.15
3nnn�
0.0
62nnn�
0.0
26
�0
.05
6n
Sto
cko
wn
ers
hip
0.0
46
0�
0.0
05
0.0
8nn
0.0
42
�0
.07
6nn
0.0
43
�0
.05
30
.00
2�
0.2
91nnn
0.1
07nnn
�0
.19
5nnn
0.1
09nnn
J.R. Graham et al. / Journal of Financial Economics ] (]]]]) ]]]–]]] 11
is somewhat sparse. As expected, the public companiesare bigger with mean sales revenue of $2.37 billion, 2.5operating segments, median sales growth of 8.5%, andmedian debt-to-assets ratio of 25%. Performance-sensitivecompensation accounts for about 52% of compensation forthese public firms. Given that companies do not have toidentify themselves in our survey, we cannot directlymatch all these 90 public firms with Compustat. None-theless, we do some benchmarking of our companies tothe universe of companies in Compustat.
Table 4 reports the correlations between both firm andexecutive characteristics for the US CEOs. Some of thecorrelations are interesting, and some are intuitive. Forexample, older CEOs are less risk-tolerant. CEOs withMBAs are younger and tend to have a career path infinance or accounting. As might be expected, older CEOstend to work in larger firms, the prestige of the collegefrom which they graduate matters less, and they are morelikely to be male.
We also look at whether there are differences in theway CEOs of private firms are compensated as comparedto CEOs of public firms. Breaking down our data, weobserve that CEOs of private firms obtain, on average,57.1% of their compensation from salary, as compared to44.6% received by CEOs of public firms (as shown inTable 1). In general, though, CEOs of private firms havea larger equity stake in their firm. In response to thequestion, ‘‘if all options were vested and exercised, whatpercent of your company’s common stock would you own(e.g., 5%),’’ CEOs of private firms have an average owner-ship of 33.9% as compared to 5.4% held by CEOs ofpublic firms.
Following the recommendation by List (2007), webenchmark to Compustat, a frequently used database forcorporate finance research. We examine sales, debt-to-assets, and other variables as shown in Appendix TableA1. Briefly, our sales comparison indicates that oursample firms are smaller than the typical Compustat firm,with two-fifths of our sample falling in the smallestCompustat quintile. This is not surprising given that88.5% of our sample is comprised of private firms,while Compustat only contains public firms. When werestrict the comparison to public firms in our sampleonly (see Table A2), the size discrepancy is less marked,with only 11.4% of sample firms falling in the smallestCompustat quintile. With this subset, 58.2% of ourpublicly listed sample firms fall within the third andfourth largest Compustat quintile. The survey responsesample is fairly representative of the Compustat universein terms of debt/assets, debt maturity, and historicalgrowth.
We also check the self-reported responses of compa-nies against the actual entries in Compustat for the firmsthat we can identify. There are 64 Compustat firms thatwe can identify in our data with self-reported leverageratio. We find that the average self-reported debt/assetratio for publicly listed firms was 24.4% with a standarddeviation of 22.8. Average Computstat total debt/assetratio for the same set of firms is 28.2% with a standarddeviation of 26.7. The mean difference (self-reportedminus Compustat debt ratio) is �3.8%, with a t-stat of
Please cite this article as: Graham, J.R., et al., Managerial attitudes and corporate actions. Journal of Financial Economics(2013), http://dx.doi.org/10.1016/j.jfineco.2013.01.010i
J.R. Graham et al. / Journal of Financial Economics ] (]]]]) ]]]–]]]12
�1.00. Therefore, the difference between self-reportedand Compustat debt ratios is not statistically significant.11
12 The survey design allows us to test whether these results hold for
the subset of CEOs who believe they are the dominant M&A decision-
3.3. Are CEO traits related to corporate decisions?
We now study the traits of managers and whetherthey relate to corporate actions. We also analyze howmanagers’ traits correlate with the compensationpackages that they receive.
We first investigate whether CEO characteristics areassociated with capital structure choices. Table 5, Panel Aexamines univariate correlations between capital structureand CEO traits as well as company characteristics. In termsof what is related to the debt ratio (total debt/total assets),in the univariate comparisons the only significant char-acteristics are the past career path of the CEO and whetherthe CEO is male. If the CEO’s past experience is primarily inthe finance/accounting arena, then the firm uses signifi-cantly more total debt. In particular, of the CEOs who haveprior experience in finance/accounting, 52% lead compa-nies that have a high debt ratio (i.e., above the samplemean). Of the CEOs with nonfinancial backgrounds, only37% lead in companies with a high debt ratio.
Next, we examine debt maturity. As can be seen in theunivariate analysis in Table 5, Panel A, males, optimists,and executives from private companies are more likely touse a higher proportion of short-term debt. Theories suchas Landier and Thesmar’s (2009) suggest that optimistsare more likely to take on short-term debt. Our results areconsistent with this implication and the optimism effectis highly significant. Similarly, if the male gender corre-sponds to being overconfident (Barber and Odean, 2001),the relation we find between short-term debt and genderis consistent with overconfidence leading to more short-term debt usage.
We next examine debt ratios and debt maturity in amultivariate setting (see Table 5, Panel B). In the regres-sions, we include executive behavioral characteristics aswell as controls for demographic and career-related vari-ables. We also include firm controls for size and public/private as well as industry controls, as these can poten-tially affect leverage choices. The results are similar tothose seen in the univariate analysis, though the signifi-cance is not always as strong. In particular, the multi-variate regressions show that behavioral characteristicsmatter for total debt as well as debt maturity. We finddebt maturity is significantly related to optimism, aftercontrolling for other factors. As can be seen in column 2,Table 5, Panel B, optimism is highly significant at 5%. Theresults suggest that if a firm has a highly optimistic CEO, itis likely to have more debt, in particular more short-termdebt; the increased marginal impact of a very optimisticCEO on short-term debt ratio is 3.6%.
11 We also check for the same company for which both the CEO and
CFO respond whether they give the same response for ‘‘how many
material acquisitions have you had in the last 2 years?’’ There were two
companies in the database where we had both CEO and CFOs respond-
ing. For both of these companies, both the CEO and CFO report zero
acquisitions.
Please cite this article as: Graham, J.R., et al., Managerial attitu(2013), http://dx.doi.org/10.1016/j.jfineco.2013.01.010i
CEO traits have often been thought to be important inmerger and acquisition activity. CEOs themselves claim tobe the dominant decision-maker in M&A decisions(Graham, Harvey, and Puri, 2012). Accordingly, we firstexamine whether the number of acquisitions made by acompany is related to managerial characteristics. There isa large literature characterizing the effects of acquisitions,but much of this literature pertains to public companies,whereas our sample consists largely of private companies.It is not necessary that the motivation for public compa-nies is the same as that for private companies. Table 5,Panel A examines whether a company makes any acquisi-tions over the previous two years. The univariate analysissuggests that CEOs who are more risk-tolerant are morelikely to make acquisitions. In addition, we find that largefirms and public firms are more likely to make suchacquisitions, which is intuitive. We also find that whenthe CEO displays aversion to sure losses, then s/he is morelikely to make acquisitions.
Table 5, Panel B, column 3 presents the results of alogit analysis in which the dependent variable equals oneif the company makes any acquisitions and zero other-wise. Among the behavioral characteristics, we find thatthe effect of the CEO’s personal risk-aversion is verysignificant. More risk-tolerant CEOs are more likely tomake acquisitions.12 From the coefficients in Table 5,Panel B, the marginal effect is a 24.6% lower probabilityof making an acquisition for highly risk-averse CEOs. Thisinteresting result is consistent with the idea that CEOcharacteristics matter in acquisition activity, which hasbeen theorized since Roll (1986) (see also Malmendierand Tate, 2008).
We additionally perform an ordered logit analysis.Table 5, Panel B, column (4) presents the results when asingle acquisition is made, and when multiple acquisi-tions are made. We also perform the regression usingordinary least squares (OLS) and a continuous dependentvariable: log of the number of acquisitions (Table 5, PanelB, column 5). Given our question asks whether CEOs havemade any material acquisitions in the last two years, itmakes sense to restrict our regressions to CEOs with atleast two years of tenure. Very few CEOs in our samplehave tenure of less than two years. The number ofobservations for the full sample is 545 compared to 509for CEOs with at least two years of tenure. We perform theregression for the full sample of CEOs as well as for thosewith at least two years of tenure and find very similarresults. For brevity, we report only the results with CEOsof greater than two years tenure in the tables. As can beseen from Table 5, the ordered logit yields very similarresults to the earlier tests. Risk-tolerant CEOs are more
maker. For this purpose, we use the question ‘‘Amongst the management
team, who has most of the input in mergers and acquisitions?’’ The CEO
is given a 7-point scale, where 1 represents ‘‘I make decision without
help from others,’’ 7 represents ‘‘others make decisions,’’ and the
midpoint is ‘‘share decision equally with others.’’ In unreported analysis,
we rerun our previous regressions using only the subset of CEOs who
scored themselves highly on making the decisions by themselves. We
find qualitatively similar results in this subsample.
des and corporate actions. Journal of Financial Economics

Table 5Do CEO and/or firm characteristics affect corporate policies?
Panel A looks at how certain executive and firm characteristics affect corporate policies on capital structure and M&A in the sample of US CEO survey respondents. Debt ratio and short-term debt are defined to
be high if they are above the mean of the survey sample of US CEOs. Mergers and acquisitions reflect the merger and acquisition behavior within the last two years for firms which have US CEO survey
representation. Acquisitions Z1 is an indicator for firms with M&A activity. Numbers in each column reflect the percentage of US CEOs, among the ones displaying / not displaying the trait at the top, who also
reflect the characteristic at the left. For example, of those with available data, 41% of males and 29% of females were associated with high debt ratios. Other variables are defined as in Table 2. Significance is
between the sample that exhibits firm/executive trait and the sample that does not exhibit the trait. Significance at the 10% level is denoted by *, 5% by **, and 1% by ***.
Panel B reports the regression analysis of firm/executive characteristics on corporate decisions with respect to M&A and capital structure for CEOs with at least 3 years of tenure. Specification 3 uses a binary
dependent variables and therefore uses both a logit and a marginal effect logit specification to calculate the contribution of each firm/executive characteristic to the probability of the left-hand side event.
Specification 4 uses a categorical variable on acquisitions that distinguishes firms with no acquisitions (acqcat¼0), one acqusition (acqcat¼1), and more than one acquisition (acqcat¼2), and runs an ordered
logit model. Industry dummy variables are used. The ten industry classifications used in the survey are: Retail / Wholesale, Mining/Construction, Manufacturing, Transportation/Energy, Communications/Media,
Tech, Banking, Service/Consulting, Healthcare, and Others. For debt regressions, debt ratio and short-term debt are defined to be high if they are above the mean of the survey sample of US CEOs. Only US CEOs
are included in the regressions. All specifications include the following controls: binary indicator variables for gender, height, whether the CEO has an MBA, finance/accounting background, age, whether the firm
is public, whether the CEO went to a prestigious college, firm size 4$1 B, and past three years revenue growth of the firm. A constant term is also included in all relevant specifications. Significance at the 10%
level is denoted by *, 5% by **, and 1% by ***, with z-stats reported in parentheses.
Panel A: Firm/executive traits and corporate policies
Highly risk
averse
Very
optimistic
Averse to
sure losses
Impatient MBA Gender Tall Fin / acc
focused
Old Firm
type
Prestigious
college
Small
firm
High Low Yes No Yes No Yes No Yes No Male Female Yes No Yes No Yes No Public Private Yes No Yes No
High debt ratio 33 41 41 35 38 40 38 41 39 39 41 29* 39 42 52 37*** 39 40 47 40 39 42 39 51*
# Observations 808 797 794 808 735 809 806 796 809 713 682 809
High short-term debt 26 34 35 24*** 28 33 34 33 30 34 34 17*** 32 36 36 32 35 30 25 34* 29 35 33 28
# Observations 802 792 788 802 731 804 801 790 803 711 677 803
Acquisition¼0 74 65* 65 66 56 67* 65 66 68 65 66 65 66 65 70 65 66 66 47 67*** 71 65* 68 40***
# Observations 869 857 849 869 790 870 865 856 868 765 728 867
AcquisitionsZ1 26 35* 35 34 44 33* 35 34 32 35 34 35 34 35 30 35 34 34 53 33*** 29 35* 32 60***
# Observations 869 857 849 869 790 870 865 856 868 765 728 867
Panel B: Regression Analysis of corporate polices on executive traits
OLSLogit Ordered Logit OLS
1 2 3 45
All CEOs for debt regressions CEO Tenure at least 2 years for acquisition regressions
High debt ratio High short term debt ratioMade acquisitions No acquisitions vs. 1 acquisition vs. more than 1 acquisition
Ln (Acqþ1)
Coefficients Coefficients Coefficients Marginal effects Coefficients Marginal effects (acqcat¼1/acqcat¼2) Coefficients
Highly risk-averse 0.004 �0.016 �1.108** �0.246** �1.160** �0.257 **/�0.275** �0.168**
(0.09) (0.69) (2.44) (2.46) (2.44) (1.99)
Very optimistic 0.049* 0.036** 0.152 0.034 0.120 0.035/0.038 0.027
(1.80) (2.36) (0.56) (0.56) (0.43) (0.45)
Averse to sure losses 0.043 0.045 0.386 0.085 0.591 0.089/0.096 0.143
(1.13) (1.39) (1.15) (1.15) (1.63) (1.56)
Impatient 0.029 0.016 �0.173 �0.039 �0.137 �0.040/�0.043 �0.051
(1.10) (1.14) (0.76) (0.76) (0.63) (1.01)
Ple
ase
citeth
isa
rticlea
s:G
rah
am
,J.R.,e
ta
l.,Ma
na
ge
rial
attitu
de
sa
nd
corp
ora
tea
ction
s.Jou
rna
lo
fFin
an
cial
Eco
no
mics
(20
13
),h
ttp://d
x.d
oi.o
rg/1
0.1
01
6/j.jfi
ne
co.2
01
3.0
1.0
10
i
J.R.
Gra
ha
met
al.
/Jo
urn
al
of
Fina
ncia
lE
con
om
ics]
(]]]])]]]–
]]]1
3

Ta
ble
5(c
on
tin
ued
)
Pa
nel
B:
Reg
ress
ion
An
aly
sis
of
corp
ora
tep
oli
ces
on
exec
uti
ve
tra
its
OLS
Log
itO
rde
red
Log
itO
LS
12
34
5
All
CE
Os
for
de
bt
reg
ress
ion
sC
EO
Te
nu
rea
tle
ast
2y
ea
rsfo
ra
cqu
isit
ion
reg
ress
ion
s
Hig
hd
eb
tra
tio
Hig
hsh
ort
term
de
bt
rati
oM
ad
ea
cqu
isit
ion
sN
oa
cqu
isit
ion
sv
s.1
acq
uis
itio
nv
s.m
ore
tha
n1
acq
uis
itio
nLn
(Acqþ
1)
Co
effi
cie
nts
Co
effi
cie
nts
Co
effi
cie
nts
Ma
rgin
al
eff
ect
sC
oe
ffici
en
tsM
arg
ina
le
ffe
cts
(acq
cat¼
1/a
cqca
t¼2
)C
oe
ffici
en
ts
Co
ntr
ol
va
ria
ble
sY
es
Ye
sY
es
Ye
sY
es
Ind
ust
ryd
um
mie
sY
es
Ye
sY
es
Ye
sY
es
N5
07
50
35
04
50
45
04
w2(d
f)fo
rLo
git
/R-s
qu
are
dfo
rO
LS1
1.9
4%
7.2
6%
39
.82
(21
)5
0.7
8(2
1)
13
.05
%
P-v
alu
eo
0.0
1o
0.0
1o
0.0
1o
0.0
1o
0.0
1
Pse
ud
oR
-sq
ua
red
11
.94
%7
.26
%8
.1%
7.3
0%
13
.05
%
Please cite this article as: Graham, J.R., et al., Managerial attitu(2013), http://dx.doi.org/10.1016/j.jfineco.2013.01.010i
J.R. Graham et al. / Journal of Financial Economics ] (]]]]) ]]]–]]]14
likely to undertake an acquisition. We find similar resultsin the OLS regression. Our main result is that CEOs whoare more risk-loving are more likely to make acquisitions,and a larger number of acquisitions.
Overall, our results suggest that capital structureactions, both total debt and debt maturity, as well asacquisition activity are associated with CEO traits and thekind of career experience that managers have had inthe past.
3.4. CEO traits and firm growth
Caution needs to be exercised when interpreting theresults in Section 3.3 because of potential reverse caus-ality. There are two kinds of issues. First, do traits persistover time or does previous performance affect traits?Given the cross-sectional nature of our data, it is hard toaddress this directly, though to the extent possible, weintroduce controls for past performance (historicalgrowth) in our regressions. More broadly, however, otherstudies have found that optimism, in particular, is a traitthat persists across time within individuals. Landier andThesmar (2009) use panel data on French entrepreneursto show (among other things) that optimism persists overtime. Similarly, Kaniel, Massey, and Robinson (2010)report findings from LOT-R results taken among a sampleof US MBA students at two points in time: once at thebeginning of the educational program and again towardsthe end of the two-year degree and find little change inLOT-R results over this time horizon. These and otherstudies suggest that at least a component of the psycho-logical variables we measure is likely to be fixed (orchanging very slowly) over time. A second issue is thatwe are unable to distinguish whether managers withparticular characteristics take certain corporate actionsfrom whether managers with such characteristics select(or, are selected into) companies with prevalent debt oracquisition activity. Our results are consistent with eitherexplanation.
Table 6, Panel A examines the historical annual salesgrowth, as well as the future annual sales growth asanticipated by the CEO. The univariate tests indicate thatrisk-tolerant CEOs are more likely to work in companieswith high historical and high expected growth. Further,young CEOs, tall ‘‘confident’’ chief executives, and CEOswho do not have finance/accounting backgrounds aremore likely to work for high-growth companies. The chiefexecutives who work in firms with high historic growthare less likely to have attended prestigious colleges. CEOswith an MBA are more likely to work for companies withhigh anticipated growth. If we interpret height as ameasure of confidence, our results are consistent with amatching story in which young, confident, risk-tolerantCEOs are more likely to work for high-growth companies.Similar patterns hold for firms with high anticipatedfuture growth. These intriguing results are generallyconsistent with these kinds of CEOs choosing to workfor growth companies, or at least companies with poten-tial for future growth.
Table 6, Panel B, column 1, presents the results of alogit regression in which the dependent variable is one if
des and corporate actions. Journal of Financial Economics
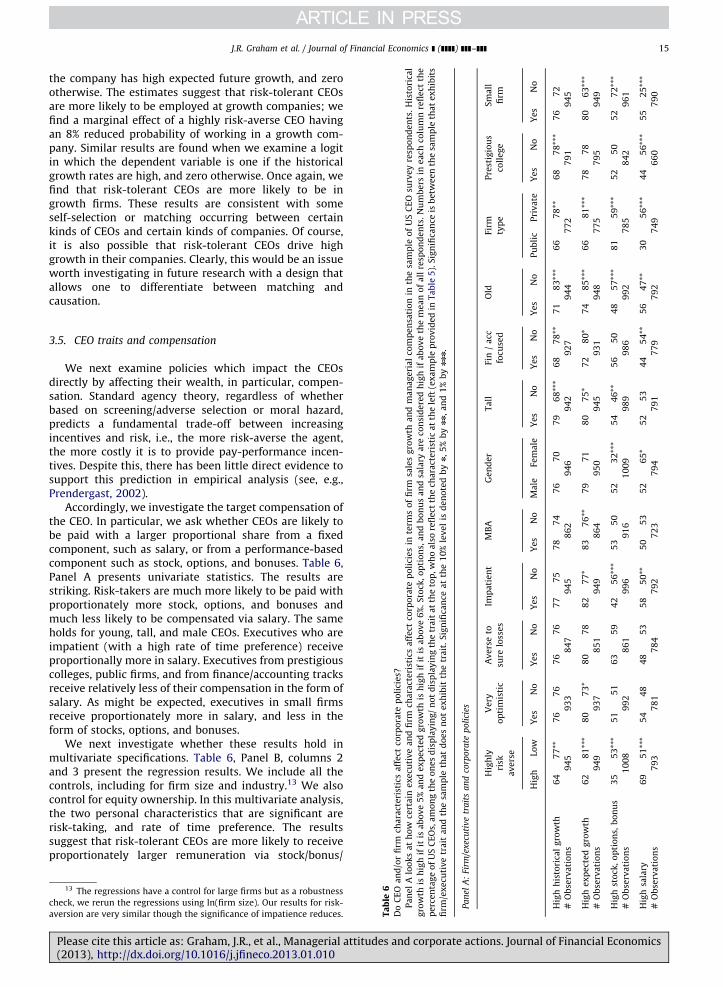
ion
inth
esa
mp
leo
fU
SC
EO
surv
ey
resp
on
de
nts
.H
isto
rica
l
ea
no
fa
llre
spo
nd
en
ts.
Nu
mb
ers
ine
ach
colu
mn
refl
ect
the
inT
ab
le5
).S
ign
ifica
nce
isb
etw
ee
nth
esa
mp
leth
at
ex
hib
its
Old
Firm
typ
e
Pre
stig
iou
s
coll
eg
e
Sm
all
firm
es
No
Pu
bli
cP
riv
ate
Ye
sN
oY
es
No
18
3**
*6
67
8**
68
78
***
76
72
94
47
72
79
19
45
48
5**
*6
68
1**
*7
87
88
06
3**
*
94
87
75
79
59
49
85
7**
*8
15
9**
*5
25
05
27
2**
*
99
27
85
84
29
61
64
7**
30
56
***
44
56
***
55
25
***
79
27
49
66
07
90
J.R. Graham et al. / Journal of Financial Economics ] (]]]]) ]]]–]]] 15
the company has high expected future growth, and zerootherwise. The estimates suggest that risk-tolerant CEOsare more likely to be employed at growth companies; wefind a marginal effect of a highly risk-averse CEO havingan 8% reduced probability of working in a growth com-pany. Similar results are found when we examine a logitin which the dependent variable is one if the historicalgrowth rates are high, and zero otherwise. Once again, wefind that risk-tolerant CEOs are more likely to be ingrowth firms. These results are consistent with someself-selection or matching occurring between certainkinds of CEOs and certain kinds of companies. Of course,it is also possible that risk-tolerant CEOs drive highgrowth in their companies. Clearly, this would be an issueworth investigating in future research with a design thatallows one to differentiate between matching andcausation.
or
firm
cha
ract
eri
stic
sa
ffe
ctco
rpo
rate
po
lici
es?
ks
at
ho
wce
rta
ine
xe
cuti
ve
an
dfi
rmch
ara
cte
rist
ics
aff
ect
corp
ora
tep
oli
cie
sin
term
so
ffi
rmsa
les
gro
wth
an
dm
an
ag
eri
al
com
pe
nsa
t
hif
itis
ab
ov
e5
%a
nd
ex
pe
cte
dg
row
this
hig
hif
itis
ab
ov
e6
%.
Sto
ck,
op
tio
ns,
an
db
on
us
an
dsa
lary
are
con
sid
ere
dh
igh
ifa
bo
ve
the
m
fU
SC
EO
s,a
mo
ng
the
on
es
dis
pla
yin
g/
no
td
isp
lay
ing
the
tra
ita
tth
eto
p,w
ho
als
ore
fle
ctth
ech
ara
cte
rist
ica
tth
ele
ft(e
xa
mp
lep
rov
ide
d
etr
ait
an
dth
esa
mp
leth
at
do
es
no
te
xh
ibit
the
tra
it.
Sig
nifi
can
cea
tth
e1
0%
lev
el
isd
en
ote
db
yn
,5
%b
ynn
,a
nd
1%
bynnn
.
m/e
xecu
tiv
etr
ait
sa
nd
corp
ora
tep
oli
cies
Hig
hly
risk
av
ers
e
Ve
ry
op
tim
isti
c
Av
ers
eto
sure
loss
es
Imp
ati
en
tM
BA
Ge
nd
er
Ta
llFi
n/
acc
focu
sed
Hig
hLo
wY
es
No
Ye
sN
oY
es
No
Ye
sN
oM
ale
Fem
ale
Ye
sN
oY
es
No
Y
ica
lg
row
th6
47
7**
76
76
76
76
77
75
78
74
76
70
79
68
***
68
78
**7
ion
s9
45
93
38
47
94
58
62
94
69
42
92
7
ted
gro
wth
62
81
***
80
73
*8
07
88
27
7*
83
76
**7
97
18
07
5*
72
80
*7
ion
s9
49
93
78
51
94
98
64
95
09
45
93
1
op
tio
ns,
bo
nu
s3
55
3**
*5
15
16
35
94
25
6**
*5
35
05
23
2**
*5
44
6**
56
50
4
ion
s1
00
89
92
86
19
96
91
61
00
99
89
98
6
69
51
***
54
48
48
53
58
50
**5
05
35
26
5*
52
53
44
54
**5
ion
s7
93
78
17
84
79
27
23
79
47
91
77
9
3.5. CEO traits and compensationWe next examine policies which impact the CEOsdirectly by affecting their wealth, in particular, compen-sation. Standard agency theory, regardless of whetherbased on screening/adverse selection or moral hazard,predicts a fundamental trade-off between increasingincentives and risk, i.e., the more risk-averse the agent,the more costly it is to provide pay-performance incen-tives. Despite this, there has been little direct evidence tosupport this prediction in empirical analysis (see, e.g.,Prendergast, 2002).
Accordingly, we investigate the target compensation ofthe CEO. In particular, we ask whether CEOs are likely tobe paid with a larger proportional share from a fixedcomponent, such as salary, or from a performance-basedcomponent such as stock, options, and bonuses. Table 6,Panel A presents univariate statistics. The results arestriking. Risk-takers are much more likely to be paid withproportionately more stock, options, and bonuses andmuch less likely to be compensated via salary. The sameholds for young, tall, and male CEOs. Executives who areimpatient (with a high rate of time preference) receiveproportionally more in salary. Executives from prestigiouscolleges, public firms, and from finance/accounting tracksreceive relatively less of their compensation in the form ofsalary. As might be expected, executives in small firmsreceive proportionately more in salary, and less in theform of stocks, options, and bonuses.
We next investigate whether these results hold inmultivariate specifications. Table 6, Panel B, columns 2and 3 present the regression results. We include all thecontrols, including for firm size and industry.13 We alsocontrol for equity ownership. In this multivariate analysis,the two personal characteristics that are significant arerisk-taking, and rate of time preference. The resultssuggest that risk-tolerant CEOs are more likely to receiveproportionately larger remuneration via stock/bonus/
Ta
ble
6D
oC
EO
an
d/
Pa
ne
lA
loo
gro
wth
ish
ig
pe
rce
nta
ge
o
firm
/ex
ecu
tiv
Pa
nel
A:
Fir
Hig
hh
isto
r
#O
bse
rva
t
Hig
he
xp
ec
#O
bse
rva
t
Hig
hst
ock
,
#O
bse
rva
t
Hig
hsa
lary
#O
bse
rva
t
13 The regressions have a control for large firms but as a robustness
check, we rerun the regressions using ln(firm size). Our results for risk-
aversion are very similar though the significance of impatience reduces.
Please cite this article as: Graham, J.R., et al., Managerial attitudes and corporate actions. Journal of Financial Economics(2013), http://dx.doi.org/10.1016/j.jfineco.2013.01.010i
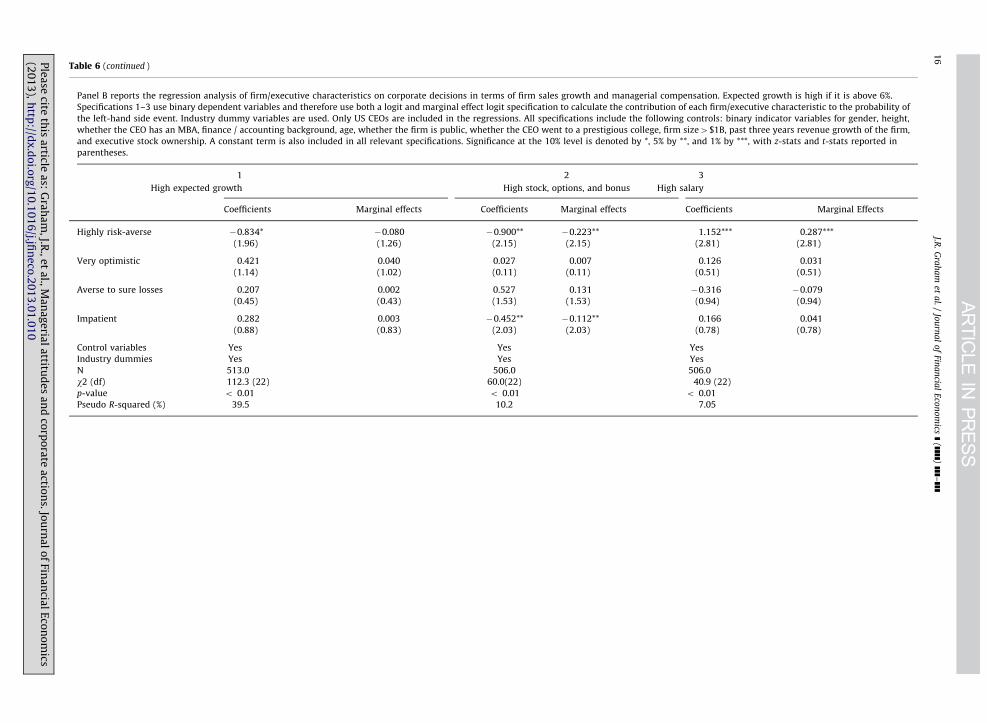
Table 6 (continued )
Panel B reports the regression analysis of firm/executive characteristics on corporate decisions in terms of firm sales growth and managerial compensation. Expected growth is high if it is above 6%.
Specifications 1–3 use binary dependent variables and therefore use both a logit and marginal effect logit specification to calculate the contribution of each firm/executive characteristic to the probability of
the left-hand side event. Industry dummy variables are used. Only US CEOs are included in the regressions. All specifications include the following controls: binary indicator variables for gender, height,
whether the CEO has an MBA, finance / accounting background, age, whether the firm is public, whether the CEO went to a prestigious college, firm size4$1B, past three years revenue growth of the firm,
and executive stock ownership. A constant term is also included in all relevant specifications. Significance at the 10% level is denoted by *, 5% by **, and 1% by ***, with z-stats and t-stats reported in
parentheses.
1 2 3
High expected growth High stock, options, and bonus High salary
Coefficients Marginal effects Coefficients Marginal effects Coefficients Marginal Effects
Highly risk-averse �0.834* �0.080 �0.900** �0.223** 1.152*** 0.287***
(1.96) (1.26) (2.15) (2.15) (2.81) (2.81)
Very optimistic 0.421 0.040 0.027 0.007 0.126 0.031
(1.14) (1.02) (0.11) (0.11) (0.51) (0.51)
Averse to sure losses 0.207 0.002 0.527 0.131 �0.316 �0.079
(0.45) (0.43) (1.53) (1.53) (0.94) (0.94)
Impatient 0.282 0.003 �0.452** �0.112** 0.166 0.041
(0.88) (0.83) (2.03) (2.03) (0.78) (0.78)
Control variables Yes Yes Yes
Industry dummies Yes Yes Yes
N 513.0 506.0 506.0
w2 (df) 112.3 (22) 60.0(22) 40.9 (22)
p-value o 0.01 o 0.01 o 0.01
Pseudo R-squared (%) 39.5 10.2 7.05
Ple
ase
citeth
isa
rticlea
s:G
rah
am
,J.R.,e
ta
l.,Ma
na
ge
rial
attitu
de
sa
nd
corp
ora
tea
ction
s.Jou
rna
lo
fFin
an
cial
Eco
no
mics
(20
13
),h
ttp://d
x.d
oi.o
rg/1
0.1
01
6/j.jfi
ne
co.2
01
3.0
1.0
10
i
J.R.
Gra
ha
met
al.
/Jo
urn
al
of
Fina
ncia
lE
con
om
ics]
(]]]])]]]–
]]]1
6

J.R. Graham et al. / Journal of Financial Economics ] (]]]]) ]]]–]]] 17
options and less via salary. Coefficient estimates fromcolumn 2 show the marginal effect of a highly risk-averseCEO is a decrease of 22.3% of having a high proportion ofstock options and bonuses in total compensation. Execu-tives who display high levels of impatience, demanding ahigh return to defer gains, are much more likely to becompensated with a proportionately smaller stock/options/bonus component.
These results are intuitive and are consistent withexecutives who possess certain characteristics matchingwith companies that offer the kind of compensationpackages they prefer. Whether executives choose theirpackage or the company tailors it to the kind of individualthey are trying to recruit, the evidence is consistent withsome matching that focuses on certain managerial andfirm characteristics. This is an important result for anumber of reasons. First, in the context of the compensa-tion literature, firms typically undertake costly incentiveschemes to induce managers to take on risk. The cost ofgiving appropriate risk-taking incentives is higher if theCEO is risk-averse (Ross, 2004). Our results are consistentwith there being a match of CEO risk-aversion to thecompensation package in a way that might make thecompensation incentive components less costly, by givingperformance-based pay to those CEOs who are morewilling to take on risk. Second, standard contractingmodels predict that the amount of risk the CEO bears inthe optimal contract and the expected wage paymentdepends on his or her risk-aversion. While there is a largecompensation literature examining the determinants ofcompensation structure, this literature has typicallyexamined firm-level variables, such as firm size andindustry, to explain compensation structure (see, e.g.,Murphy, 1999). Our results provide new evidence relatingrisk-aversion of managers to compensation.
As mentioned above, there is scarce empirical evidenceof a trade-off between incentives and risk in compensa-tion contracts, despite the strong theoretical predictions(see, e.g., Prendergast, 2002). In several studies, firms withhigher volatility are even found to have higher pay-performance sensitivity, i.e., the opposite of the predictionfrom theory (see, e.g., Core and Guay (2002) or Kaplan andStromberg (2004)). Our finding that pay-performancesensitivity decreases with risk-aversion is, to our knowl-edge, one of the first direct pieces of evidence in favor ofthis theory. In addition, our findings suggest that differ-ences in time preferences are also important for explain-ing compensation patterns, which is consistent withstandard agency theory but is a prediction that is largelyignored in the literature. Finally, our finding that CEOsare, on average, much less risk-averse than the generalpopulation, fits nicely within this framework. Risk-aversion makes incentive pay costly, and increases theparticipation constraint of the manager. As a result, firmswould prefer to hire less risk-averse agents as managers,everything else equal.
We conduct several robustness tests to clarify inter-pretation of our results. For example, it is possible thatcertain kinds of CEOs, such as more optimistic CEOs, aremore likely to respond to our survey. First, we conductanother survey in which we ask CFOs how they perceive
Please cite this article as: Graham, J.R., et al., Managerial attitu(2013), http://dx.doi.org/10.1016/j.jfineco.2013.01.010i
CEOs (described in more detail in Section 3.3). CFOsoverwhelmingly perceive CEOs to be more optimistic thanthemselves, consistent with what we find in psychometrictests of CEOs. Second, in other studies, e.g., Brav, Graham,Harvey, and Michaely et al. (2005), there were twosamples—a conference participant (in-person) samplewith a high response rate, and an Internet survey with atypical, lower response rate. Both samples show verysimilar results, suggesting that selection bias is not adominant issue in surveys such as ours. Further, while wefind CEOs are generally more optimistic, within thesample we have a lot of cross-sectional variation incorporate policies and behavioral characteristics of CEOswhich we exploit in our tests. Finally, we have variablessuch as past growth as a control variable in the capitalstructure, acquisitions, and compensation regressions.This does not alter our results for the behavioral variables,in particular, for optimism and risk-aversion which arerobust.
4. Conclusions
We examine how US CEOs differ from the lay popula-tion, CFOs, and non-US chief executives. We assemble aunique database on sitting business executives in whichwe assess managers’ personality traits and attitudes usingwell-established methods that have been validated inpsychology and experimental economics as providing agood gauge of peoples’ attitudes. Our psychometric sur-vey not only quantifies behavioral traits of senior man-agers but also gathers information related to the careerpath, education, and demographic characteristics of themanagers.
We offer evidence that CEOs differ from both the laypopulation and CFOs. Interestingly, US-based CEOs alsodiffer in significant ways from their non-US counterparts,both in terms of career paths and attitudes, tending to bemore optimistic and less risk-averse, among other things.These differences in attitudes suggest one possible expla-nation for why US firms behave in some ways quitedifferently from non-US firms.
We focus on the two corporate decisions that CEOs feelthey have the most control over-acquisitions and capitalstructure. We find evidence that links psychological traitssuch as risk-aversion and optimism to corporate policies,in ways advocated by some theories. For example, morerisk-tolerant CEOs make more acquisitions and moreoptimistic CEOs use more short-term debt.
We also find an empirical link between managerialtraits such as risk-aversion with compensation structure,and pay-performance sensitivity. This result is consistentwith the theoretical work from standard agency theorybut direct evidence on this has been scarce. We also findthat managerial impatience and time preference alsoaffect their compensation structure in a way that mightbe expected by theory but which has received littleattention. Our results provide new evidence of a role forspecific behavioral traits, in particular, risk-aversion andtime-preference in the determination of compensationstructure.
des and corporate actions. Journal of Financial Economics

J.R. Graham et al. / Journal of Financial Economics ] (]]]]) ]]]–]]]18
Appendix A
Table A2Public Sample Firms.
Comparison of the survey sample of publicly listed firms under
management of US CEOs to the Compustat sample using survey variable
definitions. Variable definitions as in Table A1.
Sample
average
Sample
median
Compustat breakpoint
quintiles
1 2 3 4 5
Sales
Universe avg. 1.0 1.7 2.8 3.9 5.7
Sample avg. 3.5 3.0 1.0 2.0 3.0 4.7 6.6
Sample % 11.4 17.7 27.8 30.4 12.7
Debt/assets
Universe avg. 0.0 0.0 0.2 0.3 1.0
Sample avg. 0.3 0.3 0.0 0.1 0.2 0.3 0.7
Sample % 18.8 18.8 11.6 30.4 20.3
Short-erm debt/
total debt
Universe avg. 0.0 0.0 0.2 0.4 0.9
Sample avg. 0.2 0.2 0.0 0.0 0.2 0.4 0.9
Sample % 24.3 11.4 35.7 15.7 12.9
Payout ratio
Universe avg.
(%)
0.0 46.2
Sample avg.
(%)
19.1 5.0 0.0 36.7
Sample % 53.2 46.8
Credit rating
Universe avg. 4.7 5.8 6.8 7.3 8.4
Sample avg. 7.9 8.0 4.5 6.0 7.0 8.0 9.6
Sample % 7.7 17.3 13.5 23.1 38.5
Historical
growth
Universe avg. -0.2 0.0 0.1 0.2 1.7
Sample avg. 0.2 0.1 -0.1 0.0 0.1 0.2 0.7
Sample % 3.0 36.7 24.1 26.6 10.1
Table A1Comparison of the survey sample of the firms with US CEOs to the
Compustat sample.
The survey data are matched against the 2005 annual Compustat data
for consistency as our survey is conducted in early 2006, which should
reflect 2005 financials. Sales is surveyed by seven size categories.
Category 1 includes firms with sales less than $25 M, category 2 includes
firms with sales between $25 M and $99 M, category 3 includes firms
with sales between $100 M and $499 M, category 4 includes firms with
sales between $500 M and $999 M, category 5 includes firms with sales
between $1B and $4.9B, category 6 includes firms with sales between
$5B and $9.9B, and category 7 includes firms with $10B or above in sales.
Debt-to-assets ratio, short-term debt ratio, dividend yield, and historical
growth are reported by US CEO survey respondent.
Credit rating is the Standard and Poors (S&P) long-term domestic
issuer credit rating grouped into ten categories in order of increasing
credit ratings. Category 1 includes firms with credit ratings of D or
suspended, category 2 includes firms with ratings of C, or CI, category 3
includes firms with ratings of CC, category 4 includes firms with ratings
of CCC� , CCC, or CCCþ , category 5 includes firms with ratings of B� , B,
or Bþ , category 6 includes firms with ratings of BB� , BB, or BBþ ,
category 7 includes firms with ratings of BBB� , BBB, or BBBþ , category
8 includes firms with ratings of A� , A, or Aþ , category 9 includes firms
with ratings of AA-, AA, or AAþ , and category 10 includes firms with
ratings of AAA� or AAA.
Sample
average
Sample
median
Compustat breakpoint
quintiles
Variable 1 2 3 4 5
Sales
Universe avg. 1.0 1.7 2.8 3.9 5.7
Sample avg. 2.2 2.0 1.0 2.0 3.0 4.5 6.6
Sample % 40.6 26.8 20.4 9.3 2.9
Debt/assets
Universe avg. 0.0 0.0 0.2 0.3 1.0
Sample avg. 0.3 0.2 0.0 0.1 0.2 0.3 0.7
Sample % 19.8 17.2 16.3 22.7 24.1
Short-term debt/total debt
Universe avg. 0.0 0.0 0.2 0.4 0.9
Sample avg. 0.3 0.1 0.0 0.0 0.2 0.4 0.9
Sample % 25.9 11.7 28.2 18.7 15.5
Payout ratio
Universe avg. 0.0 55.6
Sample avg. 21.3 0.0 0.0 41.7
Sample % 50.2 49.8
Credit rating
Universe avg. 4.7 5.8 6.8 7.3 8.4
Sample avg. 8.4 9.0 3.6 6.0 7.0 8.0 9.6
Sample % 7.5 8.4 7.8 16.5 59.8
Historical growth
Universe avg. �0.2 0.0 0.1 0.2 1.7
Sample avg. 0.3 0.1 �0.2 0.0 0.1 0.2 1.0
Sample % 1.0 26.6 33.3 25.2 13.9
Please cite this article as: Graham, J.R., et al., Managerial attitudes and corporate actions. Journal of Financial Economics(2013), http://dx.doi.org/10.1016/j.jfineco.2013.01.010i
J.R. Graham et al. / Journal of Financial Economics ] (]]]]) ]]]–]]] 19
References
Agarwal, S., Driscoll, J., Gabaix, X., Laibson, D., 2009. The age of reason:financial decisions over the life cycle and implications for regulation.Brookings Papers on Economic Activity 2, 51–117.
Allen, F., 2005. Corporate governance in emerging economies. OxfordReview of Economic Policy 21 (2), 164–177.
Andrade, G., Mitchell, M., Stafford, E., 2001. New evidence andperspectives on mergers. Journal of Economic Perspectives 15,103–120.
Barber, B., Odean, T., 2001. Boys will be boys: gender, overconfidence,and common stock investment. Quarterly Journal of Economics 116,261–292.
Barsky, R.B., Kimball, M.S., Juster, F.T., Shapiro, M.D., 1997. Preferenceparameters and behavioral heterogeneity: an experimentalapproach in the health and retirement survey. Quarterly Journal ofEconomics 112, 537–579.
Bertrand, M., Schoar, A., 2003. Managing with style: the effect ofmanagers on corporate policy. Quarterly Journal of Economics 118,1169–1208.
Brav, A., Graham, J., Harvey, C., Michaely, R., 2005. Payout policy in the21st century. Journal of Financial Economics 77, 483–527.
Case, A., Paxson, C., 2008. Stature and status: height, ability and labormarket outcomes. Journal of Political Economy 116, 499–532.
Chevalier, J., Ellison, G., 1999. Are some mutual fund managers betterthan others? Cross-sectional patterns in behavior and performance.Journal of Finance 54, 875–899.
Core, J.E., Guay, W.R., 2002. The other side of the trade-off: The impact ofrisk on executive compensation: a revised comment. Unpublishedworking paper, Massachusetts Institute of Technology and Universityof Pennsylvania.
Deaton, A.S., Arora, R., 2009. Life at the top: the benefits of height.Economics and Human Biology 7, 133–136.
Frank, M.Z., Goyal, V.K., 2007. Corporate leverage: How much domanagers really matter? Unpublished working paper, University ofMinnesota and Hong Kong University of Science and Technology.
Graham, J.R., Harvey, C.R., 2001. The theory and practice of corporate finance:evidence from the field. Journal of Financial Economics 60, 187–243.
Graham, J.R., Harvey, C.R., Rajgopal, S., 2005. The economic implicationsof corporate financial reporting. Journal of Accounting and Econom-ics 40, 3–73.
Graham, J.R., Harvey, C.R., Puri, M., 2012. Capital allocation and delega-tion of decision-making authority within firms. Unpublished work-ing paper, Duke University.
Hackbarth, D., 2008. Managerial traits and capital structure decisions.Journal of Financial and Quantitative Analysis 43 (4), 843–882.
Heaton, J.B., 2002. Managerial optimism and corporate finance. FinancialManagement 31, 33–45.
Please cite this article as: Graham, J.R., et al., Managerial attitu(2013), http://dx.doi.org/10.1016/j.jfineco.2013.01.010i
Kaniel, R., Massey, C., Robinson, D., 2010. The importance of being anoptimist: Evidence from labor markets. NBER Working Paper No. 16328.
Kaplan, S.N., Klebanov, M.M., Sorensen, M., 2012. Which CEO character-istics and abilities matter? Journal of Finance 67, 973–1007.
Kaplan, S.N., Stromberg, P., 2004. Characteristics, contracts, and actions:evidence from venture capitalist analyses. Journal of Finance 59,2177–2210.
Landier, A., Thesmar, D., 2009. Contracting with optimistic entrepre-neurs: theory and evidence. Review of Financial Studies 22,117–150.
List, J.A., 2007. Field experiments: A bridge between lab and naturally-occurring data. NBER Working Paper No. 12992.
Loewenstein, G., Read, D., Baumeister, R.F., 2003. Time and decision:Economic and psychological perspectives on intertemporal choice.Russell Sage Foundation Press, NY.
Malmendier, U., Tate, G., 2005. CEO overconfidence and corporateinvestment. Journal of Finance 60, 2661–2700.
Malmendier, U., Tate, G., 2008. Who makes acquisitions? CEO over-confidence and the market’s reaction. Journal of Financial Economics89, 20–43.
Murphy, K.J., 1999. Executive compensation. In: Ashenfelter, O., Card, D.(Eds.), Handbook of Labor Economics, 3b., Elsevier Science, NorthHolland, pp. 2485–2563.
Persicao, N., Postlewaite, A., Silverman, D., 2004. The effect of adolescentexperience on labor market outcomes: the case of height. Journal ofPolitical Economy 112, 1019–1053.
Prendergast, C., 2002. The tenuous tradeoff between risk and incentives.Journal of Political Economy 110, 1071–1102.
Puri, M., Robinson, D., 2007. Optimism and economic choice. Journal ofFinancial Economics 86, 71–99.
Puri, M., Robinson, D. The economic psychology of entrepreneurship andfamily business, Journal of Economics and Management Strategy, inpress.
Roll, R., 1986. The hubris hypothesis of corporate takeovers. Journal ofBusiness 59, 197–216.
Ross, S., 2004. Compensation, incentives, and the duality of risk aversionand riskiness. Journal of Finance 59, 207–225.
Scheier, M.F., Carver, C.S., Bridges, M.W., 1994. Distinguishing optimismfrom neuroticism (and trait anxiety, self-mastery, and self-esteem):a re-evaluation of the Life Orientation Test. Journal of Personalityand Social Psychology 67, 1063–1078.
Shefrin, H., 2005. A Behavioral Approach to Asset Pricing. Academic PressAdvanced Finance Series.
Slemrod, J., Venkatesh, V., 2002. The income tax compliance cost of largeand mid-size businesses. Unpublished working paper, University ofMichigan at Ann Arbor.
Trahan, E.A., Gitman, L.J., 1995. Bridging the theory-practice gap incorporate finance. A survey of chief financial officers. QuarterlyReview of Economics and Finance 35, 73–87.
des and corporate actions. Journal of Financial Economics