journal of experimental psychology: 1994, vol. 20, no. 6...
TRANSCRIPT

Journal of Experimental Psychology:Learning, Memoty, and Cognition1994, Vol. 20, No. 6,1486-1503
Copyright 1994 by the American Psychological Association, Inc.0278-7393/94/$3.00
Aging Associations: Influence of Speed on Adult Age Differencesin Associative Learning
Timothy A. Salthouse
Two studies, involving a total of nearly 500 Ss, were conducted to determine the mechanisms bywhich processing speed contributes to the relations between adult age and associative learning.Results of both studies indicated that increased age was related to poorer associative learninglargely because of a failure to retain information about previously correct responses. This in turnwas related to the effectiveness of encoding briefly presented information in an associative memorytask, which was related to measures of processing speed. It is therefore suggested that age-relateddecreases in speed of processing lead to less effective encoding or elaboration, which results in afragile representation that is easily disrupted by subsequent processing.
At least two different perspectives have been adopted inattempts to explain an individual's performance in learningand memory tasks. The experimental approach typically fo-cuses on specifying the components or processes, such asencoding or rehearsal, that are presumably required to per-form the criterion task. The correlational approach concen-trates on identifying relatively broad abilities, such as verbalcomprehension or short-term acquisition and retrieval, thatmay be contributing to performance on the criterion task.Despite several appeals for an integration of the two perspec-tives (e.g., Cronbach, 1957; Underwood, 1975), experimentaland correlational approaches to learning and memory haveremained largely independent. (But see Geiselman, Wood-ward, & Beatty, 1982, and Underwood, Boruch, & Malmi,1978, for notable exceptions.)
The current project represents one attempt at integratingthe two approaches in the context of understanding the sourceof a particular type of individual differences—those related toincreased age in adulthood—in a specific cognitive task—associative learning. Unlike traditional experimental ap-proaches, the processes or components identified in taskanalyses are not considered in isolation, but instead theirrelations with measures from other tasks are examined. How-ever, unlike traditional correlational approaches, the explana-tory constructs are not broad abilities, but instead are mea-sures derived from task decompositions.
Although only a single criterion task was examined in thisproject, associative learning is a moderately complex cognitiveactivity that occupies a central role in many cognitive theories.Furthermore, if relational or structural analyses at the level oftask components or processes prove successful in the currentproject, then the procedures should also be applicable to other
This research was supported by National Institute on Aging GrantR37 AG06826. I thank the following people who served as researchassistants in this project: Anita Clarke, Vicky Coon, Jane Crawford,Alan Kersten, Brian King, Tara Lineweaver, Robert Murray, andJocelyn Thomas.
Correspondence concerning this article should be addressed toTimothy A. Salthouse, School of Psychology, Georgia Institute ofTechnology, Atlanta, Georgia 30332. Electronic mail may be sent [email protected].
tasks and to other types of individual differences, includingthose based on talent or ability, developmental differences inchildhood, specific brain damage, or disease category.
Pronounced adult age differences have been reported in theefficiency of many types of learning, including trial-by-trialimprovement in learning to associate pairs of unrelated words(e.g., Kausler & Puckett, 1980; Monge, 1971; Winn, Elias, &Marshall, 1976). An example of this phenomenon is evident ina study reported by Salthouse, Kausler, and Saults (1988), inwhich 362 adults between 20 and 79 years of age werepresented with pairs of unrelated words. Eight word pairs werepresented, followed by the first word in each pair together withthe instruction to recall the second word of the pair. A secondstudy-test sequence with the same word pairs was adminis-tered immediately after the first recall attempt. Multipleregression analyses revealed that the age-related effects werelarger in the second trial (i.e., R2 for age of .144) than in thefirst trial (i.e., R2 of .087). Furthermore, there was a significantincrement in R2 associated with age (i.e., .020) in the predic-tion of Trial 2 performance after Trial 1 performance wasstatistically controlled, indicating that there were independentage-related influences on Trial 2 performance.
A similar result was obtained in a recent unpublished studyfrom my laboratory involving 50 young adults (ages 18 to 27)and 44 older adults (ages 56 to 83). In this study the R2
associated with age in the prediction of Trial 1 performancewas .381, and that for Trial 2 performance was .584. Theincrement in R2 associated with age in Trial 2 performanceafter control of Trial 1 performance was statistically significant(i.e., .083). In each of these cases, therefore, there was asmaller benefit of repetition with increased age, which mayreflect an age-related decrease in the retention of informationacross successive trials.
Previous research has also found a large influence ofprocessing speed on the relations between age and measures ofperformance on tasks ranging from reasoning and spatialabilities, to free recall and paired-associate memory (e.g.,Hertzog, 1989; Undenberger, Mayr, &. Kliegl, 1993; Nettel-beck & Rabbitt, 1992; Salthouse, 1991, 1992a, 1993a, 1994;Salthouse & Babcock, 1991; Schaie, 1989, 1990). Processingspeed in these studies has typically been measured withpaper-and-pencil tests involving comparisons, substitutions, or
1486
ASSOCIATIVE LEARNING 1487
search, or with various reaction time tasks. In each of thesestudies, comparisons of the proportion of variance (i.e., R2)associated with age before and after control of the speedmeasures indicated that between approximately 50% and100% of the age-related variance in the cognitive measures isshared with speed. (See Table 1 in Salthouse, 1993a, for theactual values in many of these studies.)
Similar statistical control analyses have also been conductedto examine the influence of speed on the relations between ageand measures of associative memory. In a study by Salthouse(1993a), two lists of six word pairs each were presented to 305adults from a wide range of ages. Scores on paper-and-pencilLetter Comparison and Pattern Comparison tests (describedhere later) were combined to serve as the speed measure. Theage-related variance (i.e., R2) in the prediction of accuracy ofremembering the second word in each pair was .162 when agewas the only predictor in the equation, but it was only .024after the speed measure had been controlled. The same speedand paired-associate tasks were also used in another unpub-lished study from my laboratory with an extreme-groups design(77 young adults and 69 older adults). In this study, the R2
associated with age was .596 when age was considered alonebut only .069 when age was examined after control of the speedmeasure. These studies therefore suggest that over 85% (i.e.,85.2% and 88.4%, respectively) of the age-related variance inperformance in associative memory tasks is shared with mea-sures of perceptual comparison speed.
The results just described strongly imply that processingspeed contributes to the relations between age and variousmeasures of cognitive performance, including associative learn-ing and memory. What they fail to indicate, however, is themanner in which that influence is manifested. A primary goalof this research was to investigate a specific hypothesis abouthow processing speed might mediate age-related effects onassociative learning.
The proposed interpretation of the speed influence is basedon three related assumptions. First, it is postulated that speedof processing directly affects the encoding of informationbecause the quality or availability of stimulus information ispresumed to degrade over time; hence, more accurate andelaborate encoding is possible when the relevant processingoperations can be performed quickly. Second, better encodingis hypothesized to result in a more durable representation thatis less susceptible to disruption from subsequent processing.Third, it is assumed that more information is preserved (i.e.,less is forgotten) when the internal representation is moredurable and stable.
The investigative strategy in this project consisted of threesteps. The first involved analyzing the associative learning taskinto distinct components. Next, components of a continuousassociative memory task presumed to be related both to speedmeasures and to associative learning components were identi-fied. Finally, empirical relations among the component mea-sures were examined by means of hierarchical regression andpath analyses.
Two studies were conducted, and each involved two phases.The initial phase consisted of an examination of the relationsamong the variables in a sample (i.e., college students) thatwas relatively homogeneous in terms of age and speed. In the
second phase, those same relations were examined in a samplethat had a much greater range of age and variation inprocessing speed. Comparison across the two phases wasexpected to be informative about how the pattern of relationsamong variables changes when the range of speed is increased.That is, some relations may only be salient when there ismoderate-to-large variation in the speed measures.
Three sets of tasks were therefore administered in eachstudy. The primary criterion task was associative learning.Associative memory tasks involving continuously changingpairs of items were administered to assess the efficiency ofencoding, and the rate of forgetting, of associative information.Finally, a variety of paper-and-pencil and computer-adminis-tered tasks were used to assess processing speed.
Associative Learning Task
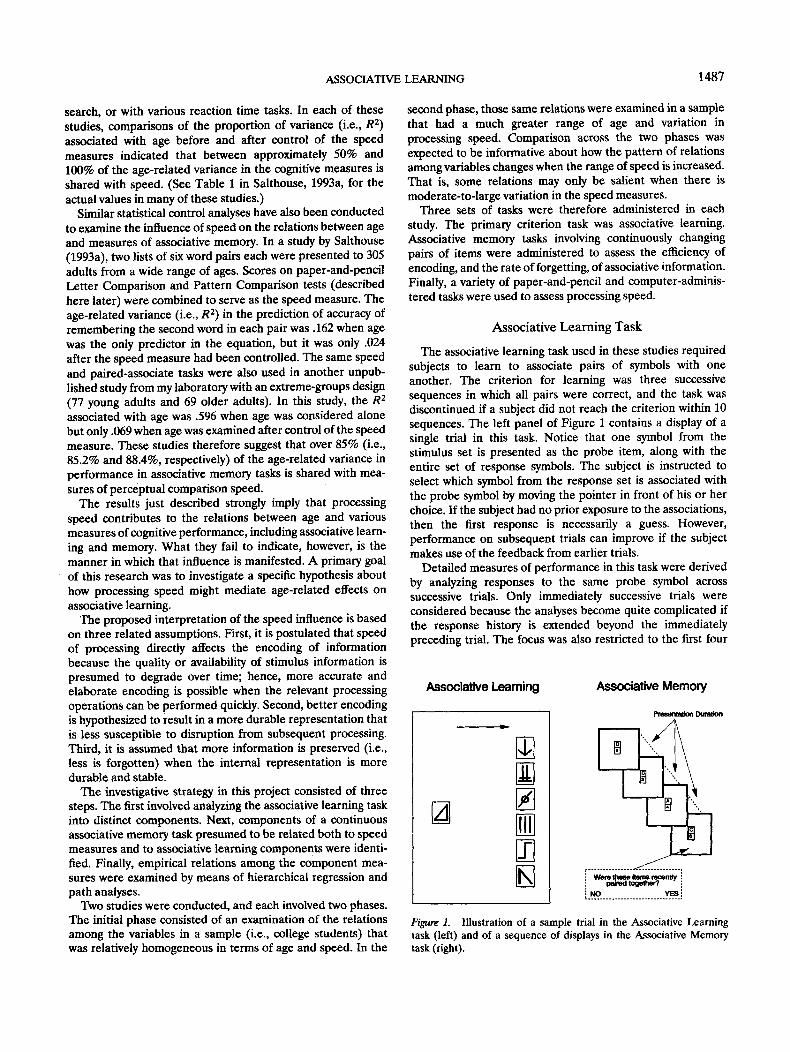
The associative learning task used in these studies requiredsubjects to learn to associate pairs of symbols with oneanother. The criterion for learning was three successivesequences in which all pairs were correct, and the task wasdiscontinued if a subject did not reach the criterion within 10sequences. The left panel of Figure 1 contains a display of asingle trial in this task. Notice that one symbol from thestimulus set is presented as the probe item, along with theentire set of response symbols. The subject is instructed toselect which symbol from the response set is associated withthe probe symbol by moving the pointer in front of his or herchoice. If the subject had no prior exposure to the associations,then the first response is necessarily a guess. However,performance on subsequent trials can improve if the subjectmakes use of the feedback from earlier trials.
Detailed measures of performance in this task were derivedby analyzing responses to the same probe symbol acrosssuccessive trials. Only immediately successive trials wereconsidered because the analyses become quite complicated ifthe response history is extended beyond the immediatelypreceding trial. The focus was also restricted to the first four
Associative Learning
Minj
K
Associative Memory
Presentation Duration
1 , / I) \\1
Figure 1. Illustration of a sample trial in the Associative Learningtask (left) and of a sequence of displays in the Associative Memorytask (right).

1488 TIMOTHY A. SALTHOUSE
trials within each set because some subjects could havereached the criterion with this number of trials, and thus therewas a possibility of missing data if a greater number of trialswere used.
For the purposes of the analyses, the associative learningresponses were classified into six mutually exclusive categories.A successful response was defined as a correct responsepreceded either by no previous exposure to this stimulus (i.e.,it was the first trial) or by an incorrect response on the previousexposure to this stimulus. A retain was defined as a correctresponse to a given stimulus followed by a correct response thenext time that stimulus was presented. The converse of theretain category was forget, defined as a correct response to astimulus followed by an incorrect response to the samestimulus the next time it occurred. A discrimination failure wasdefined as an incorrect response in which the response hadalready been linked to a different stimulus since the lastpresentation of this stimulus. That is, the subject failed todiscriminate that the selected response had already beenconfirmed as being paired with another stimulus. Apersevera-tion was defined as an incorrect response in which the responsewas a repetition of a response already disconfirmed for thisstimulus on the previous trial. That is, the subject continuedwith an inappropriate response despite the negative feedbackreceived the last time the stimulus was presented. Finally,an unsuccessful guess was defined as an incorrect responsefrom a subject who either had had no previous exposure tothis stimulus or had made an incorrect response on theprevious trial with the current response not having beenpreviously confirmed with another stimulus (i.e., not a discrimi-nation failure) or disconfirmed with this stimulus (i.e., not aperseveration).
Three of the error categories are particularly interestingbecause they each correspond to the loss of information. Thatis, forget responses represent a loss of positive (confirming)direct (to this stimulus) information; discrimination failuresrepresent a loss of positive (confirming) indirect (to anotherstimulus) information; and perseverations represent a loss ofnegative (disconfirming) direct (to this stimulus) information.Because absolute frequencies are not very meaningful whenthere are large variations in the total number of errors, eachresponse category was converted into a percentage. Thediscrimination failure and perseveration categories were exam-ined in relation to the total number of incorrect responses(including unsuccessful guesses), and forgetting responseswere examined in relation to the number of correct responseson the preceding trial because forgetting can only occur if theprevious response was correct. A percentage correct measurewas also formed by dividing the sum of successful responsesand retains by the number of opportunities for a response (i.e.,the product of trials and symbols).
A recent study by Salthouse and Kersten (1993) requiredsubjects to perform a version of this associative learning taskafter having performed two other tasks involving the samestimulus pairs. Reanalyses of the data according to theclassification scheme described above revealed that the 53older adults were significantly less accurate than the 53 youngadults in the first four trials (74.5% vs. 93.1%) and had asignificantly higher rate of forgetting from one trial to the next
(24.2% vs. 8.1 %). The percentage of errors that were persevera-tions was also significantly higher among older adults (4.8% vs.1.3%), but there was no significant difference in the percent-age of discrimination failure errors (14.4% vs. 11.8%). Theresults of the Salthouse and Kersten study are thus consistentwith the hypothesis that age differences occur in the trial-to-trial retention of associative information. Furthermore,the age differences are apparently most pronounced fordirect information about the stimulus (i.e., forgetting andperseverations).
Associative Memory
The associative memory task was included to investigate twopossible factors that might contribute to the hypothesizedpoorer retention of associative information with increased age.The two possibilities were less effective initial encoding andmore rapid forgetting. Pairs of letters and digits were pre-sented sequentially, interspersed with probes in which thesubject was to decide whether the displayed items had beenpaired together when either member of the pair was lastpresented. The task is loosely based on the continuous paired-associates procedure described by Atkinson and Shiffrin (1968).A series of displays in this task is illustrated in the right panelof Figure 1. The number of displays intervening between theinitial presentation and test (i.e., lag) was manipulated, as wellas the duration of each stimulus presentation. The examplecontains one pair intervening between the presentation of thetarget and its test, and therefore the lag in this case is 1.
Presentation-test lag was manipulated by varying the num-ber of intervening pairs between 0 and 3. If older adults forgetmore rapidly than young adults, then they would be expectedto have greater losses of accuracy with increased lag. Stimuluspresentation time was manipulated by varying the duration ofeach stimulus pair. If there are age differences in the time toregister or encode the stimulus, then young adults would beexpected to be more accurate than older adults even when thestimulus pairs are displayed for very short durations.
Processing Speed
Results from earlier studies have indicated that the influ-ence of speed varies with the nature of the speed measure; it isgenerally greatest with measures that have a cognitive compo-nent (e.g., substitution or comparison) and least with measuresthat primarily involve sensory and motor aspects (Salthouse,1993a). In an attempt to replicate and extend the previousresults, several different speed measures were included inthese studies. On the basis of results from earlier studies (e.g.,Salthouse, 1993b; 1994), two paper-and-pencil tests requiringsimply copying or drawing lines were included to assess motorspeed, and two paper-and-pencil tests requiring same-different comparisons were included to assess perceptualspeed. Two computer-administered reaction-time speed mea-sures used in other studies (Salthouse, 1992b; Salthouse &Kersten, 1993) were also included. These measures werederived from similar tasks that differed only with respect towhether the decisions were based on physical identity orassociational equivalence according to a displayed code table.

ASSOCIATIVE LEARNING 1489
The difference between the two reaction time measures servedas a measure of the speed of the association or substitutionprocess.
Analytical Procedures
Two statistical procedures were used to examine the hypoth-esized relations among variables in this project. Hierarchicalmultiple regression or semipartial correlation (e.g., Cohen &Cohen, 1983; Pedhazur, 1982) analyses were used to deter-mine the amount of age-related variance in each variable bothbefore and after the variance in measures reflecting speed ofprocessing were controlled. The difference between the twoestimates of age-related variance provides an indication of therelative contribution of the speed measure to the age-relateddifferences in the criterion variable. (See Salthouse, 1992a, forfurther discussion of this reasoning.)
Path analysis (e.g., Asher, 1983; James, Mulaik, & Brett,1982; Kenny, 1979) was the other analytical procedure used inthis project. The purpose of the path analyses was to examinethe plausibility of a particular pattern of relations among thevariables. Although causal direction is ambiguous with simulta-neous correlational data, path analyses are nevertheless usefulin determining whether specific relations among variables existand in providing an estimate of the relative strength of thoserelations.
Because both statistical methods are based on the partition-ing of variance in the variables, it is essential that the variablesused in these analyses have sufficient systematic variance toallow associations with other variables. Reliability estimateswere therefore derived for all variables, and variables with lowreliabilities were not used in the primary analyses.
Another method of minimizing measurement error involvesconducting the path or structural analyses on latent constructsrather than on observed manifest variables. Unfortunately,identification of latent constructs typically requires three ormore indicators of each construct, and that was not feasiblewith the task decomposition approach adopted in this project.
Study 1
Method
Subjects
Two groups of subjects participated in this study—64 collegestudents and 240 adults from a wide range of ages. The nonstudentadults were recruited from a variety of sources, such as churches,newspaper advertisements, and acquaintances of the research assis-tants. Demographic characteristics of all participants are summarizedin Table 1. The correlation between age and health in the adult samplewas .24, and that between age and education was —.11. Analysesexamining interactions of these variables with age are reported herelater.
Procedure
All subjects performed the tasks in the same order, with thepaper-and-pencil speed tasks first (in the order of Boxes, PatternComparison, Letter Comparison, and Digit Copying), followed by the
Table 1Demographic Characteristics of Research Participants
Group
StudentsAdults (ages)
19-3940-5960-82
All
StudentsAdults (ages)
20-3940-5960-89
All
n
64
838572
240
67
354644
125
Age
M
19.6
30.049.867.048.1
19.4
30.550.369.351.5
SDFemale
Study 1
1.6
5.46.05.6
15.9
47
64646464
Study 2
1.2
5.15.76.6
16.5
46
54614152
Education(years)
M
13.2
14.114.013.313.9
13.4
15.215.915.215.5
SD
1.9
2.72.42.42.5
1.2
2.02.32.52.3
Health
M
2.0
1.82.42.42.2
1.9
2.02.12.32.1
SD
1.8
0.91.11.11.1
0.8
1.01.01.01.0
Note. Education is self-reported number of years for formal educa-tion completed, and health is a self-rating on a scale ranging from 1 forexcellent to 5 for poor.
computer-administered speed tasks (Digit Digit and Digit Symbol),the Associative Memory task, and then the Associative Learning task.
Paper-and-pencil speed tasks. The paper-and-pencil speed taskseach consisted of an instruction page with examples, followed by twotest pages. Subjects were allowed 30 s to complete as many problems aspossible in each test page, and the average score across the twoadministrations served as the measure of performance in the test.
The Boxes test consisted of a page of squares, with each squarehaving one missing side. The task for the subject was to draw a line tomake a square, or box, out of each three-sided figure. The DigitCopying test consisted of a page of double boxes, with a digit in eachtop box and nothing in the bottom box. In this task, the subject was tocopy the digit from the top box in the empty box below it. The PatternComparison test consisted of a page containing pairs of line patternseach composed of three, six, or nine line segments. The task for thesubject was to write an S (for Same) between the pair if the twopatterns were identical and to write a D (for Different) if they werenot. The Letter Comparison test consisted of a page containing pairsof three, six, or nine letters. The task for the subject was to write an S(for Same) between the pair if the two patterns were identical and towrite a D (for Different) if they were not. In both the PatternComparison and Letter Comparison tests, one half of the pairs weredifferent because of a change in the position or identity of one of theelements (i.e., line segments or letters) in one member of the pair. Toadjust for guessing, scores in these latter two tests consisted of thenumber of correct responses minus the number of incorrect responses.
Computer-administered speed tests. The two computer-adminis-tered speed tests were based on the Wechsler Digit Symbol Substitu-tion Test (see Salthouse, 1992b). The display for a trial in each testconsisted of a code table at the top of the screen and a pair of probeitems in the middle of the screen. In the Digit Symbol version of thetest, the code table contained digits in its top row and symbols in itsbottom row, and the probe items consisted of a single digit-symbolpair. If the digit and symbol matched according to the code table at thetop of the screen, the subject was to press the / (slash) key as rapidly aspossible; if they did not match, the Z key was to be pressed as rapidly aspossible. In the Digit Digit version of the test, the code table wasredundant because the bottom row contained the same digits as thosein the top row. Subjects in this version of the test simply had to decide

1490 TIMOTHY A. SALTHOUSE
whether the two probe digits were the same or different. If they werethe same, the / key was to be pressed as rapidly as possible; if they weredifferent, the Z key was to be pressed as rapidly as possible.
A practice block of 18 trials was administered in each task, followedby two experimental blocks of 90 trials each. The order of the blockswas Digit Digit practice, Digit Digit experimental, Digit Symbolpractice, Digit Symbol experimental, Digit Symbol experimental, andDigit Digit experimental. The mean of the median reaction time (RT)and the percentage of correct responses across the two experimentalblocks served as the performance measures in each task.
Associative memory. The stimuli in this task consisted of a letterbetween A and F as the stimulus term and a digit between 1 and 6 asthe response term. Pairings of letters and digits changed continuouslyfrom presentation to presentation throughout the task. Each letter-digit pair was displayed for a specified presentation duration, butsubjects had an unlimited time to respond to the test probe. Testprobes consisted of a letter and a digit, along with the instruction todecide whether the items had been paired with one another the lasttime either had been presented. A positive decision was communi-cated by pressing the / key, and a negative decision was communicatedby pressing the Z key. Subjects could take as long as they wanted tomake their decision.
After a block of practice trials, seven experimental trial blocks werepresented. The first and last block of trials consisted of 12 tests at eachlag from 0 to 3, with a stimulus presentation duration of 1,000 ms. Themiddle five trial blocks consisted of 18 tests each at Lags 0 and 1, withstimulus presentation durations of 750, 150, 450, 300, and 600 ms,respectively. The sequence of stimulus presentations and tests witheach lag was randomly determined for each subject. The first and lasttrial blocks had an average of about 240 stimulus presentations each,with 48 tests, and the middle five blocks had an average of about 140stimulus presentations each, with 36 tests.
Associative learning. Stimuli in this task consisted of symbolscreated from a 5 x 7 matrix. The symbols were designed to be similarin complexity to letters and digits but without familiar labels. (SeeFigure 1 for examples.) Three different sets of six symbols each werecreated, and they were paired in different combinations across thethree sets of trials. Within a given set, presentation of the stimulussymbols was blocked such that all symbols were presented once beforeany symbol was presented again.
The arrangement of response symbols was different on each trial toprevent the use of position as a cue. A pointer could be moved in avertical column adjacent to the response symbols with the up- anddown-arrow keys on the keyboard. When the pointer was in front ofthe selected response symbol, the selection could be registered bypressing the ENTER key on the keyboard. The pointer could bemoved as frequently as desired, and there was no limit on the time tochoose and register a response. Feedback, consisting of a brief toneand visual highlighting of the correct response for 1.5 s, was presentedafter the selection was registered.
Each set of trials continued until the subject achieved a criterion ofthree successive sequences with all six pairs correct or a maximum of10 trials with each stimulus symbol. The first set was consideredpractice, and hence these data were not analyzed. Responses in thefirst four trials of the second and third sets were categorized accordingto the classification scheme described earlier.
Miscellaneous. In addition to the tasks described earlier, all sub-jects also performed three tasks not reported here. Two were paper-and-pencil tasks designed to measure transformation speed, but thedata were not meaningful because the absolute level of performancewas very low and the reliabilities were near zero. The results from theother task, a computer-administered arithmetic task, are describedalong with results from a separate study in another report (Salthouse& Coon, 1994).
Table 2Descriptive Statistics of Major Variables for 64 Students, Study 1
Variable
Paper and pencil speed testsBoxesDigit CopyLetter ComparisonPattern Comparison
Computer speed testsDigit Digit RTDigit Symbol RTDigit Digit % correctDigit Symbol % correctSubstitution (Digit Symbol
RT-Digit Digit RT)Associative Memory
Lag 0(1,000)Lag 1 (1,000)Lag 2 (1,000)Lag 3 (1,000)Lag 0 (150,300)Lag 1 (150,300)Lag 0 (600,750)Lag 1 (600,750)
Associative LearningTrials-to-criterionFirst four trials
% correct% forgetOther error %
Unsuccessful guessesDiscrimination failuresPerseverations
M
58.359.112.620.6
5861063
95.694.6
477
87.173.665.760.271.757.884.471.5
7.8
58.720.7
66.012.34.9
SD
14.58.12.53.7
70189
2.83.6
162
13.112.89.4
10.111.06.8
13.111.4
1.8
15.317.4
15.47.84.8
Estimatedreliability
.95
.91
.62
.76
.90
.94
.52
.81
.90
.64
.6000
.470
.78
.50
.58
.66
.56
.3200
Note. Estimated reliability computed from Spearman-Brown for-mula. Negative reliability estimates replaced by value of 0.
Results and Discussion
Student Data
Means, standard deviations, and estimates of the reliabili-ties of the performance measures are displayed in Table 2.1
Reliabilities were computed by boosting the correlation be-tween the measures obtained from the two administrations ofthe task by the Spearman-Brown formula. It can be seen thatthe reliabilities for the speed measures were in the moderate-to-high range but that the reliabilities were very low for somemeasures in the Associative Memory and Associative Learningtasks.
Correlations among the speed measures are presented inTable 3. Because the correlations between the measurespostulated to represent the same construct (i.e., motor speed,perceptual speed, RT speed) were in the moderate range,composite indexes of each speed construct were created byaveraging the relevant z scores. Correlations among thesecomposites are contained in the bottom of Table 3. Note thatbecause lower scores represent faster performance in the RTspeed measures but slower performance in the paper-and-pencil tests, correlations between the two types of speed
1 Unless specifically noted, a significance level of .01 was used in allstatistical comparisons.

ASSOCIATIVE LEARNING 1491
Table 3Correlations Among Speed Measures
Subjects
Study 1StudentsAdults
Study 2StudentsAdults
Study 1StudentsAdults
Study 2StudentsAdults
Boxes-Digit copy
(Motor speed)
.58*
.67*
.44*
.64*
Motor speed-Perceptual speed
.37*
.59*
.53*
.53*
Observed variables
Letter comparison-Pattern comparison(Perceptual speed)
.54*
.62*
.28
.59*
Composite indexes
Motor speed-RT speed
-.26- .53*
- .20-.30*
Digit digit-Digit symbol(RT speed)
.54*
.76*
.50*
.76*
Perceptualspeed-
RT speed
- .33*- .65*
-.31-.70*
Note. RT =*/> < .01.
•• response time.
measures would be expected to be negative rather thanpositive. The values are all in the low-to-moderate range,suggesting that the different types of speed in the studentsample were related but not identical.
There was little evidence of a between-subject speed-accuracy trade-off in the RT speed tasks because the correla-tions between RT and percentage correct were low (i.e., .05 forDigit Digit and .17 for Digit Symbol).
Associative memory. Because there were relatively few datafrom each presentation time condition in the AssociativeMemory task, the data from the two fastest (i.e., 150 and 300ms) and the two slowest (i.e., 600 and 750 ms) times in thevaried time versions of the task were combined with oneanother to increase reliability. It is apparent in Table 2 that, asexpected, accuracy was higher with shorter lags and withlonger times. However, the reliability was very low for Lags 2and 3; thus these measures were dropped from subsequentanalyses.
The correlation between accuracy at Lag 0 averaged acrossthe 600 and 750 ms presentation times, and accuracy at Lag 0with the 1,000 ms presentation time was .76. Because thiscorrelation is actually larger than the theoretical maximumbased on the estimated reliability of the latter measure (i.e.,.64), these two measures can be inferred to be assessing thesame construct of encoding effectiveness with adequate presen-tation time. Only the Lag 0 measure at the 1,000 ms presenta-tion time was therefore used as the measure of accuracy at theslow presentation time in the subsequent analyses.
Associative learning. Correlations among the three types ofassociative learning errors were .35 between forget and perserv-eration, .06 between forget and discrimination failure, and .12between perseveration and discrimination failure. A likelyreason for these low correlations is the low reliabilities ofall but the forget measure (cf. Table 2). Only the measure
of percentage forgetting was therefore used in subsequentanalyses.
Path analysis. The relations among the variables from thedifferent tasks were examined with path analysis procedures.Seven variables selected on the basis of theoretical relevanceand reliability were included in these analyses. The measuresfrom the Associative Learning task were trials-to-criterion asthe primary dependent variable, percentage correct in the firstfour trials as a reflection of initial learning, and percentageforgetting in the first four trials as an indication of the failureto retain information. Measures from the Associative Memorytask were accuracy at Lag 0 with fast (average across 150 and300 ms) presentation times to reflect efficiency of encodingwith limited time, accuracy at Lag 0 with slow (1,000 ms)presentation time to represent effectiveness of encoding with alonger presentation duration, and accuracy at Lag 1 with slow(1,000 ms) presentation time to represent short-term retentionin the presence of intervening information. The composite RTspeed measure was used as the primary speed index becausethe Associative Learning and Memory tasks were also pre-sented on computers.
Strong relations were expected among the measures fromthe same task. That is, in the Associative Learning task,percentage forgetting was predicted to be negatively related topercentage correct, and percentage correct was predicted to benegatively related to trials to criterion. In the AssociativeMemory task, accuracy at Lag 0 with fast presentation timeswas predicted to be related to accuracy at Lag 0 with slowpresentation times, which in turn was predicted to be relatedto accuracy at Lag 1 with slow presentation times. TheAssociative Memory and Associative Learning tasks werepostulated to be related to one another by a linkage betweenaccuracy at Lag 1 and percentage forgetting because the abilityto briefly retain information in the presence of interveninginformation was expected to be negatively related to theinability to retain information from one trial to the next. In theinterests of parsimony, the only linkage postulated from speedwas to accuracy at Lag 0 with the fast presentation times. Allrelations were postulated to be directional from simple tomore complex (i.e., from processing speed to measures ofassociative memory to measures of associative learning).
The model specification sequence for the path analysis onthe student data is summarized in Table 4.2 Relations withlarge standardized residuals were selected for inclusion as newpaths, and a model was modified when the difference inchi-square from the preceding model was significant. Modelswere also considered in which paths were specified betweenspeed and Lag 0 (slow), and between speed and percentagecorrect because those paths were added in the best-fitting
2 The measures of fit in Table 4 reflect the statistical comparison ofthe actual and observed covariances (x2), an index of the residualstandardized error (Adj. RMS), and two coefficients (Adj. Pop. F, Adj.GFI) representing the relative amount of the variances and covari-ances accounted for by the model. Values of residual standardizederror below 0.1 and values of model determination above 0.9 areconsidered to represent good fits (e.g., Steiger, 1989).

1492 TIMOTHY A. SALTHOUSE
Table 4Fits of Path Analysis Models
Model
Student data123
Adult data4567
Student data8
Adult data9
Description
InitialAdd Lag 0 (slow): % forgetDelete lag 1 (slow): % forget
Add age: Speed to Model 3Add age: % forgetAdd speed: Lag 0 (slow)Add speed: % correct
Model 3
Model 7
n X2
Study 1
6435.4629.0630.06
240121.63101.9448.5837.65
Study 2
6725.09
12548.09
df
151415
21201918
15
18
AdjustedRMS
.1327
.1267
.1284
.1333
.1278
.0802
.0706
.0969
.0961
AdjustedPop.r
.8690
.8792
.8767
.8537
.8642
.9439
.9561
.9279
.9202
AdjustedGFI
.7703
.7782
.7770
.8241
.8340
.9105
.9221
.8261
.8579
Note. RMS = root-mean-square error; Pop. F = Population Gamma; GFI = goodness-of-fit index.
model for the adult data. Neither model differed significantlyin fit from Model 3, and the coefficients for the added pathsdiffered from zero by less than two standard errors. It wastherefore concluded that although Model 3 only provides anadequate fit to the data, it cannot be improved with theaddition of the paths needed to fit the adult data. This model,with the significant path coefficients, is illustrated in Figure 2.Parallel analyses with the other speed measures yieldedgenerally similar results (i.e., the chi-square values for Model 3were 21.11 for the perceptual speed composite, 30.42 for themotor speed composite, and 32.72 for the substitution speedmeasure).
Inspection of Figure 2 reveals that there is support for theexpected relations among measures from the same tasks. Therelation between faster speed (lower times) and higher accu-racy at Lag 0 with short presentation times is consistent withthe assumption that faster processing speed allows moreextensive or elaborate encoding when the stimulus duration islimited. However, there was no relation between accuracy atLag 1 in Associative Memory and percentage forgetting inAssociative Learning. This was surprising, and consequently itwas examined further in hierarchical regression with accuracyat both Lag 0 and Lag 1 as predictors of percentage forgettingin opposite orders. The increment in R2 in the prediction ofpercentage forgetting was .013 (not significant) for Lag 1 aftercontrol of Lag 0, but .086 (p < .02) for Lag 0 after control ofLag 1. Because there is a relation between forgetting and theresidual variance in Lag 0 independent of Lag 1, but notbetween percentage forgetting and the residual variance inLag 1, these analyses confirm that it is accuracy at Lag 0 andnot accuracy at Lag 1 that is most closely related to percentageforgetting. It can therefore be concluded that forgetting inAssociative Learning is more likely when the initial representa-tion is weak, as reflected by low accuracy in AssociativeMemory at Lag 0.
.73 (-.77)
Figure 2. Path model indicating relations among variables in thestudent data. Values outside of the parentheses are the coefficientsfrom Study 1; those inside parentheses are the coefficients from Study2. All coefficients except that between speed and Lag 0 (fast) in Study 2were significantly different from 0.

ASSOCIATIVE LEARNING 1493
Adult Data
Means, standard deviations, estimated reliabilities, andcorrelations with age for all performance variables are summa-rized in Table 5. As with the student data, the reliabilities weremoderate to high for the speed measures and in the low-to-moderate range for measures from the Associative Memoryand Associative Learning tasks. The age correlations weresignificantly different from 0 for most variables, particularlywhen the estimated reliability of the measure was at leastmoderate. The correlation between the reliability estimate andthe absolute value of the age correlation was .85, indicatingthat the age relations were larger for the measures with thehighest proportions of systematic variance.
Nonlinear age trends were examined for all variables inTable 5. A significant quadratic age trend was evident only inthe measure of accuracy in the Digit Symbol task. Interactionsof age with gender, health, and education were also examinedfor all variables. The only significant interactions were withgender on accuracy in the Digit Digit and Digit Symbol tasks(i.e., negative age effects for male subjects, positive age effectsfor female subjects) and with health on accuracy at Lag 3 (i.e.,larger age effects for those in poorer health).
Table 5Descriptive Statistics of Major Variables for 240 Adults, Study 1
Variable
Paper and pencil speed testsBoxesDigit CopyLetter ComparisonPattern Comparison
Computer speed testsDigit Digit RTDigit Symbol RTDigit Digit % correctDigit Symbol % correctSubstitution (Digit Symbol
RT-Digit Digit RT)Associative Memory
Lag 0(1,000)Lag 1 (1,000)Lag 2 (1,000)Lag 3 (1,000)Lag 0(150,300)Lag 1 (150,300)Lag 0(600,750)Lag 1 (600,750)
Associative LearningTrials-to-criterionFirst four trials
% correct% forgetOther error %
Unsuccessful guessesDiscrimination failuresPerseverations
M
51.453.09.7
15.5
8391627
96.996.3
788
81.169.963.457.261.055.978.267.2
9.2
41.742.8
59.414.79.4
SD
12.810.83.13.9
211404
3.23.5
279
14.614.212.410.213.09.3
15.213.4
1.5
19.127.4
13.49.07.3
Estimatedreliability
.92
.92
.73
.84
.76
.96
.37
.59
.79
.74
.58
.470
.54
.20
.77
.67
.78
.83
.65
.36
.28
.40
Agecorrelation
-.47*-.50*-.44*-.58*
.52*
.59*
.03-.01
.46*
-.35*- .23*- .16- .03- .21*- .06-.35*-.28*
.28*
- .41*.36*
- .08- .03
.36*
Note. Estimated reliability computed from Spearman-Brown for-mula. Negative reliability estimates replaced by value of 0. RT =response time.*p < .01.
There was little evidence of a between-subjects speed-accuracy tradeoff in the RT tasks because the correlationsbetween the time and percentage correct values were small(i.e., -.13 for Digit Digit and .01 for Digit Symbol). Correla-tions among the speed measures and speed composites arepresented in Table 3, where it can be seen that all of thecorrelations are larger than those in the student sample.
Associative memory. It is apparent in Table 5 that accuracywas lower with increased lag and that the magnitude of the agecorrelations also decreased with increased lag. This patternwas confirmed in an Age (19-39, 40-59, 60-82) x Lag (0,1, 2,3) analysis of variance (ANOVA) on the data from the 1,000ms presentation duration condition. The Age, F(2, 237) =9.06, MSe = 340.02; Lag, F(3,711) = 244.48, MSe = 98.73, andAge x Lag, F(6, 711) = 6.34, MSe = 98.73, effects were allsignificant, and Age ANOVAs on each lag revealed significantage effects on Lags 0 and 1 but not on Lags 2 or 3. The absenceof significant age effects with longer lags is probably not verymeaningful, however, because the reliabilities of the measuresat long lags are quite low. Large age relations cannot beexpected if the variables have little systematic variance thatcan be related to other variables. The Age x Lag interactionwas not significant in an ANOVA with only Lags 0 and 1.
Mean levels of accuracy at each presentation time forsubjects in four (including students) age groups are displayedin Figure 3. As expected, accuracy was lower with increasedage and with shorter presentation time. Furthermore, accuracyat Lag 1 was consistently lower than accuracy at Lag 0. An Age(19-39,40-59, 60-82) x Lag (0,1) x Time (150, 300,450,600,750 ms) ANOVA revealed that all main effects and interac-tions were significant except for the triple interaction of Age xLag x Time. Age x Lag ANOVAs at each time revealed thatthe lag effects were significant at all times, the age effects weresignificant at the 450,600, and 750 ms times, but the Age x Laginteraction was significant only at the 750 ms time. This latterinteraction was attributable to larger age differences at Lag 0than at Lag 1.
A series of hierarchical regression analyses was conductedto examine relations among the accuracy measures at Lags 0and 1 across all presentation times. Separate regressionequations were created for each of the variables in Figure 4with predictors in the following order: variable to the left,variable above, speed (composite RT measure), and age. Forexample, predictors for accuracy at Lag 1 with 450 mspresentation time were accuracy at Lag 0 with 450 ms, accuracyat Lag 1 with 300 ms, speed, and age. Nonsignificant predictorswere then dropped from the equation, and standardizedregression coefficients were determined for the significantpredictors of each variable. The significant coefficients aredisplayed in Figure 4. The fit of the complete model was notvery good: x2 (69, N = 240) = 292.93, adjusted root-mean-square error (RMS) = .1118; adjusted population T = .8331;adjusted goodness-of-fit index (GFI) = .7857). However, thestandardized residuals for all relations involving both age andspeed were quite small, suggesting that these variables wereprobably not responsible for the unimpressive fit.
As expected, there were significant relations between accu-racy at Lag 0 and accuracy at Lag 1 for every presentation time

1494 TIMOTHY A. SALTHOUSE
LagO100
Lag1100
I5
a.
150 300 450 600 750 1000
Presentation Duration (msec)150 300 460 600 750 1000
Presentation Duration (msec)Figure 3. Percentage correct in associative memory as a function of stimulus presentation time forstudents and adults, Study 1.
Figure 4. Relations among age, speed, and accuracy at Lags 0 and 1for each presentation time in the adult sample, Study 1. Variables arelabeled by presentation time and lag so that, for example, 750-1 refersto Lag 1 with the 750 ms presentation duration.
and between accuracy at adjacent presentation times for eachlag (except Lag 1 with 150 and 300 ms presentation times). Ofparticular interest were the relations from speed and age. Itcan be seen that speed was not related to accuracy at Lag 1 andinstead exerted its effects through accuracy at Lag 0. Theapparent implication is that speed does not contribute to theloss of accuracy from Lag 0 to Lag 1 after its effects on Lag 0are controlled. The fact that the speed relations were signifi-cant on each Lag 0 variable even after controlling the influenceof Lag 0 accuracy with the next shorter presentation timesuggests that there were unique or independent effects ofspeed at each successive presentation time.
The most important result from Figure 4 is that there wereno direct effects of age on any of the associative memoryvariables. That is, when speed and accuracy in other associa-tive memory conditions were entered as predictors before age,there was no unique influence of age on associative memory.Instead, all of the age-related variance in associative memoryappears to be mediated through the index of processing speed.
Associative learning. Table 5 indicates that age was signifi-cantly related to several measures of associative learningperformance. Means across successive age groups for thetrials-to-criterion and percentage correct measures were 8.6and 51.3%, respectively, for ages 19 to 39; 9.2 and 41.1%,respectively, for ages 40 to 59; and 9.7 and 31.5%, respectively,for ages 60 to 82.
The probability of forgetting previously correct responsesalso increased with age. Mean percentages for successive agegroups were 31.2% for adults between ages 19 and 39, 43.0%for adults between ages 40 and 59, and 55.9% for adultsbetween ages 60 and 82. The relative frequency of persevera-tion responses was low, but these errors also increased withincreased age. Means for successive age groups were 6.5% for

ASSOCIATIVE LEARNING 1495
ages 19 to 39,9.8% for ages 40 to 59, and 12.4% for ages 60 to82. Perseverations are an interesting type of error because thefact that the response is the same as that produced the lasttime this stimulus was presented suggests that some informa-tion was retained but apparently not the information that theresponse was incorrect. The higher proportion of persevera-tions with increased age may be due to a greater tendency torespond on the basis of idiosyncratic associations to physicalcharacteristics of the symbols. Because the placement of theresponse symbols varied from trial to trial, these errors cannotbe attributed to position biases.
Correlations among the frequencies of the three types oferrors were .38 between forgetting and perserverations, -.12between forgetting and discrimination failure, and —.06 be-tween perserverations and discrimination failures. This pat-tern is very similar to the results with the student data, evenwith respect to the low reliability of the discrimination failures.
The proportion of variance associated with age in predictionof the trials-to-criterion measure was .080, but this wasreduced to .007 after the measure of forgetting was controlled.Forgetting therefore appears to be a key factor in the agedifferences in associative learning.
Hierarchical regression analyses. Results of hierarchical re-gression analyses illustrating the proportion of age-relatedvariance before and after control of various measures of speedare displayed in Table 6. Notice that there was a largeattenuation of the age-related variance in nearly all variablesafter control of the speed measures. To illustrate, for theprimary measure of trials-to-criterion, the R2 for age when itwas considered alone was .080, and this was reduced to .016after control of the RT speed measure. Because many subjectshad scores at the ceiling of 10, the measure of percentagecorrect in the first four trials is probably a more sensitive
measure of associative learning in this task. Age was associatedwith 16.5% of the variance in this measure when age was theonly predictor, but with only 3.2% of the variance when agewas entered in the regression equation after the RT speedmeasure.
It is also apparent in Table 6 that the reduction in age-related variance is generally greater when the speed measureshave more cognitive involvement. That is, the residual age-related variance is smaller in 8 of 10 comparisons involvingassociative memory and associative learning variables with theperceptual speed measure compared with the motor speedmeasure, and it is smaller in 10 of 10 comparisons with theDigit Symbol measure in comparison with the Digit Digitmeasure. However, the degree of attenuation of the age-related variance was not noticeably greater for the substitution(Digit Symbol-Digit Digit) measure. This was surprising be-cause the substitution difference score might have been ex-pected to provide a purer index of cognitive processing speed.It is possible that, rather than reflecting the time to accesspreviously learned associations in memory, this score repre-sents a relatively peripheral process of visually searching thecode table.
Path analysis. The model-testing procedure in fitting thedata of the adult sample is summarized in Table 4. The initialmodel was identical to the final model for the students after apath was added from age to speed. This model did not providea very good fit, and thus the paths from age or speed that couldbe altered to improve the fit were determined by examining thematrix of standardized residuals. The final model, Model 7, isdisplayed in Figure 5. The fit of the final model with thecomposite paper-and-pencil speed measures was similar: x2
(18, N = 240) = 35.93 with the perceptual speed compositeand x2 (18, N = 240) = 40.04 with the motor speed compos-
Table 6Age-Related Variance Before and After Control of Various Speed Measures (n = 240), Study 1
Variable
Paper and pencil MSpdPaper and pencil PSpdRT speedSubstitutionAssociative Memory
Lag 0 (150,300)Lag 0(600,750)Lag 1 (600,750)Lag 0(1,000)Lag 1 (1,000)Lag 2 (1,000)
Associative LearningTrials-to-criterion% correct% forget% perseverations
Age»&*•
alone.277*.323*.348*.213*
.045*
.120*
.077*
.123*
.052*
.025
.080*
.165*
.129*
.131*
DD
.096*
.101*
.015*
.109*
.007
.022
.030*
.012
.013
.005
.025
.051*
.032*
.054*
R2 for age after control of:
Computer
DS
.088*
.052*
.003
.004
.000
.006
.005
.005
.001
.000
.019
.038*
.030*
.053*
RTSpd
.071*
.052*—
.009
.001
.006
.010
.002
.002
.000
.016
.032*
.022
.044*
Sub
.180*
.141*
.107*—
.007
.038*
.016
.045*
.009
.004
.045*
.091*
.079*
.095*
Paper and pencil
MSpd
—.091*.134*.117*
.005
.033*
.022
.033*
.017
.005
.018
.068*
.073*
.071*
PSpd
.053*—
.071*
.044*
.003
.002
.005
.003
.001
.000
.023
.059*
.044*
.089*
Note. DD refers to Digit Digit, DS to Digit Symbol, RTSpd to the average of the z scores from Digit Digitand Digit Symbol, Sub to the difference between Digit Symbol and Digit Digit. MSpd is the average of thez scores from Boxes and Digit Copy, and PSpd is the average of the z scores from Letter Comparison andPattern Comparison.*p < .01.

1496 TIMOTHY A. SALTHOUSE
Aatodatrv*Memory
.44 (.44)
.57 (.64)
Figure 5. Path model indicating relations among variables in the adultdata. Values in parentheses are coefficients from Study 2. All coeffi-cients are significantly different from 0.
ite—although it was somewhat poorer with the substitutionspeed measure—x2 (18, N = 240) = 46.80, allps < .01.
A primary difference from the model for the student data isthe existence of direct relations from speed to accuracy at Lag0 with the slow (1,000 ms) presentation time and from speed topercentage correct in associative learning. These additionallinkages may be a consequence of the greater range of speed inthe adult sample (discussed here later).
There is also evidence of a direct age-related influence,independent of speed, on percentage forgetting. Comparisonof the initial and residual age-related variance in percentageforgetting after control of the speed measures in Table 6suggests that between 17% and 35% of the age-relatedvariance in the forgetting measure is independent of the RTspeed and perceptual speed measures. An explanation distinctfrom speed therefore appears to be needed to account for atleast some of the age-related influences on forgetting in theAssociative Learning task.
Speed variability. To examine the variability of the speedmeasures, the RT speed scores for both the student and theadult samples were converted to standard deviations of thestudent distribution. These scores are plotted as a function ofage in Figure 6. It is clear from this figure that the variance inthe speed measures was considerably greater in the adultsample than in the age-restricted sample of students.
Summary
A major finding of this study was that age and speed do notaffect associative learning directly but instead exert their
Figure 6. Reaction time speed scores in standard deviations of thestudent distribution, Study 1.
effects through a series of indirect influences. Furthermore,the pattern of influences or relations is consistent with theproposed interpretation. That is, increased age is associatedwith a slower speed of processing, which is related to loweraccuracy in immediate tests in associative memory, particularlywhen presentation times are brief. Lower accuracy in associa-tive memory is related to more frequent forgetting in associa-tive learning, which is related to lower accuracy across the firstfour trials, which is related to a greater number of trials toreach the criterion in associative learning.
Study 2
The primary purpose of the second study was to replicateand extend the major results of Study 1. In addition, severalnew questions were addressed. One was whether the speedinfluence on associative learning occurred because of therelatively brief duration of the feedback indicating the correctresponse (1.5 s). This question was investigated by using aself-paced duration for the presentation of feedback in theassociative learning task. A second question was whether thespeed influence on associative memory would be eliminatedwith self-paced stimulus presentation durations. Addition of aself-paced condition in associative memory allowed this ques-tion to be examined. The third question was whether therelations between associative memory accuracy at short presen-tation durations and the other measures would be stronger ifthe measure of accuracy at short durations were more reliable.This was addressed by increasing the number of observationsat each presentation duration.
A fourth question was whether some of the relation betweenspeed and measures of associative learning performance mightbe due to associative learning in the Digit Symbol task. Thisissue was investigated in two distinct ways. First, the associa-tive learning task was moved to the beginning of the session,and then the same pairings of digits and symbols from theAssociative Learning task were used in the Digit Symbol task.It was expected that this manipulation would reduce the

ASSOCIATIVE LEARNING 1497
associative learning component in the Digit Symbol task andthus possibly provide a purer measure of processing speed.
A second method of investigating the role of associativelearning in the Digit Symbol task involved administeringanother set of Digit Digit and Digit Symbol speed tests at theend of the session, with different pairings of the digits andsymbols. The contrast with performance after associativelearning should be informative about whether the same factorscontribute to performance in the Digit Symbol task when therelevant associations have been learned. That is, if the correla-tion between the Digit Symbol measures before and afterassociative learning is high relative to the reliabilities of themeasures, one could conclude that similar processes areinvolved. Another associative learning test was administeredafter the Digit Symbol test, with the same digit symbol pairs, toallow an examination of the amount of incidental learning ofthe associations during the performance of the Digit Symboltask.
Other changes introduced from the procedure of Study 1were as follows. The same stimuli (digits and symbols) wereused in all tasks instead of, as was the case in Study 1, digitsand symbols in the Digit Symbol task, letters and digits in theAssociative Memory task, and symbols and symbols in theAssociative Learning task. A smaller set of presentation timeswas used in the Associative Memory task to allow more trials ateach time in an attempt to increase reliability. Only Lags 0 and1 were used in the Associative Memory task because measuresof performance in Lags 2 and 3 were not reliable in Study 1.The number of trials in the first set of practice trials in theAssociative Learning task was reduced to avoid fatigue. Andfewer stimulus pairs were used in the initial AssociativeLearning task because only a small percentage of subjectsachieved the learning criterion in Study 1. In all other respects,however, the tasks were similar to those of Study 1.
Method
Subjects
Descriptive characteristics of the samples of 67 students and 125adults who participated in this study are summarized in Table I.3 Itshould be noted that the average amount of education for the adults inthis study was greater than that in Study 1 (i.e., 15.5 years vs. 13.9years). Nevertheless, the correlation between age and amount ofeducation was only .03, and that between age and health was .11.
Procedure
All subjects performed the tasks in the following order: Boxes,Pattern Comparison, Letter Comparison, Digit Copying, AssociativeLearning, Digit Digit, Digit Symbol, Digit Symbol, Digit Digit, Associa-tive Memory, Digit Digit, Digit Symbol, Digit Symbol, Digit Digit, andAssociative Learning.
The paper-and-pencil speed tests were identical to those describedin Study 1. The procedure for the Digit Digit and Digit Symbol trialswas also similar to that of Study 1 except that only eight pairs of digitsand digits, or digits and symbols, were used in this study. Thedigit-symbol pairs in the first administration of the task were the sameas those learned in the first Associative Learning trials. When the taskwas administered at the end of the session, the pairings of digits and
symbols were different from the earlier pairs but identical to thoseused in the Associative Learning task that followed this task.
The procedure in the Associative Learning task was similar to thatof Study 1 except that the first (practice) set of trials contained amaximum of three complete sequences with letter and digit stimuli,and the next two sets contained four digits (i.e., 1,3,5, and 7 in the firstset, and 2, 4, 6, and 8 in the second set), each with four differentsymbols. The associative learning trials administered at the end of thesession consisted of a single set of eight digits and eight symbols toallow an assessment of the amount of incidental learning during themost recent Digit Symbol trials. The digits and symbols in this versionof the task were the same as those used in the other tasks in the study,and the pairings were the same as those from the immediatelypreceding Digit Symbol task but different from those used in the initialAssociative Learning and Digit Symbol tasks.
The Associative Memory task was also similar to that of Study 1except that the stimuli were the same digits and symbols used in theAssociative Learning and Digit Symbol tasks. In this task, however, thepairings of digits and symbols continuously changed from trial to trialinstead of remaining constant as in the other tasks. All trial blocks had16 tests at Lag 0 and 16 tests at Lag 1. The blocks were presented in thesequence of self-paced, 750 ms, 500 ms, and 250 ms, and then the samepresentation times again in the reverse order.
Results and Discussion
Student Data
Means, standard deviations, and estimates of the reliabili-ties for all measures are presented in Table 7. As anticipated,reliabilities of the associative memory measures were higherthan those in Study 1, although they were still only in thelow-to-moderate range.
There was little evidence of a between-subjects speed-accuracy trade-off in the RT tasks because the correlationsbetween time and accuracy were generally small (i.e., initialDigit Digit = .23, final Digit Digit = .28, initial Digit Sym-bol = -.05, and final Digit Symbol = -.06). To maximizecomparability with Study 1, the Digit Digit and Digit Symbolscores from the first administrations of these tasks were usedto form the composite RT speed measure. Correlations amongthe original and composite speed measures are presented inTable 3, where it can be seen that the patterns are generallysimilar to those of Study 1.
Correlations were also computed between the RT speedmeasures at the beginning of the session, after an opportunityto learn the digit-symbol associations in the AssociativeLearning task, and at the end of the session, before having achance to learn the relevant associations. The correlationswere .82 for the Digit Digit measure and .57 for the DigitSymbol measure. This latter correlation is not very high inrelation to its reliability (see Table 7), and therefore it appearsthat some of the variation in performance in the Digit Symboltask could be attributable to differential learning of theassociations.
3 Data from 2 subjects in the adult sample, one age 20 and one age33, were excluded because they were outliers on the RT speedmeasure (i.e., greater than 3.5 studentized residuals) and also hadextreme scores on several other variables.

1498 TIMOTHY A. SALTHOUSE
Table 7Descriptive Statistics of Major Variables for 67 Students, Study 2
EstimatedVariable M SD reliability
Paper and pencil speed testsBoxes 60.4 12.2 .92Digit Copy 58.3 7.4 .92Letter Comparison 12.0 2.6 .70Pattern Comparison 20.7 3.1 .46
Computer speed testsAfter Associative Learning 1
Digit Digit RT 539 53 .80Digit Symbol RT 920 156 .80Digit Digit % correct 96.6 2.2 .47Digit Symbol % correct 95.9 3.4 .45Substitution (Digit Symbol
RT-Digit Digit RT) 381 137 .76Before Associative Learning 2
Digit Digit RT 514 48 .92Digit Symbol RT 1120 180 .85Digit Digit % correct 95.6 3.6 .70Digit Symbol % correct 93.7 4.5 .77Substitution (Digit Symbol
RT-Digit Digit RT) 606 163 .82Associative Memory
Lag 0 (Self-paced time) 767 344 .70Lag 1 (Self-paced time) 773 334 .64Lag 0 (Self-paced) 90.8 8.3 .60Lag 1 (Self-paced) 74.4 13.9 .60Lag 0(750) 87.3 8.6 .44Lag 1(750) 68.2 12.3 .68Lag 0(500) 83.4 9.6 .55Lag 1(500) 62.7 9.7 .17Lag 0(250) 76.8 11.4 .52Lag 1(250) 58.0 11.0 .36
Associative LearningBefore Digit Symbol
Trials-to-criterion 6.7 1.8 .37First four trials
% correct 69.3 15.4 .62% forget 18.3 18.0 .44Other error %
Unsuccessful guesses 67.4 18.0 .06Discrimination failures 11.3 11.6 0Perseverations 3.7 6.0 .13
% correct Trial 1 37.7 20.9 —After Digit Symbol
Trials-to-criterion 6.4 2.7 —First four trials
% correct 82.2 21.9 —% forget 11.8 16.3 —Other error %
Unsuccessful guesses 31.7 30.5 —Discrimination failures 19.4 25.9 —Perseverations 3.7 6.5 —
% correct Trial 1 74.6 30.5 —
Note. RT = response time.
Associative memory. The average inspection time for thestimulus pairs in the self-paced condition in the AssociativeMemory task was 770 ms. As can be seen in Table 7, accuracyin this condition was slightly higher than in the 750 mspresentation time condition. Accuracy decreased as presenta-tion time decreased, and Lag 1 accuracy was always about 15%to 20% lower than accuracy with Lag 0.
Associative learning. Correlations between the differenttypes of errors were .45 between percentage forgetting and
perseverations, .24 between forgetting and discriminationfailures, and .04 between perseverations and discriminationfailures. This pattern of correlations is very similar to thatreported in Study 1.
Table 7 indicates that accuracy on the first exposure toassociative learning after performing the Digit Symbol task wasabout 75%. It can therefore be inferred that substantialincidental learning of the associations occurred during theDigit Symbol task. Comparisons with accuracy on the firstexposure in associative learning prior to performing the DigitSymbol task (at the beginning of the session) are complicatedbecause the eight pairs were presented in two blocks of foureach rather than, as was the case in the Associative Learningtask at the end of the session, in a single block containing alleight pairs. Despite these differences, accuracy was only aboutone half as high (i.e., 37.7%) when the pairs were tested beforeperforming the Digit Symbol task.
Path analysis. The 250 ms presentation time condition wasused as the fast presentation time in associative memory, andthe self-paced condition was used as the slow presentationtime. The model derived to fit the student data in Study 1 wasfound to provide an adequate fit to these data (see Table 4).Parameters from the model applied to the data of this studyare contained in parentheses in Figure 3. Similar fits wereobtained with the other speed measures—x2 (15,N = 67) = 19.07 with the perceptual speed composite, x2 (15,N = 67) = 20.83 with the motor speed composite, and x2 (15,N = 67) = 28.82 with the substitution speed measure.
The primary difference from Study 1 is that in this study thepath from speed to accuracy at Lag 0 with fast presentationtime was not significantly different from 0. This discrepancy ispuzzling because examination of Tables 2 and 7 reveals thatthe variances in the two samples were similar for the speed andLag 0 (fast) accuracy measures.
Adult Data
Means, standard deviations, estimated reliabilities, and agecorrelations for all variables are summarized in Table 8. Eachof these variables was examined for nonlinear age trends andfor interactions between age and gender, health, and educa-tion. None of these effects was significant. As in Study 1,variables with higher reliabilities tended to have larger correla-tions with age (i.e., r = .51).
There was little evidence of a between-subjects speed-accuracy trade-off because the correlations between time andaccuracy were small (i.e., initial Digit Digit = .09, final DigitDigit = .09, initial Digit Symbol = -.19, and final Digit Sym-bol = -.11). Correlations among the original and compositespeed measures are presented in Table 3. As in Study 1, thecorrelations are higher in the adult sample than in the studentsample.
The correlation between the initial and final Digit Digitspeed measure was .81, and that between the initial and finalDigit Symbol speed measure was .80. These values are higherthan those from the student sample, but they are still lowerthan the reliabilities of the measures.
Additional analyses were conducted to determine whetherthere was unique or independent age-related variance in the

ASSOCIATIVE LEARNING 1499
Table 8Descriptive Statistics of Major Variables for 125 Adults, Study 2
Variable
Paper and pencil speed testsBoxesDigit CopyLetter ComparisonPattern Comparison
Computer speed testsAfter Associative Learning 1
Digit Digit RTDigit Symbol RTDigit Digit % correctDigit Symbol % correctSubstitution (Digit Symbol
RT-Digit Digit RT)Before Associative Learning 2
Digit Digit RTDigit Symbol RTDigit Digit % correctDigit Symbol % correctSubstitution (Digit Symbol
RT-Digit Digit RT)Associative Memory
Lag 0 (Self-paced time)Lag 1 (Self-paced time)Lag 0 (Self-paced)Lag 1 (Self-paced)Lag 0(750)Lag 1 (750)Lag 0(500)Lag 1 (500)Lag 0(250)Lag 1(250)
Associative LearningBefore Digit Symbol
Trials-to-criterionFirst four trials
% correct% forgetOther error %
Unsuccessful guessesDiscrimination failuresPerseverations
% correct Trial 1After Digit Symbol
Trials-to-criterionFirst four trials
% correct% forgetOther error %
Unsuccessful guessesDiscrimination failuresPerseverations
% correct Trial 1
M
47.549.0
9.715.3
7121465
97.896.7
754
6591562
97.695.4
903
12241208
86.571.078.863.176.359.869.057.2
7.5
60.530.2
60.39.98.4
37.5
8.7
56.032.4
46.015.18.2
45.3
SD
12.69.42.73.6
157435
1.82.5
332
116414
2.26.0
339
699686
13.615.514.511.313.711.513.29.4
2.2
21.027.2
21.611.910.916.6
2.1
26.227.7
25.413.19.3
31.5
Estimatedreliability
.95
.95
.80
.77
.78
.94
.37
.57
.86
.91
.97
.44
.91
.95
.82
.88
.68
.77
.74
.46
.77
.40
.66
.06
.70
.66
.65
.41
.32
.54—
—
—
—
—
Agecorrelation
-.12-.34*-.43*-.58*
.47*
.56*
.10-.02
.51*
.52*
.43*
.15-.09
.35*
.23*
.24*-.09-.11-.17-.06-.19-.14-.29*-.08
.32*
-.34*.26*
-.24*.26*.20
-.14
.26*
-.35*.25*
.22
.03
.19-.34*
Note. Estimated reliability computed from Spearman-Brown for-mula. Negative reliability estimates replaced by value of 0.*p < .01.
two Digit Symbol measures. The Digit Symbol score beforeAssociative Learning (at the end of the session) was thereforepredicted from the Digit Symbol score after AssociativeLearning (at the beginning of the session). The R2 for agewhen age was the only predictor in the regression equation was.188, but it was .000 when Digit Symbol score after AssociativeLearning was controlled. All of the age-related variance in the
Digit Symbol task when it was performed before learning thedigit-symbol pairs is therefore shared with the variance in theDigit Symbol task when it is performed after having anopportunity to learn the pairs. The apparent implication is thatassociative learning is not an important factor contributing toage-related effects in Digit Symbol performance. A similarconclusion was reached by Salthouse and Kersten (1993) onthe basis of different types of analyses.
Associative memory. Figure 7 displays the mean levels ofaccuracy for Lags 0 and 1 at each presentation time for subjectsin four age groups. It is apparent in this figure that there werelarge age differences in the average time taken to inspect thestimulus pairs in the self-paced condition. Furthermore, therewere no significant age differences in accuracy in this condition(see Table 8). With shorter presentation times, age differencesin accuracy do emerge, but they are relatively small, and noneexcept for that for Lag 0 at the shortest presentation time wasstatistically significant.
The only significant effects in an Age (20-39, 40-59, 60-89)x Lag (0, 1) x Time (250 ms, 500 ms, 750 ms, self-paced)ANOVA were Lag, F(l, 122) = 438.18, MSe = 126.91; andTime,JF(3, 336) = 103.46, MSe = 100.12. Separate Age x LagANOVAs at each time revealed significant lag effects at alltimes, and a significant Age x Lag interaction at the 250 mstime but no significant age effects. These results differ fromthose of Study 1, where significant age effects were found atpresentation times of 450, 600, and 750 ms. One possibleexplanation for the discrepancy is the different average levelsof education in the samples from the two studies (discussedhere later).
Results of the series of hierarchical regression analyses withaccuracy at the shorter lag, accuracy at the shorter presenta-tion time, speed (RT composite), and age as predictors of eachassociative memory variable are summarized in Figure 8. Thefit of the complete model was good—x2 (34, N = 125) = 63.97;adjusted RMS = .0800; adjusted population T = .9583; ad-justed GFI = .8565. These results resemble those of Study 1(Figure 4) in that age was only related to speed, and speed wasonly related to accuracy at Lag 0. Speed was not directlyrelated to Lag 0 accuracy in the self-paced condition, perhapsbecause subjects were able to compensate for a slower speed ofprocessing by spending more time inspecting the stimuluspairs.
Associative learning. Correlations among the associativelearning errors were .58 between forgetting and persevera-tions, - .04 between forgetting and discrimination failures, and.10 between perseverations and discrimination failures. Thispattern is similar to that found in the student samples in bothstudies and in the adult sample in Study 1.
The proportion of age-related variance in the trials-to-criterion measure was .104, but it was only .019 after theforgetting measure was controlled. This finding replicates thesimilar result from Study 1 and again suggests that forgetting isa key factor in the age differences in associative learning.
The significant age effects on percentage correct on the firstassociative learning trial after the Digit Symbol task (i.e., lastentry in Table 8) indicates that older adults exhibited lessincidental learning of the associations during the Digit Symboltask. A similar finding was reported by Salthouse and Kersten

1500 TIMOTHY A. SALTHOUSE
100LagO
Stutter*
250 500 750 1000 1250 1500
Presentation Duration (msec)
100
90-
8 0 -
7 0 -
6 0 -
50
Lag1
250 500 750 1000 1280 1500
Presentation Duration (msec)Figure 7. Percentage correct in associative memory as a function of stimulus presentation time forstudents and adults, Study 2. Unconnected symbols represent data from the self-paced condition.
(1993). Accuracy on the first associative learning trial beforeperforming the Digit Symbol task was somewhat lower, and thecorrelation of this measure with age was not significant.
Hierarchical regression analyses. Results of the hierarchicalregression analyses after control of the speed measures aresummarized in Table 9. As in Study 1, the speed influenceswere widespread. For example, the age-related variance in thetrials-to-criterion measure was reduced from .104 to .058 after
Figure 8. Relations among age, speed, and accuracy at Lags 0 and 1for each presentation time in the adult sample, Study 2.
control of RT speed, and in the percentage correct measure itwas reduced from .117 to .044.
The amount of residual age-related variance in the associa-tive memory and associative learning variables was smallerafter control of perceptual speed than after control of motorspeed in 11 of 12 comparisons. It was smaller after control ofDigit Symbol than after control of Digit Digit in 6 of 10comparisons (with two ties).
Path analysis. The model derived from the adult data inStudy 1 provided an adequate fit to the data of this study (seeTable 4). Parameters for the model applied to the currentdata, displayed in parentheses in Figure 5, were generally quitesimilar to those from Study 1. Models with the compositeperceptual speed index (i.e., x2 [18, N = 125] = 50.89) and thesubstitution speed measure (i.e., x2 [18, N = 125] = 52.32) hadsimilar fits, but the model could not be fit with the compositemotor speed measure without altering several paths because ofthe weak relations between this speed measure and themeasures from the Associative Memory and Associative Learn-ing tasks.
Speed variability. As in Study 1, there was much greatervariability in the speed measures among the sample of adultsthan among the students. Figure 9 illustrates the composite RTscores of all participants in this study expressed in standarddeviation units of the student distribution. The pattern isnearly identical to that observed in Study 1 in that there is asystematic shift toward higher scores with increased age.
General Discussion
Before discussing implications of the current results, it isimportant to point out that very similar patterns were evidentin the two studies despite different samples, stimuli, and

ASSOCIATIVE LEARNING 1501
Table 9Age-Related Variance Before and After Control of Various Speed Measures (n = 125), Study 2
Variable
Paper and pencil MSpdPaper and pencil PSpdRT speedSubstitutionAssociative Memory
Lag 0(250)Lag 0(500)Lag 0(750)Lag 0 (Self-paced)Lag 1(250)Lag 1 (500)Lag 1 (750)Lag 1 (Self-paced)
Associative LearningTrials-to-criterion% correct% forget% perseverations
Aee* *&•*
alone.065*.320*.304*.213*
.085*
.035
.030
.008
.007
.019
.003
.013
.104*
.117*
.067*
.039
DD
.023
.085*
.007*
.037*
.019
.000
.001
.000
.000
.000
.002
.001
.078*
.062*
.052*
.028
R2 for age after control of
Computer
DS
.010
.052*
.004
.003
.008
.008
.013
.005
.000
.000
.007
.000
.050*
.042
.035
.017
RTSpd
.011
.045*—
.000
.007
.006
.012
.004
.000
.000
.008
.000
.058*
.044
.039
.020
.016
.083*
.036*—
.016
.002
.005
.003
.002
.000
.004
.000
.052*
.051*
.036
.019
Paper and pencil
MSpd
—.198*.241*.157*
.064*
.023
.016
.005
.007
.026
.000
.013
.097*
.099*
.057*
.022
PSpd
.003—
.034*
.013
.008
.001
.003
.002
.000
.004
.009
.000
.051*
.049
.043
.004
Note. DD refers to Digit Digit, DS to Digit Symbol, RTSpd to the average of the z scores from Digit Digitand Digit Symbol, Sub to the difference between Digit Symbol and Digit Digit. MSpd is the average of thez scores from Boxes and Digit Copy, and PSpd is the average of the z scores from Letter Comparison andPattern Comparison.*p < .01.
variations in procedure. This was even true in the pathanalyses in which the structural models derived to fit the dataof Study 1 were found to provide good fits to the independentdata from Study 2. Moreover, it is possible that some of thedifferences that did occur across studies could have beenattributable to differences in the average amount of educationbecause this variable had significant correlations with mea-sures of associative learning and memory performance (e.g.,the correlations between education and associative memory
12
30 40 SO OO
ChronoloQicfll AQG
Figure 9. Reaction time speed scores in standard deviations of thestudent distribution, Study 2. Open circles indicate the two outlierswho were omitted from the analyses.
accuracy at Lag 0 in the slow presentation duration were .24 inStudy 1 and .25 in Study 2).
As expected, a strong influence of speed on the relationsbetween age and associative learning was confirmed in thesestudies. To illustrate, inspection of Tables 6 and 9 reveals thatthe age-related variance in the trials-to-criterion measure wasreduced after control of the RT speed measure by 80% inStudy 1 and by 44% in Study 2. Comparable values with thepercentage-correct measure across the first four trials were81% attenuation in Study 1 and 62% attenuation in Study 2.
The results of these studies suggest that much of theinfluence of age on associative learning is due to a failure toretain relevant information from one presentation or trial tothe next. That is, when percentage forgetting was controlled,the residual age-related variance in trials-to-criterion measurewas not significant in either study and was reduced by 91.3%(from R2 of .080 to .007) in Study 1 and by 81.7% (from R2 of.104 to .019) in Study 2. Results from the Associative Memorytasks suggest that a major reason for the poorer retention withincreased age in associative learning is that relevant informa-tion was never adequately registered or encoded.
At least some of the encoding difficulty may be related to aslower speed of processing, which could reduce the amount ofelaboration, or formation of associations to other information,that can be accomplished within the available time. Thefunctions relating accuracy to presentation time in Figures 3and 7 indicate that accuracy is higher for younger adults atevery time. It can therefore be inferred that with increased agethere is less of an opportunity to conduct additional processingon the stimulus information because of the longer duration forthe initial processing. For example, if subsequent processing is

1502 TIMOTHY A. SALTHOUSE
only effective if the initial processing yields an accuracy at Lag0 of at least 80%, then the results in Figure 3 suggest that theaverage adult over the age of 60 would not be able to engage inmore extensive processing with stimulus presentation times ofless than 1,000 ms.
The path analyses revealed an independent influence of ageon the percentage forgetting measure in both studies. Al-though the residual age-related variance after control of theRT speed measure was not significantly greater than 0 (atp < .01) in either study (cf. Tables 6 and 9), in both cases theeffects were significant with a more liberal significance crite-rion (p < .05). It therefore seems possible that a separateexplanation, not involving speed, may be needed to account forat least some of the age-related influences on the measure offorgetting in the Associative Learning task. The mechanismsfor the speed-independent age-related effects on forgettingare not yet clear, but lapses in attention or concentrationduring presentation or test is a possibility worth considering.
As expected from the results of previous studies, the speedinfluences were greater for the measures with more cognitivecomponents (i.e., Perceptual Speed compared with MotorSpeed, and Digit Symbol compared with Digit Digit). Thespeed involved in the mediation of relations between age andassociative learning therefore seems to reflect cognitive pro-cesses more than sensory or motor processes.
A comparison of Figures 2 and 5 reveals that speed wasrelated to more variables in the data from the adult samplesthan in the data from the student samples. Furthermore, thelinkage between speed and accuracy at short presentationtimes was stronger in the adult sample than in the studentsample. Two possibly related factors are likely contributing tothese results. One is the much greater range of speed in theadult samples, as reflected by the patterns in Figures 6 and 9.Relations among two variables are often larger when thevariation in one or both variables is not restricted. A secondpossibility is that speed could be a broader construct in theage-heterogeneous adult sample. For example, the correla-tions among the speed measures in Table 3 are higher in theadult sample than in the student sample. A similar finding hasbeen reported in other studies (e.g., Birren, Riegel, & Morri-son, 1962; Salthouse, 1993a, 1993b; White & Cunningham,1987) and has been interpreted as a reflection of a morepervasive influence of speed with increased age. That is,whereas speed may have relatively local and discrete effects ina sample of young adults, the effects could be much morediffuse and widespread in a sample of age-heterogeneousadults.
Previous research has generally revealed small-to-nonexist-ent age differences in rate of forgetting using proceduressimilar to those of the Associative Memory task in the currentproject (e.g., Craik, 1971; Erber, 1978; Ferris, Crook, Clark,McCarthy, & Rae, 1980; LeBreck & Baron, 1987; Lehman &Mellinger, 1986; Poon & Fozard, 1980; Salthouse, 1992c;Wickelgren, 1975). Because few of the Age x Lag interactionswere significant, and because there was no independentinfluence of age on Lag 1 accuracy after Lag 0 accuracy wascontrolled, the present results are consistent with those ofearlier studies. However, significant age differences werefound in the measure of forgetting in the Associative Learning
task in both studies of the current project and in the reanalysesof the data from the Salthouse and Kersten (1993) study.
In attempting to account for these different outcomes, it isinstructive to consider the procedures involved in the two typesof forgetting assessment. Both tasks involved similar types ofinformation (i.e., associations between pairs of letters, digits,or symbols), and recognition tests. In the Associative Memoryprocedure, forgetting is inferred from the decrease in accuracyas a function of number of intervening items across relativelyshort intervals between presentation and test. Forgetting in theAssociative Learning task was assessed in terms of the percent-age of times a correct response to a given stimulus on one trialwas followed by an incorrect response to the same stimulus onthe following trial. Because the interval between presentationand test in the Associative Learning test was longer than in theAssociative Memory tests, the length of the retention intervalis one factor that may be contributing to the different patternsof forgetting in the two measures of forgetting.
A second difference between the two sets of procedures wasthat the pairings continuously changed in the AssociativeMemory task but remained constant across trials in theAssociative Learning task. This may have led to substantialaccumulation of proactive interference in the AssociativeMemory task. However, because the age differences in forget-ting were larger in the Associative Learning task than in theAssociative Memory task, it seems unlikely that proactiveinterference was an important factor contributing to thedifferent patterns of results in the two tasks.
A third factor that may be involved in the different patternsof age influences is the relability of the forgetting measures.Forgetting in the Associative Learning task is reflected directlyby the forgetting measure, and the reliability of this measurewas .65 in both studies (cf. Tables 5 and 8). In the AssociativeMemory task, forgetting was represented by the difference inaccuracy across lags. Estimates of the reliability of the Lag 0 -Lag 1 difference score can be computed for the slowestconditions (i.e., 1,000 ms and self-paced) in each study. Thesevalues, derived by boosting the correlation between the differ-ence scores in each trial block by the Spearman-Brownformula, were .26 in Study 1 and .29 in Study 2. The lowreliability of the Associative Memory measures thereforeraises the possibility that the small-to-nonexistent age differ-ences in this measure may be at least partially attributable to alack of systematic variance available for association with othervariables.
Conclusion
In summary, the results of these studies help explain thewell-documented influence of speed on the relations betweenadult age and cognitive functioning. The focus in this projectwas on associative learning, and as with other cognitivemeasures, statistical control of measures of processing speedreduced the age-related variance by between 40% and 80%.The availability of detailed measures of associative learningand of associative memory allowed the influences of speed andage to be traced. On the basis of the hierarchical regressionand path analysis results, it appears that speed primarilycontributes to the effectiveness of encoding information in

ASSOCIATIVE LEARNING 1503
both associative memory and associative learning. The age-related effects in associative learning were largely mediatedthrough this reduced effectiveness of encoding, although anindependent influence of age may be evident on the probabilityof forgetting in the first four trials of associative learning.Finally, the discovery that meaningful and interesting resultswere obtained from relational analyses at the level of taskcomponents suggests that these types of methods should bepursued with other criterion tasks and with other types ofindividual differences.
References
Asher, H. B. (1983). Causal modeling. Newbury Park, CA: Sage.Atkinson, R. C , & Shiffrin, R. M. (1968). Human memory: A
proposed system and its control processes. In K. W. Spence & J. T.Spence (Eds.), The psychology of learning and motivation: Advances inresearch and theory (Vol. 2, pp. 89-195). New York: Academic Press.
Birren, J. E., Riegel, K. F., & Morrison, D. F. (1962). Age differencesin response speed as a function of controlled variations of stimulusconditions: Evidence of a general speed factor. Gerontologia, 6,1-18.
Cohen, J., & Cohen, P. (1983). Applied multiple regression I correlationanalysis for the behavioral sciences. Hillsdale, NJ: Erlbaum.
Craik, F. I. M. (1971). Age differences in recognition memory.Quarterly Journal of Experimental Psychology, 23, 316-323.
Cronbach, L. J. (1957). The two disciplines of scientific psychology.American Psychologist, 13, 671-684.
Erber, J. T. (1978). Age differences in a controlled-lag recognitionmemorytask. Experimental Aging Research, 4, 195-205.
Ferris, S. H., Crook, T., Clark, E., McCarthy, M., & Rae, D. (1980).Facial recognition memory deficits in normal aging and seniledementia. Journal of Gerontology, 35, 707-714.
Geiselman, R. E., Woodward, J. A., & Beatty, J. (1982). Individualdifferences in verbal memory performance: A test of alternativeinformation-processing models. Journal of Experimental Psychology:General, 111, 109-134.
Hertzog, C. (1989). Influence of cognitive slowing on age differences inintelligence. Developmental Psychology, 25, 636-651.
James, L. R., Mulaik, S. A., & Brett, J. M. (1982). Causal analysis:Assumptions, models and data. Beverly Hills, CA: Sage.
Kausler, D. H., & Puckett, J. M. (1980). Frequency judgments andcorrelated cognitive abilities in young and elderly adults. Journal ofGerontology, 35, 376-382.
Kenny, D. A. (1979). Correlation and causality. New York: Wiley.LeBreck, D. B., & Baron, A. (1987). Age and practice effects in
continuous recognition memory. Journal of Gerontology, 42, 89-91.Lehman, E. B., & Mellinger, J. C. (1986). Forgetting rates in modality
memory for young, mid-life, and older women. Psychology and Aging,1, 178-179.
Lindenberger, U., Mayr, U., & Kliegl, R. (1993). Speed and intelli-gence in old age. Psychology and Aging, 8, 207-220.
Monge, R. H. (1971). Studies of verbal learning from the college yearsthrough middle age. Journal of Gerontology, 26, 324-329.
Nettelbeck, T., & Rabbitt, P. M. A. (1992). Aging, cognitive perfor-mance, and mental speed. Intelligence, 16, 189-205.
Pedhazur, E. J. (1982). Multiple regression in behavioral research. NewYork: Holt, Rinehart & Winston.
Poon, L. W., & Fozard, J. L. (1980). Age and word frequency effects incontinuous recognition memory. Journal of Gerontology, 35, 77-86.
Salthouse, T. A. (1991). Mediation of adult age differences incognition by reductions in working memory and speed of processing.Psychological Science, 2, 179-183.
Salthouse, T. A. (1992a). Mechanisms of age-cognition relations inadulthood. Hillsdale, NJ: Erlbaum.
Salthouse, T. A. (1992b). What do adult age differences in the DigitSymbol Substitution Test reflect? Journal of Gerontology: Psychologi-cal Sciences, 47, P121-P128.
Salthouse, T. A. (1992c). Influence of processing speed on adult agedifferences in working memory. Acta Psychologica, 79, 155-170.
Salthouse, T. A. (1993a). Speed mediation of adult age differences incognition. Developmental Psychology, 29, 722-738.
Salthouse, T. A. (1993b). Speed and knowledge as determinants ofadult age differences in verbal tasks. Journal of Gerontology: Psycho-logical Sciences, 48, P29-P36.
Salthouse, T. A. (1994). The nature of the influence of speed on adultage differences in cognition. Developmental Psychology, 30, 240-259.
Salthouse, T. A., & Babcock, R. L. (1991). Decomposing adult agedifferences in working memory. Developmental Psychology, 27, 763-776.
Salthouse, T. A., & Coon, V. E. (1994). Interpretation of differentialdeficits: The case of aging and mental arithmetic. Journal ofExperimental Psychology: Learning, Memory, and Cognition, 20, 1172-1182.
Salthouse, T. A., Kausler, D. H., & Saults, J. S. (1988). Investigation ofstudent status, background variables, and the feasibility of standardtasks in cognitive aging research. Psychology and Aging, 3, 29-37.
Salthouse, T. A., & Kersten, A. W. (1993). Decomposing adult agedifferences in symbol arithmetic. Memory & Cognition, 21, 699-710.
Schaie, K. W. (1989). Perceptual speed in adulthood: Cross-sectionaland longitudinal studies. Psychology and Aging, 4, 443-453.
Schaie, K. W. (1990). Correction to Schaie. Psychology and Aging, 5,171.
Steiger, J. H. (1989). EZPATH: A supplementary module for SYSTATand SYGRAPH. Evanston, IL: SYSTAT.
Underwood, B. J. (1975). Individual differences as a crucible in theoryconstruction. American Psychologist, 30, 128-134.
Underwood, B. J., Boruch, R. F., & Malmi, R. A. (1978). Compositionof episodic memory. Journal of Experimental Psychology: General,107, 393-419.
White, N., & Cunningham, W. R. (1987). The age-comparativeconstruct validity of speeded cognitive factors. Multivariate Behav-ioral Research, 22, 249-265.
Wickelgren, W. A. (1975). Age and storage dynamics in continuousrecognition memory. Developmental Psychology, 11, 165-169.
Winn, F. J., Elias, J. W., & Marshall, P. H. (1976). Meaningfulness andinterference as factors in paired-associate learning with the aged.Educational Gerontology, 1, 297-306.
Received September 20,1993Revision received April 4,1994
Accepted April 5,1994