journal of entrepreneurship and innovation...
TRANSCRIPT

Journal of Entrepreneurship and Innovation ManagementGirişimcilik ve İnovasyon Yönetimi Dergisi
Cilt / Volume 2 | Sayı / Issue 3 | Aralık / December 2013

Derginin Adı : Girişimcilik ve İnovasyon Yönetimi Dergisi
Derginin İngilizce Adı : Journal of Entrepreneurship and Innovation Management
ISSN : 2147-5792
Dergi web adresi : www.betadergi.com
Yayıncı Kuruluş : Beta Basım Yayım Dağıtım A.Ş.
Sorumlu Müdür : Seyhan SATAR
Editör : Doç. Dr. Cevahir UZKURT
Editör Yardımcısı : Dr. Serdal TEMEL
Girişimcilik ve İnovasyon Yönetimi Dergisi, yılda iki kez Haziran ve Aralık aylarında yayınlanan hakemli bir dergidir. Dergide yayınlanan yazıların sorumluluğu yazarlarına aittir. Dergide yayınlanan yazılar kaynak göste-rilmeksizin kısmen ya da tamamen iktibas edilemez. Derginin elektronik versiyonuna www.betadergi.com adresinden ulaşılabilir.
Girişimcilik ve İnovasyon Yönetimi DergisiJournal of Enreprenuership and Innovation Managment
Editör / Editor In-ChiefCevahir UZKURT
T.C. Bilim, Sanayi ve Teknoloji Bakanlığı / The Republic of TurkeyMinistry of Science, Industry and Technology
Tel: 0090 312 201 52 51 Fax: 0090 312 201 52 53
Editör Yardımcısı / Vice-EditorSerdal TEMEL
Ege Üniversitesi Bilim Teknoloji Uygulama veAraştırma Merkezi / Ege University Science and Technology Centre,
Tel: 0090 232 343 44 00Fax: 0090 232 374 42 89
[email protected] , [email protected]
EDITORIAL BOARD Aidin SALAMZADEH (Serbia Institute of Economic Sciences / University of Tehran) Akın KOÇAK (Ankara University) Anne-Laure MENTION (Centre de Recherche Public Henri Tudor) Auste KISKIENE (Kazimiero Simonaviciaus University) B. Zafer ERDOĞAN (Anadolu University) Brad BERNTHAL (University of Colorado) Cengiz YILMAZ (METU) Claudia De FUENTES (Saint Mary’s University) Erol EREN (Beykent University) Erol TAYMAZ (Middle East Technical University) Garry BRUTON (Texas Christian University) Gundega LAPINA (Riga International School of Economics and Business) Hasan Kürşat GÜLEŞ (Selcuk University) Hayriye ATİK (Erciyes University) Jülide KESKEN (Ege University) Marina RANGA (Stanford University) Mehmet BARCA (Yıldırım Beyazıt University) Metin DURGUT (Middle East Technical University) Metin TOPRAK (Turkish Competition Authority) Nükhet HARMANCIOĞLU (Koc University) Ömer TORLAK (Eskişehir Osmangazi University)

Onno OMTA (Wageningen University) Oya TUKEL (Cleveland State University) Philip KITCHEN (Brock University) Rachna KUMAR (Alliant International University) Şirin ELÇİ (Technopolis Group) Şuayip ÖZDEMİR (Afyon Kocatepe University) Tamer MÜFTÜOĞLU (Baskent University) Tuğrul DAİM (Portland State University) Yılmaz ÜRPER (Anadolu University)
BOARD of REVIEWERS Adem KALÇA (Karadeniz Technical University) Aidin SALAMZADEH (Serbia Institute of Economic Sciences / University of Tehran) Ali AKGÜN (Gebze Institute of Technology) Annie ROYER (University of Laval) Çağrı BULUT (Yasar University) Cem IŞIK (Ataturk University) Danny SOETANTO (Lanchester University) İlker Murat AR (Karadeniz Technical University) Murat DULUPÇU (Suleyman Demirel University) Oğuz TÜRKAY (Sakarya University) Özge GOKBULUT ÖZDEMİR (Fırat University) Öznur YURT (Izmir University of Economics) Selahattin BEKMEZ (University of Gaziantep) Selçuk ÇEBİ (Karadeniz Technical University) Türkay DERELİ (Gaziantep University) Victor SCHOLTEN (DELFT University) Ying ZHANG (Erasmus University)

From The Editors
Dear Colleagues,
Welcome to the third issue of the Journal of Entrepreneurship and Innovation Management (JEIM). The JEIM is part of a growing research community and drawing great interest from many in-
ternational researchers. Although launched locally, JEIM has gone beyond the borders and become global.
In this issue we have six papers submitted from six different countries. We also have papers from Globalics Congress, which was organized in Turkey. The topics of the papers are from a variety of fields in innovation and entrepreneur-ship: the ecosystem of start-ups, barriers to innovation, managerial cognition in high-tech companies, and cluster development. It is great to see all of these top-ics in JEIM; it is very good sign for the journal’s future.
This growing interest also led us to make our journal available through the internet. We decided to set up a new website for JEIM (http://www.betadergi.com/jeim/) and publish on-line. Individual papers and entire issues will be avail-able through the journal website, including the past two issues. We thank our publisher, Beta Yayinclik Company, for this motivating initiative and investment.
We also extended our Editorial and Reviewer boards by inviting well known researchers from different universities and countries. Currently, there are 46 members on both the Editorial Board and the Reviewer Board. We are also open for new applications to the Board of Reviewers. Please contact us via the email addresses provided in the contact list if you are interested in joining this panel.
We thank each of you for submitting your papers and following the papers published in the Journal of Entrepreneurship and Innovation Management. Of course, we’re grateful to the reviewers who have done a great job, contributing a huge amount of time from their very busy schedules.
We hope this issue will help many of us to extend our understanding of the covered topics.
Best Regards
Assoc. Prof. Cevahir UZKURT
Editor-in Chief


İçindekiler / Content
Identification of Structural Restricting and Driving Factors of Development of Corporate Entrepreneurship (CE): A Case Study
Sepideh Firouzyar, Davood Kia Kojouri .......................... 1
The Brazilian Entrepreneurial Ecosystem of Startups: an analysis of entrepreneurship determinants in Brazil as seen from the OECD pillars
Carlos Arruda, Vanessa Silva Nogueira, Vinícius Costa ............................................................... 17
Cluster Development in Low Resource Settings: the Case of Bioethanol and Fruit Processing Clusters in Uganda
Julius Ecuru, Lena Trojer, Peter Okidi Lating, Yasin Naku Ziraba ........................................................ 59
Managerial Cognition in R&D Processes Within Indian hi-tech firms: A Conceptual Framework
Niharika Garud, Lakshmanan Prasad ......................... 79
Barriers In Partnerships In Open Innovation Process
Ömür Yaşar Saatçıoğlu ................................................. 99
OECD Ülkeleri ve Komşu Ülkelerin Bilgi Düzeylerinin Bilgi Haritası Yöntemi İle Analizi
Cem Işık ...................................................................... 121
R&D and Innovation Events in Turkey ..................... 139


Girişimcilik ve İnovasyon Yönetimi Dergisi
Journal of Entrepreneurship and Innovation Management
1Cilt/Volume 2 | Sayı/Issue 3 | Aralık/December 2013 | 1-16
Identification of Structural Restricting and Driving Factors of Development of Corporate Entrepreneurship (CE):
A Case Study
Sepideh Firouzyar*, Dr. Davood Kia Kojouri**
Abstract
Tourism and entrepreneurship have progressed on different paths and rarely have any major crossover occurred in each of their literatures to cross-fertilize the development of the subject areas. The tourism indus-try is often said to be less innovative than other industries. In order to make the organization more entrepreneur friendly and therefore innova-tive, driving and restricting factors need to be identified, improved and reinforced. This paper presents the identification of structural restricting and driving factors of development of Corporate Entrepreneurship (CE) in organization. The studied organization is one of the transportation companies in Iran. A questionnaire was designed according to the Likert Scale. The sampling has been done through census among 100 managers of the studied organization. By using SPSS software and analyzing the outcome of the questionnaires, restricting and driving factors are recog-nized. This study concludes that five factors such as information resource system, organizational structure, organizational strategy, task method-ology, and process and physical opportunities are driving factors. The research and development system, control and supervisionary system, wage and salary system, finance and budget system and human resource management are counted as restricting factors.
Key words: Tourism Management, Organizational entrepreneur-ship, Restricting factors, Driving factor.
* MSc Tourism Management, Maziyar University, Mazandaran, Iran
** Assistant Professor, Islamic Azad University, Chalous, Iran

Sepideh Firouzyar / Davood Kia Kojouri
Girişimcilik ve İnovasyon Yönetimi Dergisi / Journal of Entrepreneurship and Innovation Management2
1. Introduction
These days environmental and competitive conditions are dynamic and complicated, so companies have to find logical solutions to survive. Due to the globalization and converting industrial society to that of the technologi-cal ones, companies cannot compete with small and medium-sized enter-prises (SMEs) that are flexible and innovative. In order to maintain their growth and existence, most of the organizations are in serious need of inno-vation and find new opportunities (Dehnad and Mobaraki, 2010). Tourism and entrepreneurship have progressed on different paths and rarely has any major crossover occurred in each of their literatures to cross-fertilize the development of the subject areas (Ateljevic, 2009). Thus in this paper the relationship between tourism and entrepreneurship is analyzed.
The entrepreneurial function implies the discovery, assessment and ex-ploitation of opportunities, in other words, new products, services or pro-duction processes, new strategies and organizational forms, new markets for products, and inputs that did not previously exist (Shane and Venkataraman, 2000). Entrepreneurship is a complex phenomenon with many definitions. Landsrom (2000) describes entrepreneurship as discovering new business possibilities, organizing necessary resources and exploiting the business possibilities on the market. Today the pace of changes is increasing dra-matically in the society and accordingly, entrepreneurship is becoming more important for the development of societies. The society needs to develop both bigger and smaller businesses, old and new, to create conditions for the constantly present entrepreneurship that makes it possible for businesses to survive and develop in an unpredictable world (Mjornvik et al.,2008).
Tourism industry plays important role in business development in few past years (Bagherifard et al, 2013). The travel and tourism industry is the world’s largest and most diverse industry. Many nations rely on this dy-namic industry as a primary source for generating revenues, employment, private sector growth and infrastructure development (Gee and Fayos-Solá, 1997). Tourism development provides an avenue for overall economic devel-opment and a boost for local entrepreneurship (Ateljevic, 2009).
The main objective of this research is identifying structural restricting and driving factors of development of Corporate Entrepreneurship (CE) in an

Identification of Structural Restricting and Driving Factors of Development of Corporate Entrepreneurship (CE): A Case Study
3Cilt/Volume 2 | Sayı/Issue 3 | Aralık/December 2013
organization. Therefore, the research question is defined as below: “What are the restricting and driving factors of development of CE in an organization?”. This paper explains concepts of tourism, organizational entrepreneurship and restricting and driving factors. After literature review, the conceptual model is shown, and data analysis is presented, followed by discussion and conclusion.
2. Literature review
Corporate entrepreneurship is a process, which occurs in interaction with the environment. It appears that the environment plays a profound role in influencing corporate entrepreneurship: the more dynamic, hostile and heterogeneous the environment, more emphasis the company puts on en-trepreneurial activities. The corporate entrepreneurship literature highlights the importance of organizational factors for the pursuit of entrepreneurship in organizations (Heinonen and Korvela, 2003).
Literature indicates that a number of environmental factors present in organizations implementing corporate entrepreneurial concepts. Three ini-tial factor descriptions are offered as fostering entrepreneurial activity in-side corporations: (i) management support for corporate entrepreneurship, (ii) organizational structure, and (iii) resource availability. The empirical evidence supports the need for structure associated with entrepreneuring in various organizations, and validates corporate entrepreneurship as an important means for changing individual perceptions about the work en-vironment (Kuratko et al., 1990). In another study, Antoncic and Hisrich (2001) mention that while differing somewhat in their emphasis, activities and orientations, the four dimensions of corporate entrepreneurship– New business venturing, Innovativeness, Self-renewal, Proactiveness- are factors of Schumpeterian innovation, the building block of entrepreneurship.
Covin and Slevin (1991) pointed out that internal organizational factors play crucial role in fostering corporate entrepreneurship. Many researchers have provided empirical evidence for the importance of these factors that include: company’s organizational structure, incentive and control system, managerial support and resources, and organization boundary (Tanha et al.,
Sepideh Firouzyar / Davood Kia Kojouri
Girişimcilik ve İnovasyon Yönetimi Dergisi / Journal of Entrepreneurship and Innovation Management4
2011; Gupta and Srivastava, 2013). Hornsby et al. (2002) pointed out that at least five internal factors are necessary in order to foster middle managers’ activity, which are as follows: an appropriate use of rewards, gaining top management support, a supportive organizational structure, risk taking and tolerance for failure and finally, resource availability. Kuratko et al. (1990) also highlighted top management support, reward and resource availability, organizational structure and boundaries, risk taking and time availability as key internal factors able to enhance and support corporate entrepreneurship (Gupta and Srivastava, 2013).
Aghaee et al. (2010) found that performance evaluating system, me-chanical organizational structure, payments and rewards systems, research and development system and budgeting and financial system are the main obstacles. The best solutions are performance based payment system, creat-ing finance supportive departments, designing demand based research and development system, designing entrepreneurial organizational structure system and compiling opportunity based strategy for organizational entre-preneurship development in Iran National Petrochemical Company (NPC).
In another research, Dehnad and Mobaraki (2010) attempt to introduce the concept of corporate entrepreneurship and explain the organizational behavior factors as the most effective factors in the development of corpo-rate entrepreneurship. The research results indicate that from the perspec-tives of Homa managers at various organizational units, there is a variety of hindering and encouraging behavioral factors influential in the develop-ment of corporate entrepreneurship. Lack of adequate planning and staff partnership in the outcome of their creative actions, the organization’s in-clination to functional management and employees’ proficiencies are classi-fied as the restraining forces; the driving factors include the organization’s support from creativity and innovation, performance-based bonuses in the organization, risk culture, the organization’s inclination to multiple-skilled employees, teamwork culture, and the creation of common goals and values as well as strengthening them. These findings were partially supported by other researchers (e.g. see Moghimi, 2004).
In sum, researchers have used different terms to refer to the “entrepre-neurship inside an existing company” phenomenon. Terms such as Entre-

Identification of Structural Restricting and Driving Factors of Development of Corporate Entrepreneurship (CE): A Case Study
5Cilt/Volume 2 | Sayı/Issue 3 | Aralık/December 2013
preneurship, Corporate Entrepreneurship and Corporate Venturing have been used to describe essentially the same phenomena (Quesada et al., 2011). Although, to date there is only limited empirical evidence about the factors promoting entrepreneurship rather than corporate entrepreneurship (Parker, 2009), some main research works were mentioned above, based on which this study was shaped.
3. Conceptual Framework and Hypothesis
CE activities enhance a company’s success by promoting product and process innovations (Zahra et al,1999). It is brought into practice as a tool for business development, revenue growth, profitability enhancement, pioneer-ing the development of new products and services and processes (Kuratko, Montagno, and Hornsby, 1990; Zahra, 1991; Zahra & Covin, 1995; Lumpkin & Dess, 1996; Zahra, Jennings, and Kuratko, 1999; Miles & Covin, 2002). These CE activities can improve organizational growth and profitability and, depending on the company’s competitive environment, their impact may increase over time (Zahra et al,1999).
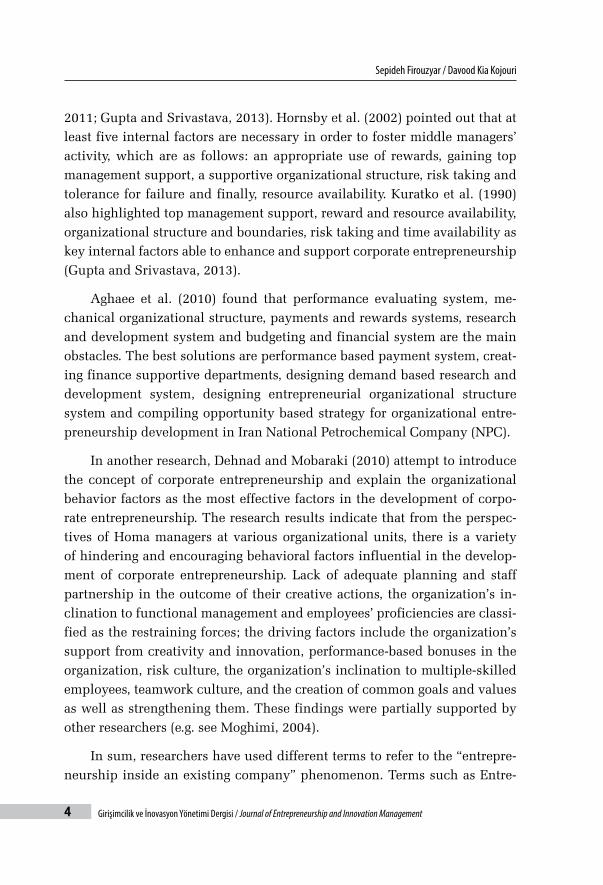
Lober (1998) believes that the three factors below cause development of organizational entreprenurship: (i) Internal organizational factors, (ii) Ex-ternal environmental factors, and (iii) Individual characteristics (Moghimi, 2004). Internal organizational factors can be categorized as behaviorial and structural factors. According to the literature review, theotherical back-ground of the conceptual model is shown in Figure 1. Descriptions of the variables have been mentioned in the Appendix.
Sepideh Firouzyar / Davood Kia Kojouri
Girişimcilik ve İnovasyon Yönetimi Dergisi / Journal of Entrepreneurship and Innovation Management6
Driving factors
Restricting factors
Organizational structure,Physical opportunities,
Organizational strategy,Task methodology and process,Control and supervision system,
Research and development system,Wage and salary system,
Financial system,Human resource system,
Information system
structural factors
Figure 1: Conceptual model
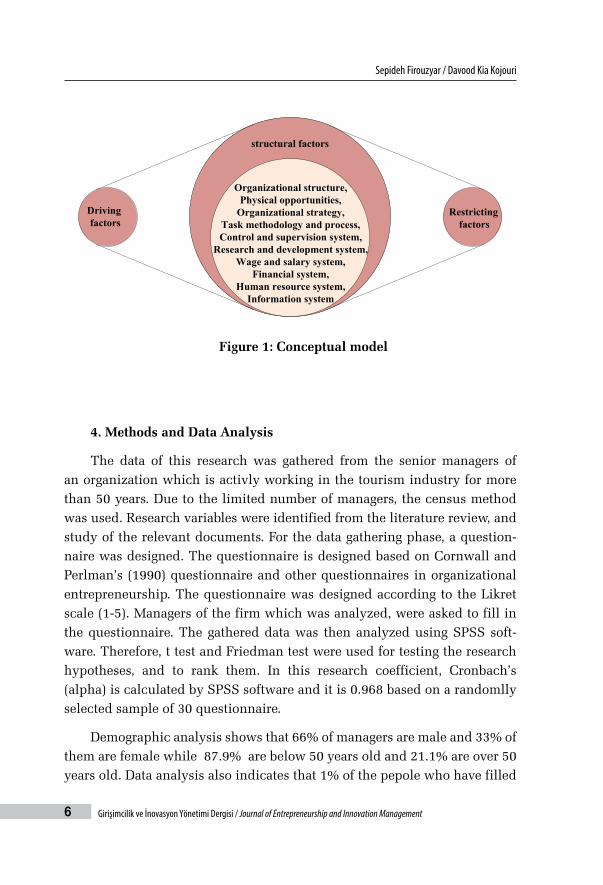
4. Methods and Data Analysis
The data of this research was gathered from the senior managers of an organization which is activly working in the tourism industry for more than 50 years. Due to the limited number of managers, the census method was used. Research variables were identified from the literature review, and study of the relevant documents. For the data gathering phase, a question-naire was designed. The questionnaire is designed based on Cornwall and Perlman’s (1990) questionnaire and other questionnaires in organizational entrepreneurship. The questionnaire was designed according to the Likret scale (1-5). Managers of the firm which was analyzed, were asked to fill in the questionnaire. The gathered data was then analyzed using SPSS soft-ware. Therefore, t test and Friedman test were used for testing the research hypotheses, and to rank them. In this research coefficient, Cronbach’s (alpha) is calculated by SPSS software and it is 0.968 based on a randomlly selected sample of 30 questionnaire.
Demographic analysis shows that 66% of managers are male and 33% of them are female while 87.9% are below 50 years old and 21.1% are over 50 years old. Data analysis also indicates that 1% of the pepole who have filled

Identification of Structural Restricting and Driving Factors of Development of Corporate Entrepreneurship (CE): A Case Study
7Cilt/Volume 2 | Sayı/Issue 3 | Aralık/December 2013
out the questionnaires have associate diplomas and 4% have PhDs and the rest have either a BA or an MA. About 50% of the respondents are over 20 years and 30% have more than 25 years of work experience.
T-test was used to identify the driving and restricting factor, and Fried-man test to rank them from the most driving to the least driving or in other words, to the most restricting one. So, null and alternative hypothesis are defined as below:
H0: The structural factors are a part of the driving factors in this survey.
Table 1: Result of t-test
Test Value = 3
T DF Sig.(2-tailed)
Mean Difference
95% Confidence Interval of the Difference
Lower Upper
Organizational structure
0.952 99 0.344 0.05959 -0.0647 0.1839
Information System
3.121 99 0.002 0.21000 0.0765 0.3435
Organizational Strategy
0.208 99 0.835 0.01583 -0.1349 0.1665
R & D -3.333 99 0.001 -0.22111 -0.3527 -0.0895
Task Methodology and Process
-0.229 99 0.820 -0.02000 -0.1936 0.1536
Control and Supervision System
-3.922 99 0.000 -0.31200 -0.4699 -0.1541
Human Resource System
-2.358 99 0.020 -0.18405 -0.3389 -0.0292
Financial System -2.981 99 0.004 -0.20482 -0.3412 -0.0685
Wage and salary system
-3.044 99 0.003 -0.21833 -0.3606 -0.0760
Physical opportunity
1.864 99 0.065 -0.31120 -0.4869 -0.1631
Sepideh Firouzyar / Davood Kia Kojouri
Girişimcilik ve İnovasyon Yönetimi Dergisi / Journal of Entrepreneurship and Innovation Management8
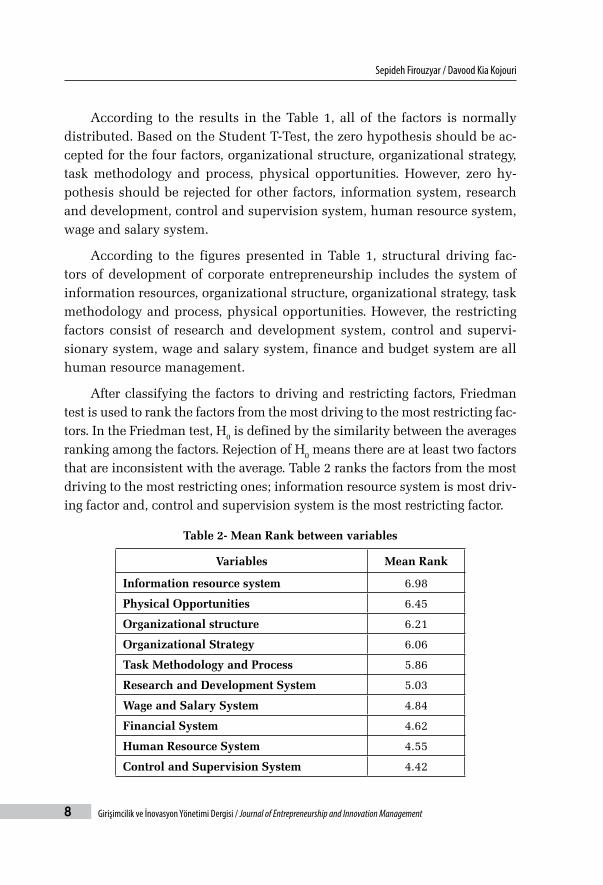
According to the results in the Table 1, all of the factors is normally distributed. Based on the Student T-Test, the zero hypothesis should be ac-cepted for the four factors, organizational structure, organizational strategy, task methodology and process, physical opportunities. However, zero hy-pothesis should be rejected for other factors, information system, research and development, control and supervision system, human resource system, wage and salary system.
According to the figures presented in Table 1, structural driving fac-tors of development of corporate entrepreneurship includes the system of information resources, organizational structure, organizational strategy, task methodology and process, physical opportunities. However, the restricting factors consist of research and development system, control and supervi-sionary system, wage and salary system, finance and budget system are all human resource management.
After classifying the factors to driving and restricting factors, Friedman test is used to rank the factors from the most driving to the most restricting fac-tors. In the Friedman test, H0 is defined by the similarity between the averages ranking among the factors. Rejection of H0 means there are at least two factors that are inconsistent with the average. Table 2 ranks the factors from the most driving to the most restricting ones; information resource system is most driv-ing factor and, control and supervision system is the most restricting factor.
Table 2- Mean Rank between variables
Variables Mean Rank
Information resource system 6.98
Physical Opportunities 6.45
Organizational structure 6.21
Organizational Strategy 6.06
Task Methodology and Process 5.86
Research and Development System 5.03
Wage and Salary System 4.84
Financial System 4.62
Human Resource System 4.55
Control and Supervision System 4.42

Identification of Structural Restricting and Driving Factors of Development of Corporate Entrepreneurship (CE): A Case Study
9Cilt/Volume 2 | Sayı/Issue 3 | Aralık/December 2013
5. Discussion and Conclusion
Research titled “Relation between organizational structure and orga-nizational entrepreneurship (Case study: manufacturing companies in the west of Mazandaran province)”, shows that there is a significant relation-ship between organizational structure and organizational entrepreneurship. In addition, it shows that there is a significant relationship between organic organizational structure and organizational entrepreneurship, and between mechanic organizational structure and organizational entrepreneurship (Ooshaksaraie et a.l, 2011).Research titled “consideration of the obstacles and structural ways in the organizational entrepreneurship development in National Petrochemical Company (NPC) in Tehran: a research based in Q-Methodology” concludes that performance evaluating system, mechani-cal organizational structure, payments and rewards systems, research and development system, and budgeting and financial system are the main ob-stacles (Aghaee and et al,2010).
Another research indicates that from the perspectives of Homa managers at various organizational units, there is a variety of hindering and encourag-ing behavioral factors influential in development of corporate entrepreneur-ship. Lack of adequate planning and staff partnership in the outcome of their creative actions, the organization’s inclination to functional management and employees’ proficiencies are classified as the restraining forces. Driving factors, on the other hand, are the organization’s support from creativity and innovation, performance-based bonuses in the organization, risk culture, the organization’s inclination to multiple-skilled employees, teamwork culture, and the creation of common goals and values (Dehnad and Mobaraki, 2010). Result of research titled “recognition of structural factors on college entrepre-neurial development” shows that organizational factors are most important and assessment system factors have least importance (Yadolahi et al, 2011).
Based on the findings, organizational structure is part of the driving factors in this survey. Moreover, based on the description of organizational structure, one can conclude that structure of an organization is flexible and adaptable. In other words, it has organic structure. This means that it helps the organization to have the organizational entrepreneurship. Moreover, the information system factor is an advancing factor. Moreover, based on the
Sepideh Firouzyar / Davood Kia Kojouri
Girişimcilik ve İnovasyon Yönetimi Dergisi / Journal of Entrepreneurship and Innovation Management10
description of the information system, one can conclude that the informa-tion system of organization is up-to-date and information is accessible for the right person at the right time. This means that it helps the organization to have the organizational entrepreneurship. This is supported by previous research (e.g. see Heinonen and Korvela, 2003; Gupta and Srivastava, 2013).
On the other hand, the organizational strategy is part of the driving fac-tors in this survey. Moreover, based on the description of the organizational strategy, one can conclude that the strategy of organization can identify new opportunities and threats or internal strengths and weakness. It also can as-sign a valuable mission. This means that it helps the organization to have the organizational entrepreneurship. Therefore, task methodology and process is part of the driving factors in this survey. Moreover, based on the descrip-tion of task methodology and process, one can conclude that task method-ology and process of organization is evaluated regularly. In other words, it has entrepreneurial process. This means that it helps the organization to have the organizational entrepreneurship. Also, the R&D system factor is a restricting factor. Moreover, based on the description of R&D system, one can conclude that R&D system of organization is not up-to-date. It shows entre-preneurs are not distributed in all sectors, managers do not pay attention to R&D. This means that it should reinforce to help the organization to have the organizational entrepreneurship. These findings are in line with previous works (see Kuratko et al., 1990; Aghaee et al., 2010)
In addition, the control and supervision system factor is a restricting factor. Moreover, based on the description of control and supervision sys-tem, one can conclude that control and supervision system of organization is not flexible. It shows controlling, rules, regulations and policies are much more than usual. This means that it should reinforce to help the organiza-tion to have the organizational entrepreneurship. Also, the human resource system factor is a restricting factor. Moreover, based on the description of human resource system, one can conclude that human resource system of organization is not entrepreneurial. It shows managers do not recruit based on meritocracy and fixed policy does not exist for recruitment. This means that it should reinforce to help the organization to have the organizational entrepreneurship (see Antoncic and Hisrich, 2001; Gupta and Srivastava, 2013).

Identification of Structural Restricting and Driving Factors of Development of Corporate Entrepreneurship (CE): A Case Study
11Cilt/Volume 2 | Sayı/Issue 3 | Aralık/December 2013
Furthermore, the financial system factor is a restricting factor. More-over, based on the description of financial system, one can conclude that financial system of organization is not entrepreneurial. It shows the firm’s financial performance in the short term. This means that it should reinforce to help the organization to have the organizational entrepreneurship. Also, the wage and salary system factor is a restricting factor. Moreover, based on the description of wage and salary system, one can conclude that wage and salary system of organization is not flexible. It shows payment is not based on risk-ability and innovation of the workers, it is just based on the physical presence. This means that it should change their system to have the organi-zational entrepreneurship. In addition, physical opportunities are part of the driving factors in this survey. Moreover, based on the description of physical opportunities, one can conclude that physical opportunities of organization help the organization to have organizational entrepreneurship (Kuratko et al., 1990; Gupta and Srivastava, 2013).
In sum, the current research shows that Task Methodology and Process, Information system, Organizational structure, Organizational strategy and Physical Opportunities are driving factors while Research and Development system, Control and Supervision System, Human Resource System, Financial System and Wage and Salary System are restricting factors. Indeed, entre-preneurship has a vital role in all activities in the organization. Since in all the third world counties, the government has a vast participation in all the economic, social and cultural aspects, changing the structure of organizations from traditional and bureaucratic to entrepreneurial ones has high impor-tance. This research indicates that different variables in the form of structural factors deeply affect and influence organizational entrepreneurship develop-ment. In addition, driving and restricting factors are identified by concen-trating on different factors of organizational structure. The results of this re-search show that five factors of information system, organizational structure, organizational strategy, task methodology and process, physical opportunities are driving factors while R&D system, control and supervision system, wage and salary system, financial system, human resource system are restricting factors. Therefore, by establishing necessary background and with improving driving factors and reinforcement of restricting factors, one can contribute to the development of entrepreneurship in the studied organization.
Sepideh Firouzyar / Davood Kia Kojouri
Girişimcilik ve İnovasyon Yönetimi Dergisi / Journal of Entrepreneurship and Innovation Management12
6. Suggestions and recommendations
With the help of previous researchers below and from what is derived in this research, here are the authors’ suggestions for restricting factors:
For developing Research and Development System it is suggested to: (i) Balance between fundamental and applied research, (ii) Considering long term rather than short term results, (iii) Select the projects based on clients and employees recommendations, (iv) Create new ideas through establishing R&D department to increase the satisfaction of clients. For the enhancement of Control and Supervision factor, the following are suggested: (i) Modifica-tion of control criteria to the number of novel ideas that officially have been accepted in the organization, (ii) Taking necessary actions in order to pro-mote clarification in the organization, (iii) Annual evaluation of the organi-zational operations with the view to considering weaknesses and strengths of the organization.
For the enhancement of the human resource system, it is recommended that: (i) All directors should be chosen based on meritocracy in a unified method, (ii) Establishment of a fixed policy for employment and recruit-ment, (iii) Test administration for choosing qualified employees and corre-sponding the field of study and their specialty with the offered positions. For the enhancement of the finance and budget system, the following are sug-gested: (i) Budgeting in the organization based on the plans and programs, (ii) Distribution of financial resources among different units in the organi-zation based on the priority of the programs, and (iii) Expediting financial resource allocations. For the enhancement of wage and salary systems, it is suggested that payments and salaries should be considered based on em-ployees operation and creativities.

Identification of Structural Restricting and Driving Factors of Development of Corporate Entrepreneurship (CE): A Case Study
13Cilt/Volume 2 | Sayı/Issue 3 | Aralık/December 2013
References
Antoncic, B., Hisrich, R. D. (2001), “Intrapreneurship: Construct refinement and cross-cultural validation”, Journal of Business Venturing, 16(5), pp. 495-527.
Atashi, A., Abdolpour, R. (2012), “Electronic Human Resources Management; En-abler of Innovation in Organization”, Journal of American Science, 8(9), pp. 582- 591.
Ateljevic, J., Stephen, J. (2009), Tourism and Entrepreneurship International Per-spective, Elsevier LTD.
Bagherifard, S. M., Jalali, M., Jalali, F., Khalili, P., & Sharifi, S. (2013), Tourism Entrepreneurship Challenges and Opportunities in Mazandaran, Journal of Basic and Applied Scientific Research, 3(4), pp. 842-846.
Behn, R.D. (1991), Leadership counts: Lessons for Public Managers from the Mas-sachusetts Welfare, Training, and Employment Program. Cambridge, MA: Harvard University Press.
Birch, D.L. (1987), Job Creation in America: How our smallest companies put the most people to work. New York: Free Press.
Beijerse, R.P. (2000), “Knowledge Management in Small and Medium-sized Companies: Knowledge Management for Entrepreneurs”, Journal of Knowledge Man-agement, 4(2), pp. 162-179.
Cornwall, J., Perlmn, B. (1990), Organizational Entrepreneurship, Richard Irwin.
Covin, J.G., Slevin. D. P. (1991), “A Conceptual Model of Entrepreneurship as Firm Behavior”, Entrepreneurship Theory and Practice, 16(1), pp. 7-25.
Dehnad, R. , Mobaraki, M.S. (2010), Identification of behavioral Restricting and Driving Factor of Development of Corporate Entrepreneurship (CE) Case Study: Iran Air, MA Thesis, Tehran University.
Egorov, Igor, Carayannis, Elias G. (1999), “Transforming the post-soviet research systems through incubating technological entrepreneurship”, Journal of Technology Transfer, 24(2/3), pp.159-172.
Gee, C. Y., Fayos-Solá, E. (1997), International Tourism: A Global Perspective, Madrid: World Tourism Organization.
Gupta, A., Srivastava, N. (2013), “An Exploratory Study Of Factors Affecting In-trapreneurship, International Journal of Innovative Research and Development, 2(8), pp. 1-8.
Sepideh Firouzyar / Davood Kia Kojouri
Girişimcilik ve İnovasyon Yönetimi Dergisi / Journal of Entrepreneurship and Innovation Management14
Kuratko, D., Montagno, R. V., & Hornsby, J. (1990), “Developing an Entrepre-neurial Assessment Instrument for an Effective Corporate Entrepreneurial Environ-ment”, Strategic Management Journal, 11, pp. 49-58.
Hashemi, K. (2012), “Key Strategic Steps in Setting a Business; A Review of Some Basic Entrepreneurial Facts”, Journal of American Science, 8(2), pp. 551-553.
Gupta, A., Srivastava, N. (2013), “An Exploratory Study Of Factors Affecting Intrapreneurship”, International Journal of Innovative Research and Development. 2(8), pp. 1-8.
Hayton, J. (2005), “Promoting Corporate Entrepreneurship through Human Re-source Management Practices: A Review of Empirical Research”, Human Resource Management Review, 15(1), pp. 21-41.
Heinonen, J., Korvela, K. (2003), How about Measuring Intrapreneurship?, In Conference Proceedings of 33rd EISB (Entrepreneurship, Innovation and Small Business) Conference in Milan, Italy.
Hornsby, J.S., D.F. Kuratko & Zahra. S.A. (2002), “Middle Managers’ Perception of the Internal Environment for Corporate Entrepreneurship: Assessing a Measurement Scale”, Journal of business Venturing, 17(3), pp. 253-273.
Kuratko, D.F., Montagno, R.V., & Hornsby, J.S. (1990), “Developing an Entrepre-neurial Assessment Instrument for an Effective Corporate Entrepreneurial Environ-ment”, Strategic Management Journal, 11, pp. 49-58.
Lumpkin, G. T. Dess, G. G (1996), “Clarifying the Entrepreneurial Orientation Construct and Linking it to Performance”, Academy of Management Review, 21(1), pp. 135-172.
Miles,M.B., Covin, J.G. (2002), “Exploring the Practice of Corporate Venturing: Some Common Forms and their Organizational Implications”, Entrepreneurship: Theory & Practice, 26(3), pp. 21-40.
Mjornvik, J. & Sanfridsson, M., & Dergard, J, (2008), Management Control Sys-tem Entrepreneurship in Lusaka: A Minor Field Study in Zambia, Master’s Thesis, Handelshogskolan Vid Goteborgs University.
Moghimi, S. M. (2006), “Corporate Entrepreneurship: Obstacles and Alterna-tives (the case of industrial corporation in Iran) ”, Journal of Entrepreneurship Re-search, 1, pp. 1-18.
Moghimi, S.,M. (2004), The Effects Factors on Organizational Entrepreneurship in Governmental Cultural and Social Organizations, Tehran University.
Mokwa, M., Permut, S. (1981), Government Marketing, New York: Praeger.
Identification of Structural Restricting and Driving Factors of Development of Corporate Entrepreneurship (CE): A Case Study
15Cilt/Volume 2 | Sayı/Issue 3 | Aralık/December 2013
Morrison, A., Rimmington, M. & Williams, C. (1999), Entrepreneurship in the Hospitality, Tourism and Leisure Industry, Oxford: Butterworth Heinemann.
Nutt, P.C., Backoff, R.W. (1993), “Transforming Public Organizations with Stra-tegic Management and Strategic Leadership”, Journal of Management, 19(2), pp. 299-347.
Ooshaksaraie, M., Asghari, M.,H., Farajpur, Z., & Taleghani, M. (2011), “Rela-tion Between Organizational Structure and Organizational Entrepreneurship (Case Study: Manufacturing Companies in the West of Mazandaran Province)”, Kuwait Chapter of Arabian Journal of Business and Management Review, 1(4), pp. 150-159.
Parker, S. C. (2009), “Intrapreneurship or entrepreneurship?”, Journal of Busi-ness Venturing, 26(1), pp. 19-34.
Quesada, U. G., Onaindia, E., & Laburu, C. O. (2011), Determinant Factors for Intrapreneurship: A Case Study Based Analysis. In fifth International Conference on Industrial Engineering and Industrial Management (pp. 56-65).
Shane, S.A. & Venkataraman, S. (2000), “The Promise of Entrepreneurship as a Field of Research”, Academy of Management Review, 25, pp. 217-226.
Tanha, D., Salamzadeh, A., Allahian, Z., & Salamzadeh, Y. (2011), “Commer-cialization of University Research and Innovations in Iran: Obstacles and Solutions”, Journal of Knowledge Management, Economics and Information Technology, 1(7), pp. 126-146.
Yadolahi Farsi, J., Zali, M.R., Bagheri Frad, S. M. (2011), Recognition of Structur-al Factors on Collage Entrepreneurial Development, MA Thesis, Tehran University.
Zahra, S.A., Nielsen, A.P., & Bogner, W.C. (1999), “Corporate Entrepreneurship, Knowledge, and Competence Development”, Entrepreneurship: Theory and Prac-tice, 23(3), pp. 169-189.
Zahra, S., Covin. J.G. (1995), “Contextual Influences on the Corporate Entrepre-neurship-Performance Relationship: A Longitudinal Analysis”, Journal of Business Venturing, 10(1), pp. 43-58.
Zahra, S. (1991), “Predictors and Financial Outcomes of Corporate Entrepre-neurship: An Exploratory Study”, Journal of Business Venturing, 6(4), pp. 259-285.
Zahra, S. A., Jennings, D. F., & Kuratko, D. F. (1999), “The Antecedents and Con-sequences of Firm-level Entrepreneurship: The State of the Field”, Entrepreneurship Theory & Practice, 24, pp. 45-65.

Sepideh Firouzyar / Davood Kia Kojouri
Girişimcilik ve İnovasyon Yönetimi Dergisi / Journal of Entrepreneurship and Innovation Management16
Appendix
Descriptions of variables
Variables Description Source(s)/reference(s)
Organizational structure
Entrepreneurial organizations are flexible and adaptab-le, far from the bureaucratic and mechanistic organiza-tion.
Birch, 1987
Organizational Strategy
A stream of research suggests that entrepreneurship is linked to strategic management that enables public sector organizations to identify new opportunities and generate new process and service innovations.
Behn, 1991; Mokwa & Permut, 1981; Nutt & Backoff,1993
Wage and salary system
As mentioned by Cornwall and Pearlman (1990), pay-ments in salary system of an innovative organization are related to performance not physical presence. Pay-ments are flexible and consider riskability and creati-vity criteria of individuals.
Atashi and Abdolpour, 2012
Financial System
Successful entrepreneurial accomplishments will inevi-tably affect the firms’ financial performance in the long term, barely in the short term; there might be no associ-ation among the CE climate factors and firms’ financial performance criteria due to project investments and firms’ internal resource usages or possible losses.
Hayton, 2005
Research and Development System
Through redistribution of specilalists between sectors and creation of favorable conditions for innovative ac-tivity in this organization, the effictiveness of existing science and engineering work would be increasing and this is only aplicable by R&D system.
Egorov and Carayannis, 1999
Control and Supervision System
Controlling Rules, regulations and policies should be decreased to a minimum level and a free controlling system should be designed.
Moghimi, 2006
Human Resource System
Human Resources Management (HRM) is the function within an organization that focuses on the recruitment of, the management of, and providing direction for the people who work in the organization. Human resources provide a source for competitive advantage and the qua-lity of HRM is a critical influence on the performance of firms, the strategic approach is a characteristic of HRM .
Hashemi, 2012
Physical Opportunities
Physical opportunites include all assets, buildings, office equipments, and vehicles.
Moghimi, 2004
Task Methodology and Process
Task methodology and process should be evaluated regularly in organizational entreprenurship and mana-gers should omit and/or merge the processes which are recognized as barriers of innovation and entreprenurs-hip or causes dissatisfaction of customers.
Moghimi, 2004
Information System
Information should be easily accessible throughout the organization. The decisions made based on the information are influenced by attitude and capacity to interpret information in order to make it meaningful and useful.
Beijerse, 2000

Girişimcilik ve İnovasyon Yönetimi Dergisi
Journal of Entrepreneurship and Innovation Management
17Cilt/Volume 2 | Sayı/Issue 3 | Aralık/December 2013 | 17-57
The Brazilian Entrepreneurial Ecosystem of Startups: an analysis of entrepreneurship
determinants in Brazil as seen from the OECD pillars
Carlos Arruda*, Vanessa Silva Nogueira**, Vinícius Costa***
Abstract
This paper presents the main findings exacted from a quantitative and qualitative investigation into mapping the Brazilian startup entre-preneurial ecosystem. The analysis was set up as of the six entrepreneur-ship determinant categories defined by the Organization of Economic Co-Operation and Development (OECD), to wit: the regulatory frame-work; market conditions; access to finance; the creation and diffusion of knowledge; entrepreneurial capabilities; and entrepreneurship culture. The study involved gathering quantitative data from secondary bases underlying each one of the six pillars and interviewing Brazilian repre-sentatives of the determinants indicated above, to proceed to understand which development stage Brazil is in as concerns encouraging entrepre-neurial practice and the favorability of the entrepreneurial ambiance in the country.
Key words: Entrepreneurship. Startup. Ecosystem. Determinants. OECD.
* PhD, Innovation and Entrepreneurship Research Center, Fundação Dom Cabral [email protected]
** MSc, Innovation and Entrepreneurship Research Center, Fundação Dom Cabral, [email protected]
*** Research Fellow, Innovation and Entrepreneurship Research Center, Fundação Dom Cabral, [email protected]
Contact address: Av. Princesa Diana, 760 - Alphaville, Lagoa dos Ingleses - 34000-000 - Nova Lima/MG - Brazil
Carlos Alberto Arruda de Oliveira / Vanessa Silva Nogueira / Vinícius Costa
Girişimcilik ve İnovasyon Yönetimi Dergisi / Journal of Entrepreneurship and Innovation Management18
1. INTRODUCTION
High-growth startup companies tend to improve their chances of suc-cess when inserted in an entrepreneurial ecosystem that encourages busi-ness development and innovation. Two benchmarks are the Silicon Valley and Israel, world-acclaimed for their success in entrepreneurial develop-ment and for yielding, in one year, more successful startups than other na-tions could create in years or decades. Although their respective ambiances are completely different, both Israel and the Silicon Valley seem to contain a combination of variables in their ecosystem that encourages the entrepre-neurial activity to blossom.
Thus, it is plausible to believe that different nations, albeit resting upon different contexts, are capable of building their own entrepreneurial ecosys-tems that can encourage the appearance of successful business concerns. For such, the strengths and weaknesses particular to any such community or country beg understanding to develop their entrepreneurship ecosystem on a par with the needs posed by local reality.
Isenberg (2010) postulates that “there’s no exact formula for creating an entrepreneurial economy; there are only practical, if imperfect, road maps”. This is akin to saying that it is not possible, for example, to replicate a new Silicon Valley in another community or nation by simply replicating the same characteristics of its entrepreneurship ecosystem; rather that, it is fea-sible to identify benchmark elements to be analyzed and developed accord-ing to each country’s specific reality.
For the purposes of this study, benchmark elements are the OECD’s en-trepreneurship determinant groups, to wit: the regulatory framework; mar-ket conditions; access to finance; the creation and diffusion of knowledge; entrepreneurial capabilities and entrepreneurship culture. The research ef-fort starts from these pillars to investigate who are the actors composing the Brazilian entrepreneurship ecosystem and what role they play as they oper-ate and evolve. Thus, this effort systematically identifies the characteristics, strengths and weaknesses of the Brazilian entrepreneurship environment focusing on the development of startups, becoming a relevant tool to steer the progress of entrepreneurial practice in Brazil.

The Brazilian Entrepreneurial Ecosystem of Startups
19Cilt/Volume 2 | Sayı/Issue 3 | Aralık/December 2013
The research also indicates benchmark countries for each of the inves-tigation’s pillars and draws a comparison with the Brazilian reality, seeking to broaden the comprehension of the country’s entrepreneurial ecosystem.
To meet the proposed objectives, the full study on which this paper is based was structured in two stages, the first being a qualitative research comprised of in-depth interviews with different actors in the Brazilian en-trepreneurship environment, amidst which notably startup entrepreneurs, investors and investment fund managers, researchers from public universi-ties and representatives of entrepreneurship supporting institutions, such as hubs, incubators, accelerators and law firms from five Brazilian states; and a second stage comprising a research effort involving the compilation of secondary quantitative data gathered from official institutions such as the World Bank, Unesco, the OECD, and the Brazilian Internal Revenue Ser-vice, among others, besides world-acclaimed research reports such as Doing Business, the Global Competitiveness Report, the Global Entrepreneurship Monitor (GEM), inter alia.
Notably, the construction of the quantitative database was based on OECD-developed methodology and represents a pioneer effort in that there are no known previous efforts of applying this entrepreneurship investiga-tion and mapping technology in Brazil – a country that is not an OECD mem-ber – at the level of detail and systematization applied in this study.
Finally, this paper is divided into 5 Chapters. The next Chapter presents the main theoretical references used in the construction of the database and for analysis. Chapter 3 contains information on the methodology employed. Chapter 4 presents the main research findings, while Chapter 5 ends this paper by outlining conclusions on the proposed theme and evaluating pos-sibilities for future studies.
2. THEORETICAL FOUNDATIONS
Resorting to Schumpeter’s classic Capitalism, Socialism and Democra-cy is one of the pathways – and arguably the most concrete – to understand the reasons for the permanent relevance of entrepreneurship and the space it broaches in the discussion agendas concerning public policies worldwide.

Carlos Alberto Arruda de Oliveira / Vanessa Silva Nogueira / Vinícius Costa
Girişimcilik ve İnovasyon Yönetimi Dergisi / Journal of Entrepreneurship and Innovation Management20
In his writings, Schumpeter posits that the business concern is the funda-mental element for the capitalist system to operate and develop. This is pre-cisely due to entrepreneurship, which allows the creation of new products, new production methods and new business models, besides being the main responsible for opening new markets. (Schumpeter, 1975).
Governments of different nations are aware of its importance and regard this theme as the indispensable element to preserve the viability and com-petitiveness of a country’s economy. However, the great attention given the subject worldwide notwithstanding, measuring entrepreneurship locally, re-gionally, nationally or internationally has loomed as a major challenge for decades (OECD, 2009).
In this sense, a few efforts have been undertaken in the attempt to sys-tematize what could be called “an entrepreneurial economy model”, pin-pointing the main variables to be considered while assessing entrepreneur-ship. For the purposes of this study, two such models were used as main frameworks: Isenberg’s (2011) and the OECD (2011).
Daniel Isenberg’s model stems from the initiative developed at the Bab-son College called BEEP – Babson Entrepreneurship Ecosystem Project. By studying the different attempts at fostering entrepreneurship elsewhere in the world, those involved in the project understood that there was not a unique, single characteristic to determine the success of local entrepreneur-ship, quite the contrary: an entire ecosystem of variables was needed to fos-ter entrepreneurship sustainable along time and indeed bringing positive social and economic impacts upon the economy. Then the next step was to develop the concepts and the methodology to understand different com-munities and nations, and work with each of their stakeholders upon the necessary elements for a blossoming, healthy and structured entrepreneur-ship ecosystem. As indicated in Figure 1, the following domains of entre-preneurship were defined: policy, finance, culture, supports, human capital and markets.

The Brazilian Entrepreneurial Ecosystem of Startups
21Cilt/Volume 2 | Sayı/Issue 3 | Aralık/December 2013
Figure 1: Domains of the Entrepreneurship Ecosystem Source: ISENBERG, Daniel. View the Ecosystem Diagram, 2011. Available at: <http://entrepre-neurial- revolution.com/view-the-ecosystem-diagram/> Acessed by: 25 april 2013.
Within the scope of policy are governmental institutions to support en-trepreneurship, be they public universities that assume an important role by creating knowledge that will eventually be taken to market as a product, or regulatory bodies charged with the implementation of incentives for, or removal of bureaucratic barriers against, fostering business development.
Within the sphere of finance are private institutions in charge of entre-preneurship funding, such as angel investors, venture capital funds and seed capital, among others.
Culture encompasses all social characteristics of a community and the sub-jective aspects related to the manner by which individuals relate to each other, what they reproach and what is reason for recognition. All these aspects are evidently analyzed through the eyes of the entrepreneur. Fear of failure, for ex-ample, is a limiting cultural factor against the development of entrepreneurship.

Carlos Alberto Arruda de Oliveira / Vanessa Silva Nogueira / Vinícius Costa
Girişimcilik ve İnovasyon Yönetimi Dergisi / Journal of Entrepreneurship and Innovation Management22
Within the scope of supports are the institutions not belonging or relat-ed to government that play the role of entrepreneurship stimulators, such as hubs, accelerators, incubators, plus, for example, accounting and law firms required to provide support to the establishment of new companies.
Human capital include both those professionals who amassed their skills through entrepreneurship-veered education, and mass work force, an intrinsic need of a market seeking economic progress through the creation of new companies.
The markets orbit, finally, approaches the need of an existing consumer mass, ready to purchase new products and disseminate them via a domestic and international contact network.
Daniel Isenberg (2011) theorizes that the development of entrepreneur-ship will occur in fact only if these different ecosystem elements are handled altogether, albeit it is not necessary to “worry about changing everything on a full scale at once”.
That perception might be a complement of Bygrave point of view on the same issue. He also understand entrepreneurship by being “embedded in a massive structure: society, government, culture, the economy, legal issues, business environment and so on” (Bygrave, 1998).
Thus, it is possible to question, for example, why does Korea not cre-ate a greater number of startups, considering the great affinity Koreans have with technology. The answer resides in culture, a determinant variable that is a development-limiting factor in that country. “In Korea, one should not be exposed while failing. Yet, in early 2000, many entrepreneurs jumped on the bandwagon of a new economy [the internet bubble]. When the bubble burst, their public failure left a scar on entrepreneurship” (Senor and Sing-er, 2009). The presence of skilled professionals in this case demonstrates a well-developed “human capital” domain, favorable to entrepreneurial devel-opment. However, without expounding on the “culture” domain, an entre-preneurial revolution in that country is not viable.
Even when analyzing countries of one specific geographic region, like it is the Latin America and Caribbean, for example, different strengths and weaknesses can be observed and have to be addressed individually, taking into account each ecosystem’s peculiarities.

The Brazilian Entrepreneurial Ecosystem of Startups
23Cilt/Volume 2 | Sayı/Issue 3 | Aralık/December 2013
When analyzing the variables mapped to Latin America and the Ca-ribbean in the 2012 edition of the Global Entrepreneurship Monitor (GEM) that are related to the individuals’ attitudes and perceptions regarding the entrepreneurial environment of each country, it is clear that aspects such as entrepreneurship opportunities, training and fear of failure are differently perceived by each country’s respondents and, therefore, differently affect the entrepreneurship development.
Table 1: Entrepreneurial Attitudes and Perceptions in the GEM Countries in 2012 by Geographic Region
Eco
nom
y
Per
ceiv
edop
por
tun
itie
s
Per
ceiv
edca
pab
ilit
ies
Fear
of
fail
ure
*
En
trep
ren
euri
alin
ten
tion
s**
En
trep
ren
eurs
hip
as a
goo
d c
aree
rch
oice
+
Hig
h s
tatu
sto
su
cces
sfu
len
trep
ren
eurs
+
Med
ia a
tten
tion
for
entr
epre
neu
rsh
ip+
LATIN AMERICA & CARRIBEAN
Argentina 50 63 27 29 74 67 63
Barbados 47 70 17 23 - - -
Brazil 52 54 31 36 89 86 86
Chile 65 60 28 43 70 68 66
Colombia 72 57 32 57 89 75 69
Costa Rica 47 63 35 33 72 72 79
Ecuador 59 72 33 51 88 84 79
El Salvador 43 59 42 40 73 72 62
Mexico 45 62 26 18 56 54 38
Panama 38 43 17 12 - - -
Peru 57 65 30 45 77 73 76
Trinidad &Tobago 59 76 17 37 78 76 64
Uruguay 51 58 27 20 61 59 51
Average(unweighted) 53 62 28 34 75 71 67
* Fear of failure assessed for those seeing opportunities** Intentions assessed among nonentrepreneur population+ These questions were optional and therefore not included by all economies
Source: Global Entrepreneurship Monitor 2012 Global Report
Carlos Alberto Arruda de Oliveira / Vanessa Silva Nogueira / Vinícius Costa
Girişimcilik ve İnovasyon Yönetimi Dergisi / Journal of Entrepreneurship and Innovation Management24
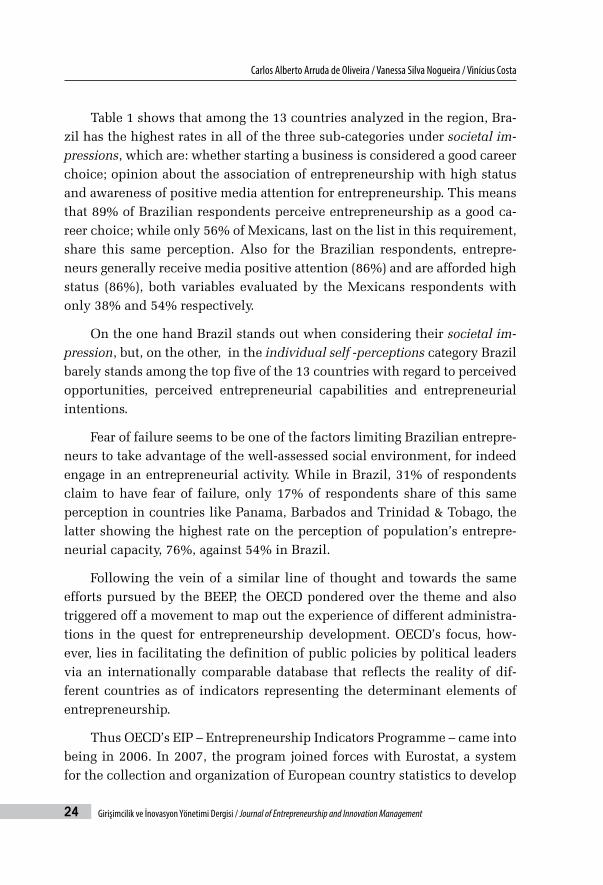
Table 1 shows that among the 13 countries analyzed in the region, Bra-zil has the highest rates in all of the three sub-categories under societal im-pressions, which are: whether starting a business is considered a good career choice; opinion about the association of entrepreneurship with high status and awareness of positive media attention for entrepreneurship. This means that 89% of Brazilian respondents perceive entrepreneurship as a good ca-reer choice; while only 56% of Mexicans, last on the list in this requirement, share this same perception. Also for the Brazilian respondents, entrepre-neurs generally receive media positive attention (86%) and are afforded high status (86%), both variables evaluated by the Mexicans respondents with only 38% and 54% respectively.
On the one hand Brazil stands out when considering their societal im-pression, but, on the other, in the individual self -perceptions category Brazil barely stands among the top five of the 13 countries with regard to perceived opportunities, perceived entrepreneurial capabilities and entrepreneurial intentions.
Fear of failure seems to be one of the factors limiting Brazilian entrepre-neurs to take advantage of the well-assessed social environment, for indeed engage in an entrepreneurial activity. While in Brazil, 31% of respondents claim to have fear of failure, only 17% of respondents share of this same perception in countries like Panama, Barbados and Trinidad & Tobago, the latter showing the highest rate on the perception of population’s entrepre-neurial capacity, 76%, against 54% in Brazil.
Following the vein of a similar line of thought and towards the same efforts pursued by the BEEP, the OECD pondered over the theme and also triggered off a movement to map out the experience of different administra-tions in the quest for entrepreneurship development. OECD’s focus, how-ever, lies in facilitating the definition of public policies by political leaders via an internationally comparable database that reflects the reality of dif-ferent countries as of indicators representing the determinant elements of entrepreneurship.
Thus OECD’s EIP – Entrepreneurship Indicators Programme – came into being in 2006. In 2007, the program joined forces with Eurostat, a system for the collection and organization of European country statistics to develop

The Brazilian Entrepreneurial Ecosystem of Startups
25Cilt/Volume 2 | Sayı/Issue 3 | Aralık/December 2013
definitions and concepts that would become the base for the construction of a database on the entrepreneurship phenomenon at the world level.
The result of the OECD-Eurostat partnership is depicted in the Figure 2:
Topic categories for entrepreneurship indicators
Determinants
Regulatoryframework
Culture Market conditions
R&D andtechnology
Entrepreneurialcapabilities
Access tofinance
Entrepreneurialperformance Impact
Firm-based indicators Job creation
Economic growthEmployment-based indicators
Poverty reductionOther indicators of
entrepreneurial performance
Figure 2: Top categories for entrepreneurship indicators
Source: OCDE. Measuring Entrepreneurship: a Collection of Indicators, 2009.
As seen in Figure 2, OECD identifies three different, however inter-linked, flows, which are important for the evaluation and formulation of entrepreneurship policies: determinants, entrepreneurial performance and impact. “The first stage of the model comprises various determinants which policy can affect and which in turn influence entrepreneurial performance, or the amount and type of entrepreneurship that take place. The final stage is the impact of entrepreneurship on higher-level goals such as economic growth, job creation or poverty reduction” (Hoffman and Ahmad, 2007).
Albeit recognizing the importance of studying the entire proposed flow, this research effort is concentrated upon the analysis of entrepreneurship determinants, as defined in the first quadrant of Figure 21.
1 Because of model complexities, the variables are dynamic and have been con-stantly improved since their inception in 2006. Therefore, although Figure 2 is the most recent graphical representation of the model presented in the available articles, OECD’s website (http://www.oecd.org/industry/business-stats/indicator-sofentrepreneurialdeterminants.htm) shows the list of updated determinants as of 2011, with minor variations in the above-mentioned determinant nomencla-ture. For the purposes of this study, therefore, updated concepts are considered, where technology and R&D are recognized as creation and diffusion of knowledge and culture is specifically called entrepreneurship culture.
Carlos Alberto Arruda de Oliveira / Vanessa Silva Nogueira / Vinícius Costa
Girişimcilik ve İnovasyon Yönetimi Dergisi / Journal of Entrepreneurship and Innovation Management26
Notably, the qualitative approach pursued in this study seeks to map out the perceptions of the ecosystem actors, mainly as concerns entrepreneur-ship of high-growth startups, as construed according to Julie Meyer’s (2012) concept, describing them as companies that start life small, but think big and, due to their great innovative potential, harbor a significant probability of early exponential growth.
Eric Ries argues that when an organization of any nature is based inside the startup thinking (focused on innovation, with as less costs as possible), it will become easier to make a business flow, by having feedbacks from the use of experimentation. The availability of entrepreneurs who takes advan-tage of experimentation requires actions from both governments and univer-sities to encourage and give capacitation for these entrepreneurs to enter this world of opportunities and wealth creation (Ries, 2012).
3. METHODOLOGY
Quantitative and qualitative data collection happened between August 2012 and March 2013. Sections 3.1 and 3.2 describe in detail what was each stage’s process like.
3.1. Qualitative stage
The snowball sampling method was used to gather qualitative data. This method resorts to indications and networking involving the respon-dents themselves, to establish contact with other individuals of interest to the investigation. That is, the sample is constructed simultaneously with the development of the research work, and this technique is used to broach access to important representatives of the theme in question, who might oth-erwise not be available for in-depth interviews if not for their prior relations with previously interviewed individuals.
Therefore, 30 in-depth interviews were conducted, all of them semi-structured such as to broach open dialogues over the six entrepreneurship pillars, as proposed by Daniel Isenberg (2011).
The Brazilian Entrepreneurial Ecosystem of Startups
27Cilt/Volume 2 | Sayı/Issue 3 | Aralık/December 2013
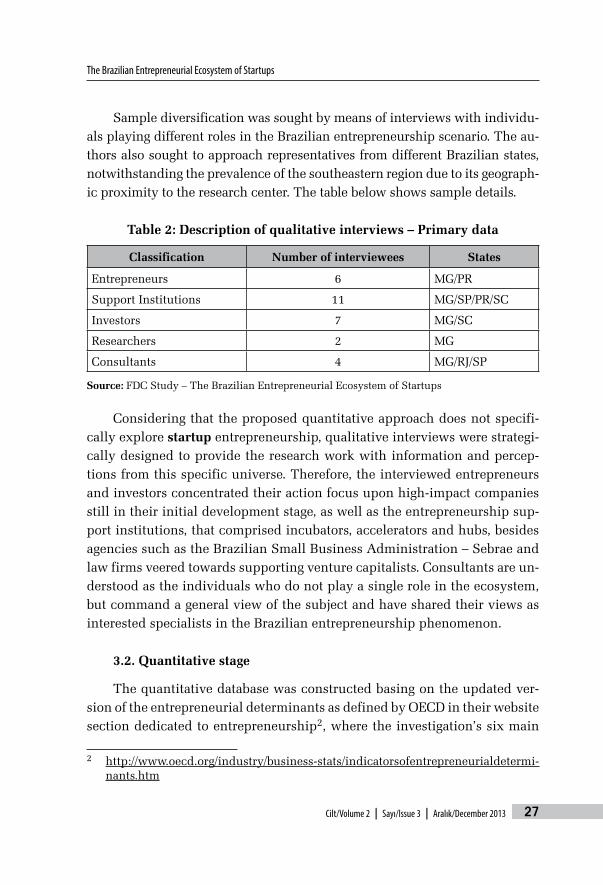
Sample diversification was sought by means of interviews with individu-als playing different roles in the Brazilian entrepreneurship scenario. The au-thors also sought to approach representatives from different Brazilian states, notwithstanding the prevalence of the southeastern region due to its geograph-ic proximity to the research center. The table below shows sample details.
Table 2: Description of qualitative interviews – Primary data
Classification Number of interviewees States
Entrepreneurs 6 MG/PR
Support Institutions 11 MG/SP/PR/SC
Investors 7 MG/SC
Researchers 2 MG
Consultants 4 MG/RJ/SP
Source: FDC Study – The Brazilian Entrepreneurial Ecosystem of Startups
Considering that the proposed quantitative approach does not specifi-cally explore startup entrepreneurship, qualitative interviews were strategi-cally designed to provide the research work with information and percep-tions from this specific universe. Therefore, the interviewed entrepreneurs and investors concentrated their action focus upon high-impact companies still in their initial development stage, as well as the entrepreneurship sup-port institutions, that comprised incubators, accelerators and hubs, besides agencies such as the Brazilian Small Business Administration – Sebrae and law firms veered towards supporting venture capitalists. Consultants are un-derstood as the individuals who do not play a single role in the ecosystem, but command a general view of the subject and have shared their views as interested specialists in the Brazilian entrepreneurship phenomenon.
3.2. Quantitative stage
The quantitative database was constructed basing on the updated ver-sion of the entrepreneurial determinants as defined by OECD in their website section dedicated to entrepreneurship2, where the investigation’s six main
2 http://www.oecd.org/industry/business-stats/indicatorsofentrepreneurialdetermi-nants.htm

Carlos Alberto Arruda de Oliveira / Vanessa Silva Nogueira / Vinícius Costa
Girişimcilik ve İnovasyon Yönetimi Dergisi / Journal of Entrepreneurship and Innovation Management28
pillars are available and determinant factors and sub-factors of each one of them are specified. OECD also suggests, in the same documents, the sources whence the data corresponding to each variable can be extracted. However, a major part of these is focused upon the study of European countries and, therefore, do not contain data about Brazil. Therein lays the main challenge to the construction of a Brazilian quantitative base.
Therefore, an extensive research effort was developed to find alterna-tive – yet corresponding – variables to those whose specified sources did not provide numbers relating to the Brazilian reality.
Although not all of them are approached in this paper, it is important to mention that the database constructed considered a total of 103 variables as suggested by OECD, being 92 of them mapped – of which 55 were original and 37 were corresponding variables – which represents a success mapping rate of approximately 89%3.
3.3. Definition of benchmark countries
Aiming at enriching this study comparative analyses were drawn be-tween Brazil and benchmark countries for each of the six studied pillars. An additional research effort was put forth to elect these countries, in compli-ance with the following methodology: countries were selected that appeared as top countries in the reports from which the quantitative variables under analysis were extracted. This means backtracking to the sources of each one of the variables that were successfully mapped for Brazil and the 10 best-rated countries in each of them were mapped out. The investigation then took as a benchmark country that country that appeared among the 10 first positions in the largest number of variables. In the cases where two or more countries appeared the same number of times, the definition criterion was the number of incidences in the first 5 positions. It is important to observe, therefore, that the definition of benchmark countries considered the list of participants in the consulted studies and not the total number of countries
3 An approximation. The alternative variables are either similar or complementary to the originals. It is not possible to guarantee 100% correspondence among the variables as originally suggested by the OECD, whose values were not found in Brazil, with those alternatively suggested.

The Brazilian Entrepreneurial Ecosystem of Startups
29Cilt/Volume 2 | Sayı/Issue 3 | Aralık/December 2013
on the planet, and countries not mapped by the reports in question may have been left aside.
4. DISCUSSION OF RESULTS
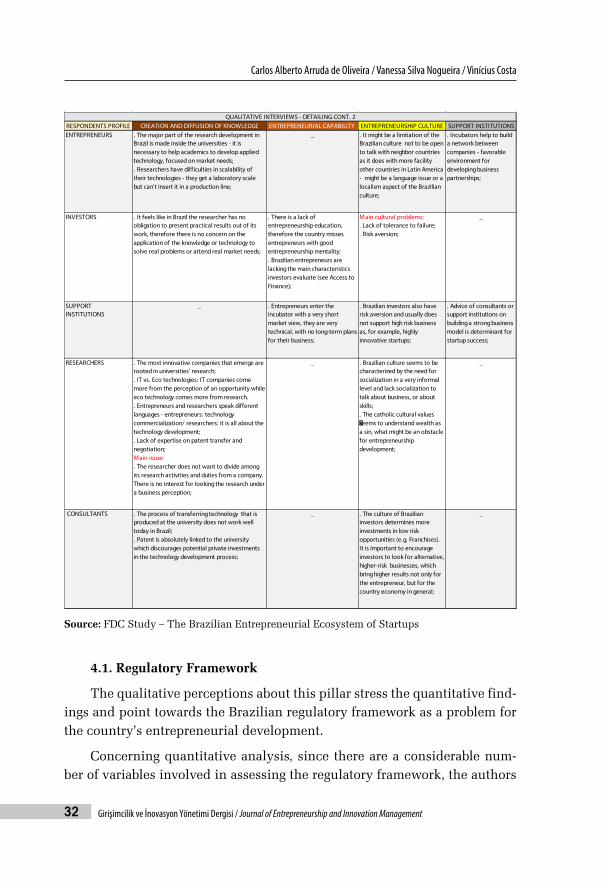
Table 3 shows the main insights taken from the set of qualitative in-terviews. The perceptions gathered from the 30 in-depth interviews were mapped considering the six OECD pillars and explored by each respondent’s profile. The data analysis is presented right after, condensing the qualitative insights with the quantitative findings so it is possible to understand in what cases the perceptions validate or go against the secondary quantitative data analyzed. The quantitative data provided are for the last year that was avail-able for each indicator. The quotations from the qualitative interviews are not identified in respect to the confidentiality policy applied at the request of the interviewees.

Carlos Alberto Arruda de Oliveira / Vanessa Silva Nogueira / Vinícius Costa
Girişimcilik ve İnovasyon Yönetimi Dergisi / Journal of Entrepreneurship and Innovation Management30
Table 3: Main insights of qualitative interviews - primary data
RESPONDENTS PROFILE REGULATORY FRAMEWORK MARKET CONDITIONS ACCESS TO FINANCEENTREPRENEURS Positive aspects:
. Availability of government financial incentives for technological research development;. As long as the entrepreneur have a good project to apply he will probably get public subvention;
Negative aspects:. No periodicity/predictability of government incentives = entrepreneurs usually are not prepared to apply in short notice under government's conditions;. To much bureaucracy on project approval and financial incentive release = entrepreneur may lose market timing for sales (mainly in IT companies);. Specific industries have huge problems to get their products approved by the National Agency for Sanitary Vigilance (ANVISA) - it can take up to six years or more to have a product approved for commercialization.
. New Brazilian companies usually already starts aiming international markets;
. Brazilian startups entrepreneurs tend to invest their own capital as seed money to make the company run; as well as their human resources, being full time dedicated to the business since its conception;. Entrepreneurs perceptions is that it is very tough to attract Venture Capital investments;. When they do attract investments the process is very slow and bureaucratic - more focused on business analysis and less in entrepreneur profile;. The greatest part of investments on research come from the government;
INVESTORS . Perception is that the investments on startups in their initial developing stage is government responsability;
_ . Investors feel that Brazil is about 20 years behind USA considering the Venture Capital/Private Equity/Angels environment and development;. Investors tend to evaluate if entrepreneurs have a partner or a owner mentality. If the entrepreneur do not accept very well to work with partners in his/her business he/she won't deal well with investment funds; . Other aspect investors evaluate is entrepreneurs' ambition - must to be high;. Skills to adapt the business to the market needs are mandatory for success; . Investment funds in Brazil invest really high amount of money, but in lower risk operations;
SUPPORT INSTITUTIONS
. There is a lot of research financial support from the government but with no criteria linked to the research implementation on the market/ startups misses resources for marketing and a good commercialization strategy;
. Main startups success cases are of those ones that had the ability to adapt their business to the market changes or needs; . Incubator startup selection evaluate the business model focusing on market size and product demand;. The market understanding is usually weak on incubated startups. Sometimes they have a well developed product but do not understand their market for effective commercialization;. Incubators tend to approve companies with high-growth potential that already starts focusing in international markets; . Incubators usually give market strategy advice to their startups;
. Startups can even get a first investment round but can hardly get a second round ("about 3 out of 30 companies evaluated get a second investment");. Incubated companies miss investments for scaling their products;. High-technology companies developing disruptive innovation does not attract many investments in their beginning as it demands high amount of capital associated with high risk operations;
QUALITATIVE INTERVIEWS - DETAILING

The Brazilian Entrepreneurial Ecosystem of Startups
31Cilt/Volume 2 | Sayı/Issue 3 | Aralık/December 2013
RESPONDENTS PROFILE REGULATORY FRAMEWORK MARKET CONDITIONS ACCESS TO FINANCERESEARCHERS . Belief on the triple helix model - it is necessary to work
the complex relationship between government, private companies and universities;
_ _
CONSULTANTS . There are regulation laws according to which public employees as university teachers/researchers are not allowed to constitute a company while working at the university - can't be both researcher and entrepreneur;. From the point of view of the investor it is very complicated to invest in a technology being developed inside the university because there are no guarantees for the freely commercialization of the technology in the market;. Brazilian tax system gives no incentive for those who make investment in innovation;. There is no significant differentiation of taxation by size or turnover of companies (could have a turnover of 2 or 50 millions and the same costs and statements are applied);. Legally there is no difference between companies that already have revenues of those who are still in the process of raising capital;. The investor in Brazil has no regulatory protection;. Companies seek Brazil despite the regulatory framework; . Regulatory framework is focused on developed companies and not in companies in the development stage;
. There is a favorable market in Brazil as a consequence of the mobility of the middle class mainly in the last years;
. The universe of Venture Capital, Private Equity and Angels institutions is concentrated in southeastern Brazil. In other states that community is still very weak;. It feels that there is a delay of 40/50 years with respect to the U.S. and its investment environment of VC / PE / Angel;
QUALITATIVE INTERVIEWS - DETAILING CONT. 1
Carlos Alberto Arruda de Oliveira / Vanessa Silva Nogueira / Vinícius Costa
Girişimcilik ve İnovasyon Yönetimi Dergisi / Journal of Entrepreneurship and Innovation Management32
RESPONDENTS PROFILE CREATION AND DIFFUSION OF KNOWLEDGE ENTREPRENEURIAL CAPABILITY ENTREPRENEURSHIP CULTURE SUPPORT INSTITUTIONSENTREPRENEURS . The major part of the research development in
Brazil is made inside the universities - it is necessary to help academics to develop applied technology, focused on market needs; . Researchers have difficulties in scalability of their technologies - they get a laboratory scale but can't insert it in a production line;
_ . It might be a limitation of the Brazilian culture not to be open to talk with neighbor countries as it does with more facility other countries in Latin America - might be a language issue or a localism aspect of the Brazilian culture;
. Incubators help to build a network between companies - favorable environment for developing business partnerships;
INVESTORS . It feels like in Brazil the researcher has no obligation to present practical results out of its work, therefore there is no concern on the application of the knowledge or technology to solve real problems or attend real market needs;
. There is a lack of entrepreneurship education, therefore the country misses entrepreneurs with good entrepreneurship mentality; . Brazilian entrepreneurs are lacking the main characteristics investors evaluate (see Access to Finance);
Main cultural problems:. Lack of tolerance to failure;. Risk aversion;
_
SUPPORT INSTITUTIONS
_ . Entrepreneurs enter the incubator with a very short market view, they are very technical, with no long-term plans for their business;
. Brazilian investors also have risk aversion and usually does not support high risk business as, for example, highly innovative startups;
. Advice of consultants or support institutions on building a strong business model is determinant for startup success;
RESEARCHERS . The most innovative companies that emerge are rooted in universities' research; . IT vs. Eco technologies: IT companies come more from the perception of an opportunity while eco technology comes more from research.. Entrepreneurs and researchers speak different languages - entrepreneurs: technology commercialization/ researchers: it is all about the technology development;. Lack of expertise on patent transfer and negotiation;Main issue:. The researcher does not want to divide among its research activities and duties from a company. There is no interest for looking the research under a business perception;
_ . Brazilian culture seems to be characterized by the need for socialization in a very informal level and lack socialization to talk about business, or about skills;. The catholic cultural values seems to understand wealth as a sin, what might be an obstacle for entrepreneurship development;
_
CONSULTANTS . The process of transferring technology that is produced at the university does not work well today in Brazil;. Patent is absolutely linked to the university which discourages potential private investments in the technology development process;
_ . The culture of Brazilian investors determines more investments in low risk opportunities (e.g. Franchises). It is important to encourage investors to look for alternative, higher-risk businesses, which bring higher results not only for the entrepreneur, but for the country economy in general;
_
QUALITATIVE INTERVIEWS - DETAILING CONT. 2
Source: FDC Study – The Brazilian Entrepreneurial Ecosystem of Startups
4.1. Regulatory Framework
The qualitative perceptions about this pillar stress the quantitative find-ings and point towards the Brazilian regulatory framework as a problem for the country’s entrepreneurial development.
Concerning quantitative analysis, since there are a considerable num-ber of variables involved in assessing the regulatory framework, the authors

The Brazilian Entrepreneurial Ecosystem of Startups
33Cilt/Volume 2 | Sayı/Issue 3 | Aralık/December 2013
decided to split the set of sub-factors into three categories that facilitate un-derstanding, to wit:
Variables in progress: these are the variables that have evolved in the past few years in the sense of facilitating new business in Brazil.
Stagnant variables: these are variables that have not evolved or have regressed in the past few years, showing variations smaller than one unit in the indices analyzed.
Regressing variables: these are the variables that have regressed in the past few years in the sense of facilitating the development of new business in Brazil.
Table 4 shows the classification of all variables analyzed according to the categories above, their corresponding factors within the regulatory frame-work pillar and, also, the comparison between Brazilian and Singaporean models - Singapore being the country chosen as the regulatory framework benchmark according to the methodology described in the previous section.
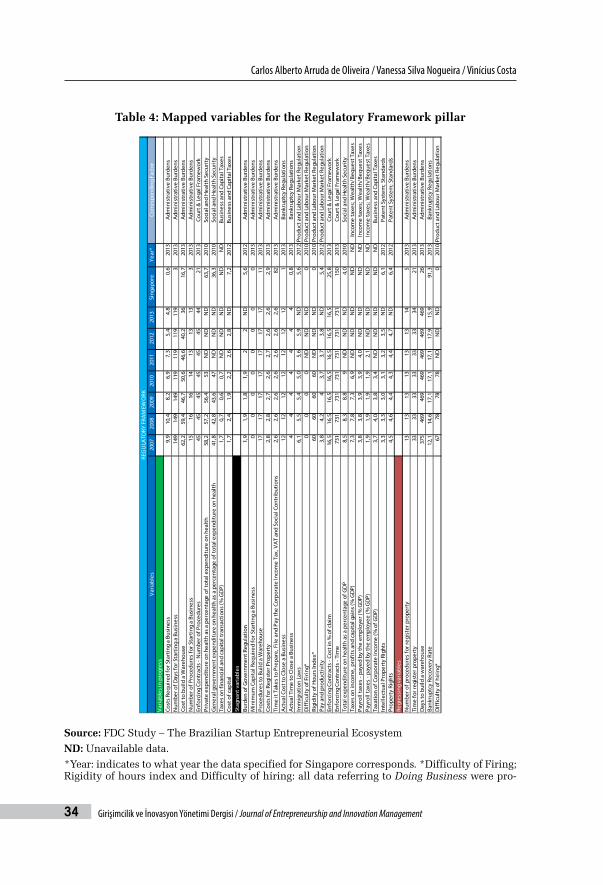
Carlos Alberto Arruda de Oliveira / Vanessa Silva Nogueira / Vinícius Costa
Girişimcilik ve İnovasyon Yönetimi Dergisi / Journal of Entrepreneurship and Innovation Management34
Table 4: Mapped variables for the Regulatory Framework pillar
Var
iabl
es20
0720
0820
0920
1020
1120
1220
13Si
ngap
ore
Year
*Co
rres
pond
ing
Fact
orV
aria
bles
in p
rogr
ess
Cost
s Re
quir
ed fo
r Sta
rtin
g a
Busi
ness
9,9
10,4
8,2
6,9
7,3
5,4
4,8
0,6
2013
Adm
inis
trat
ive
Burd
ens
Num
ber o
f Day
s fo
r Sta
rtin
g a
Busi
ness
149
149
149
119
119
119
119
320
13A
dmin
istr
ativ
e Bu
rden
sCo
st to
bui
ld a
War
ehou
se62
,259
,446
,750
,646
,640
,236
16,7
2013
Adm
inis
trat
ive
Burd
ens
Num
ber o
f Pro
cedu
res
for S
tart
ing
a Bu
sine
ss
1516
1614
1313
133
2013
Adm
inis
trat
ive
Burd
ens
Enfo
rcin
g Co
ntra
cts
- Num
ber o
f Pro
cedu
res
4545
4545
4545
4421
2013
Cour
t & L
egal
Fra
mew
ork
Priv
ate
expe
ndit
ure
on h
ealt
h as
a p
erce
ntag
e of
tota
l exp
endi
ture
on
heal
th58
,257
,256
,453
ND
ND
ND
63,7
2010
Soci
al a
nd H
ealt
h Se
curi
tyG
ener
al g
over
nmen
t exp
endi
ture
on
heal
th a
s a
perc
enta
ge o
f tot
al e
xpen
ditu
re o
n he
alth
41,8
42,8
43,6
47N
DN
DN
D36
,320
10So
cial
and
Hea
lth
Secu
rity
Taxe
s on
fina
ncia
l and
cap
ital
tran
sact
ions
(% G
DP)
1,7
0,7
0,6
0,7
ND
ND
ND
ND
ND
Busi
ness
and
Cap
ital
Tax
esCo
st o
f cap
ital
1,7
2,4
1,9
2,2
2,6
2,8
ND
7,2
2012
Busi
ness
and
Cap
ital
Tax
esSt
agna
nt v
aria
bles
Burd
en o
f Gov
ernm
ent R
egul
atio
n1,
91,
91,
81,
92
2N
D5,
620
12A
dmin
istr
ativ
e Bu
rden
sM
inim
um C
apit
al R
equi
red
for S
tart
ing
a Bu
sine
ss0
00
00
00
020
13A
dmin
istr
ativ
e Bu
rden
sPr
oced
ures
to B
uild
a W
areh
ouse
1717
1717
1717
1711
2013
Adm
inis
trat
ive
Burd
ens
Cost
s fo
r Reg
iste
r Pro
pert
y2,
82,
82,
72,
62,
72,
62,
62,
920
13A
dmin
istr
ativ
e Bu
rden
sTi
me
it T
akes
to P
repa
re, F
ile a
nd P
ay th
e Co
rpor
ate
Inco
me
Tax,
VA
T an
d So
cial
Con
trib
utio
ns2,
62,
62,
62,
62,
62,
62,
682
2013
Adm
inis
trat
ive
Burd
ens
Act
ual C
ost t
o Cl
ose
a Bu
sine
ss12
1212
1212
1212
120
13Ba
nkru
ptcy
Reg
ulat
ions
Act
ual T
ime
to C
lose
a B
usin
ess
44
44
44
40,
820
13Ba
nkru
ptcy
Reg
ulat
ions
Imm
igra
tion
Law
s6,
15,
55,
45,
05,
65,
9N
D5,
620
12Pr
oduc
t and
Lab
our M
arke
t Reg
ulat
ion
Dif
ficu
lty
of F
irin
g*0
00
0N
DN
DN
D0
2010
Prod
uct a
nd L
abou
r Mar
ket R
egul
atio
nRi
gidi
ty o
f Hou
rs In
dex*
6060
6060
ND
ND
ND
020
10Pr
oduc
t and
Lab
our M
arke
t Reg
ulat
ion
Pay
and
prod
ucti
vity
3,8
4,2
43,
73,
73,
8N
D5,
420
12Pr
oduc
t and
Lab
our M
arke
t Reg
ulat
ion
Enfo
rcin
g Co
ntra
cts
- Cos
t in
% o
f cla
im16
,516
,516
,516
,516
,516
,516
,525
,820
13Co
urt &
Leg
al F
ram
ewor
kEn
forc
ing
Cont
ract
s - T
ime
731
731
731
731
731
731
731
150
2013
Cour
t & L
egal
Fra
mew
ork
Tota
l exp
endi
ture
on
heal
th a
s a
perc
enta
ge o
f GD
P8,
58,
38,
89
ND
ND
ND
4,0
2010
Soci
al a
nd H
ealt
h Se
curi
tyTa
xes
on in
com
e, p
rofi
ts a
nd c
apit
al g
ains
(% G
DP)
7,3
7,8
7,3
6,9
ND
ND
ND
ND
ND
Inco
me
taxe
s; W
ealt
h/Be
ques
t Tax
esPa
yrol
l tax
es -
paye
d by
the
empl
oyer
(% G
DP)
3,8
3,8
3,9
3,9
4,0
ND
ND
ND
ND
Inco
me
taxe
s; W
ealt
h/Be
ques
t Tax
esPa
yrol
l tax
es -
paye
d by
the
empl
oyee
(% G
DP)
1,9
1,9
1,9
1,9
2,1
ND
ND
ND
ND
Inco
me
taxe
s; W
ealt
h/Be
ques
t Tax
esTa
xati
on o
f Cor
pora
te In
com
e (%
of G
DP)
3,7
4,0
3,8
3,4
ND
ND
ND
ND
ND
Busi
ness
and
Cap
ital
Tax
esIn
telle
ctua
l Pro
pert
y Ri
ghts
3,3
3,3
3,0
3,1
3,2
3,5
ND
6,1
2012
Pate
nt S
yste
m; S
tand
ards
Prop
erty
Rig
hts
4,5
4,6
4,4
4,3
4,4
4,7
ND
6,4
2012
Pate
nt S
yste
m; S
tand
ards
Regr
essi
ng v
aria
bles
Num
ber o
f pro
cedu
res
for r
egis
ter p
rope
rty
1313
1313
1313
145
2013
Adm
inis
trat
ive
Burd
ens
Tim
e fo
r reg
iste
r pro
pert
y33
3333
3333
3334
2120
13A
dmin
istr
ativ
e Bu
rden
sD
ays
to b
uild
a w
areh
ouse
375
469
469
469
469
469
469
2620
13A
dmin
istr
ativ
e Bu
rden
sBa
nkru
ptcy
Rec
over
y Ra
te12
,114
,617
,117
,117
,117
,915
,991
,320
13Ba
nkru
ptcy
Reg
ulat
ions
Dif
ficu
lty
of h
irin
g*67
7878
78N
DN
DN
D0
2010
Prod
uct a
nd L
abou
r Mar
ket R
egul
atio
n
REG
ULA
TORY
FRA
MEW
ORK
Source: FDC Study – The Brazilian Startup Entrepreneurial Ecosystem
ND: Unavailable data.
*Year: indicates to what year the data specified for Singapore corresponds. *Difficulty of Firing; Rigidity of hours index and Difficulty of hiring: all data referring to Doing Business were pro-

The Brazilian Entrepreneurial Ecosystem of Startups
35Cilt/Volume 2 | Sayı/Issue 3 | Aralık/December 2013
vided directly by the report organizing committee. The documents provided to Fundação Dom Cabral listing the requested data included the observation in these specific variables that the indicators are being revised. The figures were then extracted from the Doing Business reports available online. A full description of each variable mentioned above is presented in Appendix I at the end of the paper.
The entrepreneurial environment requires dynamism to develop; thus the importance of a regulatory framework that will break with the bureau-cratic hamstringing of the entrepreneurship development process.
Mainly, when startup entrepreneurship is discussed, it is necessary to consider that the speed of setting up a business and the facilities that en-courage its rapid growth are key factors for success. Young entrepreneurs are usually at the helm of these companies, bringing innovative ideas that break away from traditional product standards or business models. They think ahead of their time and their reality seems to run on a faster track.
In this context, two variables currently regressing in Brazil call atten-tion: personnel hiring difficulties and the bankrupt company recovery rate.
On a scale from 0 to 100, the latter being the highest the score and the greater the influence of laws and regulations representing hurdles against personnel hiring, Brazil was rated at 78 points. Hiring personnel appears, therefore, to be a major limiting factor of the country’s dynamism. Entre-preneurs are grid-locked in the face of administrative charges levied against personnel hiring that hamstring their budgets or when labor laws, focused upon workers’ needs, do not contemplate the employer’s requirements.
“If a company wishes to create job opportunities there’s no difference, no different treatment to create these new work sta-tions[...]”
“[The Brazilian] labor market is completely different from that of seventy years ago, but it still has the same law of seventy years ago; extremely protective and hardly flexible...”
The numbers also indicate that there is no easing in Brazil concerning the regulations applicable to the recovery of bankrupt companies. The rate of recovery assessed above is recorded as cents to the dollar recovered by credi-tors by means of reorganization, liquidation or debt foreclosing procedures.

Carlos Alberto Arruda de Oliveira / Vanessa Silva Nogueira / Vinícius Costa
Girişimcilik ve İnovasyon Yönetimi Dergisi / Journal of Entrepreneurship and Innovation Management36
In Brazil, therefore, once a company slips into red territory and contracts debt for recovery, only 15.9% of total assets committed are expected to be recovered.
Consequently, Brazilian companies have followed the opposite rationale of a favorable entrepreneurship environment; where entrepreneurs should find ease to venture serially and bankruptcy cannot loom as a limiting factor to the continuity of their efforts towards new businesses. It is precisely the possibility of restarting that strengthens the ecosystem with continual in-novative ideas that increase the possibility of successful companies existing in the marketplace.
Besides, for those companies that require proper space to develop tech-nologies through laboratory studies and more complex prototyping studies to manufacture a marketable product, the slowness of the facility building process and the bureaucracy involved in property registration, which are two other regressing variables in Brazil, can be development-limiting factors.
On the other hand, it is of the essence to note that the costs of building a warehouse decreased substantially in the past few years and that there has been remarkable progress in the process of starting a business, entailing a significant reduction both of the number of days required to start a business and also of the costs and number of procedures involved in the process.
The Brazilian federal administration created the Individual Micro-entrepreneur modality via Complementary Law no. 128, dated 12/19/2008. This is an example of official action that facilitates the establishment of companies, reducing the time required to obtain a valid corporate taxpayer number (CNPJ) down to 15 minutes, via the Internet. This measure contains many limitations since it is only applicable to entrepreneurs who are enjoy-ing maximum sales of R$60,000 per year and who do not hold equity interest in another company as a partner or owner. However, it does benefit self-employed professionals who are trying to start their own business and offers them the possibility of issuing fiscal invoices, together with the facility of opening a corporate checking account and entering into loan agreements for the company when necessary4.
4 http://www.portaldoempreendedor.gov.br/mei-microempreendedor-individual - 4/16/2013.
The Brazilian Entrepreneurial Ecosystem of Startups
37Cilt/Volume 2 | Sayı/Issue 3 | Aralık/December 2013
Another federal government measure whose purpose is to stimulate the economy and facilitate the development of companies concerns the reduc-tion of payroll taxes, a stagnant variable in Brazil for years.
Tax exemptions upon payroll were implemented in 2011 and extended application to more industries in April 2013, currently favoring 42 sectors of the Brazilian economy by the reduction of taxes levied upon workers’ wages. The measure contemplates the substitution of a 20% contribution on the payroll of companies, made to the National Institute of Social Security (INSS), for a fee varying between 1% and 2% of companies’ sales. It is an interesting reaction by the government to the negative evaluation of person-nel hiring in Brazil and, indeed, may stimulate the creation of jobs in the country and improve Brazilian corporate competitiveness5.
Although advances have been made in merit recognition because of the important influence it brings to Brazilian entrepreneurial development, the Brazilian regulatory framework is far from being a role model for entrepre-neurship incentive. Among the 34 elements mapped above, 25 of them, or approximately 74% are stagnant or regressing considering the period be-tween 2007 and 2013. This scoring is evidence of a negligent facet of the Brazilian reality that has scantily changed in the past few years in the sense of stimulating the regulatory model such as to facilitate corporate develop-ment in Brazil.
“[...] as concerns the regulatory framework, having worked in this market for such a long time, my understanding is that Bra-zil is attractive despite the regulatory framework. There is noth-ing in the regulatory framework that will make Brazil an interest-ing country. The regulatory part does not reduce the Brazil Risk”.
“[...] Brazil as a rule finds it difficult to regulate companies. The regulatory system is a hurdle, a weakness in the area of spe-cific entrepreneurship regulation”.
“[...] before earning a profit, long before compensating inves-tors and others, we are compensating the government, paying
5 http://www.fazenda.gov.br/portugues/documentos/2012/cartilhadesoneracao.pdf - 4/16/2013.

Carlos Alberto Arruda de Oliveira / Vanessa Silva Nogueira / Vinícius Costa
Girişimcilik ve İnovasyon Yönetimi Dergisi / Journal of Entrepreneurship and Innovation Management38
taxes for a long time before we can yield results. We were having negative net margins in the beginning, that is, costs were greater than revenues. Negative margins and even so you must pay taxes all the same, that means one incentive less, one advantage less to encourage you to be enterprising”.
Still, even considering the results found with variables that denoted some progress in the past few years, a marked contrast can be found between Brazilian and Singaporean numbers, which once more demonstrates the pil-lar’s shortcomings.
Table 5: Singaporean government measures towards entrepreneurship
Singaporean government measures towards entrepreneurship Corresponding years
Established an online business registration 2007/2008
Allowed the company registration and tax declaration to be made through a single online form
2008/2009
Facilitated the obtaining of building permits by improving the internal process of electronic data processing
2009
Further facilitated the process of obtaining building permits with a new Regulation of Health and Safety that allows low-risk industries to submit documents online
2010
Facilitated the property registration through improvements in the country’s digital system
2010
Source: Doing Business reports for corresponding years
Therefore, the reforms implemented by the Singaporean government since 2007 stand as an interesting tool to guide future measures in the sense of developing public policies in Brazil. According to previous years’ reports by Doing Business, the actions described on Table 5 are notable.
4.2. Market Conditions
Qualitative interviews indicated that individuals who are involved with entrepreneurship in Brazil have an optimistic view of the Brazilian market as concerns the possibility of attracting new business and technology. For

The Brazilian Entrepreneurial Ecosystem of Startups
39Cilt/Volume 2 | Sayı/Issue 3 | Aralık/December 2013
these people, the increased population purchasing power in the past few years, together with a growing access to digital tools and the Internet charac-terizes an exceedingly fertile environment for the development of startups. Technologies already saturated in markets such as the United States, i.e, highly scalable ideas through e-commerce and which are already common-place in other countries, find a practically untapped market in Brazil, daily increasing its thirst for digital consumption.
“[...] [the e-commerce market] is a brisk market all over the world and there’s a lot of space for this type of market in Brazil too, that is, ideas that appear consistently in these markets, I think they stand good chances of [creating] differentiated start-ups”.
“Companies that bring innovations from abroad to this country envision only one thing: our market. We are an emerging economy, with markets sometimes totally untapped, look at the electric car issue, they’re coming to explore our market”.
Indeed, the numbers unveiled an impressive e-commerce growth in Bra-zil. Sales from digital commerce increased from R$ 8.2 billion in 2008 to R$ 22.5 billion in 2012 in Brazil (E-bit Company, 2012). However, the consumers’ sophistication level did not increase on a par with their purchasing power in-crease. The country’s evaluations in this respect showed minimal variation, and have remained below average (between 3.8 and 3.6) for the past seven years, 1 being the score that indicates who base their buying on low price only while 7 denotes consumers who base their buying upon sophisticated product performance analysis (World Economic Forum [WEF], 2012).
This is a peculiar characteristic of the Brazilian entrepreneurship eco-system, which does not necessarily minimize its development potential but should certainly be considered by young entrepreneurs at the time of con-ceiving their business, since the actual purchasing intention is obviously a determinant factor for product and service success or failure.
Another important point to be highlighted is the degree of governmental adaptability vis-à-vis changes in the economy, that scored 4.59 in 2012, rep-resenting an increase of nearly 2 points compared to the 2007 score of 2.67.

Carlos Alberto Arruda de Oliveira / Vanessa Silva Nogueira / Vinícius Costa
Girişimcilik ve İnovasyon Yönetimi Dergisi / Journal of Entrepreneurship and Innovation Management40
The scale considered here contains 10 points, where 0 means low adapt-ability and 10 represents high governmental policy adaptability (Institute for Management Development [IMD], 2012).
Although it is possible to notice some progress in this respect, a compar-ison with the Singaporean index – 8.25 in 2012 – Singapore being a bench-mark country elected for this pillar as well, indicates that Brazil is still much behind what would be a benchmark adaptability level and, therefore, needs to identify and overcome possibly existing fetters in its market policies such as to follow up the speed of an entrepreneurial economy.
One suggestion is, for example, the facilitation for Brazilian companies to project themselves internationally. Many startups are born international and resort to information technologies to eliminate barriers among coun-tries. It behooves the economies to understand and facilitate this movement as a manner to retain Brazilian best companies in the country, minimizing the risk of losing them to international markets.
“[My startup] had to be born international already, because the games industry in Brazil is mostly pirated software, 80% to 90% of everything is pirated. Then major international partners simply didn’t communicate with Brazil, didn’t invest in games in Brazil”.
“[...] the businesses we have approved here at the incubator are fast-growing companies, companies that have great poten-tial. In fact, some of their customers are here in Paraná, but most of them are outside the country”.
The great issue is that such international projection in Brazil is being hindered by the export rates that grew exponentially in the past few years. According to Doing Business data, export costs nearly quadrupled for com-panies, from US$ 630 per container in 2007 to US$ 2215 per container in 2013 (World Bank, 2013a).
4.3. Access to Finance
Respondents note a growing supply of capital in Brazil. The economic prosperity this country has experienced for the past few years not only in-

The Brazilian Entrepreneurial Ecosystem of Startups
41Cilt/Volume 2 | Sayı/Issue 3 | Aralık/December 2013
creases the purchasing power of class C but also allows a greater accumula-tion of wealth by the individuals who were already at the top of the pyra-mid during crisis times. Such capital accumulation together with a dropping interest rate encourages investors to cast their eyes upon new investment opportunities, since fixed income investments are no longer so financially attractive.
“[...] Interest income is dropping and fixed income invest-ments lose attraction. It wasn’t too attractive before, now it’s not at all, because investors will find an actual interest rate of 3% per year at best [...]”
Besides that, the numbers show that, indeed, credit availability in the country has increased in the past few years. The percentage of credit ex-tended to the private sector, for example, was 61.4% in 2011, from 47.8% in 2007 (World Bank, 2013b). Probably a reflection of improvement of the country’s credit rating, from 61.2 in 2007 to 70.9 in 2011, in a scale from 0 to 100, where 100 represents the greatest probability of obtaining credit (IMD, 2012).
The Investor protection6 variable, however, indicates that the economy growth movement is not on a par with adaptations for the improvement of investor conditions. In Brazil, it has been stagnant for the past seven years at the score of 5.3, for an almost 4-point difference compared to the Hong Kong score – 9 –, a country defined as a benchmark for this pillar, showing the distance between Brazil and a protection benchmark country (World Bank, 2013a).
Likewise, the variable Venture Capital Availability is also stagnated in Brazil, with scores below 3 from 2007 to 2012. On a scale 1 to 7, 1 means it is impossible to get a bank loan in the country with only a good business plan and no collateral and 7 means it is easy to get a loan in these conditions (WEF, 2012).
Thus, on the one hand entrepreneurs complain of not having access to the capitals available in the country and stress the reality in that the do-
6 This variable is an average of the evaluation of three indices: transparency in transactions, responsibility for self-dealing and the capacity stockholders have to sue directors and executive officers for mismanagement.

Carlos Alberto Arruda de Oliveira / Vanessa Silva Nogueira / Vinícius Costa
Girişimcilik ve İnovasyon Yönetimi Dergisi / Journal of Entrepreneurship and Innovation Management42
mestic capital-tapping capacity does not directly influence the ease for en-trepreneurs to obtain investments or loans for their businesses during the embryonic stage of their startups.
“[...] in Brazil today it takes us one year to obtain venture capital funds, it’s very tough”.
“[...] fella has his business, proved it works and everybody’s dying to give him money; now fella who doesn’t have any, who needs resources to develop, no way, he’s got to prove it works on his own and after he’s proven, when he doesn’t need money any-more, then he’ll find money”.
“[...] even with [public] subventions, in this specific case I tried, I had to apply through another company, because a com-pany that doesn’t sell isn’t approved. Because they take up part of the technological risk but they don’t assume any commercial risk, then, if the company doesn’t sell, it doesn’t have a commer-cial life with technology, they don’t even invest”.
On the other hand, investors argue that a legal framework is lacking, such as to prompt them to invest in higher risk ventures. Investor insecurity looms as the great hurdle in the process. Most times investors will opt for transactions with larger sized companies, requiring heavier investments, but offering an attractive return at a smaller risk associated to the operation.
“[...] one thing is to take a piece of your personal assets and plough it into some venture. If it succeeds, fine. If it doesn’t, I kiss my resources goodbye. One thing is to take a piece of my personal assets, plough it into some productive activity and if this activity goes south I’ll be liable not only for the amount I’ve invested but will risk everything I own. This discourages investing in production activities.”
“I know of several investment funds that don’t invest less than 10 million; I know many that don’t invest less than 50 mil-lion”.
“[...] the groups that have investment potential in Brazil are not prepared for startup companies. They look for solid compa-

The Brazilian Entrepreneurial Ecosystem of Startups
43Cilt/Volume 2 | Sayı/Issue 3 | Aralık/December 2013
nies. We participated in an application call for credit in 2010 and one of the awarded companies had revenues to the tune of 5 billion reals that year. My question is: does a company that sell 5 billion reals really need 3 million to invest in the development of a new product? And this money really makes a difference to those who need it the most, the startup company, the company that is only just starting, the small business”.
The growth of domestic mergers and acquisitions in Brazil – from 351 in 2007 to 410 in 2011, for example – is an indication that, indeed, large-size businesses have increased in number in this country and emerging en-terprise investments end up not being a first option (KPMG, 2012). Of the 11,677 investment funds on record with the CVM – the Brazilian Securities and Exchange Commission – in 2012, only 34 are on record as Emerging En-terprise Mutual Investment Funds (FMIEE), which signifies a share of only .3% of this universe (CVM, 2013).
4.4. Creation and Diffusion of Knowledge
Respondents understand the two axes composing this pillar in different manners. On the one hand, there is a belief that relevant knowledge has been created in the academy, that is, the creation of knowledge is not seen as a ma-jor problem in Brazil. On the other hand, the diffusion of this knowledge has not been satisfactory, that is, the results of efforts veered towards research do not necessarily become business and often times remain mothballed in aca-demic shelves broaching no dialogue with the market. This lack of dialogue appears as a consequence of the incapability of two parties – researchers and entrepreneurs – to understand each other’s language. The researcher’s idealism cannot connect to the entrepreneur’s pragmatism, and this lack of communication between academia and enterprise ends up becoming a ma-jor hurdle to transform new ideas into successful companies.
“Academic researchers have a soft spot for invention; inven-tors are always quite myopic [...]. I strutted high toting my patent and thought I would save the world with my environmental area invention. I talked to industry people and disaster hit [...]. We speak different languages. In my mind [I thought]: sure, they’ll

Carlos Alberto Arruda de Oliveira / Vanessa Silva Nogueira / Vinícius Costa
Girişimcilik ve İnovasyon Yönetimi Dergisi / Journal of Entrepreneurship and Innovation Management44
be interested in an invention that’ll save the world! We then be-gan to talk and they began asking questions I couldn’t answer, and very obvious questions for those in the private area, who are thinking about the use, marketing the technology. This evidently vexed me, why couldn’t those people understand the beauty [of the invention]? Sure, from the chemical view point it was too cool!”
“[...] the hardest, in fact, is having expectations that a re-searcher, a person who prepared himself to be a researcher at the university, should have an entrepreneurial behavior. Some companies in the fund found some difficulties because of this profile gap.”
Quantitative evaluation indicates that the collaboration between univer-sity and industry is, indeed, below Finnish levels – Finland being the pillar’s benchmark country – confirming the Brazilian shortcomings as qualitatively seen in this respect. However, a small growth can be seen in the past few years’ indices. On a scale where 1 represents a minimal to non-existent level of collaboration between academia and enterprise and 7 represents an in-tense and continual level of collaboration, Brazil scored 3.4 in 2007 and 4.1 in 2012, not too far from the Finnish score of 5.6 for the same year (WEF, 2012).
On the other hand, the effective creation of knowledge – assessed by the number of patents registered in the country in the past few years – are behind Finnish indices, depicting a less optimistic reality than that seen by respondents.
In the reference year of 2010 the number of patents granted to inven-tors residing in Brazil, a country of approximately 196 million inhabitants7, is almost three times smaller than Finland’s, a country of only 5.39 million inhabitants8 (OECD, 2013).
7 Data referring to 2011 extracted from the WIPO – World Intellectual Property Or-ganization site – http://www.wipo.int/ipstats/en/statistics/country_profile/coun-tries/br.html
8 Data referring to 2011 extracted from the WIPO – World Intellectual Property Or-ganization site – http://www.wipo.int/ipstats/en/statistics/country_profile/coun-tries/fi.html

The Brazilian Entrepreneurial Ecosystem of Startups
45Cilt/Volume 2 | Sayı/Issue 3 | Aralık/December 2013
Within the scope of technological availability and acceptance – another factor that affect the Creation and Diffusion of Knowledge pillar according to the OECD framework – a fast-growing ambiance is already noticeable in Bra-zil. The increase in digital business, that almost tripled in the past five years driven by the 13 percentage point increase in the percentage of individuals who purchase products and services via the Internet between 2007 and 2011 is evidence that at least the basic technological structure – computers and the internet – has become more available to the Brazilian population in the past years and, more importantly, has been absorbed by individuals (CETIC, 2011). That is, the country wins on both sides: on the one hand, when a greater number of potential entrepreneurs has the possibility to access what is developed elsewhere – being capable of transforming information in sub-sidies for the creation of new businesses – on the other, chances to absorb digital business9 increase by the day, due to the growing mass of consumers.
Finally, the low level of cooperation among Brazilian companies in 2012 – 4.7 –, compared to Finland – 7.510 – demonstrates that large Brazilian com-panies also have space for supporting the process of entrepreneurship devel-opment in Brazil, inserting embryonic companies in their production chains as suppliers of specific technologies, for example, playing an important in-centive role in the creation of a greater number of startups in the country (IMD, 2012).
4.5. Entrepreneurial Capability
The entrepreneurial capability development process, according to the OECD, is determined by two main elements: the presence of education veered towards entrepreneurship and migratory flows bringing qualified foreigners professionals into the country.
Both interviews and quantitative data depict the Brazilian reality in a similar fashion. Education in Brazil, almost entirely, does not approach en-trepreneurship themes neither in the traditional formation courses nor in higher education courses such as business management, engineering and
9 Segment to which most startups interviewed in Southeastern Brazil have veered.10 The index is based on a scale from 0 to 10, where 0 means technological coopera-
tion among companies is lacking and 10 means that cooperation is well-devel-oped.

Carlos Alberto Arruda de Oliveira / Vanessa Silva Nogueira / Vinícius Costa
Girişimcilik ve İnovasyon Yönetimi Dergisi / Journal of Entrepreneurship and Innovation Management46
economics, for example, in which applied entrepreneurship curricula would be applicable. However, these courses are limited to the classic education to develop professionals who are mostly trained to be fine employees of great organizations – a synonym with professional success – but not to establish their own business.
“[...] as far as I know, universities have practically nothing, at most they have a junior company, which is something very different. I think all courses, engineering, IT, chemistry, medical courses – because there are several companies in the medical area as well – all courses should offer some type of training, of guidance, for [the students] to become entrepreneurs. The stu-dent finishes school, how is he going to venture?”
Even Brazilian business schools, which represent an alternative option for those who seek more specific education with the development of enter-prising skills, have quality indices below those found in the United King-dom, a benchmark country for this pillar. The scale evaluates the quality of business schools in different countries, where 1 means poor or limited quality and 7 denotes the presence of schools classified as the best in the world. Brazilian score in 2012 was 4.4 against 6.1 of United Kingdom in the same year (WEF, 2012).
Another worrying factor is the access to basic higher education, with or without entrepreneurship elements, that in 2010 was benefit of only 12% of the Brazilian population, a number in stark contrast with the 46% of the Unit-ed Kingdom population trained in higher education in the same year, which unveils a precarious reality as concerns the availability of skilled human re-sources for the large scale development of enterprises in Brazil (IMD, 2010).
Given this scenario, it would be interesting for the country economy to make Brazil attractive for skilled foreign professionals who come to this country to share ideas and abilities with local potential entrepreneurs.
However, considering the year 2010 as the baseline, a comparison be-tween the number of foreign students in Brazil – 14,738 – and in the United Kingdom – 389.958 – is a warning of the lack of attractiveness to welcome foreigners and possibly retain them in the country (UNESCO, 2013).

The Brazilian Entrepreneurial Ecosystem of Startups
47Cilt/Volume 2 | Sayı/Issue 3 | Aralık/December 2013
4.6. Entrepreneurship Culture
Culture is the backdrop of all elements of an entrepreneurial ecosys-tem and directly affects its operations and growth. In this pillar, behavioral preferences and characteristics of individuals in favor or against entrepre-neurship are assessed, besides contemplating entrepreneurial education in a subtly different manner than how it was approached in the previous pillar. Here, investigating the development of an entrepreneurial mindset in indi-viduals from their basic schooling is more important than understanding whether is any knowledge about entrepreneurship being taught in interme-diary school and higher education.
Starting from an analysis of preferences and characteristics, we note in the respondents’ statements an interesting counterpoise between the fear of failure and entrepreneurial initiative. The qualitative issue of greatest emi-nence was precisely the resistance that Brazilians offer against failure and, possibly as a direct consequence of this element, their risk aversion. Failure, in Brazil, often times seems to come hand in hand with hard to overcome social stigmata that loom as impediments or hindrances to the entrepreneur restart.
“Brazil has a complicated problem, that is, the lack of a fail-ure culture. And you don’t have any venture capital, no innova-tion, nothing of the sort here, if there’s no tolerance for failures”.
“[...] today there’s more space to create and innovate, but I also think that the fear of failing is still great. If you’ve ventured and failed, I think society in general […] the person is recognized as a flop, a person who can’t manage nor create a company”.
Risk aversion, in turn, affects the other side of the coin. Since collateral for investors still has not reached satisfactory levels, as shown in the Ac-cess to finance pillar analysis, the risk aversion cultural aspect influences investors even further into resisting greater aggregate risk, represented by the startup companies.
Nevertheless, Brazilians are still seen as people of great initiative. How-ever, such initiative is motivated by the need to find an income generation

Carlos Alberto Arruda de Oliveira / Vanessa Silva Nogueira / Vinícius Costa
Girişimcilik ve İnovasyon Yönetimi Dergisi / Journal of Entrepreneurship and Innovation Management48
manner in situations where other alternatives are not available. The fear of failure, in this case, seems to strengthen the profile of the “necessity driven entrepreneur” as a counterpoise to what is expected from entrepreneurs and startup investors, who opt for assuming great risks in exchange for the pos-sibility of achieving significant financial gains. These are the so-called “op-portunity driven entrepreneurs”.
“I think it’s changed a little, the entrepreneur has been a lit-tle more acknowledged, but I think he is seen as a jobless person, you don’t know what to do so you open a little company around the corner […] out of need instead of out of opportunity [...]”
Quantitative data, differently from the qualitative approach adopted during the interviews, seem to turn to a different face of entrepreneurship. While respondents voiced their views concerning the entrepreneur/startup investor and the characteristics required to be at the helm of a high-growth, high-risk business, some quantitative variables seem to approach entrepre-neurship merely through the eyes of the individual who would rather be self-employed than an employee. The first profile requires a different range of skills that the Brazilians, as expounded in previous paragraphs, must still improve.
The second profile is more intimately related to the wish of opening a business, no matter if it is a retail activity such as a restaurant, a bakery, a convenience store, etc. The propensity of Brazilians to pursue this type of activity is high. The 2012 data indicate that the Brazilian individual harbors many more wishes to both open his/her own business and to be a self-em-ployed professional than Norwegians, Norway being the country selected as a benchmark for this pillar (Xavier, Kelley, Kew, Herrington & Vorderwül-becke, 2012).
On the other hand, stressing the qualitative view, Norwegians are posi-tioned 11 percentage points ahead of Brazil considering opportunity-driven entrepreneurship. This index represents the percentage of individuals in-volved in entrepreneurial activities in their initial stage who claim to be motivated by the opportunity as opposed to not finding any other gainful employment (Xavier et. al, 2012).

The Brazilian Entrepreneurial Ecosystem of Startups
49Cilt/Volume 2 | Sayı/Issue 3 | Aralık/December 2013
5. CONCLUSION
The Brazilian regulatory framework, albeit showing subtle signs of im-provement, does not seem to follow the entrepreneurial movement in Brazil at the same speed as its milieu. Brazilian decision-making regulatory bodies seem not to have yet perceived the role of extreme importance they play in the country’s economic development by means of encouraging the creation of new companies, and the need to eliminate legal and regulatory constraints to stimulate the birth and growth of companies in the country.
The market for Brazilian companies, on the other hand, presents itself as a major force in Brazil, with a huge amount of potential consumers. The question that remains, however, is whether the Brazilians are willing to over-pay for an innovative product. For emerging businesses it is necessary to study in depth their target audience to understand its peculiarities and de-velop products and services that can be, in fact, absorbed by them.
With regards to the access to financing, it is clear that the progress of the Brazilian economy has created potential investors, that is, people with dis-posable capital for myriad investments who are at the crossroads of making their investment decisions. Therefore, Brazil has a very important resource with which to move its entrepreneurship ecosystem forward – the capital – and the country needs to apply efforts towards making the New Enterprise a more attractive option to these individuals. Measures for investor protec-tion, for example, can smooth the Brazilian’s risk aversion trait, serving as an incentive to transfer investments into larger companies to investments into startup enterprises.
Concomitantly, the creation of knowledge and capacity-building profes-sionals for the market – entrepreneurs or otherwise – are ecosystem elements also behind their potential, and require attention both from public bodies and other ecosystem players.
Indeed, public investment in education and measures to encourage the entrepreneurship mindset are of the essence to create a greater number of relevant research that can become businesses and, just as importantly, to place skilled professionals in the marketplace such as to meet the demand for labor during their growth process.

Carlos Alberto Arruda de Oliveira / Vanessa Silva Nogueira / Vinícius Costa
Girişimcilik ve İnovasyon Yönetimi Dergisi / Journal of Entrepreneurship and Innovation Management50
On the other hand, the responsibility for the great functioning of the ecosystem is incumbent upon all the players in it; entrepreneurs and re-searchers should also take up important roles in this evolution. Since there is evidence that much knowledge has been created and is mothballed on Brazilian academia shelves, for example, it behooves researchers and entre-preneurs to bring it out in the open and to help each other identify applica-tions for this knowledge that are interesting to both parties.
Besides that, Brazilian entrepreneurs possess basic abilities for the en-trepreneurial development in the country, such as initiative and the desire to break away from subordinated employment. It is necessary to develop these abilities in the sense of more intensely encouraging high-growth en-trepreneurship that yields large-scale economic and financial returns to the country.
This change may occur by means of capacity building and entrepre-neurship culture, which are complementary pillars. Entrepreneurial capac-ity building may influence a country’s culture change towards entrepreneur-ship, which would probably return as encouragement to advances in entre-preneurial capacity building investments.
It is well to consider that greater visibility for the country begets a great-er market, attracts foreign talent from abroad and increases the chances of retaining them in the country, awakens investor interest and, more impor-tantly, encourages the implementation of measures by the government to accelerate economic progress. Thus, considering the growing Brazilian inter-national exposure in the past few years and the exposure it will have at least until all sports events end in 2016, the time is definitely favorable to invest in the progress of the Brazilian entrepreneurial ecosystem, aiming at a fast development of the features that require attention indicated in this study; in an effort to leave, for future generations, not just stadiums and memories, but a diverse portfolio of new successful businesses.
The authors reiterate that this paper is an initial effort to systematize data on entrepreneurship in Brazil resorting to an official database enabling international comparisons, and its prime objective is to be a starting point to establish a dialogue and join efforts with research and professional organi-zations and domestic and international academicians who are motivated by

The Brazilian Entrepreneurial Ecosystem of Startups
51Cilt/Volume 2 | Sayı/Issue 3 | Aralık/December 2013
the same wish to understand world entrepreneurship and who wish to add their observations or share relevant data to allow the constant improvement of the database presented here. A very interesting next step would be, for example, to develop comparative studies among Brazil and the others Latin American countries in which regards their entrepreneurial ecosystem, its characteristics and evolution.
Also, a longitudinal study combined with joint efforts to map out the indicators for which Brazilian data could not be found will allow an under-standing of the evolution of entrepreneurship. For this purpose, the Determi-nants scope alone can be considered, as done by the authors; also fitting is expanding the understanding of the model proposed by the OECD as of the study of two other scopes approached: Impacts and Performance.
Considering this study’s qualitative stage, the authors have met with re-sistance while discussing failure experiences with entrepreneurs who were not successful with their startups. Amassing a greater number of statements concerning this issue may contribute enriching information to understand the reason for enterprise failure, adding a more comprehensive dimension of the phenomenon to the study.
Besides, in such a diverse country as Brazil, regional studies are always interesting and unveil surprising realities. Close analysis of the country’s pe-culiarities – mainly those belonging to the north, northeast and center west regions, not approached by this investigation – stand out as another possibil-ity for a study capable of creating deeper knowledge about the subject.
Finally, greater efforts should be prosecuted upon the study of pillars En-trepreneurial capability and Entrepreneurship culture. Because these aspects are more subjective than the others are, available data are scarcer, therefore limiting understanding. The contribution from Brazilian and international bodies that may share data of this magnitude is of the essence, such that the effort may indeed reach world comparability proportions.

Carlos Alberto Arruda de Oliveira / Vanessa Silva Nogueira / Vinícius Costa
Girişimcilik ve İnovasyon Yönetimi Dergisi / Journal of Entrepreneurship and Innovation Management52
References
Bygrave, B. (1998). Building and Entrepreneurial Economy: Lessons From the United States. Business Strategy Review, Vol 9 (2) pp 11-18.
CETIC [Brazilian Study Center on IT Technologies and Communication] (2011). TIC Domicílios e Usuários 2011 – Total Brasil. Available at: http://cetic.br/usuarios/tic/2011-total-brasil/> Accessed on: 13 Jan. 2013.
CVM [Brazilian Securities and Exchange Commission]. (2013). Quantidade de Fundos de Investimentos Registrados. Available at: http://www.cvm.gov.br/port/pub-lic/ASE/icvm/Arquivos2010/Fundos.xls> Accessed on: 22 Jan. 2013.
E-Bit Company. (2012). Relatório Webshoppers 26a edição (p. 15). Available at: http://www.ebitempresa.com.br/web-shoppers.asp> Accessed on: 22 Feb. 2013.
Fundação Dom Cabral. (2013). The Brazilian Startup Entrepreneurial Ecosystem: an analysis of entrepreneurship determinants in Brazil as seen from de OECD pillars. Belo Horizonte: FDC.
Hoffman, A., & Ahmad, N. (2007). A Framework for Addressing and Measuring Entrepreneurship. Paris.
Institute for Management Development. (2010). IMD World Competitiveness Re-port 2010. Lausanne.
Institute for Management Development. (2012). IMD World Competitiveness Re-port 2012. Lausanne.
Isenberg, D. (2010), “The Big Idea: How to Start an Entrepreneurial Revolution”, Harvard Business Review.
Isenberg, D. (2011). Babson Entrepreneurship Ecosystem Project. Available at: http://entrepreneurial-revolution.com/2011/12/entrepreneurship-ecosystem-les-sons/> Accessed on: 25 April 2013.
Kelley, D., Herrington, M., Xavier, Siri R., Kew, J., Vorderwülbecke, A. (n.d.). Global entrepreneurship monitor: 2012 Global Report. Babson College, Universidad del Desarrollo, Universiti Tun Abdul Razak, London Business School, and Global Entrepreneurship Research Consortium (GERA).
KPMG. (2012), Mergers & Acquisitions Research 2012 – Third quarter (Research Report/2012).
Meyer, J. (2012). Welcome to entrepreneur country. London: Constable.

The Brazilian Entrepreneurial Ecosystem of Startups
53Cilt/Volume 2 | Sayı/Issue 3 | Aralık/December 2013
OECD. (2009). Measuring Entrepreneurship: A Collection of Indicators. [pub-lished by OECD Statistics Directorate].
OECD. (2011). Indicators of entrepreneurial determinants. Available at: http://www.oecd.org/industry/business-stats/indicatorsofentrepreneurialdeterminants.htm> Accessed on: 20 March 2013.
OECD. (2013). OECD Science and Technology Statistics. Available at: http://stats.oecd.org/> Accessed on: 08 Jan. 2013.
Ries, E. (2011). The Lean Startup. Translated by Carlos Szlak. (2012). São Paulo: Lua de Papel.
Schumpeter, J. A. (1975). Capitalism, Socialism and Democracy. New York: Harper.
Singer, S., & Senor, D. (2009). Start-Up Nation: The Story of Israel’s Economic Miracle. United States: McClelland & Stewart.
UNESCO. (2013). Unesco Institute for Statistics. Available at: http://stats.uis.unesco.org/unesco/ReportFolders/reportFolders.aspx> Accessed on: 14 Feb. 2013.
World Bank. (2006). Doing Business 2007: How to reform. Washington, DC: No-bel.
World Bank. (2007). Doing Business 2008. Washington, DC: Nobel.
World Bank. (2008). Doing Business 2009. Washington, DC: Palgrave and Mac-Millan.
World Bank. (2009). Doing Business 2010: Reforming through Difficult Times. Washington, DC: Palgrave and MacMillan.
World Bank. (2013a). Doing Business 2013: Smarter Regulations for Small and Medium-Size Enterprises. Washington, DC: World Bank Group.
World Bank. (2013b). World Development Indicators. Available at: http://data.worldbank.org/indicator> Accessed on: 15 Feb. 2013.
World Economic Forum. (2012). The Global Competitiveness Report 2012 – 2013. Geneva.
Xavier. S. R., Kelley, D., Kew J., Herrington, & M., Vorderwülbecke, A. (2012). Global Entrepreneurship Monitor 2012 Global Report. Available at: http://www.gem-consortium.org/docs/download/2645> Accessed on 16 March. 2013.
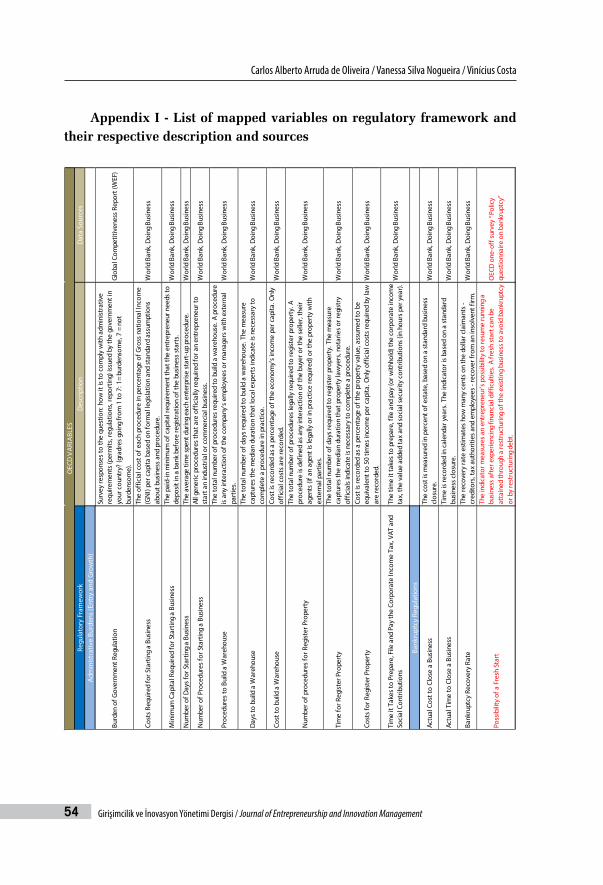
Carlos Alberto Arruda de Oliveira / Vanessa Silva Nogueira / Vinícius Costa
Girişimcilik ve İnovasyon Yönetimi Dergisi / Journal of Entrepreneurship and Innovation Management54
Appendix I - List of mapped variables on regulatory framework and their respective description and sources
Regu
lato
ry F
ram
ewor
kD
escr
iptio
nD
ata
Sour
ces
Adm
inis
trat
ive
Burd
ens
(Ent
ry a
nd G
row
th)
Burd
en o
f Gov
ernm
ent R
egul
atio
n
Surv
ey re
spon
ses
to th
e qu
estio
n: h
ow it
is to
com
ply
with
adm
inis
trat
ive
requ
irem
ents
(per
mits
, reg
ulat
ions
, rep
ortin
g) is
sued
by
the
gove
rnm
ent i
n yo
ur c
ount
ry?
(gra
dres
goi
ng fr
om 1
to 7
: 1=
burd
enso
me,
7 =
not
bu
rden
som
e).
Glo
bal C
ompe
titiv
enes
s Re
port
(WEF
)
Cost
s Re
quire
d fo
r Sta
rtin
g a
Busi
ness
The
offic
ial c
ost o
f eac
h pr
oced
ure
in p
erce
ntag
e of
Gro
ss n
atio
nal I
ncom
e (G
NI)
per c
apita
bas
ed o
n fo
rmal
legi
slat
ion
and
stan
dard
ass
umpt
ions
ab
out b
usin
ess
and
proc
edur
e.W
orld
Ban
k, D
oing
Bus
ines
s
Min
imum
Cap
ital R
equi
red
for S
tart
ing
a Bu
sine
ssTh
e pa
id-in
min
imum
of c
apita
l req
uire
men
t tha
t the
ent
repr
eneu
r nee
ds to
de
posi
t in
a ba
nk b
efor
e re
gist
ratio
n of
the
busi
ness
sta
rts.
Wor
ld B
ank,
Doi
ng B
usin
ess
Num
ber o
f Day
s fo
r Sta
rtin
g a
Busi
ness
The
aver
age
time
spen
t dur
ing
each
ent
erpr
ise
star
t-up
pro
cedu
re.
Wor
ld B
ank,
Doi
ng B
usin
ess
Num
ber o
f Pro
cedu
res
for S
tart
ing
a Bu
sine
ssAl
l gen
eric
pro
cedu
res
that
are
off
icia
lly re
quire
d fo
r an
entr
epre
neur
to
star
t an
indu
stria
l or c
omm
erci
al b
usin
ess.
Wor
ld B
ank,
Doi
ng B
usin
ess
Proc
edur
es to
Bui
ld a
War
ehou
seTh
e to
tal n
umbe
r of p
roce
dure
s re
quire
d to
bui
ld a
war
ehou
se. A
pro
cedu
re
is a
ny in
tera
ctio
n of
the
com
pany
’s e
mpl
oyee
s or
man
ager
s w
ith e
xter
nal
part
ies.
Wor
ld B
ank,
Doi
ng B
usin
ess
Day
s to
bui
ld a
War
ehou
seTh
e to
tal n
umbe
r of d
ays
requ
ired
to b
uild
a w
areh
ouse
. The
mea
sure
ca
ptur
es th
e m
edia
n du
ratio
n th
at lo
cal e
xper
ts in
dica
te is
nec
essa
ry to
co
mpl
ete
a pr
oced
ure
in p
ract
ice.
Wor
ld B
ank,
Doi
ng B
usin
ess
Cost
to b
uild
a W
areh
ouse
Cost
is re
cord
ed a
s a
perc
enta
ge o
f the
eco
nom
y’s
inco
me
per c
apita
. Onl
y of
ficia
l cos
ts a
re re
cord
ed.
Wor
ld B
ank,
Doi
ng B
usin
ess
Num
ber o
f pro
cedu
res
for R
egis
ter P
rope
rty
The
tota
l num
ber o
f pro
cedu
res
lega
lly re
quire
d to
regi
ster
pro
pert
y. A
pr
oced
ure
is d
efin
ed a
s an
y in
tera
ctio
n of
the
buye
r or t
he s
elle
r, th
eir
agen
ts (i
f an
agen
t is
lega
lly o
r in
prac
tice
requ
ired)
or t
he p
rope
rty
with
ex
tern
al p
artie
s.
Wor
ld B
ank,
Doi
ng B
usin
ess
Tim
e fo
r Reg
iste
r Pro
pert
yTh
e to
tal n
umbe
r of d
ays
requ
ired
to re
gist
er p
rope
rty.
The
mea
sure
ca
ptur
es th
e m
edia
n du
ratio
n th
at p
rope
rty
law
yers
, not
arie
s or
regi
stry
of
ficia
ls in
dica
te is
nec
essa
ry to
com
plet
e a
proc
edur
e.W
orld
Ban
k, D
oing
Bus
ines
s
Cost
s fo
r Reg
iste
r Pro
pert
yCo
st is
reco
rded
as
a pe
rcen
tage
of t
he p
rope
rty
valu
e, a
ssum
ed to
be
equi
vale
nt to
50
times
inco
me
per c
apita
. Onl
y of
ficia
l cos
ts re
quire
d by
law
ar
e re
cord
ed.
Wor
ld B
ank,
Doi
ng B
usin
ess
Tim
e it
Take
s to
Pre
pare
, File
and
Pay
the
Corp
orat
e In
com
e Ta
x, V
AT a
nd
Soci
al C
ontr
ibut
ions
The
time
it ta
kes
to p
repa
re, f
ile a
nd p
ay (o
r with
hold
) the
cor
pora
te in
com
e ta
x, th
e va
lue
adde
d ta
x an
d so
cial
sec
urity
con
trib
utio
ns (i
n ho
urs
per y
ear)
.W
orld
Ban
k, D
oing
Bus
ines
s
Bank
rupt
cy R
egul
atio
ns
Actu
al C
ost t
o Cl
ose
a Bu
sine
ssTh
e co
st is
mea
sure
d in
per
cent
of e
stat
e, b
ased
on
a st
anda
rd b
usin
ess
clos
ure.
Wor
ld B
ank,
Doi
ng B
usin
ess
Actu
al T
ime
to C
lose
a B
usin
ess
Tim
e is
reco
rded
in c
alen
dar y
ears
. The
indi
cato
r is
base
d on
a s
tand
ard
busi
ness
clo
sure
.W
orld
Ban
k, D
oing
Bus
ines
s
Bank
rupt
cy R
ecov
ery
Rate
The
reco
very
rate
est
imat
es h
ow m
any
cent
s on
the
dolla
r cla
iman
ts -
cred
itors
, tax
aut
horit
ies
and
empl
oyee
s - r
ecov
er fr
om a
n in
solv
ent f
irm.
Wor
ld B
ank,
Doi
ng B
usin
ess
Poss
ibili
ty o
f a F
resh
Sta
rt
The
indi
cato
r mea
sure
s an
ent
repr
eneu
r’s p
ossi
bilit
y to
resu
me
runn
ing
a bu
sine
ss a
fter
exp
erie
ncin
g fin
anci
al d
iffic
ultie
s. A
fres
h st
art c
an b
e at
tain
ed th
roug
h a
rest
ruct
urin
g of
the
exis
ting
busi
ness
to a
void
ban
krup
tcy
or b
y re
stru
ctur
ing
debt
.
OEC
D o
ne-o
ff s
urve
y “P
olic
y qu
estio
nnai
re o
n ba
nkru
ptcy
”
OEC
D V
ARI
ABL
ES

The Brazilian Entrepreneurial Ecosystem of Startups
55Cilt/Volume 2 | Sayı/Issue 3 | Aralık/December 2013
Regulatory Framework Description Data SourcesProduct and Labour Market Regulation
Difficulty of Firing*The index measures whether laws or other regulations have implications for the difficulties of firing a standard worker in a standard company, based on factbased (yes/no) questions, remodelled into a 0-100 index.
World Bank, Doing Business
Difficulty of Hiring*The index measures whether laws or other regulations have implications for the difficulties of hiring a standard worker in a standard company, based on factbased (yes/no) questions, remodelled into a 0-100 index.
World Bank, Doing Business
Ease of Hiring Foreign Labour
Survey responses to the question: Does labour regulation in your country prevent your company from employing foreign labor? (grades going from 1 to 7: 1 = prevents your company from employing foreign labor, 7 = does not prevent your company from employing foreign labor).
Global Competitiveness Report (WEF)
Extent of Incentive Compensation
Survey responses to the question: what is the extent of cash compensation of management? (grades going from 1 to 7: 1 = is based exclusively on salary,7 = includes bonuses and stock options, representing a significant portion of overall compensation).
Global Competitiveness Report (WEF)
Rigidity of Hours Index*
The indicator is an index with five components: (i) whether night work is restricted; (ii) whether weekend work is allowed; (iii) whether the work week consists of five and a half days or more; (iv) whether the workday can extend to 12 hours or more (including overtime); and (v) whether the annual paid vacation days are 21 days or less. (grades goes from 0 to 100, when higher grades indicates stronger rigity of hours).
World Bank, Doing Business
Immigration LawsSurvey responses to the question: Does immigration laws in your country prevent your company from hiring foreing labor? (grades going from 0 to 10: 0 prevents - 10 does not prevent).
IMD World Competitiveness Yearbook
Pay and productivitySurvey responses to the question: To what extent is pay in your country related to productivity? [Rate: 1 = Not related - 7 = Strongly related].
Global Competitiveness Report (WEF)
Court & Legal Framework
Enforcing Contracts - Cost in % of claimCost is recorded as a percentage of the claim, assumed to be equivalent to 200% of income per capita. No bribes are recorded. Three types of costs are recorded: court costs, enforcement costs and average attorney fees
World Bank, Doing Business
Enforcing Contracts - Number of ProceduresA procedure is defined as any interaction between the parties, or between them and the judge or court officer. This includes steps to file the case, steps for trial and judgment and steps necessary to enforce the judgment.
World Bank, Doing Business
Enforcing Contracts - TimeTime is recorded in calendar days, counted from the moment the plaintiff files the lawsuit in court until payment. This includes both the days when actions take place and the waiting periods between.
World Bank, Doing Business
Social and Health Security
Public Expenditure on Unemployment SupportPublic expenditure on unemployment per unemployed in US$, current PPPs. Public expenditure includes both partly, full public pay and any other program expenditures the public has.
OECD, Public expenditure and participant stocks on Labour Market Policy (LMP)
Public Health Care CoverageThe share of the population eligible for a defined set of health care goods and services under public programmes.
OECD Health data
Total expenditure on health as a percentage of gross domestic productThis is a core indicator of health financing systems. It provides information on the level of resources channeled to health relative to a country's wealth.
World Health Organization
Private expenditure on health as a percentage of total expenditure on health
This is a core indicator of health financing systems.This indicator contributes to understanding the relative weight of private entities in total expenditure on health.It includes expenditure from pooled resources with no government control, such as voluntary health insurance, and the direct payments for health by corporations (profit, non-for-profit and NGOs) and households. As a financing agent classification, it includes all sources of funding passing through these entities, including any donor (funding) they use to pay for health.
World Health Organization
General government expenditure on health as a percentage of total expenditure on health
This is a core indicator of health financing systems. This indicator contributes to understanding the relative weight of public entities in total expenditure on health. It includes not just the resources channeled through government budgets to providers of health services but also the expenditure on health by parastatals, extrabudgetary entities and notably the compulsory health insurance payments.
It refers to resources collected and pooled by the above public agencies regardless of the source, so includes any donor (external) funding passing through these agencies.
World Health Organization
OECD VARIABLES

Carlos Alberto Arruda de Oliveira / Vanessa Silva Nogueira / Vinícius Costa
Girişimcilik ve İnovasyon Yönetimi Dergisi / Journal of Entrepreneurship and Innovation Management56
Regu
lato
ry F
ram
ewor
kD
escr
iptio
nD
ata
Sour
ces
Inco
me
taxe
s; W
ealth
/Beq
uest
Tax
es
Aver
age
Inco
me
Tax
plus
Soc
ial C
ontr
ibut
ions
The
aver
age
rate
of t
axat
ion
in p
erce
ntag
e of
the
gros
s w
age.
The
indi
cato
r is
bas
ed o
n a
stan
dard
cas
e: s
ingl
e (w
ithou
t chi
ldre
n) w
ith h
igh
inco
me.
[%
GD
P].
OEC
D R
even
ue s
tatis
tics
Hig
hest
Mar
gina
l Inc
ome
Tax
plus
Soc
ial C
ontr
ibut
ions
The
high
est r
ate
of ta
xatio
n in
per
cent
age
of th
e gr
oss
wag
e. T
he in
dica
tor
is b
ased
on
a st
anda
rd c
ase:
sin
gle
(with
out c
hild
ren)
with
hig
h in
com
e.O
ECD
Rev
enue
sta
tistic
s
Reve
nue
from
Beq
uest
Tax
The
reve
nue
from
beq
uest
tax
as a
per
cent
of G
DP
on a
3 y
ear m
ovin
g av
erag
e.O
ECD
Rev
enue
sta
tistic
s
Reve
nue
from
Net
Wea
lth T
axTh
e re
venu
e fr
om n
et w
ealth
tax
as a
per
cent
of G
DP
on a
3 y
ear m
ovin
g av
erag
e.O
ECD
Rev
enue
sta
tistic
s
Taxe
s on
inco
me,
pro
fits
and
capi
tal g
ains
(% G
DP)
Fede
ral o
r cen
tral
gov
ernm
ent's
reve
nue
from
inco
me,
pro
fits
and
capi
tal
gain
s ta
xes
as a
per
cent
age
of G
DP
OEC
D R
even
ue s
tatis
tics
- Lat
in
Amer
ican
Cou
ntrie
s
Payr
oll t
axes
- pa
yed
by th
e em
ploy
er (%
GD
P)Co
ntrib
utio
n of
em
ploy
ers,
priv
ate
or g
over
nmen
tal,
to p
ublic
pen
sion
sc
hem
es.
Rece
ita F
eder
al d
o Br
asil
Payr
oll t
axes
- pa
yed
by th
e em
ploy
ee (%
GD
P)Co
ntrib
utio
n of
em
ploy
ees
- of
pub
lic o
r priv
ate
sphe
re -
to th
e so
cial
se
curit
y sy
stem
. Re
ceita
Fed
eral
do
Bras
il
Busi
ness
and
Cap
ital T
axes
SME
Tax
Rate
sN
ot s
peci
fied
at O
ECD
fram
ewor
kO
ECD
Rev
enue
sta
tistic
sTa
xatio
n of
Cor
pora
te In
com
e (%
of G
DP)
Corp
orat
e Ta
x Re
venu
e as
a p
erce
ntag
e of
GD
P.O
ECD
Rev
enue
sta
tistic
sRe
venu
eAs
per
cent
age
of G
DP
on a
thre
e ye
ar m
ovin
g av
erag
e.N
ot s
peci
fied
at O
ECD
fram
ewor
kTa
xatio
n of
Div
iden
ds –
Top
Mar
gina
l Tax
Rat
eN
ot s
peci
fied
at O
ECD
fram
ewor
kO
ECD
Tax
dat
abas
e
Taxa
tion
of S
tock
Opt
ions
The
aver
age
tax
wed
ge fo
r pur
chas
ed a
nd n
ewly
list
ed s
tock
s. A
vera
ge
inco
mes
are
use
d.O
ECD
, The
Tax
atio
n of
Em
ploy
ee
Stoc
k O
ptio
ns -
Tax
Polic
y St
udy
No.
11
Taxe
s on
fina
ncia
l and
cap
ital t
rans
actio
ns (%
GD
P)Fe
dera
l or c
entr
al g
over
nmen
t's re
venu
e fr
om fi
nanc
ial a
nd c
apita
l tr
ansa
ctio
ns ta
xes
as a
per
cent
age
of G
DP.
OEC
D R
even
ue s
tatis
tics
- Lat
in
Amer
ican
Cou
ntrie
s
Cost
of c
apita
lSu
rvey
que
stio
n: c
ost o
f cap
ital e
ncou
rage
s bu
sine
ss d
evel
opm
ent [
RATE
: 0
Det
ers
- 10
Enco
urag
es].
IMD
Wor
ld C
ompe
titiv
enes
s Ye
arbo
ok
Pate
nt S
yste
m; S
tand
ards
Inte
llect
ual P
rope
rty
Righ
tsSu
rvey
resp
onse
s to
the
ques
tion:
inte
llect
ual p
rope
rty
prot
ectio
n in
you
r co
untr
y (1
= is
wea
k or
non
exis
tent
, 7 =
is e
qual
to th
e w
orld
’s m
ost
strin
gent
).G
loba
l Com
petit
iven
ess
Repo
rt (W
EF)
Prop
erty
Rig
hts
Surv
ey re
spon
ses
to th
e qu
estio
n: p
rope
rty
right
s, in
clud
ing
over
fina
ncia
l as
sets
(1 =
are
poo
rly d
efin
ed a
nd n
ot p
rote
cted
by
law
, 7 =
are
cle
arly
de
fined
and
wel
l pro
tect
ed b
y la
w).
Glo
bal C
ompe
titiv
enes
s Re
port
(WEF
)
OEC
D V
ARI
ABL
ES
The Brazilian Entrepreneurial Ecosystem of Startups
57Cilt/Volume 2 | Sayı/Issue 3 | Aralık/December 2013
REGULATORY FRAMEWORK:
Variables suggested by the OECD for which it was possible to find data from Brazil = 24
Variables suggested by the OECD for which it was not possible to find data from Brazil = 13
Alternative variables added to the initial list provided by the OECD = 10
* Difficulty of Firing; Rigidity of hours index and Difficulty of hiring: all data re-ferring to Doing Business were provided directly by the report organizing committee. The documents provided to Fundação Dom Cabral listing the requested data includ-ed the observation in these specific variables that the indicators are being revised. The figures were then extracted from the Doing Business reports available online.


Girişimcilik ve İnovasyon Yönetimi Dergisi
Journal of Entrepreneurship and Innovation Management
59Cilt/Volume 2 | Sayı/Issue 3 | Aralık/December 2013 | 59-78
Cluster Development in Low Resource Settings: the Case of Bioethanol and Fruit Processing
Clusters in Uganda
Julius Ecuru*, Lena Trojer**, Peter Okidi Lating***, Yasin Naku Ziraba****
Abstract
In this paper, bioethanol and fruit processing clusters in Uganda were taken as sectoral innovation systems, and enabling conditions and barriers to their growth analysed from a technoscientific and innova-tion systems perspective. Active participation of entrepreneurial univer-sity scientists in the clustering process appears to be an enabling factor. Absence of goals and incentives for investing in the cluster areas and for driving formation of markets for cluster products is a major barrier. Adopting more inclusive innovation policies, and having in place good community engagement strategies, could help overcome the barriers and expand opportunities for clusters in low resource settings to grow and become competitive.
Key words: bioethanol, cluster, fruit processing, innovation system, Uganda.
* Doctoral Candidate, College of Engineering, Design, Art and Technology, Makerere University, Makerere Hill Road, Kampala, P. O. Box 7062, Kampala & Blekinge Institute of Technology, Box 214, S-374 24 Karlshamn, Sweden Email: [email protected] or [email protected]
** Professor, Blekinge Institute of Technology, Box 214, S-374 24 Karlshamn, Sweden Email: [email protected] or [email protected]
*** Senior Lecturer College of Engineering, Design, Art and Technology, Makerere University, Makerere Hill Road, Kampala, P. O. Box 7062, Kampala Email: [email protected]
**** Senior Lecturer, College of Engineering, Design, Art and Technology, Makerere University, Makerere Hill Road, Kampala, P. O. Box 7062, Kampala Email: [email protected]

Julius Ecuru / Lena Trojer / Peter Okidi Lating / Yasin Naku Ziraba
Girişimcilik ve İnovasyon Yönetimi Dergisi / Journal of Entrepreneurship and Innovation Management60
INTRODUCTION
Cluster development is widely regarded as one of the ways of ensuring competitiveness of firms and accelerating industrial and economic growth (Brakman & Van Marrewijk, 2013; Mwamila & Diyamett, 2011). A cluster is a concentration of firms in a geographic region that are interconnected by the market they serve and the products they produce, as well as by the suppli-ers, trade associations, and educational institutions with which they interact (Colgan & Baker, 2003). According to Porter (2000), clusters ‘represent a new way of thinking’ about economic growth at all levels, but which requires new roles for companies, government agencies, universities and other orga-nizations in enhancing competitiveness.
The cluster concept is relatively new in Uganda. Typical cluster initia-tives started to be promoted in Uganda and in most of eastern Africa around 2004, mainly by proactive university scientists, who view it as a collabora-tive platform between universities, industry and government (Mwamila et al., 2004b). This effort led to the creation of the Makerere University-led Innovation Systems and Clusters Programme (ISCP-Uganda), which is also affiliated with the Pan African Competitiveness Forum (PACF).
Clusters are recognized in Uganda’s industrial policy of 2008. The pol-icy encourages formation of innovative clusters as a mechanism to enhance sharing of knowledge, coopetition1, learning, value chain coordination and increased access to markets (Ministry of Tourism Trade and Industry, 2008). By their nature, clusters should thrive on their innovative potential and the value they create in their goods and services.
The aim of this paper is to highlight challenges of developing clusters and mechanisms to foster cluster growth and competitiveness in low re-source settings. Specifically, the paper identifies and discusses some of the key enabling conditions and barriers to growth of clusters in Uganda. This is done using case studies of two clusters viz: the Bioethanol and Fruit Pro-cessing clusters. The case studies are approached from a technoscientific2
1 “Coopetition” is a term that refers to firms competing and cooperating at the same time (Walley, 2007)
2 This approach is based on the understanding and experiences of triple helix, mode 2 (Nowotny et al., 2001) as well as of Donna Haraway and her situated knowledges (Haraway, 1991)

Cluster Development in Low Resource Settings: the Case of Bioethanol and Fruit Processing Clusters in Uganda
61Cilt/Volume 2 | Sayı/Issue 3 | Aralık/December 2013
and innovation systems perspective, but with a specific technological in-novation system (TIS) scheme of analysis. The TIS has been highlighted, for example, by Bergek et al. (2008) as an analytic framework for understanding the strength and weakness of an innovation system. It is a variant of the con-cept of innovation systems framed around a technology, product or service (Lundvall et al., 2002; Bergek, Hekkert, & Jacobsson, 2008; Edquist, 2005). Thus the bioethanol and fruit processing clusters were taken as sectoral in-novation systems, focusing on the product(s) or service (s) around which the clusters were formed (Niosi, 2010). An innovation system is an open and evolving relationship among a diverse group of actors involved in the production, diffusion and use of knowledge (Lundvall, 2010). A technosci-entific perspective is emphasized here in recognition of the way knowledge production is distributed and often situated (Haraway, 2007; Nowotny et al., 2001). The triple helix as university-industry-government relationship (Etzkowitz, 2003) is also considered, as it is the main concept driving the clustering process in Uganda. In this paper, therefore, TIS is seen as creat-ing conditions for bioethanol production and fruit processing clusters and fostering their innovation processes. Table 1 summarizes the TIS scheme of analysis as proposed by Bergek, Jacobsson, et al., 2008.

Julius Ecuru / Lena Trojer / Peter Okidi Lating / Yasin Naku Ziraba
Girişimcilik ve İnovasyon Yönetimi Dergisi / Journal of Entrepreneurship and Innovation Management62
Table 1: Functions of technological innovation systems (bioethanol and fruit processing)
Function Description
1.Knowledge development and diffusion
2.Influence on the direction of search
3.Entrepreneurial experimentation
4.Market formation
5.Legitimation
6.Resource mobilization
7.Development of positive externalities
The breath of scientific, indigenous and local knowledge with respect to fruit processing or bioethanol production;
Factors which make investment in fruit processing and bioethanol production attractive, including incentives, policy preferences, new markets, etc.
Emerging entrepreneurial activities, for example, new firms venturing into fruit processing and bioethanol production;
Trends in the development of the market for processed juice or bioethanol, type of the market, potential size of the market, and what is generally driving the formation of this market;
General perception about processed juice and bioethanol or production and acceptability of these products by the community and other actors.
Resources that are available, e.g. financial, human, and other complimentary services to support fruit processing and bioethanol production;
External economies brought about by the performance in the above functions-political support, advocacy coalitions, etc.
Methods used in the study are described in the following section. Re-
sults are presented and discussed in two parts: Part I discusses the Bioetha-
nol cluster, and Part II the Fruit processing cluster. Conclusions and recom-
mendations are presented in the last section.
METHODS
Twelve out of about 35 members of the Bioethanol cluster (in Jinja, east-
ern Uganda) were purposively selected and invited to a focus group discus-
sion. Similarly, 10 out of about 30 firms of the Fruit processing cluster (in

Cluster Development in Low Resource Settings: the Case of Bioethanol and Fruit Processing Clusters in Uganda
63Cilt/Volume 2 | Sayı/Issue 3 | Aralık/December 2013
Luwero, central Uganda), were purposively selected and invited to a focus group discussion. Invitations were written and addressed to the identified cluster members/firms. Furthermore, three members purposively selected from each cluster were interviewed separately. Academia representatives in the cluster and local government officials in the respective districts were also interviewed. Fruit juice processing was observed in two fruit juice pro-cessing firms in Luwero district, and ethanol brewing was observed in five ethanol brewing stations in Jinja district. Each stage of the juice production or ethanol brewing process was explained by production managers, who also addressed all questions and issues put to them. Data from the group dis-cussions and interviews as well as relevant observation notes and pictures were transcribed and analysed in accordance with the technological innova-tion systems scheme of analysis presented above.
RESULTS AND DISCUSSIONS
Part 1: The Bioethanol Cluster in Jinja
1.1 Historical Context
The Bioethanol Cluster is located in Kakira near Jinja, about 80 km east of Uganda’s capital city, Kampala. The cluster was formed in 2005 with the aim of producing ethanol from molasses for automobile and other industrial uses. The motivation for the cluster is to transform the historical brewing of crude ethanol, locally known as ‘Waragi’, in and around Kakira Sugar Works (KSW), into a modern bioethanol industry, subsequently improving the standard of life of the local community. Waragi production around KSW started in the 1970s after economic collapse under the dictatorial regime of President Idi Amin. When the sugar factory closed, there were no salaries paid to workers. The workers resorted to brewing alcohol as a source of in-come. This brewing business continued as a fall-back position for people, who retire from or get retrenched from the sugar factory. An estimated 500 people of mixed ethnic backgrounds are directly engaged in Waragi produc-tion in and around KSWs. Both women and men are involved in producing and selling ethanol, although women appear to be the majority (about 70%) compared to men.

Julius Ecuru / Lena Trojer / Peter Okidi Lating / Yasin Naku Ziraba
Girişimcilik ve İnovasyon Yönetimi Dergisi / Journal of Entrepreneurship and Innovation Management64
1.2 Key Actors
Figure 1 shows key actors in the Bioethanol cluster. Ethanol production progresses when there is financing and human capital available, and enabling governance regimes exist, e.g. policies, laws and regulations. Actors in the Bio-ethanol cluster can, therefore, be grouped appropriately as those directly sup-porting or engaged in ethanol production, those financing it, or those supply-ing the necessary human capital (knowledge and skills). Some of the actors may play single roles (sr), some dual roles (dr), while others may have multiple roles (mr). Local brewers, for example, make alcohol, but also use their locally generated funds and savings to finance their operations. KSW, on the other hand, plays one important single role, that is as a source of molasses. On the other hand, Makerere University plays multiple roles of financing, providing human resource and value addition to the ethanol production process.
Ethanol Production
Govern-ance
Human capitalFinancing
Makerere University
Sugarcane Growers
URSBMoJCA
Local BrewersKyambogo University
AcronymsKSW-Kakira Sugar WorksURSB-Uganda Registration Services BureauUNBS-Uganda National Bureau of StandardsMoJCA-Ministry of Justice, Law & Constitutional AffairsMTIC-Ministry of Trade, Industry and Cooperatives
Local Gov’tUNBS
KSW & Other Sugar Co.
Uganda Police
Raw Material SuppliersLarge Distilleries
Area Politicians
Middlemen & Buyers
MTIC
Makerere University
dr
dr
dr
dr
dr dr
drdr srsr
sr sr
sr
sr sr
sr
Figure 1: Key actors in the bioethanol cluster
Source: Structure adapted from Ecuru, et al., 2012.

Cluster Development in Low Resource Settings: the Case of Bioethanol and Fruit Processing Clusters in Uganda
65Cilt/Volume 2 | Sayı/Issue 3 | Aralık/December 2013
1.3 Bioethanol Production in the Cluster
Around 1985, before the sugar factory became operational again, jag-gery (crude sugar cane juice) was used as feedstock for making ethanol. Mo-lasses started to be used again, when the factory resumed sugar production in the 1990s. Middlemen buy molasses from the sugar factory and sell some of it to local breweries. Supplies of molasses are brought also from other sugar companies in the region as far as western Kenya and western Uganda.
Brewing is done locally using metallic drums of 100 litres each arranged in series of three to five, placed over traditional earthen stoves. Firewood is the fuel used for boiling during the distillation process. In order to get 20 litres of ethanol, local brewers mix about 40 litres of molasses with 80 litres of water and 40 litres of vinase, i.e. distillery waste water known by the lo-cal brewers as ‘Salala’. Vinase is used as a fermentation medium. Ethanol produced by the local brewers is about 40% v/v, much of which is sold for human consumption.
Disposal of leftover vinase or ‘Salala’ is a problem for both local brew-ers and local government. Vinase has high chemical oxygen demand and biological oxygen demand, which destroy plant life if indiscriminately dis-posed of in open fields (Chandraju, et al. 2013). In dry season, local brewers spread the vinase along the road to cover dust, but they also believe it could make a good binder in brick making and house construction.
1.4. Functioning of the Cluster
1.4.1 Knowledge Development and Diffusion
The Bioethanol cluster wants more efficient ways of using molasses, water and firewood to get more and higher quality ethanol for possible in-dustrial use. In early 2000, the area Politician learnt about this need and in-troduced the group to an industrial development not-for-profit organization, which was supporting small scale industries in Uganda. The latter organiza-tion through a local scientist (chemical/mechanical engineer) at Kyambogo University trained the local brewers and connected them to ISCP-Uganda. With support from ISCP-Uganda, the scientist and local brewers organized themselves and established a cluster to produce high quality bioethanol.
Julius Ecuru / Lena Trojer / Peter Okidi Lating / Yasin Naku Ziraba
Girişimcilik ve İnovasyon Yönetimi Dergisi / Journal of Entrepreneurship and Innovation Management66
This collaboration involved design and testing of a distillation column. The experiment yielded ethanol of between 80-90% v/v, which successfully pow-ered an automobile and a generator. Unfortunately, the success was short-lived (less than a year) as one of the columns reportedly stained (with rust) and the other broke down.
1.4.2 Entrepreneurial Experimentation
There are nearly 70 brewing stations, each with approximately five to 10 people. Brewing drums per station vary from one to 10. Each station brews at least once or twice daily. Together, the local brewers produce about 500 litres of ethanol per day. New entrants in brewing alcohol come and go as they get into other businesses. Although the production of bioethanol did not prog-ress, local brewers still believe that with a properly functioning distillation column, they can organize themselves as a cottage industry to produce and sell bioethanol for industrial uses. One of the local brewers said optimisti-cally, “…if we could get support and come up with a cottage industry, we would be in a position to buy this Waragi from our distillers and centralise it in one place and purify it, and do packaging, bottling and market it worldwide”. Jaffe and Azumi (1960) used the term ‘cottage industry’ referring to econom-ic activities, e.g. a small scale retail business or processing unit, which is carried out on, at, or near the home of the worker or proprietor, and usually run by the proprietor’s family members (Jaffe & Azumi, 1960).
1.4.3 Influence on the Direction of Search
The Bioethanol cluster aspires to produce bio-ethanol for industrial uses partly because of the increasing global pressure to reduce greenhouse gas emissions by developing alternative environmentally friendly renewable fu-els. The Organization for Economic Cooperation and Development (OECD) projects global ethanol production will rise from 100 billion litres in 2011 to nearly 160 billion litres by 2019; and predict that whereas the feedstock for ethanol production will be coarse grains in developed countries, for develop-ing countries it will be root and tubers and molasses (OECD/FAO, 2012). As countries explore green growth strategies, bioethanol production is expected to become more and more important in Uganda and the region. The chal-lenge, however, is though the national energy policy and national sugar poli-

Cluster Development in Low Resource Settings: the Case of Bioethanol and Fruit Processing Clusters in Uganda
67Cilt/Volume 2 | Sayı/Issue 3 | Aralık/December 2013
cy both recognise biofuels as a potentially renewable energy resource, there is no strategy, incentives and programs yet to translate this into action especial-ly for bioethanol production (Ministry of Trade Industry and Cooperatives (MTIC), 2010). No national standards exist so far for bioethanol. Bioethanol does not feature prominently as one of the energy priorities for Uganda.
1.4.4 Market Formation
Most of the ethanol produced by the cluster is consumed as beverage. But with the distillation column functioning well, the cluster has potential to produce ethanol of over 80% v/v for industrial uses. One cluster member said, “If we could come up with ethanol, pure ethanol, ours would be market-able. We did it to the range of 90% v/v. These people (i.e. the potential buyers) would come and buy—the hospitals would buy, it would be used by big hotels, the universities, laboratories and so many others because whatever (i.e. etha-nol) is used in Uganda right now comes from outside Uganda.” However, if a market for bioethanol is to be created, government regulation requiring, for example, blending with fossil fuels, would be necessary like it is elsewhere, in USA, Brazil, Europe, China, and was also tried in Zimbabwe, Kenya, and Malawi (Shiyan, 2012; Amigun et al., 2011). The challenge would be to mo-bilise capacity to produce sufficient amounts of bioethanol, and to address dual concerns of food and fuel competition. Also, the cluster could link with bigger distilleries to buy the ethanol, provided local brewers get fair returns for their efforts. Additionally, the ethanol could replace kerosene in local stoves and lamps.
1.4.5 Legitimation
Ethanol for industrial purposes is generally acceptable. However, lo-cal authorities are concerned about potential for its abuse if not controlled. Some members of the community have negative perception about produc-tion of ethanol by this cluster. The cluster members are aware of this but they try to cope with it. One of the cluster members said, “People enjoy it (the alcohol) but they do not want to be associated with its production”. Another member said, “...there is a tendency of citing these Waragi brewers saying they make the environment dirty, and yet it is a business sustaining so many households”. Some people also view it as an illegal trade. The Enguli (Manu-

Julius Ecuru / Lena Trojer / Peter Okidi Lating / Yasin Naku Ziraba
Girişimcilik ve İnovasyon Yönetimi Dergisi / Journal of Entrepreneurship and Innovation Management68
facturing and Licensing) Act of 1966 prohibits the manufacture and sale of alcohol without a license. Enguli is an indigenous word for locally brewed alcohol. In their 2004 report the Justice Law and Order Sector observed that production and consumption of Enguli is widespread in the country. The report recognized that the ‘selling of Enguli is a source of revenue especially to the rural poor and some local administrations and as a result the Act has outlived its usefulness and recommended decriminalization of the Act, giv-en also that other big companies are by law authorised to produce a similar product (Ministry of Justice and Constitutional Affairs, 2004). However, in 2010, Uganda Youth Development Link (UYDL), a local Non-Governmental Organization published a report calling for strict implementation of the En-guli Act to prevent alcohol abuse and its associated dangers (UYDL, 2010). The local brewers, however, seem to find solace in the national sugar policy which they believe gives them more leverage to produce ethanol from mo-lasses coming from sugar works. The sugar policy specifically recognises the potential of diversification in use of molasses to make portable alcohol, industrial alcohol and gasohol (MTIC, 2010).
1.4.6 Resource Mobilization
Most of the local brewers are former sugar factory workers. The skill of brewing ethanol is learned through apprenticeship within this community. Some members gained additional skills through training in, for example, en-trepreneurship. The local competence base for producing more purified and standardized ethanol can be acquired from local universities and associated beer industries in the country. With respect to financing, local brewers use their own savings. The local brewers are reluctant to acquire bank loans for their businesses. Red tape, high interest rates and lack of collateral seemed to be their main concerns/barriers to accessing credit.
1.4.7 Development of Positive Externalities
The Jinja district local government is interested in this community of local brewers. The local brewers pay taxes to the local council. To improve their living conditions and waste management, the district plans to acquire land, to which the local brewers would be relocated, hopefully with better amenities. Other than forming themselves into a Bioethanol cluster, there is
Cluster Development in Low Resource Settings: the Case of Bioethanol and Fruit Processing Clusters in Uganda
69Cilt/Volume 2 | Sayı/Issue 3 | Aralık/December 2013
no presence of advocacy groups or associations that are specifically promot-ing bioethanol as an alternative form of fuel. Support from civil society and the political elites will be essential for the bioethanol enterprise is to grow.
1.5 Summary Conclusions
The Bioethanol cluster in Jinja is isolated with a number of policy, so-cial, and technical challenges. The cluster could benefit from a specific pol-icy effort, strategy and incentives aimed at promoting bioethanol for indus-trial uses. In the absence of such strategy and incentives, ethanol production in the cluster may remain for human consumption only, but with social and health ramifications when it is abused, including for example, domestic vio-lence, destruction of family structures, severe and dangerous situations for the children. Therefore, the bioethanol cluster initiative, in trying to trans-form local ethanol brewing into a modern industrial bioethanol production, should also try to secure practices that minimize risk of alcohol dependency associated with unregulated brewing of ethanol.
Part II The Fruit Processing Cluster in Luwero
2.1 Historical Context
The Luwero Fruit Processing Cluster (LFPC) is located in Luwero dis-trict, 65 km north of Kampala City. It was established in 2005. Fruit process-ing in Luwero started around 1999. The main fruits are pineapple, mangos, passion fruits, papaya, avocado, jackfruit, and tomatoes. Uganda has a size-able share of these fruits in east and central Africa (Agona, et al. 2002). The motivation for fruit processing in Luwero is value addition to create jobs for the youth and to diversify household incomes. With this goal, individual local entrepreneurs began their own small fruit processing units in their homes (cottages). Nearly 30 micro and small scale fruit processors exist in the district and approximately 70 exist country-wide.
2.2 Key actors
Figure 2 shows key actors in the Fruit processing cluster. A good num-ber of processors supported by organized farmer groups and farmer-centred

Julius Ecuru / Lena Trojer / Peter Okidi Lating / Yasin Naku Ziraba
Girişimcilik ve İnovasyon Yönetimi Dergisi / Journal of Entrepreneurship and Innovation Management70
associations are present. Private sector, government and development part-ners appear to have provided the necessary financial resources. The supply of skilled personnel in fruit processing seems adequate, and there is also em-phasis on entrepreneurial skills, notably by Enterprise Uganda. In terms of governance, the agencies exist such as ministry responsible for agriculture, trade and investments and bureau of standards.
Fruit Processing
Govern-ance
Human capitalFinancing
Makerere Univ
UIRI
UEPB
Farmers
SNV
URSB
UNFF
MAAIF
Enterprise Uganda
Processors/ LFPC
Kyambogo Univ
AcronymsURSB-Uganda Registration Services BureauUNFF-Uganda National Farmers’ FederationUNBS-Uganda National Bureau of StandardsNAADS-National Agricultural Advisory ServicesPres’ Office-President’s OfficeMAAIF-Ministry of Agriculture, Animal Industry & FisheriesUEPB-Uganda Exports Promotion BoardNOGAMU-National Organic Manufacturers in UgandaNARL-National Agricultural Research LaboratoriesUMA-Uganda Manufacturers’ AssociationSNV-SNV Netherlands Development OrganizationLFPC-Luwero Fruit Processing ClusterUIRI-Uganda Industrial Research InstitutePSF-Private Sector FoundationMFPED-Ministry of Finance, Planning and Economic DevelopmentLDFA-Luwero District Farmers’ AssociationUDC-Uganda Development CooperationMTIC-Ministry of Trade, Industry and Cooperatives
Irish Aid
Local Gov’t
NARLNOGAMU
NAADSUNBS
Larger Scale Fruit Processors
PSF
UMA
Pres’ Office
Raw Material Suppliers
MFPED
LDFA
UDC
MTIC
dr
dr
dr
dr
dr dr
drdr
sr
sr
sr
sr
sr sr
sr
sr
Figure 2: Key actors in the fruit processing clusterSource: Structure adapted from Ecuru,et al., 2012

Cluster Development in Low Resource Settings: the Case of Bioethanol and Fruit Processing Clusters in Uganda
71Cilt/Volume 2 | Sayı/Issue 3 | Aralık/December 2013
2.3 Fruit processing by the Cluster
The Cluster produces mainly mixed fruit juices comprised of pineapple, papaya, passion, and oranges. They also produce jam and tomato souce. The fruits are screened, cleaned with water, crushed and manually squeezed to extract crude juice. The crude juice is then filtered using special nets bought from supermarkets in Kampala. The filtrate (juice) is mixed in certain ra-tios, and preservatives (sodium benzoate, potassium sorbate, citric acid or sulphur dioxide) and additives (food colour and sugar) added. The juice (mixed) is then pasteurized at 70 – 75 degrees Celsius (for fruits) and 80-87 degrees Celsius (for jam), cooled to about 60 degrees Celsius and packed in glass bottles ready for sale.
The cluster developed plant based preservatives for their juices, which they claim works very well with a reported shelf life of two years. The idea was conceived by one of the cluster members after attending a training work-shop organized by a network of indigenous people and researchers in east and central Africa. The cluster then developed the idea further, perfecting it through trial and error until they obtained a formula that seems to work well for them. The ISCP-Uganda is assisting to protect their intellectual asset.
2.4. Functioning of the cluster
2.4.1 Knowledge Development and Diffusion
The main interest for the cluster is to develop different formulations and to try out juices from a variety of fruits (blends). Some of the cluster members have started using plant based preservatives. However, the ef-ficacy of these particular plant based preservatives is yet to be ascertained with modern scientific tools. A challenge is high cost of packaging materi-als, which accounts for more than half of the production cost. One proces-sor lamented: “Packaging is a problem. It limits our production, because at the end of the day, the production cost goes high”. A 500ml bottle costs about one US dollar. Being small processors, the cluster does not enjoy the economies of scale to make large orders, and orders made take too long to be delivered.

Julius Ecuru / Lena Trojer / Peter Okidi Lating / Yasin Naku Ziraba
Girişimcilik ve İnovasyon Yönetimi Dergisi / Journal of Entrepreneurship and Innovation Management72
2.4.2 Entrepreneurial Experimentation
The number of fruit processors in Luwero district has increased slightly since 1999. In 2008, the President of Uganda at the Luwero farmers’ request promised to support building of a fruit processing factory in the region. Land for the factory was acquired, but the plan stalled when a prospective investor pulled out of the deal (Kiwanuka, 2010). For the cluster members, it seems that the factory would be of value, if it helped them grow as a cottage indus-try. One member said emphatically, “…our strategy is to fight poverty through cottage industry so that people can be productive right from their homes”. Any future investment strategy in fruit processing in this community should weigh opportunity cost of investing in a large scale juice processing factory verses developing a fruit processing cottage industry. There are experimental fruit processing projects at the Uganda Industrial Research Institute, which is processing juice from mango and passion fruits and at the School of Bio-engineering, Food and Nutrition at Makerere University, which also houses an incubator for fruit and vegetable products. These developments within the fruit processing sub-sector in the country could enhance profitability of the LFPC through building stronger synergy among the actors.
2.4.3 Influence on the Direction of Search
Value addition and agro-processing is one of Uganda government’s pri-orities for economic growth and development. Local processors also boast of an organic market for their juices. Although, there is no specific strategy so far for fruit processing at district and national level, it is promoted as one of agro-processing and value addition opportunities. Fruits and horticultural crops are ranked in the Agriculture Sector Development and Investment Plan (DSIP) 2010/11 – 2014/15 as a commodity generally small in size with-out a significant contribution to the export market, but having a high return on investment and a high potential future impact (Ministry of Agriculture Animal Industry and Fisheries, 2010).
2.4.4 Market Formation
The market for fruits is believed to be growing as people change their dietary habits in preference to fruits and vegetables. The regional market (Kenya and South Sudan) as well as the local market is also believed to be

Cluster Development in Low Resource Settings: the Case of Bioethanol and Fruit Processing Clusters in Uganda
73Cilt/Volume 2 | Sayı/Issue 3 | Aralık/December 2013
expanding. Luwero’s central location makes it a potential fruit hub, serving both local and regional markets. The fruit processors believe that they can have an edge in the organic market. One of them confidently stated, “for us we use purely fruit juice; that makes us different from the others”. However, to sustain this unique attribute of the ‘Luwero fruits’, the processors would have to formally certify their ‘organic’ fruit claims. They would also have to label their products as organic and possibly register trademarks for the products. But most processors are not aware of trademarks, and how it is acquired or registered. Furthermore, to sustain the fruit market, the production side of it must be supported by breeding systems and good agronomic practices to ensure a steady supply of fruits, and to help maintain a distinction between organic and non-organically produced fruits. This support can come from agricultural extension agents and university partners in the cluster.
2.4.5 Legitimation
Generally, people like fruits, both fresh and processed for different con-sumption preferences. Parents normally buy processed juice concentrates for their children returning to boarding school. Locally processed fruits juices are also acceptable in hotels and restaurants. Local processors believe their products are well received: “It depends”, said one processor. “Some individuals prefer this (processed juice) others prefer fresh; whereas other families pack it (processed juice) for their children when they are going back to school”. Another describing the eating habits of customers, said, “The pineapples you chew live; now you will not be surprised after eating this one, the pineapple, then he asks for his juice: ‘Ndetera ku juice wange (translated, “please, bring me my juice’)”. The challenge with locally produced juice is that consumers do not distinguish its price from the one conventionally produced. One processor was disappointed, and said, “people believe that all these (conventional and organic) juices are the same; so they expect you to sell it at say Uganda Shillings 500, when your bottle alone is Uganda Shillings 2,300…”. Customers tend to tag the same price on all juices in the market. They do not differentiate price and quality. Cluster firms should also bear the cost of securing quality marks for their products.

Julius Ecuru / Lena Trojer / Peter Okidi Lating / Yasin Naku Ziraba
Girişimcilik ve İnovasyon Yönetimi Dergisi / Journal of Entrepreneurship and Innovation Management74
2.4.6 Resource Mobilization
The necessary human resources can be available from the local univer-sities. In addition, the Uganda Industrial Research Institute, Uganda Nation-al Bureau of Standards and the National Agricultural Research Laboratories have specialist capacities to support the fruit processing sub-sector gener-ally and the Luwero Cluster in particular. Other capacities exist in larger more established formal fruit processing industries within the country. With respect to financing, there are some challenges with access to credit. There have been initiatives such as the youth entrepreneurship scheme, bank loans and micro credits, but red tape and high interest rates (not less than 10% per annum) appear to discourage cluster firms from getting credit.
2.4.7 Development of positive externalities
The juice processing industry in Uganda is both non formal and formal. But there are no organized associations or advocacy groups for locally pro-cessed juices. However, the Farmer’s Federation appears to be quite strong, although their focus is on productivity and welfare of the farmers.
2.5 Summary Conclusions
The LFPC has the potential to grow into a regional fruit hub. However, for this to happen, the Cluster needs to broaden its membership to encom-pass the multiplicity of actors in the fruit processing subsector and interac-tions promoted among actors.
CONCLUSION AND RECOMMENDATIONS
The active involvement of academia is paramount in any innovative cluster development effort. The university can fill a knowledge gap and ca-talyse innovative activity of cluster firms. However, this requires the univer-sity to maintain a significant presence in the cluster community. Establish-ing a field cohort for joint projects, including offering incubation support, could be part of the university’s long term engagement strategy with clusters.
If the two clusters are to evolve and grow, deliberate policy measures will be necessary to guide and drive innovation and create market opportu-
Cluster Development in Low Resource Settings: the Case of Bioethanol and Fruit Processing Clusters in Uganda
75Cilt/Volume 2 | Sayı/Issue 3 | Aralık/December 2013
nities for the bioethanol and fruit processing sub-sectors. There is need for specific targets and incentives to drive ambitions and lines of inquiry into product development and innovations within these clusters both at national and local levels.
Both the bioethanol and fruit processing cluster members seem to prefer a cottage type of industrial growth. A cluster development strategy should therefore strike a balance between investing in larger more industrial pro-cessing plants and supporting community centred cottages. This notwith-standing, the clusters must be inclusive of other actors in fruit processing and bioethanol production. More emphasis should be made on delivering products and covering the geographical spread and concentration of the ac-tors involved; and in identifying cluster facilitators with more convening power and ability to build trust among cluster firms.
For both the bio-ethanol and fruit processing clusters, the role of the community is important in determining the direction and growth of the cluster since both clusters are community based. An active community en-gagement strategy is essential for clusters in these types of settings.
In conclusion, a technoscientific and innovation systems perspective can be used to identify enabling conditions and barriers to cluster develop-ment in low resource settings.

Julius Ecuru / Lena Trojer / Peter Okidi Lating / Yasin Naku Ziraba
Girişimcilik ve İnovasyon Yönetimi Dergisi / Journal of Entrepreneurship and Innovation Management76
References
Agona, J. A., Nabawanuka, J., & Kalunda, P. (2002). A market overview of the dried fruit sector in Uganda. Kampala.
Amigun, B., Musango, J. K., & Stafford, W. (2011). Biofuels and sustainability in Africa. Renewable and Sustainable Energy Reviews, 15(2), 1360–1372. doi:10.1016/j.rser.2010.10.015
Bergek, A., Hekkert, M., & Jacobsson, S. (2008). Functions in innovation sys-tems : A framework for analysing energy system dynamics and identifying goals for system-building activities by entrepreneurs and policy makers. Policy. Chalmers.
Bergek, A., Jacobsson, S., Carlsson, B., Lindmark, S., & Rickne, A. (2008). Ana-lyzing the functional dynamics of technological innovation systems: A scheme of analysis. Research Policy, 37, 407–429. doi:10.1016/j.respol.2007.12.003
Brakman, S., & Van Marrewijk, C. (2013). Reflections on cluster policies. Cam-bridge Journal of Regions, Economy and Society, 1–15. doi:10.1093/cjres/rst001
Chandraju, S., Thejovathi, C., & Kumar, C. S. C. (2013). Impact of distillery spent wash irrigation on sprouting, growth and yield of Dahlia (Asteraceae) flowering plant. Chemical Science Transactions, 2(2), 635–641. doi:10.7598/cst2013.364
Colgan, C. S., & Baker, C. (2003). A framework for assessing cluster development. Economic Development Quarterly, 17(4), 352–366. doi:10.1177/0891242403256667
Ecuru, J., Trojer, L., Ziraba, Y. N., & Lating, P. O. (2012). Structure and dynamics of Uganda’s technological innovation system. African Journal of Science, Technology, Innovation and Development, 4(4).
Edquist, C. (2005). Systems of innovation: perspectives and challenges. In J. Fargerberg, D. C. Mowery, & R. R. Nelson (Eds.), The Oxford Handbook of Innovation (pp. 181–208). New York: Oxford University Press.
Etzkowitz, H. (2003). Innovation in innovation: the Triple Helix of universi-ty-industry-government relations. Social Science Information, 42(3), 293–337. doi:10.1177/05390184030423002
Haraway, J. D. (1991). Simians, cyborgs, and women: The reinvention of nature (pp. 183–201). Free Association Books, London.
Haraway, J. D. (2007). Situated knowledges : The science question in feminism and the privilege of partial perspective. Feminist Studies, 14(3), 575–599.

Cluster Development in Low Resource Settings: the Case of Bioethanol and Fruit Processing Clusters in Uganda
77Cilt/Volume 2 | Sayı/Issue 3 | Aralık/December 2013
Jaffe, A. J., & Azumi, K. (1960). The birth rate and cottage industries in under-develope countries. Economic Development and Cultural Change, 9(1), 52–63. Re-trieved from http://www.jstor.org/discover/10.2307/1151922
Kiwanuka, F. (2010, September 19). Construction of Luwero fruit plan stalls. The New Vision. Kampala. Retrieved from http://allafrica.com/stories/201009200176.html
Lundvall, B.-Å. (2010). National innovation systems: toward a theory of innova-tion and interactive learning. (B.-Å. Lundvall, Ed.). London: ANTHEM Press.
Lundvall, B.-Å., Johnson, B., Andersen, E. S., & Dalum, B. (2002). National sys-tems of production, innovation and competence building. Research Policy, 31, 213–231.
Ministry of Agriculture Animal Industry and Fisheries. (2010). Agriculture sector development strategy and investment plan: 2010/11-2014/15. Development. Kampala.
Ministry of Justice and Constitutional Affairs. (2004). A study on sentencing and offences legislation in Uganda (pp. 1–46).
Ministry of Tourism Trade and Industry. (2008). National Industrial Policy. Kampala.
Ministry of Trade Industry and Cooperatives (MTIC). (2010). National Sugar Policy. Kampala.
Mwamila, B. L., & Diyamett, B. (2011). Tanzania: The evolving role of universi-ties in economic development. In B. Goransson & C. Brundenius (Eds.), Universi-ties in Transition: The Changing Role and Challenges for Academic Institutions (pp. 171–179). Ottawa, Canada: Springer. doi:10.1007/978-1-4419-7509-6
Mwamila, B. L., Trojer, L., Diyamett, B., & Temu, K. A. (2004). Innovation sys-tems and innovative clusters in Africa. In B. L. Mwamila, L. Trojer, B. Diyamett, & K. A. Temu (Eds.), Innovation Systems and Innovative Clusters in Africa (pp. 3–111). Bagamoyo, Tanzania.
Niosi, J. (2010). Building national and regional innovation systems: institutions for economic development. Cheltenham: Edward Edgar Publishing Limited.
Nowotny, H., Scott, P., & Gibbons, M. (2001). Re-thinking science: Knowledge and the public in the age of uncertainty. Cambridge: Piloty Press, UK.
OECD/FAO. (2012). OECD-FAO Agricultural Outlook 2012 - 2021 (pp. 87–95). OECD Publishing and FAO. Retrieved from http://dx.doi.org/10.1787/agr_outlook-2012-en
Porter, M. E. (2000). Location, competition, and economic development: Lo-cal clusters in a global economy. Economic Development Quarterly, 14(1), 15–34. doi:10.1177/089124240001400105

Julius Ecuru / Lena Trojer / Peter Okidi Lating / Yasin Naku Ziraba
Girişimcilik ve İnovasyon Yönetimi Dergisi / Journal of Entrepreneurship and Innovation Management78
Shiyan, C. (2012). Development of Biofuels in China Technologies , Economics and Policies.
Uganda Youth Development Link. (2010). The road map to alcohol: policy and regulation in Uganda.
Walley, K. (2007). Coopetition: An introductionto the subject and an agenda for research. International Studies on Management and Organization, 37(2), 11–31. doi:10.2753/IMO0020-8825370201

Girişimcilik ve İnovasyon Yönetimi Dergisi
Journal of Entrepreneurship and Innovation Management
79Cilt/Volume 2 | Sayı/Issue 3 | Aralık/December 2013 | 79-98
Managerial Cognition in R&D Processes Within Indian hi-tech firms:
A Conceptual Framework
Niharika Garud*, Lakshmanan Prasad**
Abstract
New products are a source of firms’ competitive advantage. Research on R&D investments, processes and performance has majorly been at the level of analysis of organizations. In this research, we theorize and build theoretical arguments on managerial cognition in R&D projects and impact on performance within firms at an individual level entrepreneurial decision-making and resource utilization processes. We bridge behavioral-decision with cognitive perspective in building propositions on R&D processes. We examine corporate R&D managers, under resource constraints and high uncertainty, apply cognitive processes to take decisions and how it affects performance. We argue that cognitive processes are moderated by political skills of R&D manager and how it affects performance. This research also builds our understanding of managerial cognition under uncertainty within large organizations.
Key words: management of innovation, R&D, emerging economies, resource constraints
* Doctoral Candidate, Organizational Behavior & Human Resources Indian Institute of Management Bangalore, India E: [email protected] P: +91-942-570-9875
Address: C/O FPM Office, IIM Bangalore Campus, Bannerghatta Road, Bangalore
560076 INDIA
** Professor, Organizational Behavior & Human Resources Indian Institute of Management Bangalore, India E: [email protected] P: +91-80-26993158
Address: C-208, Academic Blocks, IIM Bangalore Campus, Bannerghatta Road, Bangalore 560076 INDIA
NOTE: Both authors have contributed equally

Niharika Garud / Lakshmanan Prasad
Girişimcilik ve İnovasyon Yönetimi Dergisi / Journal of Entrepreneurship and Innovation Management80
INTRODUCTION
Innovation and R&D are important factors for growth and profitability of organizations and play an important role in economic development of nations. Innovation positively impacts firm level competitiveness, national standards of living and a nation’s ability to eradicate poverty (Dutz, 2007). Therefore, researchers, practitioners and organizations are actively interest-ed in identifying determinants of successful innovation and R&D outcomes. The research on innovation and R&D in organizations began with Schum-peter (Schumpeter, 1947) proposing that larger monopolistic organizations are responsible for most technology innovations that reach the market (Co-hen & Levinthal, 1990). With the emergence of the behavioral and manage-rial cognition perspective over the last forty years, scholars began to study innovation and R&D challenges at the micro level of the scientist, the in-novator and the product champion (Burgelman, 1983). Recent research has found the roles of innovator, product champion and manager to overlap and affect the outcomes and process of R&D and innovation, irrespective of their formally assigned roles.
Decisions to invest and decisions to disintegrate or persist with an idea can influence investments in R&D over time as well as long run outcomes. These decisions in R&D projects are taken in an uncertain environment and hence, are risky, with potential payoffs only realized in the long run. Fur-thermore, they are based on temporal tradeoffs between firms’ short term profitability and long term gains (Deutsch, 2007). According to resource de-pendence theory, irrespective of potential benefits to the firm in the longer run, not all stakeholders of the firm will be interested in making R&D invest-ments. R&D managers need to operate and realize novel ideas in organiza-tional settings while operating with similar issues that entrepreneurs face - limited resources and other constraints during the new product develop-ment. Hence, an unconventional entrepreneurial approach to manage risky R&D decisions will play crucial role in supporting managers to deviate to the path of new product development and innovation in firms.
The managers of R&D projects choose specific ideas from a number of proposals of new products operating in the same R&D setting. Hence, man-agers use their own domain specific knowledge bound by cognitive biases and firm dynamics to assess the R&D project in terms of both short term and

Managerial Cognition in R&D Processes Within Indian hi-tech firms: A Conceptual Framework
81Cilt/Volume 2 | Sayı/Issue 3 | Aralık/December 2013
long-term benefits. This process requires managers and hence, their firm, to identify relevant resources that aid such projects from already constrained internal and external environments. Identifying the cognitive issues of ex-perienced managers, working in similar uncertainty as in entrepreneurial settings, provides us insights on how managerial style (effectual, causal and bricolage) facilitates R&D performance and in turn, informs us on how man-agers should deal with R&D and innovation. In this research, we examine managers of R&D projects through the lens of cognition processes (taken from entrepreneurship literature) within the boundaries of a firm.
ImpACT Of mANAgeRIAl COgNITION ON R&D peRfORmANCe
Investments in R&D and innovation processes in large organizations pose a challenge in terms of valuations made by conventional management practices (Klein & Sorra, 1996). For instance, the goal of the R&D process may change with the development process and the targets and solutions might not be clear. So if a new product is being developed, it becomes dif-ficult to accurately identify potential market and demand functions. The typical managerial issues that arise around the development and conceiving of the idea for a new product that is yet to be developed include: How do we design the process flow for this product? How do we identify, valuate and seek resources for its development? How do we convince the top manage-ment to provide support and to shelter the development processes? These are some common issues arising in R&D intensive areas on a regular basis (von Zedtwitz, Gassmann, & Boutellier, 2004). The managers in R&D are therefore forced to be more entrepreneurial as compared to the managers in routine operations (Busenitz & Barney, 1997; Lyon, Lumpkin, & Dess, 2000).
Some of the most common conflicts faced by R&D managers in an orga-nization are to rationalize the process of creation and predict the creation at the same time (Davenport & Short, 1990). Data such as demand functions, market estimation and goal specification are often required to be presented to stakeholders including top management in large organizations for invest-ment purposes. This justification is the key to acquire resources and to get the internal legitimacy to the process of creation, which might be crucial for subsequent stages of development (Deeds, Decarolis, & Coombs, 2000). We,
Niharika Garud / Lakshmanan Prasad
Girişimcilik ve İnovasyon Yönetimi Dergisi / Journal of Entrepreneurship and Innovation Management82
therefore, argue that entrepreneurial cognition of managers positively affects their innovative behavior and performance in R&D (including output and ef-ficiency). We propose that R&D managers, in resource constrained corporate settings, who learn from their entrepreneurial expertise, who employ effec-tuation and bricolage and use their political skills, are better decision-mak-ers in product innovation when viewed through the lens of organizational performance standards.
eNTRepReNeURIAl COgNITION IN DeCISION-mAkINg
Organizations in general deal with both exploration and exploitation constantly as in ambidextrous organizations (O Reilly, 2004). For example, exploration of a particular opportunity or an idea might require more en-trepreneurial thinking and actions whereas exploitation will require goal orientation and setting targets (Sarasvathy, 2001). Exploration and exploi-tation processes are integral to uncertainty and the R&D context and lead to an emergent strategy (Mintzberg & Waters, 1985). In recounting of R&D success, the organizations depict the successful output as a direct result of the choices and decisions that they made. Similarly, exploration and exploi-tation might be viewed as a result of an intended set of decisions in a cor-porate context where decision makers are answerable to internal polity and external stakeholders. Hence, individual behavior becomes crucial when managers get involved in decision-making processes of the organization that are bound by a set of resources, stakeholders, and social structures. However, there can be different ways in which individuals intrinsically think, gather data, process information, make certain choices and act upon them in any social settings (Salancik & Pfeffer, 1978). Thus, the difference in choices and actions is where entrepreneurial actions in corporate settings begin.
lINkAgeS beTweeN mANAgeRIAl COgNITION AND R&D peRfORmANCe
Investments, intensity and outcomes in R&D have been globally used to measure innovation management inputs (Adams, Bessant, & Phelps, 2006). Several scholars have linked R&D intensity (ratio of investments or expendi-

Managerial Cognition in R&D Processes Within Indian hi-tech firms: A Conceptual Framework
83Cilt/Volume 2 | Sayı/Issue 3 | Aralık/December 2013
ture or number of people employed along with variety of roles and some ex-pression of R&D output) with innovation performance and firm performance at firm level (e.g. Deeds, 2001; Greve, 2003; Parthasarthy & Hammond, 2002). R&D has been studied at firm, entrepreneurial and individual level. There are several behavioral studies which focus on personality traits of R&D man-agers and comparative analyses with entrepreneurs, intrapreneurs and gen-eral managers (cf. (Scott & Bruce, 1994). Several studies have shown innova-tive efforts of employees and management as one of the key factors influenc-ing innovative performance of the firm (Bedrock & Watson, 1993; Hoffman, Parejo, Bessant, & Perren, 1998). However, we can see a clear gap between the behavioral, cognitive and micro studies in R&D and their implications on individual as well as team based performances and innovativeness. When financial and other constraints are imposed on R&D in organizations, R&D managers may choose to invest and continue to invest as per the organiza-tions criteria to evaluate such projects. Even then, their evaluation is not always be empirical or based on net present value calculations. They may use their earlier experiences and expertise to analyze the R&D opportunity and synthesize it into a holistic view before making a specific R&D invest-ment. Since their expertise, ability to think holistically and cognition has not been studied before in terms of their impact on performance, this is a clear research gap in the area.
eNTRepReNeURIAl COgNITION IN CORpORATe SeTTINgS
The entrepreneurial cognition concepts of effectuation and bricolage have largely been studied in the context of independent entrepreneurs and start-ups in organization research. However, there are only a few articles that study bricolage and effectuation in larger corporate settings (Brettel, Mauer, Engelen, & Küpper, 2011; Senyard, Baker, & Steffens, 2010). R&D and innovation provide an interesting context to examine effectual and bri-colage cognitive processes in contrast to traditional approaches of planning and rationality to explore and exploit opportunities in resource constraint environments. Our research examines the application of the entrepreneur-ial cognition concepts of effectuation and bricolage to R&D and innovation decision-making and its performance in large corporate settings.
Niharika Garud / Lakshmanan Prasad
Girişimcilik ve İnovasyon Yönetimi Dergisi / Journal of Entrepreneurship and Innovation Management84
effectuation
Sarasvathy discusses four principles of entrepreneurial cognition dis-played by entrepreneurial experts that shows how entrepreneurs think, pro-cess information and make key decisions through effectuation (Sarasvathy 2001). When compared to the causal school of thought, effectuation refers to processes that start with “a set of means as given and focuses on selecting between possible effects that can be created with that set of means” while causation builds on prediction and processes that “take a particular effect as given and focuses on selecting between means to create that effect” (Saras-vathy, 2001). The principles of effectuation can be applied to the context of R&D decisions in uncertain environments (Dew et al., 2009). The first prin-ciple, known as bird-in-hand or means, broadly highlights what the present status is in terms of “who I am”, “what I know” and “whom I know” (Brettel et al., 2011). The possible courses of effectuator arise driven by available means rather than a goal or target. Secondly, effectuation uses the concept of affordable loss rather than expected returns to be the evaluation crite-ria for potential investments (Chandler, McKelvie, DeTienne, & Mumford, 2011). This contradicts the process of routine planning, estimation, break-even points in business plans and finally, expected returns from the finished product. The effectuation process therefore uses an upside down approach when compared to conventional strategic planning with competitive analy-sis (Chandler et al., 2011). The third principle of effectuation emphasizes the importance of self selected stakeholders and strategic alliances/partner-ships, where pre-commitments are important to reduce uncertainty and to remove entry barriers and hence, to an extent, have some control on the future events. The willingness to change the course of action and the ability of stakeholders to view such changes as another opportunity plays a very important role in effectual logic and decision-making. However not all stake-holders in large organizations are likely to view unexpected outcomes or events to be windows of opportunities rather than hurdles to the process (Wiltbank, Dew, Read, & Sarasvathy, 2006). Organizing to avoiding such “shocks” in the development process is typically considered to be of utmost importance in corporate settings. Managers in large corporate settings, who are keen to invest in developing new businesses, may find that these four principles of effectuation lead to new opportunities to plan different courses

Managerial Cognition in R&D Processes Within Indian hi-tech firms: A Conceptual Framework
85Cilt/Volume 2 | Sayı/Issue 3 | Aralık/December 2013
of actions and may also provide a safer approach of making such invest-ments under uncertainty in large corporate settings.
bricolage
Levi-Strauss first defined bricolage in 1966 anthropology as making do with current resources, and creating new forms and new order from tools and materials available at hand. Bricolage specifically addresses cognitive patterns displaying resource orientation rather than goal orientation and the term has been adopted in management theory on improvisation and similar processes (Baker, Miner, & Eesley, 2003; Weick, 1993). However, bricolage is conceptually much more than simply being a “resource seeker”; it involves intimate and in-depth knowledge of existing resources, specific domains of application and the context of application. Hence, bricolage may appear quite similar to improvisation activity and improvisation seems to imply that bricolage will occur (Baker et al., 2003). Bricolage also helps organiza-tions and existing set-ups to view resources in a different light for its pos-sible new uses, applications and combinations which were not considered to be relevant or practical earlier. Instead, like means in effectual logic, the bri-coleur considers the current set of resources as the potential starting point for a new idea (Senyard et al., 2010).
INNOvATIve behAvIOR AND R&D peRfORmANCe
At the micro level, individual measures in R&D have been typically restricted to a few constructs such as innovative behavior, innovative out-comes and innovator-adaptor measures. Studies show relationships between team diversity and team innovative performance (Kessler and Chakrabarti, 1996) and prior exposures to experience of team members with teams’ inno-vative outcomes (Bantel and Jackson, 1989) but the individual linkages have not been clearly drawn so far. Since an individual placed in charge of a team primarily does the decision-making in an R&D team, it is logical to study the individual decision-maker and his/her orientation in R&D investments. Earlier studies have shown relationships between propensity of teams to in-novate and the teams’ innovative output. But at the individual level, such studies are rare due to measurement issues.

Niharika Garud / Lakshmanan Prasad
Girişimcilik ve İnovasyon Yönetimi Dergisi / Journal of Entrepreneurship and Innovation Management86
Since R&D decisions and investments are being studied at the individu-al level, analyzing the outcomes and efficiency measures for the individual decision-maker provides a consistent approach to analyze impact of R&D investments and decisions on individual’s own performance. Performance in the context of R&D and innovation has always been measured through proxies and it has been difficult for scholars to agree on a single measure of performance. Hence, we argue that innovative behavior (idea generation, promotion and realization), and innovative outcomes emerge from the indi-vidual’s self ability to perceive and develop novel ideas along with longer term benefits of enhancement of knowledge, expertise and initiatives for fu-ture potential ideas (Brettel et al., 2011). Thus, the performance measure is not dependent on the temporal element in the context of R&D and considers a longer benefit approach as the best approach to study and analyze innova-tive performance. For this study, innovative behavior, innovative outcomes and efficiency are terms adapted from earlier works (Brettel et al., 2011; Scott & Bruce, 1994). Innovative behavior measures individual’s contribu-tion to three stages in R&D and innovation process where idea is generated, promoted and realized in the firm through development and negotiation processes with other stakeholders in the organizational setting. Innovative outcomes are defined in terms of individual’s perceived value of the work, future potential of the work, individual expertise and competencies. Indi-vidual’s efficiency has been defined in the standard way of benchmarking their progress using budgeting, timelines and performance standards set by the firm.
pOlITICAl SkIllS Of mANAgeRS IN R&D
Since at the individual level, the ability to negotiate and actively ex-plore new resources is important for gaining or even realizing resources at hand, the individual needs to constantly interact with the reporting struc-ture and with entities such as higher management, colleagues, technology experts, marketing executives or even customers. Within the context of large organizations, the individual’s capability to negotiate with others, under-stand them effectively and to use such knowledge to influence others to act in such a way that it enhances ones or the organizational objectives is known as their political skill (Ferris et al., 2005; Mintzberg & Waters, 1985).

Managerial Cognition in R&D Processes Within Indian hi-tech firms: A Conceptual Framework
87Cilt/Volume 2 | Sayı/Issue 3 | Aralık/December 2013
Politically skilled individuals at work use social astuteness and capacity to adjust behavior to different and changing situational demands in ways that appears to be sincere so to inspire support and trust. They effectively influ-ence and control the responses of others (Ferris et al., 2007). Political skill also influences the ability of individual to network positively (Ferris et al., 2007) and networking is crucial in effectual logics. The ability to influence others at work (interpersonal influence) is also positively affected by the po-litical skill of the individual (Ferris et al., 2007). We argue that political skill will be crucial in organizations where individuals actively seek resources, network with others for further knowledge, pre-commitments and more re-sources. And finally, political skill is crucial when the goal orientation is weak and the individual is effectually constructing the path of development for innovation and R&D.
pROpOSITIONS ON eNTRepReNeURIAl COgNITION IN R&D SeTTINgS
We develop a set of propositions on the use of bricolage and effectuation in the process of innovation and R&D in large corporate settings.
Individual Innovative behavior
Research suggests that different levels of innovativeness require differ-ent sets of resources in terms of scale and scope (Green, Welsh, & Gordon, 2003). This represents the constant dilemma faced by R&D managers in or-ganizations in justifying investments in major resources without any clear expected potential return. The literature on innovative behavior of individu-als at workplaces examines intentional creation, introduction, and appli-cation of new ideas within a work role, group, or organization, in order to benefit role performance, the group, or the organization (West & Farr, 1989). Scott & Bruce (1994) argued that individual innovative behavior is complex and consists of three behavioral tasks (idea generation, idea promotion, and idea realization). Hence, in spite of different levels of innovativeness, indi-viduals who actively explore and exploit different bundles of means might be more innovative and successful in creating and completing R&D projects than those who keep a larger goal such as creating disruptive or incremental innovations.

Niharika Garud / Lakshmanan Prasad
Girişimcilik ve İnovasyon Yönetimi Dergisi / Journal of Entrepreneurship and Innovation Management88
Proposition 1a. In the context of large organizations, means orientation of R&D managers is likely to positively affect innovative behavior of R&D man-agers.
Proposition 1b. In the context of large organizations, bricolage orienta-tion of R&D managers is likely to positively affect innovative behavior of R&D managers.
Individual Innovative Outcomes
We relate effectual logic of means and bricolage to the innovative out-comes at the individual level. The outcomes of R&D processes have been measured in various ways at the individual level of analysis (Scott & Bruce, 1994). Effectuation through the means principle closely relates to the ab-sorptive capacity of the firm (Cohen & Levinthal, 1990) – its ability to value the resources at hand and to incorporate and implement that knowledge to take effective R&D decisions. Lichtenthaler (2009) argues that as the difficul-ty in predicting developments in highly innovative environments increases, prior resources become particularly crucial. The concentration on existing resources helps firms to access additional knowledge and resources and to successfully proceed on their development paths. Lichtenthaler (2009) concludes that the cumulative resources and knowledge generation that are based on existing resources and knowledge is particularly important in un-certain environments because institutions constantly face new challenges. As shown earlier, the individual’s political skill influences their ability to network positively (Ferris et al., 2007). We argue that political skill will be crucial in organizations where individuals actively seek resources, network with others for further knowledge, pre-commitments and more resources and finally, political skill is crucial when the goal orientation is weak and the individual is effectually constructing the path of developments for in-novation and R&D.
Proposition 2a. In the context of large organizations, means orientation of R&D managers, moderated by their political skills, is likely to positively affect R&D managers’ individual outcomes.
Proposition 2b. In the context of large organizations, bricolage orientation of R&D managers, moderated by their political skills, is likely to positively af-fect R&D managers’ individual outcomes.
Managerial Cognition in R&D Processes Within Indian hi-tech firms: A Conceptual Framework
89Cilt/Volume 2 | Sayı/Issue 3 | Aralık/December 2013
Individual efficiency
Though seeking several bundles of resources will provide individual decision makers an opportunity to explore and exploit several courses of action, such R&D projects will not be as efficiently implemented as R&D projects with well-defined goals (Brinckmann, Grichnik, & Kapsa, 2010). Similarly, individual decision makers that work on several projects with ill-defined goals will struggle to meet efficiency targets in the R&D context. While attempts to increase efficiency in various ways (such as guiding the process, defining schedules and budgets, reducing errors), are desirable in general, several research studies suggest the opposite for innovative out-comes of R&D processes (Fredrickson & Iaquinto, 1989; Seidel, 2007; Wilt-bank et al., 2006). They find that comprehensive planning activities in the R&D context are negatively associated with performance as well as with the organization’s ability to notice important changes in environment, and with innovation process outcomes. This is primarily due to the changing goals and ambiguity involved in the R&D process (Seidel, 2007). Hence, R&D man-agers using means and bricolage will struggle to meet their efficiency targets.
Proposition 3a. In the context of large organizations, means orientation of R&D managers is likely to negatively impact R&D managers’ individual efficiency.
Proposition 3b. In the context of large organizations, bricolage orientation of R&D managers is likely to negatively impact R&D managers’ individual ef-ficiency.
Affordable loss
Affordable loss is the advance commitment of what the effectuator or stakeholder is willing to lose in the R&D process and is opposite to the in-vestment orientation with expected outcomes or positive returns at the end of the process (Sarasvathy, 2008). Affordable loss is akin to decisions in R&D processes that aim to minimize risk and losses. R&D managers may choose different paths to minimize risk, such as strict budgeting, strict schedules and adhering to specifications provided already by organizations or even by customers for developing the idea. This might lead to increase in efficiency of the individuals’ performance and their impact on R&D but it will also

Niharika Garud / Lakshmanan Prasad
Girişimcilik ve İnovasyon Yönetimi Dergisi / Journal of Entrepreneurship and Innovation Management90
bind them into pre-existing notions of the development process for a prod-uct, which is not yet in existence. In contrast, the logic of affordable loss gives the freedom to stakeholders to control the situation without making any promises of outcomes and returns.
In the R&D process, where uncertainty is high, reliable predictions and forecasting of the development processes require information, which cannot be assessed easily (for example, customer acceptance of a new product, de-mand function or sales function for a new market). In fact, such information cannot be gathered reliably even by formal market analysis or other means of getting external data as the potential of a highly innovative idea will re-main unclear till actualized. Dew et al. (2009) concludes that the acceptable downside potential or affordable loss is far easier to estimate keeping the current situation in mind while upside data is usually difficult to estimate and is generally not discriminating and reliable enough to make key deci-sions. Neoclassical investment theory (Campbell, 1992) states that decisions to maximize expected returns (which equally considers upside and down-side information) leads to superior operational performance and, as a result, higher process efficiency. Pre-commitments to budgets and schedules for projects avoid overspending on resources and hence, effectuators play to be on the safer side. We therefore propose that effectual logic of affordable loss positively impacts efficiency at individual level for R&D processes.
Proposition 4a. In the context of large organizations, affordable loss ori-entation of R&D managers is likely to positively impact R&D managers’ effi-ciency in implementing R&D projects.
However, affordable loss along with pre-commitments to schedules and budgets may restrict the behavioral tasks of idea development, promo-tion and realization. Pre-commitments to budgets and schedules will draw boundaries, thereby blocking out-of-the-box thinking of the effectuator. Ideas may have to be tailored to meet apriori deadlines. Since the reliabil-ity of their predictions will be questioned, effectuators will tend to rely on the downside of the outcomes. The urge to get pre-commitments on large resources and make major investments will be low. This in turn will nega-tively influence innovation in the project. Similar patterns may also follow in the promotion of new ideas and the realization of new ideas – keeping the downside of outcomes as the priority. Hence, we propose that the principle
Managerial Cognition in R&D Processes Within Indian hi-tech firms: A Conceptual Framework
91Cilt/Volume 2 | Sayı/Issue 3 | Aralık/December 2013
of affordable loss will negatively influence innovative behavior of the R&D manager. There is no available research (conceptual or empirical) that links affordable loss orientation with the behavioral perspective.
Proposition 4b. In the context of large organizations, affordable loss ori-entation of R&D manager negatively impacts innovative behavior of R&D manager in implementing R&D projects.
partnerships and Co-creation
Partnerships or alliances in effectuation refer to the involvement of stakeholders in decision making and innovation processes in order to ex-pand the means available and to co-create new possibilities (Sarasvathy, 2008). This is crucial to cross-functional integration in organizations and to acquire resources from the environment which might be necessary for orga-nizational survival (Olson, Walker, Ruekerf, & Bonnerd, 2001). Stakeholders such as customers and suppliers may also provide crucial information and new resources to reduce the ambiguity and uncertainty in R&D processes and in turn positively impact R&D output (Griffin, 2002; Petersen, Hand-field, & Ragatz, 2003). Read, Song, & Smit (2009) in their meta-analysis of effectuation and venture performance found a positive relationship between self-selected stakeholders and new venture performance.
In the context of uncertainty in R&D and innovation, the conventional market and competitors’ analysis (causal approach to making decisions) is inappropriate as there are no sources of reliable information and data about the potential market for the potential product. Partnering with interested stakeholders tends to bring in more clarity rather than haziness to the R&D process, positively impacting the innovative outcome. For example, an inter-ested customer may agree to test the prototype at no cost and give feedback at a stage when formal market testing may not be feasible as the product is not yet complete. This pre-commitment by a customer might also help in better idea realization and even promotion of the product. It has been found that integration of market knowledge into decision-making improves inno-vation performance (Grinstein, 2008). Hence, we propose that seeking part-nerships positively impact innovative behavior of the R&D managers and their performance output.
Niharika Garud / Lakshmanan Prasad
Girişimcilik ve İnovasyon Yönetimi Dergisi / Journal of Entrepreneurship and Innovation Management92
Proposition 5a. In the context of large organizations, partnership orienta-tion of R&D manager is likely to positively affects innovative behavior of R&D manager.
Proposition 5b. In the context of large organizations, partnership orienta-tion of R&D manager is likely to positively affect innovative outcomes of R&D manager.
DISCUSSIONS
In our conceptual framework, we have theorized on how entrepreneur-ial cognitions within large organizations lead to performance in the context of uncertainty of R&D and innovation. The propositions developed can be tested in R&D settings in different industry sectors with different technologi-cal intensities. Apart from implications for research and practice in innova-tion and R&D, there are implications for our understanding of managerial cognition in highly uncertain environments. We contribute theoretically to our understanding of the moderating effect of political behavior in the con-text of organizational decision-making under uncertainty. The theoretical arguments offer insights on how individuals make a difference in R&D pro-cesses through their innovativeness and their political skills. This reflects how politics at an individual level can support, facilitate and nourish ac-tivities in the uncertain environments within organizations. The research builds on the cognition and behavioral theories in the management and or-ganizational research. It also contributes to the literature of entrepreneurial perspectives from an organizational point of view. In summary, this research will contribute to literature in the areas of R&D, innovation, managerial cog-nition and the political process within behavioral decision-making in large organizations.
ReCOmmeNDATIONS fOR fUTURe ReSeARCh
The dearth of research work in this field calls for scholars from around the world to study R&D and to contribute to both academia and practice. This field is particularly of interest to both the groups, as it has the ability to bring profitability and competitive advantage for the firms. Through this

Managerial Cognition in R&D Processes Within Indian hi-tech firms: A Conceptual Framework
93Cilt/Volume 2 | Sayı/Issue 3 | Aralık/December 2013
research, we see a great potential for overcoming hindrances to study R&D and innovation within established firms using diverse lenses of cognition, behavior and entrepreneurship theories. This will enrich scholarly under-standing for R&D and will be crucial to broaden the field. Empirical studies will support and strengthen the theory building in the field. The scholarship in the R&D literature needs both qualitative and quantitative approaches to study R&D to connect to the realities of the field and in order to create value for the practitioners.
Research on the R&D performance is also needed, especially at the in-dividual level as much of the literature on R&D performance has kept the organizational level as their main focus. And connecting performance to the dimensions of decision-making, utilization of resources, and dimensions of product development in the firms will be important. It will also be crucial to study R&D performance and linkages with decisions, resources and product development in the context of entrepreneurship and young firms. Through these research directions, scholarship will be broadened to discuss the is-sues of performance in practice. It is important to understand measurement of both success and failure of individual leadership and management in R&D in future studies. Hence, the future studies could incorporate objec-tive measurements for performance and effective or disruptive management styles for leaders or managers or even their decision-making teams in terms of their individual financial measures, resource utilization measures and divergent process outcomes. While future studies should verify if our theo-retical arguments hold, it would be interesting to test the arguments using standardized measurement scales and experimental designs already exist-ing in the field. It will also be important to study the context of emerging economies and Asian cultures to contribute and enrich understanding of R&D practices around the world. As emerging economies have started play-ing an important role in the global markets, the scholarly and empirical work in these contexts have been long due. Longitudinal datasets will also play a role in understanding evolution of R&D processes where the transition of performance and expected outcomes from R&D could be monitored. These longitudinal datasets will also allow researchers to understand how R&D has evolved with the firm and how they have influenced competitive advantage, profits and strategy building.

Niharika Garud / Lakshmanan Prasad
Girişimcilik ve İnovasyon Yönetimi Dergisi / Journal of Entrepreneurship and Innovation Management94
CONClUSIONS
We theorize and build arguments on R&D processes within established firms using lenses of managerial cognition. We discuss how entrepreneurial cognition impacts R&D keeping in mind the central role of individuals and how individual cognition influences the aspects of R&D process including outcomes and efficiency at the individual level. This research contributes and builds on cognitive and behavioral research in the context of R&D and organizational research.
Managerial Cognition in R&D Processes Within Indian hi-tech firms: A Conceptual Framework
95Cilt/Volume 2 | Sayı/Issue 3 | Aralık/December 2013
References
Adams, R., Bessant, J., & Phelps, R. (2006) “Innovation Management Measure-ment: A Review”. International Journal of Management Reviews, 8(8): 21-47.
Baker, T., Miner, A. S., & Eesley, D. T. (2003) “Improvising firms: Bricolage, ac-count giving and improvisational competencies in the founding process”. Research Policy, 32(2): 255-276.
Bantel, K. A., & Jackson, S. E. (1989) “Top management and innovations in bank-ing: Does the composition of the top team make a difference?” Strategic Management Journal, 10(S1): 107–124.
Bedrock, R., & Watson, T. (1993) “Managing innovation for survival and growth: Rotunda PLC — a case in point”. Paper presented at 16th National Small Firms Policy and Research Conference.
Brettel, M., Mauer, R., Engelen, A., & Kupper, D. (2012) “Corporate effectuation: Entrepreneurial action and its impact on R&D project performance”. Journal of Busi-ness Venturing, 27(2): 167-184.
Brinckmann, J., Grichnik, D., & Kapsa, D. (2010) “Should entrepreneurs plan or just storm the castle? A meta-analysis on contextual factors impacting business planning-performance relationship in small firms”. Journal of Business Venturing, 25(1): 24-40.
Burgelman, R. (1983) “Corporate entrepreneurship and strategic management: Insights from a process study”. Management Science, 29(12): 1349-1364.
Busenitz, L. W., & Barney, J. B. (1997) “Differences between entrepreneurs and managers in large organizations: Biases and heuristics in strategic decision-making”. Journal of Business Venturing, 12(1): 9-30.
Campbell, C. A. (1992) “A decision theory model for entrepreneurial acts”. En-trepreneurship Theory & Practice, 17(1): 21.
Chandler, G. N., McKelvie, A., DeTienne, D., & Mumford, T. (2011) “Causation and effectuation processes: A validation study”. Journal of Business Venturing, 26(3): 375-390.
Cohen, W. M., & Levinthal, D. A. (1990) “Absorptive capacity: A new perspective on learning and innovation”. Administrative Science Quarterly, 35(1).

Niharika Garud / Lakshmanan Prasad
Girişimcilik ve İnovasyon Yönetimi Dergisi / Journal of Entrepreneurship and Innovation Management96
Davenport, T. H., & Short, J., E. (1990) “The new industrial engineering: Informa-tion technology and business process redesign”. Sloan Management Review, Sum-mer 11-27.
Deeds, D. L. (2001) “The role of R&D intensity, technical development and ab-sorptive capacity in creating entrepreneurial wealth in high technology start-ups”. Journal of Engineering and Technology Management, 18(1): 29-47.
Deeds, D. L., Decarolis, D., & Coombs, J. (2000) “Dynamic capabilities and new product development in high technology ventures: An empirical analysis of new biotechnology firms”. Journal of Business Venturing, 15(3): 211-229.
Deutsch, Y. (2007) “The influence of outside directors’ stock-option compensa-tion on firms’ R&D”. Corporate Governance: An International Review, 15(5): 816-827.
Dew, N., Read, S., Sarasvathy, S. D., & Wiltbank, R. (2009) “Effectual versus pre-dictive logics in entrepreneurial decision-making: Differences between experts and novices”. Journal of Business Venturing, 24(4): 287-309.
Dutz, M. A. (2007) Unleashing India’s innovation: Toward sustainable and inclu-sive growth. Washington DC: The World Bank.
Ferris, G. R., Treadway, D. C., Kolodinsky, R. W., Hochwarter, W. A., Kacmar, C. J., Douglas, C., & Frink, D. D. (2005) “Development and validation of the political skill inventory”. Journal of Management, 31(1): 126-152.
Ferris, G. R., Treadway, D. C., Perrewe, P. L., Brouer, R. L., Douglas, C., & Lux, S. (2007) “Political skill in organizations”. Journal of Management, 33(3): 290-320.
Fredrickson, J. W., & Iaquinto, A. L. (1989) “Inertia and creeping rationality in strategic decision processes”. Academy of Management Journal, 32(3): 516-542.
Green, S. G., Welsh, M. A., & Gordon, E. D. (2003) “Advocacy, performance, and threshold influences on decisions to terminate new product development”. The Academy of Management Journal, 46(4): 419-434.
Greve, H. R. (2003) Organizational learning from performance feedback: A be-havioral perspective on innovation and change. Cambridge: Cambridge University Press.
Griffin, A. (2002) “Product development cycle time for business-to-business products”. Industrial Marketing Management, 31(4): 291-304.
Grinstein, A. (2008) “The effect of market orientation and its components on innovation consequences: a meta-analysis”. Journal of the Academy of Marketing Science, 36(2): 691-703.

Managerial Cognition in R&D Processes Within Indian hi-tech firms: A Conceptual Framework
97Cilt/Volume 2 | Sayı/Issue 3 | Aralık/December 2013
Hoffman, K., Parejo, M., Bessant, J., & Perren, L. (1998) “Small firms, R&D, tech-nology and innovation in the UK: A literature review”. Technovation, 18(1): 39-55.
Kessler, E. H., & Chakrabarti, A. K. (1996) “Innovation speed: A conceptual mod-el of context, antecedents, and outcomes”. Academy of Management Review, 21(4): 1143-1191.
Klein, K. J., & Sorra, J. S. (1996) “The challenge of innovation implementation”. Academy of Management Review, 21(4): 1055-1080.
Lichtenthaler, U. (2009) “Absorptive capacity, environmental turbulence, and the complementarity of organizational learning processes”. Academy of Management Journal, 52(4): 822-846.
Lyon, D. W., Lumpkin, G. T., & Dess, G. G. (2000) “Enhancing entrepreneurial orientation research: Operationalizing and measuring a key strategic decision mak-ing process”. Journal of Management, 26(5): 1055-1085.
Mintzberg, H., & Waters, J. A. (1985) “Of strategies, deliberate and emergent”. Strategic Management Journal, 6(3): 257-272.
Olson, E. M., Walker, O. C., Ruekerf, R. W., & Bonnerd, J. M. (2001) “Patterns of cooperation during new product development among marketing, operations and R&D: Implications for project performance”. Journal of Product Innovation Manage-ment, 18(4): 258-271.
Parthasarthy, R., & Hammond, J. (2002) “Product Innovation Input And Out-come: Moderating Effects Of The Innovation Process”. Journal of Engineering and Technology Management, 19(1): 75-91.
Petersen, K. J., Handfield, R. B., & Ragatz, G. L. (2003) “A Model Of Supplier Integration Into New Product Development”. Journal of Product Innovation Manage-ment, 20(4): 284-299.
Read, S., Song, M., & Smit, W. (2009) “A Meta-Analytic Review Of Effectuation And Venture Performance”. Journal of Business Venturing, 24(6): 573-587.
Salancik, G. R., & Pfeffer, J. (1978) “Social information processing approach to job attitudes and task design”. Administrative Science Quarterly, 23(2): 224-253.
Sarasvathy, S. D. (2001) “Causation and effectuation: towards a theoretical shift from economic inevitability to entrepreneurial contingency”. Academy of Manage-ment Review, 26(2): 243-263.
Sarasvathy, S. D. (2008) Effectuation: Elements of entrepreneurial expertise. Northampton, MA, USA: Edward Elgar Publishing, Inc.

Niharika Garud / Lakshmanan Prasad
Girişimcilik ve İnovasyon Yönetimi Dergisi / Journal of Entrepreneurship and Innovation Management98
Schumpeter, J. (1947) The Creative Response in Economic History, Journal of Economic History, November, pp. 149-159
Scott, S. G., & Bruce, R. A. (1994) “Determinants of innovative behavior: A path model of individual innovation in the workplace”. The Academy of Management Journal, 37(3): 580-607.
Seidel, V. (2007) “Concept shifting and the radical product development pro-cess”. Journal of Product Innovation Management, 24: 522-533.
Senyard, J. M., Baker, T., & Steffens, P. R. (2010) “Entrepreneurial bricolage and firm performance: Moderating effects of firm change and innovativeness”, Annual Meeting of the Academy of Management. Montreal, Canada.
Weick, K. E., (1993) “The collapse of sensemaking in organizations: The Man Gulch disaster”. Administrative Science Quarterly, 38: 628-652.
West, M., & Farr, J. (1989) “Innovation at work: Psychological perspectives”. So-cial Behavior, 4: 15-30.
Wiltbank, R., Dew, N., Read, S., & Sarasvathy, S. D. (2006) “What to do next? The case for non-predictive strategy”. Strategic Management Journal, 27(10): 981-998.
Girişimcilik ve İnovasyon Yönetimi Dergisi
Journal of Entrepreneurship and Innovation Management
99Cilt/Volume 2 | Sayı/Issue 3 | Aralık/December 2013 | 99-119
Barriers In Partnerships In Open Innovation Process
Ömür Yaşar Saatçıoğlu*
Abstract
Today, innovation is a receipt for most of the problems the firms are facing. Today, firms can’t develop innovations merely contenting them-selves with their own effortful struggles. In addition to such initiative, they should cooperate with other actors. Cooperating with other actors outside the firm opens the innovation process. Open innovation has lots of advantages which can be categorised in two main groups : in-creasing revenues, and decreasing costs. The main idea in open innova-tion strenghtens the relations with external environment by increasing knowledge and technology inflows and outflows. However, dealing with the boundaries of the firm, there are barriers related with knowledge and technology flows. This research aims to explain evolution of open innova-tion, partnerships as main actors in knowledge and technology outflows, and intellectual property as the concept that protects knolwedge flows. external environment of the firm.
Keywords: Open innovation, Partnerships, Intellectual Property, University,
* Doç.Dr., Dokuz Eylül Üniversitesi Denizcilik Fakültesi Tınaztepe Kampüsü, [email protected]

Ömür Yaşar Saatçıoğlu
Girişimcilik ve İnovasyon Yönetimi Dergisi / Journal of Entrepreneurship and Innovation Management100
INTRODUCTION
There have recently been inevitable social, economical and technologi-cal changes in global marketplace. Innovation is the key solution in the pro-cess of adaptation to these changes. Innovation has considerable effects on the national, regional, industrial and firm level. First theoretical approaches to innovation state that in innovation process only one actor (an individual or a company) is considered responsible for the innovation process. This paradigm causes firms to be strongly self-reliant, because they can’t be sure of the quality, availability and capability of others’ ideas. (Chesbrough, 2004, Research Technology ). Furthermore, as Huizingh (2011) argues trends such as outsourcing, agility, and flexibility has already forced companies to re-consider their strategies and processes in other areas and to become network organizations. Hence, “do-it-yourself” mentality in innovation management is not valid anymore. Besides, innovation processes consist of complex so-cial and disorderly interactive interactions which these earlier models can-not embrace and now become central in an array of innovation theories (Chesbrough, 2003; Sorensen et al., 2010). Since open innovation is con-cerned with the ability of many external factors to influence the rate and direction of innovation activity, it is rather associated with a different set of organizing assumptions than traditional firm-based innovation. (Lakhani and Tushman, 2012). Scanning, gathering and absorbing knowledge from the external environment is necessary in realizing open innovation projects. Hence, effective partnerships is unavoidable in open innovation projects. Traitler (et al, 2011) complement “innovate or die” with the new mantra “partner or perish”. Partnerships are created to solve problems, fill gaps, or find answers more effectively and rapidly (for example, time to market). Effectiveness and speed are the operative and overriding principles of any innovation partnership.
In this paper, first open innovation concept will be introduced with the distinguishing factors of open innovation with respect to closed innovation second, partnerships and intellectual property as way of managing external knowledge and protecting knowledge will be introduced. The research aims to contribute to the relevant literature by examining how knowledge inflows and outflows as well as how to protect knowledge.

Barriers In Partnerships In Open Innovation Process
101Cilt/Volume 2 | Sayı/Issue 3 | Aralık/December 2013
1. OPEN INNOVATION
The strengthening of the knowledge-based component in products and adoption of information and communication technologies has encouraged firms to seek new sources of opportunities from networked collaboration such as open innovation. Lichtenthaler (2011) defines open innovation as systematically performing knowledge exploration, retention and exploita-tion inside and outside an organization’s boundaries throughout the inno-vation process. Open innovation has offered more possibilities for firms to operate over country borders in a much more open environment than be-fore. (Edelmann and Volchek, 2010). Chesbrough(2003) is the first to define “open innovation”, however; Vujovic and Ulhøi (2008) argue that the first applications of open innovation can be traced back to the UK iron industry and US steel industry in the third quarter of the nineteenth century. Toward the end of the 20th century, a number of factors were influential to rethink about closed innovaton. The main factor was the rise in the mobility and number of knowledge workers, making it difficult for companies to control their ideas and expertise. Another important factor was the growing ability of private venture capital which has helped to finance new firms and their efforts to commercialize ideas that have spilled outside of the corporate re-search labs (Chesbrough, 2003b). Chesbrough (2008) identifies 8 points that differentiates open innovation from the earlier innovation theories. These can be summarized as: increased importance of external knowledge, the im-portance of business model, the ability to turn unsuccessful R&D projects int successful ones, purposive outflow of knowledge and technology, abundant knowledge landscape, proactive role of IP management, the rise of innova-tion intermediaries and new metrics for innovation capability and perfor-mance.
In the past, internal R&D was a valuable strategic asset, and also a barrier to entry by competitors in many markets. Open innovation paradigm opens up the classical funnel to encompass flows of technology and ideas within and outside the organization: the duration of creation, recognition and ar-ticulation of opportunities can be drastically shortened if ideas come not just from the R&D department (Carbone et al., 2012). Hence, having effective partnerships have gained importance in open innovation. Mostly preferred partnerships are suppliers, customers, research organizations and universi-

Ömür Yaşar Saatçıoğlu
Girişimcilik ve İnovasyon Yönetimi Dergisi / Journal of Entrepreneurship and Innovation Management102
ties (Luoma et al.,2010; Sorensen et al.2010; Evens; 2009). Furthermore; Sorenson (et al., 2010) and Evens(2009) complements generally accepted partners with competitors, spin-offs from large firms, knowledge intensive service firms, partners, government, private laboratory and other nations. However, the internal interfaces such as the business units, processes and structures are also as important as the external partners. (Edelmanand Vol-chek, 2010).
Herstad (et al., 2008) argue that the broader the range of actors and actor groups firms interface with, the higher the probability that ideas and knowledge complementary to own activity and capabilities is identified, and the higher the likelihood of something novel emerging. Besides, external ac-tors can leverage a firm’s investment in internal R&D through expanding op-portunities of combinations of previously disconnected silos of knowledge and capabilities (Dahlander, Gann, 2010). The open model assumes that the value of a creative work can be increased by allowing more potential inno-vators to contribute to its development, and economic value is gained as a result. (Maxwell, 2006).
Hence, open innovation has become the umbrella that encompasses, connects and integrates a range of already existing activities. Firms that manage to create a synergy between their own processes and externally available ideas may be able to benefit from the creative ideas of outsiders to generate profitable new products and services. Available resources become larger than a single firm can manage; they enable innovative ways to market or to create standards in emerging markets. Such synergies can be created by relying on the external environment and by taking an active part in ex-ternal developments (Dahlender et al., 2008). Lee (et al, 2012) identify the necessity of collaboration with that of other world-class firms to develop the internal competencies of firms. External networking is another impor-tant dimension which is consistently associated with open innovation. It comprises both formal collaborative projects and more general and informal networking activities. External participations enable the recovery of innova-tions that were initially abandoned or that did not seem promising (Van de Vrande et al.,2009). Open innovation has gained popularity for at least three reasons as (Barge-Gil, 2010):

Barriers In Partnerships In Open Innovation Process
103Cilt/Volume 2 | Sayı/Issue 3 | Aralık/December 2013
1) It reflects the changes to work patterns where professionals are seeking portfolio careers rather than a job-or-life, and work contexts that involve increasing divisions of labour,
2) Improved market institutions (property rights, venture capitalists, standards) are enabling increased trade knowledge,
3) New technologies are easing coordination across geographical dis-tance.
Though there is a trend toward open innovation, most of the firms hesi-tate to open up their innovation processes. However, it seems that there is a clear trend toward open innovation which will continue or even intensify in the future (Lichtenthaler, 2008). Besides, some industries need to con-tinue to operate in a Closed Innovation regime. Nuclear reactors and aircraft engines are two industries in which reliance on one’s own ideas, and in-ternal commercializaton paths to market appear to be valid. (Chesbrough, 2003a). Meanwhile; Enkel (et al, 2009) suggest using an appropriate balance between open and closed innovation since too much openness may lead to faster loss of control and core competences. Open innovation is mostly real-ized by pioneering firms whereas other companies still follow a relatively closed strategy. Luoma (et al., 2010) show that most of the companies have cooperation with other parties and many of them are unconsciusly utilising open innovation to some extent. Evens (2009) compares closed innovation and open innovation. According to the precise conclusion of this compari-son, in closed innovation, the main idea is that they have to do everything on their own, while, in open innovation the focus is on opening up to the external ideas.

Ömür Yaşar Saatçıoğlu
Girişimcilik ve İnovasyon Yönetimi Dergisi / Journal of Entrepreneurship and Innovation Management104
Table 1: Comparing and Contrasting Principles of Open and
Closed Innovation
Closed Innovation Open Innovation
Field of Expertise The smart people in our field work for us.
Not all the smart people work for us so we must find and tap into the knowledge and expertise of bright individuals outside our company.
Function of the own R&D
To profit from R&D, we must discover, develop and ship it to ourselves.
External R&D can create significant value, internal R&D is needed to claim some portion of that value.
Attitude regarding research
If we discover it ourselves, we will get it to the market.
We don’t have to originate the research in order to profit from it.
Market ambition If we are first to commercialize an innovation, we will win.
Building a better business model is better than getting to market first.
Sources for idea If we create and the best ideas in the industry, we will win.
If we make best use of external and internal ideas, we will win.
Intellectual property
We should control our intellectual property so that our competitors don’t profit from our ideas.
We should profit from others’ intellectual property, we should buy others’ IP whenever it advances our own business model.
Source: Ili, Albers and Miller (2010) adapted from Chesbrough (2003)
The open innovation paradigm balances the role of internal and exter-nal sources of knowledge. Open innovation also requires a number of chang-es within firms in order to effectively best manage the use of purposive in and outflows of knowledge. Stahlbrost and Bergvall-Kareborn (2011) point out three elements in open innovation as culture, structure and business model. Having an open innovation approach forces organizations to em-brace an entirely different culture in their way of thinking. The change in structure means that it’s more important to develop mechanisms in sup-port of importing and exploring knowledge and ideas. Lee (et al., 2012) and

Barriers In Partnerships In Open Innovation Process
105Cilt/Volume 2 | Sayı/Issue 3 | Aralık/December 2013
Van der Meer (2007) explain the stages to open innovation beginning from closed innovation. Journey from closed to open innovation involves four main dimensions of the firm’s organization, inter-organizational networks, organizational structure, evaluation processes and knowledge management systems, along which can be managed and stimulated. (Gassman, et al.,2010; Huizingh, 2011). Open innovation reflects much less a dichotomy (open ver-sus closed) than a continuum with varying degrees of openness. Open in-novation also encompasses various activities, e.g. inbound, outbound and coupled activities. Each of these activities can be more or less open. Open innovation measurement scales should therefore reflect this multi-dimen-sional nature. Three core processes can be differentiated in open innovation such as (Enkel et al.,2009):
1) Outside-in process enriching the company’s own knowledge base through the integration of suppliers, customers and external knowl-edge sourcing.
2) The inside-out process referring earning profits by bringing ideas to market, selling IP, and multiplying technology by transferring ideas to the outside environment.
3) The coupled process referring co-creation with (mainly) comple-mentary partners through alliances, cooperation and joint ventures during which give and take are crucial for success.

Ömür Yaşar Saatçıoğlu
Girişimcilik ve İnovasyon Yönetimi Dergisi / Journal of Entrepreneurship and Innovation Management106
Sale/Divest
Spinoff
License
MARKETREVENUE
INTERNAL ANDEXTERNAL
DEVELOPMENTCOSTS
NEWREVENUES
REVENUES
COSTS
MARKETREVENUE
INTERNALDEVELOPMENT
COSTS
CLOSEDBUSINESSMODEL
OPENBUSINESSMODEL
Costand time savings fromleveraging external development
0
Figure 1: Open and Closed Business Models Compared Regarding
Revenues and Costs
Source: Chesbrough(2007)
Chesbrough (2007) tells that to ofset the trends of rising development
costs and shorter product life cycles (left bar), companies must experiment
with creative ways to open their business models by using outside ideas
and technologies in internal product development and by allowing inside
intellectual property to be commercialized externally (right bar). Reed and
Barnes(2012) propose that open innovation reduces the barriers related with
economies of scale and capital requirements.
Evens (2009) points out that there are a lot of things to be learned about
open innovation since it’s only at the beginning of its existence. It is stated
that the focus of open innovation is usually on the benefits, however, the
evidence of possible barriers research is scarce (Luoma et al, 2010). Further-

Barriers In Partnerships In Open Innovation Process
107Cilt/Volume 2 | Sayı/Issue 3 | Aralık/December 2013
more, Vega (et al., 2012) define identification of barriers as relevant entry points to get immersed in the system of innovaton in order to identify sys-tem failures.
Luoma (et al, 2010) group open innovation barriers in two main cat-egories such as: company-specific factors and environment-specific factors. Many researchers detailed company-specific and environment-specific fac-tors with different viewpoints. West and Gallagher(2006) define open inno-vation barriers related with processes in open innovation. Roper and Dun-das(2013) point out the role of various channels in managing the relations between external environment. Munos(2011), Stone and Keating (2010) define open innovation barriers as the difference between actors involved. Birkinshaw (et al., 2007) define barriers related with network formation. Savistkaya (2011) comments that external influences are stronger in creat-ing barriers to open innovation than internal practices which companies may develop and improve over time. Successful partnerships are effective to manage the barriers in external environment. In this research, barriers re-lated with two important partnerships and intellectual property as a bridge between these partnerships will be discussed.
2. PARTNERSHIPS
Luoma (et al., 2010) point out the barriers related with partners and collaboration in network management. The diffciulties can be summarized as: 1) To recognise possible partners from the network 2) To find new reli-able partners 3) To understand partners and negaotiate with them and 4) To build trust.
2.1. PUBLIC-PRIVATE PARTNERSHIP
The main aim of the PPP idea is to bring together the public and private sector organizations in mutual benefit (Awe et al., 2011). There are four sets of arguments in support of PPP – synergy, transformation, budget enlarge-ment and capacity enlargement (Oyebanji et al., 2011). In case PPP provide a better service by aligning the social and private benefits, they will end up producing a better outcome for society (Rangel et al., 2011). Successful

Ömür Yaşar Saatçıoğlu
Girişimcilik ve İnovasyon Yönetimi Dergisi / Journal of Entrepreneurship and Innovation Management108
partnerships should be collaborative, operational, operational, contributory and consultative (Wettenhall, 2003). Munksgaard (et al., 2012) state that there are barriers between private and public actors in innovation process. Besides, the barriers within between PPIP(Public Private Innovation Part-nerships) are harder to solve. As long as the public sector widely pursues dissemination of partnership, the conditions for organizing processes seem difficult. In case of successful partnerships, win-win becomes the name of the game.
The differences between public and private actors and how these differ-ences affect innovation partnerships are explained as follows:
1) The first difference is the diverse objectives for engaging in innova-tion projects held by public and private partnership respectively.
2) The second difference is balancing the divergent planning and im-plementation horizons which is a delicate matter also related to the timing of goal achievement of the partners.
3) The third difference is that public and private actors tend to per-ceive risk differently leading to differences in their risk behaviour. Risk is shared commonly in the public sector whereas risk is assumed individually based in the private sector.
4) The fourth difference relates to incentives for participation and ex-pected rewards. Private actors prefer incentives and expectations of econom-ic rewards whereas public actors aim to prefer creating public value through innovations.
5) The fifth difference is related with the viewpoint of innovation. Pub-lic actors view innovations as creating new knowledge whereas private ac-tors define innovation in terms of added value through new applications.
Relations between organizations should be conducted on the basis of specilization and cooperation rather than hiearchical diktat. (Pollitt, 2005 in Skelcher). In Learning Collaborative model; partners, which are selected based on their experience, share freely and stay focused on the shared goal of translating discoveries from laboratory to marketplace and also improve the processes. (Weir et al., 2012).

Barriers In Partnerships In Open Innovation Process
109Cilt/Volume 2 | Sayı/Issue 3 | Aralık/December 2013
As the conditions on joint innovation differ in every project, a need ex-ists for more flexible governance modes how to cooperate between public and private actors. Furthermore, there is a need to change the traditions and cultures for innovation in the public setting.
2.2. UNIVERSITIES AS PARTNERS
Howells (et al., 2012) claim that firms see universities as being poor sources for innovation information. More importantly, in terms of the open innovation and networking agenda, we may infer from this that universi-ties are seen as low priority, low-order partners for forming collaborations and in the development of network architectures. Hagen (2002) also empha-sizes that partnership process is an extremely high risk strategy at the level of implementation. However once established, this study reveals that col-laborations by firms with universities and other Higher Education Institu-tions were found to have a very positive and significant effect on innovation. Melese (et al, 2009) identify two major areas that affect industry-academia collaborations in terms of strategy and operations: organizational and cul-tural issues and funding challenges.
Kaiv-oja (et al., 2010) explain the evolution of universities beginning from knowledge store, knowledge factory, knowledge hub to innovation factory and added that universities are not ivory towers, but innovation engines and learning environments in contemporary sciences. Melendez and Moreno(2012) emphasize the new role of universities that changed from that of ivory tower to knowledge broker. On the contrary, Hagen(2002) states that due to fragmented nature of knowledge generation and dissemi-nation, universities are no longer the only knowledge and innovation cen-ters. Furthermore, universities are seen as the vehicle to develop processes for dissemination of new knowledge mostly at a regional level. However; the opportunity to build on these relationships and extend them to others within the organization is not well understood. Besides; these collaborative activities are often based on personal relationships between individuals in each organization. As a result, it is rarely realized that the company and the university are losing important opportunities to leverage existing researh relationships and broaden the scientific focus.
Ömür Yaşar Saatçıoğlu
Girişimcilik ve İnovasyon Yönetimi Dergisi / Journal of Entrepreneurship and Innovation Management110
Knowledge Transfer Exchange (KTE) is an important factor to sustain satisfactory results. KTE process generally follows such phases as: carrying out scientific discovery, securing intellectual property, marketing intellectual property and realizing profit. Interestingly, the only agent that could be in-volved in all activities is the researcher. Thus, the understanding of which factors influence researcher engagement in KTE is of key importance.
Johnston (et al., 2010) identify eight inhibitors affecting exchanges be-tween researchers tasked with KTE activities:
1) Adapting the research cycle to fit real-world timelines;
2) Establishing relationships with decision makers;
3) Justifying activities that fit poorly with traditional academic perfor-mance expectations;
4) A perceived lack of knowledge of the research process;
5) The traditional academic format of communication;
6) Research that is not relevant to practice-based issues;
7) A lack of timely results; and
8) The lack of time and resources to participate in KTE.
Johnston (et al., 2010) identify seven emerging themes influencing Higher Education Institution-industry KTE interactions.
1) The importance of network intermediaries;
2) Flexibility, openness and connectivity of network structures.
3) Encouraging network participation.
4) Building trust in relationships through mutual understanding.
5) Active network learning
6) Strengthening cooperation through capacity building, and
7) Culture change
Fabrizio (2006) advises that to successfuly embrace the open innova-tion paradigm, firms must develop the ability to identify, assimilate, and make use of external knowledge and ideas. Unversity-based research con-

Barriers In Partnerships In Open Innovation Process
111Cilt/Volume 2 | Sayı/Issue 3 | Aralık/December 2013
tribute to firms’ knowledge base. However, firms should also develop their internal research expertise. Roper and Dundas(2013) suggest that knowledge co-production with other organizations, such as company-based and univer-sity-based public funded research centers, as part of their R&D or knowl-edge-generation activities are likely to be important. They also define spatial distribution, cognitive proximity and organizational proximity as important factors for creating knowledge spillovers. Significant differences emerge be-tween university-based and company-based public research centers, with university-based research centers more likely than company-based public research centers to engage both in knowledge sharing and the co-creation of knowledge as well as knowledge-supply activities. Concerns about intel-lectual property protection seem to be particularly important in limiting the external connections developed by company-based public research centers.
2.3. INTELLECTUAL PROPERTY
Wikhamn and Knights(2011) state that much of the open innovation process is contingent on a contractual use of intellectual property in terms of trading (both buying and selling) on the market or with selected partners. West and Gallagher(2006) emphasize that open innovation is a powerful framework encompassing the generation, capture, and employment of intel-lectual property at the firm level, however, as (Maxwell, 2006) points out openness is challenging the conventional closed model of intellectual prop-erty resulting with a difficult combination between intellectual property and open innovation (Luoma, et al., 2010). The logic of the publish-versus-patent approach is an example of open innovation thinking. In Closed Innova-tion, firms that make new discoveries would think first about how to own and protect this knowledge. In Open Innovation, firms choose to patent core knowledge, but carefully consider “publish” as well. The decision between patent-and-publish is related with the business model. The model helps the firm create value throughout the value chain and then positions the firm to capture some portion of that value (Chesbrough, 2003a).
The use of intellectual property rights such as patents, trade marks and copyright may help to bring the intangible intellectual assets more tan-gible and manageable which may be of value especially in collaboration situation(Varis and Olander, 2010). Intellectual property rights may also help

Ömür Yaşar Saatçıoğlu
Girişimcilik ve İnovasyon Yönetimi Dergisi / Journal of Entrepreneurship and Innovation Management112
in capturing value from innovations as they enable protection over the inno-vation and thus the patent owner for example may exclusively use and out-license the product. Increasing intellectual property concerns in an arena previously characterized by open knowledge sharing may create barriers and administrative burdens that can be a drag on innovation (Fabrizio, 2006).
Lli (et al., 2010) relate the intellectual property rights with the changing role of R&D in open innovation. Herstad (et al., 2008) state that outsourc-ing R&D may provide cost-efficient problem solving on a project basis but comes with the organizational cost of knowledge accumulation. West and Gallagher(2006) suggest that firms must make use of intellectual property as a supplement to, not a replacement for, internal R&D. Savitskaya(2011) conclude that the greater the complexity and cost of intellectual property protection, the less likely firms will engage in open innovation. West and Gallagher(2006) say that firms question to contribute to intellectual property since it’s also going to be made available to their rivals.
Varis and Olander(2010) state about the usage of intellectual property that firms which engage in R&D in order to find new solutions to existing problems or creating totally new knowledge and innovations have several possible strategies related to innovations. They also argue that firms might either decide to apply for intellectual property rights (for example, a patent) to protect the innovation from imitation or in order to license the right to use the innovation to other firms, or they may want to keep the innovation a secret to prevent knowledge about the innovation from spreading around, which might give them lead time in developing the innovation further. Some firms are believed to choose patenting for reasons of ensuring future free-dom of operation while others might fear a failure in patenting process or that a competitor would be granted one before they had the chance, and thus decide to publish their innovations for defence.
As the open innovation framework makes clear, the best way for a firm to gain value from innovations that do not fit the firm’s own set of comple-mentary assets is to look outside of the firm for a licensee or spin off to develop the innovation. Traitler (et al., 2010) suggest understanding clear definition of partners’ needs in solving the contradictions related with intel-lectual property.

Barriers In Partnerships In Open Innovation Process
113Cilt/Volume 2 | Sayı/Issue 3 | Aralık/December 2013
Savitskaya (et al, 2010) relate the problems in intellectual property rights system as weak appropriability regime, strong intellectual property rights protection and costs of intellectual property protection and proce-dure of claiming intellectual property. Under a weak appropriability regime, firms are encouraged to protect their innovations and thus less inclined to share their internally generated knowledge with others. Hence, firms have less incentive to conduct in-house R&D; therefore the amount of research surplus would decrease as well. Weak intellectual property rights protec-tion may lead to the overall rate of private sector R&D decreasing below the levels needed to sustain long-term private returns from innovation and may therefore necessitate public support for in-house R&D. In strong protection of intellectual property, firms are supposed to increase the willingness of companies to develop own techologies in house. Hence, the involvement of companies into open innovation may depend on the strength of intellectual property rights protection and associated with its costs and formal arrange-ment. Giannopoluou (et al., 2010) mention that different strategies of open innovation require particular intellectual property management.
The other partnership that should be considered in intellectual prop-erty is the relation between universities. Melese (et al. 2009) state that intel-lectual property rights continue to pose a challenge for cultivating collabora-tive environments that support innovation. They also propose giving more thoughts to structure contractual agreements that promote innovation while continuing to respect the intellectual property rights of the collaborators. If the intellectual property protection terms are too broad, it will be difficult for academic researchers to collaborate. If intellectual property protection reaches too far into the future to include research that might be performed after the collaboration ends, the result will be to restrict research with other collaborators. This serves to unnecessarily limit or tie all inventions exclu-sively to one partner and will therefore be a major barrier to innovation.
CONCLUSION
Innovation is an effective solution for many of the problems resulting from inevitable changes. However, rapid and uncontrollable changes in the external environment force companies to colloborate with actors in external

Ömür Yaşar Saatçıoğlu
Girişimcilik ve İnovasyon Yönetimi Dergisi / Journal of Entrepreneurship and Innovation Management114
environment. These mentioned developments have caused a new type of in-novation to emerge which is defined as open innovation. In open innovation, the advantages can be briefly described as increasing revenues via decreas-ing costs. Besides, ideas from actors’ knowledge about problems increase the probability of novelty of innovations. However, increasing number of partnerships cause barriers in developing innovations. In this research, bar-riers related with universities and public partnerships are discussed. Intel-lectual property acts a bridge between firms and the external actors during innovation process. In open innovation, building trust is important for the relationship. Partners should begin collaboration with appropriate agree-ments. Although the importance of intellectual property in open innovation is admitted in literature, there is a lack of intellectual property issues in the literature. One of the main problems between actors is the difference in their goals. It is advisable that a person be assigned for supporting open innova-tion processes. In open innovation process, external environment should be scanned carefully, partners should be selected carefully and external knowl-edge should be integrated to the knowledge created in the firm. However; firms should think carefully whether to innovate openly or not. As stated in the literature, open innovation is not suitable for all firms and industries. Firms should think whether they need to rely on their own ideas. If this oc-curs, they should not innovate openly. One of the other point that needs to be considered is the need to change for open innovation. All of the partners in open innovation should change their structures, cultures and processes and change their business model. The last point that needs to be mentioned is that firms should also consider other interactive channels of knowledge transfer such as conferences, consulting and informal interactions.
In this research, a literature review open innovation and role of partner-ships to have effective open innovation projects are provided. Partnerships are means of knowledge inflows and outflows in open innovation. However, there are also barriers in building effective relationships. Barriers are also ex-plainde in this research. In future studies, each barrier should be examined in detail. In-depth interviews should be conducted in different cases related with open innovation.

Barriers In Partnerships In Open Innovation Process
115Cilt/Volume 2 | Sayı/Issue 3 | Aralık/December 2013
References
Awe, E.W., Griffith, A., & Stephenson, P.(2011). Identifyng and Tackling Problems Militating Against Youth Interest in Constructon Crafts Careers: Panacea for Effec-tive PPP Implementation in Nigeria, A.Akintoye, C.Lancashire, S.Renukappa(Eds.), Public-Private Partnerships, 45-60.
Barge-Gil, A.(2010), Open, semi-open and closed innovators: Towards an expla-nation of degree of openness. Industry and Innovation, 17(6), 577-607.
Birkinshaw, J., Bessant, J. & Delbridge, R.(2007). Finding, Forming and Perform-ing: Creating Networks for Discontinuous Innovation. California Management Re-view, 49(3), 67-84.
Carbone, F., Contrereas, J., Hernandez, J. & Gomez-Perez, J.S. (2012). Open in-novation in an Enterprise 3.0 Framework: Three Case Studies, Expert System with Applications, 39, 8929-8939.
Chesbrough, H.W.(2003). Open Innovation: The New Imprerative for Creating and Profiting from Technology. Harvard Business School Press.
Chesbrough, H.W.(2003a). The Logic of Open Innovation: Managing Intellectual Property, California Management Review, 45(3), 33-58.
Chesbrough, H.W.(2003b). The Era of Open Innovation, MIT Sloan Management Review, Spring, 35-41.
Chesbrough, H.W.(2004). Managing Open Innovation. Research Technology Management, 47(1), 23-26.
Chesbrough, H.W.(2007). Why Companies Should Have Open Business Models. MIT Sloan Management Review, 48(2), 22-28.
Chesbrough, H.W. Open Innovation: A New Paradigm for Understanding Idus-trial Evolution, In H.W.Chesbrough, W. Vanhaverbeke, W., & J.West (Eds). (2008). Open Innovation: Researching a New Paradigm, Oxford University Press.
Dahlender, L., Frederiksen, L. & Rullani, F.(2008). Online communities and open innovation: Governance and symbolic value creation. Industry and Innovation, 15(2), 115-123.
Dahlender, L., Gann, D.M.(2010). How open is inovation?. Research Policy, 39, 699-709.
Ömür Yaşar Saatçıoğlu
Girişimcilik ve İnovasyon Yönetimi Dergisi / Journal of Entrepreneurship and Innovation Management116
Edelmann, J. & Volchek, D.(2010). Open innovation in cross borders – advan-tages or disadvantages? Strategic options analysis, In M.Torkkeli (Eds.), Frontiers of Open Innovation, 5-24, Finland.
Enkel, E., Gassmann, O., & Chesbrough, H.W. (2009). Open R&D and open in-novation: exploring the phenomeon. R&D Management, 39(4), 311-316.
Fabrizio, K.R.(2006). The Use of University Research in Firm Innovation, In Henry Chesbrough, W.Van haverbeke, Joel West(Eds.), Open Innovation: Researching a New Paradigm, 134-160, Oxford University Press.
Gassman, O., Enkel, E. & Chesbrough, H.W.(2010). The future of open innova-tion. R&D Management, 40(3), 1-9.
Giannopoulou, E., Yström, A., Ollila, S., Fredberg, T. & Elmquist, M.(2010). Im-plications of Openness: A Study into All the Growing Literature on Open Innovation. Journal of Technology Management and Innovation, 5(3), 162-180.
Hagen, R.(2002). Globalization, university transformation and economic regen-eration A UK case study of public/private sector partnership, The International Jour-nal of the Public Sector Management, 15(3), 204-218.
Herstad, S.J., & Cheng, S.(2012). Universities in an open innovation system: a UK perspective. International Journal of Entrepreneurial Behaviour & Research, 18(4), 440-456.
Huizingh, E.(2011). Open innovation: State of art and future perspectives, Tech-novation, 31(1), 2-9.
Ili, S., Albers, A. & Mller, S.(2010). Open innovation in the automotive industry. R&D Management, 40(3), 246-255.
Johnston, L., Robinson, S. & Lockett, N.(2010). Recognising “open innovation” in HEI-industry interaction for knowledge transfer and exchange. International Journal of Entrepreneurial Behaviour & Research, 16(6), 540-560.
Kaivo-oja, J., Stenvall, J. & Rannisto, P.H. (2010). Universities in the Regional Open Innovation System and Strategy: Case Study Reflections of National Univer-sity Reform of Finland, In M.Torkkeli (Eds.), Frontiers of Open Innovation, 91-106, Finland.
Lakhani, K.L., & Tushman, M.L.(2012). Open Innovation and Organizational BBooundaries: The Impact of Task Decompositon and Knowledge Distribution on the Locus of Innovation, Harvard Business Technology and Operations Management Unit Working Paper, 12(5), 12-057.
Lee, S.M., Olson, D.L. & Trimi, S.(2012). Co-innovation: Convergenomics, col-

Barriers In Partnerships In Open Innovation Process
117Cilt/Volume 2 | Sayı/Issue 3 | Aralık/December 2013
laboration and co-creation for organizational values. Management Decision, 50(5), 817-831.
Lichtenthaler, U.(2008). Open innovation in practice: An analysis of strategic approaches to technology transactions. IEEE Transactions on Engineering Manage-ment, 55(1), 148-157.
Lichtenthaler, U.(2011). Open innovation: Past research, current debates and future directions. Academy of Management, February, 75-92.
Luoma, T., Paasi, J. & Valkokari, K.(2010). Barriers to Innovating Openly. Re-search Paper.
Maxwell, E.(2006). Open Standards, Open Source and Open Innovation Har-nessing the Benefits of Openness. Innovations: Technology, Governance, Globaliza-tion, 1(3), 119-176.
Melendez, A.P. & Moreno, A.G.(2012). Open innovation in universities: What motivates researchers to engage in knowledge transfer exchanges. International Jour-nal of Entrepreneurial Behaviour & Research, 18(4), 417-439.
Melese, T., Lin, S.M., Chang, J.L. & Cohen, N.H.(2009). Open innovation net-works between academia and industry: an imperative for breakthrough therapies. Nature Medicine, 15(5), 502-507.
Morgan, L. & Finnegan, P.(2010). Open innovation in secondary software firms: An exploration of managers’ perceptions of open source software. ACM SIGMIS Da-tabase, 41(1), 76-95.
Munksgaard, K.B., Evald, M.R., Clarke, A.H. & Nielsen, S.L.(2012). Open innova-tio in Public-Private Partnerships. Ledelse & Erhvervsokonomi, 77(2), 41-51.
Munos, B. (2010). Can Open-Source Drug R&D Repower Pharmaceutical Innova-tion?. Clinical Pharmacology & Theapeutics, 87(5), 534-536.
Oyebanji, A.O., Akintola, A. & Liyanage, C.L.(2011). Public-Private Partnerships Approach: A Panacea to Urban Housing Inequalities in Developing Countries- A Case Study of Nigeria, In A.Akintoye, C.Lancashire, S.Renukappa(Eds.), Public-Pri-vate Partnerships, 61-75.
Rangel, T., Vassallo, J.M. & Arena, B. (2011). Implemenation of Safety Based In-centives in Public Private Partnerships(PPPS): An Empricial Analysis for the Case of Spain, In A.Akintoye, C.Lancashire, S.Renukappa(Eds.), Public-Private Partnerships, 15-29.
Reed, R. & Barnes, S.(2012). How open innovation affects the drivers of competi-tive advantage? Trading the benefits f IP creation and ownership for free invention. Management Decision, 5(1), 58-73.

Ömür Yaşar Saatçıoğlu
Girişimcilik ve İnovasyon Yönetimi Dergisi / Journal of Entrepreneurship and Innovation Management118
Roper, S. & Dundas, N. (2013). Catalysing open innovation through publicly-funded R&D: A comparison of university and company-based research centers. Inter-national Small Business Journal, 31(3), 275-295.
Savitskaya, I.(2011). Enviromental Influences on the Adoption of Open Innova-tion: Analysis of Structural, Institutional and Cultural Impacts, Lappeenranta Univer-sity of Technology, Unpublished Doctoral Thesis.
Savistkaya, I., Salmi, P., & Torkkeli, M. (2010). Barriers to Open Innovation: Case China, Journal of Technology Management and Innovation, 5(4), 10-21.
Sorensen, F., Mattson, J., & Sundbo, J.(2010). Experimental methods in innova-ton research. Research Policy, 39, 313-322.
Stahlbrost, A. & Bergvall – Kareborn, B.(2011). Living Labs-Real World Experi-ments to Support Open Service Innovation, Paper presented at the eChallenges e-2011 Conference Proceedings.
Stone, J.(2010). Innovation – a business risk that can be managed and mitigated, Keeping Good Companies Together, February, 23-28.
Traitler, H., Watzke, H.J. & Saguy, I.S.(2011). Reinventing R&D in an Open In-novation Ecosystem, Journal of Food Science, 76(2), R62-R68.
Van de Vrande, V., Vanhaverbeke, W. & Rochemont, M. (2009). Open innovation in SMEs: Trends, motives and challenges. Technovation, 29, 423-437.
Van de Vrande, V., Vanhaverbeke, W., & Gassman, O.(2010). Broadening the scope of open innovation: Past research, current state and future directions. Interna-tional Journal of Technology Management, 52(3/4), 221-235.
Van der Meer, H.(2007). Open innovation – The Dutch treat: Challenges in thinking business models, Creativity and Innovation Management, 16(2), 192-202.
Varis, J. & Olander, H.(2010). Developing non-core ideas into innovations – The obstacles for open knowledge sharing, In M.Torkkeli (Eds.), Frontiers of Open Innova-tion, 205-222, Finland.
Vega, A., Brown, D. & Chiasson, M.(2012). Open innovation and SMEs: Explor-ing policy and the scope for improvements in university-based public programmes through a multidisciplinary lens. International Journal of Entrepreneurial Behaviour & Research, 18(4), 457-476.
Vujovic, S. & Ulhoi, J.P. (2008). Online innovation: the case of open source soft-ware development. European Journal of Innovation Management, 11(1), 142-156.
Wettenhall, R.(2003). The Rhetoric and Reality of Public-Private Partnerships, Public Organization Review: A Global Journal, 3, 77-107.

Barriers In Partnerships In Open Innovation Process
119Cilt/Volume 2 | Sayı/Issue 3 | Aralık/December 2013
Weir, S.J., DeGennaro, L.J. & Austin, C. (2012). Repurposing Approved and Aban-doned Drugs fort he Treatment and Prevention of Cancer through Public-Private Part-nership, Cancer Research, 72, 1055-1058.
West, J. & Gallagher, S.(2006). Challenges of Open Innovation: The Paradox of Firm Investment in Open Source Software. R&D Management, 36(3), 319-331.
Wikhamn, B.R. & Knights, D.(2011). Transaction Cost Economics and Open In-novation: Reinventing the Wheel of Boundary. Paper for DRUID 2011.

Girişimcilik ve İnovasyon Yönetimi Dergisi
Journal of Entrepreneurship and Innovation Management
121Cilt/Volume 2 | Sayı/Issue 3 | Aralık/December 2013 | 121-138
OECD Ülkeleri ve Komşu Ülkelerin Bilgi Düzeylerinin Bilgi Haritası Yöntemi İle Analizi
OECD Countrıes and Neighbor Countries’ Knowledge Level Analysis by Using Knowledge Mapping Method
Cem Işık*
* Yrd. Doç. Dr., Atatürk Üniversitesi, [email protected] OECD ülkeleri: ABD, Almanya, Avusturya, Belçika, Danimarka, Fransa, Hollanda, İngiltere,
İrlanda, İspanya, İsveç, İsviçre, İtalya, İzlanda, Japonya, Kanada, Lüksemburg, Norveç, Por-tekiz, Türkiye ve Yunanistan.
2 Azerbaycan, Bulgaristan, Ermenistan, Gürcistan, Irak, İran, Suriye ve Yunanistan.
Özet
Bilgi, refahın kaynağı olmakla birlikte sahibine ekonomik güç katan çok önemli bir değerdir. Günümüzde kaynağını bilgiden alan ekonomiler bilgi ekonomisi bu ekonomi-yi icra eden toplumlar ise bilgi toplumu ola-rak bilinmektedir. Bilginin bir üretim faktörü olarak karşımıza çıktığı yeni ekonomilerde rakabetçi üstünlük yaratan faktörleri analiz etmek kalkınmanın derecesini belirlemede önemli hale gelmiştir. Bu nedenledirki çalış-masının amacı ekonomik olgu ve olayları bil-gi ekonomisi rekabetçi üstünlük değişkenleri çerçevesinde analiz ederek bir yol haritası oluşturmaktır. Bu çalışmada bilgi ekonomile-rinin rekabet üstünlüğü oluşturulmasına etki eden Ar-Ge, İnovasyon, Patent ve Bilgi Tek-nolojileri açısından Türkiye’de dâhil olmak üzere OECD1 ülkeleri ve komşularımızın2 bil-gi düzeyleri “bilgi haritası yöntemi” kullanı-larak analiz edilmiştir. Daha sonra ülkelerin bilgi düzeyleri, OECD bilim ve teknoloji gös-tergeleri ile tespit edilen sonuçlarla karşılaştı-rılarak değerlendirilmiştir. Çalışma sonuçları gösteriyor ki Türkiye bilgi ekonomisi rekabet-çi değişkenlerine daha fazla önem vermeli ve bu alanda çalışmalarını sıklaştırmalıdır.
Anahtar Kelimeler: Bilgi, Bilgi Haritası, OECD, Bilgi Düzeyi
Abstract
Knowledge is an important value that adds economic power to his/her owner and foundation of the prosperity. Today, econo-my that takes foundation from knowledge is known as knowledge economy and people who live in society are known as knowledge society. Therefore, this study aims at contribut-ing people who want to constitute knowledge economy works in Turkey. The purpose of the study is to make comprehensible of the eco-nomic fact and situations in the framework of knowledge economy. In this study, it is determined that the factors, which influence the establishment of competitive advantage in knowledge economies, including Turkey, OECD countries and neighbors knowledge levels were analyzed by using “knowledge mapping method”. Then, information level of countries were evaluated by comparing the results of OECD Science and Technology In-dicators. According to results, Turkey should increase knowledge works in this area.
Keywords: Knowledge, Knowledge Map-ping, OECD, Knowledge Level

Cem Işık
Girişimcilik ve İnovasyon Yönetimi Dergisi / Journal of Entrepreneurship and Innovation Management122
1. Giriş
Ülkeler sahip oldukları bilginin ne düzeyde olduğu, hangi bilginin ne zaman, nerede kullanılması gerektiği ve var olan bu bilginin nasıl saklana-bileceği konusunda yeterli bilgi sahibi değildirler. Bilginin sürekli değişen yapısı ekonomileri bilgiyi saklama, değerlendirme ve kontrolüne yönelik adımlar atma zorunluluğuna sevk etmektedir. Ülkeler bilginin etkin kulla-nımı ve sahip oldukları bilginin ne düzeyde olduğunu görmeleri için bilgi haritalarına ihtiyaç duymaktadır. Bilgi haritası; çeşitli metinler, rakamlar, şe-killer ve sembollerin kullanılmasıyla hazırlanan ve bilgi kaynaklarıyla bilgi-ye gereksinim duyanlar arasındaki bağlantıyı sağlayan temel bir erişim aracı olarak tanımlanmaktadır (Zack, 2000; Haggie, 2003; Özdemirci ve Aydın, 2007). Grey’e göre de organizasyonun sahip olduğu bilginin yerini, sahibini ve değerini tespit ederek, bunlardan en faydalı şekilde yararlanma yollarının keşfedilmesini içeren sürekli bir çabaya işaret etmektedir (Grey, 1999). Ay-rıca, inceleme ve sentez sürecini içermekle birlikte bilginin elde edilmesi ve akışının açıklanmasıdır. Bu sayede ekonomide tanımlanmış, sınıflandırılmış ve düzenlenmiş bilgiye farklı bir ortamda nasıl ulaşılacağı belirlenmektedir. Bilgi haritası; bilgiyi depolamaya yarayan bir araç değil, bilgiye nasıl ula-şılacağı ve kullanılabileceğini gösteren bir rehberdir. Bu sebeple öncelikle ekonomide bilgi varlıklarının isimlendirilmesi, gruplandırılması ve sahiple-rinin ortaya konması gerekmektedir. Daha sonra bu sonuçlar, referans kişiler katalogu, aranabilir veritabanı, sürekli güncellenebilir arayüz ve dinamik raporlar gibi teknik çözümlerle sunulmaktadır. Sistematik bir yaklaşımla ele alınması gereken bilgi haritası yönteminde bilgi tüm çeşitlerde olabilmekte-dir (açık-kapalı, resmi-gayri resmi). Bilginin düzenlenmesi, saklanabileceği her alanda (süreçler, dokümanlar, ilişkiler) yakalanması ve hukuksal düzen-lemeler ile ele alınması önem arz etmektedir (Pınar ve Kamaşar, 2008).
Son yıllarda teknolojide ortaya çıkan gelişmeler sayesinde bilgi Ar-Ge ve inovasyon sonucu ortaya çıkan yenilikler ile bilgi teknolojilerindeki hızlı ilerlemeler sayesinde toplumun her kesimine hızlı bir şekilde yayılmaktadır. Sosyo-ekonomik kalkınmanın bir belirleyicisi haline gelen Ar-Ge, inovas-yon, patent ve bilgi teknolojileri rekabetçi üstünlük kurulmasında ülkelere önemli avantajlar sağlamaktadır. Bir ülkenin bilim ve teknolojiyi daha etkin kullanması bilgiye dayalı karar alma süreçleri ile daha fazla değer üreten, küresel rekabette başarılı ve refah düzeyi yüksek bir konuma çıkma hedefini de beraberinde getirmektedir (DPT, 2006-2010).

OECD Ülkeleri ve Komşu Ülkelerin Bilgi Düzeylerinin Bilgi Haritası Yöntemi İle Analizi
123Cilt/Volume 2 | Sayı/Issue 3 | Aralık/December 2013
Çalışmada, ekonomilerin sahip oldukları bilgi düzeyinin rakip ekonomi-ler ile karşılaştırılabilir olması bilgi haritası metodunun seçilme nedenidir. Bilgi haritası üzerinde yer alan semboller ve grafikler, ekonomi ve rakiplerin bu harita üzerindeki yerini belirtecek şekilde oluşturulmasıdır. Örneğin bir ekonomi x bilgi alanında ileri seviyede bir bilgiye sahipken, rakip ekonomi-ler temel seviyede bir bilgi düzeyine sahip olabilmektedir. Bilgi matrisinin oluşturulması, ekonomilerin kendi durumlarını görüp bilgi seviyelerini art-tırmak için strateji geliştirmeye yardımcı olurken, bilgi matrisine göre ülke-lerin ileri bilgi düzeyini aşmaları, yenilikçi bilgi düzeyinin yakalanmasıdır.
OECD ülkeleri bilgi düzeyi bakımından komşularımıza rol model ülke-ler olabilecek konumdadır. Bu çalışma OECD ülkeleri ve komşu ülkelerin bilgi düzeylerinin bilgi haritası analizleri yöntemi kullanarak Ar-Ge, inovas-yon, patent ve bilgi teknolojileri açısından bilgi düzeyinin belirlenmesi ama-cını taşımaktadır. Bu çalışma dört bölümden oluşmaktadır. Birinci bölümde bilgi haritası ve matrisi açıklanmış, ikinci bölümde bilgi haritası konusunda literatür çalışmalarına yer verilmiş, üçüncü bölümde metodoloji ve son bö-lümde elde edilen sonuçlar tartışılmıştır.
2. Bilgi Haritası Literatür Araştırması
Michael Zack’in (1999) literatüre kazandırdığı bilgi haritası kavramı daha önceleri sistematik bir şekilde uygulanmamasına rağmen hayatın içeri-sinde yer almıştır. Elde edilen bilgi kayıtlarının toplanıp, dokümantasyonu-nun yapılmaya başlanması ile bilgi haritası metodolojisi önem kazanmaya başlamıştır.
Michael Zack (1999) bilgiyi dinamik bir süreç olarak tanımlamış ve son-ra stratejik bilginin önemine değinmiştir. Stratejik bilgi rekabet edilebilirlik açısından firmanın piyasada ki konumunun belirlenmesinde kullanılmakta-dır. Firmalar rekabetçi ve yenilikçi bir yapıya kavuşmak için bilgiyi katego-rize ederek bilgi haritası yardımıyla bu yapıyı daha kullanışlı hâle getirmek-tedir (Zack, 1999).
Grey (1999) bilgi haritasını sadece bilginin organizasyonu açısından ele almamış aynı zamanda bilginin nerede ve nasıl kullanılması gerektiğine, de-ğerine ve sağlıklı bir bilgi akışının sağlanması için çeşitli yollar üzerinde

Cem Işık
Girişimcilik ve İnovasyon Yönetimi Dergisi / Journal of Entrepreneurship and Innovation Management124
durmuştur. Ayrıca sözü geçen bu çalışmasında sahip olunan bir bilgi veya enformasyonun izlenmesi gerektiği ve bu doğrultuda bilginin entelektüel sermaye ile biraraya getirilerek kullanılması gerekliliği üzerinde de durul-muştur (Grey, 1999).
Wexler (2001) çalışmasında bilgi haritasını organizasyon içerisindeki karmaşık enformasyonun sevk ve idare edilmesinde kullanılan bir yöntem olarak ifade etmiştir. Başka bir değişle, bilgi haritası her türlü bilginin sem-bol ve şekiller ile ifade edilerek yönetilmesidir (Wexler, 2001).
Vestal (2002) çalışmasında bilgi haritasını organizasyonu tanımlayan ve kategorize eden insan, süreç, içerik ve teknolojiyi kapsayan bir bütün olarak tanımlamıştır. Firmalar karşılaştığı engel ve kısıtları stratejik amaç ve hedef-leri çerçevesinde yapılandırmalıdır. Bu nedenle bilgi haritası, firmanın amaç ve hedeflerine ulaşmak için bir yol haritası niteliğindedir (Vestal, 2002).
IBM tarafından yapılan bir çalışmada çalışmasında bilginin nasıl akta-rılacağına ve benzer alanlarda çoklu süreçlerden geçerek (işlenerek) nasıl kullanılacağına dikkat çekmiş ve bilgi altyapısının ne derece önemli olduğu vurgusu yapılmıştır (IBM, 2003).
Callahan (2005) ise araştırmasında çalışmasında bilgi haritasına geç-meden önce amaçların tam olarak belirlenmesi gerektiğini savunulmuştur. Callahan’a göre ise, bilgi haritası tedarikçiler, rakipler ve müşteriler ile iliş-kiler kurma ve bu ilişkileri sorgulama sürecini kapsayan bir eğitim şeklidir. Yani, tedarikçiler, rakipler ve müşteriler belirli bir bilgi düzeyine sahipken ancak bu durumda bilgi insanlar arasında ilişki kurmanın bir yolu olarak kullanılabilmektedir.
Ermine vd., (2006) çalışmasında teknik eğitim, yüz yüze eğitim ve hiz-met içi eğitim gibi yollar ile yapılan bilgi transferlerinin geçerli bir yol olma-dığını bunun yerine organizasyonun içerisinde bilgi sermayesine yapılacak katılımın önemli olduğu görüşü üzerinde durmuştur. Aynı çalışmasında Er-mine vd. Bilgi transferi sürecince bilgi bileşenleri tanımlanarak bilgi yöneti-mi sürecinin iyi bir şekilde oluşturulması gerektiğini vurgulamıştır (Ermine vd., 2006).
Huijsen vd., (2007) çalışmasında bilgi haritasını organizasyon içerisin-de yer alan bilginin şeffaf bir şekilde yansıması olarak tanımlamıştır. Ayrıca

OECD Ülkeleri ve Komşu Ülkelerin Bilgi Düzeylerinin Bilgi Haritası Yöntemi İle Analizi
125Cilt/Volume 2 | Sayı/Issue 3 | Aralık/December 2013
bilgi haritası, firma performansı hakkında bilgi sahibi olunmasına da yar-dımcı olmaktadır (Driessen vd., 2007).
3. Bilgi Haritası ve Bilgi Matrisi
Zack’in ortaya koyduğu bilgi yaklaşımı kapsamında bilgi haritası üze-rinde yer alan bilgi seviyeleri; temel, ileri (teknik) ve yenilikçi bilgi olmak üzere, başlıca üç grupta toplanmaktadır. Bunlar (Zack, 1999);
• Temel bilgi; ekonominin ihtiyaç duyduğu en alt düzeydeki bilgiyi ifade etmektedir.
• İleri bilgi; ekonominin uluslararası alanda rekabetçi olarak varlığı-nı sürdürmeye yarayan bilgidir.
• Yenilikçi bilgi; ekonomilerin rakiplerine nazaran lider konumda ol-masına yardımcı olan bilgidir.
Ulusal ve rakip ekonomileri gösterir bilgi haritası ve buna ait değişken-ler Şekil 1’de gösterilmiştir.
İleriTeknoloji
(Yenilikçi Bilgi)
Orta-Düşük-İleriTeknoloji
(İleri Bilgi)
DüşükTeknoloji
(Temel Bilgi)
Ulusal Ekonomi
Rakip Ekonomiler
DüşükTeknoloji
(Temel Bilgi)
Orta-Düşük-İleriTeknoloji
(İleri Bilgi)
İleriTeknoloji
(Yenilikçi Bilgi)
Yenilikçi
Lider
Rekabetçi
Geride
Riskli
Şekil 1: Bilgi Haritası
Kaynak: Michael H. Zack, Developing a Knowledge Strategy, California Management Re-view, 41(3), 1999, p.134.
Cem Işık
Girişimcilik ve İnovasyon Yönetimi Dergisi / Journal of Entrepreneurship and Innovation Management126
Michael Zack (2000) çalışmasına göre bilgi haritası değişkenlerini şu şekilde sıralamak mümkündür.
• Yenilikçi ekonomi: rakipler temel bir bilgi düzeyindeyken ekono-minin yenilikçi bilgiyle piyasada öncü konumunda olmasıdır.
• Lider ekonomi: mevcut durum içerisinde diğer ekonomilere öncü-lük edebilecek durumda yenilikçi bilgiye sahipken, rakiplerin de ileri bir bilgiye sahip olmasıdır.
• Rekabetçi: ekonomiyle rakip ekonomilerin aynı düzeyde bilgi sevi-yesine sahip olmasıdır. Bu durumda ekonomi ve rakipler ileri bilgi düzeyine sahiptir.
• Geride kalmış ekonomi: ekonominin rakiplere nazaran bilgi düzeyi olarak geride kalmasıdır. Yani ekonomi temel bilgi düzeyindeyken rakipler ileri bilgi düzeyindedir.
• Riskli ekonomi: ekonomi temel bilgi düzeyinde yer alırken, rakip-lerin de yenilikçi bir bilgi düzeyine sahip olmasıdır. Bu durum aynı zamanda ekonominin kalkınma hamleleri ve gerekli yatırımları yapması gerektiği sınırı göstermektedir.
2.1. Bilgi Haritası Yararları
Bilginin saklanması ve yayılması için kullanılan yöntemlerden biri olan bilgi haritası metodu önemli bilgilerin ve bu bilgiler arasındaki ilişkilerin şematik olarak gösterilmesi sonucu ortaya çıkan yararı içermektedir. Orta-ya çıkan sonuçları şu şekilde sıralamak mümkündür (O’Donell, 1994, Zack, 1999; WB, 2003;).
• Bilgiye ulaşım ve paylaşım kolaylaşır ve bu sayede var olan bilgi yeni bilgiler için bir kaynak oluşturmaktadır. Böylece zamandan ve kaynaklardan tasarruf sağlanmış olmaktadır.
• Ekonomide uzmanlaşma artmaktadır.
• Öğrenen ekonomiler (learning economy), hayat boyu öğrenme (life long learning), e-öğrenme (e-learning) gibi kavramlar ortaya çık-maktadır. Bu metodlar ile öğrenme artar ve böylece bilgi toplumuna geçiş sürecinde büyük bir aşama kaydedilmiş olmaktadır.

OECD Ülkeleri ve Komşu Ülkelerin Bilgi Düzeylerinin Bilgi Haritası Yöntemi İle Analizi
127Cilt/Volume 2 | Sayı/Issue 3 | Aralık/December 2013
• Bilginin yönetimi, değerlendirilmesi ve kontrolü kolaylaştırmakta-dır.
2.2. Bilgi Haritası Yöntemi
Günümüzde rekabetin yoğun olarak yaşandığı ekonomilerin karşılaştır-malı analizleri yapılırken bilgi varlıklarının yerini belirlemek ve bilgi envan-teri oluşturabilmek için bilgi haritası yöntemi sıkça kullanılmaktadır. Bilgi haritası; bir ülkenin teknoloji düzeyi ile bilgi seviyesinin grafik ve semboller yardımıyla bilgi yapısı ve yerinin tespit edilmesidir (Zack, 1999). Böylece, Michael Zack’in literatüre kazandırdığı bu yöntem ile bir ülkenin bilgi düze-yi belirlenebilmektedir.
Uygulama bölümünün ilk aşamasında, ülkemiz öznelinde, 2009-2010 dönemini kapsayan yıllık veriler bilgi haritası ile analiz edilmiştir. Bu amaç-la, bilgi ekonomisine ilişkin kavramlar ele alınırken gerekli verilerin sağla-nabilmesi için OECD (2010), Dünya Ekonomik Forumu (2010), Economist Intelligence Unit (2009), TÜSİAD (1991) ve Saygılı (2003) gibi kişi, kurum ve kuruluşların yayınlamış olduğu çalışmalara başvurulacaktır (Saygılı, 2003; EIU, 2009; TÜSİAD, 19991; WEF, 2010, OECD, 1996). Bu kapsamda, bilgi ekonomilerinde rekabet üstünlüğü oluşturulmasına etki eden faktörler ışığında gelişmiş ülkeler (ABD, Almanya, Fransa, İngiltere, İspanya, İtalya ve Japonya), Yunanistan ve Türkiye de dâhil olmak üzere diğer OECD ülkeleri (Avusturya, Belçika, Kanada, Danimarka, Yunanistan, İzlanda, İrlanda, Lük-semburg, Hollanda, Norveç, Portekiz, İsveç, İsviçre) ve komşularımızın (Yu-nanistan, Azerbaycan, Bulgaristan, Gürcistan, Suriye ve Ermenistan, İran, Irak) bilgi düzeyi belirlenmiştir.
Bilgi ekonomileri açısından ülkemizde bilgi düzeyinin belirlenmesi amacıyla, uygulamanın ilk aşamasındaki bilgi haritası analizlerinde kullanı-lacak ilk faktör Ar-Ge’dir. İçerisinde yenilik barındıran, kültür ve insan bilgi-sini içeren Ar-Ge; bilginin yeni uygulamaları sonucu ortaya çıkan düzenli ve yaratıcı faaliyetler bütününü temsil etmektedir. (Resmi Gazete, 2002)
Bilgi düzeyinin belirlenmesi amacıyla rekabet üstünlüğü oluşturulma-sına etki eden faktörlerden inovasyon; yenileme sürecini kapsayan bir fikrin belli bir süreç içerisinde pazarlanmak suretiyle bir ürün ya da hizmete, yeni yahut geliştirilmiş bir imalat veya dağıtım yöntemine, ya da yeni bir toplum-

Cem Işık
Girişimcilik ve İnovasyon Yönetimi Dergisi / Journal of Entrepreneurship and Innovation Management128
sal hizmet yöntemine dönüştürülmesi ile ilgili tüm çalışmaları içerisinde barındırması olarak açıklanmaktadır. (Resmi Gazete, 2002)
Bilgi ekonomileri açısından ülkemizin bilgi haritasının belirlenmesi amacıyla çalışmanın uygulama bölümünün ilk aşamasında kullanılan üçün-cü faktör patenttir. Patent; buluş konusu olan bir ürünü belirli bir süre üret-me, kullanma, satma veya ithal etme haklarıyla ilgili bilginin toplanmasıdır. (TPE, 2013)
Teknoloji ve teknoloji altyapısına ilişkin bilgileri, bilgi teknolojileri oluşturmaktır. Ekonominin içerisinde yer alan bilişim sektörüne ilişkin var olan bilgi düzeyi ve tüm gelişmeler bilgi teknolojileri değişkeninin doğrudan belirleyicileri arasında yer almaktadır. Hem genel, hem de bilgi teknolojileri yönetimi açısından ekonominin performansı üzerinde hızlı değişmelere yol açan kaynaklarının planlanması, geliştirilmesi ve kontrolü, bilgi teknolojile-rinin beslenmesinde hayati önem taşımaktadır. Bu kapsamda, ülkemizin bil-gi düzeyinin belirlenebilmesi amacıyla kullanılan son faktör bilgi ve iletişim teknolojileridir. Avustralyanın1998 yılında Joint Middle Management Deve-lopment Programı (JMMDP3) adı altında anket yöntemi ile yaptığı Avust-ralya milli kütüphane organizasyonun ihtiyaçlarının belirlenme çalışmaları konuya gösterilebilecek özgün bir uygulama örneğidir (Australian Library and Information Association, 2010).
3. Yöntem ve Veri Seti
Çalışmada kullanılan Ar-Ge, Patent, İnovasyon ve Bilgi Teknoloji veri-leri 2009–2010 dönemini kapsayan yılları içermektedir. Bu veriler OECD ve Dünya Bankası veri tabanlarından temin edilmiştir.
Ülkelerin Rekabet Skorunun Hesaplanışı (2009-2010)
Not: qi : Anket sorusu, c: Ülkelerin skoru, t = 2009, 2010, N: Örnek sayısı
3 JMMDP için hazırlanan e-anket çalışmasının soruları ekler kısmında verilmiştir.

OECD Ülkeleri ve Komşu Ülkelerin Bilgi Düzeylerinin Bilgi Haritası Yöntemi İle Analizi
129Cilt/Volume 2 | Sayı/Issue 3 | Aralık/December 2013
genelleştirilmiş haliyle
Tablo 1’de ülkelere göre bilgi alanları sunulmuştur.

Cem Işık
Girişimcilik ve İnovasyon Yönetimi Dergisi / Journal of Entrepreneurship and Innovation Management130
Tablo 1: Türkiye ve Komşularının Bilgi Alanı (2010)
Ülkeler Ülke Sembolleri
İnovasyonSkoru
Ar-Ge, Patent ve Bilgi Tek.
Skoru4
Ortalama Teknoloji Düzeyi (M)5
Azerbaycan AZ 3.16 4.29 3.72
TÜRKİYE TR 3.10 4.25 3.67
İran IR 3.11 4.14 3.62
Bulgaristan BG 2.91 4.13 3.52
Yunanistan GR 3.00 3.99 3.49
Ermenistan ER 2.63 3.76 3.19
Gürcistan GEO 2.51 3.86 3.18
Suriye SYR 2.49 3.78 3.13
Irak IRQ --- --- ---
Kaynak: World Economic Forum, 2010, Research and Development Expenditure, Erişim: 04.10.2012 http://www3.weforum.org/docs/WEF_GlobalCompetitivenessReport_2010-11.pdf.
Not: Ar-Ge, İnovasyon, Patent ve Bilgi Teknolojileri (BT) açısından Dünya Bankası’na göre dün-ya ortalaması 2.21 olarak belirtilmiştir.
Tablo 1’den de görüldüğü üzere, bilgi alanları olan Ar-Ge, İnovasyon, Patent ve Bilgi Teknolojileri açısından ülkeler sırasıyla Azerbaycan, Türki-ye, İran, Bulgaristan, Yunanistan, Ermenistan, Gürcistan ve Suriye olarak sıralanmıştır.
Ortalama teknoloji düzeyleri hesaplanırken İnovasyon ile Ar-Ge, Patent ve Bilgi Teknoloji değişkenleri kullanılmıştır. Burada mn OECD veri tabanından alınmış ülkelerin Ar-Ge, İnovasyon, Patent ve Bilgi Teknolo-jisi indeks verileridir. k değişken sayısını ve m inovasyon skoru ile ülkelerin Ar-Ge, Patent ve Bilgi Teknolojileri skoru toplamını ifade etmektedir. M ise ortalama teknoloji düzeyini vermektedir (Ermine vd., 2006).
4 Ülkelerin teknoloji düzeyi Dünya Bankası verilerine göre Ar-Ge, Patent ve Bilgi Teknoloji değişkenlerinin Milli Gelir içerisindeki yüzde olarak ortalamasıdır.
5 Ortalama Teknoloji Düzeyi: Dünya Bankası verilerine göre Ar-Ge, İnovasyon, Pa-tent ve Bilgi Teknoloji değişkenlerinin Milli Gelir içerisindeki yüzde olarak top-lamlarının ortalamasına göre hesaplanmıştır.

OECD Ülkeleri ve Komşu Ülkelerin Bilgi Düzeylerinin Bilgi Haritası Yöntemi İle Analizi
131Cilt/Volume 2 | Sayı/Issue 3 | Aralık/December 2013
Türkiye’nin komşuları içerisinde bilgi haritasındaki yeri Şekil 2’de gös-terilmiştir.
UlusalEkonomi
Yenilikçi Bilgi
İleri Bilgi
Temel Bilgi
Temel Bilgi İleri Bilgi Yenilikçi Bilgi
Yenilikçi
Lider
Rekabetçi
Geride
Riskli
AZTRIRBCGR
ERGEO
SYR
Şekil 2: Türkiye ve Komşularının Bilgi Haritasındaki Yeri (2010)
Şekil 2’den de görüldüğü üzere, Türkiye’nin komşularına göre ileri bil-gi düzeyindedir.
OECD’nin yapmış olduğu rekabet sıralaması ise Tablo 2’de sunulmuştur (OECD, 2010).
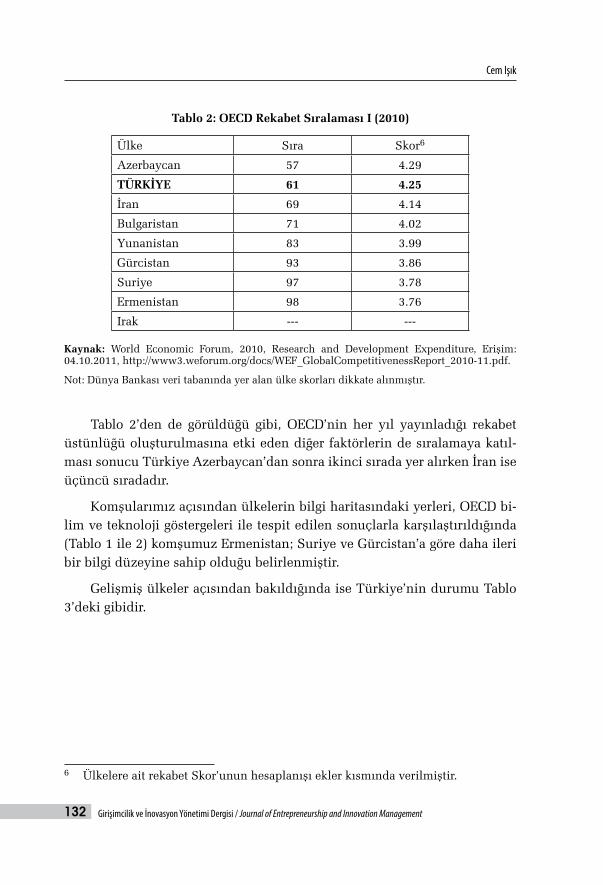
Cem Işık
Girişimcilik ve İnovasyon Yönetimi Dergisi / Journal of Entrepreneurship and Innovation Management132
Tablo 2: OECD Rekabet Sıralaması I (2010)
Ülke Sıra Skor6
Azerbaycan 57 4.29
TÜRKİYE 61 4.25
İran 69 4.14
Bulgaristan 71 4.02
Yunanistan 83 3.99
Gürcistan 93 3.86
Suriye 97 3.78
Ermenistan 98 3.76
Irak --- ---
Kaynak: World Economic Forum, 2010, Research and Development Expenditure, Erişim: 04.10.2011, http://www3.weforum.org/docs/WEF_GlobalCompetitivenessReport_2010-11.pdf.
Not: Dünya Bankası veri tabanında yer alan ülke skorları dikkate alınmıştır.
Tablo 2’den de görüldüğü gibi, OECD’nin her yıl yayınladığı rekabet üstünlüğü oluşturulmasına etki eden diğer faktörlerin de sıralamaya katıl-ması sonucu Türkiye Azerbaycan’dan sonra ikinci sırada yer alırken İran ise üçüncü sıradadır.
Komşularımız açısından ülkelerin bilgi haritasındaki yerleri, OECD bi-lim ve teknoloji göstergeleri ile tespit edilen sonuçlarla karşılaştırıldığında (Tablo 1 ile 2) komşumuz Ermenistan; Suriye ve Gürcistan’a göre daha ileri bir bilgi düzeyine sahip olduğu belirlenmiştir.
Gelişmiş ülkeler açısından bakıldığında ise Türkiye’nin durumu Tablo 3’deki gibidir.
6 Ülkelere ait rekabet Skor’unun hesaplanışı ekler kısmında verilmiştir.
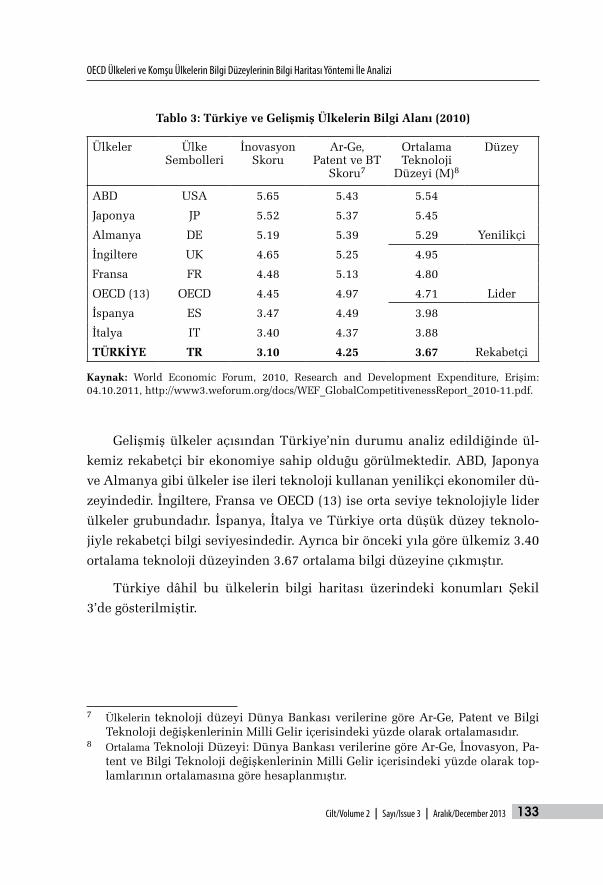
OECD Ülkeleri ve Komşu Ülkelerin Bilgi Düzeylerinin Bilgi Haritası Yöntemi İle Analizi
133Cilt/Volume 2 | Sayı/Issue 3 | Aralık/December 2013
Tablo 3: Türkiye ve Gelişmiş Ülkelerin Bilgi Alanı (2010)
Ülkeler Ülke Sembolleri
İnovasyonSkoru
Ar-Ge, Patent ve BT
Skoru7
Ortalama Teknoloji
Düzeyi (M)8
Düzey
ABD USA 5.65 5.43 5.54
Yenilikçi
Japonya JP 5.52 5.37 5.45
Almanya DE 5.19 5.39 5.29
İngiltere UK 4.65 5.25 4.95
Lider
Fransa FR 4.48 5.13 4.80
OECD (13) OECD 4.45 4.97 4.71
İspanya ES 3.47 4.49 3.98
Rekabetçi
İtalya IT 3.40 4.37 3.88
TÜRKİYE TR 3.10 4.25 3.67
Kaynak: World Economic Forum, 2010, Research and Development Expenditure, Erişim: 04.10.2011, http://www3.weforum.org/docs/WEF_GlobalCompetitivenessReport_2010-11.pdf.
Gelişmiş ülkeler açısından Türkiye’nin durumu analiz edildiğinde ül-
kemiz rekabetçi bir ekonomiye sahip olduğu görülmektedir. ABD, Japonya
ve Almanya gibi ülkeler ise ileri teknoloji kullanan yenilikçi ekonomiler dü-
zeyindedir. İngiltere, Fransa ve OECD (13) ise orta seviye teknolojiyle lider
ülkeler grubundadır. İspanya, İtalya ve Türkiye orta düşük düzey teknolo-
jiyle rekabetçi bilgi seviyesindedir. Ayrıca bir önceki yıla göre ülkemiz 3.40
ortalama teknoloji düzeyinden 3.67 ortalama bilgi düzeyine çıkmıştır.
Türkiye dâhil bu ülkelerin bilgi haritası üzerindeki konumları Şekil
3’de gösterilmiştir.
7 Ülkelerin teknoloji düzeyi Dünya Bankası verilerine göre Ar-Ge, Patent ve Bilgi Teknoloji değişkenlerinin Milli Gelir içerisindeki yüzde olarak ortalamasıdır.
8 Ortalama Teknoloji Düzeyi: Dünya Bankası verilerine göre Ar-Ge, İnovasyon, Pa-tent ve Bilgi Teknoloji değişkenlerinin Milli Gelir içerisindeki yüzde olarak top-lamlarının ortalamasına göre hesaplanmıştır.

Cem Işık
Girişimcilik ve İnovasyon Yönetimi Dergisi / Journal of Entrepreneurship and Innovation Management134
Şekil 3: Türkiye ve Gelişmiş Ülkelerin Bilgi Haritasında Yeri (2010)
UlusalEkonomi
Yenilikçi Bilgi
İleri Bilgi
Temel Bilgi
Yenilikçi
Lider
Rekabetçi
Geride
Riskli
USAJP
DE
FROECD
ESIT
TR
Temel Bilgi İleri Bilgi Yenilikçi Bilgi
UK
Şekil 3’den de görüldüğü üzere, gelişmiş ülkeler açısından Türkiye’nin bilgi haritasındaki yeri rekabetçi bilgi düzeyindedir. Diğer bir ifadeyle reka-betçi bilgi düzeyi ekonomiyle rakip ekonomilerin aynı düzeyde bilgi seviye-sine sahip olmasıdır. Bu durumda ekonomi ve rakipler ileri bilgi düzeyine sahiptir.
OECD’nin gelişmiş ülkeler açısından 2009 yılı rekabet sıralaması Tablo 4’de sunulmuştur.

OECD Ülkeleri ve Komşu Ülkelerin Bilgi Düzeylerinin Bilgi Haritası Yöntemi İle Analizi
135Cilt/Volume 2 | Sayı/Issue 3 | Aralık/December 2013
Tablo 4: OECD Rekabet Sıralaması II (2009-2010)
Ülke Sıra Skor
ABD 4 5.43
Almanya 5 5.39
Japonya 6 5.37
İngiltere 12 5.25
Fransa 15 5.13
OECD (13) - 4.97
İspanya 42 4.49
İtalya 48 4.37
TÜRKİYE 61 4.25
Kaynak: World Economic Forum, 2009, Research and Development Expenditure, Erişim: 04.10.2010, http://www3.weforum.org/docs/WEF_GlobalCompetitivenessReport_2010-11.pdf.
Gelişmiş ülkeler açısından ülkelerin bilgi haritasındaki yerleri, OECD bilim ve teknoloji göstergeleri ile tespit edilen sonuçlarla karşılaştırıldığında (Tablo 3 ile 4) Japonya Ar-Ge, İnovasyon, Patent ve Bilgi Teknoloji faktörleri açısından Almanya’ya göre daha ileri bir bilgi düzeyine sahip olduğu ortaya konmuştur. Ayrıca, ülkemizin bilgi haritasındaki yeri de OECD bilim ve teknoloji göstergeleri ile tespit edilen sonuçlara benzerlik göstermektedir. Teorik ve ampirik analiz sonucunda, bilgi ekonomilerinde rekabet üstünlü-ğü oluşmasına etki eden faktörler açısından Türkiye’nin dünyadaki konu-munun gelişmekte olduğu tespit edilmiştir.
Sonuç ve Değerlendirme
Bu çalışmada, bilgi ekonomilerinde rekabet üstünlük yaratan faktörler olan Araştırma-Geliştirme (AR&GE), İnovasyon (Yenilik), Patent, Bilgi Tek-nolojileri ve Yatırımları ele alınarak analiz edilmiştir. Adı geçen faktörler bilgi haritalanması metodu aracılığı ile ekonominin sahip olduğu teknoloji düzeyi ve bilgi seviyesi grafik ve sembollerle beşli bir skala üzerinde ekono-minin yapısı ve yeri belirlenmesinde kullanılmıştır. Çalışmada kullanılan bilgi haritası yöntemi rakip ekonomilerin bilgi düzeyine (güçlü ve zayıf yan-ları) ilişkin fikir vermektedir.

Cem Işık
Girişimcilik ve İnovasyon Yönetimi Dergisi / Journal of Entrepreneurship and Innovation Management136
Uygulamada diğer ekonomiler ve Türkiye’nin yeri karşılaştırmalı ola-rak gösterilmiş ve rekabetçi faktörlerinin önemi bilgi düzeylerine göre or-taya çıkarılmıştır. Çalışmada yapılan analizler 2023 yılı vizyonu doğrul-tusunda lider(gelişmiş) bir ülke olmak isteyen ülkemizin teknoloji düzeyi ve tercih edilebilirliği eksik alanlarına takviye yaparak, güçlü yanlarını da ortaya çıkararak yenilikçi düzeyde olan ekonomiler arasına girme isteği ile doğru orantılı olduğunu göstermektedir. Bu çerçevede ülkemizin öncelikle kendisine daha yakın rakiplerinden olan İtalya, İngiltere gibi lider düzeyde olan ülkeleri, yapacağı dönüşüm eylem planı ve bilgi yatırımlarıyla zorla-ması daha sonra bilgi toplumuna geçişi bir an önce tam olarak tamamlama-sı gerektiği kanısına varılmıştır. Böylece Türkiye geride kaldığı yüksek ve orta-ileri teknoloji alanlarını geliştirmesi mümkün olabilecektir. Bu amaçla desteklenmesi gereken bu sektörler öncelikle ileri teknolojide; Havacılık ve Uzay, Bilgisayar ve Büro Makineleri, Elektronik-Haberleşme, İlaç, orta-ileri teknoloji sınıfında; Mesleki Bilim ve Ölçüm Aletleri, Taşıt Araçları, Elektrik-li Makineler, Kimyasallar(İlaç Hariç), Diğer Taşıt Araçları, Elektriksiz Maki-neleridir.
Ar&Ge, İnovasyon, Bilgi Teknolojileri ve Patent gibi değişkenler yeni-likçi bilgi seviyelerini yakalamakta önemli bir yere sahipken aynı zamanda ileri teknoloji seviyesine geçebilmek için de etkilidirler. Bu amaçla planlama ve stratejilerdeki eksiklikler giderilerek kendi kendine yeterliliğin üstüne çı-kılması önem arz etmektedir. Bu sayede bilginin Ar-Ge, inovasyon, patent ve bilgi teknolojileriyle toplumun her kesimine hızlı bir şekilde yayılması; günümüz dünyasında sosyo-ekonomik kalkınmanın belirleyicisi haline gel-miştir.

OECD Ülkeleri ve Komşu Ülkelerin Bilgi Düzeylerinin Bilgi Haritası Yöntemi İle Analizi
137Cilt/Volume 2 | Sayı/Issue 3 | Aralık/December 2013
Kaynaklar
Australian Library and Information Association, Erişim: 09.10.2010, www.nla.gov.au.
Callahan S., (2005) “Knowledge Mapping is Sensemaking”, s.1, Erişim: 13.10.2010, http://www.anecdote.com.au/archives/2005/11/knowledge_mappi.html.
Denham Grey D. (1999) “Knowledge Mapping: A Practical Overview”, p.1, Eri-şim: 13.10.2010,http://www.impactalliance.org/file_download.php?location=S_Ufilename=10383546681Knowledge_Mapping.htm.
DPT, (2006) “Bilgi Toplumu Stratejisi (2006-2010)”, Temmuz 2006, s.1, Erişim: 17.10.2010, www.bilgitoplumu.gov.tr.
Driessen S., Huijsen W. O. and Grootveld M., (2007) “A Framework for Evalua-ting Knowledge-Mapping Tools”, Journal of Knowledge Management, 11(2), pp.109-117.
Economist Intelligence Unit (EIU), (2009) “Resilience Amid Turmoil Benchmar-king IT Industry Competitiveness”, Erişim: 04.03.2010, http://global.bsa.org/2009eiu/study/2009_eiu_global.pdf.
Ermine J-L., Boughzala I. and Tounkara T., (2006) “Critical Knowledge Map as a Decision Tool for Knowledge Transfer Actions”, The Electronic Journal of Knowledge Management, 4(2), pp.129-140.
Haggie K. (2003 ) Choosing Your Knowledge Management Strategy, Journal of Knowledge Management Practice, http://www.tlainc.com/articl51.htm
IBM Global Services,(2003) “Knowing What We Know: Language and Tools for Knowledge Mapping”, 2003, pp.186-188, Erişim: 11.10.2010, http://www.download-it.org.
O’Donell, A. M. (1994) “Learning From Knowledge Maps: The Effects of Map Orientation”, Contemporary Educational Psychology, S. 19, 1994, pp.33-34.
OECD (1996) “The Knowledge Based Economy”, General Distribution OCDE/GD(96) 102,Paris, 1996, Erişim: 10.01.2010, /51/8/1913021.pdf
OECD (2010) “Global Information Technology Report 2009-2010”, pp.12-13, Eri-şim: 01.10.2010, http://www.weforum.org/pdf/GITR10/GITR%202009-2010_Full%20Report%20final.pdf.

Cem Işık
Girişimcilik ve İnovasyon Yönetimi Dergisi / Journal of Entrepreneurship and Innovation Management138
Özdemirci F. ve Aydın C. (2007) “Kurumsal Bilgi Kaynakları ve Bilgi Yönetimi”, Türk Kütüphaneciliği Dergisi, 21 (2), pp.164–185.
Pınar İ. ve Kamaşar R. (2008) “İşletmelerde Bilgi Yönetimine Stratejik Bir Yak-laşım: Bilgi Haritalanması ve Bir Sektörel Uygulama, Bilgi, Ekonomi ve Yönetim, Cilt 2, pp.822–836.
Resmi Gazete (2002) Teknoloji Geliştirme Bölgeleri Uygulama Yönetmeliği, 19 Haziran 2002, Sayı: 24790, sayfa 183.
Saygılı Ş., (2003) “Bilgi Ekonomisine Geçiş Sürecinde Türkiye Ekonomisinin Dünyadaki Konumu”, Ekonomik Modeller ve Stratejik Araştırmalar Genel Müdürlüğü DPT Yayın No:2675, ss.59-98.
TPE (2013) Türkiye Patent Enstitüsü, erişim: 03.07.2013 http://www.turkpa-tent.gov.tr/portal/default2.jsp?sayfa=123&konu=1, son
TÜSİAD (1991), Erişim: 04.10.2010, www.tusiad.org.
Zack, M. H. (1999) “Developing a Knowledge Strategy”, California Management Review, 41(3), pp. 125-145.
Zack, M. H. (2000) “Competing on Knowledge”, 2000 Handbook of Business Strategy, New York: Faulkner - Gray, 1999, pp.81-88.
Vestal W., (2002) “Knowledge Mapping Guides Organizations to Knowledge Wit-hin its Walls”, American Productivity - Quality Center, p.1, Erişim: 12.10.2010,http://www.providersedge.com/docs/km_articles/Knowledge_Mapping_Guides_Organiza-tions_to_Knowledge_Within_its_Walls.pdf.
WEF (Dünya Ekonomik Forumu), “2010-2011 The Global Competitiveness Report”, pp.302, http://www3.weforum.org/docs/WEF_GlobalCompetitivenessRe-port_2010-11.pdf.
Wexler M.N., “The Who, What and Why Knowledge Mapping”. Journal of Know-ledge Management, 5 (3), pp. 249-263.
World Bank (2003) “Lifelong Learning in the Global Knowledge Economy Chal-lenges for Developing Countries”, Profiles in Development, 2003, pp.77-80, Erişim: 10.10.2010, http://www.techknowlogia.org/TKL_Articles/PDF/476.pdf.
Girişimcilik ve İnovasyon Yönetimi Dergisi
Journal of Entrepreneurship and Innovation Management
139Cilt/Volume 2 | Sayı/Issue 3 | Aralık/December 2013 | 139-140
R&D AND INNOVATION EVENTS IN TURKEY
THE 11TH GLOBELICS CONFERENCE
The 11th Globelics Conference (Global Network for Economics of Learning, In-
novation, and Competence Building Systems) was held at Middle East Technical
University (METU), September 11-13, 2013. It was organised by METU Science and
Technology Policies Research Centre (TEKPOL), Centre for Competition Research of
Yıldırım Beyazıt University (REKMER) and Ankara Development Agency.
Globelics is a global network established around the concepts of learning, inno-
vation, regional competence building, global competitiveness, regional development
and development of human capital, which are of great importance to countries in
their technological transition process. Within this network, experts on innovation
and economic development from diverse academic disciplines, both from developed
and developing world come together, share experiences and contribute to academic
knowledge creation in the fields of innovation and development.
This year’s Freeman Lecture was given by world-known scholar on innovation,
Luc Soete from Maastricht University around the topic “Innovation, Technological
Unemployment and Shifting Wealth” under the chairmanship of Bengt-Ake Lundvall
(Secretary General of Globelics) and welcomed by a crowded and enthusiastic audi-
ence.
“Entrepreneurship, Innovation Policy and Development in an Era of Increased
Globalisation” was the main context of 11th Globelics Conference. In 47 parallel ses-
sions, around 170 participants from 45 different countries presented their research
papers on topics including learning, competence building, entrepreneurship, inno-
vation policies, sustainable development strategies and inclusive innovation with
reference to the science, technology and innovation policies implemented in their
own countries.
The conference was enriched by special sessions and plenary lectures given
by a preeminent group of academicians, consultants and policy makers, who played
critical roles in the creation of a literature on economics of technology, industry
and innovation and in the shaping of science and technology policies in developing
Cem Işık
Girişimcilik ve İnovasyon Yönetimi Dergisi / Journal of Entrepreneurship and Innovation Management140
countries and provided a great opportunity for networking for researchers and policy
makers who are interested in the subjects of technology and innovation policies.
OECD III. BİLGİ EKONOMİSİ KÜRESEL FORUMU
OECD ve Bilim, Sanayi ve Teknoloji Bakanlığı birlikteliğinde düzenlenen III.
Bilgi Ekonomisi Küresel Formu 22-23 Ekim 2013 tarihleri arasında İstanbul’da ger-
çekleşti. Toplam 7 farklı oturumun gerçekleştiği Foruma çok sayıda yerli ve yabancı
uzmanlar katıldı.
Forumun Küresel Ekonomik Büyümenin Bilim ve İnovasyona Katkısı oturumun-
da özellikle teknoloji, bilim ve inovasyon bağlamında etkileşim ve bu etkileşimin
yönü ele alındı. Bilgi ve İletişim Teknolojileri ile Bilim ve İnovasyon Politikalarının
İzlenmesi başlıklı oturumda ise kurumların inovasyon politikalarını izlenmesinin
önemi ve bu politikaların izlenmesine kullanabilecek araçlar üzerinde değerlendir-
meler yapıldı. Bilgiye erişimin ve ortak bilimsel etkinliklerin gerçekleştirilmesinin
öneminin vurgulandığı Açık Bilim oturumu ise özellikle akademisyenlerin büyük
ilgisini çekti.
Forumda ulusal ve uluslararası katılımcılar tarafından tartışılan önemli bir
konu da üniversite-sanayi işbirliği oldu. Özellikle üniversite sanayi işbirliğinin hem
bilimin gelişmesine hem de uygulamaya yönelik yeni ürünlerin geliştirilmesi üze-
rine etkileri geniş çerçevede ele alındı. Etkinlikte tartışılan diğer bir önemli başlık
ise Bilim ve Yenilik Politikalarının Oluşturulmasında Teknoloji Öngörüsünün Rolü
oldu. Özellikle Türkiye’nin gelecek yıllarda hangi adımları atarak teknolojik gelişim
sürecini hızlandırabileceği konusunun tartışıldığı bu oturumda önemli sonuçlar elde
edildi. Bu oturumun tamamlayıcısı olarak düzenlenen Bilim, Teknoloji ve Yenilik
Politikalarının Geleceği başlıklı oturumda ise gelişmekte olan ülkelerin teknolojik
yeteneklerin geliştirilmesine yönelik stratejik adımların neler olabileceği tartışıldı.
II. ARGE MERKEZLERİ ZİRVESİ
Bilim, Sanayi ve Teknoloji Bakanlığı tarafından düzenlenen II.Arge Merkezleri
Zirvesi 15-16 Kasım 2013 tarihleri arasında İstanbul’da gerçekleşti. Bilgilendirme,
ağ oluşturma ve tartışma ortamının sağlandığı bu etkinlikte inovasyon ekosistemi,
kamu-sanayi ve üniversite işbirliği, ekonomik gelişme ile sosyal gelişme için Ar-Ge
ve inovasyonun öneminin ağırlıkla tartışıldığı bu etkinlikte ARGE Merkezi olan ku-
rumların mevcut sorunları ve beklentileri de tartışılan başlıklar arasında yer aldı.

Girişimcilik ve İnovasyon Yönetimi Dergisi
Journal of Entrepreneurship and Innovation Management
141Cilt/Volume 2 | Sayı/Issue 3 | Aralık/December 2013
YAZIM KURALLARI1. Girişimcilik ve İnovasyon Yönetimi Dergisi; tüketici ve tüketim davranışlarını
pazarlama, psikoloji, sosyoloji, iletişim, ekonomi, antropoloji, kültürel çalışmalar, tarih ve eğitim bilimleri gibi disiplinler açısından değerlendiren özgün makaleleri yayınlamayı amaçlayan hakemli bir dergidir. Yılda iki kez yayınlanacak olan der-gi, alanında kuramsal, kavramsal ve uygulamalı çalışmalara yer verir.
2. Dergiye gönderilecek makalelerde öncelik olarak Türkçe yazılmış olanlara veril-mekle beraber, sınırlı sayıda İngilizce makalelere de yer verilecektir.
3. Yayına gönderilecek makalelerin aynı anda başka bir derginin değerlendirme sü-recinde bulunmaması, hiçbir yerde yayına kabul edilmemiş ve yayınlanmamış olması gerekmektedir.
4. Yayınlanmak üzere dergiye gönderilen makaleler ile birlikte yazar/ların adı-soya-dı, ünvanı, kurum, ve e-posta adresleri ile açık iletişim adreslerini içeren bilgiler, kimlik ve iletişim bilgileri başlığı altında ayrı bir sayfa olarak gönderilmelidir.
5. Makale metninde makalenin Türkçe ve İngilizce başlıkları, 120 kelimeyi aşmaya-cak şekilde Türkçe ve İngilizce özetler ile en fazla beşer adet Türkçe ve İngilizce anahtar kelime yer almalıdır. Makale metninde yazar/ların kimlik bilgileri yer al-mamalıdır.
6. Dergiye gönderilecek yazılar A4 ebadında kağıda, Times New Roman, 12 punto, 1,5 aralıkla, paragraf öncesi şekilde, metin, tablo ve şekiller, kaynakça ve ekler dahil 40 sayfayı aşmayacak şekilde yazılmış olmalıdır.
7. Makalenin başlığı sağa yaslı, 14 punto, bold ve sadece ilk harfleri büyük yazılmış olmalıdır.
8. Tüm metin iki yana yaslı, paragraflar arasında 12nk boşluk verilmiş, başlıklar ve metin dahil olmak üzere soldan girinti yapılmamış olmalıdır. Gönderilecek çalış-maların sayfa kenar boşlukları aşağıdaki gibi belirlenmelidir:
Üstten : 5 cmSoldan : 3,5 cmAlttan : 5 cmSağdan : 3,5 cm
9. Metin içi atıflarda Harvard metodu olarak adlandırılan ve yazar soyadı, tarih ve sayfa numaralarının verildiği sistem tercih edilmelidir (Clegg, 1997: 53). İkiden fazla yazarı olan kaynaklara atıflarda ilk yazarın soyadı ve “vd.” ibaresi kulla-nılmalıdır (Morgan vd., 1994). Aynı parantez içerisinde birden fazla kaynak “;” işareti ile ayrılmalıdır (Hassard ve Parker, 1994; Boje, 1996).
10. Metin içinde yer alacak tablo, şekil, grafik, harita vb.’lerinin de bu ölçüleri aşma-yacak şekilde metin içine ortalanarak yerleştirilmiş olması ya da gerekiyorsa ekler bölümünde -metin sonunda- kaynakçadan hemen önce yer almış olması gerekli-dir.
11. Metin içindeki tüm şekiller ve grafikler sıra numarası ile (Şekil 1) kendi içinde ve şekil ya da grafiğin altında; tablolar ise yine kendi içinde numaralanmak üzere (Tablo 1) tablonun üzerinde numaralandırılmış ve isimlendirilmiş olmalıdır. Tab-lo, grafik ve şekil başlıkları sayfaya ortalanmış, bold ve yalnızca kelimelerin baş harfleri büyük olacak şekilde yazılmalıdır.

Girişimcilik ve İnovasyon Yönetimi Dergisi / Journal of Entrepreneurship and Innovation Management142
12. Tablo, şekil ve grafiklerin varsa kaynakları; tablo, şekil ve grafiklerin hemen altın-da metin içi atıf kurallarına uygun olarak verilmelidir. Matematiksel ve istatistik-sel simgeler Microsoft Office denklem düzenleyicisi ile hazırlanmalıdır.
13. Makalenin sonunda yazar soyadlarına göre alfabetik olarak düzenlenecek kay-nakça kısmı bulunmalıdır. Kaynakçada sadece makalede kullanılan eserler yer almalıdır ve kaynakça aşağıda belirtilen örneğe uygun olarak hazırlanmalıdır.
KİTAPLARTorlak, Ömer ve Remzi Altunışık (2012), Pazarlama Stratejileri Yönetsel Bir Yaklaşım, İstanbul: Beta Yayınları.Uzkurt, Cevahir (2008), Yenilik Yönetimi ve Yenilikçi Örgüt Kültürü, İstanbul: Beta Yayınları.Chesbrough, Henry (2003), Open Innovation: The New Imperative for Creating and Profiting from Technology, Boston: Harvard Business School Press.
DERLEME KİTAPTA BÖLÜM
Kaiser, Susan B. ve Karyl Ketchum (2005), “Consuming fashion as flexinility: methap-hor, cultural mood, and materiality”, Ed. S. Ratneshwar ve David Glen Mick, Inside Consumption – Consumer Motives, Goals, and Desires, London: Routledge,122-143.
MAKALELER
Temel, S., Victor Scholten, Cengiz Akdeniz, Frances Fortuin, Onno Omta (2013), “University-Industry Collaboration in Turkish SMEs: Investigation of an U-shaped relationship”, The International Journal of Entrepreneurship and Innovation, 14(2), 103-115.
Uzkurt, C., Rachna Kumar, Halil Semih Kimzan, Hanife Sert (2012), “The Impact of Environmental Uncertainty Dimensions On Organizational Innovativeness: An Em-pirical Study on SMEs” International Journal of Innovation Management, 16(2), doi: 10.1142/S1363919611003647
İNTERNET KAYNAKLARI
Yazarı Belli Olan İnternet Kaynakları:
Tınç, Lütfü (2008), “Kapalıçarşı’dan Beyoğlu mağazalarına... Osmanlı’nın alışveriş mekânları “, http://www.thegate.com.tr/?sid=5d6bc63fa883d5484e1587d9ac4018f4&subid=470, (Erişim: 22.01.2009).
Blecher, George (2004), “Ye Kürküm Ye Deyişinden Veblen’in Gösterişçi Kuramı’na”, http://www.eurozine.com/articles/2004-07-22-blecher-tr.html, Çev. Osman Denizte-kin, (Erişim: 22.01.2009).
Yazarı Belli Olmayan İnternet Kaynakları:
“Bugün ve yarın kredi kartı boykotu var!”, 21.06.2007, http://www.memurlar.net/ha-ber/79440/, (Erişim: 22.01.2009).
http://www.rok.org.tr
Belirtilen formatta kaleme alınan çalışmalar, e-posta yoluyla aşağıdaki adrese gönde-rilmelidir: